The Single-mode Complex Amplitude Refinement (SCAR) …
13
A&A 635, A55 (2020) https://doi.org/10.1051/0004-6361/201731616 c ESO 2020 Astronomy & Astrophysics The Single-mode Complex Amplitude Refinement (SCAR) coronagraph I. Concept, theory, and design E. H. Por and S. Y. Haffert Sterrewacht Leiden, PO Box 9513, Niels Bohrweg 2, 2300 RA Leiden, The Netherlands e-mail: [email protected] Received 21 July 2017 / Accepted 13 February 2019 ABSTRACT Context. The recent discovery of an Earth-mass exoplanet around the nearby star Proxima Centauri provides a prime target for the search for life on planets outside our solar system. Atmospheric characterization of these planets has been proposed by blocking the starlight with a stellar coronagraph and using a high-resolution spectrograph to search for reflected starlight off the planet. Aims. Due to the large flux ratio and small angular separation between Proxima b and its host star (.10 -7 and .2.2λ/D respectively; at 750 nm for an 8 m-class telescope) the coronagraph requires high starlight suppression at extremely-low inner working angles. Additionally, it must operate over a broad spectral bandwidth and under residual telescope vibrations. This allows for efficient use of spectroscopic post-processing techniques. We aim to find the global optimum of an integrated coronagraphic integral-field spectro- graph. Methods. We present the Single-mode Complex Amplitude Refinement (SCAR) coronagraph that uses a microlens-fed single-mode fiber array in the focal plane downstream from a pupil-plane phase plate. The mode-filtering property of the single-mode fibers al- lows for the nulling of starlight on the fibers. The phase pattern in the pupil plane is specifically designed to take advantage of this mode-filtering capability. Second-order nulling on the fibers expands the spectral bandwidth and decreases the tip-tilt sensitivity of the coronagraph. Results. The SCAR coronagraph has a low inner working angle (∼1λ/D) at a contrast of <3 × 10 -5 for the six fibers surrounding the star using a sufficiently-good adaptive optics system. It can operate over broad spectral bandwidths (∼20%) and delivers high throughput (>50% including fiber injection losses). Additionally, it is robust against tip-tilt errors (∼0.1λ/D rms). We present SCAR designs for both an unobstructed and a VLT-like pupil. Conclusions. The SCAR coronagraph is a promising candidate for exoplanet detection and characterization around nearby stars using current high-resolution imaging instruments. Key words. instrumentation: high angular resolution – techniques: high angular resolution – methods: numerical 1. Introduction The discovery of many rocky exoplanets around stars (Borucki et al. 2011) has prompted the radial velocity search of the closest and brightest ones. This led to the discovery of a terrestrial exoplanet in the habitable zone around Prox- ima Centauri (Anglada-Escudé et al. 2016). This planet does not transit its host star (Kipping et al. 2017), making transit spec- troscopy impossible. Proxima b however has an angular sep- aration in quadrature of ∼2.2λ/D at 750 nm for an 8 m-class telescope, making a spatially resolved imaging approach fea- sible. Lovis et al. (2017) explores the possibility of coupling the high-contrast imager SPHERE (Beuzit et al. 2008) with the high-resolution spectrograph ESPRESSO (Pepe et al. 2010). The implementation of the coronagraph was left as an open ques- tion. Here we show a new type of coronagraph that will enable a combination of SPHERE and a high-resolution spectrograph to successfully observe Proxima b. With the advent of extreme adaptive optics systems (xAO), such as SPHERE (Beuzit et al. 2008), GPI (Macintosh et al. 2014) and SCExAO (Jovanovic et al. 2015), direct detection has taken some major steps forward. These systems create a diffraction-limited point spread function (PSF), which allows for the use of coronagraphy to enhance the contrast of obser- vations. Coronagraphs need to suppress stellar light at the loca- tion of the planet, while having high throughput for the planet itself. Additionally, they need to operate over a broad wave- length range and in the presence of residual telescope aberra- tions, both static and dynamic. Telescope vibrations in particular turned out to be a major concern for these high contrast imag- ing instruments (Fusco et al. 2016). The performance of pupil- plane-only coronagraphs is independent of telescope pointing, making telescope vibrations less of a concern. An inherent dis- advantage of pupil-plane coronagraphs is that the coronagraphic throughput loss is the same for the star and the planet. There- fore designs of pupil-plane coronagraphs that reach high con- trasts or extremely-low inner working angles have an intrinsically low throughput. As a result, coronagraphs combining focal-plane and pupil-plane optics often outperform pupil-plane-only coro- nagraphs at extremely-low inner working angles (Mawet et al. 2012). For example, an apodizing phase plate (APP) with an annu- lar dark zone optimized from 1.2λ/D to 2.3λ/D for a contrast of 10 -4 has a Strehl ratio (i.e. planetary throughput) of 0.13%. The APP optimization was performed following Por (2017). Article published by EDP Sciences A55, page 1 of 13
Transcript of The Single-mode Complex Amplitude Refinement (SCAR) …

A&A 635, A55 (2020)https://doi.org/10.1051/0004-6361/201731616c© ESO 2020
Astronomy&Astrophysics
The Single-mode Complex Amplitude Refinement (SCAR)coronagraph
I. Concept, theory, and design
E. H. Por and S. Y. Haffert
Sterrewacht Leiden, PO Box 9513, Niels Bohrweg 2, 2300 RA Leiden, The Netherlandse-mail: [email protected]
Received 21 July 2017 / Accepted 13 February 2019
ABSTRACT
Context. The recent discovery of an Earth-mass exoplanet around the nearby star Proxima Centauri provides a prime target for thesearch for life on planets outside our solar system. Atmospheric characterization of these planets has been proposed by blocking thestarlight with a stellar coronagraph and using a high-resolution spectrograph to search for reflected starlight off the planet.Aims. Due to the large flux ratio and small angular separation between Proxima b and its host star (.10−7 and .2.2λ/D respectively;at 750 nm for an 8 m-class telescope) the coronagraph requires high starlight suppression at extremely-low inner working angles.Additionally, it must operate over a broad spectral bandwidth and under residual telescope vibrations. This allows for efficient use ofspectroscopic post-processing techniques. We aim to find the global optimum of an integrated coronagraphic integral-field spectro-graph.Methods. We present the Single-mode Complex Amplitude Refinement (SCAR) coronagraph that uses a microlens-fed single-modefiber array in the focal plane downstream from a pupil-plane phase plate. The mode-filtering property of the single-mode fibers al-lows for the nulling of starlight on the fibers. The phase pattern in the pupil plane is specifically designed to take advantage of thismode-filtering capability. Second-order nulling on the fibers expands the spectral bandwidth and decreases the tip-tilt sensitivity ofthe coronagraph.Results. The SCAR coronagraph has a low inner working angle (∼1λ/D) at a contrast of <3 × 10⁻⁵ for the six fibers surroundingthe star using a sufficiently-good adaptive optics system. It can operate over broad spectral bandwidths (∼20%) and delivers highthroughput (>50% including fiber injection losses). Additionally, it is robust against tip-tilt errors (∼0.1λ/D rms). We present SCARdesigns for both an unobstructed and a VLT-like pupil.Conclusions. The SCAR coronagraph is a promising candidate for exoplanet detection and characterization around nearby stars usingcurrent high-resolution imaging instruments.
Key words. instrumentation: high angular resolution – techniques: high angular resolution – methods: numerical
1. Introduction
The discovery of many rocky exoplanets around stars(Borucki et al. 2011) has prompted the radial velocity searchof the closest and brightest ones. This led to the discoveryof a terrestrial exoplanet in the habitable zone around Prox-ima Centauri (Anglada-Escudé et al. 2016). This planet does nottransit its host star (Kipping et al. 2017), making transit spec-troscopy impossible. Proxima b however has an angular sep-aration in quadrature of ∼2.2λ/D at 750 nm for an 8 m-classtelescope, making a spatially resolved imaging approach fea-sible. Lovis et al. (2017) explores the possibility of couplingthe high-contrast imager SPHERE (Beuzit et al. 2008) withthe high-resolution spectrograph ESPRESSO (Pepe et al. 2010).The implementation of the coronagraph was left as an open ques-tion. Here we show a new type of coronagraph that will enable acombination of SPHERE and a high-resolution spectrograph tosuccessfully observe Proxima b.
With the advent of extreme adaptive optics systems (xAO),such as SPHERE (Beuzit et al. 2008), GPI (Macintosh et al.2014) and SCExAO (Jovanovic et al. 2015), direct detectionhas taken some major steps forward. These systems create a
diffraction-limited point spread function (PSF), which allowsfor the use of coronagraphy to enhance the contrast of obser-vations. Coronagraphs need to suppress stellar light at the loca-tion of the planet, while having high throughput for the planetitself. Additionally, they need to operate over a broad wave-length range and in the presence of residual telescope aberra-tions, both static and dynamic. Telescope vibrations in particularturned out to be a major concern for these high contrast imag-ing instruments (Fusco et al. 2016). The performance of pupil-plane-only coronagraphs is independent of telescope pointing,making telescope vibrations less of a concern. An inherent dis-advantage of pupil-plane coronagraphs is that the coronagraphicthroughput loss is the same for the star and the planet. There-fore designs of pupil-plane coronagraphs that reach high con-trasts or extremely-low inner working angles have an intrinsicallylow throughput. As a result, coronagraphs combining focal-planeand pupil-plane optics often outperform pupil-plane-only coro-nagraphs at extremely-low inner working angles (Mawet et al.2012). For example, an apodizing phase plate (APP) with an annu-lar dark zone optimized from 1.2λ/D to 2.3λ/D for a contrast of10−4 has a Strehl ratio (i.e. planetary throughput) of 0.13%. TheAPP optimization was performed following Por (2017).
Article published by EDP Sciences A55, page 1 of 13
A&A 635, A55 (2020)
Even with the best adaptive optics systems, residualaberrations will always limit the raw contrast of ground-based observations to ∼10−6 to 10−7 (Guyon 2005). Currentlyhowever, observations are limited by the non-common-patherrors between the wavefront sensor and science camera, cre-ating quasi-static speckles in the focal-plane. These specklesamplify atmospheric residuals (Aime & Soummer 2004) andare notoriously hard to predict. The raw contrast in the inten-sity image provided by the coronagraphic system is oftenenhanced by post-processing techniques to form the final con-trast curve of the observation. Diversity of some kind isoften used to calibrate the instrument itself. Angular diver-sity (Marois et al. 2006) uses the rotation of the sky withrespect to the instrument and has provided excellent results.A recent development in this field uses the diversity in radialvelocities of the star and the planet: stellar-light specklesstill retain the radial velocity of the star, while the planetappears at a different velocity altogether. Cross-correlation tech-niques on high-resolution spectroscopy (Sparks & Ford 2002;Riaud & Schneider 2007; Konopacky et al. 2013) combinedwith coronagraphy (Kawahara et al. 2014; Snellen et al. 2015;Wang et al. 2017) show great promise. They provide daysidespectroscopy of τ Boötis b (Brogi et al. 2012) and even the firstmeasurement of planetary spin (Snellen et al. 2014).
Integration of both coronagraphy and high-resolution spec-troscopy into a single concept has only recently been attempted.Mawet et al. (2017) use a fiber injection unit in the focal-planedownstream from a conventional vortex coronagraph. A single-mode fiber was centered around the planet and the stellar lightspeckles were removed using active speckle control algorithms.While this setup does allow for transportation of the light toa dedicated high-resolution spectrograph, it does not optimallycombine both methods. A system for which all components areoptimized simultaneously is always better than, or at least asgood as, a system for which each component is optimized sepa-rately. In this paper we allow the coronagraph design to dependon the single-mode fibers in the focal plane. This allows formore freedom in the design process and provides better plane-tary coronagraphic throughput as those modes filtered out by thefiber injection unit do not need to be suppressed by the upstreamcoronagraph. The increase in throughput can be quite significant.For example, optimizing a SCAR coronagraph with an operatingangular separations from 1λ/D to 2.5λ/D yields a throughput of∼54%, compared to the ∼0.13% of the corresponding APP men-tioned above.
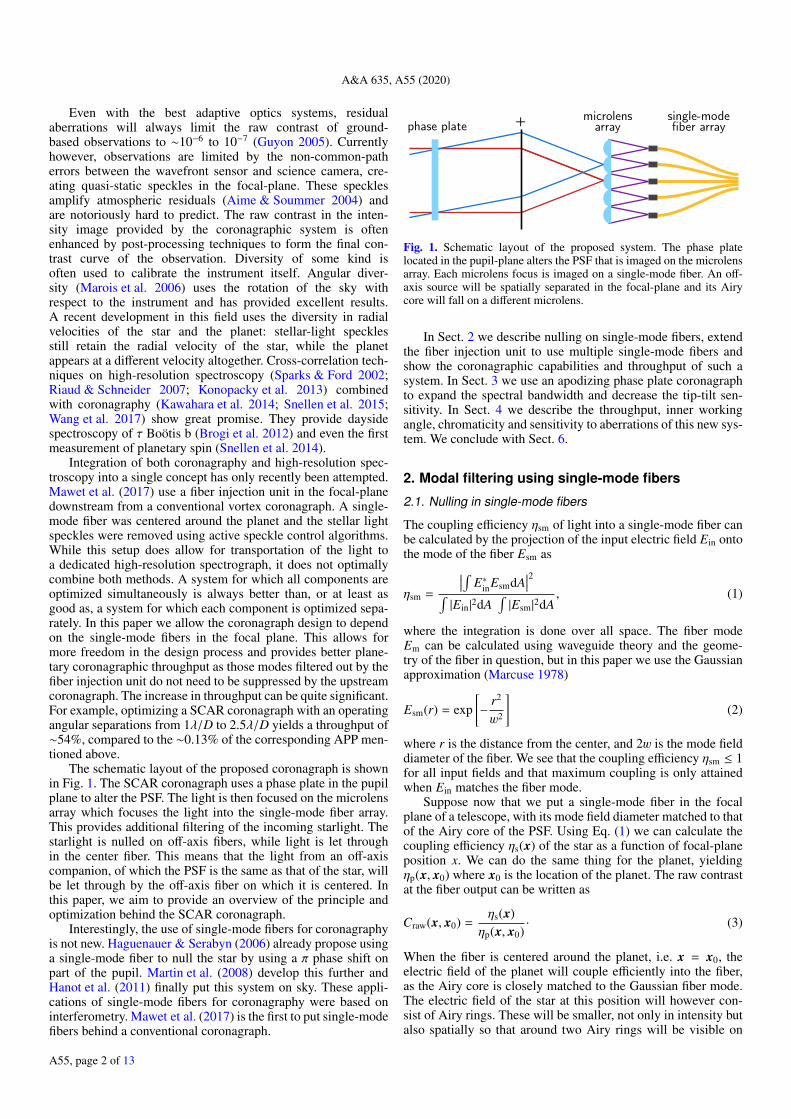
The schematic layout of the proposed coronagraph is shownin Fig. 1. The SCAR coronagraph uses a phase plate in the pupilplane to alter the PSF. The light is then focused on the microlensarray which focuses the light into the single-mode fiber array.This provides additional filtering of the incoming starlight. Thestarlight is nulled on off-axis fibers, while light is let throughin the center fiber. This means that the light from an off-axiscompanion, of which the PSF is the same as that of the star, willbe let through by the off-axis fiber on which it is centered. Inthis paper, we aim to provide an overview of the principle andoptimization behind the SCAR coronagraph.
Interestingly, the use of single-mode fibers for coronagraphyis not new. Haguenauer & Serabyn (2006) already propose usinga single-mode fiber to null the star by using a π phase shift onpart of the pupil. Martin et al. (2008) develop this further andHanot et al. (2011) finally put this system on sky. These appli-cations of single-mode fibers for coronagraphy were based oninterferometry. Mawet et al. (2017) is the first to put single-modefibers behind a conventional coronagraph.
+phase platemicrolens
arraysingle-modefiber array
Fig. 1. Schematic layout of the proposed system. The phase platelocated in the pupil-plane alters the PSF that is imaged on the microlensarray. Each microlens focus is imaged on a single-mode fiber. An off-axis source will be spatially separated in the focal-plane and its Airycore will fall on a different microlens.
In Sect. 2 we describe nulling on single-mode fibers, extendthe fiber injection unit to use multiple single-mode fibers andshow the coronagraphic capabilities and throughput of such asystem. In Sect. 3 we use an apodizing phase plate coronagraphto expand the spectral bandwidth and decrease the tip-tilt sen-sitivity. In Sect. 4 we describe the throughput, inner workingangle, chromaticity and sensitivity to aberrations of this new sys-tem. We conclude with Sect. 6.
2. Modal filtering using single-mode fibers
2.1. Nulling in single-mode fibers
The coupling efficiency ηsm of light into a single-mode fiber canbe calculated by the projection of the input electric field Ein ontothe mode of the fiber Esm as
ηsm =
∣∣∣∫ E∗inEsmdA∣∣∣2∫
|Ein|2dA
∫|Esm|
2dA, (1)
where the integration is done over all space. The fiber modeEm can be calculated using waveguide theory and the geome-try of the fiber in question, but in this paper we use the Gaussianapproximation (Marcuse 1978)
Esm(r) = exp[−
r2
w2
](2)
where r is the distance from the center, and 2w is the mode fielddiameter of the fiber. We see that the coupling efficiency ηsm ≤ 1for all input fields and that maximum coupling is only attainedwhen Ein matches the fiber mode.
Suppose now that we put a single-mode fiber in the focalplane of a telescope, with its mode field diameter matched to thatof the Airy core of the PSF. Using Eq. (1) we can calculate thecoupling efficiency ηs(x) of the star as a function of focal-planeposition x. We can do the same thing for the planet, yieldingηp(x, x0) where x0 is the location of the planet. The raw contrastat the fiber output can be written as
Craw(x, x0) =ηs(x)
ηp(x, x0)· (3)
When the fiber is centered around the planet, i.e. x = x0, theelectric field of the planet will couple efficiently into the fiber,as the Airy core is closely matched to the Gaussian fiber mode.The electric field of the star at this position will however con-sist of Airy rings. These will be smaller, not only in intensity butalso spatially so that around two Airy rings will be visible on
A55, page 2 of 13

E. H. Por and S. Y. Haffert: The Single-mode Complex Amplitude Refinement (SCAR) coronagraph. I.
Cou
piln
gIn
tens
ityEle
ctric fie
ld
Matched mode First ordernull
Second ordernull
Δx
x
x x x
xx
Δx Δx
Fig. 2. Coupling into a single-mode fiber with a (a) matched electricfield, (b) first order null and (c) second order null. First row: electricfield projected onto the fiber. Second row: intensity on the fiber face.Third row: coupling efficiency for off-center fibers. The matched modecouples well into the fiber, even for small off-center positions. The first-order null has no throughput: its odd electric field ensures a zero overlapintegral in Eq. (1). Off-center positions however still transmit becausethe odd structure is lost. The second-order employs an even electricfield where the contribution of the central peak is canceled by the twosidebands. This creates a much broader null when decentering the fiber.
the fiber face. This is possible as the Airy core itself has a sizeof ∼1λ/D full-width half-maximum (FWHM), while the Airyrings are sized ∼0.5λ/D FWHM. As neighboring Airy rings haveopposite phase, the light from the two Airy rings will (partially)cancel each other in the projection integral of Eq. (1), result-ing in a lower stellar throughput. This nulling provides an addi-tional contrast enhancement not possible with multimode fibers.Figure 2 illustrates this graphically in columns one and two.
Column three in Fig. 2 shows an alternative null structure.This second-order null balances the contribution of the core withits two sidebands. This has the effect of broadening the null fordecenter as the loss in overlap with one of the sidebands is com-pensated by the increase in overlap with the other. In this casewe have essentially split the second-order null into two first-order null by subtracting a tiny fraction of the matched mode.This gives a characteristic double dip in the coupling curve andbroadens the null even more by raising the coupling between thetwo first-order nulls. This coupling at the center must be keptbelow the design coupling.
This second-order null is the basis for the SCAR coron-agraph. For comparison with existing coronagraph implemen-tations, we define the “relative integration time” as the ratiobetween the integration time for unresolved imaging and corona-graphic imaging to reach a predefined signal-to-noise ratio. Thiscan be expressed in the star and planet throughput as
∆Tcoronagraphic
∆Tunresolved=
ηs(x)η2
p(x, x0)· (4)
This metric takes into account both the raw contrast and planetthroughput of the coronagraph. Noise sources other than photon
1 0 1x/Dmla
1
0
1
y/D
mla
Amplitude
1 0 1x/Dmla
Phase
Fig. 3. Backpropagated mode of a single-mode fiber to the microlensarray surface. Conceptually our microlens array and single-mode fibercan still be thought of as focal-plane electric field filtering using thismodified mode. The mode is still Gaussian on the central microlens, butpicks up an additional tilt on off-axis microlenses: on those microlensesthe light needs to have a huge tilt to be propagated into the central fiber.
noise were ignored in this respect. As these only become impor-tant for small planet throughputs, we will show both the relativeintegration time ηs/η
2p and the planet throughput ηp.
2.2. Single-mode fiber arrays using microlenses
To cover the field of view around a star, we need to fill thefocal plane with single-mode fibers. This means that the fibersare impractically close together. A more reasonable solutionis to use a microlens array with a single-mode fiber in eachfocus, as shown by Corbett (2009). Each fiber face now con-tains a strongly spatially-filtered telescope pupil. The corre-sponding focal-plane mode for each fiber can be recovered byback-propagating the fiber mode to the focal plane. An exam-ple of such a mode is shown in Fig. 3. The amplitude of thisback-propagated mode is still Gaussian in amplitude. In phasehowever, it is flat within the central lenslet, but picks up a phasegradient on off-axis lenslets: light hitting off-axis lenslets needto have a huge tilt to still couple into the central fiber. We denotethis off-axis contribution as lenslet crosstalk, and it is taken intoaccount in every optimization and calculation done in this paper.
The throughput of the single-mode fiber array depends on theposition of the object and the mode field diameter of the fibers.Figure 4 shows the throughput for a clear aperture with slicesthrough the best and worst-case position angles. The throughputis dominated by the lenslet closest to the center of the PSF andis only weakly dependent on the mode field diameter around theoptimal value. Additionally, at each position in the focal plane,the optimal value of the mode field diameter is the same, simpli-fying implementation.
Figure 5 shows the throughput of an off-axis lenslet as afunction of microlens diameter, while keeping the PSF centeredaround the on-axis lenslet. We can clearly see that at a diame-ter of ∼1.28λ/D no stellar light is transmitted by the fiber. Thiscontrast is solely the result of the mode-filtering property of thesingle-mode fiber: if we were to use multimode fibers instead,the contrast would still be ∼3 × 10⁻² at this point. The nullingcan be classified as first order: only where the electric field of theAiry core and the first Airy ring exactly cancel do we see the con-trast reduction. Moving the PSF only slightly already destroysthis nulling.
Since the PSF changes in size with wavelength, the through-put of an off-axis fiber is inherently chromatic. We can read off
A55, page 3 of 13

A&A 635, A55 (2020)
Dmla
1.0
0.8
0.6
0.4
0.2
0.0
-3 -2 -1 0 1 2 3
0
0.2
0.4
0.6
0.8
0
0.2
0.4
0.6
Thr
ough
put
Tip-tilt offset (in λ/D)
w = 0.78 λ/Dmla
w = 0.64 λ/Dmla
w = 0.92 λ/Dmla
w = 1.06 λ/Dmla
w = 1.20 λ/Dmla
(A)
(B)
Offset in x
Offse
t in
yT
hrou
ghpu
tT
hrou
ghpu
t
(A)
(B)
Fig. 4. Throughput of the single-mode fibers as a function of tip-tiltoffset of the source. On the top a two-dimensional throughput map isshown. On the bottom two slices through this map are plotted for sev-eral values for the mode field diameter of the single-mode fibers. Max-imum throughput of ∼72% is reached at the center of a lenslet. On theedge of two microlens the throughput of two fibers have to be addedto reach ∼30% throughput. The worst case is the triple-point at whichthe maximum throughput drops to ∼25%. A fiber mode field radius ofw = 0.78λ/D achieves the highest throughput for all tip-tilt offsets.
the spectral bandwidth from Fig. 5 directly. A contrast of 10−4
is reached for 1.26λ/D < Dmla < 1.30λ/D, corresponding to aspectral bandwidth of just 3%. Nevertheless this demonstratesthat significant gains can be obtained by using single-modefibers instead of multimode fibers or even conventional intensitydetectors.
3. Coronagraphy with a single-mode fiber array
3.1. Conventional coronagraphy
We can use conventional coronagraphy techniques to reducethe spot intensity and ignore the mode-filtering property in thedesign process. As an example we use the apodizing phaseplate (APP) coronagraph (Codona et al. 2006; Snik et al. 2012;
Coup
ling
rati
o
Microlens diameter (in λ/D)
Multi-mode
Single-mode
10-1
10-2
10-3
10-4
10-51.0 1.2 1.4 1.6 1.8 2.0
Fig. 5. Coupling ratio between an on-axis and off-axis source throughan off-axis microlens as a function of microlens diameter for a mul-timode and single-mode fiber. The gain in contrast by using a single-mode fiber can readily be seen in the ratio of these two functions. Formost microlens diameters this gain amounts to several orders of magni-tude and reaches infinity at ∼1.28λ/D where the light is perfectly nulledon the fiber face by the single-mode fiber. This nulling is first order andis therefore very sensitive to wavelength and centering of the star aroundthe central lenslet.
Multi-mode contrast Single-mode contrast0
-1
-2
-3
-4
-5
-6
log 1
0(co
ntra
st)
Fig. 6. Coupling through a microlens array using a conventional APPcoronagraph with multimode fibers (left) and single-mode fibers (right).Using a conventional coronagraph such as an APP contrast is stillenhanced by the single-mode fibers. The contrast in the dark zone isstill enhanced by ∼3× on average when using single-mode fibers com-pared to multimode fibers.
Otten et al. 2017). This coronagraph consists of a single phase-only optic in the pupil plane, making it impervious to tip-tiltvibrations of the telescope or adaptive optics system. The phasepattern is designed to yield a dark zone in a certain region ofinterest in the focal plane. This region of interest can be bothone- and two-sided, and can have arbitrary shapes. Most oftenthe one-sided regions of interest are D-shaped and the two-sidedare annular. See Por (2017) for a recent description of APPdesign. As both the PSF of the star and the planet are altered,the Strehl ratio is maximized to retain planet transmission.
Figure 6 shows the contrast through a fiber-fed single-modefiber array using an APP designed for a contrast of 10−5 in aD-shaped region with an inner working angle of 2λ/D and outerworking angle of 10λ/D. While the use of single-mode fibersdoes enhance the contrast by ∼3× on average, this enhancementis not consistent: in some fibers the contrast is enhanced by >10×while in others we barely see any improvement at all. This showsthat the factor of 3 enhancement that Mawet et al. (2017) finds
A55, page 4 of 13

E. H. Por and S. Y. Haffert: The Single-mode Complex Amplitude Refinement (SCAR) coronagraph. I.
for a dynamic random speckle field holds true for a single-modefiber in a static structured speckle field, such as a residual coro-nagraphic electric field, even when the mode shape is modifiedfrom a Gaussian to a constricted Gaussian profile.
3.2. Direct pupil-plane phase mask optimization
This improvement brings up the question: can we make use ofthis mode-filtering in the coronagraph design? As the single-mode fiber array already filters out some electric field modes,the coronagraph does not have to suppress those modes; onlymodes that are transmitted by the single-mode fiber array needto be suppressed by the coronagraph. The coronagraph needs tominimize the coupling through the single-mode fibers, not theintensity at those positions in the focal plane. Designing a coro-nagraph specifically for the fiber array therefore allows for moredesign freedom compared to conventional coronagraph design.In principle, any coronagraph can be designed to take the fibercoupling into account. As a case study, we use a pupil-planephase plate to alter the PSF in the focal plane. A schematic lay-out of the proposed system is shown in Fig. 1.
To find the phase pattern, we use the novel optimizer fromPor (2017), based on the work by Carlotti et al. (2013), thatmaximizes the throughput (i.e. Strehl ratio) for a complex pupilmask, while constraining the stellar intensity in the dark zone tobe below the desired contrast. Since the transformation betweenthe pupil and focal plane is linear in electric field, this opti-mization problem is linear, and its global optimum can beeasily found using large-scale numerical optimizers such asGurobi (Gurobi Optimization, Inc. 2016). In practice the opti-mization produces phase-only solutions, which is surprisingas non-phase-only solutions are still feasible solutions. As thephase-only optimization problem is simply a more constrainedversion of the linear one, the phase-only solution must thereforebe a global optimum of both problems.
The fiber coupling integral in Eq. (1), or rather the amplitudeof the coupled electric field
Ecoupled =
∫E∗inEsmdA∣∣∣∫ EsmdA
∣∣∣ (5)
is still linear in the input electric field Ein, so we can apply thesame method here. We maximize the throughput of the centralfiber, while constraining the coupling through the specified off-axis fibers. To counter the chromaticity mentioned in Sect. 2.2,we constrain the off-axis stellar intensity at several wavelengthssimultaneously, which ensures that the contrast is attained overa broad spectral bandwidth. Jitter resistance is kept in check ina similar manner: the desired raw contrast must be attained forseveral tip-tilt positions simultaneously.
In Fig. 7 we show a few examples of optimizations for one,three and six fibers for a contrast of 1×10⁻⁴, 3×10⁻⁵ and 1×10⁻⁵
using a 0%, 10% and 20% spectral bandwidth, along with theircorresponding PSF and chromatic response. The design parame-ters are shown in Table 1. These design parameters were chosento show a variety of SCAR designs for realistic implementations.At the shown contrast limits, the residual atmospheric speck-les will limited the on-sky contrast, even after an extreme AOsystem. The spectral bandwidths were chosen as wide as possi-ble, without compromising on planet throughput. The resultingspectral bandwidths are large enough to apply spectral cross-correlation techniques.
In each case the optimizer prefers a second order null. Thissecond order null is much more stable against bandwidth and
tip-tilt jitter. The reason for this is explained graphically in Fig. 2.Furthermore, this second order null is even present in monochro-matic optimizations and in optimizations without accommoda-tion for tip-tilt errors. This means that the second-order nullrequires less phase stroke to achieve and therefore provideshigher Strehl ratios.
As the optimizer can handle arbitrary apertures, optimiza-tions for other aperture shapes are also possible. Figure 8 showsoptimizations for a VLT aperture for the same parameters as forthe clear apertures. The aperture was subject to a 1% binary ero-sion, i.e. undersizing the pupil and oversizing central obscura-tion, spiders and other pupil features by 1% of the aperture size,to accommodate for a misalignment in the pupil mask. Althoughthe overall structure is quite similar, there is one key differencecompared to a clear aperture: the relative transmission T is lowerfor all phase plate designs. This means that the relative trans-mission depends strongly on the size of the central obscuration.This is obvious as larger central obscurations strengthen the firstAiry ring and brighter features typically cost more stroke, andtherefore relative transmission, to change, similar to conven-tional APP design. Effectively, this means that each feature inthe phase pattern becomes larger to compensate for larger cen-tral obscurations.
We summarize the multitude of SCAR phase pattern designsin Fig. 9. This figure shows the total planet throughput ηp, pro-vided that the planet is located in the center of the off-axismicrolens. This throughput includes all theoretically unavoid-able terms, but excludes all experimental terms. A summary ofimportant throughput terms are listed in Table 2.
In the rest of this paper, we consider the outlined SCARdesign in Figs. 7 and 8 using a 10% spectral bandwidth for acontrast of 3× 10⁻⁵. Although optimized for only 10%, this spe-cific design performs exceptionally well and a contrast of <10−4
is obtained for a spectral bandwidth of 18% centered around thedesign wavelength.
4. Single-mode fiber coronagraph properties
In this section we show the properties of this new corona-graph and perform parameter studies on the fixed parametersin Table 1. We discuss the mode field diameter of the single-mode fiber in Sect. 4.1, throughput and inner working angle inSect. 4.2, the chromatic response in Sect. 4.3, the tip-tilt sensitiv-ity of the SCAR designs in Sect. 4.4 and the sensitivity of othermodes in Sect. 4.5.
4.1. Fiber mode field diameter
The phase plate reduces the throughput of planet light. Thisreduction will also affect the optimal value of the mode fielddiameter. Smaller mode field diameters result in larger back-propagated fiber modes in the focal plane, which makes it easierto squeeze the three rings necessary for the second-order nullinginto this mode. Therefore, we expect higher Strehl ratios (thethroughput relative to the unaltered PSF throughput) as the modefield diameter becomes smaller. This is superimposed on theactual throughput of the unaltered PSF. Both curves are shownin Fig. 10 for both a clear and the VLT aperture.
4.2. Throughput and inner working angle
The throughput shown here is the fractional transmission oflight from the entire pupil into the central single-mode fiber:
A55, page 5 of 13

A&A 635, A55 (2020)
0.9 1.0 1.1/ 0
6
5
4
log10(contrast) 10 4 3×10 5 10 5
0.9 1.0 1.1/ 0
10 4 3×10 5 10 5
0.9 1.0 1.1/ 0
10 4 3×10 5 10 5
0.9 1.0 1.1/ 0
6
5
4
log10(contrast) 10 4 3×10 5 10 5
0.9 1.0 1.1/ 0
10 4 3×10 5 10 5
0.9 1.0 1.1/ 0
10 4 3×10 5 10 5
0.9 1.0 1.1/ 0
6
5
4
log10(contrast) 10 4 3×10 5 10 5
0.9 1.0 1.1/ 0
10 4 3×10 5 10 5
0.9 1.0 1.1/ 0
10 4 3×10 5 10 5
Number of nulled fibers1 fiber 3 fibers 6 fibers
0%
10%
20%
Des
ign
spec
tral
ban
dwid
th
Fig. 7. Series of optimizations for one, three and six fibers on the first ring of microlenses for a clear aperture. The design spectral bandwidth were0%, 10% and 20% and the contrasts 1 × 10⁻⁴, 3 × 10⁻⁵ and 1 × 10⁻⁵. A 0.06λ/D peak-to-peak telescope tip-tilt jitter was also taken into account.Each microlens has a circum-diameter of 1.8λ/D. For each SCAR design we show the pupil-plane phase pattern, its corresponding point spreadfunction and its raw contrast ηs/ηp as a function of wavelength averaged over the marked fibers. The chromatic response shows the raw contrastafter the single-mode fiber. The second-order nulling on the fiber face is clearly visible in every design. In Table 1 we list the fixed and variedparameter in this figure. The throughput of all SCAR designs shown in this figure can be found in Fig. 9.
it includes all theoretical terms as listed in Table 1. It how-ever excludes all experimental terms. It is clear that largermicrolenses generally give a better throughput, as is expected.Additionally, we can see that the optimal mode field diameter asa function of microlens diameter for the unaltered PSF movesto larger mode field diameters, as it is essentially matching theAiry-core width rather than the size of the microlens itself. The
optimal mode field diameter for the SCAR however stay thesame as smaller mode field diameter have an advantage in theirStrehl ratio.
Figure 11 shows the throughput (ηp) of the coronagraphfor different values for the microlens diameter. The mode fieldradius of the fiber was fixed at w = 0.85λ/Dmla and the con-trast at 3 × 10⁻⁵. We adopted a 0.1λ/D rms telescope tip-tilt
A55, page 6 of 13

E. H. Por and S. Y. Haffert: The Single-mode Complex Amplitude Refinement (SCAR) coronagraph. I.
Table 1. Design parameters used for all SCAR designs throughout thiswork.
Parameter name Value
Raw contrast limit {1 × 10⁻⁴, 3 × 10⁻⁵, 1 × 10⁻⁵}
Spectral bandwidths {0%, 10%, 20%}Tip-tilt errors 0.06λ/D peak-to-peakMicrolens circum-diameter 1.8λ/DMicrolens shape HexagonalFiber mode shape GaussianFiber mode field diameter 1.7λ/DmlaPupil mask {Unobstructed,VLT}
Notes. All SCAR designs generated with these parameters can be foundin Figs. 7 and 8.
jitter with a normal distribution, corresponding to a 2 mas rmstip-tilt jitter at a wavelength of λ = 750 nm. This level of tip-tiltjitter was chosen to mimic a SPHERE-like adaptive optics sys-tem, according to Fusco et al. (2016). The throughput is aver-aged over all pointing positions and over the full 10% spectralbandwidth. The throughput of off-center fibers is negligible tothat of the central fiber: all throughput is concentrated in onlyone single-mode fiber.
As the stellar throughput is only minimized for the firstring of microlenses, we do not have much throughput beyondthe edge of the first off-axis microlens. Designs can be madefor more than one ring of microlenses, although this compli-cates the design procedure and will be discussed in future work.Extremely close to the star, we have no throughput, as theAiry core is still mostly on the central lenslet. At ∼0.5λ/D thethroughput starts to rise, reaching a maximum at the center ofthe first microlens. A throughput of ∼50% of the maximumSCAR throughput is already reached at ∼1λ/D, which is theusual definition of inner working angle. Also, up to microlensdiameters of ∼1.8λ/D the throughput at small angular separa-tions (<1λ/D) does not change much, but the maximum through-put still increases. For larger microlens diameter we still gain inthroughput at the center of the microlens, however the through-put at these small angular separations starts to suffer, which isespecially visible in the Dmla = 2.0λ/D throughput curve.
Lines for the theoretical throughput of other coronagraphsare overplotted in Fig. 11. Perfect coronagraphs refer to thenotion introduced by Cavarroc et al. (2006) and Guyon et al.(2006). A second-order perfect coronagraph removes a constantterm from the pupil-plane electric field. A fourth-order addition-ally removes the x and y components from the electric field. Asixth-order perfect coronagraph furthermore removes the x2, xyand y2 modes from the electric field. For the theoretical coro-nagraphs, the throughput is calculated using a circular apertureof 0.7λ/D centered around the off-axis planet. We can see thatthe SCAR throughput lags behind the theoretical second-ordercoronagraph, but stays close to the fourth-order and beats thesixth-order at angular separations <1.7λ/D.
Figure 12 shows the relative integration time (ηs/η2p) under
the same conditions as in Fig. 11. We now see that, even thoughthe throughput of the theoretical second-order coronagraph isgood, its integration time is minor because it does not outweighthe loss in starlight suppression. SCAR however performs sim-ilar to theoretical fourth-order coronagraph for angular separa-tions <1.8λ/D. A sixth-order coronagraphs does even better, butsuffers from a lack of throughput which becomes noticeable incases where the raw contrast (ηs/ηp) is limited, which is the case
in any ground-based telescope. This suggests that SCAR is aclose-to-optimal coronagraph.
4.3. Spectral bandwidth
Figures 7 and 8 show the chromatic response for all designs.Every design exhibits the double-dipped structure of the second-order null on the fiber. For all designs with a non-zero spectralbandwidth, we can also see that the contrast is hard to achieve onthe long wavelength side. At these longer wavelengths the brightAiry core starts to grow into the microlens array. This meansthat the second Airy ring needs to be made much brighter tocompensate, which requires substantial deviations in the phasepattern. Qualitatively, the location of the second null is chosenby the optimizer such that the spectral bandwidth requirement isreached.
4.4. Tip-tilt sensitivity and stellar diameter
Figure 13 shows the average contrast (ηs/ηp) over the full 10%bandwidth as a function of tip-tilt error upstream of the fiberinjection unit. The double-dip structure is again clearly visible,which greatly improves the tip-tilt response. Both coronagraphdesigns achieve a tip-tilt stability of ∼0.1λ/D rms. This figurealso shows that the SCAR coronagraph is insensitive for starswith an angular diameter up to 0.1λ/D.
4.5. Sensitivity to other aberrations
To show the sensitivity to other aberrations, we perform a sen-sitivity analysis on the SCAR coronagraph: we aim to find themode basis of orthogonal modes ordered by their sensitivity.These principal modes can be found by taking the first-orderTaylor expansion of the phase in the pupil-plane around the nom-inal position. In this way a linear transformation Gλ can be con-structed from a phase deformation δϕ to the resulting change inelectric field in the fibers δEλ:
δEλ = Gλδϕ. (6)
Gλ and δEλ both depend on wavelength as the response of thecoronagraph is inherently chromatic. A singular value decompo-sition of the matrix Gλ yields the monochromatic principal phasemodes of the coronagraph. The corresponding singular valuesdenote the importance of those modes. This expansion is sim-ilar to the one used in electric field conjugation (Give’on et al.2007).
Broadband principal modes can be obtained by stacking sev-eral Gλ matrices for wavelengths within the spectral bandwidthinto a single matrix G asδEλ1
δEλ2
...δEλN
=
Gλ1
Gλ2
...GλN
δϕ. (7)
A singular value decomposition on the matrix G now yields thebroadband principal modes. The singular values are now indica-tive of the amount of electric field each phase mode induces inthe fibers as a function of wavelength. This method is againsimilar to the one used in broadband electric field conjuga-tion (Give’on et al. 2007).
Figure 14 shows the broadband principal modes for theSCAR design for the VLT aperture, along with their singular val-ues. Only six modes are important for the final contrast. Naively
A55, page 7 of 13

A&A 635, A55 (2020)
0.9 1.0 1.1/ 0
6
5
4
log10(contrast) 10 4 3×10 5 10 5
0.9 1.0 1.1/ 0
10 4 3×10 5 10 5
0.9 1.0 1.1/ 0
10 4 3×10 5 10 5
0.9 1.0 1.1/ 0
6
5
4
log10(contrast) 10 4 3×10 5 10 5
0.9 1.0 1.1/ 0
10 4 3×10 5 10 5
0.9 1.0 1.1/ 0
10 4 3×10 5 10 5
0.9 1.0 1.1/ 0
6
5
4
log10(contrast) 10 4 3×10 5 10 5
0.9 1.0 1.1/ 0
10 4 3×10 5 10 5
0.9 1.0 1.1/ 0
10 4 3×10 5 10 5
Number of nulled fibers1 fiber 3 fibers 6 fibers
0%
10%
20%
Des
ign
spec
tral
ban
dwid
th
Fig. 8. Same as Fig. 7 for a VLT aperture. The aperture was subject to a 1% binary erosion, i.e. undersizing the pupil and oversizing centralobscuration, spiders and other pupil features by 1% of the aperture size, to accommodate a pupil misalignment. The general structure of thesolutions is similar to the case of a clear aperture. The central obscuration increases the strength of the first Airy ring, thereby decreasing thethroughput of these SCAR designs slightly. The relatively thin spiders have no influence on the throughput at these angular separations. In Table 1we list the fixed and varied parameter in this figure. A summary of the throughput of all SCAR designs shown in this figure can be found in Fig. 9.
we would expect two modes per fiber, so 12 modes in total, aswe need to control both the real and imaginary part of the elec-tric field. However in our case the system shows an antihermi-tian symmetry: the transmitted electric field on fibers in oppositepoints in the focal plane are not independent if only small phaseaberrations are present. This means that one phase mode deter-mines the electric field for both fibers so that only two modesper two fibers are needed. Only half of the original 12 modes
determine the contrast in a monochromatic system, meaning thatsix modes are left. The omitted six modes correspond to ampli-tude errors. For the broadband principal modes we of courseexpect some additional modes with low importance, correspond-ing to the spectral bandwidth increase. The first six of these areshown as modes 7 to 12 in Fig. 14.
The first principal mode is trefoil, which is the result of thesix-fold symmetry in the fiber locations. The second trefoil is
A55, page 8 of 13

E. H. Por and S. Y. Haffert: The Single-mode Complex Amplitude Refinement (SCAR) coronagraph. I.
1 × 10 4 3 × 10 5 1 × 10 5
Raw contrast ( s/ p)
20%
10%
0%Spec
tral b
andw
idth
(/
)
76% 73% 67%
76% 76% 76%
76% 76% 76%
1 fiber
1 × 10 4 3 × 10 5 1 × 10 5
Raw contrast ( s/ p)20
%10
%0%Sp
ectra
l ban
dwid
th (
/)
73% 65% 51%
74% 73% 71%
75% 74% 74%
3 fibers
1 × 10 4 3 × 10 5 1 × 10 5
Raw contrast ( s/ p)
20%
10%
0%Spec
tral b
andw
idth
(/
)
49% 27% 12%
53% 50% 38%
54% 53% 51%
6 fibers
1 × 10 4 3 × 10 5 1 × 10 5
Raw contrast ( s/ p)
20%
10%
0%Spec
tral b
andw
idth
(/
)
71% 69% 63%
71% 71% 70%
71% 71% 71%
1 fiber
1 × 10 4 3 × 10 5 1 × 10 5
Raw contrast ( s/ p)
20%
10%
0%Spec
tral b
andw
idth
(/
)
64% 58% 47%
65% 64% 62%
66% 65% 64%
3 fibers
1 × 10 4 3 × 10 5 1 × 10 5
Raw contrast ( s/ p)
20%
10%
0%Spec
tral b
andw
idth
(/
)
35% 23% 11%
37% 35% 30%
39% 38% 36%
6 fibers
0.0
0.2
0.4
0.6
0.8
1.0
0.0
0.2
0.4
0.6
0.8
1.0
0.0
0.2
0.4
0.6
0.8
1.0
0.0
0.2
0.4
0.6
0.8
1.0
0.0
0.2
0.4
0.6
0.8
1.0
0.0
0.2
0.4
0.6
0.8
1.0
Unobstructed aperture
VLT aperture
Fig. 9. Throughput (ηp) for the SCAR designs shown Figs. 7 and 8. The shown throughput is the total throughput of the coronagraphic system.It includes the Strehl reduction of the phase plate, the spatial filtering of the microlenses and the mode filtering of the single-mode fibers. Thisthroughput is achieved through a single single-mode fiber when the planet is located directly on top of an off-axis lenslet. The throughput at otherpositions varies generally according to Fig. 4, but varies slightly depending on the specific SCAR design.
missing: its corresponding electric field change is completely fil-tered out by the single-mode fibers: it creates radial first-ordernulls directly on the center of every lenslet. Other importantmodes include secondary-astigmatism-like modes for modes 2and 3, coma-like modes for modes 4 and 5, and a perturbedspherical mode for mode 6.
In Fig. 15 we show the response of the SCAR coronagraphto each of these modes. The average normalized irradiance isthe average raw contrast over the full spectral bandwidth and allsix fibers in the first ring of microlenses. It can be seen that theresponse for the first six modes is generally a lot stronger thanthat of the last six. The average raw contrast is limited by theresidual leakage from the SCAR coronagraph at the low aber-ration end, while the contrast increases when more aberrationis added. Additionally, we can see different behaviour, depend-ing on the mode that we are looking at. Some modes (modes1 to 6, 9, 11 and 12) show quadratic behaviour, while others(modes 7, 8 and 10) show a fourth order behaviour. Also noticethat mode 7 actually increase the average raw contrast. Whilethis may seem an impossibility, as the SCAR coronagraph isoptimized for raw contrast, in these cases the fibers on one sidebecome brighter than the contrast constraint, while the otherscompensate by becoming dimmer. This would actually decreasethe effectiveness of the coronagraph while still increasing theaverage raw contrast.
5. Comparison to the vortex coronagraph
The described performance of the SCAR coronagraph begsthe question on how it compares to other coronagraphs using
Table 2. Different throughput terms that are important for the SCARcoronagraph.
Throughput term Typical values
TheoreticalGeometric lenslet throughput ∼80%Fiber injection losses 90%−95%Planet location 50%−100%Phase plate Strehl reduction 60%−80%Total ∼41%
ExperimentalPhase plate transmission >85%Fresnel losses on the fiber ∼90%Microlens transmission >95%Strehl ratio of the AO system ∼50%Total '36%
Total '14%
Notes. A distinction is made between theoretical and experimentalterms. Experimental throughput terms will be non-existent with per-fect manufacturing, while theoretical throughput terms are unavoidable.Typical values in the visible are shown for each term. The values for theexperimental throughput terms are indicative of current technology per-formance and may increase as technology matures.
single-mode fibers. In this section we will provide a comparisonof the SCAR coronagraph with the single-mode fiber injectionunit with vortex coronagraph proposed by Mawet et al. (2017),and a comparison with a multiplexed fiber injection unit as
A55, page 9 of 13

A&A 635, A55 (2020)
0.0
0.2
0.4
0.6
0.8
Thro
ughp
ut
Dmla=1.4 /DDmla=1.5 /DDmla=1.6 /DDmla=1.7 /DDmla=1.8 /DDmla=1.9 /DDmla=2.0 /D
0.5 0.6 0.7 0.8 0.9 1.0 1.1 1.2Mode field radius ( /Dmla)
0.0
0.2
0.4
0.6
0.8
Thro
ughp
ut
Dmla=1.4 /DDmla=1.5 /DDmla=1.6 /DDmla=1.7 /DDmla=1.8 /DDmla=1.9 /DDmla=2.0 /D
Fig. 10. Throughput of the central lenslet as a function of mode fieldradius for various values of the microlens diameter. Each data point rep-resents a different SCAR design. Solid lines indicate the SCAR PSFs,dashed lines an unaltered PSF. Top panel: throughput for an clear aper-ture, bottom panel: for a VLT aperture.
shown in Sect. 3 behind a vortex coronagraph. Figure 16 showsthe throughput and relative integration time of a conventionalvortex coronagraph using a clear aperture. A conventional inten-sity detector (i.e. sum of all flux in an aperture centered aroundthe star) is compared with a single-mode fiber centered aroundthe planet. The mode field diameter was optimized for maxi-mum throughput of the PSF without a coronagraph. To bettercapture the best and worst case performance for comparisonwith the vortex coronagraph, we take a telescope tip-tilt jittersof 0.05λ/D for the best case performance and 0.15λ/D for theworst case performance Similarly to Fig. 11, a telescope tip-tiltjitter of 0.1λ/D rms was chosen.
For charges m = 4 and m = 6 a decrease in throughput, com-pared to the vortex coronagraph with multimode fiber, can beseen, approximately corresponding with the maximum couplingof an Airy pattern through a Gaussian single-mode fiber. Addi-tionally the vortex in the focal plane imprints a phase ramp onoff-axis sources, which degrades throughput even further. Thiseffect is more pronounced with smaller angular separations and
0.0
0.2
0.4
0.6
0.8
1.0
Thro
ughp
ut (
p)
Dmla = 1.4 /DDmla = 1.5 /DDmla = 1.6 /DDmla = 1.7 /DDmla = 1.8 /D
Dmla = 1.9 /DDmla = 2.0 /D2nd order4th order6th order
0 1 2 3 4Angular separation ( /D)
0.0
0.2
0.4
0.6
0.8
1.0
Thro
ughp
ut (
p)
Dmla = 1.4 /DDmla = 1.5 /DDmla = 1.6 /DDmla = 1.7 /DDmla = 1.8 /D
Dmla = 1.9 /DDmla = 2.0 /D2nd order4th order6th order
Fig. 11. Throughput as function of off-axis angle for various values ofthe microlens diameter. The throughput of a perfect second, fourth andsixth-order coronagraph is also plotted. Top panel: throughput for anunobstructed aperture, bottom panel: for the VLT aperture. The through-put is calculated for the optimal position angle of the off-axis source (i.e.directly across an off-axis microlens). The throughput for the theoreti-cal coronagraphs is taken to be the fractional flux within an aperture ofradius 0.7λ/D centered around the planet.
higher charge vortices. Most of this phase ramp can be eas-ily negated by tilting the fiber slightly, depending on the focal-plane position of the planet. We can see that the SCAR corona-graph wins in throughput compared to vortex coronagraphs withcharger m > 2. However the charge 2 vortex coronagraph doesnot suppress the star very well, resulting in a moderate relativeintegration time compared to the SCAR coronagraph.
Figure 17 shows the throughput and relative integration timeof a vortex coronagraph charge m = 2 through a microlens-fedsingle-mode fiber-array as the fiber injection unit. The diameterof the microlenses is varied from 1.4 to 2.0λ/D, and the modefield diameter is optimized for maximum throughput of an Airypattern. For large angular separations the throughput oscillatesdue to the transmission of the microlens array as shown in Fig. 4.For the first ring of microlenses the throughput rises quickly,again reaching its maximum at the center of the microlens.
A55, page 10 of 13

E. H. Por and S. Y. Haffert: The Single-mode Complex Amplitude Refinement (SCAR) coronagraph. I.
10 4
10 3
10 2
10 1
100
Inte
grat
ion
tim
e ga
in (
s/2 p)
Dmla = 1.4 /DDmla = 1.5 /DDmla = 1.6 /DDmla = 1.7 /DDmla = 1.8 /DDmla = 1.9 /DDmla = 2.0 /Dtheoretical m = 2theoretical m = 4theoretical m = 6
0 1 2 3 4Angular separation ( /D)
10 4
10 3
10 2
10 1
100
Inte
grat
ion
tim
e ga
in (
s/2 p)
Dmla = 1.4 /DDmla = 1.5 /DDmla = 1.6 /DDmla = 1.7 /DDmla = 1.8 /DDmla = 1.9 /DDmla = 2.0 /Dtheoretical m = 2theoretical m = 4theoretical m = 6
Fig. 12. Relative integration time (ηs/η2p) as function of off-axis angle
for various values of the microlens diameter. Top panel: relative inte-gration time for an unobstructed aperture, bottom panel: for the VLTaperture. The integration time for the theoretical coronagraphs is calcu-lated on the flux within an aperture of radius 0.7λ/D centered aroundthe planet.
0.2 0.1 0.0 0.1 0.2Tip-tilt error in x ( /D)
0.2
0.1
0.0
0.1
0.2
Tip-
tilt e
rror
in y
(/D
)
-4.5
-4.5
-4.5
-4.0
-4.0
-4.0
-4.0
-3.5
-3.5
-3.0
Clear aperture
0.2 0.1 0.0 0.1 0.2Tip-tilt error in x ( /D)
-4.5
-4.5
-4.5
-4.0
-4.0
-4.0
-4.0
-3.5
-3.5
-3.5
-3.0
VLT aperture
Fig. 13. Map of the worst contrast through an off-axis fiber over a 10%bandwidth as a function of tip-tilt error upstream of the microlens array.This shows that the coronagraph is reasonably stable against tip-tilt,allowing for a ∼0.15λ/D tip-tilt error until the contrast drops to 10−4.The contour labels indicate log10(ηs/ηp).
Even though the coupling efficiency for smaller microlensesis higher, the geometric throughput decreases more rapidly. Atrade-off between these two throughput terms leads to an opti-mal microlens diameter of ∼1.8λ/D for the vortex coronagraphas well. The throughput at this microlens diameter is comparableto the performance of the SCAR coronagraph even though the
1 2 3 4 6
7 8 9 10 11 12
5
1.0
0.0
0.2
0.4
0.6
0.8
Rel
ativ
e sing
ular
val
ues
Mode number2 4 6 8 10 12
Fig. 14. Principal phase modes for the SCAR coronagraph using thedesign described in the text. Top panel: singular value of each mode,indicating its significance for the obtained contrast after phase correc-tion. Bottom panel: pupil-plane phase for each mode.
10 4 10 3 10 2
RMS wavefront error (waves)
10 5
10 4
10 3
10 2
Ave
rage
nor
mal
ized
irra
dian
ce
Mode 1Mode 2Mode 3Mode 4Mode 5Mode 6
Mode 7Mode 8Mode 9Mode 10Mode 11Mode 12
Fig. 15. Average normalized irradiance for each of the modes in Fig. 14.The normalized irradiance is averaged over all fibers in the first ring ofmicrolenses, and over the full 10% spectral bandwidth. These curvescan yield constraints on the post-AO residual variance for each of theshown modes. Higher-order modes in this expansion generally have lessresponse and do not have to be controller as well as low-order modes.
vortex coronagraph has a more complicated optical setup. Thismultiplexed single-mode fiber vortex coronagraph however doesnot suppress starlight as well as the SCAR, leading to a worserelative integration time. The vortex coronagraph however doeshave the advantage of an infinite outer working angle.
6. Conclusion
In this paper we described the principle behind coronagraphsleveraging the design freedom offered by the use of single-mode
A55, page 11 of 13

A&A 635, A55 (2020)
Tip-tilt jitter 0.05 λ/D Tip-tilt jitter 0.15 λ/D
Fig. 16. Throughput (ηp) and relative integration time (ηs/η2p) for a vortex coronagraph using a clear aperture for charges m = 2, 4, 6 using a
conventional intensity detector or a single-mode fiber centered around the planet. A telescope tip-tilt jitter of (left column) 0.05λ/D or (rightcolumn) 0.15λ/D rms was taken into account. These values correspond to a best and worst case performance of the adaptive optics system. Thethroughput is calculated for the optimal position angle of the off-axis source (i.e. directly across an off-axis microlens). For the vortex coronagraphwithout fiber, the throughput and relative integration time is calculated on an aperture of radius 0.7λ/D centered around the planet.
fibers as a mode filter. We have shown the properties of amicrolens-array fed single-mode fiber-array, making it possibleto perform exoplanet searches. We combined this with a pupil-plane phase plate, yielding the SCAR coronagraph and presentedthe following advantages of this new coronagraph:1. Low inner working angles. Inner working angles as low as
1λ/D can be reached using current designs.2. High throughput. These designs reach a maximum through-
put of 50% and 30% for a clear and the VLT aperture, respec-tively.
3. High contrast. Starlight can be suppressed to <3 × 10⁻⁵ forthe six fibers surrounding the star over the full spectral band-width until the throughput starts to drop.
4. Broad spectral bandwidth. This suppression is achieved overthe full 20% spectral bandwidth.
5. Robust against tip-tilt errors. The SCAR coronagraph is sta-ble against ∼0.1λ/D rms tip-tilt errors upstream due to theuse of second order nulling on the fibers.
6. Residual speckle suppression. Residual speckles are arereduced by ∼3× in intensity, due to the couplingefficiency of a random electric field into the single-modefibers.
All advantages can be obtained into a single SCAR design. Allthese advantages make this coronagraph a prime candidate forfuture upgrades of extreme AO systems. In particular, the SCARcoronagraph is perfectly suited for spectral characterization ofProxima b: it satisfies all coronagraphic requirements set byLovis et al. (2017). A companion paper (Haffert et al. 2020) pro-vides a tolerancing study for this specific application.
Future research will explore active control of the fiberthroughput of the SCAR coronagraph. Application of the SCARmethodology to other coronagraphs is also left for futureresearch. An interesting example in this case is the design ofa Lyot-plane mask for a conventional Lyot or vortex corona-graph, akin to Ruane et al. (2015a). Even optimizing the focal-plane mask itself might be realizable for the fiber array in thesecoronagraphs (Ruane et al. 2015b).
Another avenue is the use of photonic technologies to fur-ther process the light in the fibers. A simple example is theuse of fiber Bragg gratings for filtering the atmospheric OHlines (Trinh et al. 2013). Another example is building a phase-shifting interferometer of the six fibers. This will provide infor-mation about the coherence of the light in each of the fibers withrespect to the star, and would allow for synchronous interfero-metric speckle subtraction (Guyon 2004).
A55, page 12 of 13

E. H. Por and S. Y. Haffert: The Single-mode Complex Amplitude Refinement (SCAR) coronagraph. I.
Tip-tilt jitter 0.05 λ/D Tip-tilt jitter 0.15 λ/D
Fig. 17. Throughput (ηp) and relative integration time (ηs/η2p) of a charge m = 2 vortex coronagraph on a microlens-fed single-mode fiber array.
The diameter of the microlenses is varied from 1.4 to 2.0λ/D, and the mode field diameter is optimized for maximum throughput of an Airypattern. The throughput of the SCAR coronagraph designed for 1.8λ/D microlens diameter was added for comparison. The assumed tip-tilt jitteris (left column) 0.05λ/D or (right column) 0.15λ/D rms. These values correspond to a best and worst case performance of the adaptive opticssystem. The throughput is calculated for the optimal position angle of the off-axis source (i.e. directly across an off-axis microlens).
Acknowledgements. Por acknowledges funding from The Netherlands Organ-isation for Scientific Research (NWO) and the São Paulo Research Founda-tion (FAPESP). Haffert acknowledges funding from research program VICI639.043.107, which is financed by NWO.
ReferencesAime, C., & Soummer, R. 2004, ApJ, 612, L85Anglada-Escudé, G., Amado, P. J., Barnes, J., et al. 2016, Nature, 536, 437Beuzit, J. L., Feldt, M., Dohlen, K., et al. 2008, Proc. SPIE, 7014, 701418Borucki, W. J., Koch, D. G., Basri, G., et al. 2011, ApJ, 736, 19Brogi, M., Snellen, I. A., de Kok, R. J., et al. 2012, Nature, 486, 502Carlotti, A., Kasdin, N. J., Vanderbei, R. J., & Riggs, A. E. 2013, Proc. SPIE,
8864, 88641QCavarroc, C., Boccaletti, A., Baudoz, P., Fusco, T., & Rouan, D. 2006, A&A,
447, 397Codona, J., Kenworthy, M., Hinz, P., Angel, J., & Woolf, N. 2006, Proc. SPIE,
6269, 62691NCorbett, J. C. 2009, Opt. Exp., 17, 1885Fusco, T., Sauvage, J. F., Mouillet, D., et al. 2016, Proc. SPIE, 9909, 99090UGive’on, A., Kern, B., Shaklan, S., Moody, D. C., & Pueyo, L. 2007, Proc. SPIE,
6691, 66910AGurobi Optimization, Inc. 2016, Gurobi Optimizer Reference Manual, http://www.gurobi.com
Guyon, O. 2004, ApJ, 615, 562Guyon, O. 2005, ApJ, 629, 592Guyon, O., Pluzhnik, E., Kuchner, M., Collins, B., & Ridgway, S. 2006, ApJS,
167, 81Haffert, S. Y., Por, E. H., Keller, C. U., et al. 2020, A&A, 635, A56Haguenauer, P., & Serabyn, E. 2006, Appl. Opt., 45, 2749
Hanot, C., Mennesson, B., Martin, S., et al. 2011, ApJ, 729, 110Jovanovic, N., Martinache, F., Guyon, O., et al. 2015, PASP, 127, 890Kawahara, H., Murakami, N., Matsuo, T., & Kotani, T. 2014, ApJS, 212,
27Kipping, D. M., Cameron, C., Hartman, J. D., et al. 2017, AJ, 153, 93Konopacky, Q. M., Barman, T. S., Macintosh, B. A., & Marois, C. 2013, Science,
339, 1398Lovis, C., Snellen, I., Mouillet, D., et al. 2017, A&A, 599, A16Macintosh, B., Graham, J. R., Ingraham, P., et al. 2014, Proc. Natl. Acad. Sci.,
111, 12661Marcuse, D. 1978, J. Opt. Soc. Am., 68, 103Marois, C., Lafreniere, D., Doyon, R., Macintosh, B., & Nadeau, D. 2006, ApJ,
641, 556Martin, S., Serabyn, E., Liewer, K., et al. 2008, Society of Photo-Optical
Instrumentation EngineersMawet, D., Pueyo, L., Lawson, P., et al. 2012, Proc. SPIE, 8442, 844204Mawet, D., Ruane, G., Xuan, W., et al. 2017, ApJ, 838, 92Otten, G. P., Snik, F., Kenworthy, M. A., et al. 2017, ApJ, 834, 175Pepe, F. A., Cristiani, S., Lopez, R. R., et al. 2010, Proc. SPIE, 7735, 77350FPor, E. H. 2017, Proc. SPIE, 10400, 104000VRiaud, P., & Schneider, J. 2007, A&A, 469, 355Ruane, G. J., Huby, E., Absil, O., et al. 2015a, A&A, 583, A81Ruane, G. J., Swartzlander, G. A., Slussarenko, S., Marrucci, L., & Dennis, M.
R. 2015b, Optica, 2, 147Snellen, I. A., Brandl, B. R., de Kok, R. J., et al. 2014, Nature, 509, 63Snellen, I., de Kok, R., Birkby, J., et al. 2015, A&A, 576, A59Snik, F., Otten, G., Kenworthy, M., et al. 2012, Proc. SPIE, 8450, 84500MSparks, W. B., & Ford, H. C. 2002, ApJ, 578, 543Trinh, C. Q., Ellis, S. C., Bland-Hawthorn, J., et al. 2013, AJ, 145, 51Wang, J., Mawet, D., Ruane, G., Hu, R., & Benneke, B. 2017, AJ, 153, 183
A55, page 13 of 13