The Shale Gas Revolution -...
60
The Shale Gas Revolution Lucian Pugliaresi Energy Policy Research Foundation, Inc. Presentation on behalf of the Japan Oil, Gas, and Metals Corporation Tokyo February 2, 2010 Energy Policy Research Foundation, Inc. | 1031 31st St, NW Washington, DC 20007 | 202.944.3339 | www.eprinc.org 1
Transcript of The Shale Gas Revolution -...

The Shale Gas RevolutionLucian Pugliaresi
Energy Policy Research Foundation, Inc.
Presentation on behalf of the
Japan Oil, Gas, and Metals Corporation
Tokyo
February 2, 2010
Energy Policy Research Foundation, Inc. | 1031 31st St, NW Washington, DC 20007 | 202.944.3339 | www.eprinc.org 1

January 28, 2010Davos, Switzerland
Unconventional gas will transform the entire energy production landscape in the United States.........and alters the U.S. energy outlook for probably a hundred years*
Tony HaywardChief Executive OfficerBP plc
*In 2009 the United States became the world’s largest producer of natural gas
2Energy Policy Research Foundation, Inc. | 1031 31st St, NW Washington, DC 20007 | 202.944.3339 | www.eprinc.org

Overview
Natural gas markets around the world are undergoing rapid and fundamental shifts in supply, demand, and pricingEuropean importers are reducing imports from Gazprom and in many cases dropping to (or maybe below) take-or-pay contract minimums.
Turning to lower cost LNG spot cargos when available At the same time, supply of liquefied natural gas (LNG) has increased globally… …and the outlook for natural gas production in the U.S. has changed radically with a breakthrough in the production of gas from shale rock formationsSurge in U.S. shale gas production is gaining interest worldwideWorld markets are saturated with natural gas, pressuring prices
3Energy Policy Research Foundation, Inc. | 1031 31st St, NW Washington, DC 20007 | 202.944.3339 | www.eprinc.org

Natural Gas Consumption Through 2030
0
20
40
60
80
100
120
140
160
18019
8019
8219
8419
8619
8819
9019
9219
9419
9619
9820
0020
0220
0420
0620
0820
1020
1220
1420
1620
1820
2020
2220
2420
2620
2820
30
tcf p
er y
ear
OECD
Non-OECD
Total
Source: EIA International Energy Outlook 2009
4Energy Policy Research Foundation, Inc. | 1031 31st St, NW Washington, DC 20007 | 202.944.3339 | www.eprinc.org

1
1.2
1.4
1.6
1.8
2
2.2
1973
1974
1975
1976
1977
1978
1979
1980
1981
1982
1983
1984
1985
1986
1987
1988
1989
1990
1991
1992
1993
1994
1995
1996
1997
1998
1999
2000
2001
2002
2003
2004
2005
2006
2007
2008
2009
trill
ion
cubi
c fe
et
Source: EIA Data
U.S. Monthly Marketed Natural Gas Production1973 - 2009
5Energy Policy Research Foundation, Inc. | 1031 31st St, NW Washington, DC 20007 | 202.944.3339 | www.eprinc.org

U.S. Proven Gas Reserves Since 1980
0
50
100
150
200
250
30019
80
1982
1984
1986
1988
1990
1992
1994
1996
1998
2000
2002
2004
2006
2008
tcf
~50% increase in 8 years – nearly all
from shale gas
6Energy Policy Research Foundation, Inc. | 1031 31st St, NW Washington, DC 20007 | 202.944.3339 | www.eprinc.org
EIA 2010 Natural Gas Production Forecast
7Energy Policy Research Foundation, Inc. | 1031 31st St, NW Washington, DC 20007 | 202.944.3339 | www.eprinc.org
Shale Gas Revolution in North America
Rise in North American gas production in recent years is due to the growing role of the unconventional natural gas, mainly shale gas.
Due to improvements in drilling technology and well-completion methods, U.S. and Canadian gas shale plays currently account for about 10% of the natural gas supply of both countries
8Energy Policy Research Foundation, Inc. | 1031 31st St, NW Washington, DC 20007 | 202.944.3339 | www.eprinc.org

U.S. Shale Basins
Source: DOE
9Energy Policy Research Foundation, Inc. | 1031 31st St, NW Washington, DC 20007 | 202.944.3339 | www.eprinc.org

Shale Production Technology
Horizontal drilling enables producers to hit the “sweet spot” of a shale formation
Horizontal drilling is often combined with hydraulic fracturing, where rock formations are broken apart and pumped with slick water and sand at a high pressure to break the sediment and release the gas
Wells initially produce gas at a very high rate, then flow quickly tapers off and stabilizes
Wells in the recent past that took 60 days to develop can now be completed in 28 days
10Energy Policy Research Foundation, Inc. | 1031 31st St, NW Washington, DC 20007 | 202.944.3339 | www.eprinc.org

Casing Zones and Cement Programs
Source: DOE Shale Primer
11Energy Policy Research Foundation, Inc. | 1031 31st St, NW Washington, DC 20007 | 202.944.3339 | www.eprinc.org
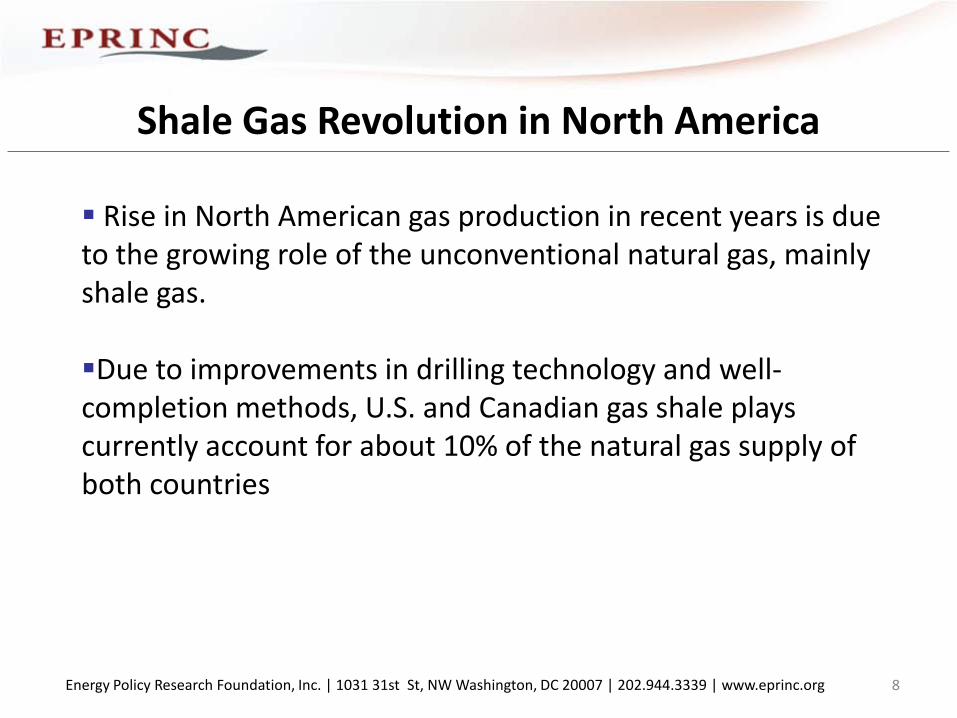
Hydraulic Fracturing of Marcellus Shale
Source: DOE Shale Primer, Chesapeake
12Energy Policy Research Foundation, Inc. | 1031 31st St, NW Washington, DC 20007 | 202.944.3339 | www.eprinc.org

U.S. Shale Supply Cost Curve
0
5
10
15
20
25
30
35
40
45
0
1
2
3
4
5
6
7
8
45 50 55 60 65 70
$/bo
e
$/m
cf
bcf/d
Base Production
Marcellus
Barnett Core
Haynesville
Barnett Non-Core
Fayetteville Woodford
Source: Wood Makenzie, EPRINC calculations
13Energy Policy Research Foundation, Inc. | 1031 31st St, NW Washington, DC 20007 | 202.944.3339 | www.eprinc.org

Coal, Oil, and Gas Prices in the U.S.
14Energy Policy Research Foundation, Inc. | 1031 31st St, NW Washington, DC 20007 | 202.944.3339 | www.eprinc.org

Challenges Remain (but they can be overcome)
Barriers to developing shale gas and bringing it to the market outside of North America remain significant, including:
• difficult geologic formations• shortage of adequate infrastructure• variations in size and maturity of basins• physical access• exploitation costs • environmental concerns• regulatory and institutional constraints
15Energy Policy Research Foundation, Inc. | 1031 31st St, NW Washington, DC 20007 | 202.944.3339 | www.eprinc.org

The Evolving Industry
Global economic downturn has slowed down the capital-intensive development of unconventional resources
Production has held up even as gas prices dipped below $3/MMBtu. It is unclear whether production would be sustained under such conditions in the long term.
Uncertainties remain about projecting shale gas production in the U.S. –decline rates have been difficult to predict
Environmental concerns regarding chemicals sometimes used in the fracturing process.
More experience and time is needed to establish the decline rates and production lifespan of shale gas wells
16Energy Policy Research Foundation, Inc. | 1031 31st St, NW Washington, DC 20007 | 202.944.3339 | www.eprinc.org

Environmental Concerns
There are two major environmental concerns facing shale gas production.
Both relate to the hydraulic fracturing process and worries over the possible contamination of underground drinking water.
17Energy Policy Research Foundation, Inc. | 1031 31st St, NW Washington, DC 20007 | 202.944.3339 | www.eprinc.org
Hydraulic Fracturing and Well Casing
Hydraulic fracturing usually occurs below water aquifers – fracturing fluid is pumped down the well at high pressure to create pores in the shale rock.
Therefore wells must be drilled through the water aquifer.
Environmentalists worry that the well casing could leak fracturing chemicals and contaminate the aquifer.
There is little evidence to support this concern
18Energy Policy Research Foundation, Inc. | 1031 31st St, NW Washington, DC 20007 | 202.944.3339 | www.eprinc.org

Fracturing Water Treatment and Disposal
The hydraulic fracturing process uses millions of gallons of water and often produces additional water.
This water may contain various chemicals, from both the fracturing process and produced water, that is not potable and must be treated.Currently this is done by storing water in pits. Environmentalists worry that this water could leak through the ground and contaminate aquifers.
There are several options for dealing with this concern, including:
Onsite treatmentOnsite tank storageRemoval by tanker trucks
19Energy Policy Research Foundation, Inc. | 1031 31st St, NW Washington, DC 20007 | 202.944.3339 | www.eprinc.org

Possible Fracturing Legislation
A recent Congressional hearing on the ExxonMobil-XTO merger made it clear that the Federal Government does not intend to ban hydraulic fracturing
Federal regulation is possible and could involve disclosure of chemicals, although regulation may continue to be left up to the states.
New York State has opposed hydraulic fracturing in the New York City watershed
Chesapeake has agreed to put off drilling the watershedMeanwhile, Pennsylvania has strongly supported shale gas development.
It has brought thousands of jobs and billions in revenue to the stateNY is struggling financially and may eventually support development, albeit with further regulation
20Energy Policy Research Foundation, Inc. | 1031 31st St, NW Washington, DC 20007 | 202.944.3339 | www.eprinc.org
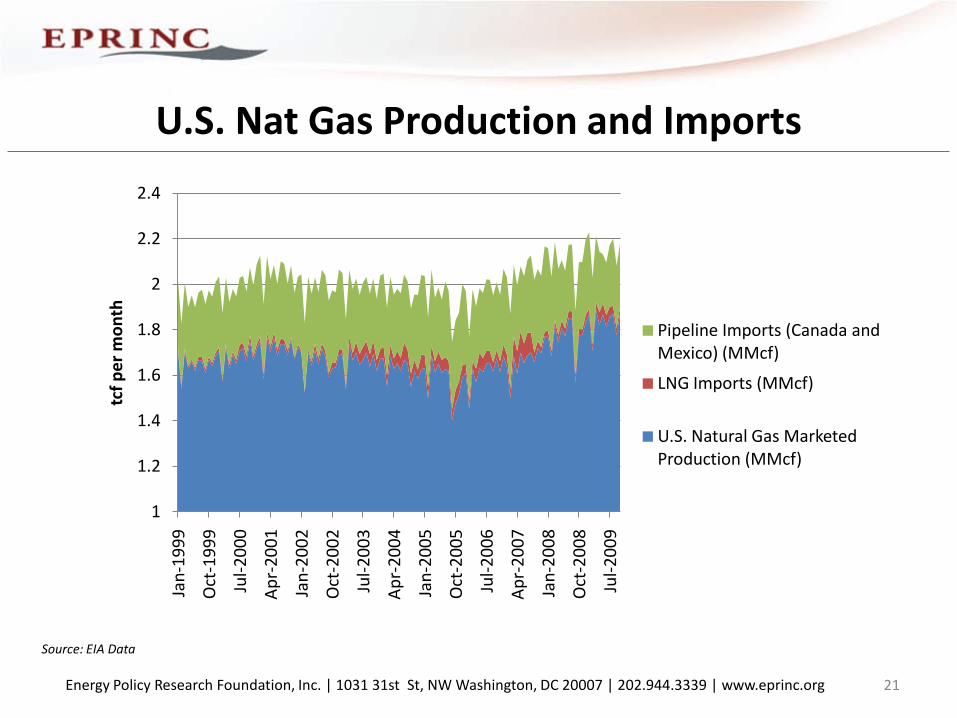
U.S. Nat Gas Production and Imports
1
1.2
1.4
1.6
1.8
2
2.2
2.4Ja
n-19
99
Oct
-199
9
Jul-2
000
Apr-
2001
Jan-
2002
Oct
-200
2
Jul-2
003
Apr-
2004
Jan-
2005
Oct
-200
5
Jul-2
006
Apr-
2007
Jan-
2008
Oct
-200
8
Jul-2
009
tcf p
er m
onth
Pipeline Imports (Canada and Mexico) (MMcf)
LNG Imports (MMcf)
U.S. Natural Gas Marketed Production (MMcf)
Source: EIA Data
21Energy Policy Research Foundation, Inc. | 1031 31st St, NW Washington, DC 20007 | 202.944.3339 | www.eprinc.org

Foreign Interest in Shale Gas
22Energy Policy Research Foundation, Inc. | 1031 31st St, NW Washington, DC 20007 | 202.944.3339 | www.eprinc.org

U.S. Shale Industry Draws Foreign Investment
BP acquired part of Oklahoma’s Woodford shale gas play from Chesapeake Energy in 2008 for $3.65 billion
EnCana and Royal Dutch Shell began developing the Haynesville Shale in Louisiana and Texas
StatoilHydro and Chesapeake Energy jointly develop Marcellus shale basin and 14 different shale plays in other countries
ExxonMobil began exporting its expertise and know-how from its North American shale gas operations to European gas markets
Total’s invested $2.3 billion in Chesapeake's acreage in Barnett and other plays
23Energy Policy Research Foundation, Inc. | 1031 31st St, NW Washington, DC 20007 | 202.944.3339 | www.eprinc.org

Potential for Shale Outside North America
China and much of Europe possess shale formations similar to those found in the U.S.
However, the potential for large-scale gas production remains unknown – significant production is about a decade away
Exploration in Europe is being carried out largely by joint ventures with companies that have experience in North American ShaleExploration in China is at an earlier stage than European explorationSuccessful shale development could have huge implications for historical exporters (Gazprom)
24Energy Policy Research Foundation, Inc. | 1031 31st St, NW Washington, DC 20007 | 202.944.3339 | www.eprinc.org

European Shale Exploration Sites
From the Economist
25Energy Policy Research Foundation, Inc. | 1031 31st St, NW Washington, DC 20007 | 202.944.3339 | www.eprinc.org
Exploration in Europe and China – Utilizing American Experience
A major reason for European and IOC investment in U.S. shale is experience…ExxonMobil is active in Germany and Hungary
Exxon has struggled with early exploration in Hungary – this may have influenced their acquisition of XTO
ConocoPhillips and 3 Legs Resources exploring in PolandPolish shale similar to Barnett in Texas
Shell carrying out exploration in SwedenTotal and UK Devon active in FranceChina has recently agreed to deals with Shell and BP to explore in China
26Energy Policy Research Foundation, Inc. | 1031 31st St, NW Washington, DC 20007 | 202.944.3339 | www.eprinc.org

Constraints to European Development
Very early in E&P processEuropean companies do not have the same amount of experience as their U.S. counterparts and Europe lacks the type of small, independent companies that initiated U.S. shale developmentAlso lack logistical infrastructure to bring new production to market
Geology is similar, but not identical to North AmericaHigher population density means makes access more difficult
This may cause additional transportation problems
27Energy Policy Research Foundation, Inc. | 1031 31st St, NW Washington, DC 20007 | 202.944.3339 | www.eprinc.org

Unconventional Reserves Around the World
28Source: Statoil
Energy Policy Research Foundation, Inc. | 1031 31st St, NW Washington, DC 20007 | 202.944.3339 | www.eprinc.org

LNG
&
Natural Gas Pricing
29Energy Policy Research Foundation, Inc. | 1031 31st St, NW Washington, DC 20007 | 202.944.3339 | www.eprinc.org

World LNG and Unconventional Gas Production
30Energy Policy Research Foundation, Inc. | 1031 31st St, NW Washington, DC 20007 | 202.944.3339 | www.eprinc.org

Russian Export and U.S. Henry Hub Gas Prices vs. Oil
0
5
10
15
20
25
Jan-
2000
Jul-2
000
Jan-
2001
Jul-2
001
Jan-
2002
Jul-2
002
Jan-
2003
Jul-2
003
Jan-
2004
Jul-2
004
Jan-
2005
Jul-2
005
Jan-
2006
Jul-2
006
Jan-
2007
Jul-2
007
Jan-
2008
Jul-2
008
Jan-
2009
Jul-2
009
Jan-
2010
$ pe
r mill
ion
BTU
Russian Natural Gas Border Price in Germany ($ per million BTU)
NYMEX-Henry Hub Natural Gas Front Month Futures Contract ($ per million BTU)
Brent Crude - Pushed Forward 6 Months ($ per million btu)
Russian Natural Gas Price Estimate
Henry Hub - EIA Estimate - 2010 Average
Russian export prices track crude prices from 6 months prior, therefore prices in
H1 2010 will reflect crude’s late 2009 rebound and Russian gas will likely cost
twice as much as Henry Hub in 2010.Source: EIA Data, IMF Data, EPRINC Calculations
31Energy Policy Research Foundation, Inc. | 1031 31st St, NW Washington, DC 20007 | 202.944.3339 | www.eprinc.org

Natural Gas and Crude Oil Prices Through 2030
0
5
10
15
20
25
2007
$ p
er m
illio
n BT
U
Henry Hub Spot Price
Imported Low-Sulfur Light Crude Oil ($ per million BTU)
Source: EIA Annual Energy Outlook 2009
32Energy Policy Research Foundation, Inc. | 1031 31st St, NW Washington, DC 20007 | 202.944.3339 | www.eprinc.org
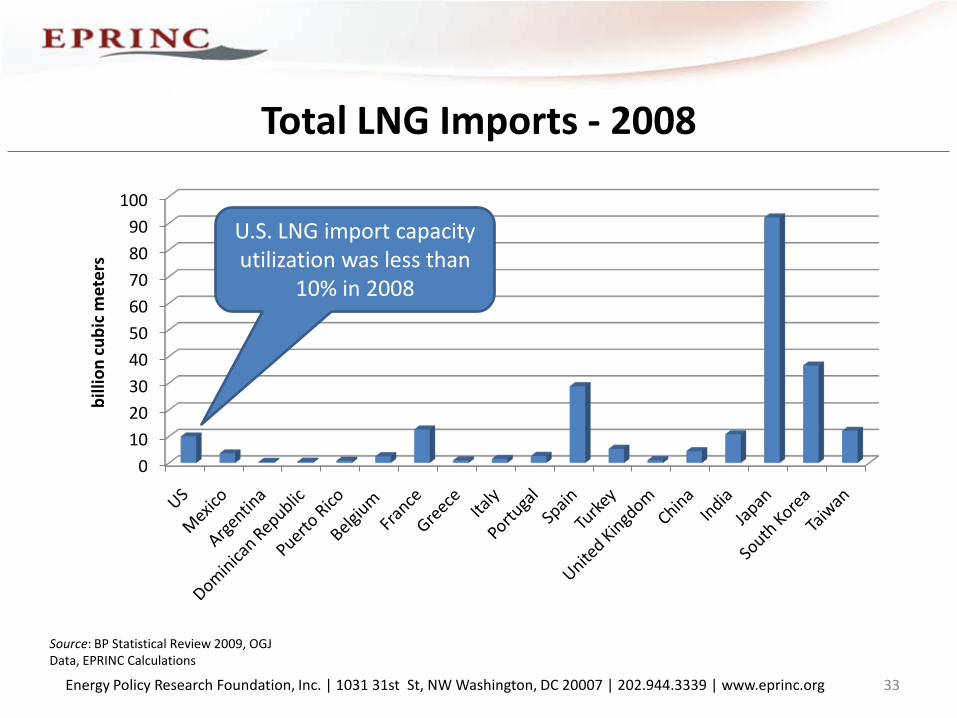
Total LNG Imports - 2008
Source: BP Statistical Review 2009, OGJ Data, EPRINC Calculations
0102030405060708090
100
billi
on cu
bic
met
ers
U.S. LNG import capacity utilization was less than
10% in 2008
33Energy Policy Research Foundation, Inc. | 1031 31st St, NW Washington, DC 20007 | 202.944.3339 | www.eprinc.org
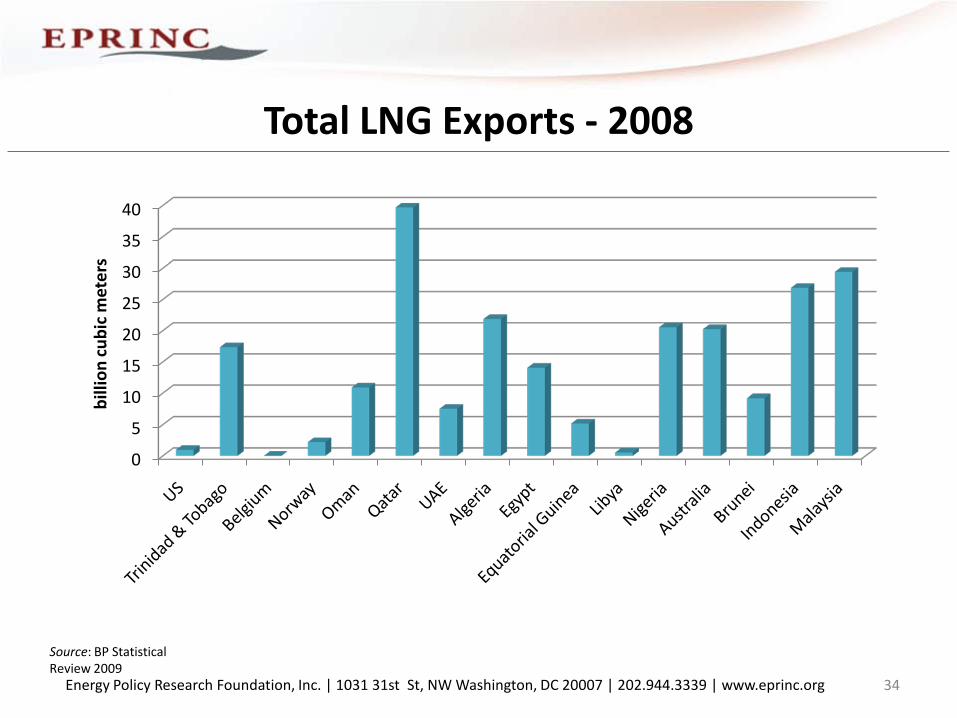
Total LNG Exports - 2008
Source: BP Statistical Review 2009
0
5
10
15
20
25
30
35
40
billi
on cu
bic
met
ers
34Energy Policy Research Foundation, Inc. | 1031 31st St, NW Washington, DC 20007 | 202.944.3339 | www.eprinc.org

Spot LNG Trade by Country
Source: CIIGNL (2009)
35Energy Policy Research Foundation, Inc. | 1031 31st St, NW Washington, DC 20007 | 202.944.3339 | www.eprinc.org

LNG Liquefaction Capacities Through 2015
Source: IEA Data
36
0
100
200
300
400
500
600
bcm
/yea
r
2013
2012
2011
2010
2009
Capacity under construction **
Capacity end - 2005*
Projected total capacity ***
Energy Policy Research Foundation, Inc. | 1031 31st St, NW Washington, DC 20007 | 202.944.3339 | www.eprinc.org

LNG Trade and Implications
LNG shipments that were redirected from North American markets to Europe have helped to keep spot prices lower than prices indexed to crude oil
Some European gas customers are seeking renegotiation of long-term contracts, potentially changing the current oil-linked natural gas price index
Successful North American development of unconventional gas resources has already and is anticipated to reduce U.S. and Canadian LNG imports.
37Energy Policy Research Foundation, Inc. | 1031 31st St, NW Washington, DC 20007 | 202.944.3339 | www.eprinc.org

Range of U.S. Gas Price Projections
38Source: Statoil
Energy Policy Research Foundation, Inc. | 1031 31st St, NW Washington, DC 20007 | 202.944.3339 | www.eprinc.org

Asian LNG Imports – 2008 and 2009
39Energy Policy Research Foundation, Inc. | 1031 31st St, NW Washington, DC 20007 | 202.944.3339 | www.eprinc.org

Global Gas Prices – 2009
40Energy Policy Research Foundation, Inc. | 1031 31st St, NW Washington, DC 20007 | 202.944.3339 | www.eprinc.org

Fuel Oil vs. Spot LNG -- 2009
41Energy Policy Research Foundation, Inc. | 1031 31st St, NW Washington, DC 20007 | 202.944.3339 | www.eprinc.org

Will GTL Make a Comeback?
42Energy Policy Research Foundation, Inc. | 1031 31st St, NW Washington, DC 20007 | 202.944.3339 | www.eprinc.org

Gas-to-Liquids Technology
•Turning natural gas in liquid petroleum products•GTL technologies are often derived from the Fischer-Tropschprocess (although several methods exist)•Combines natural gas molecules to form liquids: largely middle distillates and along with napthas/gasoline and lubricants
•Overall, the process results in a very clean and very high value barrel of liquids•No “bottom of the barrel products”
•The technology still faces many technological and capital cost hurdles
•Energy waste presents significant questions regarding the process’s long-term economic viability
•Some current technologies yield only 60% of the energy content 43Energy Policy Research Foundation, Inc. | 1031 31st St, NW Washington, DC 20007 | 202.944.3339 | www.eprinc.org

Why GTLs?
• Monetize stranded gas and associated gas•Transform Natural Gas into a more valuable product•Liquids can be transported more easily than gas, therefore reaching additional markets•Some countries (Japan) wish to switch liquid fuels dependency from crude oil to natural gas •GTL fuels burn more cleanly than crude derived fuels•Shift in Gas Market Pricing Makes GTL and DME Research a Priority?
44Energy Policy Research Foundation, Inc. | 1031 31st St, NW Washington, DC 20007 | 202.944.3339 | www.eprinc.org

Niigata Demo Plant
•JV between Nippon Oil, JOGMEC, JAPEX, INPEX, and Chiyoda
•500 b/d•Completion: April 2009•Cost: 36 billion yen (~ $400 million)•Designed not for commercial production but to research Japanese technology and to determine whether such technology can be scaled economically
•Successor to Yufutsu Pilot Plant•Can handle gas with high CO2 content
45Energy Policy Research Foundation, Inc. | 1031 31st St, NW Washington, DC 20007 | 202.944.3339 | www.eprinc.org
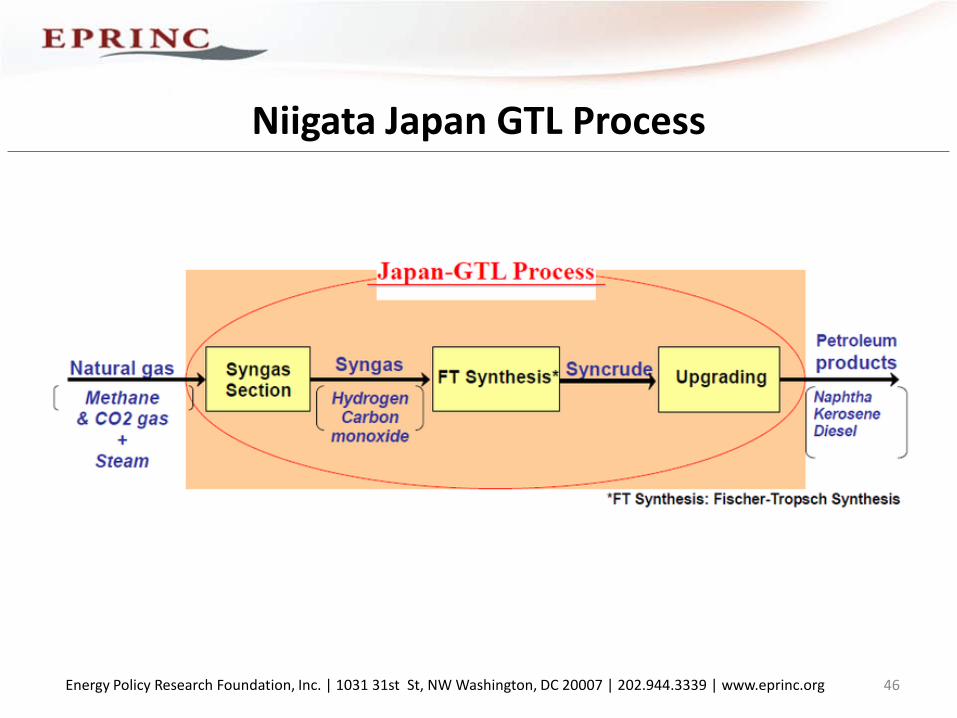
Niigata Japan GTL Process
46Energy Policy Research Foundation, Inc. | 1031 31st St, NW Washington, DC 20007 | 202.944.3339 | www.eprinc.org

Niigata Japan GTL Plant
47Energy Policy Research Foundation, Inc. | 1031 31st St, NW Washington, DC 20007 | 202.944.3339 | www.eprinc.org

Crude vs. GTL Finished Products
Refined Brent (vol%) GTL-FT (vol%)
LPG 3
Naptha + Gasoline 37 15-25
Distillates 40 50-80
Fuel Oils 40
Lubes + Wax 0-30
Source: BP, E-MetaVentures, Inc. from IAEE Annual Int’l Conference, 2003
48Energy Policy Research Foundation, Inc. | 1031 31st St, NW Washington, DC 20007 | 202.944.3339 | www.eprinc.org

A Brief History of GTLs
• SASOL developed GTL technology in the 1950’s using the FT process.
•Interest grew from the 1980’s to early 2000’s•SASOL is still a leader in GTL technology•Several IOCs currently constructing large plants
•Most commercial GTL plants operate in South Africa, Qatar, and Malaysia•Demo plants scattered throughout the world, from the U.S. to Japan
49Energy Policy Research Foundation, Inc. | 1031 31st St, NW Washington, DC 20007 | 202.944.3339 | www.eprinc.org

GTL Plants Under Construction
• Two common themes:•Over-budget•Behind Schedule
•Projections for capital cost improvements made in the early 2000’s have not materialized
•Construction has been delayed across the board and projects are coming in significantly over budget
•Unforeseen technical challenges have played a large role•Many planned projects have been cancelled
•Per barrel costs for projects under construction are several times greater than those of a new crude oil refinery
50Energy Policy Research Foundation, Inc. | 1031 31st St, NW Washington, DC 20007 | 202.944.3339 | www.eprinc.org

Shell Pearl
• Shell and Qatar Gas constructing plant in Ras Laffan, Qatar with capacity of:
•140,000 b/d of liquids•120,000 boe of LPGs, condensates, and ethane
•Expected Completion: late 2010-2011•Initial Projected Cost: $6 billion•Final Expected Cost: $18-$19 billion
•Cost per barrel of liquids: $129,000 – $136,000
51Energy Policy Research Foundation, Inc. | 1031 31st St, NW Washington, DC 20007 | 202.944.3339 | www.eprinc.org

A Modern, Commercial Plant: ORYX
• SASOL and QATAR Petroleum•Capacity has grown to over 32,000 b/d
•Plant was completed in 2006 but production did not begin in earnest until 2009
•Faced catalyst problems•Cost: $1 billion
•Cost per barrel: $31,250•Cost is deceivingly low because plant was delayed for several years
52Energy Policy Research Foundation, Inc. | 1031 31st St, NW Washington, DC 20007 | 202.944.3339 | www.eprinc.org

Chevron Escravos
•Facing issues similar to that of Shell’s Pearl – over budget •Chevron and SASOL project in Nigeria.
•34,000 b/d of liquids•Uses SASOL Slurry Phase Technology
•Expected Completion: 2012•Initial Projected Cost: $1.7 billion•Final Expected Cost: $6.9 billion
•Cost per barrel of liquids: $202,000
53Energy Policy Research Foundation, Inc. | 1031 31st St, NW Washington, DC 20007 | 202.944.3339 | www.eprinc.org

World GTL/Petrotrin – Small Scale GTL
•Trinidad and Tobago•2,250 b/d
•Expected Completion: 2010?•Initial Projected Cost: $150 million•Final Expected Cost: $445 million
•Cost per barrel of liquids: $197,000
54Energy Policy Research Foundation, Inc. | 1031 31st St, NW Washington, DC 20007 | 202.944.3339 | www.eprinc.org

Capital Cost Barrier
• Saudi Arabia is building three new crude oil refineries, for domestic consumption and exports
•Each is 400,000 b/d•All should be completed by 2013•Cost is around $10 - $12 billion, or $25,000 - $30,000 per barrel of capacity
•Meanwhile, GTL plants under construction cost $100,000 -$200,000 per barrel of capacity
•To be successful, capital costs must come down and gas must remain discounted to crude oil (and the technology must be refined)
55Energy Policy Research Foundation, Inc. | 1031 31st St, NW Washington, DC 20007 | 202.944.3339 | www.eprinc.org

GTL & DME Gross Margins
-100
-50
0
50
100
150
200
Jan-
2000
Aug-
2000
Mar
-200
1
Oct
-200
1
May
-200
2
Dec-
2002
Jul-2
003
Feb-
2004
Sep-
2004
Apr-
2005
Nov
-200
5
Jun-
2006
Jan-
2007
Aug-
2007
Mar
-200
8
Oct
-200
8
May
-200
9
$/bb
l
Gross GTL Margins – 1 barrel of low sulfur diesel minus natural gas feedstock costs
GTL Gross Margin - $ per Barrel of Low-Sulfur Diesel
Henry Hub NYMEX Front Month Natural Gas Price - $ per Barrel of Oil Equivilent (5.8 MMBtu)
New York Harbor No 2 Diesel Low Sulfur Spot Price - $ per Barrel
56Energy Policy Research Foundation, Inc. | 1031 31st St, NW Washington, DC 20007 | 202.944.3339 | www.eprinc.org

Are GTL Capital Costs on the Decline?
Source: E-MetaVentures, Inc. from IAEE Annual Int’l Conference, 2003
Shell’s recent difficulties with its Pearl plant would
suggest that costs have drastically risen – this cost is equivalent to current crude
refinery projects
57Energy Policy Research Foundation, Inc. | 1031 31st St, NW Washington, DC 20007 | 202.944.3339 | www.eprinc.org

Capital Costs and the Gas Crude Spread*
0
200000
400000
600000
800000
1000000
1200000
0
50
100
150
200
250
300
40 60 80 100 120 140 160 180 200
$ pe
r bar
rel o
f ins
talle
d ca
paci
ty
$ pe
r bar
rel
Price of Oil - $ per barrel
Gross Margin - 80% discount to oil
Gross Margin ($ per barrel of Distillate, assumed to be the price of crude oil plus 10%) - left axis
Feedstock costs and operating costs ($5/bbl) per barrel of product output (Includes 40% energy penalty) - left axis
Break even capital cost per barrel of installed capacity at a given oil price (required to break even over 20 years | refined product value minus feedstock and operating costs of $5/bbl) - right axis
Break even capital cost per barrel of installed capacity - 80% discount to oil
Current capital costs ($200,000/bbl) atChevron's Escravos plant requirie $90 oil to break even.
To be competitive at current prices, capital costs would have to be reduced to $125,000/bbl
*EPRINC preliminary estimates 58Energy Policy Research Foundation, Inc. | 1031 31st St, NW Washington, DC 20007 | 202.944.3339 | www.eprinc.org

Projected GTL Capacity - NPC
Source: NPC
59Energy Policy Research Foundation, Inc. | 1031 31st St, NW Washington, DC 20007 | 202.944.3339 | www.eprinc.org
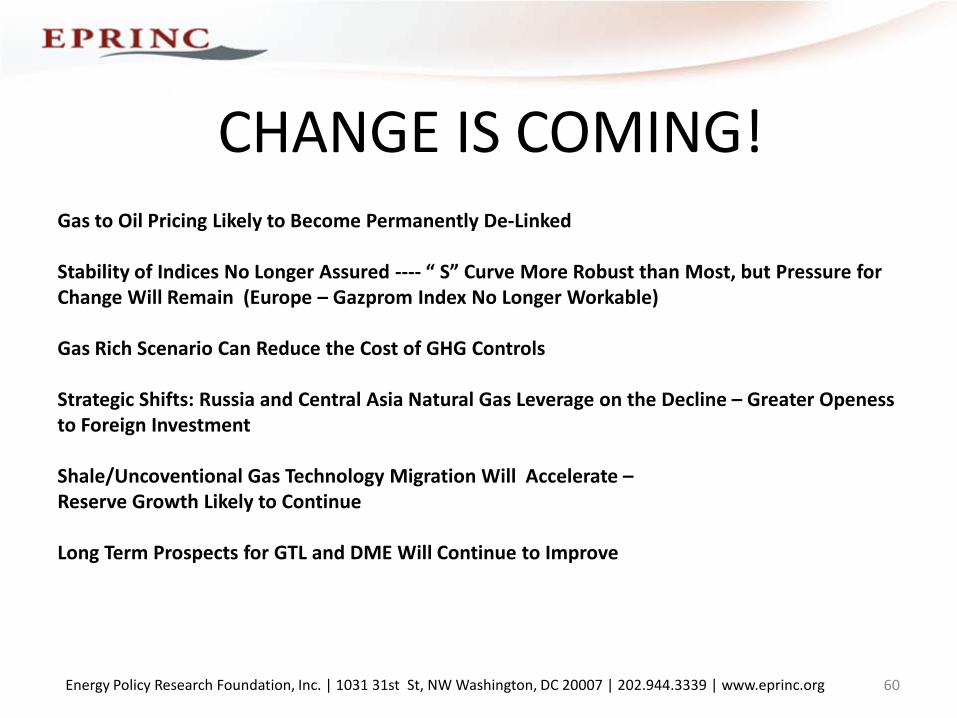
Gas to Oil Pricing Likely to Become Permanently De-Linked
Stability of Indices No Longer Assured ---- “ S” Curve More Robust than Most, but Pressure forChange Will Remain (Europe – Gazprom Index No Longer Workable)
Gas Rich Scenario Can Reduce the Cost of GHG Controls
Strategic Shifts: Russia and Central Asia Natural Gas Leverage on the Decline – Greater Openessto Foreign Investment
Shale/Uncoventional Gas Technology Migration Will Accelerate –Reserve Growth Likely to Continue
Long Term Prospects for GTL and DME Will Continue to Improve
CHANGE IS COMING!
60Energy Policy Research Foundation, Inc. | 1031 31st St, NW Washington, DC 20007 | 202.944.3339 | www.eprinc.org