Managing Customer Satisfaction Week 3 Customer Expectations & Satisfaction.

Alternation 22,1 (2015) 139 - 162 ISSN 1023-1757 139
The Service Quality - Customer Satisfaction
Nexus: A Study of Employees and Students
Perceptions in Kenyan Private Universities
Eric E. Mang’unyi
Krishna K. Govender
Abstract The Higher Education Performance (HEdPERF) instrument was adapted to
measure service quality (SQ) in private Kenyan higher education institutions
(HEIs). Exploratory factor analysis was used to determine the scale’s
validity, and path analysis examined the model linking the SQ and customer
satisfaction (CS) constructs. It was ascertained that with respect to Kenyan
private higher education, SQ is an antecedent of customer satisfaction (CS)
in that it directly influences CS. Given that employees and students of
selected private universities were surveyed, the results provide an
opportunity for HE managers to develop strategic SQ delivery deliverables
for their universities. HEdPERF was also found to be a valid measurement
tool that could be used for measuring service delivery in the private higher
education sector in Kenya.
Keywords: Private Higher Education, Service Quality, Customer
Satisfaction, Higher Education Performance.
Introduction With the increasing number of students qualifying for higher education, and
the mushrooming of universities (especially privates) in Kenya, the question
of service quality management in the institutions of higher learning (IHL)
becomes very fundamental (Ngome 2010). Hogg and Hogg (1995) argue that
university customers have different experiences as service consumers, in that
they want quality, and their expectations for better service performance is
increasing, thus the need for increased customer satisfaction (Dohert 1994).
For many years, higher education provision has been considered a service
calling requiring its providers to adopt a customer-focused approach
(Angell, Heffernan & Megicks 2008).

Eric E. Mang’unyi and Krishna K. Govender
140
Furthermore, Vaill (2008) asserts that education is a service and not a
product therefore providers have to be mindful and responsive to the
characteristics, needs and expectations of its customers, specifically the
student by adopting a student-customer approach.
Some stakeholders in higher education (Quinn, Lema, Larsen & Johnson
2009) have argued that the measurement of service quality and customer
satisfaction in educational institutions is a challenging task. This is because
over the years, issues concerning the quality of service have taken on new
dimensions and received varied treatment. The increasing pressure towards
service quality and the desire to achieve business excellence and high
performance to become a world-class organization drives the adoption of
service improvement initiatives (Kimani 2011). This mindset has urged
organizations to continuously improve their services and adopt new ways to
deliver the same services, which has become a common practice especially
in fast-developing countries such as Kenya.
Oswald (2009:1) cites Bounds, Lyle, Mel and Gipsie (1994), who assert
that over three decades, organizations throughout the developed world have
been aggressively pursuing quality management.
This has been attributed to a commonly held view that high quality
products and services result in improved organizational performance.
Educational establishments have adopted various ways of addressing
quality issues, for example total quality management (TQM) in order to meet
stakeholders’ expectations and needs efficiently, without compromising the
underlying moral principles (Ngome 2011). The need for continuous quality
improvement especially in universities means that Kenya is not an exception
in pursuing service quality in HE. TQM also implies that quality should not
only be perceived from a student-customer perspective, since staff is also
recipients of services as the ‘internal’ customers of the HEIs.
In light of the above, this paper examines the relationship between
certain service quality attributes/dimensions and the overall services quality
(SQ), as well as the relationship between SQ and satisfaction (CS) from both
the HE students’ and employees’ perspectives.
Service Quality and Customer Satisfaction The debate on the association between service quality and customer
satisfaction is on-going, and these two constructs have sometimes been used

The Service Quality - Customer Satisfaction Nexus
141
interchangeably, albeit incorrectly. Perez, Juan, Gemaand, and Raquel
(2007) argued that the growth in the importance of service quality has been
greatly influenced by the customers’ changing needs, preferences and tastes,
and more so, the changing nature of global markets. As a significant factor,
service quality has enabled firms to achieve a differential advantage over
competitors (Perez et al. 2007) and service quality is viewed as a critical
construct of competitiveness (Shahinand & Samea 2010). Seth, Deshmukh
and Vrat (2005) posit that SQ is a function of the differences between
expectation and performance along the quality dimensions. According to
Hung et al. (2003), although providing service quality excellence and
superior customer satisfaction is vital, it still remains a challenge facing the
service industry. Regardless of the sector (public or private), SQ remains an
important subject for consideration among leaders, managers and researchers
(Zahari, Yusoff & Ismail 2008).
Some researchers (Seilier 2004; Zahari et al. 2008) define service
quality as the extent to which a service meets or exceeds customer needs and
expectations, and others (Khodayari & Khodayari 2011) argue that
perceived service quality reflects the difference between consumer
expectations and perceptions.
Through an investigation of the five dimensions of SERVQUAL
(Parasuraman, Ziethaml & Berry 1988), Ham and Hayduk (2003) found that
a positive relationship existed between satisfaction and each of the
SERVQUAL dimensions, with the Reliability dimension having the
strongest relationship, followed by Responsiveness, Empathy, Assurance
and Tangibility. By assessing the importance of CS, SQ and service
performance of a library in Taiwan, Wang and Shieh (2006) found that the
overall, service quality has a significantly positive effect on satisfaction.
Some researchers such as Hasan and Ilias (2008) explained that Empathy
and Assurance are critical factors that contribute most to students’
satisfaction. However, Hishamuddin and Azleen (2008) argued that all the
service quality attributes were significantly related with satisfaction and
highly correlated with one another as well. Leading sources of information
on students’ expectations of universities include past experiences,
advertising, and word of mouth (Prugsamatz, Pentecost & Ofstad 2006). The
aforementioned researchers suggested that by explicitly and implicitly
making service promises, the desired and predicted expectations of the uni-

Eric E. Mang’unyi and Krishna K. Govender
142
versity’s service quality become higher.
From the above, it may be deduced that customer satisfaction is directly
or indirectly a central issue for universities and the university management.
Therefore, satisfaction with the quality of service provided by the university
becomes vital, and this requires the university to focus on both internal and
external customers.
Several researchers have alluded to the importance of service quality and
customer satisfaction (Cronin & Brady 2001; Perez et al. 2007; Maddern,
Roger & Andi 2007; Kara, Lonial, Tarim & Zaim 2005), and organizational
competitiveness (Rust, Danaher & Sajeev 2000). Being a major area of
attention for practitioners, managers and researchers, SQ has had a strong
impact on business performance, costs, customer satisfaction, allegiance,
return on investment, and profitability (Seth & Deshmukh 2005; Chang,
Wang & Yang 2009; Yee, Yeung & Cheng, 2010; Siddiqi 2011).
The rapid development of and competition for service in both
developing and developed realms has made it important for organizations to
measure and evaluate the quality of service encounters (Brown & Bitner
2007). Furthermore, several aspects of service quality have cumulative
outcomes on its perception, thus they complement each other and therefore
cannot be treated in isolation. Therefore, by focusing on SQ, organizations
may risk their competitiveness, since satisfaction and competitiveness are
inter-related (Hishamuddin & Azleen, 2008).
Hishamuddin and Azleen (2008) affirm that service quality is a widely
accepted antecedent of satisfaction, and their view has been supported by
several other researchers, inter-alia, Jamal and Naser (2002), Hensley and
Sulek (2007), and Herington and Weaven (2007).
Several researchers have differing opinions on the issue of service quality
and its determining factors (Siddiqi 2011; Yee et al. 2010; Hasan & Ilias
2008; Hishamuddin & Azleen 2008), and have alluded to a relationship
between service quality, customer satisfaction and to an extent institutional
excellence.
Employees as Customers While HE possesses the traditional characteristics of a service offering, the
unique characteristics are notable which differentiate it from any other retail
service. One such characteristic is the conflicting views on the customer,

The Service Quality - Customer Satisfaction Nexus
143
since various stakeholders inter alia employees, students, parents, sponsors,
and the government utilize the services of HE (Quinn et al. 2009). Although
students are possibly the first and most obvious customers because they pay
for the education service (sometimes), or if the cost of education is met by
their parents or guardians, these individuals act as a point of contact for
some service interactions with the HEI.
Similarly, employees (academic and administrative), exercise control in
the design of some of the services, and therefore also make use of a number
of the HEI’s services (Quinn et al. 2009:141). Whereas residence halls
exclusively serve student-customers’ accommodation needs, administrative
areas in a university have explicit internal and external customers.
For example, a research function or office serves internal staff and
graduate students as well as government agencies and research sponsors
(Quinn et al. 2009). The involvement of different stakeholders within the HE
environment makes the measurement of HE services complicated compared
to retail services, including how each stakeholder perceives the indicators of
service which may also be conflicting (Becket & Brookes 2006; Quinn et al.
2009).
In light of the above, it is important to examine employees’ (internal
customers of HE) and students’ (external customers), perceptions of service
quality and service satisfaction. The perceived experiences of the employees
are important since, it may provide more objective and practical information
for assessing service quality and customer satisfaction in the HE context.
Thus, this paper reports exploratory research conducted among a sample of
employees (administrative and academics), and students (undergraduates and
postgraduates) at select Kenyan private universities, to determine their
perceptions of the quality of services delivered, and whether this perception
determines their satisfaction with the service.
The HEdPERF Model The management of quality issues has been the focus of many managers
within the education service industry. By referring to the work of Hill
(1995), DeJager and Gbadamosi (2010: 253), argue that in an education
setting, service provision and customer satisfaction rely on the interface
between students and staff. Through this contact and its labour intensive
nature, this service translates into a potentially highly heterogeneous service

Eric E. Mang’unyi and Krishna K. Govender
144
quality experience.
Within the services marketing literature, debates revolve around the use
of the ‘gap’ measures, and great interest seems to be on the service-quality-
service performance (SERVPERF) relationship (Cronin &Taylor 1994). For
example, by citing Babakus and Mangold (1992), Cronin and Taylor (1994:
126) recognized in equal measure, strong support for the use of
performance-based evaluations.
Although there has been wide-ranging use of the SERVQUAL tool in
the measurement of service quality in higher education (Rajasekhar,
Muninarayanappa & Reddy 2009; Sunanto, Taufiquarrahman &
Pangemanan 2007; Shekarchizadeh, Rasli & Hon-Tat 2011), its use in this
study was avoided for inter-alia, reasons that follow.
For instance, Aldridge and Rowley (1998) argue that SERVQUAL
application in HE has had its fair share of criticisms, which include the need
to ask the same questions twice, and the fact that the instrument captures a
snapshot of perceptions at one point in time. Furthermore, Buttle (1996)
argues that the model lacks complete applicability since its five dimensions
are not universal. However, with careful modification, the SERVQUAL
instrument could lead to its successful use since it has been employed in HE
(Hair 2006: 11).
Due to inter-alia, the limitations of using SERVQUAL in the HE
environment alluded to above, and bearing in mind that service quality is a
construct that fits a specific context (Roostika, 2009), the HEdPERF tool
developed by Firdaus (2005) was used. Modified to a six-factor structure
with 41 items (Firdaus 2006), the HEdPERF instrument has clear distinct
dimensions, namely, academic aspects, reputation, non-academic aspects,
access, program issues and understanding characterized within HE.
Several researchers (Ham & Hayduk 2003; Firdaus 2006; Wang & Shieh
2006; Calvo-Porall et al. 2013; Govender & Ramroop 2013;) applied various
instruments to measure the impact of SQ on customer satisfaction within
HE. However, the aforementioned studies have solely focused on students’
perception of quality, and little attention was paid to the perspectives of both
the students and employees (academic and administration) or on other non-
academic aspects of the educational experience.

The Service Quality - Customer Satisfaction Nexus
145
Research Questions and Hypotheses The main purpose of this research is to explore the relationship between
service quality (SQ) and customer satisfaction (CS) among employees and
students in Kenyan private universities. The study endeavoured to recognize
the dimensions of university service quality, assess dimensions/attributes of
quality that contribute to customer satisfaction, and determine the
association between SQ and CS. In order to address the aforementioned, two
research questions were formulated:
RQ1: What are the service quality dimensions that impact on the
employees and students perceived SQ?
RQ2: Is there a difference in the satisfaction of employees and
students in HE?
In relation to the above-mentioned research questions the following
hypotheses have been formulated:
H1: The HEdPERF service equality dimensions (academic aspects,
non-academic aspects, programme aspects, reputation, access and
understanding) form the perceived service quality construct, and
these dimensions have a significant positive relationship with the
overall service quality.
H2: There is no significant difference in the satisfaction between the
students and employees as university customers.
Methodology A cross-sectional survey was conducted among a sample of 600 students and
250 employees from four private universities in Kenya. Using stratified
random sampling based on the type of private university (faith-oriented and
commercial), employees in the academic and administrative departments and

Eric E. Mang’unyi and Krishna K. Govender
146
students (both undergraduate and postgraduate), were selected to participate
in the study. Of the total 655 valid cases, 133 were full-time employees and
522 were fully registered students in the selected private universities.
Participation in the study was voluntary and the participants were required to
complete a pre-designed questionnaire.
Each of the items in the structured instrument was anchored on a 7-point
Likert scale, and respondents were required to indicate their agreement with
the each item, ranging from 1 absolutely disagree to 7 absolutely agree. The
first part of the questionnaire addressed attributes of service quality
contributing to customer satisfaction in private universities, and the second
part included statements pertaining to customer satisfaction and overall
evaluation of satisfaction. The same (although with slight modification in
wording where necessary) questionnaires were administered to both
samples. The data was collected over a four-month period extending from
late September 2013 to January 2014.
To measure perceived SQ in HE, the 41-item HEdPERF scale developed
by Firdaus (2006) was adapted to suit the Kenyan context. Perceived SQ is
captured in six dimensions/attributes namely: non-academic, academic,
reputation, access, programme issues and understanding.
The data was subject to Exploratory Factor Analysis (EFA) and
structural equation models (SEM) using SPSS (AMOS), since SEM allows
for identification of the influence of each of the HEdPERF dimensions on
perceived SQ in HE (Schumacker & Lomax 2004). Levene’s t-test was also
performed to compare the employee and customer samples in the study.
Results
Reliability of the Research Instruments The internal consistency of the two questionnaires was determined through
calculating the Cronbach alpha (α) coefficients using Stepwise Reliability
Analysis, whereby internally inconsistent items were sequentially deleted,
therefore maximizing the scales’ reliability (Sekaran & Bougie 2010: 325).
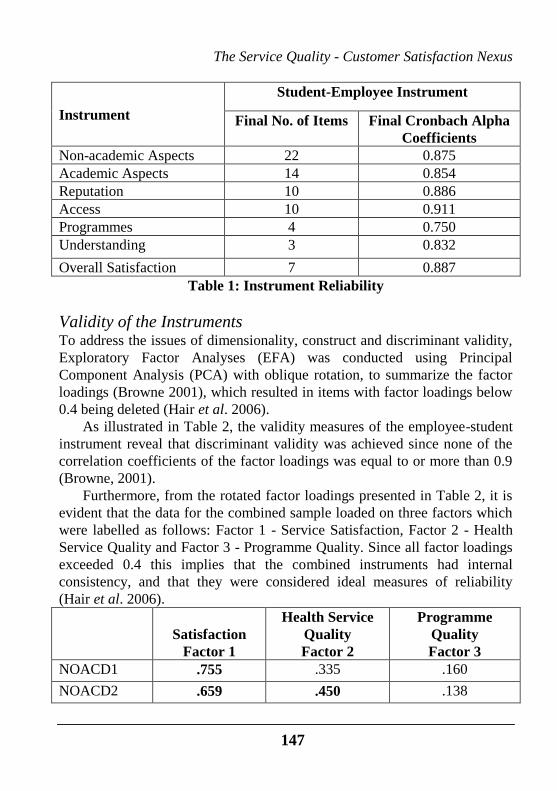
Table 1 reflects that the Cronbach coefficient alphas were acceptable
(exceeding 0.7), as suggested Hair et al. (2006; 2010), implying that the
measurement instruments were fairly reliable.
The Service Quality - Customer Satisfaction Nexus
147
Instrument
Student-Employee Instrument
Final No. of Items Final Cronbach Alpha
Coefficients
Non-academic Aspects 22 0.875
Academic Aspects 14 0.854
Reputation 10 0.886
Access 10 0.911
Programmes 4 0.750
Understanding 3 0.832
Overall Satisfaction 7 0.887
Table 1: Instrument Reliability
Validity of the Instruments To address the issues of dimensionality, construct and discriminant validity,
Exploratory Factor Analyses (EFA) was conducted using Principal
Component Analysis (PCA) with oblique rotation, to summarize the factor
loadings (Browne 2001), which resulted in items with factor loadings below
0.4 being deleted (Hair et al. 2006).
As illustrated in Table 2, the validity measures of the employee-student
instrument reveal that discriminant validity was achieved since none of the
correlation coefficients of the factor loadings was equal to or more than 0.9
(Browne, 2001).
Furthermore, from the rotated factor loadings presented in Table 2, it is
evident that the data for the combined sample loaded on three factors which
were labelled as follows: Factor 1 - Service Satisfaction, Factor 2 - Health
Service Quality and Factor 3 - Programme Quality. Since all factor loadings
exceeded 0.4 this implies that the combined instruments had internal
consistency, and that they were considered ideal measures of reliability
(Hair et al. 2006).
Satisfaction
Factor 1
Health Service
Quality
Factor 2
Programme
Quality
Factor 3
NOACD1 .755 .335 .160
NOACD2 .659 .450 .138

Eric E. Mang’unyi and Krishna K. Govender
148
NOACD3 .435 .149 -.019
NOACD4 .514 .064 .111
ACD1 .751 .054 .224
ACD2 .726 .047 .336
REP1 .499 .539 .248
REP2 .539 .506 .454
ACC1 .530 .528 .403
ACC2 .448 .578 .304
PRG1 .188 .328 .751
PRG2 .260 .345 .717
PRG3 .205 .199 .793
PRG4 .012 .091 .650
UND1 .137 .741 .401
UND2 .116 .764 .306
UND3 .246 .783 .106
OvrQual .374 .221 -.015
Table 2: Rotated Factor Matrix for Combined Student-Employee
Measurement Instruments
**Note: NOACD = non-academic, ACD = academic, REP = reputation,
ACC = access, PRG = programme, UND = understanding, OvrQual =
overall quality
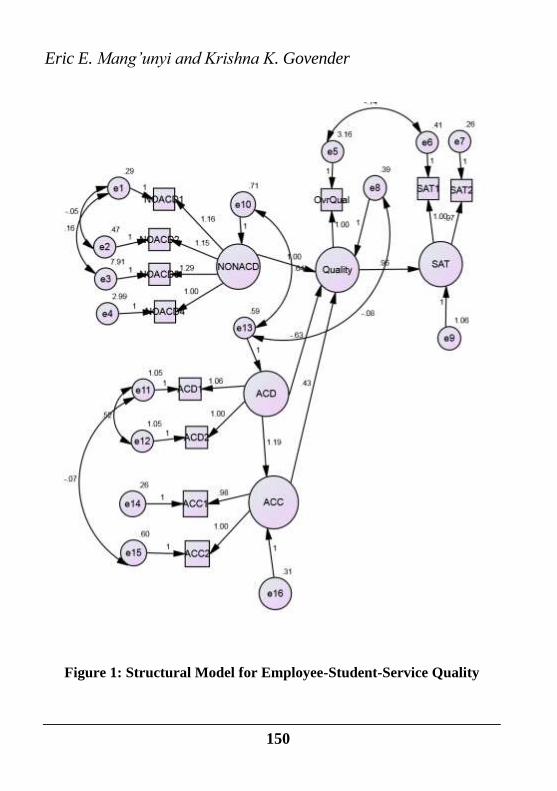
Structural Equation Modelling Results From the AMOS output reflected in Table 3, it is clear that the model fitted
the data well, and therefore the proposed model was adequate in explaining
the relationship among the variables. The resulting maximum likelihood
estimates are indicated in Figure 1.

The Service Quality - Customer Satisfaction Nexus
149
Table 3: Model Fit Indices for the Combined Employee-Student
Measures
Eric E. Mang’unyi and Krishna K. Govender
150
Figure 1: Structural Model for Employee-Student-Service Quality

The Service Quality - Customer Satisfaction Nexus
151
The estimates also confirm a good fit of the data, since the chi-square value
is 29.997 (Hair et al. 2006). The RMSEA value yielded an exact/good fit at
0.00, and the CMIN/DF was 0.908, further supporting the goodness-of-fit.
The p-value (with a level of significance of 0.05) was greater than 0.05
(0.618), hence the model was declared adequate (Schumacker & Lomax
2004; Hair et al. 2006). Furthermore, the incremental fit measures of the two
constructs, namely, university service quality and customer satisfaction and,
the resultant structural models from the combined data showed a proper fit
considering that the Comparative Fit Index (CFI), Relative Fit Index (RFI),
Incremental Fit Index (IFI) and Tucker-Lewis Index (TLI) had values greater
than 0.90 (Schumacker & Lomax 2004; Hair et al. 2010).
After evaluating the model in relation to the merged employee-student
data, the goodness of fit results and corresponding findings of EFA, the
researchers carried out an analysis on the weighting and influence of the
HEdPERF service quality dimensions on perceived SQ from merged
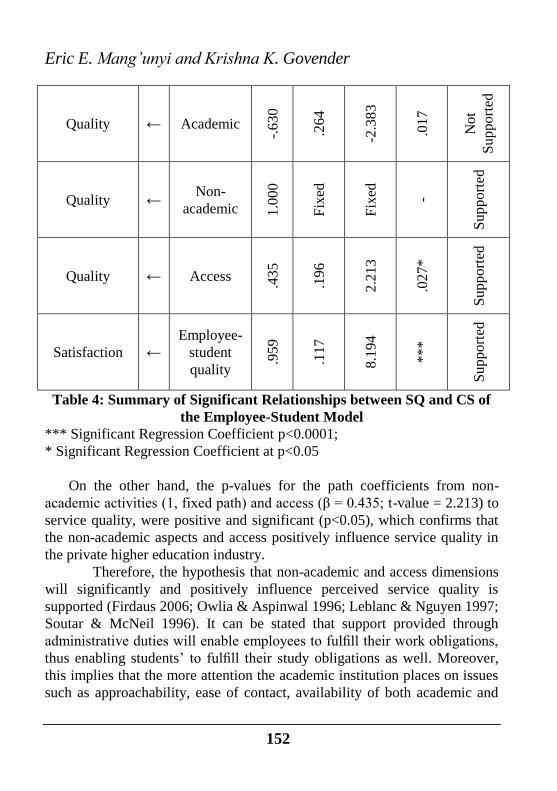
employee-student standpoint. The findings reflected in Table 4 show that,
only two dimensions have a positive and significant influence on higher
education perceived service quality and no empirical evidence emerged to
support a positive significant influence of some HEdPERF dimensions such
as reputation, understanding, and programme.
Besides, the p-value for the path co-efficient from the academic activity
to the quality of service is insignificant (β = -.630; CR = -2.383; p>0.0001),
indicating that academic activities do not positively affect service quality.
These results therefore imply that the hypothesised relationship between the
academic dimension and perceived service quality is not supported in
Kenya’s private higher education industry.
Dimensions
and
Relationships
Est
ima
te
SE
t-v
alu
e
p-v
alu
e
Ou
tco
me
Eric E. Mang’unyi and Krishna K. Govender
152
Quality ← Academic
-.630
.264
-2.3
83
.017
Not
Support
ed
Quality ← Non-
academic 1.0
00
Fix
ed
Fix
ed
-
Support
ed
Quality ← Access .4
35
.196
2.2
13
.027*
Support
ed
Satisfaction ←
Employee-
student
quality
.959
.117
8.1
94
***
Support
ed
Table 4: Summary of Significant Relationships between SQ and CS of
the Employee-Student Model
*** Significant Regression Coefficient p<0.0001;
* Significant Regression Coefficient at p<0.05
On the other hand, the p-values for the path coefficients from non-
academic activities (1, fixed path) and access (β = 0.435; t-value = 2.213) to
service quality, were positive and significant (p<0.05), which confirms that
the non-academic aspects and access positively influence service quality in
the private higher education industry.
Therefore, the hypothesis that non-academic and access dimensions
will significantly and positively influence perceived service quality is
supported (Firdaus 2006; Owlia & Aspinwal 1996; Leblanc & Nguyen 1997;
Soutar & McNeil 1996). It can be stated that support provided through
administrative duties will enable employees to fulfill their work obligations,
thus enabling students’ to fulfill their study obligations as well. Moreover,
this implies that the more attention the academic institution places on issues
such as approachability, ease of contact, availability of both academic and

The Service Quality - Customer Satisfaction Nexus
153
administrative staff and convenience, the higher the perceived SQ from the
employees’ and students’ standpoint. These findings are consistent with
Firdaus (2006) who observed that students perceive access as an important
element in determining service quality in HE environments. The p-value for
the path coefficient from employee-student quality to satisfaction is positive
(β = 0.959; t-value = 8.194) and significant (p<0.0001), which indicates that
service quality positively affects employee and student satisfaction levels in
private higher education in Kenya.
This is supported by previous research (Lassar, Manolis & Winsor 2000)
where the overall service quality influences satisfaction. Thus, the
hypothesis that SQ impacts customer satisfaction (CS) is fully supported.
Finally, by considering the effect sizes, it may be concluded that the ‘non-
academic’ dimension has a greater impact on perceived SQ in private higher
education. Thus, it is concluded that the ‘non-academic’ dimension of
HEdPERF is the most relevant dimension in explaining perceived service
quality, followed by access with a relatively lower influence on perceived
service quality (Figure 2).
Figure 2: Employee-Student Model for Perceived SQ and CS Outcomes ** Means Significant at p<0.05; *** means significant at p<0001

Eric E. Mang’unyi and Krishna K. Govender
154
Comparison of Satisfaction between Employees and Students To test the null hypothesis, which implied that there is no significant
difference in satisfaction between the students and employees (as university
customers), a new variable score called satisfaction was computed by
summing the facets of satisfaction. The lowest value that this variable could
take is 7, while the maximum value is 49 (Field 2009). Table 5 below
summarises the distribution of this satisfaction score.
N Minimum Maximum Mean
Std.
Deviation
Satisfaction Score 576 7.00 49.00 37.7 6.698
Table 5 Satisfaction Score
The mean score (37.7) is greater than the midpoint of 28, meaning that
the customers are fairly satisfied with the service that they receive. Further
analysis entailed ascertaining if the satisfaction score varied by the type of
customer, and in particular, if there is difference in satisfaction between staff
and students. However, before this we done, an exploratory analysis using a
box plot (Figure 3) was conducted to determine (graphically) if the
difference existed.

The Service Quality - Customer Satisfaction Nexus
155
Figure 3 Satisfactions by Customer
From Figure 3 above, it is evident that although both students and
employees have almost the same satisfaction score, some students had very
low satisfaction, hence forming outliers represented by circles. Only one
employee’s score was categorised as an outlier. To check whether there is a
significant difference between the students’ and employees’ (as customers)
satisfaction, the student’s t-statistical test results were calculated as shown
Table 6.
Customer
Type N Mean
Std.
Deviation
Std.
Error
Mean
Satisfaction Student 450 37.5044 6.89671 .32511
Staff 126 38.3968 5.90739 .52627
Table 6 Satisfaction Score by Customer Type
Eric E. Mang’unyi and Krishna K. Govender
156
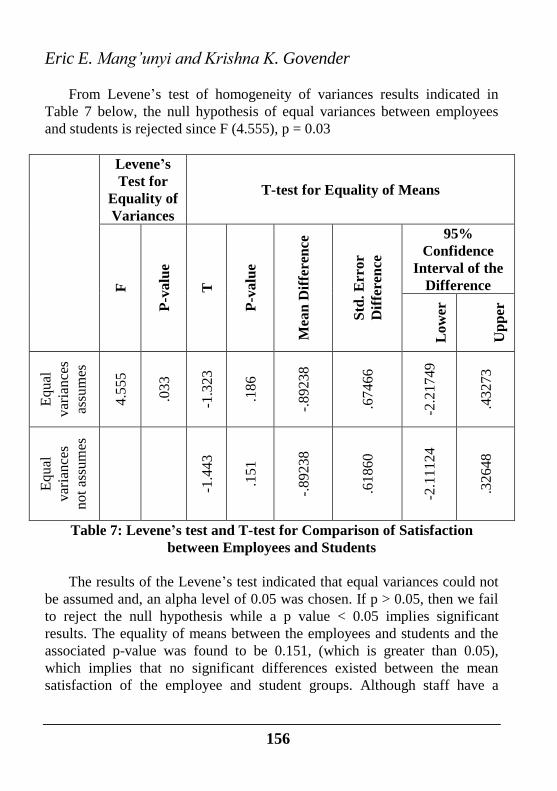
From Levene’s test of homogeneity of variances results indicated in
Table 7 below, the null hypothesis of equal variances between employees
and students is rejected since F (4.555), p = 0.03
Levene’s
Test for
Equality of
Variances
T-test for Equality of Means
F
P-v
alu
e
T
P-v
alu
e
Mea
n D
iffe
ren
ce
Std
. E
rror
Dif
fere
nce
95%
Confidence
Interval of the
Difference
Low
er
Up
per
Equal
var
iance
s
assu
mes
4.5
55
.033
-1.3
23
.186
-.89238
.67466
-2.2
1749
.43273
Eq
ual
var
ian
ces
no
t as
sum
es
-1.4
43
.15
1
-.8
92
38
.61
86
0
-2.1
11
24
.32
64
8
Table 7: Levene’s test and T-test for Comparison of Satisfaction
between Employees and Students
The results of the Levene’s test indicated that equal variances could not
be assumed and, an alpha level of 0.05 was chosen. If p > 0.05, then we fail
to reject the null hypothesis while a p value < 0.05 implies significant
results. The equality of means between the employees and students and the
associated p-value was found to be 0.151, (which is greater than 0.05),
which implies that no significant differences existed between the mean
satisfaction of the employee and student groups. Although staff have a

The Service Quality - Customer Satisfaction Nexus
157
slightly superior quality satisfaction index score ( X = 38.39, SD = 5.91)
than students ( X = 37.50, SD = 6.89), there is no significant statistical
difference between these averages. Thus, the null hypothesis is not rejected,
and it can be concluded that there is no statistically significant difference in
satisfaction between employees and students. The findings concur with some
previous studies (De Jager & Gbadamosi 2010), where it was revealed that
significant lower perceived service experience by students to what they
believed to be vital in their learning centres.
The universities used in the study were all private, thus it was assumed
that all employees and students in similar universities were subjected to
similar conditions from a service perspective. Thus, it may be concluded that
the test is not biased to any customer
Conclusion and Recommendations The findings reveal that with reference to the service quality dimensions in
this study, “access” and “non-academic” are most significant determinants of
perceived SQ in the private HE institutions. It was also ascertained that the
‘non-academic’ dimensions contributed most towards the respondents’
perception of service quality. This study did not find any empirical support
for a positive and significant relationship between the academic dimension
and perceived service quality in HE.
These findings provide insight to the management of HE institutions in
that they may use the findings to enhance both employee and student
perceptions of service quality. Therefore, a private university provider can
prioritize and allocate resources and/or emphasize the non-academic quality,
access quality and academic quality in order to meet “employee-students”
expectations.
A limitation of the study is that it adopted a purely quantitative paradigm
and was also limited to select private universities in Kenya. Therefore, the
findings should be confirmed by further evidence employing a different
equally rigorous methodology such as mixed methods.

Eric E. Mang’unyi and Krishna K. Govender
158
References Angell, RJ, TW Heffernan & P Megicks 2008. Service Quality in
Postgraduate Education. Quality Assurance Higher Education 16, 3:
236–254.
Bejou, D 2005. Treating Students Like Customers. BizEd Magazine 44-47.
Bounds, G, YA Lyle & R Gipsies 1994. Beyond Total Management toward
the Emerging Paradigm. New York: McGraw-Hill. Inc.
Brochado, A 2009. Comparing Alternative Instruments to Measure Service
Quality in Higher Education. Quality Assurance in Higher
Education 17, 2: 74-190.
Brown, SW & MJ Bitner 2007. Mandating a Service Revolution for
Marketing. In Lush, RF & SL Vargo (eds): The Service-Dominant
Logic of Marketing: Dialogue, Debate and Directions. New York:
M.E. Sharp.
Browne, MW 2001. An Overview of Analytic Rotation in Exploratory
Factor Analysis. Multivariate Behavioral Research 36: 111-150.
Buttle, F 1996. SERVQUAL: Review, Critique, Research Agenda.
European Journal of Marketing 30, 1: 8–32.
Calvo-Porall, C, JP Levy-Mangin & I Novo-Corti 2013. Perceived Quality in
Higher Education: An Empirical Study. Marketing Intelligence and
Planning 36, 6: 60.
Combrinck, T 2006. A Pilot Empirical Investigation into Student
Perceptions of Service Quality at the Department of Management of
the University of the Western Cape. Master of Commerce
Dissertation, Cape Town: University of the Western Cape.
Cooper, RD & SP Schindler 2008. Business Research Methods. 8th Edition.
New Delhi: Tata McGraw-Hill.
DeJager, J & G Gbadamosi 2010. Specific Remedy for Specific Problems:
Measuring Service Quality in South African Higher Education.
Higher Education 60, 3: 251–267.
DeShields Jr, WO, A Kara & E Kaynak 2005. Determinants of Business
Students’ Satisfaction and Retention in Higher Education: Applying
Herzberg’s Two-factor Theory. International Journal of
Educational Management 19, 2: 128–139.

The Service Quality - Customer Satisfaction Nexus
159
Douglas, J, R McClelland, & J Davies 2008. The Development of a
Conceptual Model of Student Satisfaction with their Experience in
Higher Education. Quality Assurance in Education 16, 2: 19-35.
Eagle, L & R Brenman 2007. Are Students Customers? TQM and Marketing
Perspectives. Quality Assurance in Education 15, 1: 44-60.
Field, A 2009. Discovering Statistics Using SPSS. 3rd
Edition. London: Sage
Publications Ltd.
Firdaus, A 2005. The Development of HEdPERF: A New Measuring
Instrument of Service Quality for the Higher Education Sector.
International Journal of Consumer Studies 30, 6: 569-581.
Firdaus, A 2006. Measuring Service Quality in Higher Education: HEdPERF
versus SERVPERF. Marketing Intelligence & Planning 24, 1: 31–
47.
Govender, KK 2013. Service Performance and Service Quality: Exploring
the Post-graduate Research Students’ Perceptions of the Service
Encounter. Journal of Social Sciences 37, 3: 217-224.
Govender, KK 2013. The Relationship between the Postgraduate Research
Climate and Supervisor Research Service Quality. Journal of Social
Sciences 2, 3: 146-158.
Hair, JF, WC Black, BJ Babin, RE Anderson & RL Tatham 2006.
Multivariate Data Analysis. 6th Edition. Singapore: Prentice-Hall.
Hair, JF, WC Black, BJ Babin & RE Anderson 2010. Multivariate Data
Analysis: A Global Perspective. New York: Pearson Prentice Hall.
Ham, L, & S Hayduk 2003. Gaining Competitive Advantages in Higher
Education: Analyzing the Gap between Expectations and
Perceptions of Service Quality. International Journal of Value-
Based Management 16, 3: 223–242.
Hasan, HFA & A Ilias 2008. Service Quality and Student Satisfaction: A
Case Study at Private Higher Education Institutions. International
Business Research 1, 3: 163-175.
Hensley, RI & J Sulek 2007. Customer Satisfaction with Waits in Multi-
stage Services. Managing Service Quality 17, 2: 152–173.
Hishamuddin, FAH & I Azleen 2008. Service Quality and Student
Satisfaction: A Case Study at Private Higher Education Institutions.
International Business Research 1, 3: 163–175.

Eric E. Mang’unyi and Krishna K. Govender
160
Kara, A, S Lonial, M Tarim & S Zaim 2005. A Paradox of Service Quality
in Turkey: The Seemingly Contradictory Relative Importance of
Tangible and Intangible Determinants of Service Quality. European
Business Review 17, 1: 21-27.
Khodayari, F & B Khodayari 2011. Service Quality in Higher Education.
Interdisciplinary Journal of Research in Business 1, 9 3 –4 .
Kimani, WS 2011. Business Students’ Perception of Service Quality in
Kenyan Private and Public Universities. Nairobi: CUEA Press.
Lassar, WM, C Manolis & RD Winsor 2000. Service Quality Perspectives
and Satisfaction in Private Banking. Journal of Service Marketing.
14, 3: 244–271.
Leblanc, G & N Nguyen 1997. Searching for Excellence in Business
Education: An Exploratory Study of Customer Impressions of
Service Quality. International Journal of Education Management.
11, 2: 72–79.
Little, B & R Williams 2011. Students’ Role in Maintaining Quality and
Enhancing Learning: Is There a Tension? Quality High Education.
16, 2: 115-127.
Maddern, H, M Roger & S Andi 2007. Customer Satisfaction and Service
Quality in UK Financial Services. International Journal of
Operations and Production Management 27, 9: 999 -1019.
Ngome, CK 2010. Massive Growth of University Education in East Africa
and the Challenges Facing the Sector between 2000–2010: The Case
of Kenya. Paper presented at the 10th Anniversary Celebrations of
the Revitalization of the Inter-University Council for East Africa
(IUCEA), Kampala. Available at: http//:www.iucea.org/downloads/
Massive_Growth.pdf. (Accessed on 15 June 2010.)
Owlia, MS & EM Aspinwall 1996. A Framework for the Dimensions of
Quality in Higher Education. Quality Assurance in Education 4, 2:
12–20.
Perez, MS, CGA Juan, MMC Gema & SF Raquel 2007. Effects of Service
Quality Dimensions on Behavioural Purchase Intentions: A Study in
Public Sector Transport. Managing Service Quality 17, 2: 134-151.
Prugsamatz, S, R Pentecost & L Ofstad 2006. The Influence of Explicit and
Implicit Service Promises on Chinese Students’ Expectations of

The Service Quality - Customer Satisfaction Nexus
161
Overseas Universities. Pacific Journal of Marketing and Logistics
18, 2: 129-145.
Quinn, A, G Lemay, P Larsen & DM Johnson 2009. Service Quality in
Higher Education. Total Quality Management 20, 2: 139–152.
Rajasekhar M, M Muninarayanappa & SVS Reddy 2009. The GAP Model
Analysis of Service Quality in Indian Higher Education. Journal of
Social Sciences. 1, 2: 214-229.
Roostika, R 2009. The Role of Customer Value within the Service Quality,
Customer Satisfaction and Behavioural Intentions Relationships: An
Empirical Examination in the Indonesian Higher Education Sector.
Unpublished PhD thesis in Business Management, Melbourne:
Swinburne University of Technology.
Rust, RT, PJ Danaher & V Sajeev 2000. Using Service Quality Data for
Competitive Marketing Decisions. International Journal of Services
Industry Management 11, 5: 438–469.
Schumacker, RE & RG Lomax 2004. A Beginner’s Guide to Structural
Equation Modelling. New Jersey: Lawrence Erlbaum Associates.
Seilier, VL 2004. Examining Service Quality for Homebuyers in the
Residential Real Estate Brokerage Industry. Unpublished PhD thesis
in Marketing. Sydney: University of Western Sydney.
Sekaran, U & R Bougie 2010. Research Methods for Business: A Skill
Building Approach. 5th Edition. New York: John Wiley & Sons, Inc.
Seth, N, SG Deshmukh & P Vrat 2005. Service Quality Models: A Review.
International Journal of Quality & Reliability Management 22, 9:
913-949.
Shekarchizadeh, A, A Rasli & H Hon-Tat 2011. SERVQUAL in Malaysian
Universities: Perspectives of International Students. Business
Process Management Journal 17, 1: 67
Siddiqi, KO 2011. Interrelations Between Service Quality Attributes,
Customer Satisfaction and Customer Loyalty in the Retail Banking
Sector in Bangladesh. International Journal of Business and
Management 6, 3: 12-36.
Soutar, G & M McNeil 1996. Measuring Service Quality in a Tertiary
Institution. Journal of Educational Administration 34, 1: 72–82.
Sunanto, S, T Taufiquarrahman & R Pangemanan 2007. An Analysis of
University Services Quality Gap and Student Satisfaction in

Eric E. Mang’unyi and Krishna K. Govender
162
Indonesia. The International Journal of Knowledge, Culture and
Change Management 7, 7: 1-10.
Vaill, P 2008. Beware the Idea of the Student as a Customer: A Dissenting
View. Available at: http://www.people.veu.edu/~rsleeth/
NotCustomers.html. (Accessed on 4 July 4 2012.)
Wang, I & C Sheih 2006. The Relationship between Service Quality and
Customer Satisfaction: The Example of CJCU Library. Journal of
Information and Optimization Sciences 27, 1: 193–201.
Yee, R, A Yeung & T Cheng 2010. An Empirical Study of Employee
Loyalty, Service Quality and Firm Performance in the Service
Industry. International Journal of Production Economics 24, 1: 109.
Yoon, MH, JHJ Seo, & TS Yoon 2004. Effects of Contact Employee
Supports on Critical Employee Responses and Customer Service
Evaluation. Journal of Services Marketing 18, 5: 395–415.
Yunus, NKY, A Ismail, S Ishak & ZR Juga 2009. Service Quality
Dimensions, Perceived Value and Customer Satisfaction: ABC
Relationship Model Testing. IBEJ 2, 1: 1-18.
Zahari, W, W Yusoff & M Ismail 2008. FM-SERVQUAL: A New Approach
of Service Quality Measurement Framework in Local Authorities.
Journal of Corporate Real Estate 10, 2: 130–144.
Eric E. Mang’unyi
School of IT, Management and Governance
University of KwaZulu-Natal
Krishna K. Govender
School of Management, IT and Governance,
University of KwaZulu-Natal and
Regenesys Business School,
Johannesburg, South Africa