The Self-Sufficiency Standard for Washington State - Employment
68
by Diana Pearce, Ph.D. with Jennifer Brooks September 2001 Prepared for the Washington Association of Churches, the Washington Living Wage Movement and the Washington Self-Sufficiency Standard Committee The Self-Sufficiency Standard for Washington State
Transcript of The Self-Sufficiency Standard for Washington State - Employment
by Diana Pearce, Ph.D.with Jennifer Brooks
September 2001
Prepared for the Washington Association of Churches,the Washington Living Wage Movement and theWashington Self-Sufficiency Standard Committee
The Self-Sufficiency Standard forWashington State

The Self-Sufficiency Standard for Washington State 2001 Diana Pearce and Wider Opportunities for Women
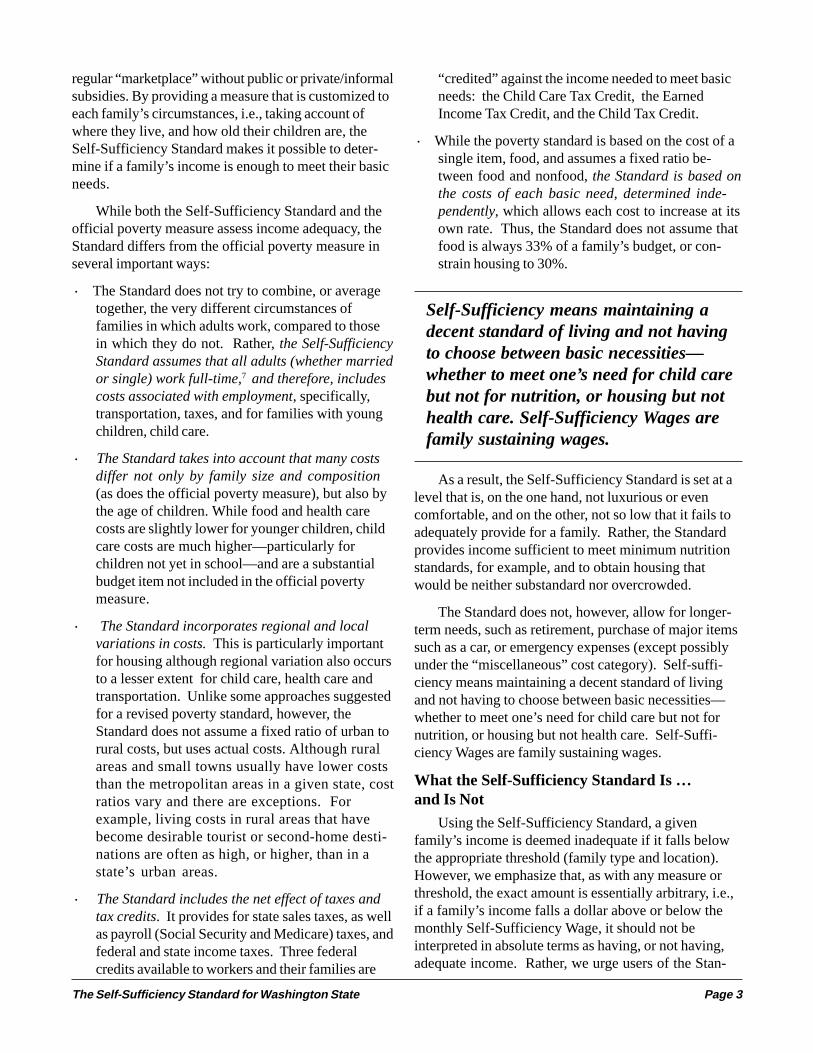
Preface
The Self-Sufficiency Standard was developed for Wider Opportunities for Women as part of the StateOrganizing Project for Family Economic Self-Sufficiency by Dr. Diana Pearce, who was at that time Director ofthe Women and Poverty Project at Wider Opportunities for Women. Funding for its original development andcontinued support have been provided by the Ford Foundation and additionally in Washington State, the OttingerFoundation. A number of other people also have contributed to the development of the Standard, its calculation,and/or the writing of state reports. The Standard would not be what it is without the contributions of JenniferBrooks, Laura Henze Russell, Janice Hamilton Outtz, Roberta Spalter-Roth, Antonia Juhasz, Alice Gates, AleshaDurfee, Melanie Lavelle, Nina Dunning, Sacha Crittenden, Seook Jeong and in Washington, Sara FlemingMerten and Michael Ramos. Nonetheless, any mistakes are the authors’ responsibility.
We also thank the following individuals and agencies that assisted us in the development of this report and itsrelease: Lonnie Johns Brown, Washington Association for the Education of Young Children; Julie Chinitz, North-west Health Law Advocates; Jean Colman, Welfare Rights Organizing Coalition; Barbara Flye, WashingtonCitizen Action; Jon Gould, Children’s Alliance; Deena Heg, Northwest Policy Center; Jeff Johnson, WashingtonState Labor Council; Mark M. McDermott, City of Seattle; Tony Lee, Fremont Public Association; Aiko Schaffer,Statewide Poverty Action Network; Yvette War-Bonnet, Columbia Legal Services.


Table of Contents
Introduction .................................................................................................1
How the Self-Sufficiency Standard is Calculated ...................... 5
How Much Money is Enough in Washington State? ............... 8
Comparing the Standard to Other Benchmarks of Income ...... 13
Comparing the Standard for Washington Cities to OtherMajor Cities.......................................................................15
Closing the Gap Between Incomes and the Self-SufficiencyStandard .........................................................................................16
Modeling the Impact of Supports on Wages Required to MeetBasic Needs ..................................................................... 19
How the Self-Sufficiency Standard Can be Used ................... 23
Conclusion ............................................................................... 25
Endnotes ................................................................................... 27
DataSources ............................................................................. 29
About the Authors .................................................................. 31
List of Counties by Metropolitan Area and Non-MetropolitanCounties ......................................................................................... 33
Map of Washington Counties ........................................................ 35
Appendix: Selected Family Types .................................................... 37


The Self-Sufficiency Standardfor Washington StateHow much money does it take for families to live and workwithout public or private assistance or subsidies?
IntroductionDue to a robust economy combined with recent
changes in welfare and workforce development policy,the question of self-sufficiency has taken on newurgency. As many parents leave welfare and enter thelabor market, they join a growing number of familieswho are unable to stretch their wages to meet the costsof basic necessities. Even though many of thesefamilies are not poor according to the official povertymeasure, their incomes are inadequate. But what isadequate income—and how does this amount varyamong different family types and different places?To answer that question we have a new measure ofincome adequacy, the Self-Sufficiency Standard.
The Self-Sufficiency Standard measures howmuch income is needed, for a family of a givencomposition in a given place, to adequately meet itsbasic needs—without public or private assistance.Below we will explain the origin of the Standard; how itdiffers from the official poverty standard; how it iscalculated; what it looks like for Washington's families;and how various public subsidies, public policies, childsupport, and other available resources can help familiesmove towards self-sufficiency. We conclude thisreport with a discussion of the varied ways that theStandard can be used as a tool for policy analysis,counseling, performance evaluation, and research.
Measuring Income Adequacy: Problems with thePoverty Line
How much is enough for families to meet theirneeds, on their own? Although we may have troublecoming up with an exact dollar figure, most of us knowwhat adequacy looks like when we see it. As one
participant in a training program put it, when asked todefine her progress towards economic self-sufficiency:
I wouldn’t say I’m economically self-sufficient yet. When it comes to a point where Idon’t have to worry about the health care needsof my family, when I don’t have to worry aboutthe light bill, when the light man isn’t knockingon the door saying “your bill is due.” Not thatyou have a lot of money, but you’re not worriedabout how your kid is going to get that next pairof shoes …. Just the simple things, that may notbe all that simple because we don’t have themyet.1
Obviously, however, we cannot interview everyperson for his or her own assessment of income ad-equacy, as quoted above. Besides, such assessmentswould be subjective and inconsistent. The need for anobjective standard to assess income adequacy has thusled most of us to the official federal poverty measure.Using the federal poverty measure, we can determinethat a family is “poor” if its income is below the appro-priate threshold, and “not poor” if it is above thatthreshold. The poverty measure, however, has becomeincreasingly problematic as a measure of incomeadequacy.
The most significant shortcoming of the federalpoverty measure is: for most families, in most places, itis simply not high enough. There are many families withincomes above the federal poverty line who nonethelesslack sufficient resources to adequately meet their basicneeds. As a result, many assistance programs use a

Page 2 The Self-Sufficiency Standard for Washington State
Not only is the federal poverty measuretoo low, but it is based on outdatedassumptions, thus not incorporating newneeds, changing demographics andwidening geographic differentials.
multiple of the poverty standard to measure need. Forexample, Medicaid is extended to families with incomesthat are 100%, 185%, or 200% of the official povertythresholds.
Not only government, but the general public alsoconsiders the poverty line to be too low. A number ofstudies have shown that the public would set a mini-mum income 25-50% above the federal povertystandard, depending upon the family’s compositionand where the family lives.2
However, the official poverty measure has addi-tional problems inherent in its structure. Simplyraising the poverty line, or using a multiple of thethreshold cannot solve these problems. Since the
official poverty measure was first developed andimplemented in the early 1960s it has only been updatedto reflect inflation, and has not and cannot incorporatemodern-day needs.
This inability to account for new or different needsresults from two methodological problems. The first isthat the federal poverty measure is based on the cost ofa single item, food. The second is that it assumes afixed ratio between food and all other needs (housing,clothing, etc.). This fixed ratio does not allow forsome costs to rise faster than food. In fact, there is noway to increase the amount allotted for food to takeinto account new nutritional standards.
In addition to outdated nutritional standards onwhich the poverty measure was based and the limitedbasic needs package, the demographic model (the two-parent family with a stay-at-home wife) has alsochanged significantly since the measure’s inception.Particularly for working parents—of whom there aremany more today than in the 1960s—there are newneeds associated with employment, such as transporta-tion, taxes, and if they have young children, child care.
The poverty thresholds are also the same whetherone lives in Mississippi or Manhattan. That is, thepoverty measure does not vary by geographic location.Although there was some geographic variation in coststhree decades ago, differences in the cost of living
between areas have increased substantially since then,particularly in the area of housing. Indeed, housing in themost expensive areas of the country costs about fourtimes as much as the same size units in the least expen-sive areas.3
Once again, public programs have recognized thefailure of the one-size-fits-all poverty measure tocapture differences in need. Thus, instead of using thepoverty measure, federal housing programs assess needusing local area median income as a way to take intoaccount the significant differences in cost of livingbetween localities. The Food Stamp program also takesinto account variations in costs of housing and childcare between different localities.
Finally, the poverty measure does not distinguishbetween those families in which the adults are em-ployed, and those in which the adults are not employed.At the time that the poverty measure was first devel-oped, there was probably not a large difference betweenfamilies in these situations: taxes were very low for low-income families with earned income and transportationwas inexpensive. Most important, the majority ofworkers with children had a nonworking spouse whoprovided child care. Today, taxes even for low-incomefamilies are substantial, transportation can be costly, andmany families do not have “free” child care available.
For these and other reasons, many researchers andanalysts have proposed revising the poverty standard.Suggested changes would reflect new needs as well asincorporate geographically-based differences in costs,and would build in more responsiveness to changes overtime.4 Others have gone further, creating new measuresof income adequacy, such as “Basic Needs Budgets” orLiving Wages.5
The Self-Sufficiency Standard–And How ItDiffers from the Federal Poverty Measure
While drawing on the critiques and analysis of thepoverty measure cited above, the Self-SufficiencyStandard takes a somewhat different approach tomeasuring income adequacy. As the editors of theBoston Globe put it: “Ask not where poverty ends, butwhere economic independence begins.” 6 That is, atwhat point does a family have sufficient income andresources (such as health benefits) to meet their needsadequately, without public or private assistance?
As a standard of income adequacy, the Self-Suffi-ciency Standard defines the amount of income requiredto meet basic needs (including paying taxes) in the
The Self-Sufficiency Standard for Washington State Page 3
regular “marketplace” without public or private/informalsubsidies. By providing a measure that is customized toeach family’s circumstances, i.e., taking account ofwhere they live, and how old their children are, theSelf-Sufficiency Standard makes it possible to deter-mine if a family’s income is enough to meet their basicneeds.
While both the Self-Sufficiency Standard and theofficial poverty measure assess income adequacy, theStandard differs from the official poverty measure inseveral important ways:
· The Standard does not try to combine, or averagetogether, the very different circumstances offamilies in which adults work, compared to thosein which they do not. Rather, the Self-SufficiencyStandard assumes that all adults (whether marriedor single) work full-time,7 and therefore, includescosts associated with employment, specifically,transportation, taxes, and for families with youngchildren, child care.
· The Standard takes into account that many costsdiffer not only by family size and composition(as does the official poverty measure), but also bythe age of children. While food and health carecosts are slightly lower for younger children, childcare costs are much higher—particularly forchildren not yet in school—and are a substantialbudget item not included in the official povertymeasure.
· The Standard incorporates regional and localvariations in costs. This is particularly importantfor housing although regional variation also occursto a lesser extent for child care, health care andtransportation. Unlike some approaches suggestedfor a revised poverty standard, however, theStandard does not assume a fixed ratio of urban torural costs, but uses actual costs. Although ruralareas and small towns usually have lower coststhan the metropolitan areas in a given state, costratios vary and there are exceptions. Forexample, living costs in rural areas that havebecome desirable tourist or second-home desti-nations are often as high, or higher, than in astate’s urban areas.
· The Standard includes the net effect of taxes andtax credits. It provides for state sales taxes, as wellas payroll (Social Security and Medicare) taxes, andfederal and state income taxes. Three federalcredits available to workers and their families are
“credited” against the income needed to meet basicneeds: the Child Care Tax Credit, the EarnedIncome Tax Credit, and the Child Tax Credit.
· While the poverty standard is based on the cost of asingle item, food, and assumes a fixed ratio be-tween food and nonfood, the Standard is based onthe costs of each basic need, determined inde-pendently, which allows each cost to increase at itsown rate. Thus, the Standard does not assume thatfood is always 33% of a family’s budget, or con-strain housing to 30%.
Self-Sufficiency means maintaining adecent standard of living and not havingto choose between basic necessities—whether to meet one’s need for child carebut not for nutrition, or housing but nothealth care. Self-Sufficiency Wages arefamily sustaining wages.
As a result, the Self-Sufficiency Standard is set at alevel that is, on the one hand, not luxurious or evencomfortable, and on the other, not so low that it fails toadequately provide for a family. Rather, the Standardprovides income sufficient to meet minimum nutritionstandards, for example, and to obtain housing thatwould be neither substandard nor overcrowded.
The Standard does not, however, allow for longer-term needs, such as retirement, purchase of major itemssuch as a car, or emergency expenses (except possiblyunder the “miscellaneous” cost category). Self-suffi-ciency means maintaining a decent standard of livingand not having to choose between basic necessities—whether to meet one’s need for child care but not fornutrition, or housing but not health care. Self-Suffi-ciency Wages are family sustaining wages.
What the Self-Sufficiency Standard Is …and Is Not
Using the Self-Sufficiency Standard, a givenfamily’s income is deemed inadequate if it falls belowthe appropriate threshold (family type and location).However, we emphasize that, as with any measure orthreshold, the exact amount is essentially arbitrary, i.e.,if a family’s income falls a dollar above or below themonthly Self-Sufficiency Wage, it should not beinterpreted in absolute terms as having, or not having,adequate income. Rather, we urge users of the Stan-
Page 4 The Self-Sufficiency Standard for Washington State
dard to think in relative terms of “wage adequacy,” thatis, one should ask how close is a given wage to theStandard?
Thus, for example, if the Standard for a given familyis $10.00 per hour, but the adult supporting the familyonly earns $7.00 per hour, then the latter wage has a“wage adequacy” level of only 70%. At the same time,a penny above or below $10.00 ($9.99 versus $10.01) isnot a meaningful distinction.
Second, the use of income thresholds should not betaken to mean that economic self-sufficiency can beachieved with just wages alone, or even wages com-
Community, societal and governmentalresponse to families struggling to achievefamily sustaining wages should beencouraged as supportive of the goal ofself-sufficiency.
bined with benefits. True self-sufficiency involves notjust a job with a certain wage and benefits, but ratherincome security for a family over time. Thus, the Self-Sufficiency Wage represents a larger goal toward whichone is striving, and is a process that one is engaged in,not a one-time achievement. As one person put it,“Self-sufficiency is a road I’m on.”8
Central to these efforts are access to education andtraining, access to jobs that provide real potential forskill development, and career advancement over thelong-term. For some, this may mean entering jobs thatare nontraditional for women, and for others it maymean developing their own small businesses as theirsole or an adjunct source of income. For many, if notmost, however, self-sufficiency is not achieved throughstopgap measures or short-term solutions. Most indi-viduals moving from welfare to work cannot achieve aSelf-Sufficiency Wage in a single step, but require theneeded assistance, guidance, transitional work subsidiesand the time necessary to become self-sufficient.
Although training and education do not have thesame urgency as do basic needs such as food andshelter, true long-term self-sufficiency increasinglynecessitates investments that enhance skills and adapt-ability. Without technologically sophisticated andbroad-based education—which provides the flexibilityto move into new jobs and careers—self-sufficiency isin danger of being at best a fleeting accomplishment.
Finally, the Self-Sufficiency Standard is not meantto imply that government subsidies and supports arenot appropriate for Washington families. Indeed, giventhe large number of families who have not yet achievedwage adequacy, temporary assistance in meeting thecosts of such high price items as child care, health care,and housing, is frequently the only viable means forthese families to have the necessary resources to securetheir basic needs.
Likewise, it is important to recognize that self-sufficiency does not imply that families should becompletely self-reliant and independent of one another,or the community at large. Indeed, it is through inter-dependence between families, and community institu-tions such as schools or religious institutions, as well asinformal networks of friends, family, and neighbors,that many are able to meet their non-economic needs aswell as economic necessities. Such support and help isessential to our well-being, psychologically as well asmaterially, and should be supported.
Nothing about the Self-Sufficiency Standardshould be taken to mean that such efforts to help eachother should be discouraged. Nor should the Standardbe understood as endorsing an ideal of self-dependencein complete isolation—we are not advocating a “LoneRanger” model for families. The Standard is a measureof income adequacy, not of family functioning. Like-wise, community, societal, and governmental responseto families struggling to achieve family sustainingwages should be encouraged as supportive of the goalof self-sufficiency.
The Self-Sufficiency Standard for Washington State Page 5
How the Self-Sufficiency Standard isCalculated
The goal of making the Standard as standardizedand accurate as possible, yet varied geographically andby age, requires meeting several different criteria. Asmuch as possible, the figures used here:
· are collected or calculated using standardizedor equivalent methodology,
· come from scholarly or credible sources, suchas the U.S. Bureau of the Census,
· are updated at least annually, and
· are age- and/or geographically-specific (whereappropriate).
Thus, costs that rarely have regional variation (suchas food) are usually standardized, while costs such ashousing and child care, which vary substantially, arecalculated at the most geographically- specific levelavailable.
For each county or sub-county area in Washington,the Self-Sufficiency Standard is calculated for 70different family types—all one-adult and two-adultfamilies, ranging from a single adult with no children,to one adult with one infant, one adult with onepreschooler, and so forth, up to two-adult families withthree teenagers. The costs of each basic need and theSelf-Sufficiency Wages for all 70 family types for allgeographic areas may be found in the Full Report. Wehave included the costs of each basic need and theSelf-Sufficiency Wages for eight selected family typesfor each county in Washington in the Appendix to thisreport.
The components of the Self-Sufficiency Standardfor Washington and the assumptions included in thecalculations are described below.
Housing: The Standard uses the Fiscal Year 2001Fair Market Rents for housing costs, which are calcu-lated annually by the U.S. Department of Housing andUrban Development for every metropolitan housingmarket and non-metropolitan county (totaling over 400housing market areas). Fair market rents are based ondata from the decennial census, the annual American
Housing Survey, and telephone surveys.9 The FairMarket Rents (which include utilities except telephoneand cable) are intended to reflect the cost of housingthat meets minimum standards of decency, but is notluxurious. They reflect the cost of a given size unit at the40th percentile level. (At the 40th percentile level, 40% ofthe housing in a given area would be less expensive thanthe FMR, while 60% would cost more than the FMR.
The Standard has recently incorporated PaymentStandards, which are adjustments to the FMR by localPublic Housing Authorities (PHA). Each PHA has theauthority to vary their payment standards by a range of 90-110%, based on the local market, and may do so in specificareas and even by size of unit. If there is a need to adjustthe FMRs even further (above 110%), the PHA may seekthe required approval from the state’s HUD office for an“exception” rent. Most exception rents are 120%, or the50th percentile, but they are defined as anything over110%.
The Self-Sufficiency Standard assumes that parentsand children do not share the same bedroom and thatthere are not more than two children per bedroom.Therefore, the Standard assumes that single personsand couples without children have one-bedroom units;10
families with one or two children require two bedrooms,and families with three children, three bedrooms.
Child Care: The Standard uses the most accurateinformation available that is recent, geographically-specific, and age- and setting- specific. In most states,this is the survey of child care costs originally mandatedby the Family Support Act, which provides the cost ofchild care at the 75th percentile, by age of child andsetting (family day care home, day care center, etc.).11
For Washington, the Standard uses the 3rd Quarter-Year 2000 Regional Market Rate (RMR) Ceilings,which are based on the results of a statewide survey ofover 8,400 child care providers conducted by theWashington State Child Care Resource and ReferralNetwork. The rates given are the DSHS reimbursementrates and are specified by age, setting, and county.
Page 6 The Self-Sufficiency Standard for Washington State
Because it is more common for very young childrento be in day care homes rather than centers,12 theStandard assumes that children less than three years ofage (infants and toddlers, called “infants” here) receivefull-time care in day care homes. Preschoolers (threethrough five years old), in contrast, are assumed to goto day care centers full-time. School-age children(ages six to 12) are assumed to receive part-time carein before- and after-school programs.
Food: Although the Thrifty Food Plan is used asthe basis of both the poverty thresholds and the FoodStamps allotments, the Standard uses the Low-CostFood Plan for food costs.13 While both of these USDAdiets meet minimum nutritional standards, the ThriftyFood Plan was meant for emergency use only, while theLow-Cost Food Plan is based on more realistic assump-tions about food preparation time and consumptionpatterns. Although the Low-Cost Food Plan amounts areabout 25% higher than the Thrifty Food Plan, they are
and moderate- income population.14 The city of Seattle is theonly area in Washington in which substantial numbers ofworkers use public transportation to get to and fromwork, with nearly 16% of those in the city of Seattleusing public transportation.
Elsewhere in the state, the proportion using publictransportation is much less, and therefore it is not areasonable assumption that workers would be able to getto work by public transportation. Therefore, we assumeonly workers living in the city of Seattle use publictransportation. For all others, it is assumed that adultsrequire a car to get to and from work; if there are twoadults in the family, we assume two cars. (It is unlikelythat two adults with two jobs would be traveling to andfrom the same place of work, at exactly the same time.)
Data for public transportation costs are based on thecost of a monthly pass for each adult. Private transpor-tation costs are based on the costs of owning andoperating an average car (or two cars, if there are twoadults). The costs include the fixed costs of owning a car(including fire and theft insurance, property damage andliability, license, registration, taxes, repairs, and financecharges), in addition to monthly variable costs (e.g., gas,oil, tires, and maintenance), but do not include the initialcost of purchasing a car.
To estimate fixed costs, we use the Consumer Expen-diture Survey amounts for families in the second quintile(those whose incomes are between the 20th and 40th
percentile) of income, by region. In Washington, there aredifferences in costs by region, with auto insurance costingmore in King and Pierce counties. Therefore, we variedthe insurance portion of the fixed costs by a ratio computedfrom a study of insurance costs differentials done by theOffice of the Insurance Commissioner for Washington andthe gas cost based on AAA Surveys.15 For varied costs,the Standard assumes that the car(s) will be used tocommute to and from work five days per week, plus onetrip per week per family for shopping for food and othererrands. (The commuting distance is computed using thestatewide average from the National Personal Transporta-tion Survey). In addition, one parent in each householdwith young children is assumed to have a slightly longerweekday trip to allow for “linking” trips to the day carecenter or home.
Health Care: Health care costs in the Standardinclude both the employee’s share of insurance premi-ums plus additional out-of-pocket expenses, such as co-payments, uncovered expenses (e.g., dental care andprescriptions), and insurance deductibles.
The Self-Sufficiency Standard iscalculated using scholarly or crediblesources from data that is collected at leastannually, is age- and geographically-specific (where appropriate), and iscollected or calculated using standardizedor equivalent methodology.
nevertheless conservative estimates of the level of foodexpenditures required to meet nutritional standards. TheLow-Cost Food Plan does not allow for any take-out, fast-food, or restaurant meals, even though, according to theConsumer Expenditure Survey, average Americanfamilies spend about 42% of their food budget on foodeaten away from home. Again, the choice to use thisfood budget reflects what it costs to adequately meetnutritional needs, not consumer behavior.
The food costs in the Standard are varied according to thenumber and age of children and the number and gender ofadults. Since there is little regional variation in the cost of foodoverall, the Standard uses the national average throughout theState of Washington.
Transportation: If there is an adequate public transporta-tion system in a given area, it is assumed that workers usepublic transportation to get to and from work. A publictransportation system is considered “adequate” if it is used bya substantial percentage of the population to get to work.According to one study, if about 7% of the total public usespublic transportation, that “translates” to about 30% of the low-

The Self-Sufficiency Standard for Washington State Page 7
Although workers who do not have employer-provided health insurance often “do without,” familiescannot be truly self-sufficient without health insurance.The Self-Sufficiency Standard assumes that the em-ployer provides health insurance coverage16 , and thatemployees pay a portion of the premium for coverage(usually about one-fourth of the cost for employee only,and about one-third for family coverage).17 The costs ofhealth insurance in Washington are based on data from theOffice of the Insurance Commissioner for Washingtonwhich was produced by the National Institute for HealthCare Management. To capture the geographical differ-ences in costs, we varied the health insurance premiumsby a ratio computed from available HMOs through theHealth Care Authority of Washington.
Data for out-of-pocket health care costs (by age)were obtained from the National Medical ExpenditureSurvey, adjusted by state using the Families USAreport, Skyrocketing Health Inflation: 1980–1993–2000, and adjusted for inflation using the MedicalConsumer Price Index (Medical CPI).
Miscellaneous: This expense category includes allother essentials such as clothing, shoes, paper products,diapers, nonprescription medicines, cleaning productsand household items, personal hygiene items, andtelephone. It does not allow for recreation, entertain-ment, or savings. Miscellaneous expenses are calcu-lated by taking 10% of all other costs. This percentageis a conservative estimate in comparison to estimates inother basic needs budgets, which usually use 15%.18
Taxes: Taxes include state sales tax, federal andstate income taxes, and payroll taxes. The retail salestax varies by locality from 7.5% to 8.6%, with no taxon food. Sales taxes are calculated only on “miscella-neous” items, as one does not ordinarily pay tax onrent, child care, and so forth. (As is the case in manystates, Washington does not tax services.) Indirecttaxes, e.g., property taxes paid by the landlord onhousing, are assumed to be included in the price ofhousing passed on by the landlord to the tenant. Also,taxes on gasoline and automobiles are included as acost of owning and running a car.
State income taxes are calculated using the Com-merce Clearinghouse State Tax Handbook as well astax forms from the Washington Department of Rev-enue. The federal income tax calculation assumes thestandard deduction and exemptions, and includes taxcredits, both refundable and nonrefundable.There is nostate income tax in Washington.
Payroll taxes for Social Security and Medicare arecalculated at 7.65% of each dollar earned. Although thefederal income tax rate is higher than the payroll tax rate—15% of income for families in this range—federal exemp-tions and deductions are substantial. As a result, familiesdo not pay federal income tax on the first $10,000 to$12,000 or more, thus lowering the effective federal taxrate to 7% to 10% for many taxpayers.
Earned Income Tax Credit (EITC): The EITC, oras it is sometimes called, the Earned Income Credit, is afederal tax refund intended to offset the loss of incomefrom payroll taxes owed by working-poor and near-poorfamilies. The EITC is “refundable”; that is, workingadults may receive the tax credit whether or not theyowe any federal taxes, adding to their income.
Child Care Tax Credit (CCTC): The CCTC is afederal tax credit that allows working parents to deducta percentage of their child care costs from the federalincome taxes they owe. Like the EITC, the CCTC isdeducted from the total amount of money a familyneeds to be self-sufficient. Unlike the EITC, the federalCCTC is not a “refundable” tax credit. A family mayonly receive the CCTC as a credit against federalincome taxes owed. Therefore, families who pay littleor no federal income taxes, receive little or no CCTC.
Child Tax Credit (CTC): The CTC is a federaltax credit that allows parents to deduct up to $500 perchild (for children less than 17 years old) from thefederal income taxes they owe. If a family has one ortwo children, it is calculated like the CCTC, as a creditagainst federal taxes owed. If the family does not owefederal taxes, or has already taken the CCTC and thereis no remaining liability (that is, no federal tax is owedafter the CCTC is taken), then the family is not eligiblefor the CTC. However, if there are three or morechildren, then the CTC becomes refundable (as with theEITC). In this case, the family may receive the credit(up to $500 per child), even if they do not owe anyfederal taxes. However, the amount of CTC theyreceive is limited to the amount their payroll taxexceeds the EITC that they have or will receive.Starting in 2002, the CTC will be refundable for thosewith earnings over $10,000.
Given the high costs of child care, most familieswith young children who pay market rate child careoffset most or all of the federal taxes they owe withtheir child care tax credit. However, those with olderchildren, or three or more children and higher incomes,are more likely to receive the CTC.
Page 8 The Self-Sufficiency Standard for Washington State
How Much Money is Enough inWashington State?
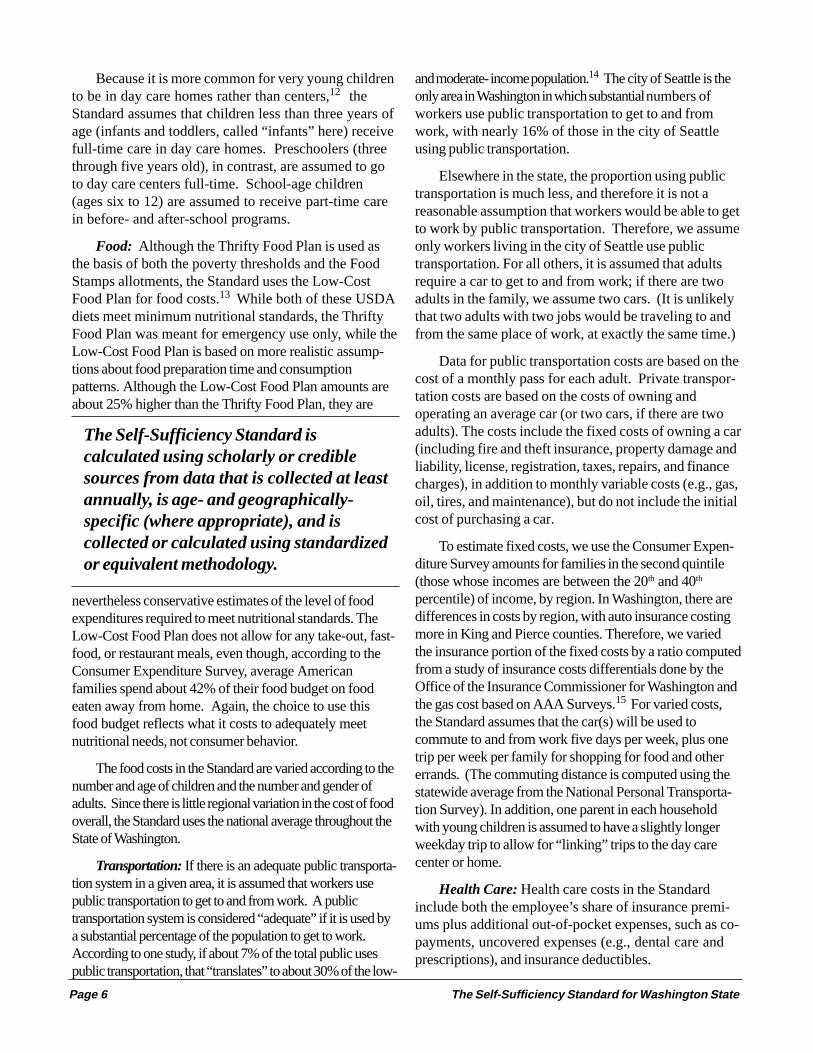
Because the Self-Sufficiency Standard varies byfamily type and location, the amount of money that afamily needs to be economically self-sufficient dependsupon family size and composition, the age of children,and where they live. In this section we present the costof living for four different places in Washington: King
County (East), Chelan County, Franklin County andSpokane County.
In King County (East), which includes Bellevue,Juanita, Kirkland and Renton, a single person with nochildren needs to earn $9.61 per hour to be able to
Monthly Costs Costs% oftotal
Costs% oftotal
Costs% oftotal
Costs% oftotal
Housing $767 45% $971 32% $971 27% $971 23%
Child Care $0 0% $650 21% $1,025 28% $1,025 25%
Food $168 10% $255 8% $379 10% $521 13%
Transportation $259 15% $265 9% $265 7% $457 11%
Health Care $69 4% $201 7% $222 6% $278 7%
Miscellaneous $126 7% $234 8% $286 8% $325 8%
Taxes** $301 18% $555 18% $658 18% $725 18%
Earned IncomeTax Credit (-)
$0 0% $0 0% $0 0% $0 0%
Child CareTax Credit (-)
$0 0% -$40 -1% -$80 -2% -$80 -2%
Child Tax Credit (-) $0 0% -$42 -1% -$83 -2% -$83 -2%
Total Percent — 100 — 100 — 100 — 100Self -Sufficiency Wage - Hourly*** $9.61 $17.33 $20.70 $11.76 per adult
- Monthly $1,691 $3,050 $3,644 $4,139
- Annual $20,287 $36,599 $43,728 $49,669
* The Standard is calculated by adding expenses and taxes and subtracting tax credits. ** Taxes (including federal income tax and federal tax credits) consist of federal and state payroll taxes and sales taxes.
Table 1The Self-Sufficiency Standard for Selected Family Types
in King County (East), WA, 2001*Seattle-Bellevue-Everett, WA PMSA
Monthly Expenses and Shares of Total Budgets
One AdultOne Adult,
One Preschooler
One Adult,One Preschooler,One Schoolage
Two Adults,One Preschooler,One Schoolage
*** The hourly wage is calculated by dividing the monthly wage by 176 hours (8 hours per day times 22 days per month).Note: Totals may not add exactly due to rounding.

The Self-Sufficiency Standard for Washington State Page 9
child care stay the same), but the amount each wouldneed to earn is about one-fifth over the amount a singleparent would need to earn: $11.76 per hour.
In Chelan County (see Table 2), the costs aresignificantly less than the costs in King County (East),for each family type. Thus a single adult’s Self-Sufficiency Wage is $6.23 per hour (since the Washing-ton state minimum wage is $6.72 per hour in 2001, thismeans that the single adult would need to work aminimum of 37 rather than 40 hours per week, to meet
meet her/his basic needs, as can be seen in the firstcolumn of Table 1 (previous page). While these costs arehigh, a single parent with one preschooler needs to earnalmost double this amount, $17.33 per hour to meet thebasic needs of her family.19 If she has two children, onepreschooler and one schoolage child, she would needover twice as much, $20.70 per hour to meet herfamily’s needs. Finally, if there are two adults supportingtwo children, a preschooler and a school-age child, costsare increased slightly for additional food, health care, andmiscellaneous costs, (the major costs of housing and
Monthly Costs Costs% oftotal
Costs% oftotal
Costs% oftotal
Costs% oftotal
Housing $382 35% $497 26% $497 23% $497 18%
Child Care $0 0% $429 22% $594 27% $594 21%
Food $168 15% $255 13% $379 17% $521 19%
Transportation $230 21% $236 12% $236 11% $416 15%
Health Care $69 6% $201 11% $222 10% $278 10%
Miscellaneous $85 8% $162 8% $193 9% $231 8%
Taxes** $162 15% $290 15% $324 15% $408 15%
Earned IncomeTax Credit (-)
$0 0% -$71 -4% -$99 -4% $0 0%
Child CareTax Credit (-)
$0 0% -$46 -2% -$84 -4% -$80 -3%
Child Tax Credit (-) $0 0% -$42 -2% -$55 -3% -$83 -3%
Total Percent — 100% — 100 — 100 — 100Self -Sufficiency Wage - Hourly*** $6.23 $10.86 $12.54 $7.90 per adult
- Monthly $1,096 $1,911 $2,207 $2,781
- Annual $13,158 $22,931 $26,489 $33,374
* The Standard is calculated by adding expenses and taxes and subtracting tax credits. ** Taxes (including federal income tax and federal tax credits) consist of federal and state payroll taxes and sales taxes.
Table 2The Self-Sufficiency Standard for Selected Family Types
in Chelan County, WA, 2001*Monthly Expenses and Shares of Total Budgets
One AdultOne Adult,
One Preschooler
One Adult,One Preschooler,One Schoolage
Two Adults,One Preschooler,One Schoolage
*** The hourly wage is calculated by dividing the monthly wage by 176 hours (8 hours per day times 22 days per month).Note: Totals may not add exactly due to rounding.
Page 10 The Self-Sufficiency Standard for Washington State
his/her needs). The single parent must earn an additional$4.00 per hour, or $10.86 per hour. The single parentwith two children in Chelan County would need toearn $12.54 per hour to meet her family’s needs (seeTable 2). In the two-parent family, each adult wouldneed to earn $7.90 per hour.
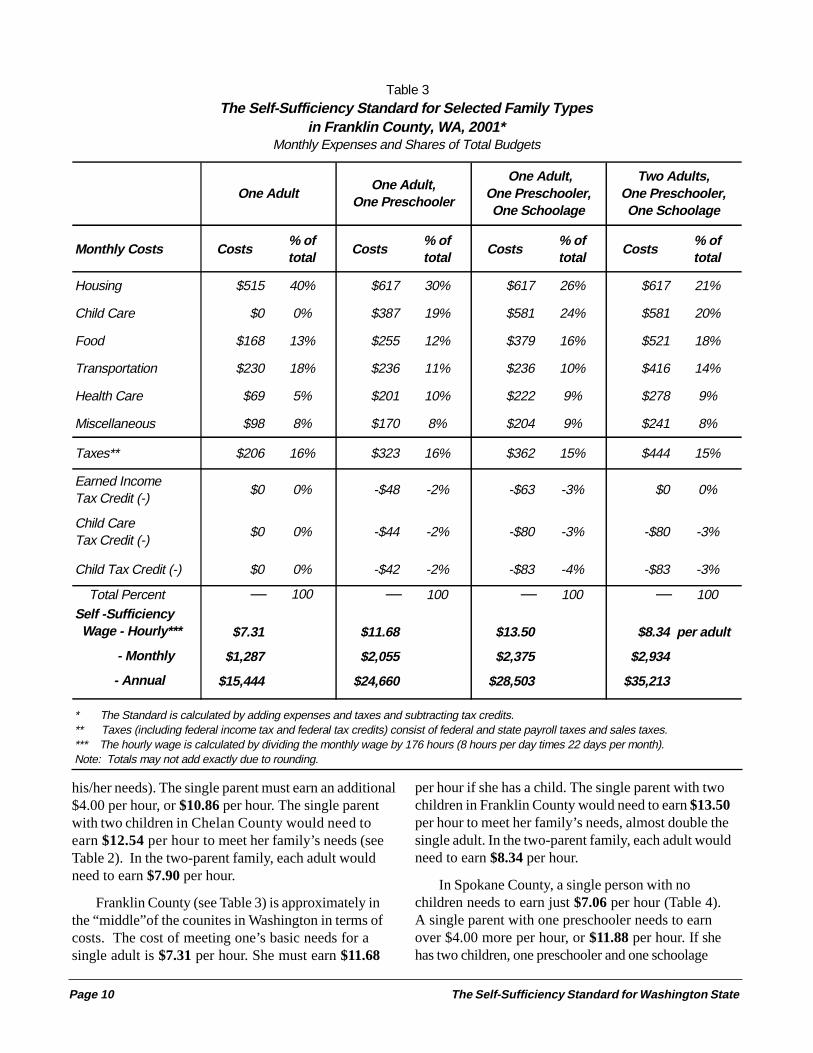
Franklin County (see Table 3) is approximately inthe “middle”of the counites in Washington in terms ofcosts. The cost of meeting one’s basic needs for asingle adult is $7.31 per hour. She must earn $11.68
per hour if she has a child. The single parent with twochildren in Franklin County would need to earn $13.50per hour to meet her family’s needs, almost double thesingle adult. In the two-parent family, each adult wouldneed to earn $8.34 per hour.
In Spokane County, a single person with nochildren needs to earn just $7.06 per hour (Table 4).A single parent with one preschooler needs to earnover $4.00 more per hour, or $11.88 per hour. If shehas two children, one preschooler and one schoolage
Monthly Costs Costs% oftotal
Costs% oftotal
Costs% oftotal
Costs% oftotal
Housing $515 40% $617 30% $617 26% $617 21%
Child Care $0 0% $387 19% $581 24% $581 20%
Food $168 13% $255 12% $379 16% $521 18%
Transportation $230 18% $236 11% $236 10% $416 14%
Health Care $69 5% $201 10% $222 9% $278 9%
Miscellaneous $98 8% $170 8% $204 9% $241 8%
Taxes** $206 16% $323 16% $362 15% $444 15%
Earned IncomeTax Credit (-)
$0 0% -$48 -2% -$63 -3% $0 0%
Child CareTax Credit (-)
$0 0% -$44 -2% -$80 -3% -$80 -3%
Child Tax Credit (-) $0 0% -$42 -2% -$83 -4% -$83 -3%
Total Percent — 100 — 100 — 100 — 100Self -Sufficiency Wage - Hourly*** $7.31 $11.68 $13.50 $8.34 per adult
- Monthly $1,287 $2,055 $2,375 $2,934
- Annual $15,444 $24,660 $28,503 $35,213
* The Standard is calculated by adding expenses and taxes and subtracting tax credits. ** Taxes (including federal income tax and federal tax credits) consist of federal and state payroll taxes and sales taxes.
Table 3The Self-Sufficiency Standard for Selected Family Types
in Franklin County, WA, 2001*Monthly Expenses and Shares of Total Budgets
One AdultOne Adult,
One Preschooler
One Adult,One Preschooler,One Schoolage
Two Adults,One Preschooler,One Schoolage
*** The hourly wage is calculated by dividing the monthly wage by 176 hours (8 hours per day times 22 days per month).Note: Totals may not add exactly due to rounding.

The Self-Sufficiency Standard for Washington State Page 11
child, she would need to earn over twice the amount of thesingle adult, or $14.23 per hour. In the two-parent family,each adult would need to earn $8.61 per hour.
In Washington, the cost of living is highest in thelarge urban counties (see Tables 1 through 4), especiallyin the eastern portions of King County. Because bothchild care and housing costs are lower in less expensiveareas of Washington compared to higher cost areas, andthese two costs account for the majority of the budget,the proportions spent in each cost area do not varygreatly from place to place. Among families with just
one infant or preschool-age child, housing costs inWashington average over a fourth of costs—about 26 to32%, while child care is somewhat lower—19 to 22%.For families with two children, however, child care costsexceed housing costs (except in Franklin County), withchild care costing from 24 to 28% of the family budget,more than the 23 to 27% that goes to housing costs,depending on the place.
While the rent for a two-bedroom housing unitvaries from a low of $497 per month (Chelan County)to a high of $971 per month (King County -East), the
Monthly Costs Costs% oftotal
Costs% oftotal
Costs% oftotal
Costs% oftotal
Housing $480 39% $580 28% $580 23% $580 19%
Child Care $0 0% $440 21% $680 27% $680 22%
Food $168 14% $255 12% $379 15% $521 17%
Transportation $234 19% $240 11% $240 10% $420 14%
Health Care $69 6% $201 10% $222 9% $278 9%
Miscellaneous $95 8% $172 8% $210 8% $248 8%
Taxes** $196 16% $332 16% $393 16% $466 15%
Earned IncomeTax Credit (-)
$0 0% -$42 -2% -$36 -1% $0 0%
Child CareTax Credit (-)
$0 0% -$44 -2% -$80 -3% -$80 -3%
Child Tax Credit (-) $0 0% -$42 -2% -$83 -3% -$83 -3%
Total Percent — 100 — 100 — 100 — 100Self -Sufficiency Wage - Hourly*** $7.06 $11.88 $14.23 $8.61 per adult
- Monthly $1,243 $2,091 $2,505 $3,029
- Annual $14,910 $25,094 $30,063 $36,349
* The Standard is calculated by adding expenses and taxes and subtracting tax credits. ** Taxes (including federal income tax and federal tax credits) consist of federal and state payroll taxes and sales taxes.
Table 4The Self-Sufficiency Standard for Selected Family Types
in Spokane County, WA, 2001*Spokane, WA PMSA
Monthly Expenses and Shares of Total Budgets
One AdultOne Adult,
One Preschooler
One Adult,One Preschooler,One Schoolage
Two Adults,One Preschooler,One Schoolage
*** The hourly wage is calculated by dividing the monthly wage by 176 hours (8 hours per day times 22 days per month).Note: Totals may not add exactly due to rounding.
Page 12 The Self-Sufficiency Standard for Washington State
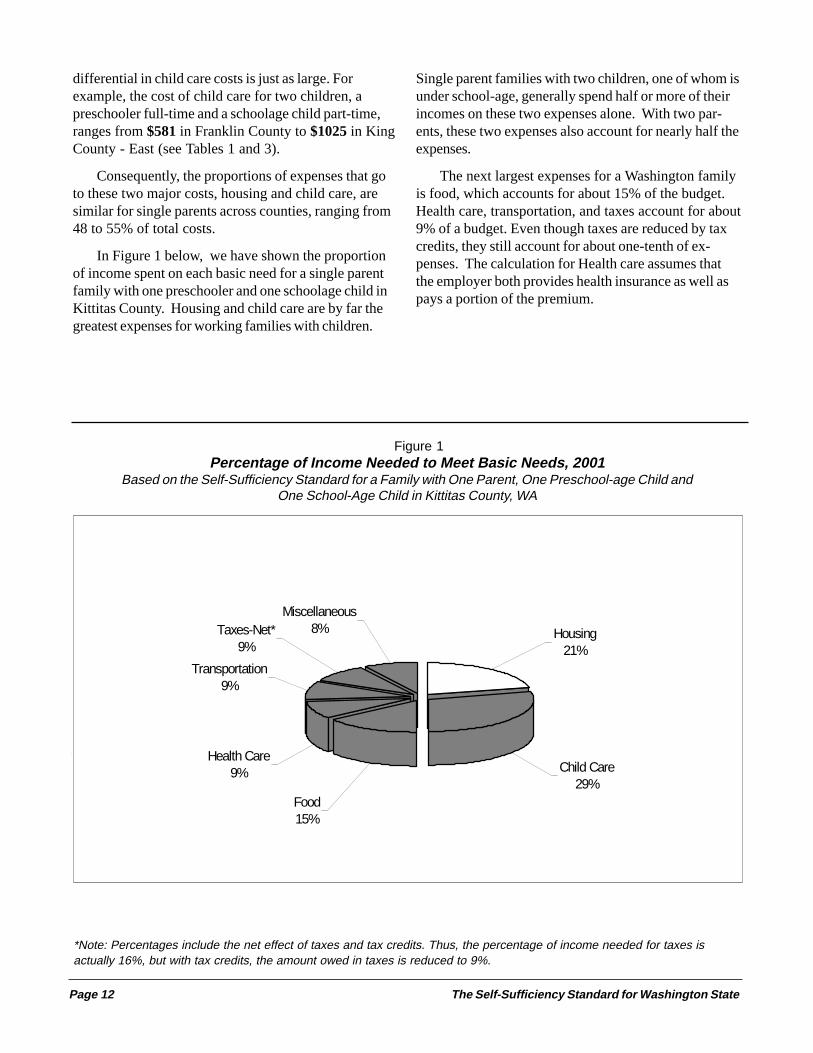
Figure 1Percentage of Income Needed to Meet Basic Needs, 2001
Based on the Self-Sufficiency Standard for a Family with One Parent, One Preschool-age Child andOne School-Age Child in Kittitas County, WA
*Note: Percentages include the net effect of taxes and tax credits. Thus, the percentage of income needed for taxes isactually 16%, but with tax credits, the amount owed in taxes is reduced to 9%.
differential in child care costs is just as large. Forexample, the cost of child care for two children, apreschooler full-time and a schoolage child part-time,ranges from $581 in Franklin County to $1025 in KingCounty - East (see Tables 1 and 3).
Consequently, the proportions of expenses that goto these two major costs, housing and child care, aresimilar for single parents across counties, ranging from48 to 55% of total costs.
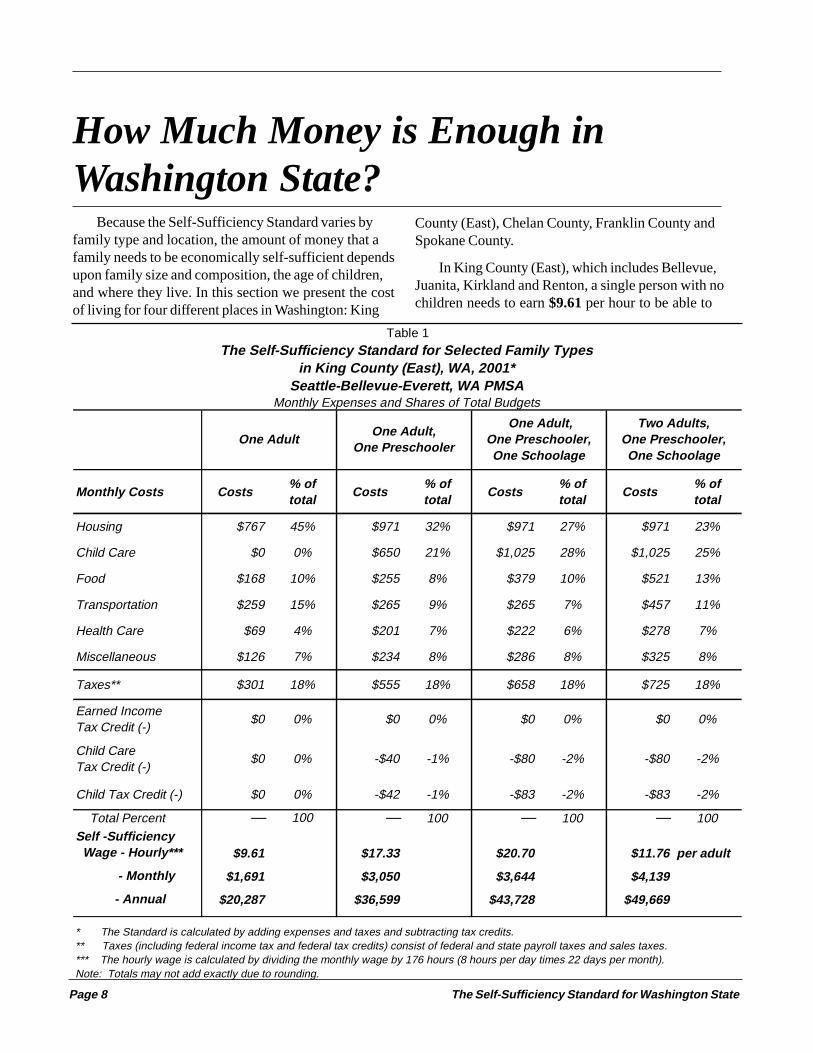
In Figure 1 below, we have shown the proportionof income spent on each basic need for a single parentfamily with one preschooler and one schoolage child inKittitas County. Housing and child care are by far thegreatest expenses for working families with children.
Single parent families with two children, one of whom isunder school-age, generally spend half or more of theirincomes on these two expenses alone. With two par-ents, these two expenses also account for nearly half theexpenses.
The next largest expenses for a Washington familyis food, which accounts for about 15% of the budget.Health care, transportation, and taxes account for about9% of a budget. Even though taxes are reduced by taxcredits, they still account for about one-tenth of ex-penses. The calculation for Health care assumes thatthe employer both provides health insurance as well aspays a portion of the premium.
Health Care 9% Child Care
29%
Housing21%
Miscellaneous8%Taxes-Net*
9%
Food 15%
Transportation9%

The Self-Sufficiency Standard for Washington State Page 13
Comparing the Standard to OtherBenchmarks of Income
To put the Standard in context, it is useful tocompare it to other commonly used measures ofincome adequacy. In Figure 2 above we have com-pared the Standard to four other benchmarks: thewelfare grant package, the federal poverty measure,the Washington minimum wage, and median income.This set of benchmarks is not meant to show how afamily would move from welfare or poverty to self-sufficiency. Rather, the concept of self-sufficiencyassumes a gradual progression, one that takes placeover time. (Please see the next two sections for a more
detailed discussion of how Washington families canachieve Self-Sufficiency Wages).
For purposes of comparison, we use the Standardfor a three-person family consisting of one adult, onepreschooler, and one school-age child living in ThurstonCounty. (The other benchmarks presented are also forthree-person families; however, none is as specific as theStandard in terms of age and number of children, and/orgeographic location.) The Standard for this family type,in Thurston County, Washington, is $33,420.
Figure 2The Self-Sufficiency Standard Compared to Other Benchmarks, 2001
Based on the Self-Sufficiency Standard for a Family with One Parent, One Preschooler andOne School-Age Child in Thurston County, WA
* Note: Full-time minimum wage is the year 2001 Washington minimum wage of $6.72 per hour, and includes the net effect of the additionof the Earned Income Tax Credit and the subtraction of taxes.
$10,241
$14,630$16,726
$33,420
$46,700
$-
$5,000
$10,000
$15,000
$20,000
$25,000
$30,000
$35,000
$40,000
$45,000
$50,000
Welfare and FoodStamps
Federal PovertyLine
Full-Time MinimumWage*
Self-SufficiencyWage
Median FamilyIncome
80%
50%
$37,360
$23,350

Page 14 The Self-Sufficiency Standard for Washington State
A family with one parent, one preschool-age child and one school-age child spendsmore than half of its monthly budget onhousing and child care.
The Welfare (TANF) Grant and Food Stamps:Including the cash value of Food Stamps as well as thecash TANF grant, the total assistance package is $853per month in Thurston County or $10,241 per yearassuming no wage or other income. This amount is lessthan one-third (31%) of the Self-Sufficiency Standardfor a three-person family in Thurston County.
Federal Poverty Level: Not surprisingly, theStandard is quite a bit higher than the official povertylevel for a family of three. A family consisting of oneadult and two children would be considered “poor,”according to federal guidelines, if this family had amonthly income of $1,219 ($14,630 annually) or less—regardless of where they live, or the age of their chil-dren. Thus, the official poverty level for a three- personfamily is less than half (44%) of the Self-SufficiencyWage actually needed for a three-person family (withone adult, one preschooler and one school-age child).Even in the least expensive jurisdiction in Washington,such as Chelan County, the official poverty guideline isonly about 55% of the amount needed to meet familyneeds according to the Standard. And in East KingCounty, the federal poverty level is just over one-fourth(34%) of the Self-Sufficiency Standard.
Minimum Wage: A full-time worker at the Wash-ington minimum wage of $6.72 per hour (effectiveJanuary 1, 2001) earns about $1,165 per month or$13,978 per year. Subtracting taxes—payroll (SocialSecurity), and federal and state income taxes—andadding tax credits—the child care, child, and federal
either the Child Care Tax Credit or the Child TaxCredit.)
Even with the help of the federal EITC, however, afull-time job with the minimum wage provides only one-half (50%) of the amount needed to be self-sufficient.If we assume that she pays taxes, but does not receivethe EITC payments on a monthly basis—as is true ofmost workers—she will only receive $12,908 duringthe year, which is just over one-third of the Self-Sufficiency Standard (39%). For all three of thesebenchmarks there is an unusually large gap (comparedto other states) between each of them and the Self-Sufficiency Wage.
Median Family Income: Median family income(half of an area’s families have incomes above thisamount and half have incomes below this amount) is arough measure of the relative cost of living in an area.The median income for a three-person family inThurston County is $46,700. The Self-SufficiencyStandard for a single-parent family with one preschoolerand one school-age child is thus 72% of the medianfamily income for Thurston County.
The U.S. Department of Housing and UrbanDevelopment (HUD) uses area median family incomeas a standard to assess families’ needs for housingassistance. Those with incomes below 50% of themedian area income are considered “Very Low In-come,” while those with incomes below 80% of themedian are considered “Low Income.” (Almost allassistance is limited to the “Very Low Income” cat-egory, and even then, only about one-fourth of thoseeligible families receive housing assistance.) Thus, theSelf-Sufficiency Standard for a Thurston County familyfalls just below the HUD definition of “Low Income.” Inmost states and localities, the Self-Sufficiency Standardfalls between 50% and 80% of area median income. Thatit is closest to the 80%-of-area-median-income/“LowIncome” standard used by HUD suggests both that asubstantial portion of Washington families lack adequateincome to meet their needs, and that using area medianincome as a benchmark of income inadequacy (in thiscase, inadequate income to meet housing needs) is at timesan imperfect measure of need for support.
Earned Income Tax Credits—this worker would have acash income of $1,394 per month, or $16,726 per year.This amount is more than her earnings alone because thefederal and state EITC benefit for which she qualifies isthe maximum, and is more than the taxes she owes. (Atthis income level, this worker only has to pay sales andpayroll taxes—her income is below the threshold forpaying federal income taxes. Nevertheless, because shedoes not pay federal income taxes, she does not receive
The Self-Sufficiency Standard for Washington State Page 15
Comparing the Standard for WashingtonCities to other Major Cities
With this report for Washington, the Self-SufficiencyStandard has now been completed for 16 states orcities. Because the Self-Sufficiency Standard uses thesame methodology across states, the cost of meetingbasic needs for a given family type can be directlycompared. However, since the Standard has been donein different years in the various places, it is necessaryto update the numbers to the year 2001. While over along period of time, costs are likely to increase atdifferent rates, for our purposes here, it is acceptable touse the overall Consumer Price Index (for the appropri-ate region or city) to update the Standards to makethem comparable.
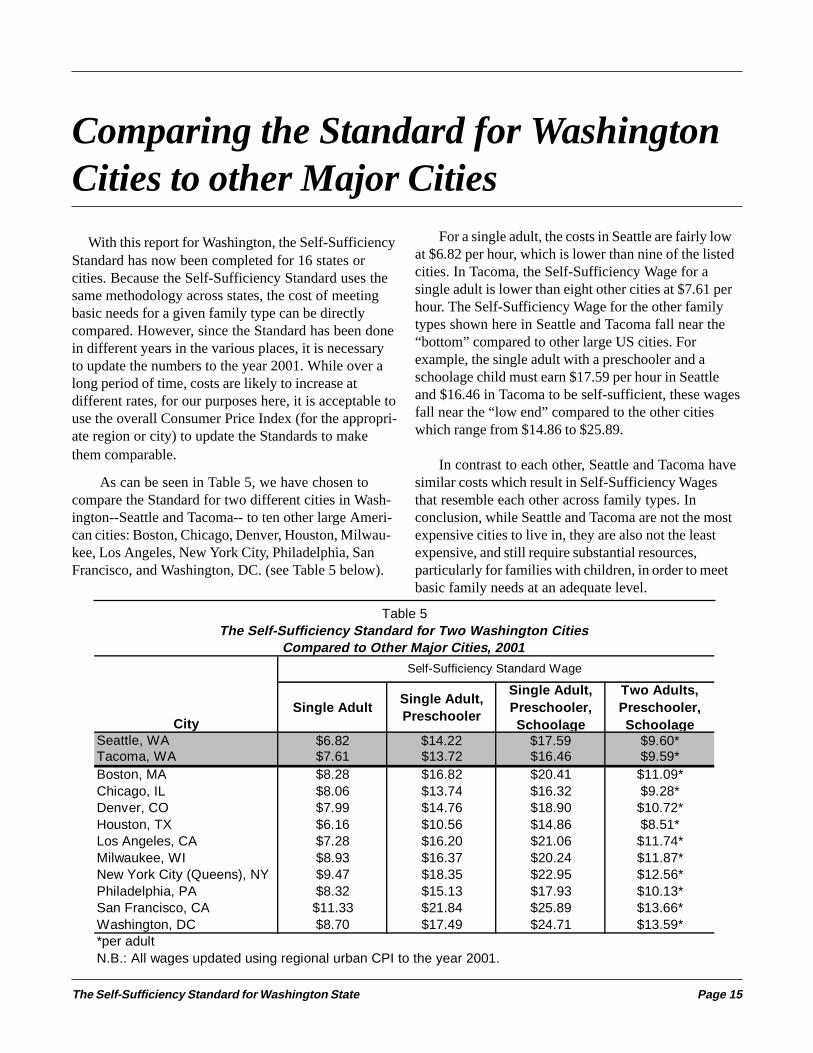
As can be seen in Table 5, we have chosen tocompare the Standard for two different cities in Wash-ington--Seattle and Tacoma-- to ten other large Ameri-can cities: Boston, Chicago, Denver, Houston, Milwau-kee, Los Angeles, New York City, Philadelphia, SanFrancisco, and Washington, DC. (see Table 5 below).
For a single adult, the costs in Seattle are fairly lowat $6.82 per hour, which is lower than nine of the listedcities. In Tacoma, the Self-Sufficiency Wage for asingle adult is lower than eight other cities at $7.61 perhour. The Self-Sufficiency Wage for the other familytypes shown here in Seattle and Tacoma fall near the“bottom” compared to other large US cities. Forexample, the single adult with a preschooler and aschoolage child must earn $17.59 per hour in Seattleand $16.46 in Tacoma to be self-sufficient, these wagesfall near the “low end” compared to the other citieswhich range from $14.86 to $25.89.
In contrast to each other, Seattle and Tacoma havesimilar costs which result in Self-Sufficiency Wagesthat resemble each other across family types. Inconclusion, while Seattle and Tacoma are not the mostexpensive cities to live in, they are also not the leastexpensive, and still require substantial resources,particularly for families with children, in order to meetbasic family needs at an adequate level.
City Single Adult
Single Adult, Preschooler
Single Adult, Preschooler, Schoola ge
Two Adults, Preschooler, Schoola ge
Seattle, WA $6.82 $14.22 $17.59 $9.60*Tacoma, WA $7.61 $13.72 $16.46 $9.59*Boston, MA $8.28 $16.82 $20.41 $11.09*Chicago, IL $8.06 $13.74 $16.32 $9.28*Denver, CO $7.99 $14.76 $18.90 $10.72*Houston, TX $6.16 $10.56 $14.86 $8.51*Los Angeles, CA $7.28 $16.20 $21.06 $11.74*Milwaukee, WI $8.93 $16.37 $20.24 $11.87*New York City (Queens), NY $9.47 $18.35 $22.95 $12.56*Philadelphia, PA $8.32 $15.13 $17.93 $10.13*San Francisco, CA $11.33 $21.84 $25.89 $13.66*Washington, DC $8.70 $17.49 $24.71 $13.59**per adult
Table 5The Self-Sufficiency Standard for Two Washington Cities
Compared to Other Major Cities, 2001
N.B.: All wages updated using regional urban CPI to the year 2001.
Self-Sufficiency Standard Wage

Page 16 The Self-Sufficiency Standard for Washington State
Closing the Gap Between Incomes andthe Self-Sufficiency Standard
Of course, many families do not earn Self-Suffi-ciency Wages, particularly if they have recently entered(or reentered) the workforce, or live in high-cost areas.Therefore, they cannot afford their housing and foodand child care—much less their other basic needs.They must choose between needs, or accept substan-dard or inadequate child care, insufficient food, orsubstandard housing.
This wage gap presents states and localities with achallenge of how to aid families who are striving forself-sufficiency, especially families whose incomes maybe above the “poverty” level and/or assistance eligibilitylevels, yet fall below what is needed for self-suffi-ciency. While many have benefited from the opportuni-ties produced by the expanding economy, helpingfamilies achieve self-sufficiency will be an even greaterchallenge in the future in the advent of economicdownturns and/or those who have exhausted their timelimits on welfare.
The two basic strategies to close this gap in incomeare to (1) raise wages and/or (2) reduce coststhrough supports—public and/or private, in cash or“in kind.” On the one hand, there are a number ofstrategies that may help individuals to raise their wages.On the other hand, families may be provided with otherresources, in cash or in kind, in the form of subsidies orother supports, that help fill the gap between theirearnings and their families’ needs.
These two approaches are not mutually exclusive,but in fact can, and should, be used as appropriate,sequentially or in tandem. Thus, some parents mayreceive education and training, followed by jobs that aresupplemented by supports (if necessary) until theirwages reach the self-sufficiency level. Alternatively,individual parents may combine work and study fromthe outset. Whatever choices are made, parents shouldbe able to choose the path to self-sufficiency that bestsafeguards their family’s well-being and allows them tobalance work, education and family responsibilities.
Raising WagesTraining and Education: Adults who have lan-
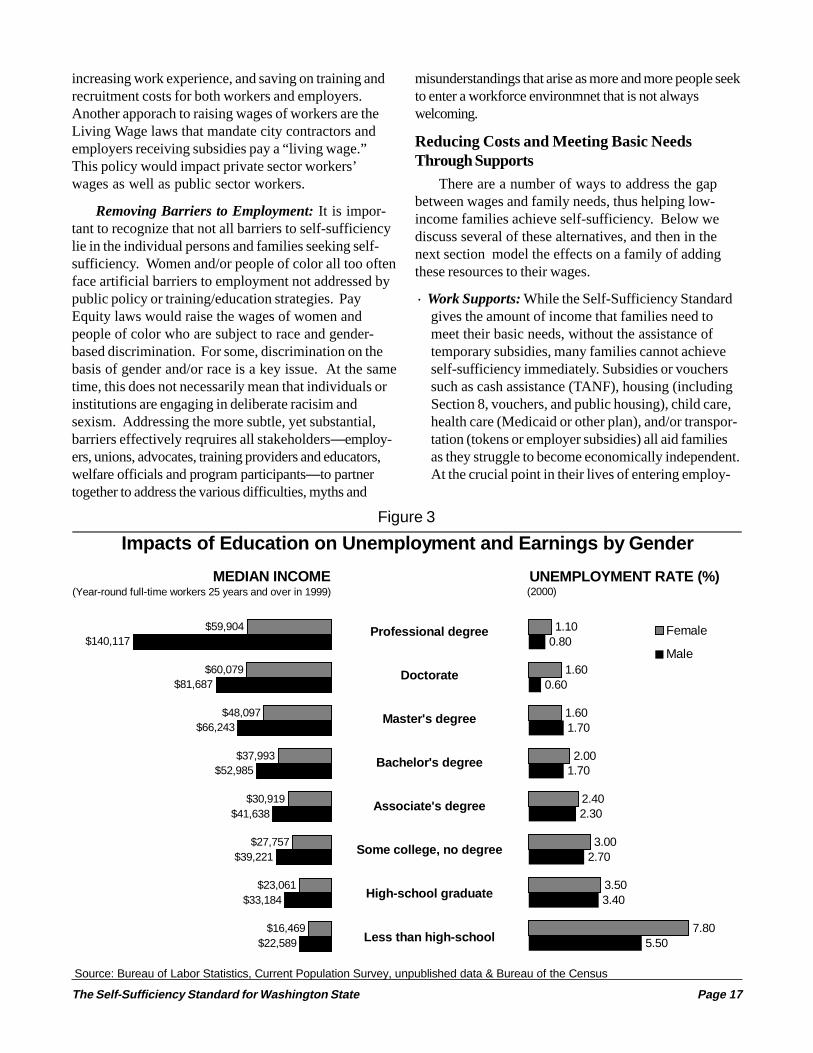
guage difficulties, inadequate education, or who lack jobskills or experience, cannot achieve Self-SufficiencyWages without first addressing access to training andeducation. Training and education are often key toentering occupations and workplaces that will eventu-ally, if not immediately, pay Self-Sufficiency Wages (seeFigure 3 on following page). For some, this may meanESL (English as a Second Language), Adult BasicEducation (ABE) and/or the GED (General EducationDegree). For others, this may mean two- or four-yeardegrees.
The development of an educated workforce isnecessary for many employers to remain competitive.Indeed, businesses have long invested heavily ineducation and training for their skilled workers in orderto take advantage of new technology. Expandingincumbent worker training results in increased produc-tivity as well as increased efficiency and higher wages.
Access to Nontraditional Jobs: For many women,nontraditional jobs (such as construction, copy machinerepair, X-ray technician, or computer-aided drafting)require relatively little post-secondary training, yet providewages at self-sufficiency levels. To enhance women’saccess to these jobs—or training leading to these jobs—requires addressing a range of barriers that preventwomen from entering and remaining in nontraditionaloccupations. Similarly, problems of sexual and racialharassment must be addressed in order for women and/orminorities to fully realize their potential.
Labor Market Reforms: As can be seen in Tables1 through 4, even two parents working full-time must earnwell above the federal minimum wage to meet theirfamily’s basic needs. Raising the minimum wage, particu-larly in high cost areas, is essential because it raises the“floor” for wages, and therefore affects many workers’earnings. Higher wages also have a positive impact onboth workers and their employers by reducing turnover,
The Self-Sufficiency Standard for Washington State Page 17
increasing work experience, and saving on training andrecruitment costs for both workers and employers.Another apporach to raising wages of workers are theLiving Wage laws that mandate city contractors andemployers receiving subsidies pay a “living wage.”This policy would impact private sector workers’wages as well as public sector workers.
Removing Barriers to Employment: It is impor-tant to recognize that not all barriers to self-sufficiencylie in the individual persons and families seeking self-sufficiency. Women and/or people of color all too oftenface artificial barriers to employment not addressed bypublic policy or training/education strategies. PayEquity laws would raise the wages of women andpeople of color who are subject to race and gender-based discrimination. For some, discrimination on thebasis of gender and/or race is a key issue. At the sametime, this does not necessarily mean that individuals orinstitutions are engaging in deliberate racisim andsexism. Addressing the more subtle, yet substantial,barriers effectively reqruires all stakeholders—employ-ers, unions, advocates, training providers and educators,welfare officials and program participants—to partnertogether to address the various difficulties, myths and
misunderstandings that arise as more and more people seekto enter a workforce environmnet that is not alwayswelcoming.
Reducing Costs and Meeting Basic NeedsThrough Supports
There are a number of ways to address the gapbetween wages and family needs, thus helping low-income families achieve self-sufficiency. Below wediscuss several of these alternatives, and then in thenext section model the effects on a family of addingthese resources to their wages.
· Work Supports: While the Self-Sufficiency Standardgives the amount of income that families need tomeet their basic needs, without the assistance oftemporary subsidies, many families cannot achieveself-sufficiency immediately. Subsidies or voucherssuch as cash assistance (TANF), housing (includingSection 8, vouchers, and public housing), child care,health care (Medicaid or other plan), and/or transpor-tation (tokens or employer subsidies) all aid familiesas they struggle to become economically independent.At the crucial point in their lives of entering employ-
Impacts of Education on Unemployment and Earnings by Gender
UNEMPLOYMENT RATE (%) (2000)
Professional degree
Doctorate
Master's degree
Bachelor's degree
Associate's degree
Some college, no degree
High-school graduate
Source: Bureau of Labor Statistics, Current Population Survey, unpublished data & Bureau of the Census
(Year-round full-time workers 25 years and over in 1999) MEDIAN INCOME
Less than high-school$22,589
$33,184
$39,221
$41,638
$52,985
$66,243
$81,687
$140,117
$16,469
$23,061
$27,757
$30,919
$37,993
$48,097
$60,079
$59,904
5.50
3.40
2.70
2.30
1.70
1.70
0.60
0.80
7.80
3.50
3.00
2.40
2.00
1.60
1.60
1.10 Female
Male
Figure 3
Page 18 The Self-Sufficiency Standard for Washington State
ment, such subsidies can help a family achievestability, without scrimping on nutrition, or living inovercrowded or substandard housing, or usinginadequate child care. This stability can help a familymaintain employment, which is a necessary conditionfor improving wages.
· Child Support: While not an option for all families,whenever possible child support from absent, non-custodial parents should be sought. Higher unem-ployment rates and lower wages among some groupsmay result in lesser amounts of child support.Nevertheless, whatever the amount, child supportpayments reduce the amount required for a family tomeet its needs, while providing the support of bothparents to meet children’s needs.
· Health Care Coverage: While health care ex-penses are a relatively small cost item in most ofthese family type budgets (less than 10%), health carecoverage is essential. The Standard assumes that a
Self-Sufficiency Wage includes employer-provided(and partially financed) health insurance. Withouthealth benefits, parents have to make the difficultchoice between (1) not working and retaining eligibil-ity for health care coverage (through welfare/Medic-aid), and (2) employment without health care cover-age for their families.
However, with the expansions in Medicaid andthe state-subsidized Child Health Insurance Pro-gram—known as CHIP in Washington—manyfamilies now have the option of covering theirchildren’s health care needs when their employerdoes not offer family coverage. Families who enterthe workforce from welfare are eligible for contin-ued coverage by Medicaid for themselves and theirchildren for one full year. After that, and for thosefamilies not transitioning from welfare, children canbe covered by Medicaid or by CHIP, depending uponeach child’s age, family income and size.20

The Self-Sufficiency Standard for Washington State Page 19
Modeling the Impact of Supports onWages Required to Meet Basic Needs
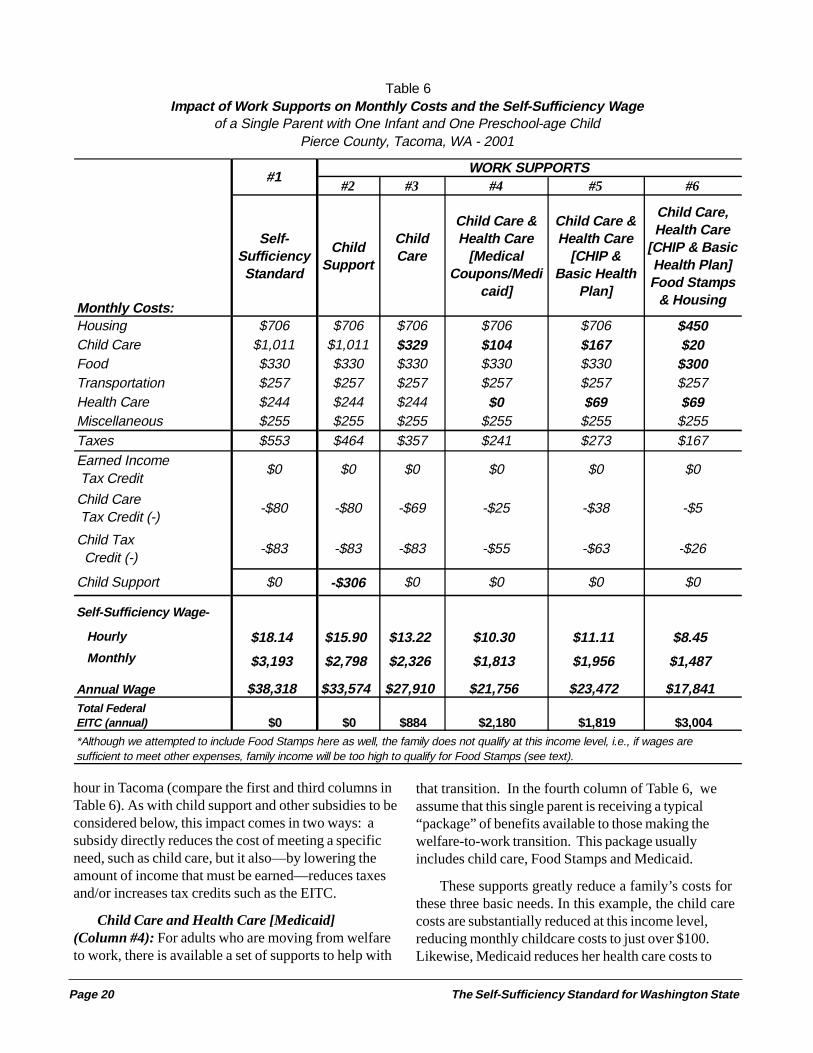
In Table 6, we examine the effect of adding subsi-dies and supports for a family consisting of a singleparent and two children, an infant and a preschooler,living in Tacoma, Pierce County.
Treatment of Tax Credits. Although we includethe Earned Income Tax Credit (when a family qualifies)in the calculation of the Self-Sufficiency Standard, inthis model we want to show only income that is in factlikely to be available to families each month to meettheir needs. Although by law, a family can receive partof the federal EITC to which they are entitled on amonthly basis, the great majority (approximately 99%)of families receive the EITC as a lump sum payment thefollowing year when they file their tax returns.21
While this money is frequently used, according toresearch, to meet important family needs, such as asecurity deposit for housing, to buy a car, to settle debts,to pay tuition, or to start a savings account, it is notavailable to meet daily or monthly needs.22 Also, formany workers, it is difficult to gauge how much theEITC will total, because of fluctuating hours andwages, and sometimes job and/or wage changes,throughout the year.
We show the federal EITC only in terms of thetotal amount of EITC for which this family wouldqualify when they file their taxes the following year, ifthey worked at this wage for the entire year. (See thesecond line from the bottom of Table 6.) On the lastline of Table 6, the amount that is shown is whatWashington workers would receive if there was aWashington EITC set at 15% of the federal EITC.Note that because these amounts are not receivedduring the month or year shown here, they are notincluded in the calculation of the wages shown.
The Self-Sufficiency Standard (Column #1): Inthe first column of Table 6, the Standard provides thefull amount of this family’s expenses, including taxes,without any subsidies or supports to reduce these costs(except tax credits where applicable). In Tacoma, withchild care expenses of $1,011 per month and housing
costs of $706 per month, it is not surprising that theSelf-Sufficiency Wage is $18.14 per hour.
Private Supports:Child Support (Column #2): In the second
column of Table 6, the private “subsidy” of childsupport is added. The amount of $306 shown in Table6 is the average child support payments per month, perfamily (not per child) in Washington state.23 Unlikeadditional earned income, child support is not reducedby taxes, and therefore it has a stronger impact onhelping families meet their needs.
Not only does child support reduce the amount thatmust be earned, but it changes taxes and tax credits aswell. Taxes decrease from $553 in Tacoma in Column#1—when all income is earned, to $464—when someincome is received as child support. Note that alto-gether, these changes reduce the amount this singleparent must earn to meet her family’s needs by morethan two dollars, from $18.14 to $15.90 per hour inTacoma. Nonetheless, it does not reduce the wageneeded to meet living costs enough to qualify for EITC.
Public Work Supports:Child Care (Column #3): In the third column, we
show the effect of the Washington state child careprogram, Working Connections, available to low-incomefamilies, that is, families with incomes below 225% of theFederal Poverty Level. This subsidy substantially reduceschild care costs for this family, by about $700, to $329 permonth in Tacoma. The child care co-payment amounts(parent’s fee) are based on a formula, in which the parentpays $10 if family’s countable income falls at or below82% of the Federal Poverty Level ($968 for a family ofthree), or pays a minimum of $20 per month if familyincome is between 82% and 137.5% of the FPL, and upto $474 per month if family income is between 137.5%and 225% of the FPL ($20 plus 44% of your incomeabove 137.5% of the FPL).
This subsidy in turn reduces the Self-Sufficiencywage by well over one-third, from $18.14 to $13.22 per
Page 20 The Self-Sufficiency Standard for Washington State
hour in Tacoma (compare the first and third columns inTable 6). As with child support and other subsidies to beconsidered below, this impact comes in two ways: asubsidy directly reduces the cost of meeting a specificneed, such as child care, but it also—by lowering theamount of income that must be earned—reduces taxesand/or increases tax credits such as the EITC.
Child Care and Health Care [Medicaid](Column #4): For adults who are moving from welfareto work, there is available a set of supports to help with
that transition. In the fourth column of Table 6, weassume that this single parent is receiving a typical“package” of benefits available to those making thewelfare-to-work transition. This package usuallyincludes child care, Food Stamps and Medicaid.
These supports greatly reduce a family’s costs forthese three basic needs. In this example, the child carecosts are substantially reduced at this income level,reducing monthly childcare costs to just over $100.Likewise, Medicaid reduces her health care costs to
#2 #3 #4 #5 #6
Self-Sufficiency Standard
Child Support
Child Care
Child Care & Health Care
[Medical Coupons/Medi
caid]
Child Care & Health Care
[CHIP & Basic Health
Plan]
Child Care, Health Care
[CHIP & Basic Health Plan] Food Stamps
& Housing
Housing $706 $706 $706 $706 $706 $450Child Care $1,011 $1,011 $329 $104 $167 $20Food $330 $330 $330 $330 $330 $300Transportation $257 $257 $257 $257 $257 $257Health Care $244 $244 $244 $0 $69 $69Miscellaneous $255 $255 $255 $255 $255 $255Taxes $553 $464 $357 $241 $273 $167Earned Income Tax Credit
$0 $0 $0 $0 $0 $0
Child Care Tax Credit (-)
-$80 -$80 -$69 -$25 -$38 -$5
Child Tax Credit (-)
-$83 -$83 -$83 -$55 -$63 -$26
Child Support $0 -$306 $0 $0 $0 $0
Self-Sufficiency Wage-
Hourly $18.14 $15.90 $13.22 $10.30 $11.11 $8.45 Monthly $3,193 $2,798 $2,326 $1,813 $1,956 $1,487
Annual Wage $38,318 $33,574 $27,910 $21,756 $23,472 $17,841Total Federal EITC (annual) $0 $0 $884 $2,180 $1,819 $3,004*Although we attempted to include Food Stamps here as well, the family does not qualify at this income level, i.e., if wages are sufficient to meet other expenses, family income will be too high to qualify for Food Stamps (see text).
#1
Monthl y Costs:
Table 6Impact of Work Supports on Monthly Costs and the Self-Sufficiency Wage
of a Single Parent with One Infant and One Preschool-age ChildPierce County, Tacoma, WA - 2001
WORK SUPPORTS

The Self-Sufficiency Standard for Washington State Page 21
zero. However, in order to be eligible for Food Stamps,gross family income must be less than 130% of thefederal poverty threshold. Yet, if this parent’s wage is tobe sufficient to meet her housing and other necessities,even with the help of child care assistance and Medicaid,it would exceed the Food Stamps gross income limit.Thus, in Tacoma, this single parent would not be eligiblefor Food Stamps.
Although this family would not receive the ChildCare Tax Credit or Food Stamps, this is more than madeup by the two subsidies she does receive. By substan-tially lowering the income that must be earned to pay forchild care and health care, these two work supports alsodecrease the taxes owed by more than the decreased taxcredits. Altogether, this lowers the wages required tomeet basic needs to $10.30 per hour in Tacoma, whichis almost one-half of the full Self-Sufficiency Wage.The EITC to which she is entitled is substantial, totalingalmost $2200.
It should be noted that we attempted to model thesesubsidies together with a partial TANF cash grant. Wefound that families would lose any cash benefit beforetheir combined income was enough to meet their needs,even with the help of work supports. That is, underWashington state earned income disregard rules,families may keep (or have disregarded) 50% of theirearnings. As earnings increase, their cash grant de-creases, until their earnings reach about double thegrant, at which point the cash grant becomes zero. Inour model, even with the help of these work supports(child care, Food Stamps and Medicaid), parent’searnings must be considerably more than double thecash grant in order to meet their needs.
Earlier research showing that parents could com-bine work and cash assistance was based on theexperience of families under AFDC, prior to TANF. Atthat time, there were different rules regarding earnings,especially in the first few months, and cash benefitswere generally higher relative to costs then is truetoday.24 Also, some families combined welfare andwork as sources of income, but not at the same time.They did so by alternating between periods of work andwelfare. Of course, families may use this strategytoday, although this may not be as viable a strategyunder TANF as it was under AFDC. Under TANF,each month on welfare, no matter how small the cashgrant, counts against their lifetime limit of five years inWashington. Using such a strategy creates other prob-lems such as securing adequate child care for shortperiods of employment.
Child Care and Health Care [CHIP & BasicHealth Plan] (Column #5): After one year, theparent making the transition from welfare to work losesMedicaid coverage for her whole family, although she iseligible for CHIP for health insurance coverage for herchildren (if family income remains below 250% ofpoverty). In the fifth column of Table 6, we model thischange by assuming that the children’s health carecosts (including both insurance and out-of-pocket costs)are covered by CHIP. The parent’s cost is not cov-ered, however, so the parent must pay for her share ofthe health insurance premium that is available throughher employer, or through the Basic Health Plan as wellas out-of-pocket costs for herself, which totals $69 permonth in Tacoma.
Although not by itself a large amount, as a result ofthe loss of Medicaid coverage for herself, she mustincrease her earnings by 81 cents per hour to $11.11per hour in Tacoma, just to be able to meet her needs atthe same level as when Medicaid covered all of herfamily’s health care costs.
Child Care, Food Stamps, Health Care [CHIP& Basic Health Plan], and Housing (Column #6):In the sixth column, we have assumed that she receiveschild care assistance and Medicaid, and that shereceives housing assistance as well. The housing aid(whether in the form of a Section 8 Housing ChoiceVoucher or other assistance) reduces her housing coststo 30% of her income, which is less than half of whatshe had been paying. These work supports togetherlower the income she must earn to meet her family’sother needs enough so that she now qualifies for apartial Food Stamps benefit as well. Altogether, theaddition of housing aid, combined with the other in-creased work supports, reduces what she must earn bymore than one-half, reducing the Self-Sufficiency Wageto $8.45 per hour in Tacoma.
The figures in Table 6 provide examples for onefamily—a single parent with one infant and one pre-school-age child, living in Tacoma in Pierce County.The impact of various work supports and taxes variesin different communities and family types, depending oncost levels and policy choices. What is clear from thisexample is that public policy choices can have asubstantial impact on the ability of families to becomeself-sufficient, assisting families who receive the sup-ports for which they are eligible.
By temporarily aiding families with work supportsuntil they are able to earn Self-Sufficiency-level Wages,
Page 22 The Self-Sufficiency Standard for Washington State
families are able to meet their needs adequately as theyenter or re-enter the workforce. Meeting their basic needsmeans that they are more likely to be able to achievestability in their housing, child care, diet, and health care.This in turn helps support their achieving stable employ-ment, depending on the state of the economy. Thus,carefully targeted programs and tax policies can play animportant role in helping families become fully self-sufficient.
Unfortunately, the various work supports modeledhere are not available to all who need them:
· Nationally, only about 12% of eligible familiesreceive housing assistance or live in public hous-ing.25
· Between 1996 and 2000, the number of peoplereceiving Food Stamps dropped by 8.6 million,according to the U.S. Department of Agriculture.Although some of this decline was due to theimproving economy, a GAO report concluded thatthe decline was greater than would be expectedaccording to economic indicators, and the UrbanInstitute reported that about two-thirds of those thatleft the Food Stamps program as they left welfare,remained eligible.27
· Only 10% of about 15 million eligible children arereceiving child care subsidies nationwide; in Wash-ington state, 25% of eligible children are receivingchild care assistance.28
· CHIP serves approximately 4,445 children inWashington.29 Washington’s Medical AssistanceAdministration estimate that approximately 14,500uninsured children were eligible for CHIP when theprogram was implemented in 2000; this constitutesapproximately 7.8% (March/April 1998) of allchildren in households with incomes between 200%and 250% of the FPL.30
· Although 58% of custodial parents had childsupport awards, only 34% received at least part ofthe child support payment owed them, and less than20% received the full amount owed. Not surpris-ingly, the average monthly child support payment of$309 represents just 17% of a single mother’s, and11% of a single father’s income.31 In Washington,the average child support amount is $306 permonth.32
The Self-Sufficiency Standard for Washington State Page 23
How the Self-Sufficiency Standard CanBe Used
The Self-Sufficiency Standard can be usedin a variety of settings: to assist welfareclients choosing the best route out ofpoverty, to help organizations better targettheir education and training resources, toaid policy makers analyze proposals on taxpolicy, programs and economicdevelopment.
different options. The discussion below should be seenas a partial list of options, as new uses and applicationsof the Standard continue to emerge.
The Self-Sufficiency Standard as a Policy ToolThe Self-Sufficiency Standard has a number of uses
in the development and evaluation of policy in differentareas. The Standard is a key component, for example,in the Targeted Jobs Strategy. This strategy uses theStandard to assess the ability of various jobs, occupa-tions, and sectors to provide self-sufficient wages forworkers. The Standard is used together with analysis ofthe current local labor market supply and demand (todetermine jobs that have expanding but unfilled open-ings), an assessment of the available job training andeducation infrastructure, and an evaluation of the skills
and location of current/potential workers. Through suchan analysis, it is possible to assess the jobs and sectorson which to target training and counseling resources.
The Standard has also been used to evaluateeconomic development proposals. By using theStandard to determine if the wages paid by newbusinesses seeking tax breaks and other governmentsubsidies are at or above self-sufficiency, it can bedetermined if these proposed enterprises will requiresupports to the workers as well. Thus, such proposalscan be evaluated as to their net positive or negativeeffect on the local economy as well as the well-being ofthe potential workers and their families.
The Standard has also been used to evaluate theimpact of proposed policy changes. As shown in thisreport (see Table 6), the Standard can be used toevaluate the impact of restructuring work supportprograms, changing co-payment schedules, or imple-menting tax reforms of various kinds. With the Stan-dard it is possible not only to show the direct impact onfamily incomes, but to model the effects of the interac-tion of taxes, tax credits, and, where applicable, subsi-dies. It can similarly be used to look at the impact ofchanging program rules–-such as requiring parents toenter employment when their youngest child reachesthe age of three years instead of the current 12months–-on both individual families and state budgets.
The Standard can be used to target education andjob training investments. Given the Self-SufficiencyWages for most family types, the Standard can help—make the case for investing in various types of post-secondary education and training, including in non-traditional occupations for women and minorities, whichprovide access to a wide range of jobs paying Self-Sufficiency Wages.
The Self-Sufficiency Standard as a Guideline forWage-Setting
By determining the wages necessary to meet basicneeds, the Standard provides information for settingminimum wage standards. It was used precisely this
The Self-Sufficiency Standard is relevant to a rangeof issues and arenas, providing crucial information aboutwage adequacy to help design strategies for self-suffi-ciency. The Standard can be used in a variety ofsettings: from welfare clients choosing the best route outof poverty for themselves and their families, to organiza-tions weighing investment in various education andtraining opportunities, to state-level policymakers facingcritical policy choices on tax policy, subsidies, welfare-to-work programs, economic development plans,education and training.
At a time when many policy and programmaticdecisions are being made at the state and local levels, theStandard provides a tool and a means to evaluate many

Page 24 The Self-Sufficiency Standard for Washington State
way by the Center for the Child Care Workforce, whichdeveloped specific guidelines for each county/schooldistrict in California for child care workers’ salaries. Ithas also been used by private agencies, such as Commu-nity Action Agencies, to evaluate the adequacy of theirown salary schedules. The Standard can and has beenused in communities elsewhere to advocate for higherwages through Living Wage ordinances and in negotiatinglabor union agreements.
The Self-Sufficiency Standard as a Benchmarkfor Evaluation
The Standard can be used to evaluate outcomes for awide range of programs that result in employment, fromshort-term job search and placement programs, toprograms providing extensive education or job training.By evaluating outcomes in terms of self-sufficiency,programs are using a measure of true effectiveness.That is, for each participant, the question asked is howclose the wages achieved are to the family’s Self-Sufficiency Wage and thus how does the programimpact on the ability of these adults to meet theirfamilies’ needs adequately. Such evaluations can helpredirect resources to the types of approaches that resultin improved outcomes for participants.
The Self-Sufficiency Standard as a CounselingTool
The Standard can and has been used as a counsel-ing tool, to help participants in work and training pro-grams make choices among various occupations andjobs. The Standard has also been used to develop theSelf-Sufficiency Standard Budget Worksheet, which is atool that counselors and clients can use to “test” theability of various wages to meet a family’s self-suffi-ciency needs. With the information provided by theStandard, clients can make informed decisions aboutwhat kinds of training would most likely lead to Self-Sufficiency Wages and/or which jobs would best providethe resources they need. Alternatively, the Standardcan help participants determine in what ways micro-enterprise or Individual Development Account strategiesmay, alone or together with paid employment, provide apath to self-sufficiency for themselves and their fami-lies.
The Budget Worksheet also provides both counselorsand clients with information on available programs and
work supports, integrating in one place a wide range ofpossibilities not usually brought together—even thoughclients often must coordinate these various programs intheir lives.
The Self-Sufficiency Standard as a PublicEducation Tool
The Standard is an important public education tool.It helps the public at large understand what is involvedin making the transition to self-sufficiency. For employ-ers, it shows the importance of providing benefits,especially health care, that help families meet theirneeds and protect against health crises becomingeconomic crises. By demonstrating how the various
The Self-Sufficiency Standard shows that,for most families, earnings that are abovethe official poverty level—or are highenough to disqualify them form welfare—are nevertheless far below what they needto meet their families’ basic needs.
components fit together, it helps facilitate the coordina-tion of various providers of services and supports, bothpublic and private, such as child care providers, com-munity organizations and education and training organi-zations.
The Self-Sufficiency Standard in ResearchBecause the Self-Sufficiency Standard provides an
accurate and specific (both geographically, and interms of the age of children) measure of incomeadequacy, it is finding increasing use in research onincome adequacy and poverty. Since it has long beenknown that living costs differ greatly between differentlocalities, the Self-Sufficiency Standard provides ameans of estimating the true level of “poverty,” orincome inadequacy, and how this differs from place toplace, and among different family types. In addition,the Standard provides a means to measure the ad-equacy of various work supports, such as child supportor child care assistance—given a family’s income, placeof residence, and composition.

The Self-Sufficiency Standard for Washington State Page 25
ConclusionWith the passage of the 1996 welfare legislation—
particularly with the advent of work requirements andtime limits—helping participants become self-sufficienthas become a top priority. The Self-Sufficiency Standarddocuments the cost of living that families of differentsizes must meet to live independently, without public orprivate assistance. The Self-Sufficiency Standard showsthat, for most families, earnings that are above the officialpoverty level or earnings that are high enough to dis-qualify them from welfare are nevertheless far belowwhat they need to meet their families’ basic needs.
The Standard is currently being used to betterunderstand issues of income adequacy, to analyze policyand to help individuals striving for self-sufficiency.Community organizations, academic researchers, policyinstitutes, legal advocates, training providers, communityaction agencies, and state and local officials, amongothers, are using the Standard.
The Standard has been calculated for a number ofother states, including California, Colorado, Connecti-cut, Illinois, Indiana, Iowa, Massachusetts, New Jersey,New York, North Carolina, Pennsylvania, SouthDakota, Texas, Wisconsin, and the Washington, DCmetropolitan area.
For further information about the Standard, or tolearn about how to have the Standard developed foryour community or state, contact Jennifer Brooks atWider Opportunities for Women at (202) 638-3143 orDr. Diana Pearce at [email protected] or (206)616-2850. For further information on the findings andimplications of the Self-Sufficiency Standard forWashington, or to order the full Standard for Washing-ton, contact Sara Fleming Merten or Michael Ramos atthe Washington Association of Churches at (206) 625-9790.

The Self-Sufficiency Standard for Washington State Page 27
Endnotes 1 Anonymous quote in Elizabeth A. Gowdy and Susan R.Pearlmutter, “Economic Self-Sufficiency is a Road I’m On:The Results of Focus Group Research with Low-IncomeWomen,” in Liane V. Davis, ed., Building on Women’sStrengths: A Social Work Agenda for the Twenty-FirstCentury (New York: The Haworth Press, 1994), p. 93.
2 See for example, William O’Hare, Taynia Mann, KathrynPorter and Robert Greenstein, Real Life Poverty inAmerica: Where the American Public Would Set thePoverty Line, Center on Budget and Policy Priorities, July1990.
3 Using the Fair Market Rents for two-bedroom units, whichis the cost of housing including utilities at the 40th percen-tile (see below for further explanation) housing in the mostexpensive place, Marin County, CA, part of the San Fran-cisco metropolitan area, cost $1,362. This is almost fourtimes as much as the least expensive housing, found in ruralAlabama, such as Barbour County, where a two-bedroomunit costs $347 per month.
4 One of the first was Patricia Ruggles, author of Drawingthe Line. Ruggles’ work and the analyses of many others aresummarized in Constance Citro and Robert Michael, eds.,Measuring Poverty: A New Approach, Washington, DC:National Academy Press, 1995.
5 The Basic Needs Budget was developed by Trudi Renwickand Barbara Bergmann. See Barbara Bergmann and TrudiRenwick, “A Budget-Based Definition of Poverty: With anApplication to Single-Parent Families,” The Journal ofHuman Resources, Vol.28, No.1, p.1-24, Winter 1993. LivingWage campaigns exist in many states and/or cities, withmany of them developing an estimate of the minimum wagefor several family types in their area/state.
6 Boston Globe, 9/25/98.
7 While the majority of employed women with children under18 years of age work full-time (about 70% of married mothers,and 80% of single mothers), working part-time is clearly thedesirable option under many circumstances—such as whenthe children are very young, or in need of special care, oraffordable/appropriate child care is not available. For manylow-income mothers it is equally clear that economic neces-sity, as well as the new requirements under TANF, precludethis option.
8 Quoted in Gowdy and Pearlmutter, op.cit., p. 91.
9 These costs are based on a survey of units that have beenon the market within the last two years, and exclude both
new housing (two years old or less), and substandard andpublic housing.
10 Because of the lack of availability of efficiencies in someareas, and their very uneven quality, it was decided to useone-bedroom units for the single adult and childless couple.
11 Under the 1988 Family Support Act (which was supercededby the Personal Responsibility and Work OpportunityReconciliation Act, passed in 1996), states were required tofund or reimburse child care needed by those on welfare (orleaving welfare) at market rate, which was defined as the 75thpercentile, for the age of child, setting, and location. Moststates conducted surveys of costs, or commissioned childcare referral networks or researchers to do these studies
12 Child care centers are more frequently used for olderchildren (two to four years old) than for infants (J.R. Veumand P. M. Gleason. October, 1991. “ Child Care Arrangementsand Costs.” Monthly Labor Review. p. 10-17.) However,particularly for younger children and lower-income parents,relative care (other than the parent) accounts for significantamounts of child care for children under three (27% comparedto 17% in family day care and 22% in child care centers). Itshould be noted that relative day care is usually, but notalways, in the relative’s home, and is usually, though notalways, paid; thus it more closely resembles (and mayactually be) day care homes rather than day care centers. Forchildren three years and older, the predominant child carearrangement is the child care center, accounting for 45% ofthe care (compared to 14% in family child care, and 17% inrelative care.) See J. Capizzano, G. Adams, and F. Sonenstein.March 2000. Child Care Arrangements for Children underFive: Variation across States. Washington, DC: The UrbanInstitute. National Survey of America’s Families, Series B, No.b-7.
13 Because the USDA does not produce annual averages forfood costs, the Standard follows the Food Stamps Programand uses the costs for June as an annual average.
14 See C. Porter and E. Deakin. December 1995. Socioeco-nomic and Journey-to-Work Data: A Compendium for the35 Largest U.S. Metropolitan Areas. Berkely, CA: Instituteof Urban and Regional Development, University of Californiaat Berkley.
15 Premium Comparison of Largest Auto InsuranceWriters in Washington.Washington InsuranceCommissioner's Office: www.insurance.state.pa.us/html/cauto.html

Page 28 The Self-Sufficiency Standard for Washington State
16 According to the Bureau of Labor Statistics, 83% of non-temporary workers have health insurance provided throughtheir employer.
17 A. Foster Higgins & co., Inc., Tables: National Sureveyof Employer-Sponsored Health Plans, 1993-1996(Princeton, NJ: A. Foster Higgins & Co., Inc., 1994-1997),and William M. Mercer, Inc., Tables: National Survey ofEmployer-Sponsored Health Plans, 1997 and 1998, (NewYork, NY: William M. Mercer, Inc., 1998 and 1999).
18 See Citro and Michael, op.cit.
19 In the report, single parents are referred to as “she”because over 90% of single parents are women.
20 Under Medicaid, children from birth through their firstbirthday are covered up to 200% of poverty; children fromage one through age five, up to 133% of poverty, andchildren age six through 19, up to 100% of poverty. UnderHealthy Families, health care coverage is provided forchildren in families with net incomes (after certain deduc-tions, such as for child care) that is less than 250% ofpoverty, with some families paying a small premium up to amaximum of $27 per family).
21 Of returns filed in 1999, only 183,859 taxpayers reportedhaving received advanced EIC payments out of more than 15million families with children receiving the EITC. (Num-bers cited by Rosa Castaneda of the Center on Budget andPolicy Priorities, based on data reported in the IRS incomeTax Section is “Monthly Operational Review of EarnedIncome Credit.”)
22Although some workers may be unaware of the advancedpayment option, and others have employers who do notparticipate, there is strong evidence that receiving the EITCas a “lump sum” is the preferred option, and indeed familiesmake financial decisions based on its receipt (together withtax refunds) when they file their taxes early in the followingyear. See J. L. Romich and T. Weisner. October 1999. HowFamilies View and Use the EITC: The Case for Lump-sumDelivery. Paper delivered at Northwestern University, JointCenter for Poverty Research Conference on The EarnedIncome Tax Credit: Early Evidence.
23 March 2001 data from the Department of Child Support,Department of Social and Health Services (DSHS).
24 Roberta Spalter-Roth, Beverly Burr, Heidi Hartmann, andLois Shaw, with Jill Braunstein and Robin Dennis. (1995).Welfare that Works: The Working Lives of AFDC Recipients.Washington, D.C.: Institute for Women’s Policy Research.Also, Roberta Spalter-Roth, Income Packages Among Low-Income Single-Mother Families: Economic Well-Being andIncome Security, presented at the Coalition on Human Needs,3/29/96.
25 U.S. Department of Housing and Urban Development,Assisted Housing 1999.
26 A. Kevin Williams, PhD. The Long Wait: The CriticalShortage of Housing in California. June 2000.
27 “Current News and Analysis: 8.6 Million Fewer FoodStamp Participants in March 2000 than March 1996, YetStudies Show Persistent Need”, http://www.frac.org/html/news/fsmar00nos.html. Also see Sheila R. Zedlewski andSarah Brauner, Are the Steep Declines in Food StampParticipation Linked to Falling Welfare Caseloads? TheUrban Institute: Assessing the New Federalism, Nationalsurvey of America’s Families (NSAF). Series B, No. B-3,November 1999.
28 Access to Child Care for Low-Income Working Families.Child Care Bureau, Administration for Children andFamilies, U.S. Health and Human Services. (http://www.acf.dhhs.gov/programs/ccb/research/ccreport/ccreport.htm#8). For Washington, the number of childrenreceiving CCDF subsidies from April to September 1998was used along with the state’s eligibity rules effectiveOctober 1997 to calculate this percentage.
29Medical Assistance Managed Care Enrollees InCapitated Plans and Primary Care Case Management.Department of Social and Health Services, Medical Assis-tance Administration. August 2001.
30State of Washington SCHIP Annual Report. DSHS,Medical Assistance Administration. January 2001.
31Lydia Scoon-Rogers, Child Support for Custodial Mothersand Fathers: 1995. U.S. Bureau of the Census, CurrentPopulation Reports (P60-196, March 1999).
32 Department of Child Support, DSHS, March 2001.
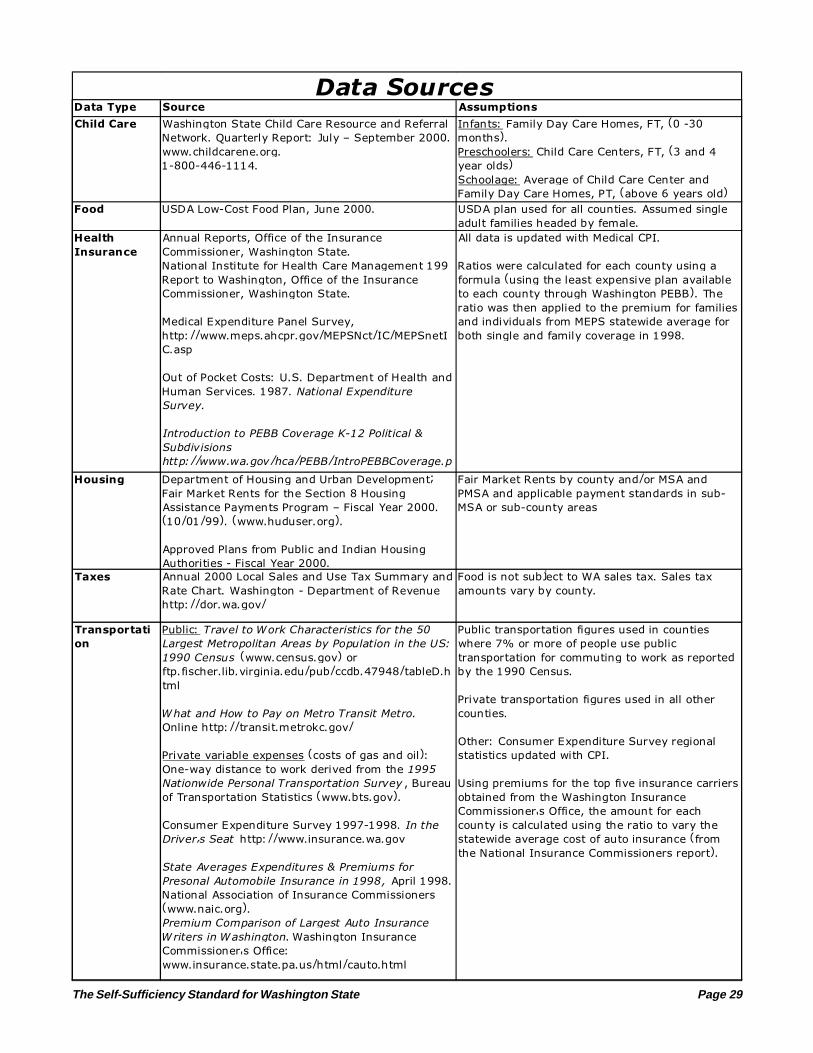
The Self-Sufficiency Standard for Washington State Page 29
Data Type Source Assumptions
Child Care Washington State Child Care Resource and Referral
Network. Quarterly Report: July � September 2000.
www.childcarene.org.
1-800-446-1114.
Infants: Family Day Care Homes, FT, (0 -30
months).
Preschoolers: Child Care Centers, FT, (3 and 4
year olds)
Schoolage: Average of Child Care Center and
Family Day Care Homes, PT, (above 6 years old)
Food USDA Low-Cost Food Plan, June 2000. USDA plan used for all counties. Assumed single
adult families headed by female.
Health
Insurance
Annual Reports, Office of the Insurance
Commissioner, Washington State.
National Institute for Health Care Management 199
Report to Washington, Office of the Insurance
Commissioner, Washington State.
Medical Expenditure Panel Survey,
http://www.meps.ahcpr.gov/MEPSNct/IC/MEPSnetI
C.asp
Out of Pocket Costs: U.S. Department of Health and
Human Services. 1987. National Expenditure
Survey.
Introduction to PEBB Coverage K-12 Political &
Subdivisions
http://www.wa.gov/hca/PEBB/IntroPEBBCoverage.p
df
All data is updated with Medical CPI.
Ratios were calculated for each county using a
formula (using the least expensive plan available
to each county through Washington PEBB). The
ratio was then applied to the premium for families
and individuals from MEPS statewide average for
both single and family coverage in 1998.
Housing Department of Housing and Urban Development;
Fair Market Rents for the Section 8 Housing
Assistance Payments Program � Fiscal Year 2000.
(10/01/99). (www.huduser.org).
Approved Plans from Public and Indian Housing
Authorities - Fiscal Year 2000.
Fair Market Rents by county and/or MSA and
PMSA and applicable payment standards in sub-
MSA or sub-county areas
Taxes Annual 2000 Local Sales and Use Tax Summary and
Rate Chart. Washington - Department of Revenue
http://dor.wa.gov/
Food is not subject to WA sales tax. Sales tax
amounts vary by county.
Transportati
on
Public: Travel to Work Characteristics for the 50
Largest Metropolitan Areas by Population in the US:
1990 Census (www.census.gov) or
ftp.fischer.lib.virginia.edu/pub/ccdb.47948/tableD.h
tml
What and How to Pay on Metro Transit Metro.
Online http://transit.metrokc.gov/
Private variable expenses (costs of gas and oil):
One-way distance to work derived from the 1995
Nationwide Personal Transportation Survey , Bureau
of Transportation Statistics (www.bts.gov).
Consumer Expenditure Survey 1997-1998. In the
Driver�s Seat http://www.insurance.wa.gov
State Averages Expenditures & Premiums for
Presonal Automobile Insurance in 1998, April 1998.
National Association of Insurance Commissioners
(www.naic.org).
Premium Comparison of Largest Auto Insurance
Writers in Washington. Washington Insurance
Commissioner's Office:
www.insurance.state.pa.us/html/cauto.html
Public transportation figures used in counties
where 7% or more of people use public
transportation for commuting to work as reported
by the 1990 Census.
Private transportation figures used in all other
counties.
Other: Consumer Expenditure Survey regional
statistics updated with CPI.
Using premiums for the top five insurance carriers
obtained from the Washington Insurance
Commissioner's Office, the amount for each
county is calculated using the ratio to vary the
statewide average cost of auto insurance (from
the National Insurance Commissioners report).
Data Sources


The Self-Sufficiency Standard for Washington State Page 31
About the AuthorsDiana M. Pearce, Ph.D. teaches at the School of Social Work, University ofWashington in Seattle, Washington. Recognized for coining the phrase “thefeminization of poverty,” Dr. Pearce founded and directed the Women andPoverty Project at Wider Opportunities for Women. She has written and spokenwidely on women’s poverty and economic inequality, including testimony beforeCongress and the President’s Working Group on Welfare Reform. While atWOW, Dr. Pearce conceived and developed the methodology for the Self-Sufficiency Standard and first published results in 1996 for Iowa and California.Her areas of expertise include low-wage and part-time employment, unemploy-ment insurance, homelessness, and welfare reform as they impact on women. Dr.Pearce has helped found and lead several coalitions, including the Women, Workand Welfare Coalition and the Women and Job Training Coalition. She receivedher Ph.D. degree in Sociology and Social Work from the University of Michigan.
Jennifer Brooks is the Director of Self-Sufficiency Programs and Policy forWider Opportunities for Women (WOW). Ms. Brooks has worked on the Self-Sufficiency Standards for seven states through her work on WOW’s State Orga-nizing Project for Family Economic Self-Sufficiency. Ms. Brooks oversees thedevelopment and implementation of the Standard in the states; oversees WOW’slocal, state and federal legislative involvement; assists in formulation of WOW’spolicy positions; works to build coalitions of advocates at the local and regionallevels; and provides technical assistance to WOW’s state and local partners onissues related to women, work and poverty. Ms. Brooks received a Master’sDegree in Public Policy with a Concentration in Women’s Studies from TheGeorge Washington University.


The Self-Sufficiency Standard for Washington State Page 33
List of Washington Metropolitan Areasand Non-Metropolitan CountiesMetropolitan Areas
Bellingham, WA MSA
Whatcom County
Bremerton, WA PMSA
Kitsap County
Olympia, WA PMSA
Thurston
Portland-Vancouver, OR-WA
PMSA
Clark County
Richland-Kennewick-Pasco, WA
MSA
Benton County
Franklin County
Seattle-Bellevue-Everett, WA
PMSA
Island County
King County
Snohomish County
Spokane, WA MSA
Spokane County
Tacoma, WA PMSA
Pierce County
Yakima, WA MSA
Yakima County
Non-Metropolitan
Counties
Adams County
Asotin County
Chelan County
Clallam County
Columbia County
Cowlitz County
Douglas County
Ferry County
Garfield County
Grant County
Grays Harbor County
Jefferson County
Kittitas County
Klickitat County
Lewis County
Lincoln County
Mason County
Okanogan County
Pacific County
Pend Oreille County
San Juan County
Skagit County
Skamania County
Stevens County
Wahkiakum County
Walla Walla County
Whitman County


The Self-Sufficiency Standard for Washington State Page 35
Map of
Washington
Counties


The Self-Sufficiency Standard for Washington State Page 37
Appendix:The Self-Sufficiency Standard for SelectedFamily Types, Washington State

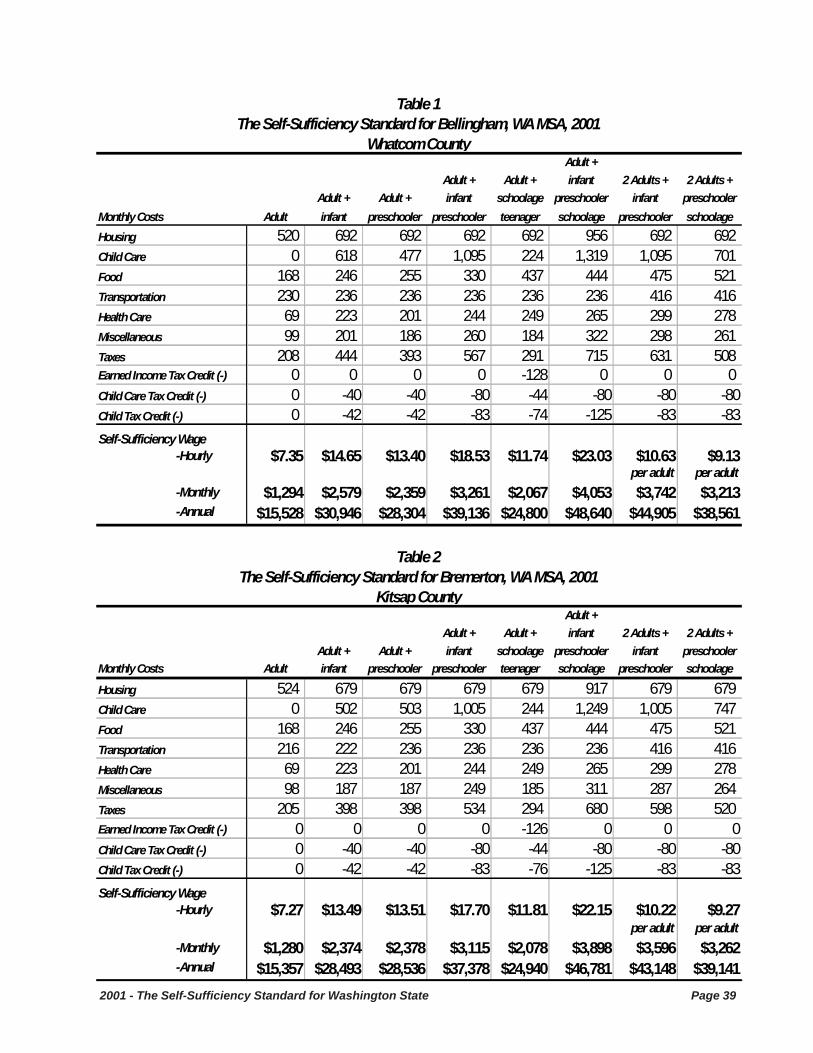
2001 - The Self-Sufficiency Standard for Washington State Page 39
Adult +Adult + Adult + infant 2 Adults + 2 Adults +
Adult + Adult + infant schoolage preschooler infant preschoolerMonthly Costs Adult infant preschooler preschooler teenager schoolage preschooler schoolageHousing 520 692 692 692 692 956 692 692Child Care 0 618 477 1,095 224 1,319 1,095 701Food 168 246 255 330 437 444 475 521Transportation 230 236 236 236 236 236 416 416Health Care 69 223 201 244 249 265 299 278Miscellaneous 99 201 186 260 184 322 298 261Taxes 208 444 393 567 291 715 631 508Earned Income Tax Credit (-) 0 0 0 0 -128 0 0 0Child Care Tax Credit (-) 0 -40 -40 -80 -44 -80 -80 -80Child Tax Credit (-) 0 -42 -42 -83 -74 -125 -83 -83Self-Sufficiency Wage -Hourly $7.35 $14.65 $13.40 $18.53 $11.74 $23.03 $10.63 $9.13
per adult per adult -Monthly $1,294 $2,579 $2,359 $3,261 $2,067 $4,053 $3,742 $3,213 -Annual $15,528 $30,946 $28,304 $39,136 $24,800 $48,640 $44,905 $38,561
Adult +Adult + Adult + infant 2 Adults + 2 Adults +
Adult + Adult + infant schoolage preschooler infant preschoolerMonthly Costs Adult infant preschooler preschooler teenager schoolage preschooler schoolage
Housing 524 679 679 679 679 917 679 679Child Care 0 502 503 1,005 244 1,249 1,005 747Food 168 246 255 330 437 444 475 521Transportation 216 222 236 236 236 236 416 416Health Care 69 223 201 244 249 265 299 278Miscellaneous 98 187 187 249 185 311 287 264Taxes 205 398 398 534 294 680 598 520Earned Income Tax Credit (-) 0 0 0 0 -126 0 0 0Child Care Tax Credit (-) 0 -40 -40 -80 -44 -80 -80 -80Child Tax Credit (-) 0 -42 -42 -83 -76 -125 -83 -83Self-Sufficiency Wage -Hourly $7.27 $13.49 $13.51 $17.70 $11.81 $22.15 $10.22 $9.27
per adult per adult -Monthly $1,280 $2,374 $2,378 $3,115 $2,078 $3,898 $3,596 $3,262 -Annual $15,357 $28,493 $28,536 $37,378 $24,940 $46,781 $43,148 $39,141
Table 2The Self-Sufficiency Standard for Bremerton, WA MSA, 2001
Kitsap County
Table 1The Self-Sufficiency Standard for Bellingham, WA MSA, 2001
Whatcom County
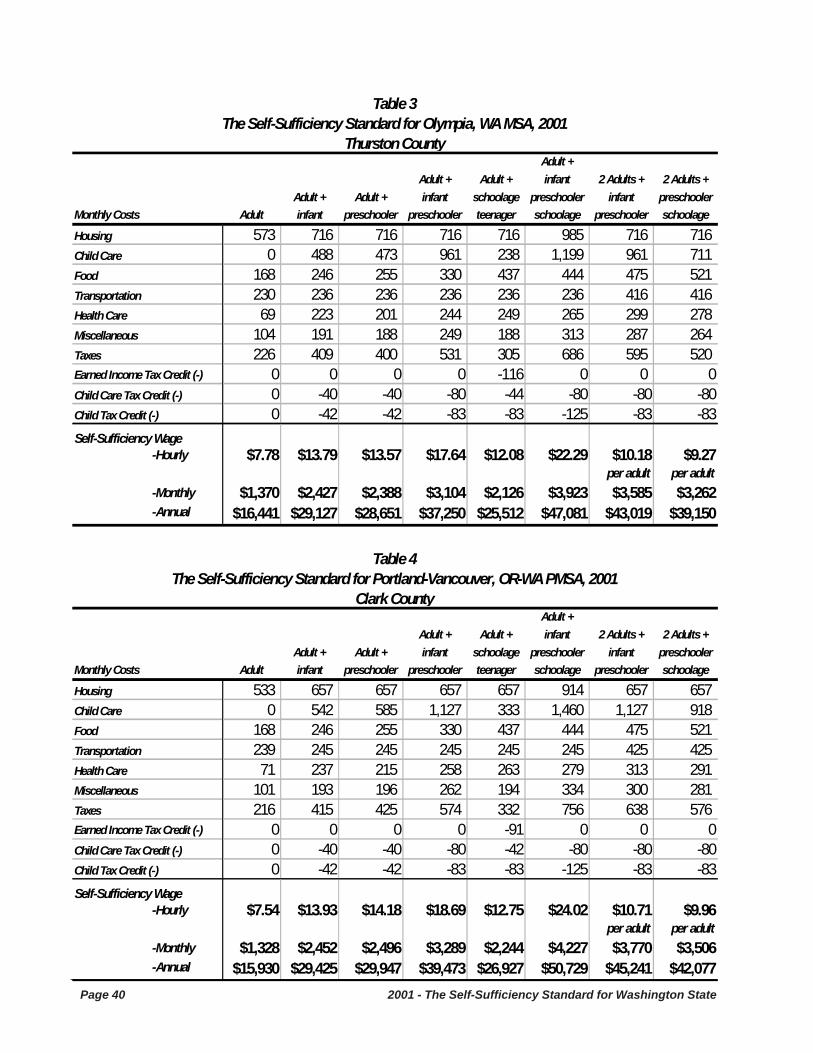
Page 40 2001 - The Self-Sufficiency Standard for Washington State
Adult +Adult + Adult + infant 2 Adults + 2 Adults +
Adult + Adult + infant schoolage preschooler infant preschoolerMonthly Costs Adult infant preschooler preschooler teenager schoolage preschooler schoolage
Housing 573 716 716 716 716 985 716 716Child Care 0 488 473 961 238 1,199 961 711Food 168 246 255 330 437 444 475 521Transportation 230 236 236 236 236 236 416 416Health Care 69 223 201 244 249 265 299 278Miscellaneous 104 191 188 249 188 313 287 264Taxes 226 409 400 531 305 686 595 520Earned Income Tax Credit (-) 0 0 0 0 -116 0 0 0Child Care Tax Credit (-) 0 -40 -40 -80 -44 -80 -80 -80Child Tax Credit (-) 0 -42 -42 -83 -83 -125 -83 -83Self-Sufficiency Wage -Hourly $7.78 $13.79 $13.57 $17.64 $12.08 $22.29 $10.18 $9.27
per adult per adult -Monthly $1,370 $2,427 $2,388 $3,104 $2,126 $3,923 $3,585 $3,262 -Annual $16,441 $29,127 $28,651 $37,250 $25,512 $47,081 $43,019 $39,150
Adult +Adult + Adult + infant 2 Adults + 2 Adults +
Adult + Adult + infant schoolage preschooler infant preschoolerMonthly Costs Adult infant preschooler preschooler teenager schoolage preschooler schoolage
Housing 533 657 657 657 657 914 657 657Child Care 0 542 585 1,127 333 1,460 1,127 918Food 168 246 255 330 437 444 475 521Transportation 239 245 245 245 245 245 425 425Health Care 71 237 215 258 263 279 313 291Miscellaneous 101 193 196 262 194 334 300 281Taxes 216 415 425 574 332 756 638 576Earned Income Tax Credit (-) 0 0 0 0 -91 0 0 0Child Care Tax Credit (-) 0 -40 -40 -80 -42 -80 -80 -80Child Tax Credit (-) 0 -42 -42 -83 -83 -125 -83 -83Self-Sufficiency Wage -Hourly $7.54 $13.93 $14.18 $18.69 $12.75 $24.02 $10.71 $9.96
per adult per adult -Monthly $1,328 $2,452 $2,496 $3,289 $2,244 $4,227 $3,770 $3,506 -Annual $15,930 $29,425 $29,947 $39,473 $26,927 $50,729 $45,241 $42,077
Table 3The Self-Sufficiency Standard for Olympia, WA MSA, 2001
Thurston County
Table 4The Self-Sufficiency Standard for Portland-Vancouver, OR-WA PMSA, 2001
Clark County

2001 - The Self-Sufficiency Standard for Washington State Page 41
Adult + Adult + Adult + infant 2 Adults + 2 Adults +
Adult + Adult + infant schoolage preschooler infant preschoolerMonthly Costs Adult infant preschooler preschooler teenager schoolage preschooler schoolageHousing 515 617 617 617 617 859 617 617Child Care 0 439 475 914 239 1,153 914 714Food 168 246 255 330 437 444 475 521Transportation 230 236 236 236 236 236 416 416Health Care 69 223 201 244 249 265 299 278Miscellaneous 98 176 178 234 178 296 272 255Taxes 206 351 361 483 269 628 546 488Earned Income Tax Credit (-) 0 -29 -22 0 -148 0 0 0Child Care Tax Credit (-) 0 -42 -42 -80 -46 -80 -80 -80Child Tax Credit (-) 0 -42 -42 -83 -58 -125 -83 -83Self-Sufficiency Wage -Hourly $7.31 $12.36 $12.60 $16.45 $11.21 $20.89 $9.59 $8.88
per adult per adult -Monthly $1,287 $2,175 $2,217 $2,895 $1,974 $3,677 $3,376 $3,125 -Annual $15,444 $26,100 $26,606 $34,740 $23,684 $44,124 $40,509 $37,500
Adult +Adult + Adult + infant 2 Adults + 2 Adults +
Adult + Adult + infant schoolage preschooler infant preschoolerMonthly Costs Adult infant preschooler preschooler teenager schoolage preschooler schoolage
Housing 543 651 651 651 651 859 651 651Child Care 0 439 475 914 239 1,153 914 714Food 168 246 255 330 437 444 475 521Transportation 230 236 236 236 236 236 416 416Health Care 69 223 201 244 249 265 299 278Miscellaneous 101 179 182 238 181 296 275 258Taxes 216 365 375 494 282 628 558 499Earned Income Tax Credit (-) 0 -19 -13 0 -137 0 0 0Child Care Tax Credit (-) 0 -42 -42 -80 -44 -80 -80 -80Child Tax Credit (-) 0 -42 -42 -83 -68 -125 -83 -83Self-Sufficiency Wage -Hourly $7.54 $12.71 $12.95 $16.73 $11.51 $20.89 $9.73 $9.02
per adult per adult -Monthly $1,327 $2,236 $2,279 $2,944 $2,027 $3,677 $3,424 $3,174 -Annual $15,925 $26,837 $27,342 $35,324 $24,318 $44,124 $41,094 $38,084
Table 6The Self-Sufficiency Standard for Richland-Kennewick-Pasco, WA MSA, 2001
Benton County - Richland
Table 5The Self-Sufficiency Standard for Richland-Kennewick-Pasco, WA MSA, 2001
Benton County - Kennewick
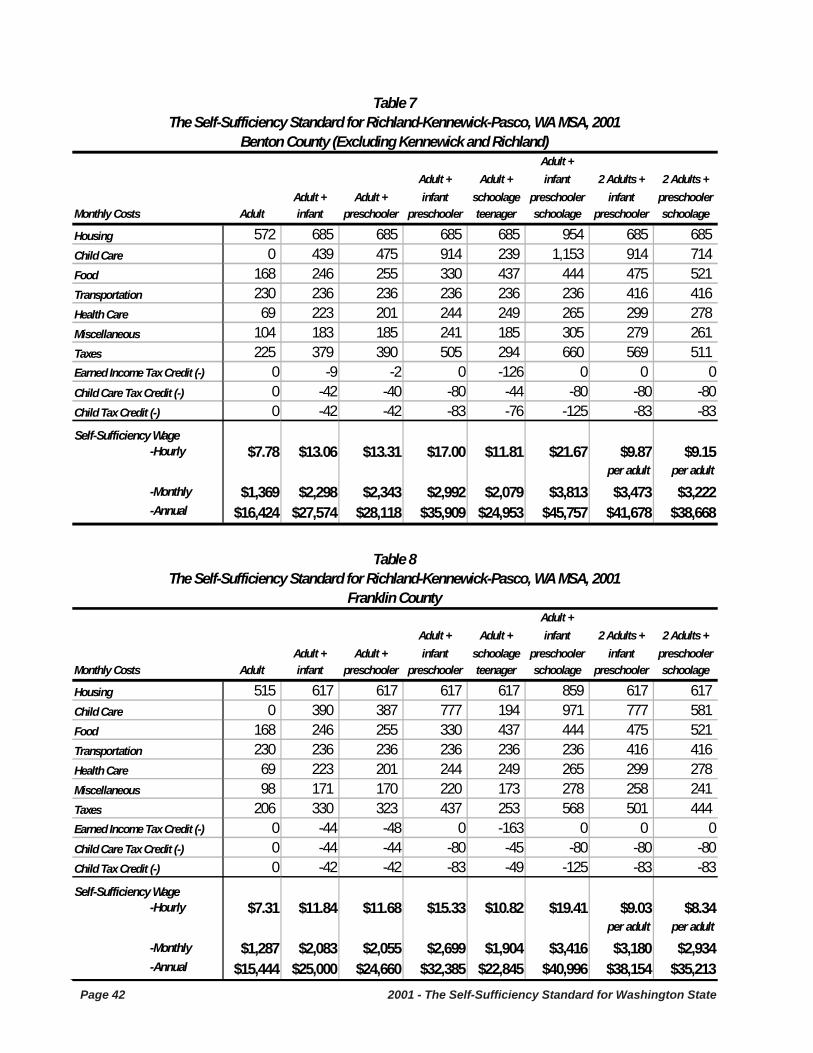
Page 42 2001 - The Self-Sufficiency Standard for Washington State
Adult +Adult + Adult + infant 2 Adults + 2 Adults +
Adult + Adult + infant schoolage preschooler infant preschoolerMonthly Costs Adult infant preschooler preschooler teenager schoolage preschooler schoolage
Housing 572 685 685 685 685 954 685 685Child Care 0 439 475 914 239 1,153 914 714Food 168 246 255 330 437 444 475 521Transportation 230 236 236 236 236 236 416 416Health Care 69 223 201 244 249 265 299 278Miscellaneous 104 183 185 241 185 305 279 261Taxes 225 379 390 505 294 660 569 511Earned Income Tax Credit (-) 0 -9 -2 0 -126 0 0 0Child Care Tax Credit (-) 0 -42 -40 -80 -44 -80 -80 -80Child Tax Credit (-) 0 -42 -42 -83 -76 -125 -83 -83Self-Sufficiency Wage -Hourly $7.78 $13.06 $13.31 $17.00 $11.81 $21.67 $9.87 $9.15
per adult per adult -Monthly $1,369 $2,298 $2,343 $2,992 $2,079 $3,813 $3,473 $3,222 -Annual $16,424 $27,574 $28,118 $35,909 $24,953 $45,757 $41,678 $38,668
Adult +Adult + Adult + infant 2 Adults + 2 Adults +
Adult + Adult + infant schoolage preschooler infant preschoolerMonthly Costs Adult infant preschooler preschooler teenager schoolage preschooler schoolage
Housing 515 617 617 617 617 859 617 617Child Care 0 390 387 777 194 971 777 581Food 168 246 255 330 437 444 475 521Transportation 230 236 236 236 236 236 416 416Health Care 69 223 201 244 249 265 299 278Miscellaneous 98 171 170 220 173 278 258 241Taxes 206 330 323 437 253 568 501 444Earned Income Tax Credit (-) 0 -44 -48 0 -163 0 0 0Child Care Tax Credit (-) 0 -44 -44 -80 -45 -80 -80 -80Child Tax Credit (-) 0 -42 -42 -83 -49 -125 -83 -83Self-Sufficiency Wage -Hourly $7.31 $11.84 $11.68 $15.33 $10.82 $19.41 $9.03 $8.34
per adult per adult -Monthly $1,287 $2,083 $2,055 $2,699 $1,904 $3,416 $3,180 $2,934 -Annual $15,444 $25,000 $24,660 $32,385 $22,845 $40,996 $38,154 $35,213
Table 7The Self-Sufficiency Standard for Richland-Kennewick-Pasco, WA MSA, 2001
Benton County (Excluding Kennewick and Richland)
Table 8The Self-Sufficiency Standard for Richland-Kennewick-Pasco, WA MSA, 2001
Franklin County
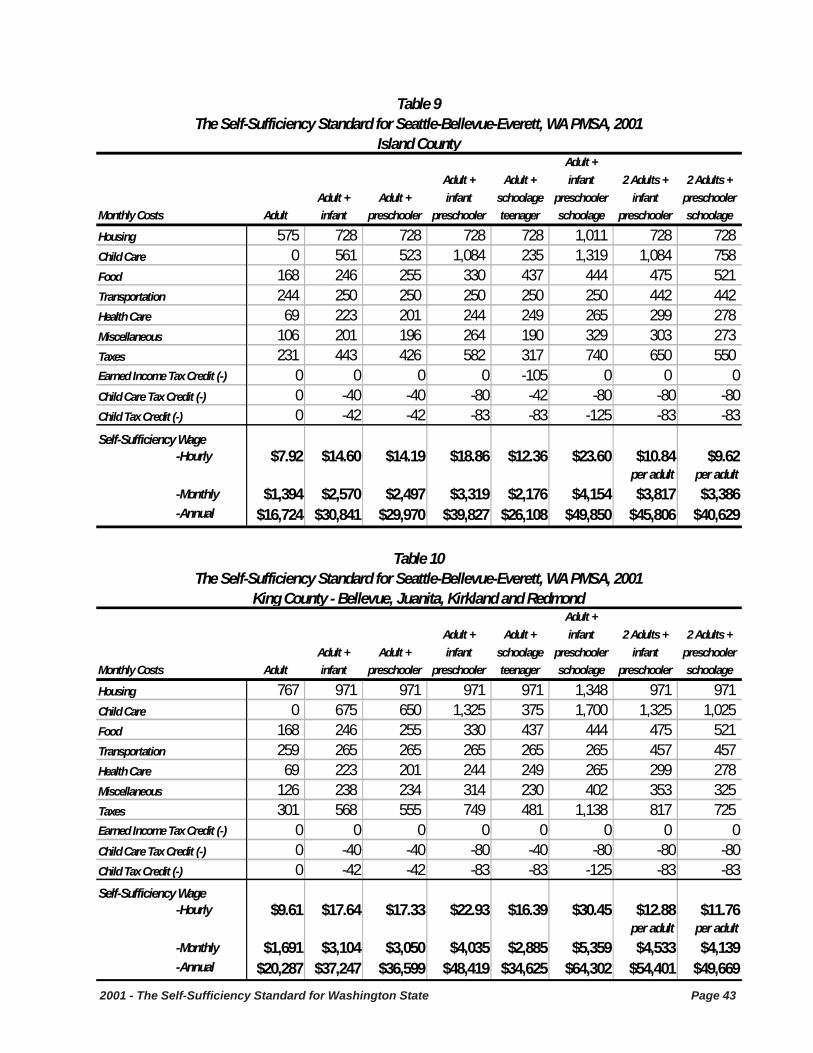
2001 - The Self-Sufficiency Standard for Washington State Page 43
Adult +Adult + Adult + infant 2 Adults + 2 Adults +
Adult + Adult + infant schoolage preschooler infant preschoolerMonthly Costs Adult infant preschooler preschooler teenager schoolage preschooler schoolage
Housing 575 728 728 728 728 1,011 728 728Child Care 0 561 523 1,084 235 1,319 1,084 758Food 168 246 255 330 437 444 475 521Transportation 244 250 250 250 250 250 442 442Health Care 69 223 201 244 249 265 299 278Miscellaneous 106 201 196 264 190 329 303 273Taxes 231 443 426 582 317 740 650 550Earned Income Tax Credit (-) 0 0 0 0 -105 0 0 0Child Care Tax Credit (-) 0 -40 -40 -80 -42 -80 -80 -80Child Tax Credit (-) 0 -42 -42 -83 -83 -125 -83 -83Self-Sufficiency Wage -Hourly $7.92 $14.60 $14.19 $18.86 $12.36 $23.60 $10.84 $9.62
per adult per adult -Monthly $1,394 $2,570 $2,497 $3,319 $2,176 $4,154 $3,817 $3,386 -Annual $16,724 $30,841 $29,970 $39,827 $26,108 $49,850 $45,806 $40,629
Adult +Adult + Adult + infant 2 Adults + 2 Adults +
Adult + Adult + infant schoolage preschooler infant preschoolerMonthly Costs Adult infant preschooler preschooler teenager schoolage preschooler schoolage
Housing 767 971 971 971 971 1,348 971 971Child Care 0 675 650 1,325 375 1,700 1,325 1,025Food 168 246 255 330 437 444 475 521Transportation 259 265 265 265 265 265 457 457Health Care 69 223 201 244 249 265 299 278Miscellaneous 126 238 234 314 230 402 353 325Taxes 301 568 555 749 481 1,138 817 725Earned Income Tax Credit (-) 0 0 0 0 0 0 0 0Child Care Tax Credit (-) 0 -40 -40 -80 -40 -80 -80 -80Child Tax Credit (-) 0 -42 -42 -83 -83 -125 -83 -83Self-Sufficiency Wage -Hourly $9.61 $17.64 $17.33 $22.93 $16.39 $30.45 $12.88 $11.76
per adult per adult -Monthly $1,691 $3,104 $3,050 $4,035 $2,885 $5,359 $4,533 $4,139 -Annual $20,287 $37,247 $36,599 $48,419 $34,625 $64,302 $54,401 $49,669
Table 10The Self-Sufficiency Standard for Seattle-Bellevue-Everett, WA PMSA, 2001
King County - Bellevue, Juanita, Kirkland and Redmond
Table 9The Self-Sufficiency Standard for Seattle-Bellevue-Everett, WA PMSA, 2001
Island County
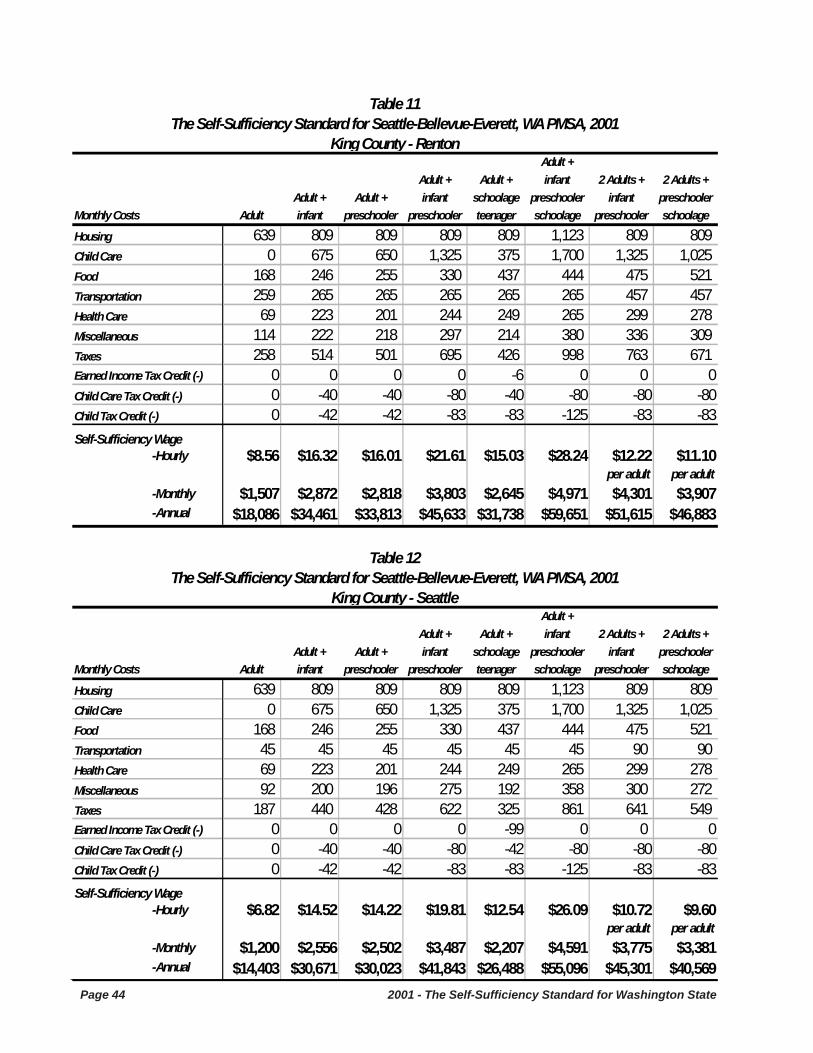
Page 44 2001 - The Self-Sufficiency Standard for Washington State
Adult +Adult + Adult + infant 2 Adults + 2 Adults +
Adult + Adult + infant schoolage preschooler infant preschoolerMonthly Costs Adult infant preschooler preschooler teenager schoolage preschooler schoolageHousing 639 809 809 809 809 1,123 809 809Child Care 0 675 650 1,325 375 1,700 1,325 1,025Food 168 246 255 330 437 444 475 521Transportation 259 265 265 265 265 265 457 457Health Care 69 223 201 244 249 265 299 278Miscellaneous 114 222 218 297 214 380 336 309Taxes 258 514 501 695 426 998 763 671Earned Income Tax Credit (-) 0 0 0 0 -6 0 0 0Child Care Tax Credit (-) 0 -40 -40 -80 -40 -80 -80 -80Child Tax Credit (-) 0 -42 -42 -83 -83 -125 -83 -83Self-Sufficiency Wage -Hourly $8.56 $16.32 $16.01 $21.61 $15.03 $28.24 $12.22 $11.10
per adult per adult -Monthly $1,507 $2,872 $2,818 $3,803 $2,645 $4,971 $4,301 $3,907 -Annual $18,086 $34,461 $33,813 $45,633 $31,738 $59,651 $51,615 $46,883
Adult +Adult + Adult + infant 2 Adults + 2 Adults +
Adult + Adult + infant schoolage preschooler infant preschoolerMonthly Costs Adult infant preschooler preschooler teenager schoolage preschooler schoolage
Housing 639 809 809 809 809 1,123 809 809Child Care 0 675 650 1,325 375 1,700 1,325 1,025Food 168 246 255 330 437 444 475 521Transportation 45 45 45 45 45 45 90 90Health Care 69 223 201 244 249 265 299 278Miscellaneous 92 200 196 275 192 358 300 272Taxes 187 440 428 622 325 861 641 549Earned Income Tax Credit (-) 0 0 0 0 -99 0 0 0Child Care Tax Credit (-) 0 -40 -40 -80 -42 -80 -80 -80Child Tax Credit (-) 0 -42 -42 -83 -83 -125 -83 -83Self-Sufficiency Wage -Hourly $6.82 $14.52 $14.22 $19.81 $12.54 $26.09 $10.72 $9.60
per adult per adult -Monthly $1,200 $2,556 $2,502 $3,487 $2,207 $4,591 $3,775 $3,381 -Annual $14,403 $30,671 $30,023 $41,843 $26,488 $55,096 $45,301 $40,569
Table 11The Self-Sufficiency Standard for Seattle-Bellevue-Everett, WA PMSA, 2001
King County - Renton
Table 12The Self-Sufficiency Standard for Seattle-Bellevue-Everett, WA PMSA, 2001
King County - Seattle

2001 - The Self-Sufficiency Standard for Washington State Page 45
Adult +Adult + Adult + infant 2 Adults + 2 Adults +
Adult + Adult + infant schoolage preschooler infant preschoolerMonthly Costs Adult infant preschooler preschooler teenager schoolage preschooler schoolage
Housing 703 890 890 890 890 1,235 890 890Child Care 0 675 650 1,325 375 1,700 1,325 1,025Food 168 246 255 330 437 444 475 521Transportation 259 265 265 265 265 265 457 457Health Care 69 223 201 244 249 265 299 278Miscellaneous 120 230 226 305 222 391 345 317Taxes 279 541 528 722 454 1,068 790 698Earned Income Tax Credit (-) 0 0 0 0 0 0 0 0Child Care Tax Credit (-) 0 -40 -40 -80 -40 -80 -80 -80Child Tax Credit (-) 0 -42 -42 -83 -83 -125 -83 -83Self-Sufficiency Wage -Hourly $9.08 $16.98 $16.67 $22.27 $15.73 $29.34 $12.55 $11.43
per adult per adult -Monthly $1,599 $2,988 $2,934 $3,919 $2,769 $5,164 $4,417 $4,023 -Annual $19,187 $35,854 $35,206 $47,026 $33,232 $61,966 $53,008 $48,276
Adult +Adult + Adult + infant 2 Adults + 2 Adults +
Adult + Adult + infant schoolage preschooler infant preschoolerMonthly Costs Adult infant preschooler preschooler teenager schoolage preschooler schoolage
Housing 703 890 890 890 890 1,235 890 890Child Care 0 629 553 1,182 327 1,509 1,182 880Food 168 246 255 330 437 444 475 521Transportation 252 259 259 259 259 259 450 450Health Care 69 223 201 244 249 265 299 278Miscellaneous 119 225 216 291 216 371 330 302Taxes 277 523 494 672 436 945 740 648Earned Income Tax Credit (-) 0 0 0 0 0 0 0 0Child Care Tax Credit (-) 0 -40 -40 -80 -40 -80 -80 -80Child Tax Credit (-) 0 -42 -42 -83 -83 -125 -83 -83Self-Sufficiency Wage -Hourly $9.03 $16.55 $15.83 $21.05 $15.29 $27.41 $11.94 $10.81
per adult per adult -Monthly $1,589 $2,912 $2,785 $3,704 $2,691 $4,823 $4,203 $3,806 -Annual $19,073 $34,949 $33,423 $44,453 $32,292 $57,881 $50,434 $45,669
Table 14The Self-Sufficiency Standard for Seattle-Bellevue-Everett, WA PMSA, 2001
Snohomish County
Table 13The Self-Sufficiency Standard for Seattle-Bellevue-Everett, WA PMSA, 2001
King County (Excluding Bellevue, Juanita, Kirkland, Redmond, Renton, and Seattle)

Page 46 2001 - The Self-Sufficiency Standard for Washington State
Adult +Adult + Adult + infant 2 Adults + 2 Adults +
Adult + Adult + infant schoolage preschooler infant preschoolerMonthly Costs Adult infant preschooler preschooler teenager schoolage preschooler schoolageHousing 480 580 580 580 580 788 580 580Child Care 0 444 440 884 240 1,124 884 680Food 168 246 255 330 437 444 475 521Transportation 234 240 240 240 240 240 420 420Health Care 69 223 201 244 249 265 299 278Miscellaneous 95 173 172 228 175 286 266 248Taxes 196 339 332 462 258 597 526 466Earned Income Tax Credit (-) 0 -38 -42 0 -158 0 0 0Child Care Tax Credit (-) 0 -44 -44 -80 -46 -80 -80 -80Child Tax Credit (-) 0 -42 -42 -83 -51 -125 -83 -83Self-Sufficiency Wage -Hourly $7.06 $12.05 $11.88 $15.94 $10.93 $20.11 $9.33 $8.61
per adult per adult -Monthly $1,243 $2,121 $2,091 $2,805 $1,924 $3,540 $3,286 $3,029 -Annual $14,910 $25,455 $25,094 $33,658 $23,088 $42,476 $39,428 $36,349
Adult +Adult + Adult + infant 2 Adults + 2 Adults +
Adult + Adult + infant schoolage preschooler infant preschoolerMonthly Costs Adult infant preschooler preschooler teenager schoolage preschooler schoolage
Housing 530 706 706 706 706 982 706 706Child Care 0 531 480 1,011 297 1,308 1,011 777Food 168 246 255 330 437 444 475 521Transportation 251 257 257 257 257 257 437 437Health Care 69 223 201 244 249 265 299 278Miscellaneous 102 196 190 255 195 326 293 272Taxes 219 429 407 553 338 730 617 547Earned Income Tax Credit (-) 0 0 0 0 -86 0 0 0Child Care Tax Credit (-) 0 -40 -40 -80 -42 -80 -80 -80Child Tax Credit (-) 0 -42 -42 -83 -83 -125 -83 -83Self-Sufficiency Wage -Hourly $7.61 $14.24 $13.72 $18.14 $12.89 $23.34 $10.44 $9.59
per adult per adult -Monthly $1,339 $2,506 $2,415 $3,193 $2,268 $4,107 $3,674 $3,375 -Annual $16,070 $30,070 $28,975 $38,318 $27,222 $49,289 $44,090 $40,494
Table 15The Self-Sufficiency Standard for Spokane, WA MSA, 2001
Spokane County
Table 16The Self-Sufficiency Standard for Tacoma, WA PMSA, 2001
Pierce County - Tacoma
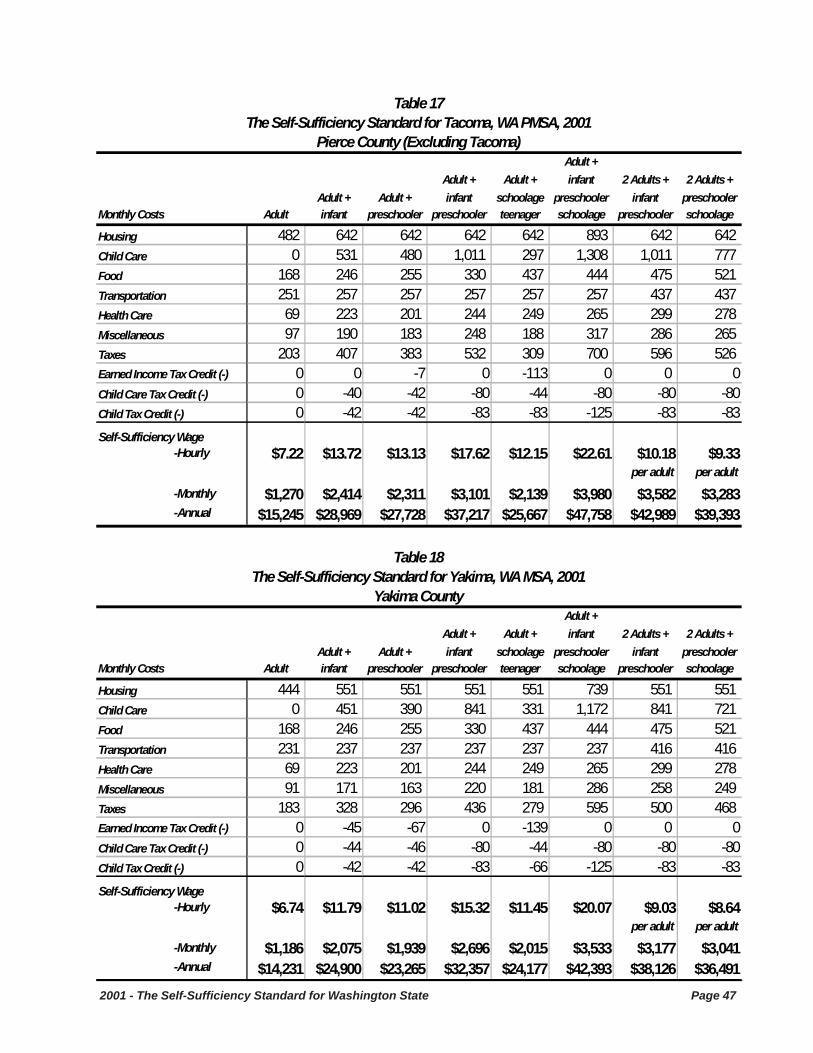
2001 - The Self-Sufficiency Standard for Washington State Page 47
Adult +Adult + Adult + infant 2 Adults + 2 Adults +
Adult + Adult + infant schoolage preschooler infant preschoolerMonthly Costs Adult infant preschooler preschooler teenager schoolage preschooler schoolage
Housing 482 642 642 642 642 893 642 642Child Care 0 531 480 1,011 297 1,308 1,011 777Food 168 246 255 330 437 444 475 521Transportation 251 257 257 257 257 257 437 437Health Care 69 223 201 244 249 265 299 278Miscellaneous 97 190 183 248 188 317 286 265Taxes 203 407 383 532 309 700 596 526Earned Income Tax Credit (-) 0 0 -7 0 -113 0 0 0Child Care Tax Credit (-) 0 -40 -42 -80 -44 -80 -80 -80Child Tax Credit (-) 0 -42 -42 -83 -83 -125 -83 -83Self-Sufficiency Wage -Hourly $7.22 $13.72 $13.13 $17.62 $12.15 $22.61 $10.18 $9.33
per adult per adult -Monthly $1,270 $2,414 $2,311 $3,101 $2,139 $3,980 $3,582 $3,283 -Annual $15,245 $28,969 $27,728 $37,217 $25,667 $47,758 $42,989 $39,393
Adult +Adult + Adult + infant 2 Adults + 2 Adults +
Adult + Adult + infant schoolage preschooler infant preschoolerMonthly Costs Adult infant preschooler preschooler teenager schoolage preschooler schoolage
Housing 444 551 551 551 551 739 551 551Child Care 0 451 390 841 331 1,172 841 721Food 168 246 255 330 437 444 475 521Transportation 231 237 237 237 237 237 416 416Health Care 69 223 201 244 249 265 299 278Miscellaneous 91 171 163 220 181 286 258 249Taxes 183 328 296 436 279 595 500 468Earned Income Tax Credit (-) 0 -45 -67 0 -139 0 0 0Child Care Tax Credit (-) 0 -44 -46 -80 -44 -80 -80 -80Child Tax Credit (-) 0 -42 -42 -83 -66 -125 -83 -83Self-Sufficiency Wage -Hourly $6.74 $11.79 $11.02 $15.32 $11.45 $20.07 $9.03 $8.64
per adult per adult -Monthly $1,186 $2,075 $1,939 $2,696 $2,015 $3,533 $3,177 $3,041 -Annual $14,231 $24,900 $23,265 $32,357 $24,177 $42,393 $38,126 $36,491
Table 18The Self-Sufficiency Standard for Yakima, WA MSA, 2001
Yakima County
Table 17The Self-Sufficiency Standard for Tacoma, WA PMSA, 2001
Pierce County (Excluding Tacoma)
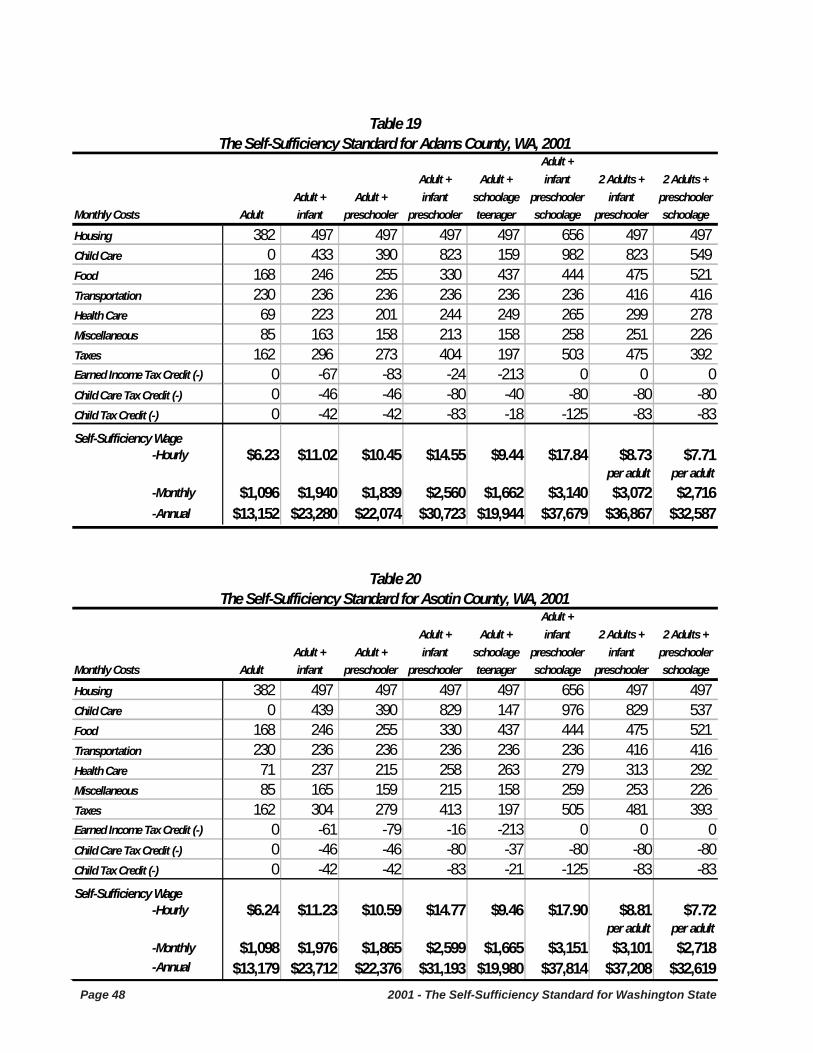
Page 48 2001 - The Self-Sufficiency Standard for Washington State
Adult +Adult + Adult + infant 2 Adults + 2 Adults +
Adult + Adult + infant schoolage preschooler infant preschoolerMonthly Costs Adult infant preschooler preschooler teenager schoolage preschooler schoolage
Housing 382 497 497 497 497 656 497 497Child Care 0 433 390 823 159 982 823 549Food 168 246 255 330 437 444 475 521Transportation 230 236 236 236 236 236 416 416Health Care 69 223 201 244 249 265 299 278Miscellaneous 85 163 158 213 158 258 251 226Taxes 162 296 273 404 197 503 475 392Earned Income Tax Credit (-) 0 -67 -83 -24 -213 0 0 0Child Care Tax Credit (-) 0 -46 -46 -80 -40 -80 -80 -80Child Tax Credit (-) 0 -42 -42 -83 -18 -125 -83 -83Self-Sufficiency Wage -Hourly $6.23 $11.02 $10.45 $14.55 $9.44 $17.84 $8.73 $7.71
per adult per adult -Monthly $1,096 $1,940 $1,839 $2,560 $1,662 $3,140 $3,072 $2,716 -Annual $13,152 $23,280 $22,074 $30,723 $19,944 $37,679 $36,867 $32,587
Adult +Adult + Adult + infant 2 Adults + 2 Adults +
Adult + Adult + infant schoolage preschooler infant preschoolerMonthly Costs Adult infant preschooler preschooler teenager schoolage preschooler schoolage
Housing 382 497 497 497 497 656 497 497Child Care 0 439 390 829 147 976 829 537Food 168 246 255 330 437 444 475 521Transportation 230 236 236 236 236 236 416 416Health Care 71 237 215 258 263 279 313 292Miscellaneous 85 165 159 215 158 259 253 226Taxes 162 304 279 413 197 505 481 393Earned Income Tax Credit (-) 0 -61 -79 -16 -213 0 0 0Child Care Tax Credit (-) 0 -46 -46 -80 -37 -80 -80 -80Child Tax Credit (-) 0 -42 -42 -83 -21 -125 -83 -83Self-Sufficiency Wage -Hourly $6.24 $11.23 $10.59 $14.77 $9.46 $17.90 $8.81 $7.72
per adult per adult -Monthly $1,098 $1,976 $1,865 $2,599 $1,665 $3,151 $3,101 $2,718 -Annual $13,179 $23,712 $22,376 $31,193 $19,980 $37,814 $37,208 $32,619
Table 19The Self-Sufficiency Standard for Adams County, WA, 2001
Table 20The Self-Sufficiency Standard for Asotin County, WA, 2001

2001 - The Self-Sufficiency Standard for Washington State Page 49
Adult +Adult + Adult + infant 2 Adults + 2 Adults +
Adult + Adult + infant schoolage preschooler infant preschoolerMonthly Costs Adult infant preschooler preschooler teenager schoolage preschooler schoolageHousing 382 497 497 497 497 656 497 497Child Care 0 401 429 830 165 995 830 594Food 168 246 255 330 437 444 475 521Transportation 230 236 236 236 236 236 416 416Health Care 69 223 201 244 249 265 299 278Miscellaneous 85 160 162 214 158 260 252 231Taxes 162 284 290 409 200 508 479 408Earned Income Tax Credit (-) 0 -76 -71 -21 -211 0 0 0Child Care Tax Credit (-) 0 -46 -46 -80 -40 -80 -80 -80Child Tax Credit (-) 0 -42 -42 -83 -19 -125 -83 -83Self-Sufficiency Wage -Hourly $6.23 $10.70 $10.86 $14.63 $9.50 $17.95 $8.76 $7.90
per adult per adult -Monthly $1,096 $1,883 $1,911 $2,576 $1,672 $3,160 $3,084 $2,781 -Annual $13,158 $22,599 $22,931 $30,906 $20,066 $37,919 $37,003 $33,374
Adult +Adult + Adult + infant 2 Adults + 2 Adults +
Adult + Adult + infant schoolage preschooler infant preschoolerMonthly Costs Adult infant preschooler preschooler teenager schoolage preschooler schoolage
Housing 460 585 585 585 585 753 585 585Child Care 0 561 585 1,146 187 1,333 1,146 772Food 168 246 255 330 437 444 475 521Transportation 230 236 236 236 236 236 416 416Health Care 70 227 205 248 253 269 304 282Miscellaneous 93 185 187 255 170 304 292 258Taxes 188 392 396 551 241 655 615 499Earned Income Tax Credit (-) 0 -1 0 0 -174 0 0 0Child Care Tax Credit (-) 0 -40 -40 -80 -43 -80 -80 -80Child Tax Credit (-) 0 -42 -42 -83 -43 -125 -83 -83Self-Sufficiency Wage -Hourly $6.87 $13.35 $13.45 $18.11 $10.51 $21.53 $10.42 $9.00
per adult per adult -Monthly $1,209 $2,349 $2,367 $3,188 $1,850 $3,790 $3,669 $3,169 -Annual $14,510 $28,189 $28,403 $38,259 $22,203 $45,478 $44,029 $38,027
Table 22The Self-Sufficiency Standard for Clallam County, WA, 2001
Table 21The Self-Sufficiency Standard for Chelan County, WA, 2001
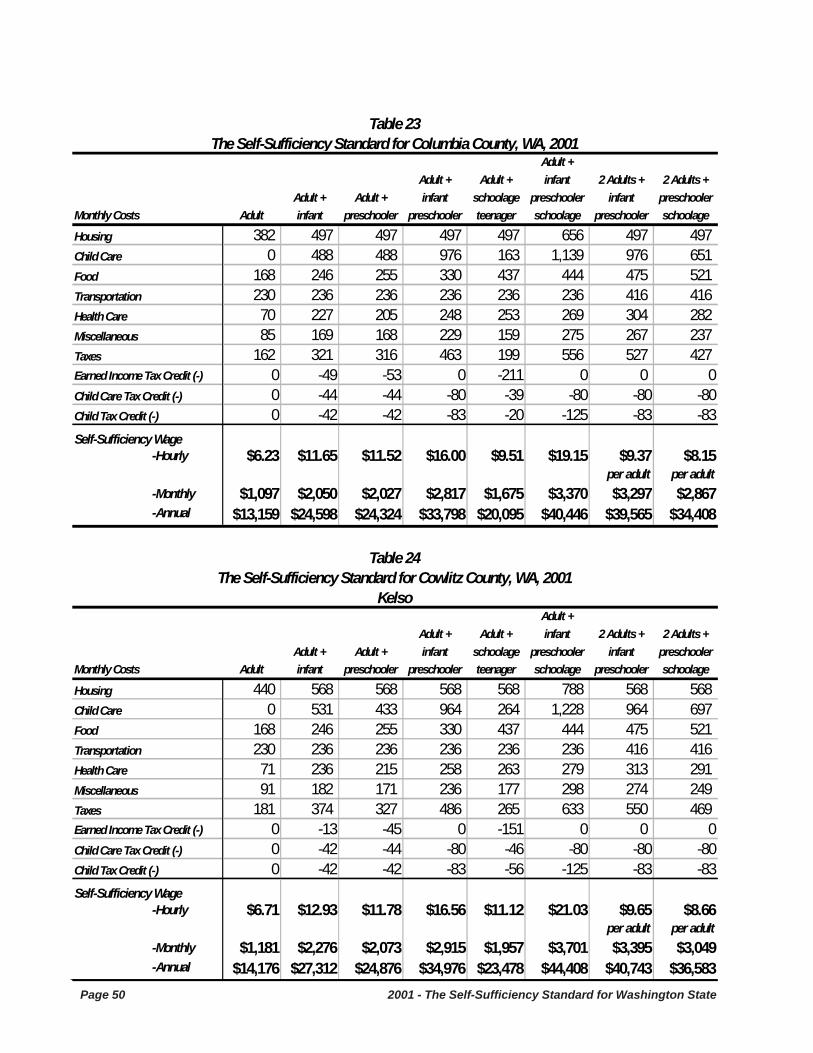
Page 50 2001 - The Self-Sufficiency Standard for Washington State
Adult +Adult + Adult + infant 2 Adults + 2 Adults +
Adult + Adult + infant schoolage preschooler infant preschoolerMonthly Costs Adult infant preschooler preschooler teenager schoolage preschooler schoolageHousing 382 497 497 497 497 656 497 497Child Care 0 488 488 976 163 1,139 976 651Food 168 246 255 330 437 444 475 521Transportation 230 236 236 236 236 236 416 416Health Care 70 227 205 248 253 269 304 282Miscellaneous 85 169 168 229 159 275 267 237Taxes 162 321 316 463 199 556 527 427Earned Income Tax Credit (-) 0 -49 -53 0 -211 0 0 0Child Care Tax Credit (-) 0 -44 -44 -80 -39 -80 -80 -80Child Tax Credit (-) 0 -42 -42 -83 -20 -125 -83 -83Self-Sufficiency Wage -Hourly $6.23 $11.65 $11.52 $16.00 $9.51 $19.15 $9.37 $8.15
per adult per adult -Monthly $1,097 $2,050 $2,027 $2,817 $1,675 $3,370 $3,297 $2,867 -Annual $13,159 $24,598 $24,324 $33,798 $20,095 $40,446 $39,565 $34,408
Adult +Adult + Adult + infant 2 Adults + 2 Adults +
Adult + Adult + infant schoolage preschooler infant preschoolerMonthly Costs Adult infant preschooler preschooler teenager schoolage preschooler schoolage
Housing 440 568 568 568 568 788 568 568Child Care 0 531 433 964 264 1,228 964 697Food 168 246 255 330 437 444 475 521Transportation 230 236 236 236 236 236 416 416Health Care 71 236 215 258 263 279 313 291Miscellaneous 91 182 171 236 177 298 274 249Taxes 181 374 327 486 265 633 550 469Earned Income Tax Credit (-) 0 -13 -45 0 -151 0 0 0Child Care Tax Credit (-) 0 -42 -44 -80 -46 -80 -80 -80Child Tax Credit (-) 0 -42 -42 -83 -56 -125 -83 -83Self-Sufficiency Wage -Hourly $6.71 $12.93 $11.78 $16.56 $11.12 $21.03 $9.65 $8.66
per adult per adult -Monthly $1,181 $2,276 $2,073 $2,915 $1,957 $3,701 $3,395 $3,049 -Annual $14,176 $27,312 $24,876 $34,976 $23,478 $44,408 $40,743 $36,583
Table 23The Self-Sufficiency Standard for Columbia County, WA, 2001
Table 24The Self-Sufficiency Standard for Cowlitz County, WA, 2001
Kelso
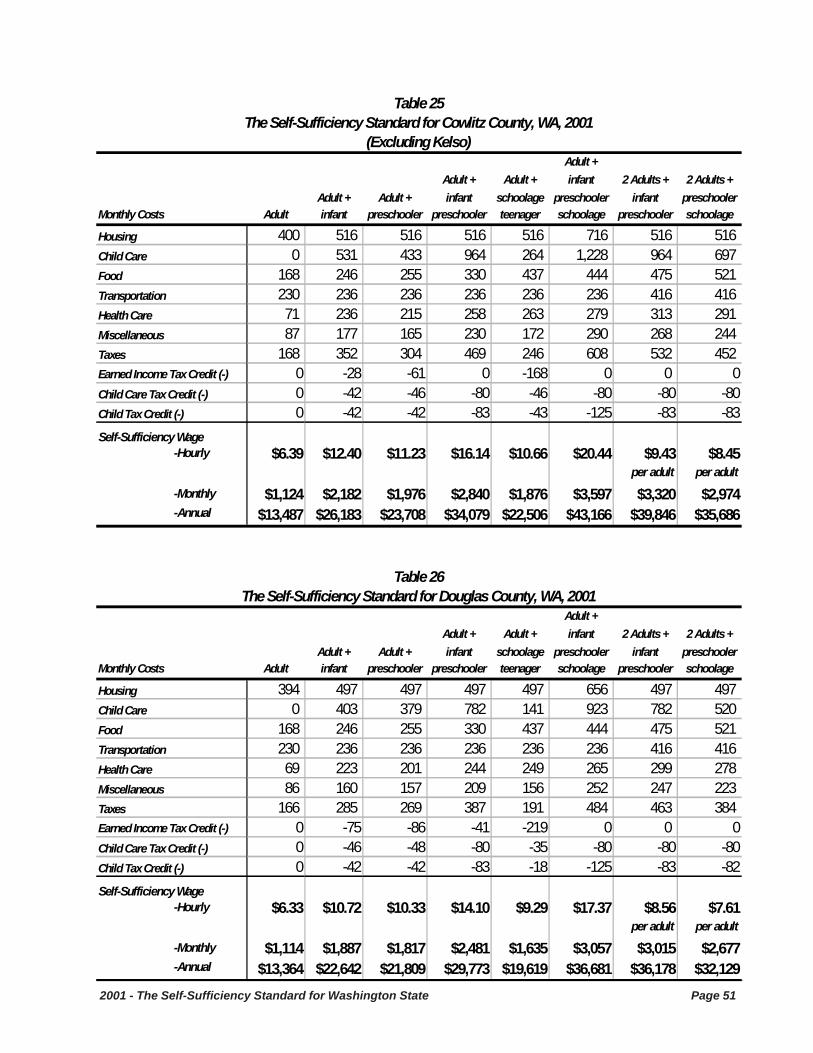
2001 - The Self-Sufficiency Standard for Washington State Page 51
Adult +Adult + Adult + infant 2 Adults + 2 Adults +
Adult + Adult + infant schoolage preschooler infant preschoolerMonthly Costs Adult infant preschooler preschooler teenager schoolage preschooler schoolage
Housing 400 516 516 516 516 716 516 516Child Care 0 531 433 964 264 1,228 964 697Food 168 246 255 330 437 444 475 521Transportation 230 236 236 236 236 236 416 416Health Care 71 236 215 258 263 279 313 291Miscellaneous 87 177 165 230 172 290 268 244Taxes 168 352 304 469 246 608 532 452Earned Income Tax Credit (-) 0 -28 -61 0 -168 0 0 0Child Care Tax Credit (-) 0 -42 -46 -80 -46 -80 -80 -80Child Tax Credit (-) 0 -42 -42 -83 -43 -125 -83 -83Self-Sufficiency Wage -Hourly $6.39 $12.40 $11.23 $16.14 $10.66 $20.44 $9.43 $8.45
per adult per adult -Monthly $1,124 $2,182 $1,976 $2,840 $1,876 $3,597 $3,320 $2,974 -Annual $13,487 $26,183 $23,708 $34,079 $22,506 $43,166 $39,846 $35,686
Adult +Adult + Adult + infant 2 Adults + 2 Adults +
Adult + Adult + infant schoolage preschooler infant preschoolerMonthly Costs Adult infant preschooler preschooler teenager schoolage preschooler schoolage
Housing 394 497 497 497 497 656 497 497Child Care 0 403 379 782 141 923 782 520Food 168 246 255 330 437 444 475 521Transportation 230 236 236 236 236 236 416 416Health Care 69 223 201 244 249 265 299 278Miscellaneous 86 160 157 209 156 252 247 223Taxes 166 285 269 387 191 484 463 384Earned Income Tax Credit (-) 0 -75 -86 -41 -219 0 0 0Child Care Tax Credit (-) 0 -46 -48 -80 -35 -80 -80 -80Child Tax Credit (-) 0 -42 -42 -83 -18 -125 -83 -82Self-Sufficiency Wage -Hourly $6.33 $10.72 $10.33 $14.10 $9.29 $17.37 $8.56 $7.61
per adult per adult -Monthly $1,114 $1,887 $1,817 $2,481 $1,635 $3,057 $3,015 $2,677 -Annual $13,364 $22,642 $21,809 $29,773 $19,619 $36,681 $36,178 $32,129
Table 26The Self-Sufficiency Standard for Douglas County, WA, 2001
Table 25The Self-Sufficiency Standard for Cowlitz County, WA, 2001
(Excluding Kelso)
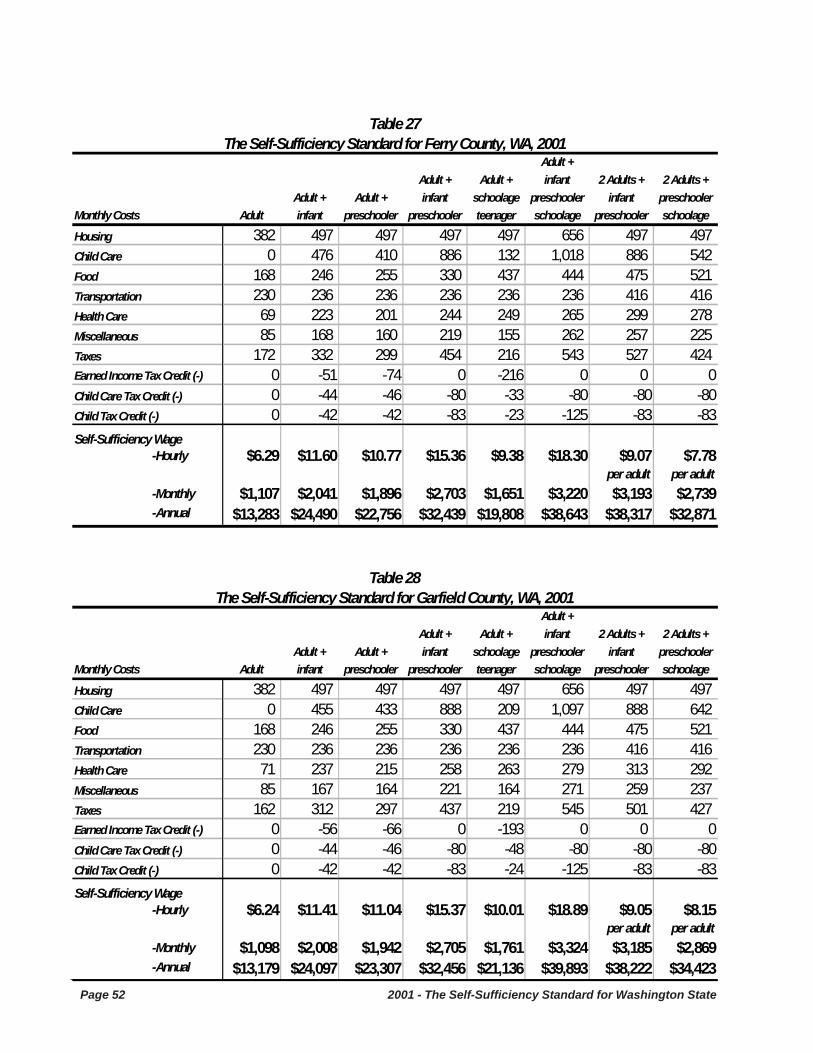
Page 52 2001 - The Self-Sufficiency Standard for Washington State
Adult +Adult + Adult + infant 2 Adults + 2 Adults +
Adult + Adult + infant schoolage preschooler infant preschoolerMonthly Costs Adult infant preschooler preschooler teenager schoolage preschooler schoolageHousing 382 497 497 497 497 656 497 497Child Care 0 476 410 886 132 1,018 886 542Food 168 246 255 330 437 444 475 521Transportation 230 236 236 236 236 236 416 416Health Care 69 223 201 244 249 265 299 278Miscellaneous 85 168 160 219 155 262 257 225Taxes 172 332 299 454 216 543 527 424Earned Income Tax Credit (-) 0 -51 -74 0 -216 0 0 0Child Care Tax Credit (-) 0 -44 -46 -80 -33 -80 -80 -80Child Tax Credit (-) 0 -42 -42 -83 -23 -125 -83 -83Self-Sufficiency Wage -Hourly $6.29 $11.60 $10.77 $15.36 $9.38 $18.30 $9.07 $7.78
per adult per adult -Monthly $1,107 $2,041 $1,896 $2,703 $1,651 $3,220 $3,193 $2,739 -Annual $13,283 $24,490 $22,756 $32,439 $19,808 $38,643 $38,317 $32,871
Adult +Adult + Adult + infant 2 Adults + 2 Adults +
Adult + Adult + infant schoolage preschooler infant preschoolerMonthly Costs Adult infant preschooler preschooler teenager schoolage preschooler schoolage
Housing 382 497 497 497 497 656 497 497Child Care 0 455 433 888 209 1,097 888 642Food 168 246 255 330 437 444 475 521Transportation 230 236 236 236 236 236 416 416Health Care 71 237 215 258 263 279 313 292Miscellaneous 85 167 164 221 164 271 259 237Taxes 162 312 297 437 219 545 501 427Earned Income Tax Credit (-) 0 -56 -66 0 -193 0 0 0Child Care Tax Credit (-) 0 -44 -46 -80 -48 -80 -80 -80Child Tax Credit (-) 0 -42 -42 -83 -24 -125 -83 -83Self-Sufficiency Wage -Hourly $6.24 $11.41 $11.04 $15.37 $10.01 $18.89 $9.05 $8.15
per adult per adult -Monthly $1,098 $2,008 $1,942 $2,705 $1,761 $3,324 $3,185 $2,869 -Annual $13,179 $24,097 $23,307 $32,456 $21,136 $39,893 $38,222 $34,423
Table 27The Self-Sufficiency Standard for Ferry County, WA, 2001
Table 28The Self-Sufficiency Standard for Garfield County, WA, 2001

2001 - The Self-Sufficiency Standard for Washington State Page 53
Adult +Adult + Adult + infant 2 Adults + 2 Adults +
Adult + Adult + infant schoolage preschooler infant preschoolerMonthly Costs Adult infant preschooler preschooler teenager schoolage preschooler schoolageHousing 420 522 522 522 522 689 522 522Child Care 0 455 417 872 179 1,051 872 596Food 168 246 255 330 437 444 475 521Transportation 230 236 236 236 236 236 416 416Health Care 69 223 201 244 249 265 299 278Miscellaneous 89 168 163 220 162 269 258 233Taxes 174 317 295 436 213 537 500 417Earned Income Tax Credit (-) 0 -52 -68 0 -199 0 0 0Child Care Tax Credit (-) 0 -44 -46 -80 -43 -80 -80 -80Child Tax Credit (-) 0 -42 -42 -83 -25 -125 -83 -83Self-Sufficiency Wage -Hourly $6.54 $11.53 $10.99 $15.33 $9.84 $18.67 $9.03 $8.01
per adult per adult -Monthly $1,151 $2,029 $1,934 $2,698 $1,732 $3,287 $3,179 $2,819 -Annual $13,808 $24,343 $23,206 $32,378 $20,788 $39,440 $38,146 $33,831
Adult +Adult + Adult + infant 2 Adults + 2 Adults +
Adult + Adult + infant schoolage preschooler infant preschoolerMonthly Costs Adult infant preschooler preschooler teenager schoolage preschooler schoolage
Housing 382 502 502 502 502 677 502 502Child Care 0 499 433 932 213 1,145 932 646Food 168 246 255 330 437 444 475 521Transportation 230 236 236 236 236 236 416 416Health Care 69 223 201 244 249 265 299 278Miscellaneous 85 171 163 224 164 277 262 236Taxes 162 328 294 451 219 566 515 428Earned Income Tax Credit (-) 0 -45 -69 0 -194 0 0 0Child Care Tax Credit (-) 0 -44 -46 -80 -48 -80 -80 -80Child Tax Credit (-) 0 -42 -42 -83 -23 -125 -83 -83Self-Sufficiency Wage -Hourly $6.23 $11.78 $10.95 $15.66 $9.97 $19.35 $9.20 $8.13
per adult per adult -Monthly $1,097 $2,073 $1,928 $2,757 $1,755 $3,406 $3,238 $2,863 -Annual $13,160 $24,876 $23,132 $33,080 $21,060 $40,867 $38,850 $34,361
Table 29The Self-Sufficiency Standard for Grant County, WA, 2001
Table 30The Self-Sufficiency Standard for Gray's Harbor, WA, 2001
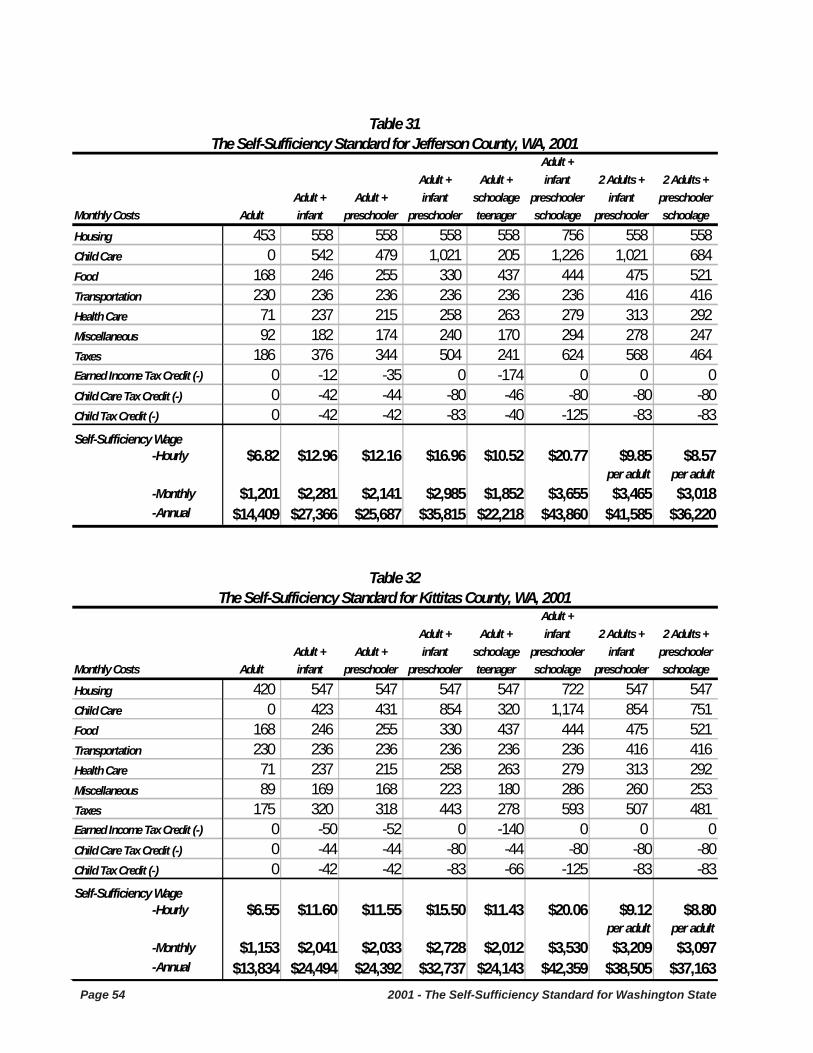
Page 54 2001 - The Self-Sufficiency Standard for Washington State
Adult +Adult + Adult + infant 2 Adults + 2 Adults +
Adult + Adult + infant schoolage preschooler infant preschoolerMonthly Costs Adult infant preschooler preschooler teenager schoolage preschooler schoolageHousing 453 558 558 558 558 756 558 558Child Care 0 542 479 1,021 205 1,226 1,021 684Food 168 246 255 330 437 444 475 521Transportation 230 236 236 236 236 236 416 416Health Care 71 237 215 258 263 279 313 292Miscellaneous 92 182 174 240 170 294 278 247Taxes 186 376 344 504 241 624 568 464Earned Income Tax Credit (-) 0 -12 -35 0 -174 0 0 0Child Care Tax Credit (-) 0 -42 -44 -80 -46 -80 -80 -80Child Tax Credit (-) 0 -42 -42 -83 -40 -125 -83 -83Self-Sufficiency Wage -Hourly $6.82 $12.96 $12.16 $16.96 $10.52 $20.77 $9.85 $8.57
per adult per adult -Monthly $1,201 $2,281 $2,141 $2,985 $1,852 $3,655 $3,465 $3,018 -Annual $14,409 $27,366 $25,687 $35,815 $22,218 $43,860 $41,585 $36,220
Adult +Adult + Adult + infant 2 Adults + 2 Adults +
Adult + Adult + infant schoolage preschooler infant preschoolerMonthly Costs Adult infant preschooler preschooler teenager schoolage preschooler schoolage
Housing 420 547 547 547 547 722 547 547Child Care 0 423 431 854 320 1,174 854 751Food 168 246 255 330 437 444 475 521Transportation 230 236 236 236 236 236 416 416Health Care 71 237 215 258 263 279 313 292Miscellaneous 89 169 168 223 180 286 260 253Taxes 175 320 318 443 278 593 507 481Earned Income Tax Credit (-) 0 -50 -52 0 -140 0 0 0Child Care Tax Credit (-) 0 -44 -44 -80 -44 -80 -80 -80Child Tax Credit (-) 0 -42 -42 -83 -66 -125 -83 -83Self-Sufficiency Wage -Hourly $6.55 $11.60 $11.55 $15.50 $11.43 $20.06 $9.12 $8.80
per adult per adult -Monthly $1,153 $2,041 $2,033 $2,728 $2,012 $3,530 $3,209 $3,097 -Annual $13,834 $24,494 $24,392 $32,737 $24,143 $42,359 $38,505 $37,163
Table 31The Self-Sufficiency Standard for Jefferson County, WA, 2001
Table 32The Self-Sufficiency Standard for Kittitas County, WA, 2001
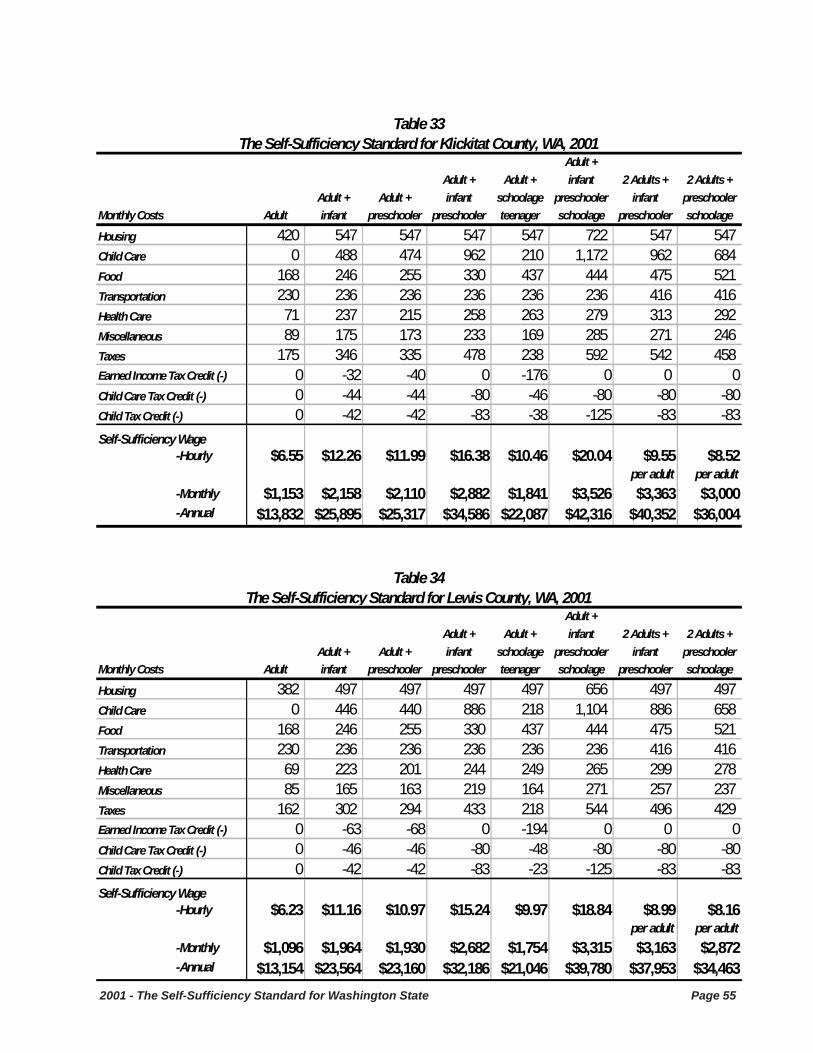
2001 - The Self-Sufficiency Standard for Washington State Page 55
Adult +Adult + Adult + infant 2 Adults + 2 Adults +
Adult + Adult + infant schoolage preschooler infant preschoolerMonthly Costs Adult infant preschooler preschooler teenager schoolage preschooler schoolageHousing 420 547 547 547 547 722 547 547Child Care 0 488 474 962 210 1,172 962 684Food 168 246 255 330 437 444 475 521Transportation 230 236 236 236 236 236 416 416Health Care 71 237 215 258 263 279 313 292Miscellaneous 89 175 173 233 169 285 271 246Taxes 175 346 335 478 238 592 542 458Earned Income Tax Credit (-) 0 -32 -40 0 -176 0 0 0Child Care Tax Credit (-) 0 -44 -44 -80 -46 -80 -80 -80Child Tax Credit (-) 0 -42 -42 -83 -38 -125 -83 -83Self-Sufficiency Wage -Hourly $6.55 $12.26 $11.99 $16.38 $10.46 $20.04 $9.55 $8.52
per adult per adult -Monthly $1,153 $2,158 $2,110 $2,882 $1,841 $3,526 $3,363 $3,000 -Annual $13,832 $25,895 $25,317 $34,586 $22,087 $42,316 $40,352 $36,004
Adult +Adult + Adult + infant 2 Adults + 2 Adults +
Adult + Adult + infant schoolage preschooler infant preschoolerMonthly Costs Adult infant preschooler preschooler teenager schoolage preschooler schoolage
Housing 382 497 497 497 497 656 497 497Child Care 0 446 440 886 218 1,104 886 658Food 168 246 255 330 437 444 475 521Transportation 230 236 236 236 236 236 416 416Health Care 69 223 201 244 249 265 299 278Miscellaneous 85 165 163 219 164 271 257 237Taxes 162 302 294 433 218 544 496 429Earned Income Tax Credit (-) 0 -63 -68 0 -194 0 0 0Child Care Tax Credit (-) 0 -46 -46 -80 -48 -80 -80 -80Child Tax Credit (-) 0 -42 -42 -83 -23 -125 -83 -83Self-Sufficiency Wage -Hourly $6.23 $11.16 $10.97 $15.24 $9.97 $18.84 $8.99 $8.16
per adult per adult -Monthly $1,096 $1,964 $1,930 $2,682 $1,754 $3,315 $3,163 $2,872 -Annual $13,154 $23,564 $23,160 $32,186 $21,046 $39,780 $37,953 $34,463
Table 33The Self-Sufficiency Standard for Klickitat County, WA, 2001
Table 34The Self-Sufficiency Standard for Lewis County, WA, 2001
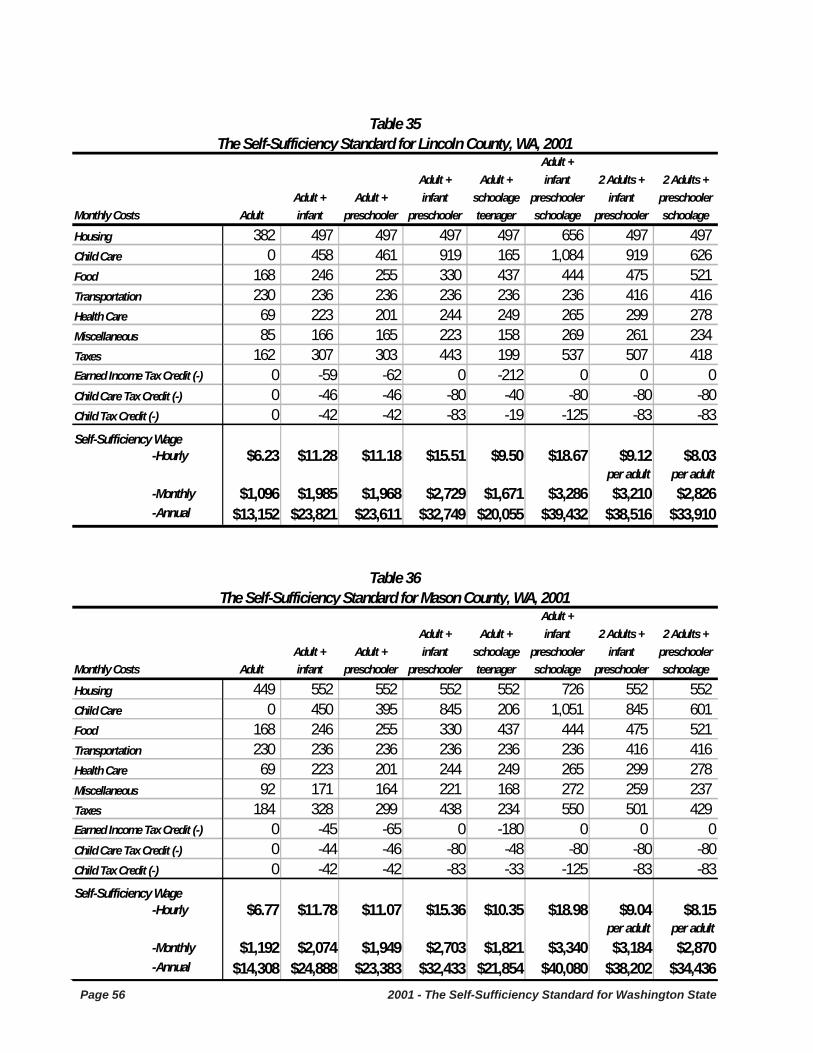
Page 56 2001 - The Self-Sufficiency Standard for Washington State
Adult +Adult + Adult + infant 2 Adults + 2 Adults +
Adult + Adult + infant schoolage preschooler infant preschoolerMonthly Costs Adult infant preschooler preschooler teenager schoolage preschooler schoolageHousing 382 497 497 497 497 656 497 497Child Care 0 458 461 919 165 1,084 919 626Food 168 246 255 330 437 444 475 521Transportation 230 236 236 236 236 236 416 416Health Care 69 223 201 244 249 265 299 278Miscellaneous 85 166 165 223 158 269 261 234Taxes 162 307 303 443 199 537 507 418Earned Income Tax Credit (-) 0 -59 -62 0 -212 0 0 0Child Care Tax Credit (-) 0 -46 -46 -80 -40 -80 -80 -80Child Tax Credit (-) 0 -42 -42 -83 -19 -125 -83 -83Self-Sufficiency Wage -Hourly $6.23 $11.28 $11.18 $15.51 $9.50 $18.67 $9.12 $8.03
per adult per adult -Monthly $1,096 $1,985 $1,968 $2,729 $1,671 $3,286 $3,210 $2,826 -Annual $13,152 $23,821 $23,611 $32,749 $20,055 $39,432 $38,516 $33,910
Adult +Adult + Adult + infant 2 Adults + 2 Adults +
Adult + Adult + infant schoolage preschooler infant preschoolerMonthly Costs Adult infant preschooler preschooler teenager schoolage preschooler schoolage
Housing 449 552 552 552 552 726 552 552Child Care 0 450 395 845 206 1,051 845 601Food 168 246 255 330 437 444 475 521Transportation 230 236 236 236 236 236 416 416Health Care 69 223 201 244 249 265 299 278Miscellaneous 92 171 164 221 168 272 259 237Taxes 184 328 299 438 234 550 501 429Earned Income Tax Credit (-) 0 -45 -65 0 -180 0 0 0Child Care Tax Credit (-) 0 -44 -46 -80 -48 -80 -80 -80Child Tax Credit (-) 0 -42 -42 -83 -33 -125 -83 -83Self-Sufficiency Wage -Hourly $6.77 $11.78 $11.07 $15.36 $10.35 $18.98 $9.04 $8.15
per adult per adult -Monthly $1,192 $2,074 $1,949 $2,703 $1,821 $3,340 $3,184 $2,870 -Annual $14,308 $24,888 $23,383 $32,433 $21,854 $40,080 $38,202 $34,436
Table 35The Self-Sufficiency Standard for Lincoln County, WA, 2001
Table 36The Self-Sufficiency Standard for Mason County, WA, 2001

2001 - The Self-Sufficiency Standard for Washington State Page 57
Adult +Adult + Adult + infant 2 Adults + 2 Adults +
Adult + Adult + infant schoolage preschooler infant preschoolerMonthly Costs Adult infant preschooler preschooler teenager schoolage preschooler schoolageHousing 420 547 547 547 547 656 547 547Child Care 0 402 436 838 147 985 838 583Food 168 246 255 330 437 444 475 521Transportation 230 236 236 236 236 236 416 416Health Care 69 223 201 244 249 265 299 278Miscellaneous 89 165 167 220 162 259 257 234Taxes 174 304 314 433 210 504 497 420Earned Income Tax Credit (-) 0 -61 -54 0 -201 0 0 0Child Care Tax Credit (-) 0 -46 -44 -80 -35 -80 -80 -80Child Tax Credit (-) 0 -42 -42 -83 -31 -125 -83 -83Self-Sufficiency Wage -Hourly $6.54 $11.22 $11.45 $15.25 $9.78 $17.86 $8.99 $8.06
per adult per adult -Monthly $1,150 $1,974 $2,016 $2,685 $1,721 $3,144 $3,165 $2,836 -Annual $13,805 $23,691 $24,192 $32,217 $20,652 $37,731 $37,984 $34,030
Adult +Adult + Adult + infant 2 Adults + 2 Adults +
Adult + Adult + infant schoolage preschooler infant preschoolerMonthly Costs Adult infant preschooler preschooler teenager schoolage preschooler schoolage
Housing 382 497 497 497 497 656 497 497Child Care 0 443 433 876 201 1,077 876 634Food 168 246 255 330 437 444 475 521Transportation 230 236 236 236 236 236 416 416Health Care 71 237 215 258 263 279 313 292Miscellaneous 85 166 164 220 163 269 258 236Taxes 162 307 297 434 217 540 498 426Earned Income Tax Credit (-) 0 -60 -66 0 -195 0 0 0Child Care Tax Credit (-) 0 -46 -46 -80 -48 -80 -80 -80Child Tax Credit (-) 0 -42 -42 -83 -23 -125 -83 -83Self-Sufficiency Wage -Hourly $6.24 $11.27 $11.04 $15.27 $9.94 $18.73 $9.00 $8.12
per adult per adult -Monthly $1,099 $1,984 $1,943 $2,688 $1,750 $3,297 $3,169 $2,858 -Annual $13,183 $23,808 $23,317 $32,260 $20,995 $39,562 $38,028 $34,297
Table 38The Self-Sufficiency Standard for Pacific County, WA, 2001
Table 37The Self-Sufficiency Standard for Okanogan County, WA, 2001

Page 58 2001 - The Self-Sufficiency Standard for Washington State
Adult +Adult + Adult + infant 2 Adults + 2 Adults +
Adult + Adult + infant schoolage preschooler infant preschoolerMonthly Costs Adult infant preschooler preschooler teenager schoolage preschooler schoolageHousing 420 547 547 547 547 722 547 547Child Care 0 390 414 804 151 955 804 565Food 168 246 255 330 437 444 475 521Transportation 230 236 236 236 236 236 416 416Health Care 69 223 201 244 249 265 299 278Miscellaneous 89 164 165 216 162 262 254 233Taxes 174 299 304 418 211 515 485 414Earned Income Tax Credit (-) 0 -65 -61 -12 -200 0 0 0Child Care Tax Credit (-) 0 -46 -46 -80 -36 -80 -80 -80Child Tax Credit (-) 0 -42 -42 -83 -31 -125 -83 -83Self-Sufficiency Wage -Hourly $6.54 $11.09 $11.21 $14.89 $9.81 $18.16 $8.85 $7.98
per adult per adult -Monthly $1,150 $1,952 $1,973 $2,621 $1,727 $3,195 $3,116 $2,810 -Annual $13,804 $23,428 $23,673 $31,450 $20,724 $38,345 $37,396 $33,717
Adult +Adult + Adult + infant 2 Adults + 2 Adults +
Adult + Adult + infant schoolage preschooler infant preschoolerMonthly Costs Adult infant preschooler preschooler teenager schoolage preschooler schoolage
Housing 538 717 717 717 717 945 717 717Child Care 0 622 719 1,341 233 1,574 1,341 952Food 168 246 255 330 437 444 475 521Transportation 230 236 236 236 236 236 416 416Health Care 71 237 215 258 263 279 313 292Miscellaneous 101 206 214 288 189 348 326 290Taxes 214 458 486 661 308 800 725 604Earned Income Tax Credit (-) 0 0 0 0 -112 0 0 0Child Care Tax Credit (-) 0 -40 -40 -80 -44 -80 -80 -80Child Tax Credit (-) 0 -42 -42 -83 -83 -125 -83 -83Self-Sufficiency Wage -Hourly $7.51 $15.00 $15.69 $20.85 $12.18 $25.13 $11.79 $10.31
per adult per adult -Monthly $1,322 $2,640 $2,761 $3,669 $2,144 $4,422 $4,150 $3,628 -Annual $15,862 $31,680 $33,129 $44,028 $25,732 $53,065 $49,795 $43,538
Table 39The Self-Sufficiency Standard for Pend Oreille County, WA, 2001
Table 40The Self-Sufficiency Standard for San Juan County, WA, 2001
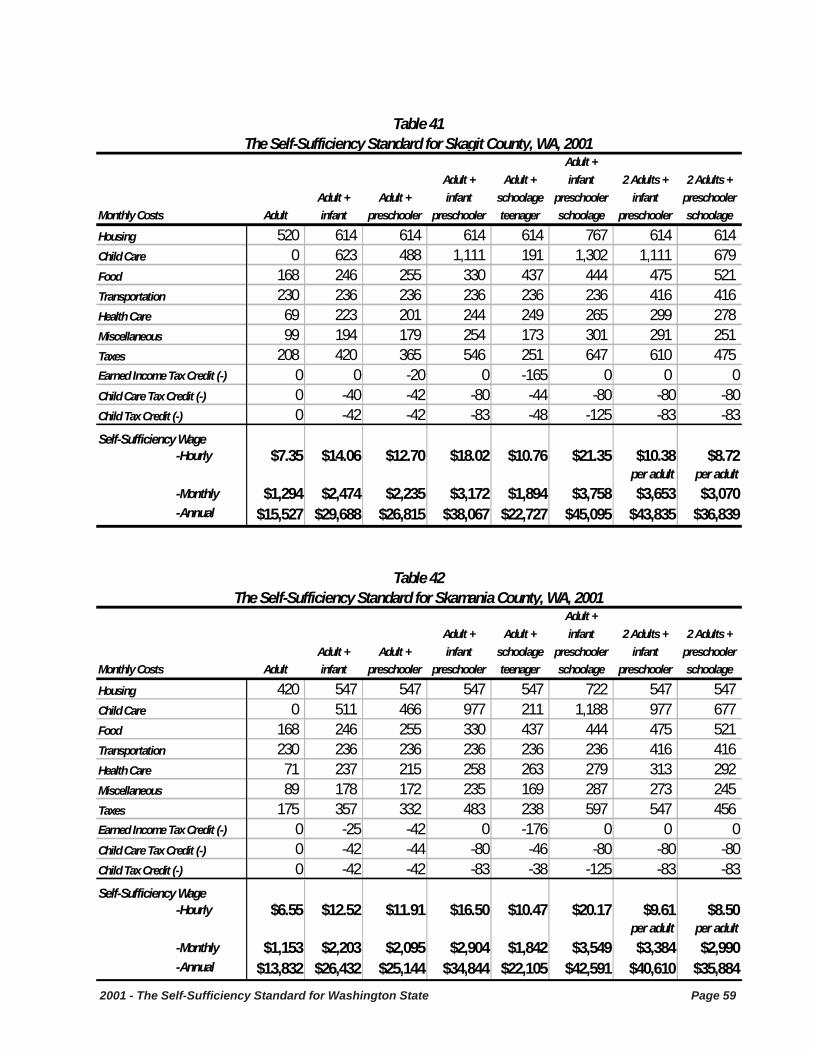
2001 - The Self-Sufficiency Standard for Washington State Page 59
Adult +Adult + Adult + infant 2 Adults + 2 Adults +
Adult + Adult + infant schoolage preschooler infant preschoolerMonthly Costs Adult infant preschooler preschooler teenager schoolage preschooler schoolageHousing 520 614 614 614 614 767 614 614Child Care 0 623 488 1,111 191 1,302 1,111 679Food 168 246 255 330 437 444 475 521Transportation 230 236 236 236 236 236 416 416Health Care 69 223 201 244 249 265 299 278Miscellaneous 99 194 179 254 173 301 291 251Taxes 208 420 365 546 251 647 610 475Earned Income Tax Credit (-) 0 0 -20 0 -165 0 0 0Child Care Tax Credit (-) 0 -40 -42 -80 -44 -80 -80 -80Child Tax Credit (-) 0 -42 -42 -83 -48 -125 -83 -83Self-Sufficiency Wage -Hourly $7.35 $14.06 $12.70 $18.02 $10.76 $21.35 $10.38 $8.72
per adult per adult -Monthly $1,294 $2,474 $2,235 $3,172 $1,894 $3,758 $3,653 $3,070 -Annual $15,527 $29,688 $26,815 $38,067 $22,727 $45,095 $43,835 $36,839
Adult +Adult + Adult + infant 2 Adults + 2 Adults +
Adult + Adult + infant schoolage preschooler infant preschoolerMonthly Costs Adult infant preschooler preschooler teenager schoolage preschooler schoolage
Housing 420 547 547 547 547 722 547 547Child Care 0 511 466 977 211 1,188 977 677Food 168 246 255 330 437 444 475 521Transportation 230 236 236 236 236 236 416 416Health Care 71 237 215 258 263 279 313 292Miscellaneous 89 178 172 235 169 287 273 245Taxes 175 357 332 483 238 597 547 456Earned Income Tax Credit (-) 0 -25 -42 0 -176 0 0 0Child Care Tax Credit (-) 0 -42 -44 -80 -46 -80 -80 -80Child Tax Credit (-) 0 -42 -42 -83 -38 -125 -83 -83Self-Sufficiency Wage -Hourly $6.55 $12.52 $11.91 $16.50 $10.47 $20.17 $9.61 $8.50
per adult per adult -Monthly $1,153 $2,203 $2,095 $2,904 $1,842 $3,549 $3,384 $2,990 -Annual $13,832 $26,432 $25,144 $34,844 $22,105 $42,591 $40,610 $35,884
Table 42The Self-Sufficiency Standard for Skamania County, WA, 2001
Table 41The Self-Sufficiency Standard for Skagit County, WA, 2001
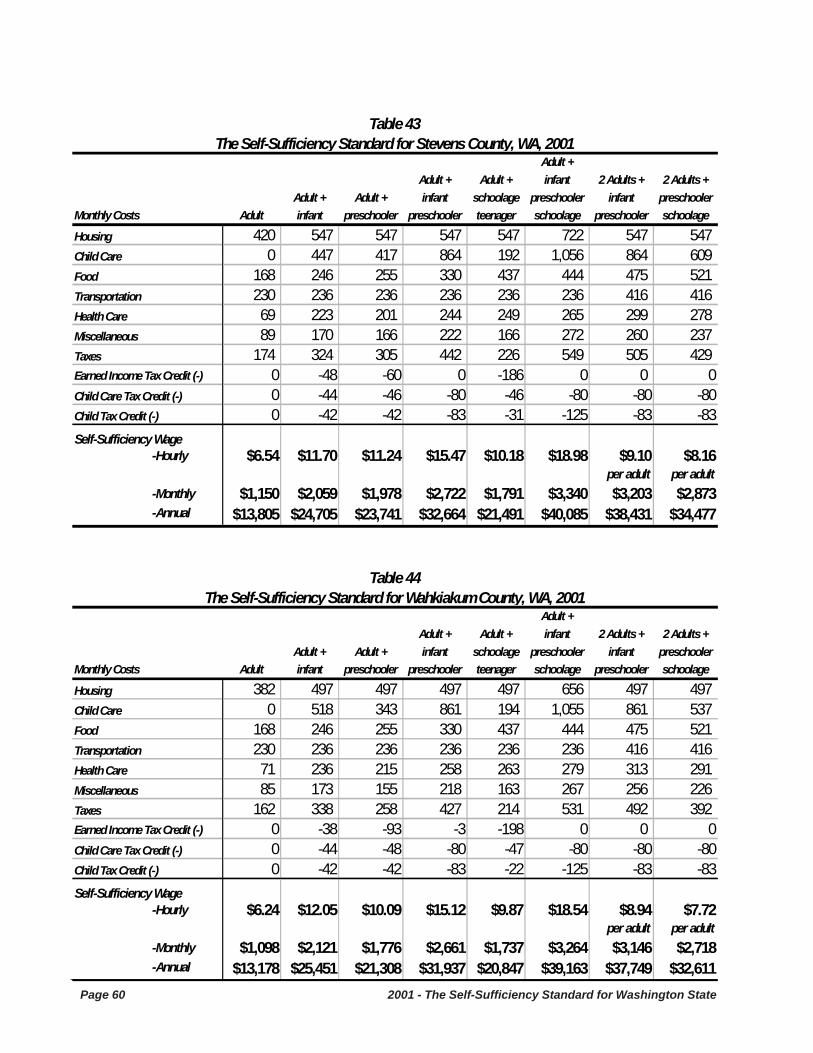
Page 60 2001 - The Self-Sufficiency Standard for Washington State
Adult +Adult + Adult + infant 2 Adults + 2 Adults +
Adult + Adult + infant schoolage preschooler infant preschoolerMonthly Costs Adult infant preschooler preschooler teenager schoolage preschooler schoolageHousing 420 547 547 547 547 722 547 547Child Care 0 447 417 864 192 1,056 864 609Food 168 246 255 330 437 444 475 521Transportation 230 236 236 236 236 236 416 416Health Care 69 223 201 244 249 265 299 278Miscellaneous 89 170 166 222 166 272 260 237Taxes 174 324 305 442 226 549 505 429Earned Income Tax Credit (-) 0 -48 -60 0 -186 0 0 0Child Care Tax Credit (-) 0 -44 -46 -80 -46 -80 -80 -80Child Tax Credit (-) 0 -42 -42 -83 -31 -125 -83 -83Self-Sufficiency Wage -Hourly $6.54 $11.70 $11.24 $15.47 $10.18 $18.98 $9.10 $8.16
per adult per adult -Monthly $1,150 $2,059 $1,978 $2,722 $1,791 $3,340 $3,203 $2,873 -Annual $13,805 $24,705 $23,741 $32,664 $21,491 $40,085 $38,431 $34,477
Adult +Adult + Adult + infant 2 Adults + 2 Adults +
Adult + Adult + infant schoolage preschooler infant preschoolerMonthly Costs Adult infant preschooler preschooler teenager schoolage preschooler schoolage
Housing 382 497 497 497 497 656 497 497Child Care 0 518 343 861 194 1,055 861 537Food 168 246 255 330 437 444 475 521Transportation 230 236 236 236 236 236 416 416Health Care 71 236 215 258 263 279 313 291Miscellaneous 85 173 155 218 163 267 256 226Taxes 162 338 258 427 214 531 492 392Earned Income Tax Credit (-) 0 -38 -93 -3 -198 0 0 0Child Care Tax Credit (-) 0 -44 -48 -80 -47 -80 -80 -80Child Tax Credit (-) 0 -42 -42 -83 -22 -125 -83 -83Self-Sufficiency Wage -Hourly $6.24 $12.05 $10.09 $15.12 $9.87 $18.54 $8.94 $7.72
per adult per adult -Monthly $1,098 $2,121 $1,776 $2,661 $1,737 $3,264 $3,146 $2,718 -Annual $13,178 $25,451 $21,308 $31,937 $20,847 $39,163 $37,749 $32,611
Table 43The Self-Sufficiency Standard for Stevens County, WA, 2001
Table 44The Self-Sufficiency Standard for Wahkiakum County, WA, 2001

2001 - The Self-Sufficiency Standard for Washington State Page 61
Adult +Adult + Adult + infant 2 Adults + 2 Adults +
Adult + Adult + infant schoolage preschooler infant preschoolerMonthly Costs Adult infant preschooler preschooler teenager schoolage preschooler schoolageHousing 382 497 497 497 497 665 497 497Child Care 0 461 433 894 186 1,080 894 619Food 168 246 255 330 437 444 475 521Transportation 230 236 236 236 236 236 416 416Health Care 69 223 201 244 249 265 299 278Miscellaneous 85 166 162 220 161 269 258 233Taxes 162 309 292 436 207 540 500 417Earned Income Tax Credit (-) 0 -58 -70 0 -204 0 0 0Child Care Tax Credit (-) 0 -46 -46 -80 -45 -80 -80 -80Child Tax Credit (-) 0 -42 -42 -83 -19 -125 -83 -83Self-Sufficiency Wage -Hourly $6.23 $11.32 $10.90 $15.31 $9.69 $18.72 $9.02 $8.00
per adult per adult -Monthly $1,096 $1,992 $1,918 $2,694 $1,705 $3,295 $3,175 $2,817 -Annual $13,158 $23,899 $23,018 $32,334 $20,458 $39,535 $38,103 $33,804
Adult +Adult + Adult + infant 2 Adults + 2 Adults +
Adult + Adult + infant schoolage preschooler infant preschoolerMonthly Costs Adult infant preschooler preschooler teenager schoolage preschooler schoolage
Housing 430 573 573 573 573 795 573 573Child Care 0 414 455 869 193 1,062 869 648Food 168 246 255 330 437 444 475 521Transportation 230 236 236 236 236 236 416 416Health Care 71 237 215 258 263 279 313 292Miscellaneous 90 171 173 227 170 282 265 245Taxes 178 327 338 457 241 580 520 455Earned Income Tax Credit (-) 0 -46 -37 0 -173 0 0 0Child Care Tax Credit (-) 0 -44 -44 -80 -44 -80 -80 -80Child Tax Credit (-) 0 -42 -42 -83 -42 -125 -83 -83Self-Sufficiency Wage -Hourly $6.63 $11.77 $12.06 $15.83 $10.54 $19.74 $9.28 $8.48
per adult per adult -Monthly $1,167 $2,072 $2,123 $2,787 $1,855 $3,474 $3,267 $2,986 -Annual $14,005 $24,858 $25,472 $33,438 $22,257 $41,685 $39,205 $35,836
Table 46The Self-Sufficiency Standard for Whitman County, WA, 2001
Table 45The Self-Sufficiency Standard for Walla Walla County, WA, 2001