The Self-Sufficiency STandard for new york state 2010 Self-Sufficiency STandard FOR NEW YORk STATE...
106
THE SELF-SUFFICIENCY STANDARD FOR NEW YORK STATE 2010 Prepared for the New York State Self-Sufficiency Standard Steering Committee
-
Upload
trinhquynh -
Category
Documents
-
view
230 -
download
0
Transcript of The Self-Sufficiency STandard for new york state 2010 Self-Sufficiency STandard FOR NEW YORk STATE...
The Self-Sufficiency STandard for new york state 2010Prepared for the New York State Self-Sufficiency Standard Steering Committee
NEW YORK STATE SELF-SUFFICENCY STANDARD STEERING COMMITTEEThe New York State Self-Sufficiency Standard was overseen by a dedicated group of Steering Group Committee
Members led by representatives from the Empire Justice Center and the New York State Community Action
Association. Organizations represented on the Steering Committee are all dedicated to helping families and
individuals achieve economic security and work to provide opportunities for all.
Steering Committee Members
Susan Antos, Empire Justice Center; Carolyn Boldiston, Fiscal Policy Institute; Ron Deutsch, New Yorkers for
Fiscal Fairness; Denise Harlow, NYS Community Action Association; Michele Mattingly, Fiscal Policy Institute
Janaki Parthasarathy, Early Care and Learning Council; Merble Reagon, Women’s Center for Education and
Career Advancement; Carol Saginaw, Early Care and Learning Council; Russ Simon, New York Association of
Training and Employment Professionals; Myrna Young, Everywoman Opportunity Center
For More Information Contact: Susan Antos Denise Harlow Empire Justice Center NYS Community Action Association 119 Washington Avenue 2 Charles Boulevard Albany, NY 12210 Guilderland, NY 12084 (518) 462-6831 (518) 690-0491 [email protected] [email protected]
The Self-Sufficiency STandard FOR NEW YORk STATE 2010By Diana M. Pearce, PhD • June 2010
DIRECTOR, CENTER FOR WOMEN’S WELFARE
UNIVERSITY OF WASHINGTON SCHOOL OF SOCIAL WORK
PREPARED FOR THE NEW YORK STATE SELF-SUFFICIENCY STANDARD STEERING COMMITTEE
The Self-Sufficiency Standard for New York State 2010©2010 Diana Pearce, New York State Community Action Association, Inc., and Wider Opportunities for Women
A bout the AuthorDiana M. Pearce, PhD teaches at the School of Social Work, University of Washington in Seattle, Washington,
and is Director of the Center for Women’s Welfare. Recognized for coining the phrase “the feminization of
poverty,” Dr. Pearce founded and directed the Women and Poverty Project at Wider Opportunities for Women
(WOW). She has written and spoken widely on women’s poverty and economic inequality, including testimony
before Congress and the President’s Working Group on Welfare Reform. While at WOW, Dr. Pearce conceived
and developed the methodology for the Self-Sufficiency Standard and first published results in 1996 for Iowa
and California. Her areas of expertise include low-wage and part-time employment, unemployment insurance,
homelessness, and welfare reform as they impact women. Dr. Pearce has helped found and lead several
coalitions, including the Women, Work and Welfare Coalition and the Women and Job Training Coalition. She
received her PhD degree in Sociology and Social Work from the University of Michigan.
A bout the Center fo r Women’s Wel fa reThe Center for Women’s Welfare at the University of Washington School of Social Work is devoted to
furthering the goal of economic justice for women and their families. The main work of the Center focuses
on the development of the Self-Sufficiency Standard. Under the direction of Dr. Diana Pearce, the Center
partners with a range of government, non-profit, women’s, children’s, and community-based groups to:
research and evaluate public policy related to income adequacy•create tools to assess and establish income adequacy •develop programs and policies that strengthen public investment in low-income women, children, •and families.
For more information about the Center’s programs, or work related to the Self-Sufficiency Standard, call
(206) 685-5264. This report and more can be viewed at http://www.selfsufficiencystandard.org.
Center for Women’s Welfare…advancing economic justice through research and the Sel f-Sufficiency Standard
Pre faceThe Self-Sufficiency Standard for New York State 2010 measures how much income a family of a certain
composition in a given place must earn to meet their basic needs. Employers, advocates, and legislators can
use it to evaluate wages, provide career counseling, and create programs that lead to self-sufficiency for
working families.
The 2010 New York Self-Sufficiency Standard is the second edition. The New York State Self-Sufficiency
Standard Steering Committee arranged for this and the previous edition, which was published in 2000. As
with all Self-Sufficiency Standard reports, this report was authored by Dr. Diana M. Pearce and produced
by the Center for Women’s Welfare at the University of Washington. This report, including county specific
information for more than 70 family types, is available online at http://www.selfsufficiencystandard.org,
http://www.nyscommunityaction.org, and http://www.fiscalpolicy.org. Hardcopies of this report may be
ordered by calling the New York State Community Action Association at (518) 690-0491.
Dr. Diana Pearce developed the Self-Sufficiency Standard while she was the Director of the Women and
Poverty Project at Wider Opportunities for Women (WOW). The Ford Foundation provided funding for
the Standard’s original development. WOW established the national Family Economic Self-Sufficiency
(FESS) Project in 1996 in partnership with the Ms. Foundation for Women, the Corporation for Enterprise
Development, and the National Economic Development and Law Center. Over 2,500 community- and state-
based organizations and agencies, representing a broad range of sectors, are connected through the FESS
Project network.
Over the past 14 years, the Standard has now been calculated in 37 states and the District of Columbia
as well as New York City, and it has revolutionized the way policies and programs for low-income workers
are structured and what it means to be in need in the United States. At the national level, WOW has led
work on the incorporation of the Self-Sufficiency Standard and the concept of self-sufficiency in federal
law and policy, such as in workforce training and “green jobs” programs. For more information about the
FESS Project, visit the website: http://www.wowonline.org/ourprograms/fess or by contacting the Family
Economic Self-Sufficiency Project Director Donna Addkison at (202) 464-1596.
Acknowled gement s
The Self-Sufficiency Standard for New York State 2010 has been prepared through the cooperative efforts of
Sarah Lowry and Lisa Manzer at the University of Washington, Center for Women’s Welfare, Denise Harlow of
the New York State Community Action Association, Inc., and Susan Antos of the Empire Justice Center.
The following members of the New York State Self-Sufficiency Standard Steering Committee have also
contributed to the production of this report: Carolyn Boldiston and Michele Mattingly, Fiscal Policy Institute;
Ron Deutsch, New Yorkers for Fiscal Fairness; Myrna Young, Everywoman Opportunity Center; Janaki
Parthasarathy, Early Care and Learning Council; Merble Reagon, Women’s Center for Education and Career
Advancement; Carol Saginaw, Early Care and Learning Council; and, Russ Simon, New York Association of
Training and Employment Professionals.
Support and funding for the project was provided by the New York State Office of Children and Family
Services (OCFS). The Steering Committee would like to thank Commissioner Gladys Carrión, Esq. and Robert
Resnick of OCFS for their support and tireless efforts to make this report a reality.
A number of other people have also contributed to the development of the Standard, its calculation, and/
or the writing of state reports over the past 14 years. Jennifer Brooks, Maureen Golga, and kate Farrar,
former Directors of Self-Sufficiency Programs and Policies at WOW, have been key to the development of
initiatives that promote the concept of self-sufficiency and the use of the Standard, and were instrumental
in facilitating and nurturing Family Economic Self-Sufficiency (FESS) state coalitions. Additional past
contributors to the Standard have included Laura Henze Russell, Janice Hamilton Outtz, Roberta Spalter-
Roth, Antonia Juhasz, Alice Gates, Alesha Durfee, Melanie Lavelle, Nina Dunning, Maureen Newby, and Seook
Jeong.
The conclusions and opinions contained within this document do not necessarily reflect the opinions of those
listed above. Any mistakes are the author’s responsibility.
E xecut i ve Summar y
The Self-Sufficiency Standard for New York State 2010 provides a detailed measure of what it takes to make
ends meet in New York State without public or private assistance. The Self-Sufficiency Standard is based on
the costs of six basic needs for working families: housing, child care, food, health care, transportation, and
miscellaneous items as well as the cost of taxes and the impact of tax credits.
This report begins with an explanation of how the Self-Sufficiency Standard measures income adequacy. The
report leads readers through a description of what a self-sufficient wage is for New York families, how the
Standard compares to other commonly used benchmarks of income, and how it compares to other places in
the United States. For families without an adequate income, this report models how public supports, such
as child care assistance, can be a valuable resource to help families cover their basic needs as they move
towards self-sufficiency. This report concludes with a discussion of how the Self-Sufficiency Standard can be
used in New York as a tool to aid in counseling clients, to evaluate program performance, to inform policy
making, and to improve poverty research. Also, Appendix C of this report provides detailed tables of the
costs of meeting basic needs and the Self-Sufficiency Wages for ten selected family configurations in every
county of New York. The extended version of the same tables—for 70 different family configurations—is
available at http://www.selfsufficiencystandard.org/pubs.html, http://www.nyscommunityaction.org, and
http://fiscalpolicy.org.
Below are several key findings from The Self-Sufficiency Standard for New York State 2010:
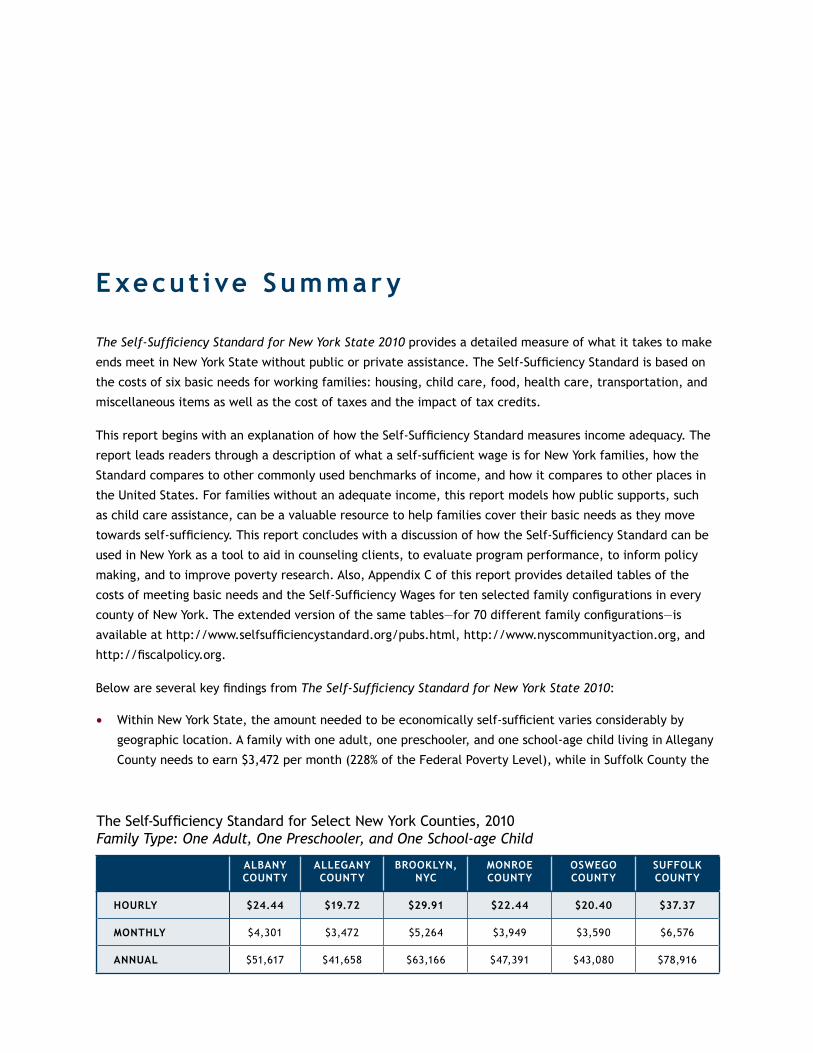
Within New York State, the amount needed to be economically self-sufficient varies considerably by •geographic location. A family with one adult, one preschooler, and one school-age child living in Allegany
County needs to earn $3,472 per month (228% of the Federal Poverty Level), while in Suffolk County the
The Self-Sufficiency Standard for Select New York Counties, 2010 Family Type: One Adult, One Preschooler, and One School-age Child
albany COUNTY
ALLEGANY COUNTY
BROOKLYN, NYC
MONROE COUNTY
OSWEGO COUNTY
suffolk COUNTY
Hourly $24.44 $19.72 $29.91 $22.44 $20.40 $37.37
MONTHLY $4,301 $3,472 $5,264 $3,949 $3,590 $6,576
annual $51,617 $41,658 $63,166 $47,391 $43,080 $78,916
same family type must earn $6,576 per month (431% of the Federal Poverty Level) to be self-sufficient.
The Standard also varies depending on how many adults and children are in a family and the age of •each child. One adult living in Albany County needs a monthly income of $1,806 to meet basic needs.
If the adult has a preschooler and a school-age child, the amount necessary to be economically secure
increases to $4,301 per month. For families with young children, the cost of housing and child care
combined typically make up at least 50% of the family’s budget.
The cost of meeting basic needs has increased considerably over the past decade throughout New York, •while median earnings among New York workers has increased at a much lower rate. Furthermore, only
one of New York’s ten most common occupations—registered nurses—pays median earnings that are above
the Standard for one adult, one preschooler, and one school-age child in Albany County.
As New York recovers from the current recession, long-term economic prosperity will require responsible
planning that puts all New Yorkers on the path to self-sufficiency. A strong economy will mean good jobs that
pay Self-Sufficiency Wages and a workforce with the skills necessary to fill those jobs. The Self-Sufficiency
Standard for New York State 2010 defines the income needed to realistically support a family, without
public or private assistance. For most workers across the state, the Self-Sufficiency Standard shows that
earnings well above the official Federal Poverty Level are nevertheless far below what is needed to meet
families’ basic needs. By publishing the Standard in New York, the New York State Self-Sufficiency Standard
Steering Committee demonstrates a commitment to utilizing the best tools to ensure New York families and
individuals achieve real economic security.
Table o f Content s
Introduction • 1
How Much is Enough in New York State? • 9
Comparing the Standard to Other Benchmarks of Income • 13
Comparison of the New York Standard to Other U.S. Cities • 15
The Self-Sufficiency Wage Over Time • 16
Modeling the Impact of Work Supports • 18
Closing the Gap Between Wages and the Standard • 27
How the Self-Sufficiency Standard Has Been Used • 32
Conclusion • 35
Endnotes • 36
Appendix A: Methodology, Assumptions and Sources • 40
Appendix B: Examples of How the Standard Has Been Used • 51
Appendix C: The Self-Sufficiency Standard for Select Family Types in New York • 57
Appendix D: The Self-Sufficiency Standard as a Percent of the Federal Poverty Level, 2010 • 91
Appendix E: Impact of Work Supports on Wage Adequacy • 93

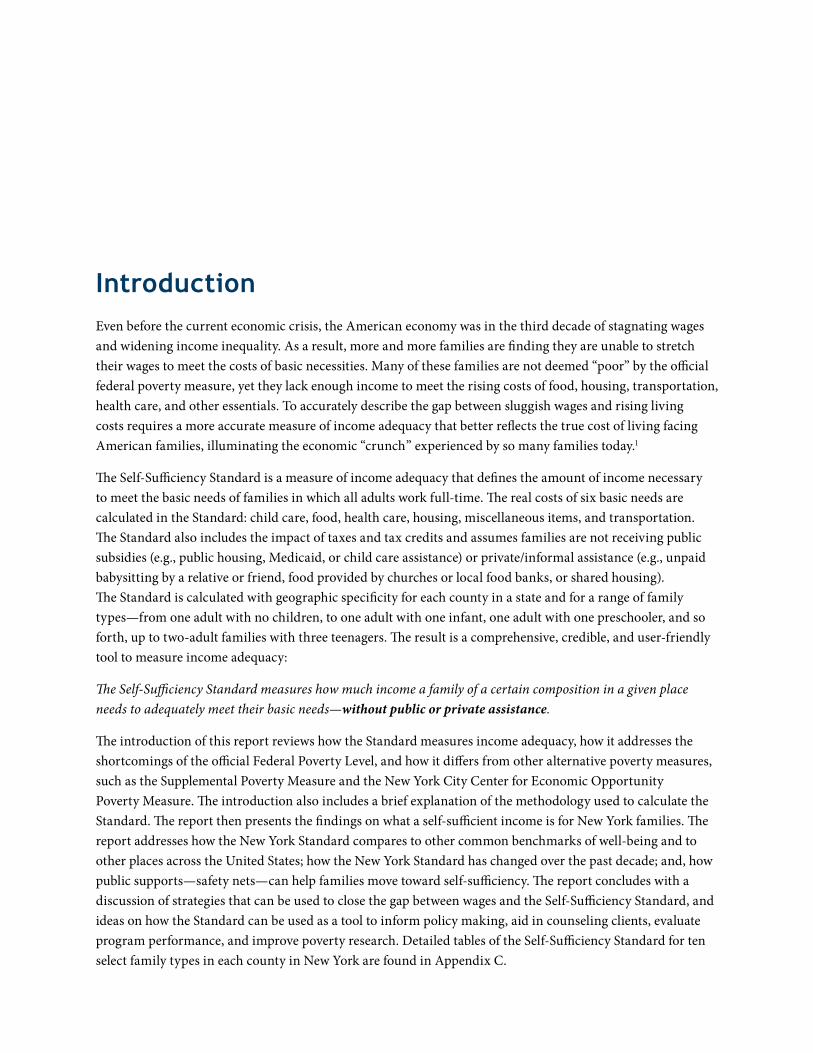
Evenbeforethecurrenteconomiccrisis,theAmericaneconomywasinthethirddecadeofstagnatingwagesandwideningincomeinequality.Asaresult,moreandmorefamiliesarefindingtheyareunabletostretchtheirwagestomeetthecostsofbasicnecessities.Manyofthesefamiliesarenotdeemed“poor”bytheofficialfederalpovertymeasure,yettheylackenoughincometomeettherisingcostsoffood,housing,transportation,healthcare,andotheressentials.ToaccuratelydescribethegapbetweensluggishwagesandrisinglivingcostsrequiresamoreaccuratemeasureofincomeadequacythatbetterreflectsthetruecostoflivingfacingAmericanfamilies,illuminatingtheeconomic“crunch”experiencedbysomanyfamiliestoday.1
TheSelf-SufficiencyStandardisameasureofincomeadequacythatdefinestheamountofincomenecessarytomeetthebasicneedsoffamiliesinwhichalladultsworkfull-time.TherealcostsofsixbasicneedsarecalculatedintheStandard:childcare,food,healthcare,housing,miscellaneousitems,andtransportation.TheStandardalsoincludestheimpactoftaxesandtaxcreditsandassumesfamiliesarenotreceivingpublicsubsidies(e.g.,publichousing,Medicaid,orchildcareassistance)orprivate/informalassistance(e.g.,unpaidbabysittingbyarelativeorfriend,foodprovidedbychurchesorlocalfoodbanks,orsharedhousing).TheStandardiscalculatedwithgeographicspecificityforeachcountyinastateandforarangeoffamilytypes—fromoneadultwithnochildren,tooneadultwithoneinfant,oneadultwithonepreschooler,andsoforth,uptotwo-adultfamilieswiththreeteenagers.Theresultisacomprehensive,credible,anduser-friendlytooltomeasureincomeadequacy:
The Self-Sufficiency Standard measures how much income a family of a certain composition in a given place needs to adequately meet their basic needs—without public or private assistance.
TheintroductionofthisreportreviewshowtheStandardmeasuresincomeadequacy,howitaddressestheshortcomingsoftheofficialFederalPovertyLevel,andhowitdiffersfromotheralternativepovertymeasures,suchastheSupplementalPovertyMeasureandtheNewYorkCityCenterforEconomicOpportunityPovertyMeasure.TheintroductionalsoincludesabriefexplanationofthemethodologyusedtocalculatetheStandard.Thereportthenpresentsthefindingsonwhataself-sufficientincomeisforNewYorkfamilies.ThereportaddresseshowtheNewYorkStandardcomparestoothercommonbenchmarksofwell-beingandtootherplacesacrosstheUnitedStates;howtheNewYorkStandardhaschangedoverthepastdecade;and,howpublicsupports—safetynets—canhelpfamiliesmovetowardself-sufficiency.ThereportconcludeswithadiscussionofstrategiesthatcanbeusedtoclosethegapbetweenwagesandtheSelf-SufficiencyStandard,andideasonhowtheStandardcanbeusedasatooltoinformpolicymaking,aidincounselingclients,evaluateprogramperformance,andimprovepovertyresearch.DetailedtablesoftheSelf-SufficiencyStandardfortenselectfamilytypesineachcountyinNewYorkarefoundinAppendixC.
Introduction
2 — tHE SELF-SUFFICIENCY STANDARD FOR NEW YORK STATE tHE SELF-SUFFICIENCY STANDARD FOR NEW YORK STATE — 3
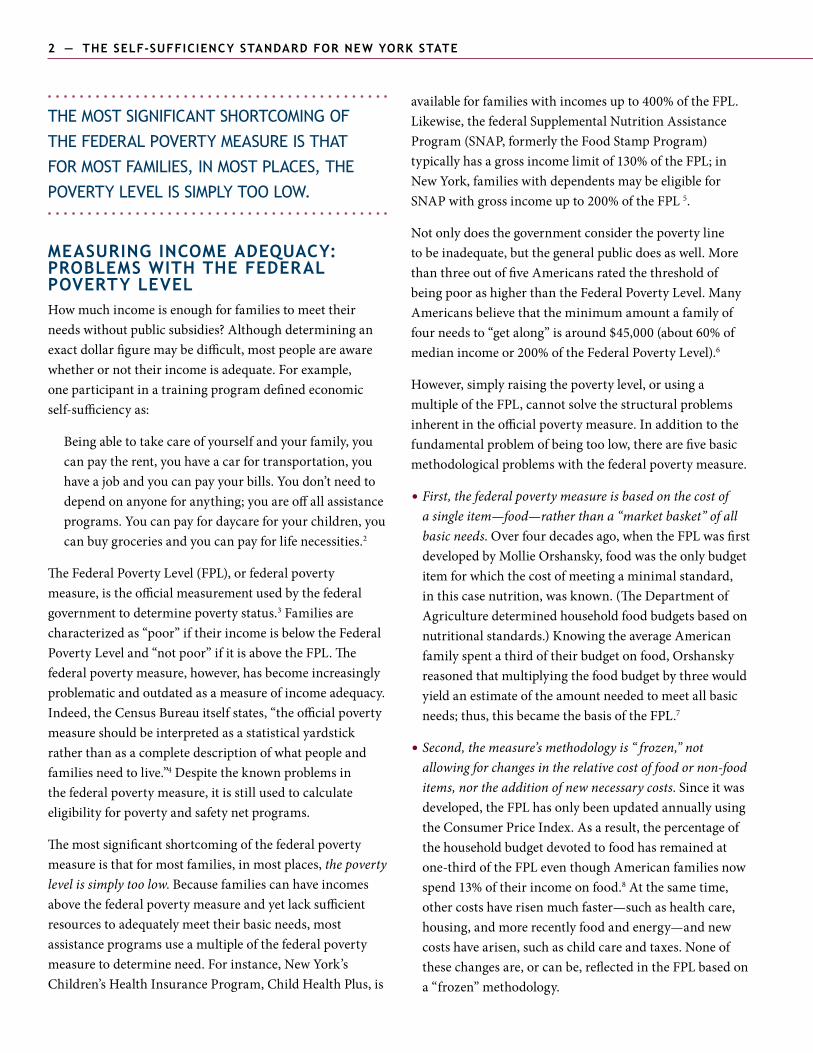
MEASURING INCOME ADEQUACY: PROBLEMS WITH THE FEDERAL PoVerty leVelHowmuchincomeisenoughforfamiliestomeettheirneedswithoutpublicsubsidies?Althoughdetermininganexactdollarfiguremaybedifficult,mostpeopleareawarewhetherornottheirincomeisadequate.Forexample,oneparticipantinatrainingprogramdefinedeconomicself-sufficiencyas:
Beingabletotakecareofyourselfandyourfamily,youcanpaytherent,youhaveacarfortransportation,youhaveajobandyoucanpayyourbills.Youdon’tneedtodependonanyoneforanything;youareoffallassistanceprograms.Youcanpayfordaycareforyourchildren,youcanbuygroceriesandyoucanpayforlifenecessities.2
TheFederalPovertyLevel(FPL),orfederalpovertymeasure,istheofficialmeasurementusedbythefederalgovernmenttodeterminepovertystatus.3Familiesarecharacterizedas“poor”iftheirincomeisbelowtheFederalPovertyLeveland“notpoor”ifitisabovetheFPL.Thefederalpovertymeasure,however,hasbecomeincreasinglyproblematicandoutdatedasameasureofincomeadequacy.Indeed,theCensusBureauitselfstates,“theofficialpovertymeasureshouldbeinterpretedasastatisticalyardstickratherthanasacompletedescriptionofwhatpeopleandfamiliesneedtolive.”4Despitetheknownproblemsinthefederalpovertymeasure,itisstillusedtocalculateeligibilityforpovertyandsafetynetprograms.
Themostsignificantshortcomingofthefederalpovertymeasureisthatformostfamilies,inmostplaces,the poverty level is simply too low.Becausefamiliescanhaveincomesabovethefederalpovertymeasureandyetlacksufficientresourcestoadequatelymeettheirbasicneeds,mostassistanceprogramsuseamultipleofthefederalpovertymeasuretodetermineneed.Forinstance,NewYork’sChildren’sHealthInsuranceProgram,ChildHealthPlus,is
availableforfamilieswithincomesupto400%oftheFPL.Likewise,thefederalSupplementalNutritionAssistanceProgram(SNAP,formerlytheFoodStampProgram)typicallyhasagrossincomelimitof130%oftheFPL;inNewYork,familieswithdependentsmaybeeligibleforSNAPwithgrossincomeupto200%oftheFPL5.
Notonlydoesthegovernmentconsiderthepovertylinetobeinadequate,butthegeneralpublicdoesaswell.MorethanthreeoutoffiveAmericansratedthethresholdofbeingpoorashigherthantheFederalPovertyLevel.ManyAmericansbelievethattheminimumamountafamilyoffourneedsto“getalong”isaround$45,000(about60%ofmedianincomeor200%oftheFederalPovertyLevel).6
However,simplyraisingthepovertylevel,orusingamultipleoftheFPL,cannotsolvethestructuralproblemsinherentintheofficialpovertymeasure.Inadditiontothefundamentalproblemofbeingtoolow,therearefivebasicmethodologicalproblemswiththefederalpovertymeasure.
First, the federal poverty measure is based on the cost of • a single item—food—rather than a “market basket” of all basic needs.Overfourdecadesago,whentheFPLwasfirstdevelopedbyMollieOrshansky,foodwastheonlybudgetitemforwhichthecostofmeetingaminimalstandard,inthiscasenutrition,wasknown.(TheDepartmentofAgriculturedeterminedhouseholdfoodbudgetsbasedonnutritionalstandards.)KnowingtheaverageAmericanfamilyspentathirdoftheirbudgetonfood,Orshanskyreasonedthatmultiplyingthefoodbudgetbythreewouldyieldanestimateoftheamountneededtomeetallbasicneeds;thus,thisbecamethebasisoftheFPL.7
Second, the measure’s methodology is “ frozen,” not • allowing for changes in the relative cost of food or non-food items, nor the addition of new necessary costs.Sinceitwasdeveloped,theFPLhasonlybeenupdatedannuallyusingtheConsumerPriceIndex.Asaresult,thepercentageofthehouseholdbudgetdevotedtofoodhasremainedatone-thirdoftheFPLeventhoughAmericanfamiliesnowspend13%oftheirincomeonfood.8Atthesametime,othercostshaverisenmuchfaster—suchashealthcare,housing,andmorerecentlyfoodandenergy—andnewcostshavearisen,suchaschildcareandtaxes.Noneofthesechangesare,orcanbe,reflectedintheFPLbasedona“frozen”methodology.
THE MOST SIGNIFICANT SHORTCOMING OF
THE FEDERAL POvERTY MEASURE IS THAT
FOR MOST FAMILIES, IN MOST PLACES, THE
POvERTY LEvEL IS SIMPLY TOO LOW.
2 — tHE SELF-SUFFICIENCY STANDARD FOR NEW YORK STATE tHE SELF-SUFFICIENCY STANDARD FOR NEW YORK STATE — 3
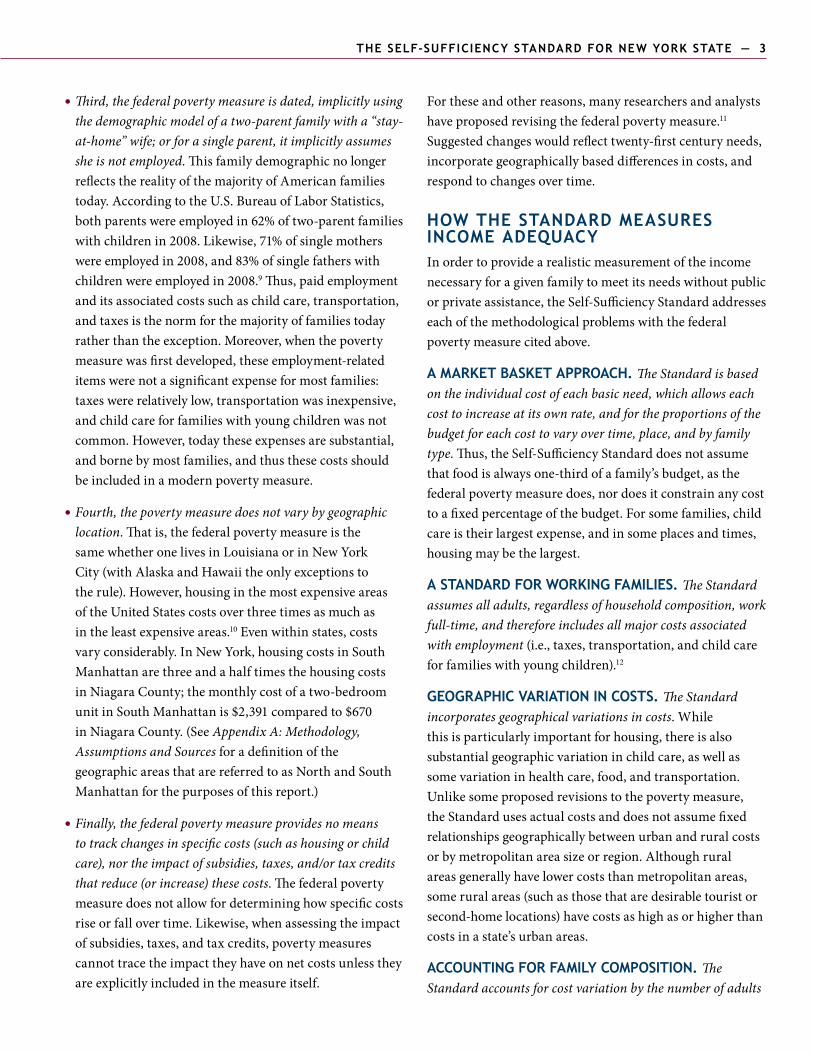
Third, the federal poverty measure is dated, implicitly using • the demographic model of a two-parent family with a “stay-at-home” wife; or for a single parent, it implicitly assumes she is not employed.ThisfamilydemographicnolongerreflectstherealityofthemajorityofAmericanfamiliestoday.AccordingtotheU.S.BureauofLaborStatistics,bothparentswereemployedin62%oftwo-parentfamilieswithchildrenin2008.Likewise,71%ofsinglemotherswereemployedin2008,and83%ofsinglefatherswithchildrenwereemployedin2008.9Thus,paidemploymentanditsassociatedcostssuchaschildcare,transportation,andtaxesisthenormforthemajorityoffamiliestodayratherthantheexception.Moreover,whenthepovertymeasurewasfirstdeveloped,theseemployment-relateditemswerenotasignificantexpenseformostfamilies:taxeswererelativelylow,transportationwasinexpensive,andchildcareforfamilieswithyoungchildrenwasnotcommon.However,todaytheseexpensesaresubstantial,andbornebymostfamilies,andthusthesecostsshouldbeincludedinamodernpovertymeasure.
Fourth, the poverty measure does not vary by geographic • location.Thatis,thefederalpovertymeasureisthesamewhetheronelivesinLouisianaorinNewYorkCity(withAlaskaandHawaiitheonlyexceptionstotherule).However,housinginthemostexpensiveareasoftheUnitedStatescostsoverthreetimesasmuchasintheleastexpensiveareas.10Evenwithinstates,costsvaryconsiderably.InNewYork,housingcostsinSouthManhattanarethreeandahalftimesthehousingcostsinNiagaraCounty;themonthlycostofatwo-bedroomunitinSouthManhattanis$2,391comparedto$670inNiagaraCounty.(SeeAppendix A: Methodology, Assumptions and SourcesforadefinitionofthegeographicareasthatarereferredtoasNorthandSouthManhattanforthepurposesofthisreport.)
Finally, the federal poverty measure provides no means • to track changes in specific costs (such as housing or child care), nor the impact of subsidies, taxes, and/or tax credits that reduce (or increase) these costs.Thefederalpovertymeasuredoesnotallowfordetermininghowspecificcostsriseorfallovertime.Likewise,whenassessingtheimpactofsubsidies,taxes,andtaxcredits,povertymeasurescannottracetheimpacttheyhaveonnetcostsunlesstheyareexplicitlyincludedinthemeasureitself.
Fortheseandotherreasons,manyresearchersandanalystshaveproposedrevisingthefederalpovertymeasure.11Suggestedchangeswouldreflecttwenty-firstcenturyneeds,incorporategeographicallybaseddifferencesincosts,andrespondtochangesovertime.
HOW THE STANDARD MEASURES INCOME ADEQUACYInordertoprovidearealisticmeasurementoftheincomenecessaryforagivenfamilytomeetitsneedswithoutpublicorprivateassistance,theSelf-SufficiencyStandardaddresseseachofthemethodologicalproblemswiththefederalpovertymeasurecitedabove.
A MARKET BASKET APPROACH. The Standard is based on the individual cost of each basic need, which allows each cost to increase at its own rate, and for the proportions of the budget for each cost to vary over time, place, and by family type.Thus,theSelf-SufficiencyStandarddoesnotassumethatfoodisalwaysone-thirdofafamily’sbudget,asthefederalpovertymeasuredoes,nordoesitconstrainanycosttoafixedpercentageofthebudget.Forsomefamilies,childcareistheirlargestexpense,andinsomeplacesandtimes,housingmaybethelargest.
A STANDARD FOR WORKING FAMILIES. The Standard assumes all adults, regardless of household composition, work full-time, and therefore includes all major costs associated with employment(i.e.,taxes,transportation,andchildcareforfamilieswithyoungchildren).12
GEOGRAPHIC VARIATION IN COSTS. The Standard incorporates geographical variations in costs.Whilethisisparticularlyimportantforhousing,thereisalsosubstantialgeographicvariationinchildcare,aswellassomevariationinhealthcare,food,andtransportation.Unlikesomeproposedrevisionstothepovertymeasure,theStandardusesactualcostsanddoesnotassumefixedrelationshipsgeographicallybetweenurbanandruralcostsorbymetropolitanareasizeorregion.Althoughruralareasgenerallyhavelowercoststhanmetropolitanareas,someruralareas(suchasthosethataredesirabletouristorsecond-homelocations)havecostsashighasorhigherthancostsinastate’surbanareas.
ACCOUNTING FOR FAMILY COMPOSITION. The Standard accounts for cost variation by the number of adults
4 — tHE SELF-SUFFICIENCY STANDARD FOR NEW YORK STATE tHE SELF-SUFFICIENCY STANDARD FOR NEW YORK STATE — 5
HOW DOES THE SELF-SUFFICIENCY STANDARD COMPARE TO PROPOSED ALTERNATIVES TO THE FEDERAL POVERTY LEVEL? Over the years, many researchers and analysts have proposed revising the federal poverty measure.a Besides the Self-
Sufficiency Standard, the other major methodology proposed as an alternative to the federal poverty measure is the
National Academy of Sciences (NAS) recommendations.b The new Supplemental Poverty Measure (SPM) being developed
by the Obama Administration for release in 2011 will be based on the NAS methodology, with some revisions.c
Meanwhile, the New York City Center for Economic Opportunity (CEO) pioneered the adoption of the methodology
proposed by the NAS into an alternative poverty measure at the local level.d The Census Bureau also has produced
poverty estimates based on various combinations of the NAS recommendations, designating them as experimental
poverty measures.e Designed primarily to track poverty trends over time, NAS-type measures (including the SPM and
New York City’s CEO measure) differ from the Self-Sufficiency Standard in several ways. Below we highlight some of the
key differences, including how the SPM may depart from the original NAS recommendations.
1. The NAS is a measure of deprivation rather than self-sufficiency, using partial thresholds that include only the bare
essentials for survival—food, clothing, and housing (including utilities)—but not health care, work-related expenses
(child care and transportation), or taxes/tax credits. This methodology results in thresholds that are only slightly
higher than the FPL on average, thus resulting in only a small increase in the poverty count; in fact, with geographic
adjustments, some applications using the NAS methodology have resulted in thresholds lower than the FPL.f
2. While the Standard is an absolute measure based on the prices of each item in the threshold, the NAS is a relative
measure, pegged to expenditure levels of families at the 33rd percentile; because living standards rise faster than
prices, this means that thresholds based on the NAS methodology would rise faster than the FPL, which is only
updated for inflation (price increases) using the Consumer Price Index, reflecting a general increase in standards of
living. At the same time, the threshold would rise as living standards rise, but also fall when living standards fall, as
in a severe recession. However, the SPM being developed by the Obama Administration is planned to be based on
five years of data, thus the SPM threshold will fall only in the case of a recession that is severe enough to impact
average expenditures over a five year period.
3. The NAS methodology is meant to include the total population, while the Standard applies only to working-age, non-
disabled and non-elderly households. Therefore the Standard includes not only “survival” costs but also health care
and work-related costs, such as child care and transportation, faced by working households. Rather than include
the real costs of health care and work-related expenses in the threshold, the NAS methodology deducts actual
expenditures from a family’s income. This methodology underestimates unmet need, as those with inadequate
resources to pay for child care, health care, and transportation will go without, and therefore will have little or no
“deductions” for these expenses. In a departure from the NAS approach, however, the U.S. Census Bureau plans
to investigate the advantages and disadvantages of trying to measure actual expenses versus assigning an average
expenditure amount to all working adults in the SPM.g
The NAS-based SPM will provide a much needed new statistic to better understand the prevalence of poverty in the
U.S. The SPM is not intended to be a replacement for the FPL but it will provide policymakers with additional data in
accessing antipoverty programs and proposals. At the same time, the SPM will not replace the need for a benchmark
of income adequacy. The Standard will continue to be an essential tool for understanding what it takes to makes ends
meet at a minimally adequate level in today’s economy.
4 — tHE SELF-SUFFICIENCY STANDARD FOR NEW YORK STATE tHE SELF-SUFFICIENCY STANDARD FOR NEW YORK STATE — 5
and children,but also by the ages of children.Whilefoodandhealthcarecostsareslightlylowerforyoungerchildren,childcarecostsaregenerallymuchhigher—particularlyforchildrennotyetinschool—andthereforeareasubstantialbudgetitemforfamilieswithyoungchildren.
INCLUSION OF TAxES AND TAx CREDITS. The Standard includes the net effect of taxes and tax credits. Alltaxes,includingstateandlocalsalestax,payroll(SocialSecurityandMedicare)tax,andfederalandstateincometaxesareincludedintheStandard(propertytaxesareassumedtobeincludedinthecostofhousing).Additionally,federal,state,andlocaltaxcreditsareincludedinthecalculationoftheStandard.
PERMITS MODELING OF THE IMPACT OF SUBSIDIES, TAxES, AND TAx CREDITS. Because the Standard specifies the cost of each major necessity, it is possible to model the impact of specific subsidies (suchastheSupplementalNutritionAssistanceProgram—formerlytheFoodStampProgram—childcareassistance,MedicaidortheChildren’sHealthInsuranceProgram,orhousingvouchers)aswellastheoverallimpactoftaxesandtaxcredits(transfers)onincomewhenevaluatingtheadequacyofagivenwageforagivenfamily.
TheSelf-SufficiencyStandardestablishesfamily-sustainingwagesbymakingreal-worldassumptions,varyingdatageographicallyandbyfamilytype,andincludingtheneteffectoftaxesandtaxcredits.ASelf-SufficiencyWagemeansthefamilyorindividualisontheroadtoeconomicindependenceandisnotforcedtochoosebetweenbasicnecessities(suchaschildcareversusnutritiousfood,oradequatehousingversushealthcare).However,itisimportanttonotethattheStandardisaconservativemeasureinthatitonlyprovidestheminimumtomeetdailyneeds,anddoesnotincludeanyallowanceforlong-termneeds(suchassavingsorcollegetuition),creditcardorotherdebtrepayment,purchasesofmajoritems(suchasacarorrefrigerator),oremergencyexpenses.Itisa“barebones”budgetthatprovidestheminimum,nottheaverage,tomeeteachbasicneed.Costsaresetatthelevelconsideredminimallyadequatetobeself-sufficient,withnoextras;forexample,thefoodbudgethasnotake-outorrestaurantfood,notevenapizza.
THE SELF-SUFFICIENCY STANDARD: MORE THAN WAGES ALONEUsingtheSelf-SufficiencyStandard,agivenfamily’sincomeisdeemedinadequateifitfallsbelowtheappropriatethresholdbasedonfamilytypeandlocation.However,usersoftheStandardareurgedtothinkintermsof“wageadequacy.”Thatis,theyshouldask:HowcloseisagivenwagetotheStandard?Forexample,iftheStandardforacertainfamilytypeis$20perhour,buttheadultsupportingthefamilyonlyearns$10perhour,thenthelatterwagehasa“wageadequacy”levelofonly50%.
DespitetheStandard’suseofincomethresholds,economicself-sufficiencycannotalwaysbeachievedwithwagesalone,orevenwithwagesandbenefitstogether.Self-sufficiencyismorethanajobwithacertainwageandbenefitsatonepointintime.Trueself-sufficiencyislong-termeconomicsecurity,makingitalargergoaltowardwhichtostriveaswellasaprocessinwhichtoengage.Asonepersonputit,“Self-sufficiencyisaroadI’mon.”13
Centraltoattainingself-sufficiencyareaccesstoeducation,training,andjobsthatproviderealpotentialforskilldevelopmentandcareeradvancementoverthelong-term.Mostindividualscannotachieveself-sufficiencythroughstopgapmeasuresorinasinglestep,butrequireassistance,guidance,and/ortransitionalworksupportstobecomeself-sufficientovertime.Whilemeetingbasicneedsmaybemoreurgentthanaccesstoeducationandtraining,truelong-termself-sufficiencyincreasinglyrequireshumancapitalinvestmentsthatenhanceskillsaswellasimproveaccesstojobswithcareerpotential.Self-sufficiencyisnotlikelytobesustainablewithoutatechnologicallyadvancedandbroad-basededucation,whichcanprovidetheflexibilitytomoveintonew,innovative,ornontraditionaljobsandcareers.Writlarge,self-sufficiencyalsorequiresan
A SELF-SUFFICIENCY WAGE MEANS THE FAMILY
OR INDIvIDUAL IS ON THE ROAD TO ECONOMIC
INDEPENDENCE AND IS NOT FORCED TO
CHOOSE BETWEEN BASIC NECESSITIES. . .
6 — tHE SELF-SUFFICIENCY STANDARD FOR NEW YORK STATE tHE SELF-SUFFICIENCY STANDARD FOR NEW YORK STATE — 7
economythatcontinuestoexpandandgrowwithnewjobsthatprovideself-sufficiencywagesandbenefitsaswellasopportunitiestoadvance.
AlthoughtheSelf-SufficiencyStandarddeterminesawagethatisadequatewithoutpublicbenefits,thisdoesnotimplythatpublicworksupportsareinappropriateorunnecessaryforNewYorkfamilies.Forfamilieswhohavenotyetachieved“wageadequacy,”publicsubsidiesforhigh-costnecessitiessuchaschildcare,healthcare,andhousingarefrequentlytheonlymeanstoadequatelymeetbasicneeds.
Indeed,manyfamiliesinNewYorkrelyonpublicworksupportstofillthegapbetweenwagesandbasicneeds.Furthermore,theSelf-SufficiencyStandarddoesnotimplythatfamiliesatanyincomeshouldbecompletelyself-reliantandindependentofoneanotherorthecommunityatlarge.Itisthroughinterdependencewithcommunityinstitutionsandinformalnetworksoffriends,extendedfamily,andneighborsthatmanyfamiliesareabletomeetboththeirnoneconomicandeconomicneeds.
6 — tHE SELF-SUFFICIENCY STANDARD FOR NEW YORK STATE tHE SELF-SUFFICIENCY STANDARD FOR NEW YORK STATE — 7
HOW THE SELF-SUFFICIENCY STANDARD IS CALCULATED
Several different criteria are required to make the Self-Sufficiency Standard as consistent and accurate as possible,
yet varied by geography and family composition. To the extent possible, the data used in calculating the Standard are:
collected or calculated using standardized or equivalent methodology nationwide• obtained from scholarly or credible sources such as the U.S. Census Bureau• calculated to be enough to meet the given need at a minimally adequate level, usually by or for a government • aid agency
updated routinely• geographically- and/or age-specific, as appropriate•
The Self-Sufficiency Standard is calculated for 70 different family types for all New York counties. Family types range
from one adult with no children, to one adult with one infant, one adult with one preschooler, and so forth, up to
two-adult families with three teenagers. While these families represent the majority of households, the Standard can
also be calculated for larger and multi-generational families.
The Self-Sufficiency Standard assumes adult household members work full-time and therefore includes all major costs
associated with employment for every adult household member (i.e., taxes, transportation, and child care for families
with young children). The data components of the Standard and the assumptions included in the calculations are
described below (more detailed information is included in Appendix A: Methodology, Assumptions and Sources).
HOUSING. For housing costs, the Standard uses the most recent Fair Market Rents (FMRs), which are calculated
annually by the U.S. Department of Housing and Urban Development (HUD) for each state’s metropolitan and
nonmetropolitan areas. FMRs include utilities (except telephone and cable) and reflect the cost of housing that meets
basic standards of decency. In most cases, FMRs are set at the 40th percentile, meaning that 40% of the housing in a
given area is less expensive than the FMR.
Since HUD calculates only one set of FMRs for an entire metropolitan area, in multiple county metropolitan areas the
Standard uses median gross rents from the U.S. Census Bureau’s American Community Survey (ACS) to calculate the
housing costs of the individual counties. In addition, the Standard uses the 2008 New York City Housing and vacancy
Survey to vary housing costs between two areas of Manhattan.
CHILD CARE. To calculate the cost of child care, the Standard assumes market-rate costs (defined as the 75th
percentile) by setting, age, and geographic location. Most states, including New York State, conduct or commission
market-rate surveys for setting child care assistance reimbursement rates.
The New York Standard assumes infants (children 0 through 2 years old) receive child care in regulated family day
care. Preschoolers (children 3 to 5 years old) are assumed to receive care in a child care center. Costs for school-age
children (6 to 12 years old) assume they receive care before and after school (part-time).
FOOD. The Standard uses the U.S. Department of Agriculture (USDA) Low-Cost Food Plan for food costs. The
Low-Cost Food Plan was designed to meet minimum nutritional standards using realistic assumptions about food
preparation time and consumption. However, it is still a very conservative estimate of food costs. For instance, the
Low-Cost Food Plan does not allow for any take-out, fast-food, or restaurant meals.
To vary costs within states, geographic differences in food costs are calculated using the ACCRA Cost of Living Index,
published by the Council for Community and Economic Research.
8 — tHE SELF-SUFFICIENCY STANDARD FOR NEW YORK STATE
TRANSPORTATION. If there is an “adequate” public transportation system in a given area, the Standard assumes
workers use public transportation to get to and from work. A public transportation system is considered “adequate”
if it is used by 7% or more of the working population in a given county. The cost of public transportation is calculated
based on the price of a monthly unlimited ride pass. Nassau, Rockland, Tompkins, and Westchester Counties as well
as New York City are calculated with public transportation use.
Private transportation costs are based on the average costs of owning and operating a car. One car is assumed for
households with one adult, and two cars are assumed for households with two adults. Costs are calculated assuming
that the car(s) will be used to commute to and from work, plus one trip per week for shopping and errands. In
addition, one adult in each household with young children is assumed to have a slightly longer weekday trip to allow
for “linking” trips to a day care site. For per-mile costs, driving cost data from the American Automobile Association is
used. The commuting distance is computed from the National Household Travel Survey.
The auto insurance premium is the average premium cost for a given state, calculated by the National Association of
Insurance Commissioners. To create within-state variation (regional or county) in auto insurance premiums, ratios are
created using sample premiums for the automobile insurance companies with the largest market shares in the state.
To estimate fixed costs of car ownership, the Standard uses Consumer Expenditure Survey amounts for families
with incomes between the 20th and 40th percentiles. The fixed costs include expenses such as fire, theft, property
damage and liability insurance, license, registration, taxes, repairs, monthly payments, and finance charges. The
monthly variable costs (e.g., gas, oil, tires, and maintenance) are also included, but the initial cost of purchasing a car
is not.
HEALTH CARE. The Standard assumes that an integral part of a Self-Sufficiency Wage is employer-sponsored
health insurance for workers and their families. The average health care premiums paid by workers are from the
national Medical Panel Survey (MEPS) and vary for single adults and for a family. To vary premium costs by region,
the Standard uses sample insurance rates from the New York State Department of Insurance. Health care costs also
include regional out-of-pocket costs calculated for adults, infants, preschoolers, school-age children, and teenagers
obtained from the MEPS, adjusted by Census region using the MEPS Household Component Analytical Tool, and
adjusted for inflation using the Medical Care Consumer Price Index.
MISCELLANEOUS. Miscellaneous expenses are calculated by taking 10% of all other costs before taxes and tax
credits are calculated. This expense category consists of all other essentials including clothing, shoes, paper products,
diapers, nonprescription medicines, cleaning products, household items, personal hygiene items, and telephone
service. It does not allow for recreation, entertainment, savings, or debt repayment.
TAxES. Taxes include federal and state income tax, payroll taxes, and state and local sales taxes where applicable.
Additionally, the Standard includes federal, state, and local tax credits. Tax credits calculated for the New York
Standard include: the federal, state, and city Child and Dependent Care Tax Credit (referred to in the Standard as the
Child Care Tax Credit or CCTC); the federal, state, and New York City Earned Income Tax Credit (EITC); the federal
and state Child Tax Credit (CTC); the federal Making Work Pay Tax Credit (MWPTC); the state and New York City
Household Credit; and the New York City School Tax Credit. Note that property taxes are assumed to be included in
the cost of housing.
FOR MORE DETAILED INFORMATION ON THE METHODOLOGY OF THE SELF-SUFFICIENCY STANDARD, INCLUDING SPECIFIC DATA SOURCES FOR NEW YORK STATE, PLEASE SEE
Appendix A: Methodology, AssuMptions And sources.
tHE SELF-SUFFICIENCY STANDARD FOR NEW YORK STATE — 9
How Much is Enough in New York State?TheSelf-SufficiencyStandardvariesbybothfamilytypeandgeographiclocationbecausetheamountofmoneyfamiliesneedtobeeconomicallyself-sufficientdependsonfamilysize,composition,children’sages,andthegeographicregionofresidence.ThissectionofthereportusesexamplesfromAlbany,Dutchess,andErieCountiestopresentanoverviewofhowmuchisenoughtobeeconomicallyself-sufficientinNewYork.
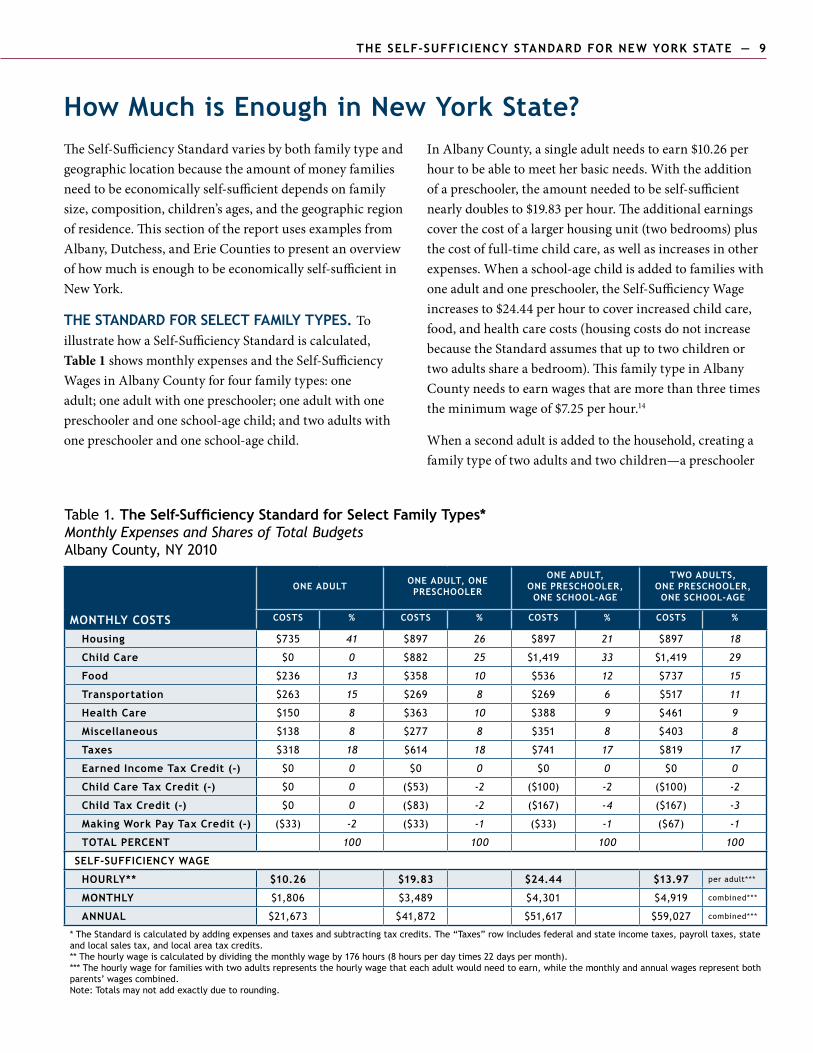
THE STANDARD FOR SELECT FAMILY TYPES. ToillustratehowaSelf-SufficiencyStandardiscalculated,Table 1 showsmonthlyexpensesandtheSelf-SufficiencyWagesinAlbanyCountyforfourfamilytypes:oneadult;oneadultwithonepreschooler;oneadultwithonepreschoolerandoneschool-agechild;andtwoadultswithonepreschoolerandoneschool-agechild.
InAlbanyCounty,asingleadultneedstoearn$10.26perhourtobeabletomeetherbasicneeds.Withtheadditionofapreschooler,theamountneededtobeself-sufficientnearlydoublesto$19.83perhour.Theadditionalearningscoverthecostofalargerhousingunit(twobedrooms)plusthecostoffull-timechildcare,aswellasincreasesinotherexpenses.Whenaschool-agechildisaddedtofamilieswithoneadultandonepreschooler,theSelf-SufficiencyWageincreasesto$24.44perhourtocoverincreasedchildcare,food,andhealthcarecosts(housingcostsdonotincreasebecausetheStandardassumesthatuptotwochildrenortwoadultsshareabedroom).ThisfamilytypeinAlbanyCountyneedstoearnwagesthataremorethanthreetimestheminimumwageof$7.25perhour.14
Whenasecondadultisaddedtothehousehold,creatingafamilytypeoftwoadultsandtwochildren—apreschooler
Table 1. The Self-Sufficiency Standard for Select Family Types* Monthly Expenses and Shares of Total Budgets Albany County, NY 2010
MONTHLY COSTS
ONE ADULT ONE ADULT, ONE PRESCHOOLER
ONE ADULT, ONE PRESCHOOLER,
ONE SCHOOL-AGE
TWO ADULTS, ONE PRESCHOOLER,
ONE SCHOOL-AGE
COSTS % COSTS % COSTS % COSTS %
Housing $735 41 $897 26 $897 21 $897 18
Child Care $0 0 $882 25 $1,419 33 $1,419 29
food $236 13 $358 10 $536 12 $737 15
Transportation $263 15 $269 8 $269 6 $517 11
Health Care $150 8 $363 10 $388 9 $461 9
Miscellaneous $138 8 $277 8 $351 8 $403 8
Taxes $318 18 $614 18 $741 17 $819 17
Earned Income Tax Credit (-) $0 0 $0 0 $0 0 $0 0
Child Care Tax Credit (-) $0 0 ($53) -2 ($100) -2 ($100) -2
Child Tax Credit (-) $0 0 ($83) -2 ($167) -4 ($167) -3
Making Work Pay Tax Credit (-) ($33) -2 ($33) -1 ($33) -1 ($67) -1
TOTAL PERCENT 100 100 100 100
SELF-SUFFICIENCY WAGE
HOURLY** $10.26 $19.83 $24.44 $13.97 per adult***
MONTHLY $1,806 $3,489 $4,301 $4,919 combined***
annual $21,673 $41,872 $51,617 $59,027 combined***
* The Standard is calculated by adding expenses and taxes and subtracting tax credits. The “Taxes” row includes federal and state income taxes, payroll taxes, state and local sales tax, and local area tax credits. ** The hourly wage is calculated by dividing the monthly wage by 176 hours (8 hours per day times 22 days per month). *** The hourly wage for families with two adults represents the hourly wage that each adult would need to earn, while the monthly and annual wages represent both parents’ wages combined. Note: Totals may not add exactly due to rounding.
10 — tHE SELF-SUFFICIENCY STANDARD FOR NEW YORK STATE tHE SELF-SUFFICIENCY STANDARD FOR NEW YORK STATE — 11
andaschool-agechild—thecostsforbasicneedssuchasfood,transportation,andhealthcareincrease.However,becausetheStandardassumesbothadultsworkfull-time,eachadultmustearn$13.97perhourtomeetthefamily’sneeds.
Inadditiontothebasicexpensessuchashousingandchildcare,theSelf-SufficiencyStandardincludestaxesandtaxcredits.Forexample,inTable1familieswithoneadultandonepreschoolerinAlbanyCountyqualifyforthreefederaltaxcredits:aChildCareTaxCreditof$53permonth,aChildTaxCreditof$83permonth,andaMakingWorkPayTaxCreditof$33permonth.ThesetaxcreditsaresubtractedfromtheotherexpensesandtaxestocalculatetheSelf-SufficiencyWage.(StateandlocaltaxcreditsarecalculatedandaccountedforintheTaxesrowofthetables.)
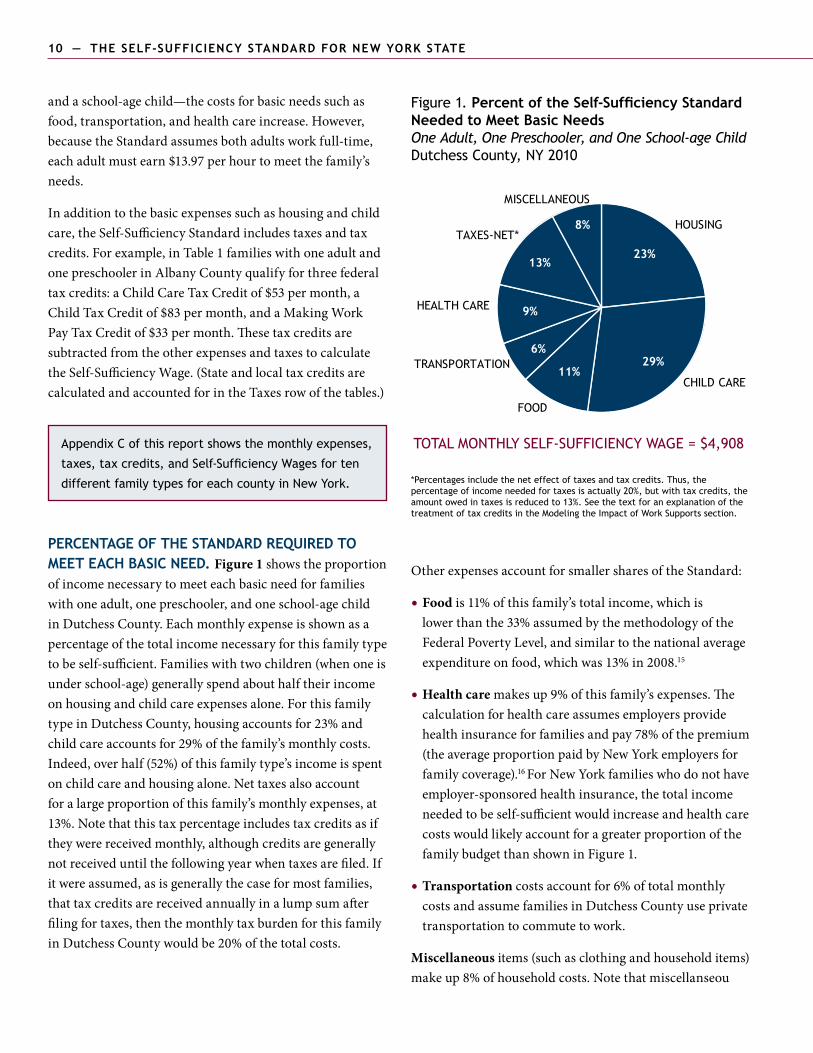
PERCENTAGE OF THE STANDARD REQUIRED TO MEET EACH BASIC NEED. Figure 1showstheproportionofincomenecessarytomeeteachbasicneedforfamilieswithoneadult,onepreschooler,andoneschool-agechildinDutchessCounty.Eachmonthlyexpenseisshownasapercentageofthetotalincomenecessaryforthisfamilytypetobeself-sufficient.Familieswithtwochildren(whenoneisunderschool-age)generallyspendabouthalftheirincomeonhousingandchildcareexpensesalone.ForthisfamilytypeinDutchessCounty,housingaccountsfor23%andchildcareaccountsfor29%ofthefamily’smonthlycosts.Indeed,overhalf(52%)ofthisfamilytype’sincomeisspentonchildcareandhousingalone.Nettaxesalsoaccountforalargeproportionofthisfamily’smonthlyexpenses,at13%.Notethatthistaxpercentageincludestaxcreditsasiftheywerereceivedmonthly,althoughcreditsaregenerallynotreceiveduntilthefollowingyearwhentaxesarefiled.Ifitwereassumed,asisgenerallythecaseformostfamilies,thattaxcreditsarereceivedannuallyinalumpsumafterfilingfortaxes,thenthemonthlytaxburdenforthisfamilyinDutchessCountywouldbe20%ofthetotalcosts.
Figure 1. Percent of the Self-Sufficiency Standard Needed to Meet Basic Needs One Adult, One Preschooler, and One School-age Child Dutchess County, NY 2010
*Percentages include the net effect of taxes and tax credits. Thus, the percentage of income needed for taxes is actually 20%, but with tax credits, the amount owed in taxes is reduced to 13%. See the text for an explanation of the treatment of tax credits in the Modeling the Impact of Work Supports section.
OtherexpensesaccountforsmallersharesoftheStandard:
Food• is11%ofthisfamily’stotalincome,whichislowerthanthe33%assumedbythemethodologyoftheFederalPovertyLevel,andsimilartothenationalaverageexpenditureonfood,whichwas13%in2008.15
Health care• makesup9%ofthisfamily’sexpenses.Thecalculationforhealthcareassumesemployersprovidehealthinsuranceforfamiliesandpay78%ofthepremium(theaverageproportionpaidbyNewYorkemployersforfamilycoverage).16ForNewYorkfamilieswhodonothaveemployer-sponsoredhealthinsurance,thetotalincomeneededtobeself-sufficientwouldincreaseandhealthcarecostswouldlikelyaccountforagreaterproportionofthefamilybudgetthanshowninFigure1.
Transportation • costsaccountfor6%oftotalmonthlycostsandassumefamiliesinDutchessCountyuseprivatetransportationtocommutetowork.
Miscellaneous items(suchasclothingandhouseholditems)makeup8%ofhouseholdcosts.Notethatmiscellanseou
Appendix C of this report shows the monthly expenses,
taxes, tax credits, and Self-Sufficiency Wages for ten
different family types for each county in New York.
TOTAL MONTHLY SELF-SUFFICIENCY WAGE = $4,908
HOUSING
CHILD CARE
TRANSPORTATION
HEALTH CARE
TAXES-NET*
MISCELLANEOUS
FOOD
8%
23%
29%11%
6%
9%
13%
10 — tHE SELF-SUFFICIENCY STANDARD FOR NEW YORK STATE tHE SELF-SUFFICIENCY STANDARD FOR NEW YORK STATE — 11
expensesarecalculatedat10%ofbasiccostsbeforetaxesandtaxcredits.AsdemonstratedinFigure1,afterincludingtaxesandtaxcreditsintothecalculationoftheSelf-SufficiencyWage,miscellaneousexpensesmakeupasmallerproportionofthetotalbudgetneeded.
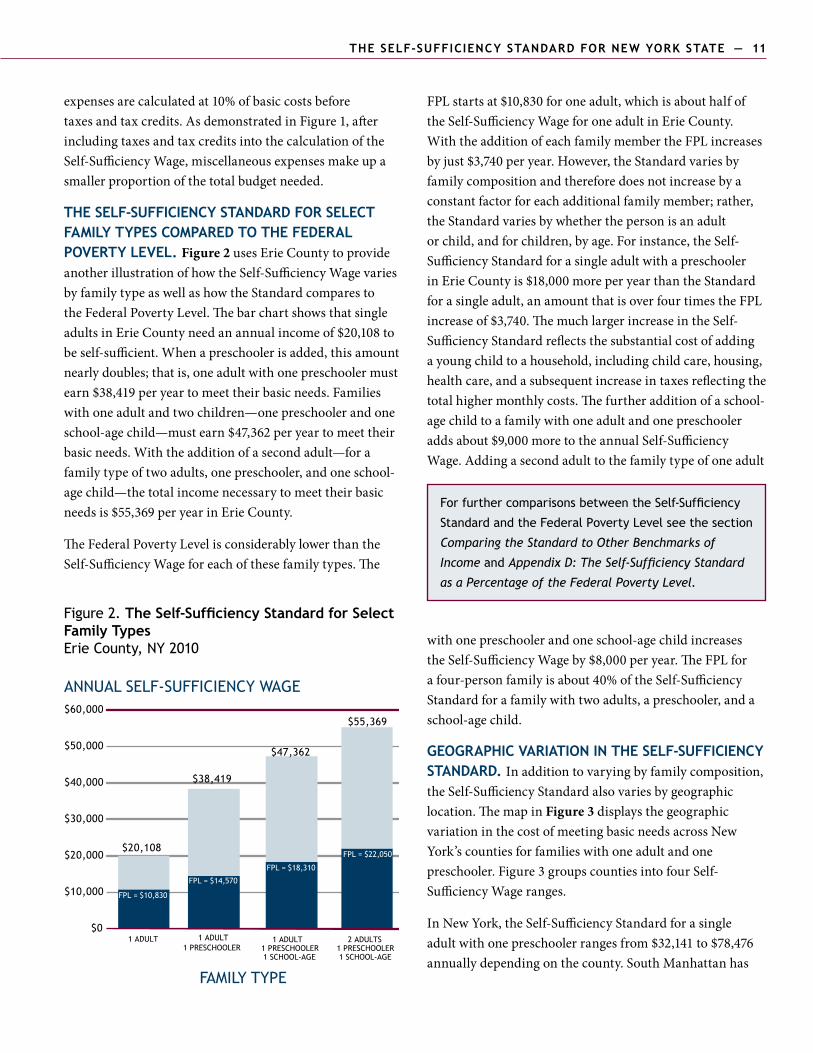
THE SELF-SUFFICIENCY STANDARD FOR SELECT FAMILY TYPES COMPARED TO THE FEDERAL POVERTY LEVEL. Figure 2 usesErieCountytoprovideanotherillustrationofhowtheSelf-SufficiencyWagevariesbyfamilytypeaswellashowtheStandardcomparestotheFederalPovertyLevel.ThebarchartshowsthatsingleadultsinErieCountyneedanannualincomeof$20,108tobeself-sufficient.Whenapreschoolerisadded,thisamountnearlydoubles;thatis,oneadultwithonepreschoolermustearn$38,419peryeartomeettheirbasicneeds.Familieswithoneadultandtwochildren—onepreschoolerandoneschool-agechild—mustearn$47,362peryeartomeettheirbasicneeds.Withtheadditionofasecondadult—forafamilytypeoftwoadults,onepreschooler,andoneschool-agechild—thetotalincomenecessarytomeettheirbasicneedsis$55,369peryearinErieCounty.
TheFederalPovertyLevelisconsiderablylowerthantheSelf-SufficiencyWageforeachofthesefamilytypes.The
FPLstartsat$10,830foroneadult,whichisabouthalfoftheSelf-SufficiencyWageforoneadultinErieCounty.WiththeadditionofeachfamilymembertheFPLincreasesbyjust$3,740peryear.However,theStandardvariesbyfamilycompositionandthereforedoesnotincreasebyaconstantfactorforeachadditionalfamilymember;rather,theStandardvariesbywhetherthepersonisanadultorchild,andforchildren,byage.Forinstance,theSelf-SufficiencyStandardforasingleadultwithapreschoolerinErieCountyis$18,000moreperyearthantheStandardforasingleadult,anamountthatisoverfourtimestheFPLincreaseof$3,740.ThemuchlargerincreaseintheSelf-SufficiencyStandardreflectsthesubstantialcostofaddingayoungchildtoahousehold,includingchildcare,housing,healthcare,andasubsequentincreaseintaxesreflectingthetotalhighermonthlycosts.Thefurtheradditionofaschool-agechildtoafamilywithoneadultandonepreschooleraddsabout$9,000moretotheannualSelf-SufficiencyWage.Addingasecondadulttothefamilytypeofoneadult
withonepreschoolerandoneschool-agechildincreasestheSelf-SufficiencyWageby$8,000peryear.TheFPLforafour-personfamilyisabout40%oftheSelf-SufficiencyStandardforafamilywithtwoadults,apreschooler,andaschool-agechild.
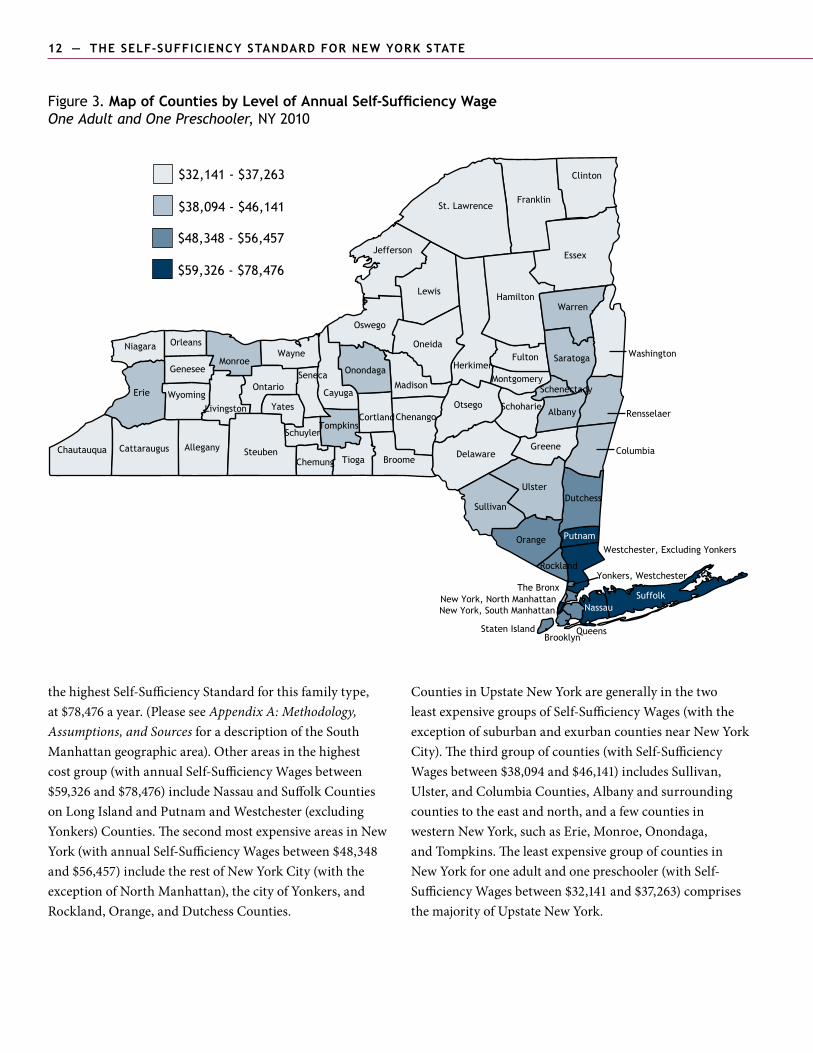
GEOGRAPHIC VARIATION IN THE SELF-SUFFICIENCY STANDARD. Inadditiontovaryingbyfamilycomposition,theSelf-SufficiencyStandardalsovariesbygeographiclocation.Themapin Figure 3 displaysthegeographicvariationinthecostofmeetingbasicneedsacrossNewYork’scountiesforfamilieswithoneadultandonepreschooler.Figure3groupscountiesintofourSelf-SufficiencyWageranges.
InNewYork,theSelf-SufficiencyStandardforasingleadultwithonepreschoolerrangesfrom$32,141to$78,476annuallydependingonthecounty.SouthManhattanhas
Figure 2. The Self-Sufficiency Standard for Select Family Types Erie County, NY 2010
1 ADULT 1 ADULT1 PRESCHOOLER
1 ADULT 1 PRESCHOOLER 1 SCHOOL-AGE
2 ADULTS 1 PRESCHOOLER1 SCHOOL-AGE
ANNUAL SELF-SUFFICIENCY WAGE
FAMILY TYPE
$0
$10,000
$20,000
$30,000
$40,000
$50,000
$60,000
FPL = $10,830
FPL = $14,570
FPL = $18,310
FPL = $22,050
$38,419
$47,362
$55,369
$20,108
For further comparisons between the Self-Sufficiency
Standard and the Federal Poverty Level see the section
Comparing the Standard to Other Benchmarks of
Income and Appendix D: The Self-Sufficiency Standard
as a Percentage of the Federal Poverty Level.
12 — tHE SELF-SUFFICIENCY STANDARD FOR NEW YORK STATE
thehighestSelf-SufficiencyStandardforthisfamilytype,at$78,476ayear.(PleaseseeAppendix A: Methodology, Assumptions, and Sources foradescriptionoftheSouthManhattangeographicarea).Otherareasinthehighestcostgroup(withannualSelf-SufficiencyWagesbetween$59,326and$78,476)includeNassauandSuffolkCountiesonLongIslandandPutnamandWestchester(excludingYonkers)Counties.ThesecondmostexpensiveareasinNewYork(withannualSelf-SufficiencyWagesbetween$48,348and$56,457)includetherestofNewYorkCity(withtheexceptionofNorthManhattan),thecityofYonkers,andRockland,Orange,andDutchessCounties.
Figure 3. Map of Counties by Level of Annual Self-Sufficiency Wage One Adult and One Preschooler, NY 2010
CountiesinUpstateNewYorkaregenerallyinthetwoleastexpensivegroupsofSelf-SufficiencyWages(withtheexceptionofsuburbanandexurbancountiesnearNewYorkCity).Thethirdgroupofcounties(withSelf-SufficiencyWagesbetween$38,094and$46,141)includesSullivan,Ulster,andColumbiaCounties,Albanyandsurroundingcountiestotheeastandnorth,andafewcountiesinwesternNewYork,suchasErie,Monroe,Onondaga,andTompkins.TheleastexpensivegroupofcountiesinNewYorkforoneadultandonepreschooler(withSelf-SufficiencyWagesbetween$32,141and$37,263)comprisesthemajorityofUpstateNewYork.
Albany
AlleganyBroome
Cattaraugus
Cayuga
ChautauquaChemung
Chenango
Clinton
Columbia
Cortland
Delaware
Dutchess
Erie
Essex
Franklin
FultonGenesee
Greene
Hamilton
Herkimer
Jefferson
Brooklyn
Lewis
Livingston
Madison
Monroe
Montgomery
NassauNew York, North Manhattan
Niagara Oneida
Onondaga
Ontario
Orange
Orleans
Oswego
Otsego
Putnam
Queens
Rensselaer
Staten Island
Saratoga
Schenectady
Schoharie
Schuyler
Seneca
Steuben
Suffolk
Sullivan
Tioga
Tompkins
Ulster
Warren
WashingtonWayne
Westchester, Excluding Yonkers
WyomingYates
St. Lawrence
The Bronx
New York, South Manhattan
Yonkers, WestchesterRockland
$32,141 - $37,263
$38,094 - $46,141
$48,348 - $56,457
$59,326 - $78,476
tHE SELF-SUFFICIENCY STANDARD FOR NEW YORK STATE — 13
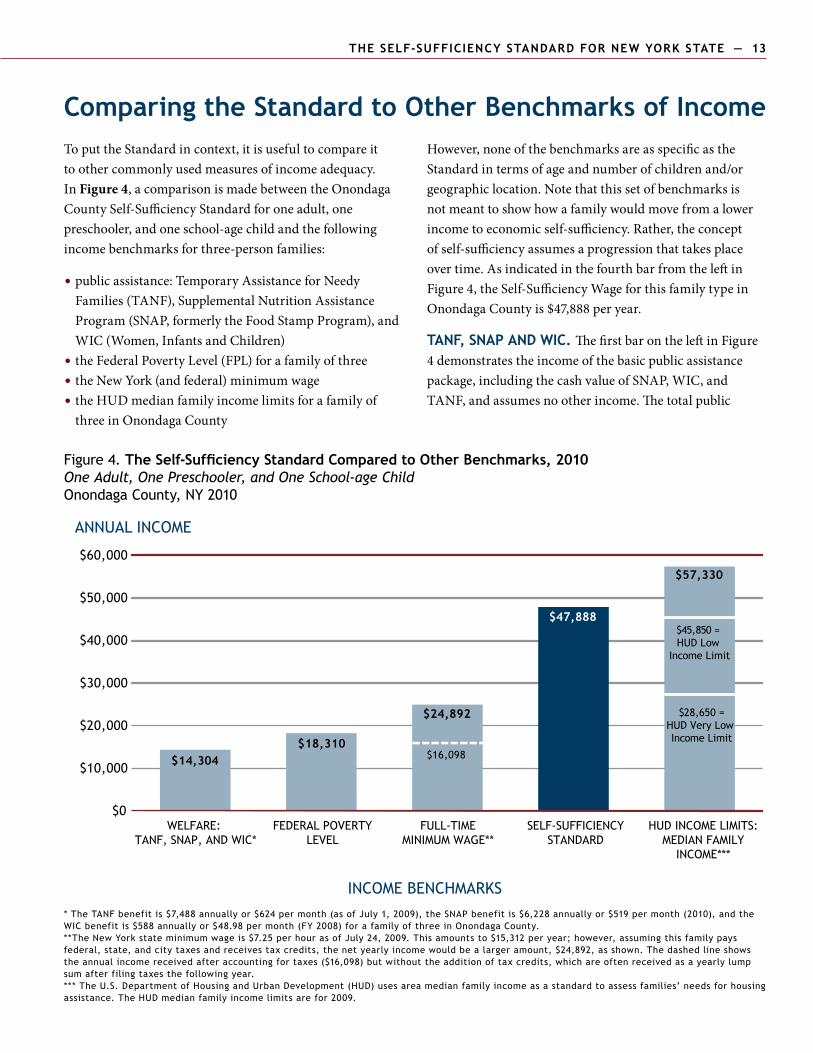
Comparing the Standard to Other Benchmarks of IncomeToputtheStandardincontext,itisusefultocompareittoothercommonlyusedmeasuresofincomeadequacy.In Figure 4,acomparisonismadebetweentheOnondagaCountySelf-SufficiencyStandardforoneadult,onepreschooler,andoneschool-agechildandthefollowingincomebenchmarksforthree-personfamilies:
publicassistance:TemporaryAssistanceforNeedy• Families(TANF),SupplementalNutritionAssistanceProgram(SNAP,formerlytheFoodStampProgram),andWIC(Women,InfantsandChildren)theFederalPovertyLevel(FPL)forafamilyofthree• theNewYork(andfederal)minimumwage• theHUDmedianfamilyincomelimitsforafamilyof• threeinOnondagaCounty
However,noneofthebenchmarksareasspecificastheStandardintermsofageandnumberofchildrenand/orgeographiclocation.Notethatthissetofbenchmarksisnotmeanttoshowhowafamilywouldmovefromalowerincometoeconomicself-sufficiency.Rather,theconceptofself-sufficiencyassumesaprogressionthattakesplaceovertime.AsindicatedinthefourthbarfromtheleftinFigure4,theSelf-SufficiencyWageforthisfamilytypeinOnondagaCountyis$47,888peryear.
TANF, SNAP AND WIC. ThefirstbarontheleftinFigure4demonstratestheincomeofthebasicpublicassistancepackage,includingthecashvalueofSNAP,WIC,andTANF,andassumesnootherincome.Thetotalpublic
Figure 4. The Self-Sufficiency Standard Compared to Other Benchmarks, 2010 One Adult, One Preschooler, and One School-age Child Onondaga County, NY 2010
* The TANF benefit is $7,488 annually or $624 per month (as of July 1, 2009), the SNAP benefit is $6,228 annually or $519 per month (2010), and the WIC benefit is $588 annually or $48.98 per month (FY 2008) for a family of three in Onondaga County.**The New York state minimum wage is $7.25 per hour as of July 24, 2009. This amounts to $15,312 per year; however, assuming this family pays federal, state, and city taxes and receives tax credits, the net yearly income would be a larger amount, $24,892, as shown. The dashed line shows the annual income received after accounting for taxes ($16,098) but without the addition of tax credits, which are often received as a yearly lump sum after filing taxes the following year.*** The U.S. Department of Housing and Urban Development (HUD) uses area median family income as a standard to assess families’ needs for housing assistance. The HUD median family income limits are for 2009.
WELFARE: TANF, SNAP, AND WIC*
FEDERAL POVERTYLEVEL
FULL-TIMEMINIMUM WAGE**
SELF-SUFFICIENCYSTANDARD
HUD INCOME LIMITS:MEDIAN FAMILY
INCOME***
ANNUAL INCOME
INCOME BENCHMARKS
$14,304$18,310
$24,892
$47,888
$57,330
$0
$10,000
$20,000
$30,000
$40,000
$50,000
$60,000
$45,850 = HUD Low
Income Limit
$16,098
$28,650 =HUD Very Low Income Limit
14 — tHE SELF-SUFFICIENCY STANDARD FOR NEW YORK STATE
assistancepackageamountsto$14,304peryearforthree-personfamiliesinOnondagaCounty.Thispublicassistancepackageisjust30%oftheSelf-SufficiencyStandardforthisthree-personfamilyinOnondagaCountyandis78%oftheFPLforathree-personfamily.
FEDERAL POVERTY LEVEL. AccordingtotheFederalPovertyLevel,afamilyconsistingofoneadultandtwochildrenwouldbeconsidered“poor”withanincomeof$18,310annuallyorless—regardlessofwheretheylive,ortheageoftheirchildren.TheFPLforthree-personfamiliesisjust38%oftheSelf-SufficiencyStandardforfamilieswithoneadult,onepreschooler,andoneschool-agechildlivinginOnondagaCounty.
AppendixDdemonstratesthatthepercentoftheFPLneededtomeetbasicneedsvariesgreatlyacrossNewYork’scountiesandfamilytypes.Forafamilywithoneadult,onepreschooler,andoneschool-agechildtheStandardrangesfrom224%oftheFPLinOrleansCountytoover400%oftheFPLonLongIslandand500%oftheFPLinthesouthernareaofManhattan.
MINIMUM WAGE. NewYork’sminimumwageis$7.25perhourandisequaltothefederalminimumwage.Afull-timeminimumwageworkerearns$15,312peryear.Aftersubtractingpayrolltaxes(SocialSecurityandMedicare)andaddingtaxcreditswheneligible,aworkingparentwithonepreschoolerandoneschool-agechildwouldhaveanetcashincomeof$24,892peryear.Thisamountismorethantheworker’searningsalonebecausethetaxcreditsforwhichthefamilyqualifiesaremorethanthetaxesowed.
Afull-timejobattheminimumwageprovides52%oftheamountneededtobeself-sufficientforthisfamilytypeinOnondagaCountyifthefamilyreceivesallofthetaxcreditstheymightbeeligiblefor.However,ifitisassumedthattheworkerpaystaxesmonthlythroughwithholding,butdoesnotreceivetaxcreditsonamonthlybasis(asistrueofmostworkers),shewillonlyreceive$16,098duringtheyear,shownbythedashedlineonthethirdbar.Withoutincludingtheimpactoftaxcredits,aminimumwagejobamountstojust34%oftheSelf-SufficiencyStandardforthisfamilytypeinOnondagaCounty.
MEDIAN FAMILY INCOME LIMITS. Medianfamilyincome(halfofanarea’sfamilieshaveincomesabovethisamountandhalfhaveincomesbelowthisamount)isaroughmeasureoftherelativecostoflivinginanarea.TheU.S.DepartmentofHousingandUrbanDevelopment(HUD)usesareamedianfamilyincometocalculateincomelimitstoassessfamilies’needsforhousingassistance.The2009HUDmedianincomeforathree-personfamilyinOnondagaCountyis$57,330annually.17HUDincomelimitsdefine“lowincome”familiesinOnondagaCountyasthosewithincomesbetween$45,850and$28,650,whilethoseconsidered“verylowincome”haveincomesbetween$28,650and$17,200,andthosewithincomesbelow$17,200areconsidered“extremelylowincome.”18TheStandardof$47,888forthisfamilytypeinOnondagaCountyisjustabovetheHUD“lowincome”limit.
Appendix D shows the Self-Sufficiency Standard as
a percentage of the Federal Poverty Level for all
counties in New York for three different family types.
tHE SELF-SUFFICIENCY STANDARD FOR NEW YORK STATE — 15
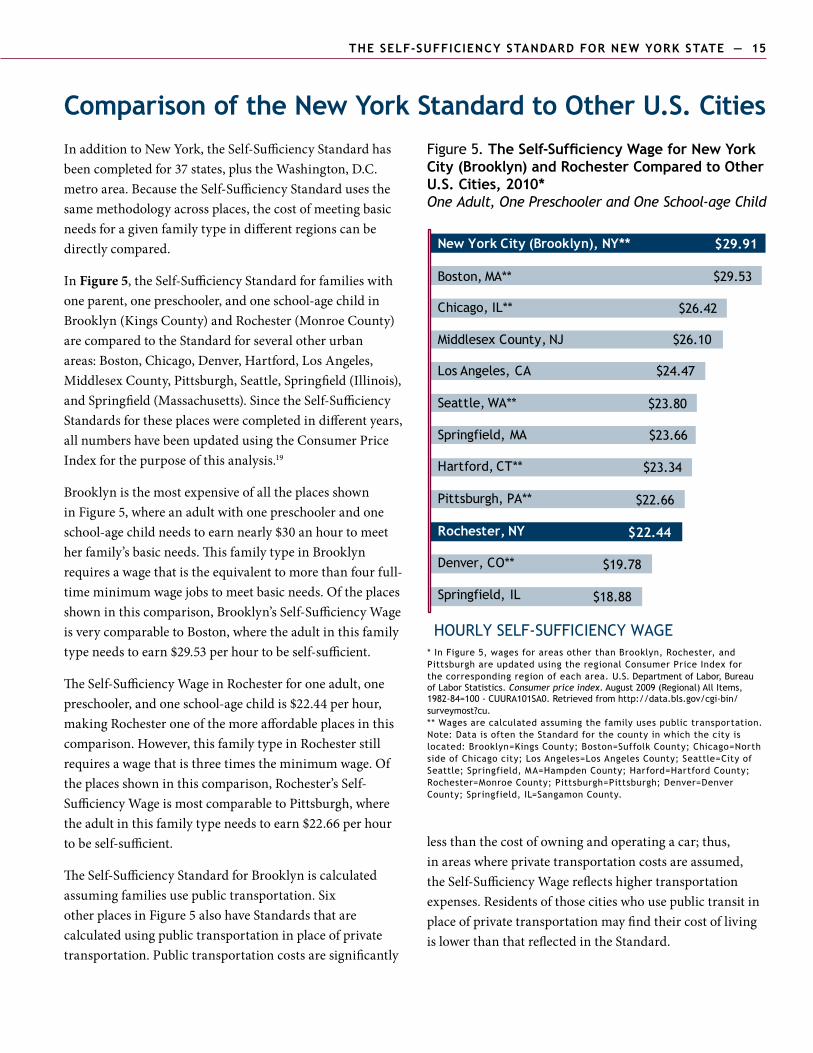
Comparison of the New York Standard to Other U.S. CitiesInadditiontoNewYork,theSelf-SufficiencyStandardhasbeencompletedfor37states,plustheWashington,D.C.metroarea.BecausetheSelf-SufficiencyStandardusesthesamemethodologyacrossplaces,thecostofmeetingbasicneedsforagivenfamilytypeindifferentregionscanbedirectlycompared.
InFigure 5,theSelf-SufficiencyStandardforfamilieswithoneparent,onepreschooler,andoneschool-agechildinBrooklyn(KingsCounty)andRochester(MonroeCounty)arecomparedtotheStandardforseveralotherurbanareas:Boston,Chicago,Denver,Hartford,LosAngeles,MiddlesexCounty,Pittsburgh,Seattle,Springfield(Illinois),andSpringfield(Massachusetts).SincetheSelf-SufficiencyStandardsfortheseplaceswerecompletedindifferentyears,allnumbershavebeenupdatedusingtheConsumerPriceIndexforthepurposeofthisanalysis.19
BrooklynisthemostexpensiveofalltheplacesshowninFigure5,whereanadultwithonepreschoolerandoneschool-agechildneedstoearnnearly$30anhourtomeetherfamily’sbasicneeds.ThisfamilytypeinBrooklynrequiresawagethatistheequivalenttomorethanfourfull-timeminimumwagejobstomeetbasicneeds.Oftheplacesshowninthiscomparison,Brooklyn’sSelf-SufficiencyWageisverycomparabletoBoston,wheretheadultinthisfamilytypeneedstoearn$29.53perhourtobeself-sufficient.
TheSelf-SufficiencyWageinRochesterforoneadult,onepreschooler,andoneschool-agechildis$22.44perhour,makingRochesteroneofthemoreaffordableplacesinthiscomparison.However,thisfamilytypeinRochesterstillrequiresawagethatisthreetimestheminimumwage.Oftheplacesshowninthiscomparison,Rochester’sSelf-SufficiencyWageismostcomparabletoPittsburgh,wheretheadultinthisfamilytypeneedstoearn$22.66perhourtobeself-sufficient.
TheSelf-SufficiencyStandardforBrooklyniscalculatedassumingfamiliesusepublictransportation.SixotherplacesinFigure5alsohaveStandardsthatarecalculatedusingpublictransportationinplaceofprivatetransportation.Publictransportationcostsaresignificantly
lessthanthecostofowningandoperatingacar;thus,inareaswhereprivatetransportationcostsareassumed,theSelf-SufficiencyWagereflectshighertransportationexpenses.ResidentsofthosecitieswhousepublictransitinplaceofprivatetransportationmayfindtheircostoflivingislowerthanthatreflectedintheStandard.
Figure 5. The Self-Sufficiency Wage for New York City (Brooklyn) and Rochester Compared to Other U.S. Cities, 2010* One Adult, One Preschooler and One School-age Child
* In Figure 5, wages for areas other than Brooklyn, Rochester, and Pittsburgh are updated using the regional Consumer Price Index for the corresponding region of each area. U.S. Department of Labor, Bureau of Labor Statistics. Consumer price index. August 2009 (Regional) All Items, 1982-84=100 - CUURA101SA0. Retrieved from http://data.bls.gov/cgi-bin/surveymost?cu.** Wages are calculated assuming the family uses public transportation.Note: Data is often the Standard for the county in which the city is located: Brooklyn=kings County; Boston=Suffolk County; Chicago=North side of Chicago city; Los Angeles=Los Angeles County; Seattle=City of Seattle; Springfield, MA=Hampden County; Harford=Hartford County; Rochester=Monroe County; Pittsburgh=Pittsburgh; Denver=Denver County; Springfield, IL=Sangamon County.
$23.60
HOURLY SELF-SUFFICIENCY WAGE
$18.88
$19.78
$22.44
$22.66
$23.34
$23.66
$23.80
$24.47
$26.10
$26.42
$29.53
$29.91
Springfield, IL
Denver, CO**
Rochester, NY
Pittsburgh, PA**
Hartford, CT**
Springfield, MA
Seattle, WA**
Los Angeles, CA
Middlesex County, NJ
Chicago, IL**
Boston, MA**
New York City (Brooklyn), NY**
16 — tHE SELF-SUFFICIENCY STANDARD FOR NEW YORK STATE tHE SELF-SUFFICIENCY STANDARD FOR NEW YORK STATE — 17
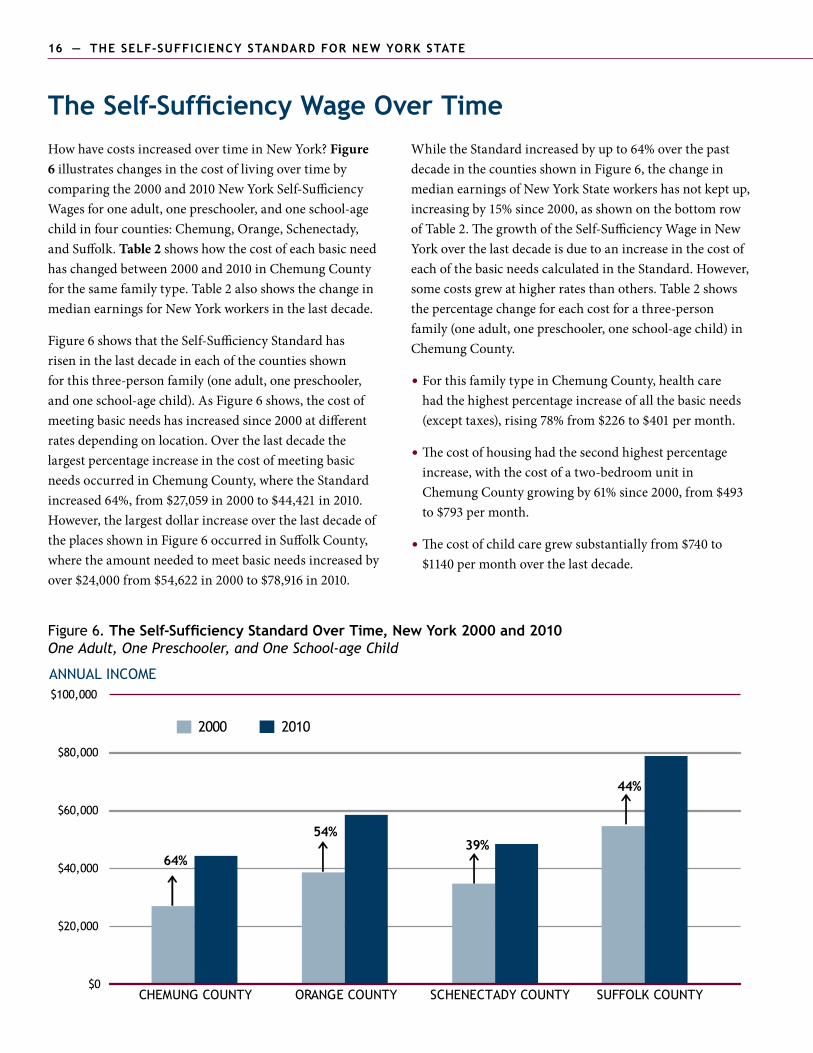
The Self-Sufficiency Wage Over TimeHowhavecostsincreasedovertimeinNewYork?Figure 6illustrateschangesinthecostoflivingovertimebycomparingthe2000and2010NewYorkSelf-SufficiencyWagesforoneadult,onepreschooler,andoneschool-agechildinfourcounties:Chemung,Orange,Schenectady,andSuffolk.Table 2showshowthecostofeachbasicneedhaschangedbetween2000and2010inChemungCountyforthesamefamilytype.Table2alsoshowsthechangeinmedianearningsforNewYorkworkersinthelastdecade.
Figure6showsthattheSelf-SufficiencyStandardhasriseninthelastdecadeineachofthecountiesshownforthisthree-personfamily(oneadult,onepreschooler,andoneschool-agechild).AsFigure6shows,thecostofmeetingbasicneedshasincreasedsince2000atdifferentratesdependingonlocation.OverthelastdecadethelargestpercentageincreaseinthecostofmeetingbasicneedsoccurredinChemungCounty,wheretheStandardincreased64%,from$27,059in2000to$44,421in2010.However,thelargestdollarincreaseoverthelastdecadeoftheplacesshowninFigure6occurredinSuffolkCounty,wheretheamountneededtomeetbasicneedsincreasedbyover$24,000from$54,622in2000to$78,916in2010.
Figure 6. The Self-Sufficiency Standard Over Time, New York 2000 and 2010 One Adult, One Preschooler, and One School-age Child
ANNUAL INCOME
$0
$20,000
$40,000
$60,000
$80,000
$100,000
CHEMUNG COUNTY ORANGE COUNTY SCHENECTADY COUNTY SUFFOLK COUNTY
2000 2010
64%
54%39%
44%
WhiletheStandardincreasedbyupto64%overthepastdecadeinthecountiesshowninFigure6,thechangeinmedianearningsofNewYorkStateworkershasnotkeptup,increasingby15%since2000,asshownonthebottomrowofTable2.ThegrowthoftheSelf-SufficiencyWageinNewYorkoverthelastdecadeisduetoanincreaseinthecostofeachofthebasicneedscalculatedintheStandard.However,somecostsgrewathigherratesthanothers.Table2showsthepercentagechangeforeachcostforathree-personfamily(oneadult,onepreschooler,oneschool-agechild)inChemungCounty.
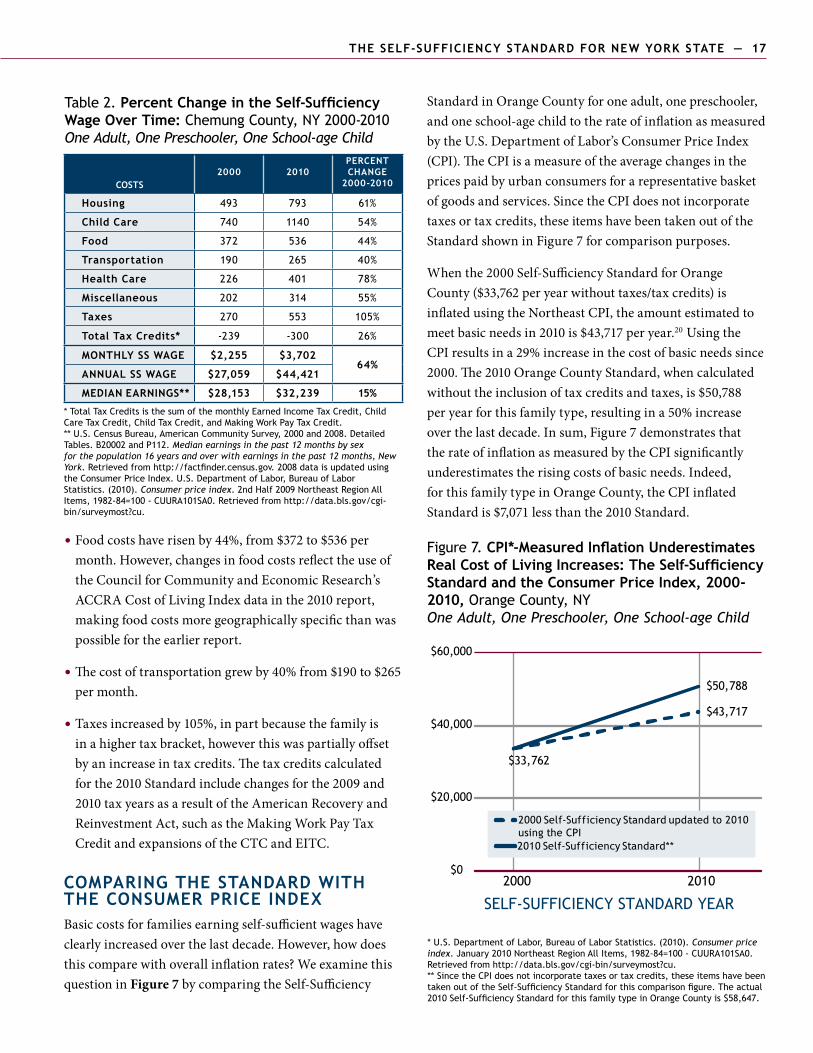
ForthisfamilytypeinChemungCounty,healthcare• hadthehighestpercentageincreaseofallthebasicneeds(excepttaxes),rising78%from$226to$401permonth.
Thecostofhousinghadthesecondhighestpercentage• increase,withthecostofatwo-bedroomunitinChemungCountygrowingby61%since2000,from$493to$793permonth.
Thecostofchildcaregrewsubstantiallyfrom$740to• $1140permonthoverthelastdecade.
16 — tHE SELF-SUFFICIENCY STANDARD FOR NEW YORK STATE tHE SELF-SUFFICIENCY STANDARD FOR NEW YORK STATE — 17
Foodcostshaverisenby44%,from$372to$536per• month.However,changesinfoodcostsreflecttheuseoftheCouncilforCommunityandEconomicResearch’sACCRACostofLivingIndexdatainthe2010report,makingfoodcostsmoregeographicallyspecificthanwaspossiblefortheearlierreport.
Thecostoftransportationgrewby40%from$190to$265• permonth.
Taxesincreasedby105%,inpartbecausethefamilyis• inahighertaxbracket,howeverthiswaspartiallyoffsetbyanincreaseintaxcredits.Thetaxcreditscalculatedforthe2010Standardincludechangesforthe2009and2010taxyearsasaresultoftheAmericanRecoveryandReinvestmentAct,suchastheMakingWorkPayTaxCreditandexpansionsoftheCTCandEITC.
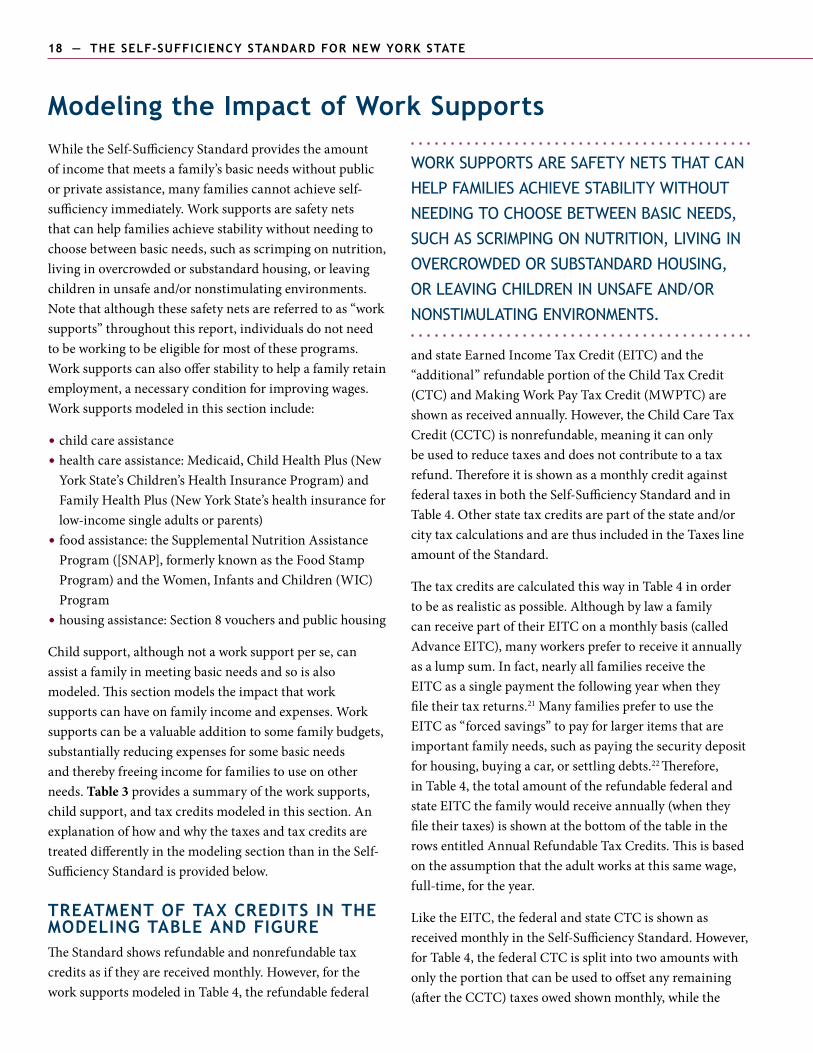
COMPARING THE STANDARD WITH THE CONSUMER PRICE INDExBasiccostsforfamiliesearningself-sufficientwageshaveclearlyincreasedoverthelastdecade.However,howdoesthiscomparewithoverallinflationrates?WeexaminethisquestioninFigure 7bycomparingtheSelf-Sufficiency
StandardinOrangeCountyforoneadult,onepreschooler,andoneschool-agechildtotherateofinflationasmeasuredbytheU.S.DepartmentofLabor’sConsumerPriceIndex(CPI).TheCPIisameasureoftheaveragechangesinthepricespaidbyurbanconsumersforarepresentativebasketofgoodsandservices.SincetheCPIdoesnotincorporatetaxesortaxcredits,theseitemshavebeentakenoutoftheStandardshowninFigure7forcomparisonpurposes.
Whenthe2000Self-SufficiencyStandardforOrangeCounty($33,762peryearwithouttaxes/taxcredits)isinflatedusingtheNortheastCPI,theamountestimatedtomeetbasicneedsin2010is$43,717peryear.20UsingtheCPIresultsina29%increaseinthecostofbasicneedssince2000.The2010OrangeCountyStandard,whencalculatedwithouttheinclusionoftaxcreditsandtaxes,is$50,788peryearforthisfamilytype,resultingina50%increaseoverthelastdecade.Insum,Figure7demonstratesthattherateofinflationasmeasuredbytheCPIsignificantlyunderestimatestherisingcostsofbasicneeds.Indeed,forthisfamilytypeinOrangeCounty,theCPIinflatedStandardis$7,071lessthanthe2010Standard.
Figure 7. CPI*-Measured Inflation Underestimates Real Cost of Living Increases: The Self-Sufficiency Standard and the Consumer Price Index, 2000-2010, Orange County, NY One Adult, One Preschooler, One School-age Child
* U.S. Department of Labor, Bureau of Labor Statistics. (2010). Consumer price index. January 2010 Northeast Region All Items, 1982-84=100 - CUURA101SA0. Retrieved from http://data.bls.gov/cgi-bin/surveymost?cu. ** Since the CPI does not incorporate taxes or tax credits, these items have been taken out of the Self-Sufficiency Standard for this comparison figure. The actual 2010 Self-Sufficiency Standard for this family type in Orange County is $58,647.
ANNUAL INCOME
SELF-SUFFICIENCY STANDARD YEAR
$0
$20,000
$40,000
$60,000
$33,762
$43,717
$50,788
2000 2010
2000 Self-Sufficiency Standard updated to 2010using the CPI2010 Self-Sufficiency Standard**
Table 2. Percent Change in the Self-Sufficiency Wage Over Time: Chemung County, NY 2000-2010 One Adult, One Preschooler, One School-age Child
COSTS2000 2010
PERCENT CHANGE
2000-2010
Housing 493 793 61%
Child Care 740 1140 54%
food 372 536 44%
Transportation 190 265 40%
Health Care 226 401 78%
Miscellaneous 202 314 55%
Taxes 270 553 105%
Total Tax Credits* -239 -300 26%
MONTHLY SS WAGE $2,255 $3,70264%
ANNUAL SS WAGE $27,059 $44,421
MEDIAN EARNINGS** $28,153 $32,239 15%
* Total Tax Credits is the sum of the monthly Earned Income Tax Credit, Child Care Tax Credit, Child Tax Credit, and Making Work Pay Tax Credit.** U.S. Census Bureau, American Community Survey, 2000 and 2008. Detailed Tables. B20002 and P112. Median earnings in the past 12 months by sex for the population 16 years and over with earnings in the past 12 months, New York. Retrieved from http://factfinder.census.gov. 2008 data is updated using the Consumer Price Index. U.S. Department of Labor, Bureau of Labor Statistics. (2010). Consumer price index. 2nd Half 2009 Northeast Region All Items, 1982-84=100 - CUURA101SA0. Retrieved from http://data.bls.gov/cgi-bin/surveymost?cu.
18 — tHE SELF-SUFFICIENCY STANDARD FOR NEW YORK STATE tHE SELF-SUFFICIENCY STANDARD FOR NEW YORK STATE — 19
WhiletheSelf-SufficiencyStandardprovidestheamountofincomethatmeetsafamily’sbasicneedswithoutpublicorprivateassistance,manyfamiliescannotachieveself-sufficiencyimmediately.Worksupportsaresafetynetsthatcanhelpfamiliesachievestabilitywithoutneedingtochoosebetweenbasicneeds,suchasscrimpingonnutrition,livinginovercrowdedorsubstandardhousing,orleavingchildreninunsafeand/ornonstimulatingenvironments.Notethatalthoughthesesafetynetsarereferredtoas“worksupports”throughoutthisreport,individualsdonotneedtobeworkingtobeeligibleformostoftheseprograms.Worksupportscanalsoofferstabilitytohelpafamilyretainemployment,anecessaryconditionforimprovingwages.Worksupportsmodeledinthissectioninclude:
childcareassistance• healthcareassistance:Medicaid,ChildHealthPlus(New• YorkState’sChildren’sHealthInsuranceProgram)andFamilyHealthPlus(NewYorkState’shealthinsuranceforlow-incomesingleadultsorparents)foodassistance:theSupplementalNutritionAssistance• Program([SNAP],formerlyknownastheFoodStampProgram)andtheWomen,InfantsandChildren(WIC)Programhousingassistance:Section8vouchersandpublichousing•
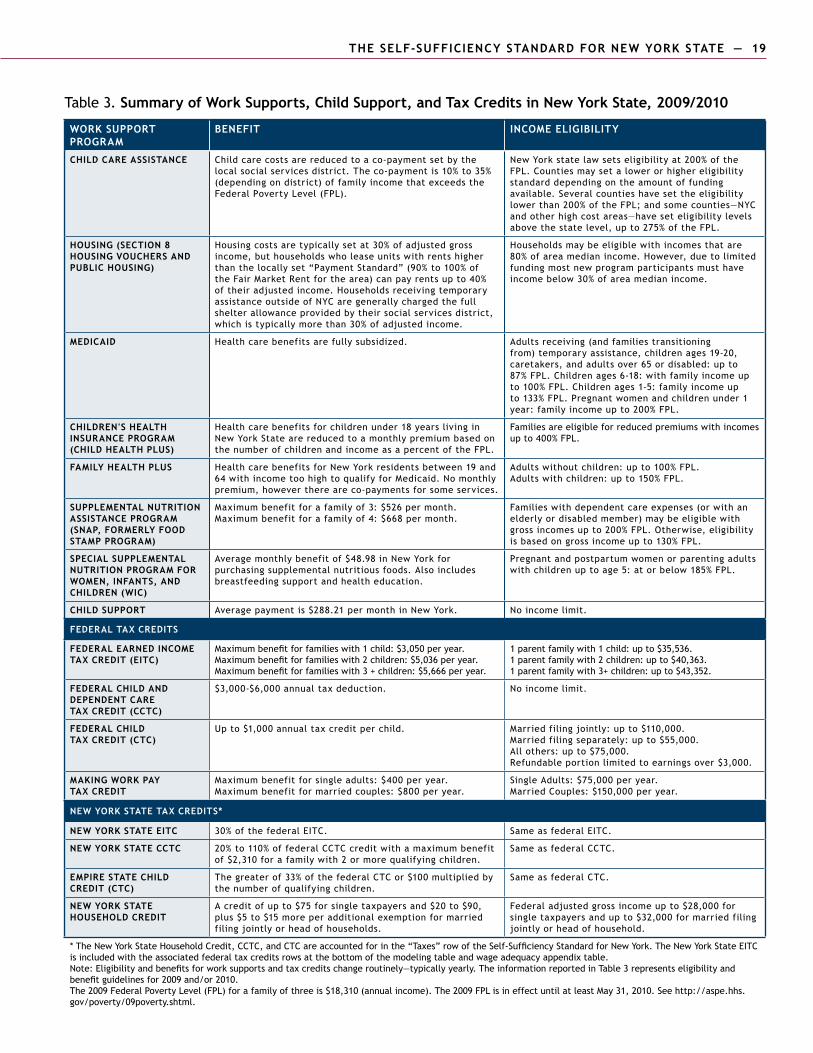
Childsupport,althoughnotaworksupportperse,canassistafamilyinmeetingbasicneedsandsoisalsomodeled.Thissectionmodelstheimpactthatworksupportscanhaveonfamilyincomeandexpenses.Worksupportscanbeavaluableadditiontosomefamilybudgets,substantiallyreducingexpensesforsomebasicneedsandtherebyfreeingincomeforfamiliestouseonotherneeds.Table 3providesasummaryoftheworksupports,childsupport,andtaxcreditsmodeledinthissection.AnexplanationofhowandwhythetaxesandtaxcreditsaretreateddifferentlyinthemodelingsectionthanintheSelf-SufficiencyStandardisprovidedbelow.
TREATMENT OF TAx CREDITS IN THE MODELING TABLE AND FIGURETheStandardshowsrefundableandnonrefundabletaxcreditsasiftheyarereceivedmonthly.However,fortheworksupportsmodeledinTable4,therefundablefederal
Modeling the Impact of Work Supports
andstateEarnedIncomeTaxCredit(EITC)andthe“additional”refundableportionoftheChildTaxCredit(CTC)andMakingWorkPayTaxCredit(MWPTC)areshownasreceivedannually.However,theChildCareTaxCredit(CCTC)isnonrefundable,meaningitcanonlybeusedtoreducetaxesanddoesnotcontributetoataxrefund.ThereforeitisshownasamonthlycreditagainstfederaltaxesinboththeSelf-SufficiencyStandardandinTable4.Otherstatetaxcreditsarepartofthestateand/orcitytaxcalculationsandarethusincludedintheTaxeslineamountoftheStandard.
ThetaxcreditsarecalculatedthiswayinTable4inordertobeasrealisticaspossible.AlthoughbylawafamilycanreceivepartoftheirEITConamonthlybasis(calledAdvanceEITC),manyworkersprefertoreceiveitannuallyasalumpsum.Infact,nearlyallfamiliesreceivetheEITCasasinglepaymentthefollowingyearwhentheyfiletheirtaxreturns.21ManyfamiliesprefertousetheEITCas“forcedsavings”topayforlargeritemsthatareimportantfamilyneeds,suchaspayingthesecuritydepositforhousing,buyingacar,orsettlingdebts.22Therefore,inTable4,thetotalamountoftherefundablefederalandstateEITCthefamilywouldreceiveannually(whentheyfiletheirtaxes)isshownatthebottomofthetableintherowsentitledAnnualRefundableTaxCredits.Thisisbasedontheassumptionthattheadultworksatthissamewage,full-time,fortheyear.
LiketheEITC,thefederalandstateCTCisshownasreceivedmonthlyintheSelf-SufficiencyStandard.However,forTable4,thefederalCTCissplitintotwoamountswithonlytheportionthatcanbeusedtooffsetanyremaining(aftertheCCTC)taxesowedshownmonthly,whilethe
WORk SUPPORTS ARE SAFETY NETS THAT CAN
HELP FAMILIES ACHIEvE STABILITY WITHOUT
NEEDING TO CHOOSE BETWEEN BASIC NEEDS,
SUCH AS SCRIMPING ON NUTRITION, LIvING IN
OvERCROWDED OR SUBSTANDARD HOUSING,
OR LEAvING CHILDREN IN UNSAFE AND/OR
NONSTIMULATING ENvIRONMENTS.
18 — tHE SELF-SUFFICIENCY STANDARD FOR NEW YORK STATE tHE SELF-SUFFICIENCY STANDARD FOR NEW YORK STATE — 19
Table 3. Summary of Work Supports, Child Support, and Tax Credits in New York State, 2009/2010
work suPPort PROGRAM
benefit INCOME ELIGIBILITY
CHILD CARE ASSISTANCE Child care costs are reduced to a co-payment set by the local social services district. The co-payment is 10% to 35% (depending on district) of family income that exceeds the Federal Poverty Level (FPL).
New York state law sets eligibility at 200% of the FPL. Counties may set a lower or higher eligibility standard depending on the amount of funding available. Several counties have set the eligibility lower than 200% of the FPL; and some counties —NYC and other high cost areas—have set eligibility levels above the state level, up to 275% of the FPL.
HOUSING (SECTION 8 HOUSING VOUCHERS AND PUBLIC HOUSING)
Housing costs are typically set at 30% of adjusted gross income, but households who lease units with rents higher than the locally set “Payment Standard” (90% to 100% of the Fair Market Rent for the area) can pay rents up to 40% of their adjusted income. Households receiving temporary assistance outside of NYC are generally charged the full shelter allowance provided by their social services district, which is typically more than 30% of adjusted income.
Households may be eligible with incomes that are 80% of area median income. However, due to limited funding most new program participants must have income below 30% of area median income.
MEDICAID Health care benefits are fully subsidized. Adults receiving (and families transitioning from) temporary assistance, children ages 19-20, caretakers, and adults over 65 or disabled: up to 87% FPL. Children ages 6-18: with family income up to 100% FPL. Children ages 1-5: family income up to 133% FPL. Pregnant women and children under 1 year: family income up to 200% FPL.
CHILDREN'S HEALTH INSURANCE PROGRAM (CHILD HEALTH PLUS)
Health care benefits for children under 18 years living in New York State are reduced to a monthly premium based on the number of children and income as a percent of the FPL.
Families are eligible for reduced premiums with incomes up to 400% FPL.
FAMILY HEALTH PLUS Health care benefits for New York residents between 19 and 64 with income too high to qualify for Medicaid. No monthly premium, however there are co-payments for some services.
Adults without children: up to 100% FPL. Adults with children: up to 150% FPL.
SUPPLEMENTAL NUTRITION ASSISTANCE PROGRAM (SNAP, FORMERLY FOOD STAMP PROGRAM)
Maximum benefit for a family of 3: $526 per month.Maximum benefit for a family of 4: $668 per month.
Families with dependent care expenses (or with an elderly or disabled member) may be eligible with gross incomes up to 200% FPL. Otherwise, eligibility is based on gross income up to 130% FPL.
SPECIAL SUPPLEMENTAL NUTRITION PROGRAM FOR WOMEN, INFANTS, AND CHILDREN (WIC)
Average monthly benefit of $48.98 in New York for purchasing supplemental nutritious foods. Also includes breastfeeding support and health education.
Pregnant and postpartum women or parenting adults with children up to age 5: at or below 185% FPL.
CHILD SUPPORT Average payment is $288.21 per month in New York. No income limit.
FEDERAL TAx CREDITS
FEDERAL EARNED INCOME TAx CREDIT (EITC)
Maximum benefit for families with 1 child: $3,050 per year. Maximum benefit for families with 2 children: $5,036 per year. Maximum benefit for families with 3 + children: $5,666 per year.
1 parent family with 1 child: up to $35,536. 1 parent family with 2 children: up to $40,363.1 parent family with 3+ children: up to $43,352.
FEDERAL CHILD AND DEPENDENT CARE TAx CREDIT (CCTC)
$3,000-$6,000 annual tax deduction. No income limit.
FEDERAL CHILD TAx CREDIT (CTC)
Up to $1,000 annual tax credit per child. Married filing jointly: up to $110,000. Married filing separately: up to $55,000. All others: up to $75,000.Refundable portion limited to earnings over $3,000.
MAKING WORK PAY TAx CREDIT
Maximum benefit for single adults: $400 per year. Maximum benefit for married couples: $800 per year.
Single Adults: $75,000 per year. Married Couples: $150,000 per year.
NEW YORK STATE TAx CREDITS*
NEW YORK STATE EITC 30% of the federal EITC. Same as federal EITC.
NEW YORK STATE CCTC 20% to 110% of federal CCTC credit with a maximum benefit of $2,310 for a family with 2 or more qualifying children.
Same as federal CCTC.
EMPIRE STATE CHILD CREDIT (CTC)
The greater of 33% of the federal CTC or $100 multiplied by the number of qualifying children.
Same as federal CTC.
new york state HOUSEHOLD CREDIT
A credit of up to $75 for single taxpayers and $20 to $90, plus $5 to $15 more per additional exemption for married filing jointly or head of households.
Federal adjusted gross income up to $28,000 for single taxpayers and up to $32,000 for married filing jointly or head of household.
* The New York State Household Credit, CCTC, and CTC are accounted for in the “Taxes” row of the Self-Sufficiency Standard for New York. The New York State EITC is included with the associated federal tax credits rows at the bottom of the modeling table and wage adequacy appendix table.Note: Eligibility and benefits for work supports and tax credits change routinely—typically yearly. The information reported in Table 3 represents eligibility and benefit guidelines for 2009 and/or 2010. The 2009 Federal Poverty Level (FPL) for a family of three is $18,310 (annual income). The 2009 FPL is in effect until at least May 31, 2010. See http://aspe.hhs.gov/poverty/09poverty.shtml.
20 — tHE SELF-SUFFICIENCY STANDARD FOR NEW YORK STATE tHE SELF-SUFFICIENCY STANDARD FOR NEW YORK STATE — 21
“additional”refundableportionoftheCTCisshownasalumpsumreceivedannuallyatthebottomofTable4.NotethatunliketheEITConecannotlegallyreceivethe“additional”refundableportionoftheChildTaxCreditonamonthlybasis.Likewise,theMWPTCisalsoseparatedintoamonthlyamountusedtooffsetremainingfederaltaxes(aftertheCCTCandCTC)andtheadditionalrefundableamountshownannually.
TABLE 4 – THE IMPACT OF WORK SUPPORTS AND CHILD SUPPORT ON MONTHLY INCOMEInTable4,theimpactofreceivingworksupportsandchildsupportontheincomenecessarytomeetbasicneedsismodeledforafamilywithoneadult,onepreschooler,andoneschool-agechildlivinginUlsterCounty.TomodeltheworksupportsinTable4,eligibilityandco-paymentsarecalculatedbasedontheincomeneededtocoverthecostsofbasicneeds.EachcolumnofTable4demonstrateshowspecificworksupportscanlowerthecostofspecificbasicneeds,andthereforelessentheincomenecessarytomeetallofafamily’sbasicneeds.Coststhathavebeenreducedbytheseworksupportsareindicatedwithboldfontinthe“MonthlyExpenses”sectionofthetable.Bracketssurroundingcolumntitlesinthetableshowthataworksupportwasmodeledbutthefamilywasnoteligibletoreceiveitinthatcolumnbasedonincomeeligibility.
No Work Supports (Column #1). Column#1ofTable4showstheSelf-SufficiencyWageneededtocoverthetotalmonthlyexpenseswithoutanyworksupportstohelpreducecosts(excepttaxcreditswhereapplicable)forfamilieswithoneadult,onepreschooler,andoneschool-agechildlivinginUlsterCounty.Thisfamilyhasmonthlychildcareexpensesof$1,419andmonthlyhousingcostsof$1,001.Theadultinthisfamilymustearn$4,545permonthor$25.82perhourworkingfull-timetomeetthefamily’sbasicneedswithoutthehelpofpublicorprivateassistance.
Child Support (Column #2). Column#2modelstheimpactofreceivingchildsupportonafamily’sbudget.ThechildsupportpaymentmodeledinColumn#2($288permonth)istheaverageamountreceivedbyfamiliesparticipatingintheChildSupportEnforcementPrograminNewYork.23Childsupportpaymentsfromabsent,noncustodialparentscanbeavaluableadditiontosome
familybudgets,evenincaseswherethenoncustodialparent’sincomeisrelativelylow.Unlikeadditionalearnedincome,childsupportisnottaxable,andcanreducetheamountfamiliesneedtoearnbothdirectlyandindirectlythroughreducedtaxes,thushavingastrongimpactonhelpingfamiliesmeettheirneeds.Overall,withthehelpofchildsupport,thewageneededtomeetbasicneedsisreducedto$4,101permonth($23.30perhour).
Child Care and Child Support (Column #3). Column#3modelstheimpactofchildcareassistancealongwithchildsupportonafamily’sbudget.Sincechildcareisoneofthemajorexpensesforworkingfamilieswithchildren,theadditionofachildcaresubsidygenerallyprovidesthegreatestfinancialreliefofanyworksupport.EligibilityforchildcareassistanceinUlsterCountyissetat200%oftheFPLforthree-personfamiliesandthemonthlyco-paymentsare25%ofafamily’sincomeabovetheFPL.24InColumn#3,childcareassistancereduceschildcarecostssubstantiallyfrom$1,419toaco-paymentof$418permonth.Withthehelpofchildcareassistanceandchildsupport,theamountthisfamilyinUlsterCountymustearntomeettheirbasicneedsisreducedto$2,911permonth($16.54perhour).
AsinallcolumnsinTable4,theannualrefundableportionoftaxcreditsareexcludedfromthemonthlywagecalculation,andareinsteadreceivedasanannuallumpsum(seeTreatment of Tax Credits in the Modeling Table and Figureinthebeginningofthissection).InColumn#3thisfamilyiseligibleforover$3,000inannualtaxcredits.
Child Care, SNAP, WIC, and Medicaid (Column #4). Childcareassistance,foodassistance,andMedicaidcomprisethetypical“package”ofbenefitsforadultstransitioningfromwelfaretoworkandaremodeledtogetherinColumn#4.FamiliesthatentertheworkforcefromTANFareusuallyeligibleforcontinuedcoveragebyMedicaidforthemselvesandtheirchildrenforupto12monthsthroughtheTransitionalMedicaidprogram.25InColumn#4Medicaidcoversallofthefamily’shealthcareexpenses.
TheSupplementalNutritionAssistanceProgram(SNAP)andtheWomen,InfantsandChildrenProgram(WIC)areadministeredbyindividualstates,andprovidecrucialfoodassistancetolow-incomehouseholds.ForfamiliestransitioningoffofTemporaryAssistanceinNewYork,
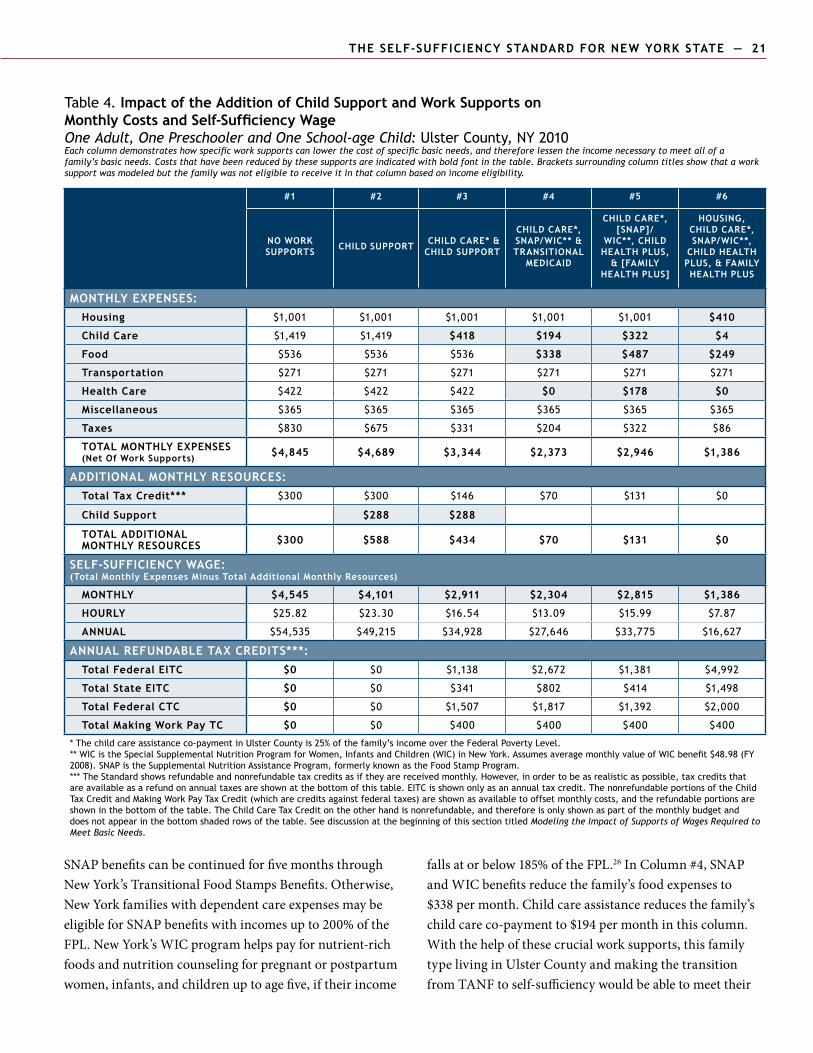
20 — tHE SELF-SUFFICIENCY STANDARD FOR NEW YORK STATE tHE SELF-SUFFICIENCY STANDARD FOR NEW YORK STATE — 21
SNAPbenefitscanbecontinuedforfivemonthsthroughNewYork’sTransitionalFoodStampsBenefits.Otherwise,NewYorkfamilieswithdependentcareexpensesmaybeeligibleforSNAPbenefitswithincomesupto200%oftheFPL.NewYork’sWICprogramhelpspayfornutrient-richfoodsandnutritioncounselingforpregnantorpostpartumwomen,infants,andchildrenuptoagefive,iftheirincome
fallsatorbelow185%oftheFPL.26InColumn#4,SNAPandWICbenefitsreducethefamily’sfoodexpensesto$338permonth.Childcareassistancereducesthefamily’schildcareco-paymentto$194permonthinthiscolumn.Withthehelpofthesecrucialworksupports,thisfamilytypelivinginUlsterCountyandmakingthetransitionfromTANFtoself-sufficiencywouldbeabletomeettheir
Table 4. Impact of the Addition of Child Support and Work Supports on Monthly Costs and Self-Sufficiency Wage One Adult, One Preschooler and One School-age Child: Ulster County, NY 2010 Each column demonstrates how specific work supports can lower the cost of specific basic needs, and therefore lessen the income necessary to meet all of a family’s basic needs. Costs that have been reduced by these supports are indicated with bold font in the table. Brackets surrounding column titles show that a work support was modeled but the family was not eligible to receive it in that column based on income eligibility.
#1 #2 #3 #4 #5 #6
no work suPPorts CHILD SUPPORT CHILD CARE* &
CHILD SUPPORT
CHILD CARE*, SNAP/WIC** & transitional
MEDICAID
CHILD CARE*, [SNAP]/
WIC**, CHILD HEALTH PLUS,
& [FAMILY HealtH Plus]
HOUSING, CHILD CARE*, SNAP/WIC**,
CHILD HEALTH PLUS, & FAMILY HealtH Plus
MONTHLY ExPENSES:Housing $1,001 $1,001 $1,001 $1,001 $1,001 $410
Child Care $1,419 $1,419 $418 $194 $322 $4
food $536 $536 $536 $338 $487 $249
Transportation $271 $271 $271 $271 $271 $271
Health Care $422 $422 $422 $0 $178 $0
Miscellaneous $365 $365 $365 $365 $365 $365
Taxes $830 $675 $331 $204 $322 $86
TOTAL MONTHLY ExPENSES(Net Of Work Supports) $4,845 $4,689 $3,344 $2,373 $2,946 $1,386
ADDITIONAL MONTHLY RESOURCES:Total Tax Credit*** $300 $300 $146 $70 $131 $0
Child Support $288 $288
TOTAL ADDITIONAL MONTHLY RESOURCES $300 $588 $434 $70 $131 $0
SELF-SUFFICIENCY WAGE:(Total Monthly Expenses Minus Total Additional Monthly Resources)
MONTHLY $4,545 $4,101 $2,911 $2,304 $2,815 $1,386
Hourly $25.82 $23.30 $16.54 $13.09 $15.99 $7.87
annual $54,535 $49,215 $34,928 $27,646 $33,775 $16,627
ANNUAL REFUNDABLE TAx CREDITS***:Total Federal EITC $0 $0 $1,138 $2,672 $1,381 $4,992
Total State EITC $0 $0 $341 $802 $414 $1,498
Total Federal CTC $0 $0 $1,507 $1,817 $1,392 $2,000
Total Making Work Pay TC $0 $0 $400 $400 $400 $400
* The child care assistance co-payment in Ulster County is 25% of the family’s income over the Federal Poverty Level.** WIC is the Special Supplemental Nutrition Program for Women, Infants and Children (WIC) in New York. Assumes average monthly value of WIC benefit $48.98 (FY 2008). SNAP is the Supplemental Nutrition Assistance Program, formerly known as the Food Stamp Program. *** The Standard shows refundable and nonrefundable tax credits as if they are received monthly. However, in order to be as realistic as possible, tax credits that are available as a refund on annual taxes are shown at the bottom of this table. EITC is shown only as an annual tax credit. The nonrefundable portions of the Child Tax Credit and Making Work Pay Tax Credit (which are credits against federal taxes) are shown as available to offset monthly costs, and the refundable portions are shown in the bottom of the table. The Child Care Tax Credit on the other hand is nonrefundable, and therefore is only shown as part of the monthly budget and does not appear in the bottom shaded rows of the table. See discussion at the beginning of this section titled Modeling the Impact of Supports of Wages Required to Meet Basic Needs.
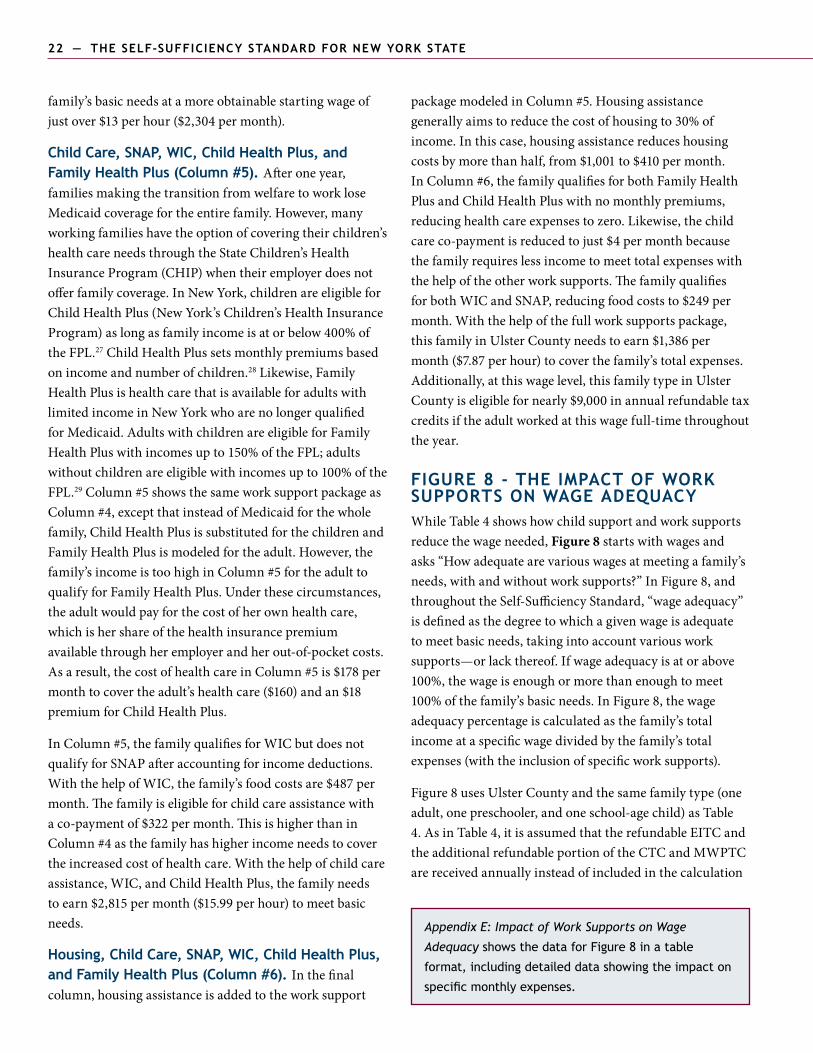
22 — tHE SELF-SUFFICIENCY STANDARD FOR NEW YORK STATE tHE SELF-SUFFICIENCY STANDARD FOR NEW YORK STATE — 23
family’sbasicneedsatamoreobtainablestartingwageofjustover$13perhour($2,304permonth).
Child Care, SNAP, WIC, Child Health Plus, and Family Health Plus (Column #5). Afteroneyear,familiesmakingthetransitionfromwelfaretoworkloseMedicaidcoveragefortheentirefamily.However,manyworkingfamilieshavetheoptionofcoveringtheirchildren’shealthcareneedsthroughtheStateChildren’sHealthInsuranceProgram(CHIP)whentheiremployerdoesnotofferfamilycoverage.InNewYork,childrenareeligibleforChildHealthPlus(NewYork’sChildren’sHealthInsuranceProgram)aslongasfamilyincomeisatorbelow400%oftheFPL.27ChildHealthPlussetsmonthlypremiumsbasedonincomeandnumberofchildren.28Likewise,FamilyHealthPlusishealthcarethatisavailableforadultswithlimitedincomeinNewYorkwhoarenolongerqualifiedforMedicaid.AdultswithchildrenareeligibleforFamilyHealthPluswithincomesupto150%oftheFPL;adultswithoutchildrenareeligiblewithincomesupto100%oftheFPL.29Column#5showsthesameworksupportpackageasColumn#4,exceptthatinsteadofMedicaidforthewholefamily,ChildHealthPlusissubstitutedforthechildrenandFamilyHealthPlusismodeledfortheadult.However,thefamily’sincomeistoohighinColumn#5fortheadulttoqualifyforFamilyHealthPlus.Underthesecircumstances,theadultwouldpayforthecostofherownhealthcare,whichishershareofthehealthinsurancepremiumavailablethroughheremployerandherout-of-pocketcosts.Asaresult,thecostofhealthcareinColumn#5is$178permonthtocovertheadult’shealthcare($160)andan$18premiumforChildHealthPlus.
InColumn#5,thefamilyqualifiesforWICbutdoesnotqualifyforSNAPafteraccountingforincomedeductions.WiththehelpofWIC,thefamily’sfoodcostsare$487permonth.Thefamilyiseligibleforchildcareassistancewithaco-paymentof$322permonth.ThisishigherthaninColumn#4asthefamilyhashigherincomeneedstocovertheincreasedcostofhealthcare.Withthehelpofchildcareassistance,WIC,andChildHealthPlus,thefamilyneedstoearn$2,815permonth($15.99perhour)tomeetbasicneeds.
Housing, Child Care, SNAP, WIC, Child Health Plus, and Family Health Plus (Column #6). Inthefinalcolumn,housingassistanceisaddedtotheworksupport
packagemodeledinColumn#5.Housingassistancegenerallyaimstoreducethecostofhousingto30%ofincome.Inthiscase,housingassistancereduceshousingcostsbymorethanhalf,from$1,001to$410permonth.InColumn#6,thefamilyqualifiesforbothFamilyHealthPlusandChildHealthPluswithnomonthlypremiums,reducinghealthcareexpensestozero.Likewise,thechildcareco-paymentisreducedtojust$4permonthbecausethefamilyrequireslessincometomeettotalexpenseswiththehelpoftheotherworksupports.ThefamilyqualifiesforbothWICandSNAP,reducingfoodcoststo$249permonth.Withthehelpofthefullworksupportspackage,thisfamilyinUlsterCountyneedstoearn$1,386permonth($7.87perhour)tocoverthefamily’stotalexpenses.Additionally,atthiswagelevel,thisfamilytypeinUlsterCountyiseligiblefornearly$9,000inannualrefundabletaxcreditsiftheadultworkedatthiswagefull-timethroughouttheyear.
FIGURE 8 - THE IMPACT OF WORK SUPPORTS ON WAGE ADEQUACYWhileTable4showshowchildsupportandworksupportsreducethewageneeded,Figure 8startswithwagesandasks“Howadequatearevariouswagesatmeetingafamily’sneeds,withandwithoutworksupports?”InFigure8,andthroughouttheSelf-SufficiencyStandard,“wageadequacy”isdefinedasthedegreetowhichagivenwageisadequatetomeetbasicneeds,takingintoaccountvariousworksupports—orlackthereof.Ifwageadequacyisatorabove100%,thewageisenoughormorethanenoughtomeet100%ofthefamily’sbasicneeds.InFigure8,thewageadequacypercentageiscalculatedasthefamily’stotalincomeataspecificwagedividedbythefamily’stotalexpenses(withtheinclusionofspecificworksupports).
Figure8usesUlsterCountyandthesamefamilytype(oneadult,onepreschooler,andoneschool-agechild)asTable4.AsinTable4,itisassumedthattherefundableEITCandtheadditionalrefundableportionoftheCTCandMWPTCarereceivedannuallyinsteadofincludedinthecalculation
Appendix E: Impact of Work Supports on Wage
Adequacy shows the data for Figure 8 in a table
format, including detailed data showing the impact on
specific monthly expenses.
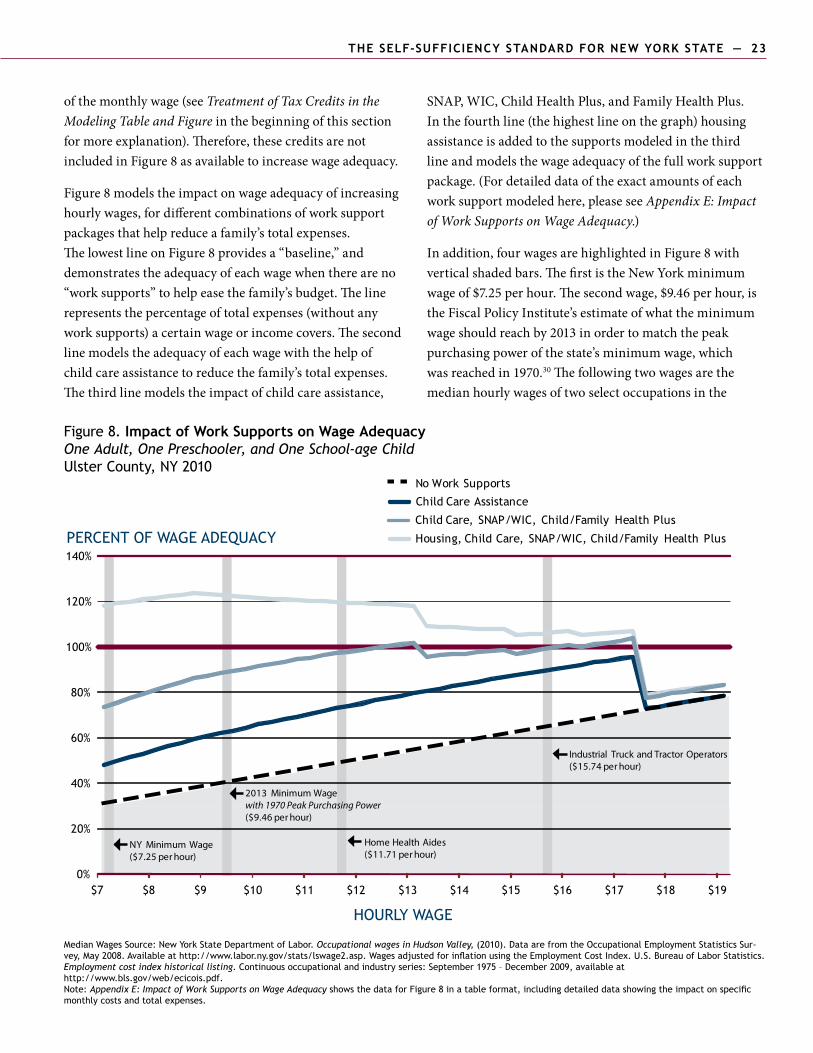
22 — tHE SELF-SUFFICIENCY STANDARD FOR NEW YORK STATE tHE SELF-SUFFICIENCY STANDARD FOR NEW YORK STATE — 23
ofthemonthlywage(seeTreatment of Tax Credits in the Modeling Table and Figureinthebeginningofthissectionformoreexplanation).Therefore,thesecreditsarenotincludedinFigure8asavailabletoincreasewageadequacy.
Figure8modelstheimpactonwageadequacyofincreasinghourlywages,fordifferentcombinationsofworksupportpackagesthathelpreduceafamily’stotalexpenses.ThelowestlineonFigure8providesa“baseline,”anddemonstratestheadequacyofeachwagewhenthereareno“worksupports”tohelpeasethefamily’sbudget.Thelinerepresentsthepercentageoftotalexpenses(withoutanyworksupports)acertainwageorincomecovers.Thesecondlinemodelstheadequacyofeachwagewiththehelpofchildcareassistancetoreducethefamily’stotalexpenses.Thethirdlinemodelstheimpactofchildcareassistance,
SNAP,WIC,ChildHealthPlus,andFamilyHealthPlus.Inthefourthline(thehighestlineonthegraph)housingassistanceisaddedtothesupportsmodeledinthethirdlineandmodelsthewageadequacyofthefullworksupportpackage.(Fordetaileddataoftheexactamountsofeachworksupportmodeledhere,pleaseseeAppendix E: Impact of Work Supports on Wage Adequacy.)
Inaddition,fourwagesarehighlightedinFigure8withverticalshadedbars.ThefirstistheNewYorkminimumwageof$7.25perhour.Thesecondwage,$9.46perhour,istheFiscalPolicyInstitute’sestimateofwhattheminimumwageshouldreachby2013inordertomatchthepeakpurchasingpowerofthestate’sminimumwage,whichwasreachedin1970.30Thefollowingtwowagesarethemedianhourlywagesoftwoselectoccupationsinthe
Figure 8. Impact of Work Supports on Wage Adequacy One Adult, One Preschooler, and One School-age Child Ulster County, NY 2010
Median Wages Source: New York State Department of Labor. Occupational wages in Hudson Valley, (2010). Data are from the Occupational Employment Statistics Sur-vey, May 2008. Available at http://www.labor.ny.gov/stats/lswage2.asp. Wages adjusted for inflation using the Employment Cost Index. U.S. Bureau of Labor Statistics. Employment cost index historical listing. Continuous occupational and industry series: September 1975 – December 2009, available at http://www.bls.gov/web/ecicois.pdf.Note: Appendix E: Impact of Work Supports on Wage Adequacy shows the data for Figure 8 in a table format, including detailed data showing the impact on specific monthly costs and total expenses.
PERCENT OF WAGE ADEQUACY
HOURLY WAGE
0%
20%
40%
60%
80%
100%
120%
140%
$7 $8 $9 $10 $11 $12 $13 $14 $15 $16 $17 $18 $19
No Work Supports
Child Care Assistance
Child Care, SNAP/WIC, Child/Family Health Plus
Housing, Child Care, SNAP/WIC, Child/Family Health Plus
NY Minimum Wage($7.25 per hour)
Home Health Aides($11.71 per hour)
Industrial Truck and Tractor Operators($15.74 per hour)
2013 Minimum Wage with 1970 Peak Purchasing Power($9.46 per hour)
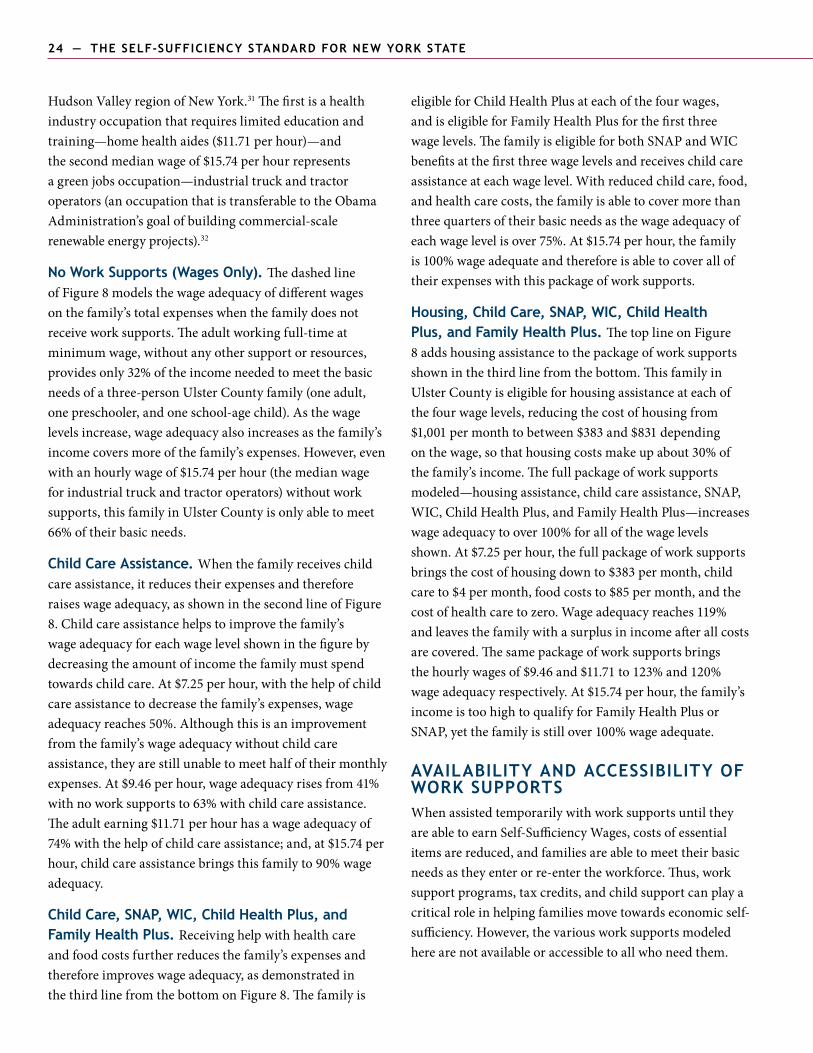
24 — tHE SELF-SUFFICIENCY STANDARD FOR NEW YORK STATE tHE SELF-SUFFICIENCY STANDARD FOR NEW YORK STATE — 25
HudsonValleyregionofNewYork.31Thefirstisahealthindustryoccupationthatrequireslimitededucationandtraining—homehealthaides($11.71perhour)—andthesecondmedianwageof$15.74perhourrepresentsagreenjobsoccupation—industrialtruckandtractoroperators(anoccupationthatistransferabletotheObamaAdministration’sgoalofbuildingcommercial-scalerenewableenergyprojects).32
No Work Supports (Wages Only). ThedashedlineofFigure8modelsthewageadequacyofdifferentwagesonthefamily’stotalexpenseswhenthefamilydoesnotreceiveworksupports.Theadultworkingfull-timeatminimumwage,withoutanyothersupportorresources,providesonly32%oftheincomeneededtomeetthebasicneedsofathree-personUlsterCountyfamily(oneadult,onepreschooler,andoneschool-agechild).Asthewagelevelsincrease,wageadequacyalsoincreasesasthefamily’sincomecoversmoreofthefamily’sexpenses.However,evenwithanhourlywageof$15.74perhour(themedianwageforindustrialtruckandtractoroperators)withoutworksupports,thisfamilyinUlsterCountyisonlyabletomeet66%oftheirbasicneeds.
Child Care Assistance. Whenthefamilyreceiveschildcareassistance,itreducestheirexpensesandthereforeraiseswageadequacy,asshowninthesecondlineofFigure8.Childcareassistancehelpstoimprovethefamily’swageadequacyforeachwagelevelshowninthefigurebydecreasingtheamountofincomethefamilymustspendtowardschildcare.At$7.25perhour,withthehelpofchildcareassistancetodecreasethefamily’sexpenses,wageadequacyreaches50%.Althoughthisisanimprovementfromthefamily’swageadequacywithoutchildcareassistance,theyarestillunabletomeethalfoftheirmonthlyexpenses.At$9.46perhour,wageadequacyrisesfrom41%withnoworksupportsto63%withchildcareassistance.Theadultearning$11.71perhourhasawageadequacyof74%withthehelpofchildcareassistance;and,at$15.74perhour,childcareassistancebringsthisfamilyto90%wageadequacy.
Child Care, SNAP, WIC, Child Health Plus, and Family Health Plus. Receivinghelpwithhealthcareandfoodcostsfurtherreducesthefamily’sexpensesandthereforeimproveswageadequacy,asdemonstratedinthethirdlinefromthebottomonFigure8.Thefamilyis
eligibleforChildHealthPlusateachofthefourwages,andiseligibleforFamilyHealthPlusforthefirstthreewagelevels.ThefamilyiseligibleforbothSNAPandWICbenefitsatthefirstthreewagelevelsandreceiveschildcareassistanceateachwagelevel.Withreducedchildcare,food,andhealthcarecosts,thefamilyisabletocovermorethanthreequartersoftheirbasicneedsasthewageadequacyofeachwagelevelisover75%.At$15.74perhour,thefamilyis100%wageadequateandthereforeisabletocoveralloftheirexpenseswiththispackageofworksupports.
Housing, Child Care, SNAP, WIC, Child Health Plus, and Family Health Plus. ThetoplineonFigure8addshousingassistancetothepackageofworksupportsshowninthethirdlinefromthebottom.ThisfamilyinUlsterCountyiseligibleforhousingassistanceateachofthefourwagelevels,reducingthecostofhousingfrom$1,001permonthtobetween$383and$831dependingonthewage,sothathousingcostsmakeupabout30%ofthefamily’sincome.Thefullpackageofworksupportsmodeled—housingassistance,childcareassistance,SNAP,WIC,ChildHealthPlus,andFamilyHealthPlus—increaseswageadequacytoover100%forallofthewagelevelsshown.At$7.25perhour,thefullpackageofworksupportsbringsthecostofhousingdownto$383permonth,childcareto$4permonth,foodcoststo$85permonth,andthecostofhealthcaretozero.Wageadequacyreaches119%andleavesthefamilywithasurplusinincomeafterallcostsarecovered.Thesamepackageofworksupportsbringsthehourlywagesof$9.46and$11.71to123%and120%wageadequacyrespectively.At$15.74perhour,thefamily’sincomeistoohightoqualifyforFamilyHealthPlusorSNAP,yetthefamilyisstillover100%wageadequate.
AVAILABILITY AND ACCESSIBILITY OF work suPPortsWhenassistedtemporarilywithworksupportsuntiltheyareabletoearnSelf-SufficiencyWages,costsofessentialitemsarereduced,andfamiliesareabletomeettheirbasicneedsastheyenterorre-entertheworkforce.Thus,worksupportprograms,taxcredits,andchildsupportcanplayacriticalroleinhelpingfamiliesmovetowardseconomicself-sufficiency.However,thevariousworksupportsmodeledherearenotavailableoraccessibletoallwhoneedthem.
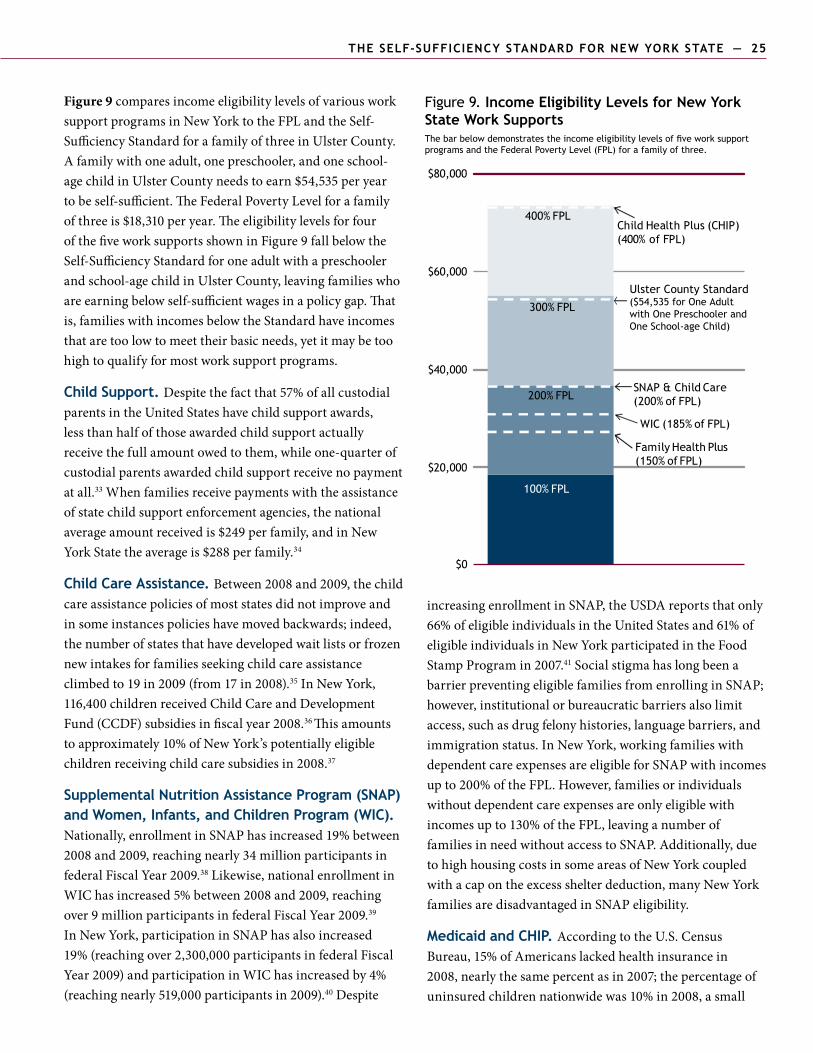
24 — tHE SELF-SUFFICIENCY STANDARD FOR NEW YORK STATE tHE SELF-SUFFICIENCY STANDARD FOR NEW YORK STATE — 25
Figure 9comparesincomeeligibilitylevelsofvariousworksupportprogramsinNewYorktotheFPLandtheSelf-SufficiencyStandardforafamilyofthreeinUlsterCounty.Afamilywithoneadult,onepreschooler,andoneschool-agechildinUlsterCountyneedstoearn$54,535peryeartobeself-sufficient.TheFederalPovertyLevelforafamilyofthreeis$18,310peryear.TheeligibilitylevelsforfourofthefiveworksupportsshowninFigure9fallbelowtheSelf-SufficiencyStandardforoneadultwithapreschoolerandschool-agechildinUlsterCounty,leavingfamilieswhoareearningbelowself-sufficientwagesinapolicygap.Thatis,familieswithincomesbelowtheStandardhaveincomesthataretoolowtomeettheirbasicneeds,yetitmaybetoohightoqualifyformostworksupportprograms.
Child Support. Despitethefactthat57%ofallcustodialparentsintheUnitedStateshavechildsupportawards,lessthanhalfofthoseawardedchildsupportactuallyreceivethefullamountowedtothem,whileone-quarterofcustodialparentsawardedchildsupportreceivenopaymentatall.33Whenfamiliesreceivepaymentswiththeassistanceofstatechildsupportenforcementagencies,thenationalaverageamountreceivedis$249perfamily,andinNewYorkStatetheaverageis$288perfamily.34
Child Care Assistance. Between2008and2009,thechildcareassistancepoliciesofmoststatesdidnotimproveandinsomeinstancespolicieshavemovedbackwards;indeed,thenumberofstatesthathavedevelopedwaitlistsorfrozennewintakesforfamiliesseekingchildcareassistanceclimbedto19in2009(from17in2008).35InNewYork,116,400childrenreceivedChildCareandDevelopmentFund(CCDF)subsidiesinfiscalyear2008.36Thisamountstoapproximately10%ofNewYork’spotentiallyeligiblechildrenreceivingchildcaresubsidiesin2008.37
Supplemental Nutrition Assistance Program (SNAP) and Women, Infants, and Children Program (WIC). Nationally,enrollmentinSNAPhasincreased19%between2008and2009,reachingnearly34millionparticipantsinfederalFiscalYear2009.38Likewise,nationalenrollmentinWIChasincreased5%between2008and2009,reachingover9millionparticipantsinfederalFiscalYear2009.39InNewYork,participationinSNAPhasalsoincreased19%(reachingover2,300,000participantsinfederalFiscalYear2009)andparticipationinWIChasincreasedby4%(reachingnearly519,000participantsin2009).40Despite
increasingenrollmentinSNAP,theUSDAreportsthatonly66%ofeligibleindividualsintheUnitedStatesand61%ofeligibleindividualsinNewYorkparticipatedintheFoodStampProgramin2007.41SocialstigmahaslongbeenabarrierpreventingeligiblefamiliesfromenrollinginSNAP;however,institutionalorbureaucraticbarriersalsolimitaccess,suchasdrugfelonyhistories,languagebarriers,andimmigrationstatus.InNewYork,workingfamilieswithdependentcareexpensesareeligibleforSNAPwithincomesupto200%oftheFPL.However,familiesorindividualswithoutdependentcareexpensesareonlyeligiblewithincomesupto130%oftheFPL,leavinganumberoffamiliesinneedwithoutaccesstoSNAP.Additionally,duetohighhousingcostsinsomeareasofNewYorkcoupledwithacapontheexcessshelterdeduction,manyNewYorkfamiliesaredisadvantagedinSNAPeligibility.
Medicaid and CHIP. AccordingtotheU.S.CensusBureau,15%ofAmericanslackedhealthinsurancein2008,nearlythesamepercentasin2007;thepercentageofuninsuredchildrennationwidewas10%in2008,asmall
Ulster County Standard ($54,535 for One Adult with One Preschooler and One School-age Child)
$0
$20,000
$40,000
$60,000
$80,000
Child Health Plus (CHIP)(400% of FPL)
WIC (185% of FPL)
Family Health Plus(150% of FPL)
SNAP & Child Care (200% of FPL)
100% FPL
200% FPL
300% FPL
400% FPL
Figure 9. Income Eligibility Levels for New York State Work SupportsThe bar below demonstrates the income eligibility levels of five work support programs and the Federal Poverty Level (FPL) for a family of three.
26 — tHE SELF-SUFFICIENCY STANDARD FOR NEW YORK STATE
dropfrom2007.42ChildHealthPlusserved517,256childrenandteensunder19yearsofageinFY2008.43AccordingtoU.S.CensusHealthInsurancedata,4.5%ofNewYorkState’schildreninfamilieswithincomesatorbelow200%oftheFederalPovertyLeveldonothavehealthinsurance.44
Housing Assistance. AlthoughdecadesagoNewYorkhadamodestinventoryofstateandlocalhousingprograms,todaylow-incomefamiliesprimarilyrelyonfederalhousingprograms.45TheonlymajorstatehousingprogramthatcontinuesistheMitchell-Lamaprogram,whichincludes280housingdevelopmentswithatotalof120,000unitsandtypicallyserveshouseholdswithsomewhathigherincomes(exceptwhencombinedwithfederalhousingassistance).46
Low-incomehouseholdsinNewYorkareprimarilyservedbyfourprimaryfederalhousingprograms.
TheHUDFederalPublicHousingProgram,inwhich• housingunitsareownedandoperatedbypublichousingauthorities,startedin1937andserves212,739householdsinNewYork(178,017inNewYorkCityand34,722intherestofNewYorkState).47
TheHUDMultifamilyHousingProgramsbeganafter• 1949andprovidesfinancialassistancetoprivatelyowneddevelopmentsinordertolowertenantcostsandfundprojects.Thereare170,047unitsinNewYorkwithHUDMultifamilyrentsubsidies,ofwhich97,894arelocatedinNewYorkCityand72,153areintherestofthestate.48
TheHUDSection8HousingChoiceVoucherProgram• originatedin1974andprovideslow-incomehouseholdswithfundingvoucherstosubsidizeaportionoftheirrentpayment,aimingtoreduceahousehold’srentto30%oftheirincome.49Thisprogramserves227,975householdsinNewYork(58%ofwhichareinNewYorkCity,and42%areintherestofthestate).50
TheLow-IncomeHousingTaxCreditProgram• (LIHTC),createdin1986,providestaxcreditstohousingdevelopmentinvestorstooffsetcostsandensureaffordablerents.Thereare106,440unitsintheLIHTCprograminNewYork(63,934areinNewYorkCityand42,506areintherestofthestate)thathave“affordable”rents(setbelow30%ofincomeforhouseholdswith
incomesthatareatleast50%to60%ofareamedianincome).51
Familieswithincomesbelow80%ofHUD’sareamedianfamilyincomeareconsideredlow-incomeandareeligibleforfederalhousingassistance.However,housingsubsidiesarelimitedduetofundingavailabilityandmostnewprogramparticipantsmustbefamilieswithextremelylowincomes(definedbyHUDasincomebelow30%ofareamedianincomelimits).52Indeed,NewYork’sstatewide2009extremelylow-incomelimitis$18,350;the2008medianfamilyincomesoffamiliesreceivingfederalassistancewasbetween$13,600and$15,900forfamiliesintheMultifamilyHousingPrograms,$14,800forfamiliesintheVoucherProgram,and$19,800forfamiliesinthePublicHousingProgram.53
Earned Income Tax Credit. AccordingtotheInternalRevenueService(IRS),approximatelyoneinfoureligibletaxpayersdonotclaimtheEarnedIncomeTaxCredit.TheIRSstatesthatthisisdueto“complexeligibilityrequirements.”TheIRShasfoundthatlanguagebarriers,homelessness,andlivinginaruralareaaresomeofthebarriersthatcontributetolowerparticipationrates.Recognizingtheimportanceofincreasingawarenessofeligibility,theDepartmentoftheTreasury,theIRS,andcommunitypartnersacrosstheUnitedStatesareworkingtoprovidemoreoutreachandinformationtoeligibleindividualsthroughEITCawarenessdays.54
Insum,thereisconsiderablevariationinthereachofworksupports,withapproximately95%ofeligiblechildrencoveredbyhealthinsurance,butonly10%receivingchildcareassistance;likewise,one-thirdofeligiblefamiliesdonotreceiveSNAP,andone-quarterdonotclaimtheEITCforwhichtheyareeligible.
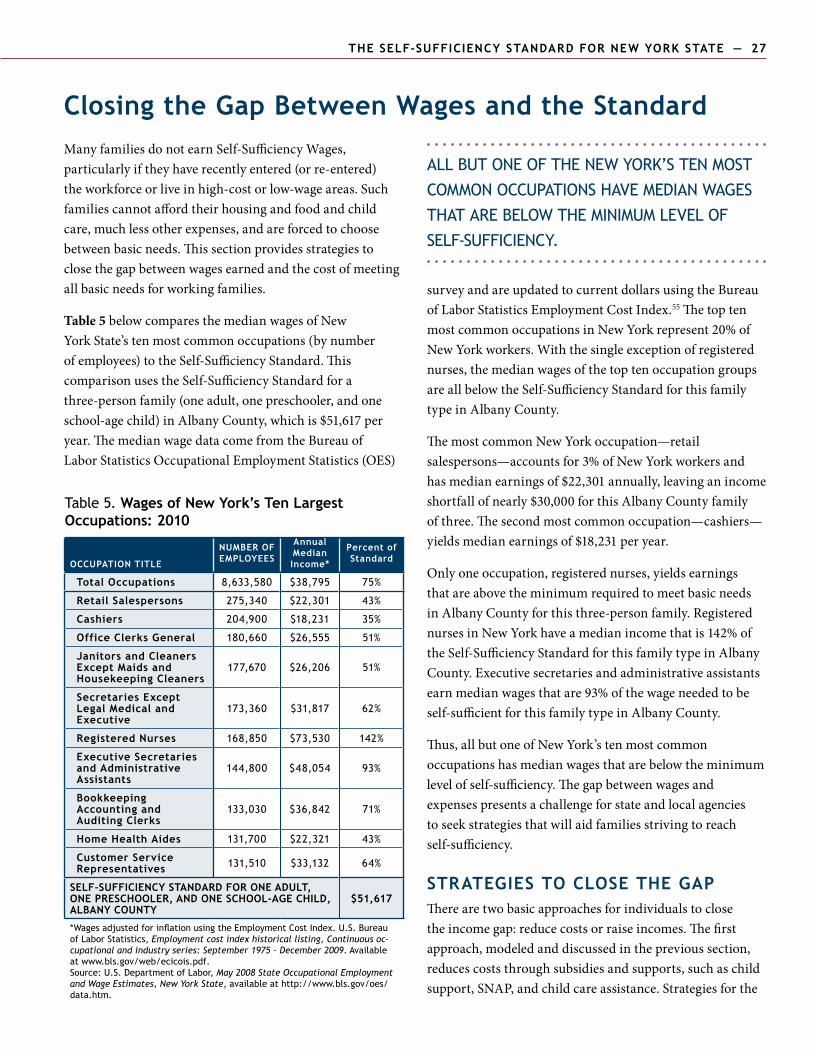
tHE SELF-SUFFICIENCY STANDARD FOR NEW YORK STATE — 27
Closing the Gap Between Wages and the StandardManyfamiliesdonotearnSelf-SufficiencyWages,particularlyiftheyhaverecentlyentered(orre-entered)theworkforceorliveinhigh-costorlow-wageareas.Suchfamiliescannotaffordtheirhousingandfoodandchildcare,muchlessotherexpenses,andareforcedtochoosebetweenbasicneeds.Thissectionprovidesstrategiestoclosethegapbetweenwagesearnedandthecostofmeetingallbasicneedsforworkingfamilies.
Table 5belowcomparesthemedianwagesofNewYorkState’stenmostcommonoccupations(bynumberofemployees)totheSelf-SufficiencyStandard.ThiscomparisonusestheSelf-SufficiencyStandardforathree-personfamily(oneadult,onepreschooler,andoneschool-agechild)inAlbanyCounty,whichis$51,617peryear.ThemedianwagedatacomefromtheBureauofLaborStatisticsOccupationalEmploymentStatistics(OES)
surveyandareupdatedtocurrentdollarsusingtheBureauofLaborStatisticsEmploymentCostIndex.55ThetoptenmostcommonoccupationsinNewYorkrepresent20%ofNewYorkworkers.Withthesingleexceptionofregisterednurses,themedianwagesofthetoptenoccupationgroupsareallbelowtheSelf-SufficiencyStandardforthisfamilytypeinAlbanyCounty.
ThemostcommonNewYorkoccupation—retailsalespersons—accountsfor3%ofNewYorkworkersandhasmedianearningsof$22,301annually,leavinganincomeshortfallofnearly$30,000forthisAlbanyCountyfamilyofthree.Thesecondmostcommonoccupation—cashiers—yieldsmedianearningsof$18,231peryear.
Onlyoneoccupation,registerednurses,yieldsearningsthatareabovetheminimumrequiredtomeetbasicneedsinAlbanyCountyforthisthree-personfamily.RegisterednursesinNewYorkhaveamedianincomethatis142%oftheSelf-SufficiencyStandardforthisfamilytypeinAlbanyCounty.Executivesecretariesandadministrativeassistantsearnmedianwagesthatare93%ofthewageneededtobeself-sufficientforthisfamilytypeinAlbanyCounty.
Thus,allbutoneofNewYork’stenmostcommonoccupationshasmedianwagesthatarebelowtheminimumlevelofself-sufficiency.Thegapbetweenwagesandexpensespresentsachallengeforstateandlocalagenciestoseekstrategiesthatwillaidfamiliesstrivingtoreachself-sufficiency.
STRATEGIES TO CLOSE THE GAPTherearetwobasicapproachesforindividualstoclosetheincomegap:reducecostsorraiseincomes.Thefirstapproach,modeledanddiscussedintheprevioussection,reducescoststhroughsubsidiesandsupports,suchaschildsupport,SNAP,andchildcareassistance.Strategiesforthe
Table 5. Wages of New York’s Ten Largest Occupations: 2010
OCCUPATION TITLE
NUMBER OF EMPLOYEES
Annual Median Income*
Percent of Standard
Total Occupations 8,633,580 $38,795 75%
Retail Salespersons 275,340 $22,301 43%
Cashiers 204,900 $18,231 35%
Office Clerks General 180,660 $26,555 51%
Janitors and Cleaners Except Maids and Housekeeping Cleaners
177,670 $26,206 51%
Secretaries Except Legal Medical and Executive
173,360 $31,817 62%
Registered Nurses 168,850 $73,530 142%
Executive Secretaries and Administrative Assistants
144,800 $48,054 93%
Bookkeeping Accounting and Auditing Clerks
133,030 $36,842 71%
Home Health Aides 131,700 $22,321 43%
Customer Service Representatives 131,510 $33,132 64%
SELF-SUFFICIENCY STANDARD FOR ONE ADULT, ONE PRESCHOOLER, AND ONE SCHOOL-AGE CHILD, ALBANY COUNTY
$51,617
*Wages adjusted for inflation using the Employment Cost Index. U.S. Bureau of Labor Statistics, Employment cost index historical listing, Continuous oc-cupational and industry series: September 1975 – December 2009. Available at www.bls.gov/web/ecicois.pdf. Source: U.S. Department of Labor, May 2008 State Occupational Employment and Wage Estimates, New York State, available at http://www.bls.gov/oes/data.htm.
ALL BUT ONE OF THE NEW YORk’S TEN MOST
COMMON OCCUPATIONS HAvE MEDIAN WAGES
THAT ARE BELOW THE MINIMUM LEvEL OF
SELF-SUFFICIENCY.
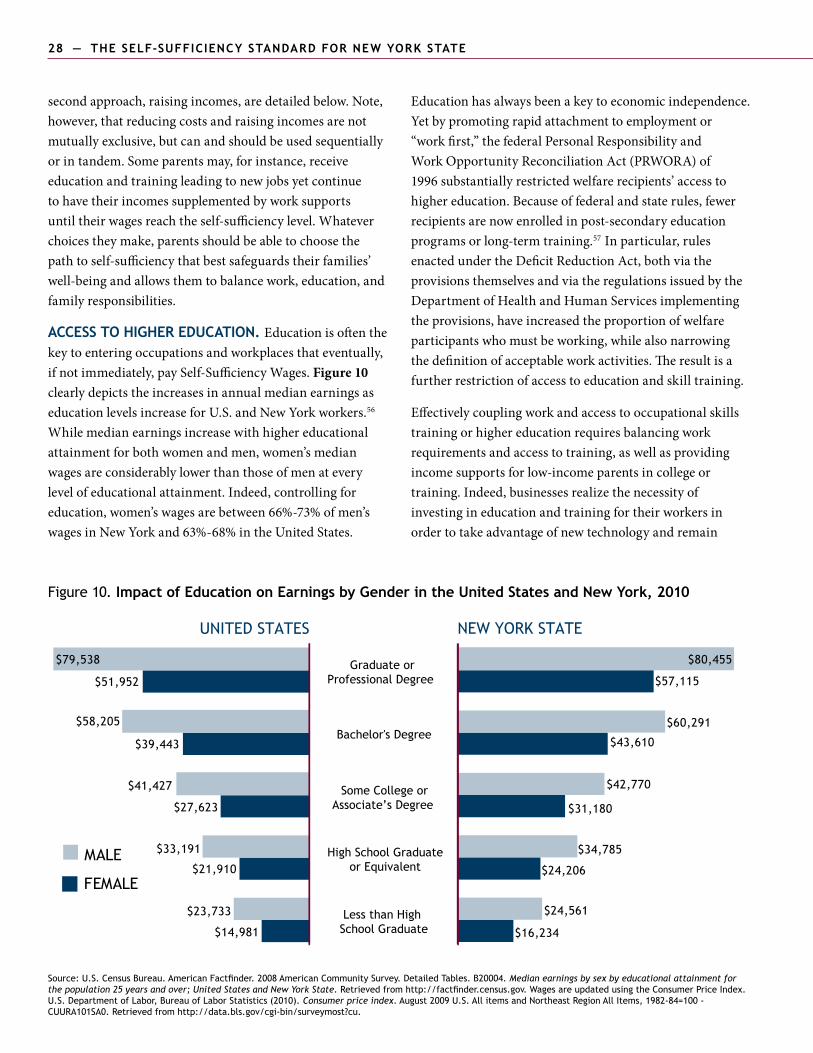
28 — tHE SELF-SUFFICIENCY STANDARD FOR NEW YORK STATE tHE SELF-SUFFICIENCY STANDARD FOR NEW YORK STATE — 29
secondapproach,raisingincomes,aredetailedbelow.Note,however,thatreducingcostsandraisingincomesarenotmutuallyexclusive,butcanandshouldbeusedsequentiallyorintandem.Someparentsmay,forinstance,receiveeducationandtrainingleadingtonewjobsyetcontinuetohavetheirincomessupplementedbyworksupportsuntiltheirwagesreachtheself-sufficiencylevel.Whateverchoicestheymake,parentsshouldbeabletochoosethepathtoself-sufficiencythatbestsafeguardstheirfamilies’well-beingandallowsthemtobalancework,education,andfamilyresponsibilities.
ACCESS TO HIGHER EDUCATION. Educationisoftenthekeytoenteringoccupationsandworkplacesthateventually,ifnotimmediately,paySelf-SufficiencyWages.Figure 10clearlydepictstheincreasesinannualmedianearningsaseducationlevelsincreaseforU.S.andNewYorkworkers.56Whilemedianearningsincreasewithhighereducationalattainmentforbothwomenandmen,women’smedianwagesareconsiderablylowerthanthoseofmenateverylevelofeducationalattainment.Indeed,controllingforeducation,women’swagesarebetween66%-73%ofmen’swagesinNewYorkand63%-68%intheUnitedStates.
Educationhasalwaysbeenakeytoeconomicindependence.Yetbypromotingrapidattachmenttoemploymentor“workfirst,”thefederalPersonalResponsibilityandWorkOpportunityReconciliationAct(PRWORA)of1996substantiallyrestrictedwelfarerecipients’accesstohighereducation.Becauseoffederalandstaterules,fewerrecipientsarenowenrolledinpost-secondaryeducationprogramsorlong-termtraining.57Inparticular,rulesenactedundertheDeficitReductionAct,bothviatheprovisionsthemselvesandviatheregulationsissuedbytheDepartmentofHealthandHumanServicesimplementingtheprovisions,haveincreasedtheproportionofwelfareparticipantswhomustbeworking,whilealsonarrowingthedefinitionofacceptableworkactivities.Theresultisafurtherrestrictionofaccesstoeducationandskilltraining.
Effectivelycouplingworkandaccesstooccupationalskillstrainingorhighereducationrequiresbalancingworkrequirementsandaccesstotraining,aswellasprovidingincomesupportsforlow-incomeparentsincollegeortraining.Indeed,businessesrealizethenecessityofinvestingineducationandtrainingfortheirworkersinordertotakeadvantageofnewtechnologyandremain
Figure 10. Impact of Education on Earnings by Gender in the United States and New York, 2010
Source: U.S. Census Bureau. American Factfinder. 2008 American Community Survey. Detailed Tables. B20004. Median earnings by sex by educational attainment for the population 25 years and over; United States and New York State. Retrieved from http://factfinder.census.gov. Wages are updated using the Consumer Price Index.U.S. Department of Labor, Bureau of Labor Statistics (2010). Consumer price index. August 2009 U.S. All items and Northeast Region All Items, 1982-84=100 - CUURA101SA0. Retrieved from http://data.bls.gov/cgi-bin/surveymost?cu.
UNITED STATES NEW YORK STATE
Graduate orProfessional Degree
Bachelor's Degree
Some College orAssociate’s Degree
High School Graduateor Equivalent
Less than High School Graduate $16,234
$24,206
$31,180
$43,610
$57,115
$24,561
$34,785
$42,770
$60,291
$80,455
$14,981
$21,910
$27,623
$39,443
$51,952
$23,733
$33,191
$41,427
$58,205
$79,538
MALE
FEMALE
28 — tHE SELF-SUFFICIENCY STANDARD FOR NEW YORK STATE tHE SELF-SUFFICIENCY STANDARD FOR NEW YORK STATE — 29
competitiveinaglobalmarketplace.Opportunitiesforlow-incomeworkerstoobtainmoreeducationarethereforevital.
Asbusinessesincreasinglyneedworkerswithhigherskilllevels,ahighschooldiplomaorGEDdoesnothavethevaluethatitoncehadinthejobmarket.58Researchershaveidentifieda“tippingpoint”whereaworker’seducationalattainmentleadstoajobthatpayswagessufficienttosupportafamily.Surprisingly,this“tippingpoint”canbereachedbeforeattainingaBachelor’sdegree.59Manymid-levelskillsjobspayfamilysustainingwagesandareinhighdemandamongemployers.Mid-levelskillsjobsarejobsthatrequiremorethanahighschooldiplomabutlessthanabachelor’sdegree.Workerscangainasubstantialincreaseinearningsbygettingatleastoneyearofcollegeandacredential.60Thirtyunits(aboutoneyearoffull-timeenrollment)havebeenshowntoincreasewagesandearningssubstantially,upto11.3%formenand11.8%forwomen.61
TARGETED TRAINING FOR HIGHER-WAGE JOBS AND SECTORAL EMPLOYMENT INTERVENTION. Asdiscussedearlierinthissection,nineofthetenmostcommonoccupationsinNewYorkhavemedianwagesbelowtheSelf-SufficiencyWageforAlbanyCountyfamilieswithoneadult,onepreschooler,andoneschool-agechild.ThatleavesjustoneofthemostcommonoccupationsinNewYorkasapotentialsectorthatpayswageshighenoughtomeetbasicneedsforacommonfamilytype.Targetedtraininginthosesectorsthatrequirelesspost-secondaryeducationbutpayhigherwagescanincreaseaccesstothesepositionsandhelplow-wageworkersmoveintocareerswithSelf-SufficiencyWages.Targetingtrainingtowardshigher-wagejobshelpscommunitiesstrengthentheirlocaleconomiesbyrespondingtobusinesses’specificlaborneedsandimprovingaregion’sabilitytoattractandkeepindustries.
SectoralEmploymentInterventionisonestrategyfortargetingtrainingtowardshigher-wagejobs.ThisapproachtojobtrainingdeterminesthewageneededbyaworkertosustainherorhisfamilyusingtheSelf-SufficiencyStandard,identifieswell-payingjobsinsectorsthatlacktrainedworkers,andanalyzesthejobtrainingandsupportservicesinfrastructurenecessarytomoveindividualsintothesejobs.KeycomponentstoSectoralEmploymentIntervention
includeengagingindustryrepresentativesandworkforcedevelopmentboards,analyzingregionallabormarkets,targetingtrainingforspecificjobs,anddevelopingrealisticoutcomestandards.62
ExPANDED AND ENHANCED ADULT BASIC EDUCATION AND STUDENT SUPPORT SERVICES. Sinceadultswithinadequateeducation,languagedifficulties,orinsufficientjobskillsandexperienceusuallycannotachieveSelf-SufficiencyWages,adulteducationisanimportantfirststepinacontinuumthatpreparesadultsforself-sufficiency.
Expansionandimprovementoftrainingprogramsaimedatthesenecessaryworkskillscouldassistadultsstrugglingtoentertheworkforce.OnecomponentofanenhancedadulteducationprogramisFunctionalContextEducation(FCE).FCEisaninstructionalstrategythatteachesliteracyandjobskillswithinthecontextofthelearners’educationalandemploymentgoals.63ProgramsthatusetheFCEmodelaremoreeffectivethantraditionalprogramsthatteachbasicskillsandjobskillsseparately,becausethisinnovativeapproachteachesliteracyandbasicskillsinthecontextinwhichthelearnerwillusethem.
Statescanencouragestudentsuccessbyprovidingsupportservicesthathelpthembalancetheirwork,family,andfinancialresponsibilitieswiththeireducationalgoals.Providingwrap-aroundserviceslikecareercounselinginadditiontotraditionalsupportssuchaschildcareandtransportationcanincreasestudents’persistenceandeducationcompletion.
Duetowelfaretimelimitsandrestrictionsoneducationandtrainingdiscussedabove,itisnowmoreimportantthaneverforindividualstomasterbasicandjob-specificskillsasquicklyandefficientlyaspossible.Short-term,high-qualityadulteducationtrainingscanassistinaccomplishingthisgoal.Expandedandenhancedadulteducationprogramsnotonlybenefitworkersbuttheyalsobenefitemployers.Expandingincumbentworkertrainingscanresultinincreasedproductivityandincreasedefficiencybenefitingtheemployeraswellastheemployee.
NONTRADITIONAL EMPLOYMENT FOR WOMEN. Entering“nontraditional”occupations(NTOs)isanunder-utilizedbuteffectivestrategybywhichwomencanaccesshigher-wagejobs.AccordingtotheU.S.Departmentof
30 — tHE SELF-SUFFICIENCY STANDARD FOR NEW YORK STATE tHE SELF-SUFFICIENCY STANDARD FOR NEW YORK STATE — 31
Labor,NTOsincludeanyoccupationinwhichlessthan25%oftheworkforceisfemale.Manynontraditionaljobs,suchasconstructionworker,bankingofficer,computerrepairer,policeofficer,ortruckdriver,requirerelativelylittlepost-secondarytraining,yetcanprovidewagesatself-sufficiencylevels.
Increasingwomen’saccesstonontraditionaljobsisacompellingstrategyforfamilyeconomicself-sufficiencyforseveralreasons.Inadditiontothehigherwages,NTOsfrequentlyhavegreatercareerandtrainingopportunities,whichcanleadtogreaterjobsatisfactionandresultinlonger-termemployment.Moreover,hiringwomeninnontraditionaljobsisgoodforbusinessbecauseitopensupanewpoolofskilledworkerstoemployersandcreatesamorediverseworkforcethatisreflectiveofthecommunity.
Recognizingthesignificantbenefitsofnontraditionalemploymentforlow-incomewomenandtheirfamilies,manycommunity-basedwomen’sorganizationsbeganofferingnontraditionaltraining25yearsago.Theireffortswereassistedbyaffirmativeactionguidelinesforemployersandapprenticeshipprogramsthatopenedtheconstructiontrades,inparticular,towomen.The1992WomeninApprenticeshipandNontraditionalOccupations(WANTO)ActprovidedfundsthroughtheU.S.DepartmentofLaborWomen’sBureauandtheBureauofApprenticeshipandTrainingforsuchprograms,providinggrantsforrecruitment,trainingandretentionofwomeninnontraditionaloccupations,aswellaspreventingsexualharassmentintheworkplace.64NontraditionalEmploymentforWomen(NEW)inNewYorkCityisonesuchprogram,offeringpre-apprenticeshiptrainingintheconstruction,utilitiesandtransportationsectorssince1978.GraduatesoftheNEWprogramgaineducationandskillsleadingtoeconomicself-sufficiency,withjobspayingasmuchas$45anhour.65
Whilemostcommunity-basednontraditionalemploymentprogramsweresuccessful,fewofthestrategiesusedtotrainandplacewomeninthenontraditionaljobshavebeeninstitutionalizedintomainstreamjobtrainingandvocationaleducationsystems.ForNTOstobecomeasuccessfulstrategyformovingfamiliesoutofpoverty,itiscriticaltoaddresstherangeofeconomic,political,andsocialbarriersthatpreventworkforcedevelopmentand
welfaresystemsfrominstitutionalizingnontraditionalemploymentforwomen.
MICROENTERPRISE TRAINING AND DEVELOPMENT. Microenterprisedevelopmentisanincome-generatingstrategythathelpslow-incomepeoplestartorexpandverysmallbusinesses.Generally,thebusinessisownedandoperatedbyonepersonorfamily,hasfewerthanfiveemployeesandcanstartupwithaloanoflessthan$25,000.Microenterpriseisanattractiveoptionforlow-incomeindividualswhomayhaveskillsinaparticularcraftorservice.
Low-incomewomenentrepreneurs,especiallythoselivinginruralorinner-citycommunitiesisolatedfromtheeconomicmainstream,oftenlackthecontactsandnetworksneededforbusinesssuccess.Peernetworks(suchaslendingcirclesandprogramalumnigroups)canhelpwomen“learntoearn”fromeachother,buildself-esteem,andorganizearoundpolicyadvocacy.Linkagesbetweenothermicroentrepreneursandestablishedwomenbusinessownerscanprovideprogramparticipantswithrolemodels,facilitateanongoingtransferofskills,andexpandnetworks.
Microenterpriseisalsoalocaleconomicdevelopmentstrategy,sincemicrobusinesseshavethepotentialtogrowintosmallbusinessesthatrespondtolocaldemand,createjobs,andaddtothelocaltaxbase.66
INDIVIDUAL DEVELOPMENT ACCOUNTS OR FAMILY SAVINGS ACCOUNTS. Formanylow-incomefamilies,thebarrierstoself-sufficiencyareaccentuatedbyanearortotalabsenceofsavings.Accordingtoareportonwealth-poorhouseholdsintheUnitedStates,theaveragefamilywithahouseholdincomebetween$10,000and$25,000hadnetfinancialassetsof$1,000,whiletheaveragefamilywithahouseholdincomeoflessthan$10,000hadnetfinancialassetsof$10.67Forthesefamilieswithnosavings,theslightestsetback—acarinneedofrepair,anunexpectedhospitalbill,areductioninworkhours—cantriggeramajorfinancialcrisis.Thesefamiliescanbeforcedtotakeoutsmallloansatexorbitantinterestrates(e.g.,“paydayloans”)justtomakeittothenextpaycheck,oftenresultinginspiralingdebt.
30 — tHE SELF-SUFFICIENCY STANDARD FOR NEW YORK STATE tHE SELF-SUFFICIENCY STANDARD FOR NEW YORK STATE — 31
Inaddition,publicpoliciesoftenworkagainstthepromotionofsavingsbyactivelypenalizingfamiliesthatmanagetoputsomemoneyaside.InNewYork,theTANFassetlimitissetat$2,000perfamily,meaningthatfamilieswhohavesavedmorethan$2,000butstilldonothaveenoughtomakeendsmeetmustspendtheirsavingsbeforetheyqualifyforassistance.68
Recentpolicychangeshavealsobeguntopromoteandencourageassetdevelopmentforlow-incomeworkers.OnemajordevelopmenthasbeentheIndividualDevelopmentAccount(IDA)orFamilySavingsAccount(FSA)program.IDAsorFSAsaremanagedbycommunity-basedorganizationsandareheldatlocalfinancialinstitutions.Inthisprogram,apublicorprivateentityprovidesamatchingcontributiontowardsregularsavingsmadebyafamily.Thesavingscanbewithdrawniftheyareusedforaspecifiedobjective,suchasthedownpaymentforahouse,paymentforhighereducation,orstart-upcostsforasmallbusiness.
ResearchfromtheAmericanDreamDemonstration(ADD),a14-siteIDA(orFSA)program,indicatesstrongsavinghabitsamonglow-incomefamiliessupportedthroughIDAprograms.Financialliteracysupportandincentivesofmatchedsavingshaveledparticipantstosave50%ofmonthlysavingstargets,onaverage.69Whilelesscommonthanincomesupports,these“wealthsupports”canbeanimportanttoolinhelpingfamiliesmovetowardsself-sufficiency.
MAKING WORK PAY THROUGH TAx REFORM. Workiscentraltoafamily’sabilitytogetahead;however,asthisreportillustrates,workitselfisnotalwaysenough.ForworkerswithincomesbelowtheSelf-SufficiencyStandard,publicpolicycanhelpby“makingworkpay.”Specifically,taxcreditscouldbeexpandedsothattheyareprovidedto
allworkingfamiliesbelowtheSelf-SufficiencyStandard.TheFederalEarnedIncomeTaxCredit(EITC),theChildandDependentCareTaxCredit(CCTC),andtheChildTaxCreditallbenefitworkingfamilieswithlowwages,butcanbegintophaseoutforsomefamilieswhoarebelowtheStandard.Asincomesincrease,thesebenefitsdecrease,wellbeforefamiliesreachtheSelf-SufficiencyStandard.NewYorkStateandCityalsohaveanEITCandCCTC,andthestatehasaCTC.
GENDER- AND RACE-BASED WAGE REFORM. Itisimportanttorecognizethatnotallbarrierstoself-sufficiencylieintheindividualpersonsand/orfamiliesseekingself-sufficiency.Womenandpeopleofcoloralltoooftenfaceartificialbarrierstoemployment—barriersnotaddressedbytaxcreditsortrainingandeducationstrategies.Discriminationonthebasisofgenderand/orraceisakeyissue.SeeFigure10forevidenceofthisinthediscussionofeducationandearningsbygender.
Atthesametime,thisdoesnotnecessarilymeanthatindividualsorinstitutionsareengagingindeliberateracismandsexism.Addressingthemoresubtle,yetsubstantial,barriersrequiresallstakeholders—employers,unions,advocates,trainingprovidersandeducators,welfareofficials,andprogramparticipants—toaddressthevariousdifficulties,myths,andmisunderstandingsthatariseasmoreandmorepeopleseektoenteraworkforceenvironmentthatisnotalwayswelcoming.Payequitylawsrequireemployerstoassessandcompensatejobsbasedonskills,effort,responsibility,andworkingconditions,andnotbasedonthegenderorrace/ethnicitiesofthejob’soccupants.Theselawsraisethewagesofwomenandpeopleofcolorwhoaresubjecttoraceandgender-baseddiscrimination.70
32 — tHE SELF-SUFFICIENCY STANDARD FOR NEW YORK STATE tHE SELF-SUFFICIENCY STANDARD FOR NEW YORK STATE — 33
How the Self-Sufficiency Standard Has Been UsedWhiletheSelf-SufficiencyStandardisanalternativemeasureofincomeadequacythatisaccurate,up-to-date,andgeographicallyspecific,itisalsomorethananimprovedmeasure.TheStandardisatoolthatcanbeusedacrossawidearrayofsettingstobenchmark,evaluate,educate,andilluminate.Belowwebrieflydescribesomeoftheseuses,andprovideoneexample.AppendixBprovidesmoredetail—withreferencesandwebsiteaddresses—sothatreaderscanexploretheseusesaswellascontacttheparticularprogramsandpersonswhohaveappliedtheSelf-SufficiencyStandardintheirwork.
ASSESSMENT OF PUBLIC POLICY OPTIONSThe Self-Sufficiency Standard has been used as a tool to evaluate the impact of current and proposed policy changes.Asinthemodelingtablesinthisreport,theStandardcanbeusedtoevaluatetheimpactofavarietyofworksupports(theFoodStampProgram/SNAP,Medicaid)orpolicyoptions(childcareco-payments,taxreformortaxcredits)onfamilybudgets.Itcanalsobeusedtomodelchangesintheseprograms.Workiscentraltoafamily’sabilitytogetaheadbut,asthisreportillustrates,itisnotalwaysenough.ForworkerswithincomesbelowtheSelf-SufficiencyStandard,publicpolicycanhelpby“makingworkpay.”
Example: • InMaryland,AdvocatesforChildrenandYouthusedtheSelf-SufficiencyStandardintheirMaryland Can Do Better for Childrencampaign,athree-yearplantoaddresscriticalneedsofchildrenandtheirfamiliesby2010.Duringthe2007specialsessionoftheMarylandGeneralAssembly,thecampaignutilizedtheStandardforeachofMaryland’s24jurisdictionstosuccessfullyadvocateforexpandedRefundableEarnedIncomeTaxCreditsforlow-incomefamilies.
EVALUATION OF ECONOMIC DEVELOPMENT PROPOSALSThe Self-Sufficiency Standard has been used to evaluate state and local level economic development proposals.
UsingtheStandardcanhelpdetermineifbusinessesseekingtaxbreaksorothergovernmentsubsidieswill,orwillnot,createjobsthatpayadequatewages.IfthenewjobscreatepaywagesthatarebelowtheStandardsothattheemployeeswillneedpublicworksupportstobeabletomeettheirbasicneeds,thenewbusinessisessentiallyseekinga“doublesubsidy.”Inthisway,economicdevelopmentproposalscanbeevaluatedfortheirnetpositiveornegativeeffectonthelocaleconomy,aswellasonthewell-beingofthepotentialworkersandtheirfamilies.
Example: • TheDelawareEconomicDevelopmentOfficehasappliedtheDelawareSelf-SufficiencyStandardtostrategicallyfundgrantapplicationsinordertofocustheirresourcesonqualityemploymentgrowth.
CREATING GUIDELINES FOR WAGE-SETTINGThe Self-Sufficiency Standard has been used as a guideline for wage-setting.Bydeterminingthewagesnecessarytomeetbasicneeds,theStandardprovidesinformationforsettingwagestandards.
Example: • VanderbiltUniversityinTennesseeusestheSelf-SufficiencyStandardtoeducateemployeesandadministratorsabouttheneedtoincreasethetake-homepayofservicestaff.
TARGETING OF JOB TRAINING RESOURCES The Self-Sufficiency Standard has been used to target job training resources. Usingatargetedjobsstrategy,theStandardhelpstomatchjobseekerswithemploymentthatpaysSelf-SufficiencyWages.SectoralEmploymentInterventionisonestrategyfortargetingtrainingtowardshigher-wagejobs.ThisapproachtojobtrainingdeterminesthewageneededbyaworkertosustainherorhisfamilyusingtheSelf-SufficiencyStandard,identifieswell-payingjobsinsectorsthatlacktrainedworkers,andanalyzesthejobtrainingandsupportservicesinfrastructurenecessarytomoveindividualsintothesejobs.KeycomponentstoSectoralEmploymentInterventionincludeengagingindustryrepresentativesandworkforcedevelopmentboards,analyzingregionallabormarkets,targetingtrainingforspecificjobs,anddevelopingrealisticoutcomestandards.Throughthisanalysisitispossibletodetermine
For more examples of how the Standard has been used
please see Appendix B of this publication.
32 — tHE SELF-SUFFICIENCY STANDARD FOR NEW YORK STATE tHE SELF-SUFFICIENCY STANDARD FOR NEW YORK STATE — 33
thejobsandsectorsonwhichtotargettrainingandeducationresources.
Example: • TheSacramentoEmploymentandTrainingAgency(SETA)usestheSelf-SufficiencyStandardtodetermineself-sufficientwagesinSacramentoCounty.WiththisinformationSETAisabletoidentifygrowthindustriespayingSelf-SufficiencyWagesandtodirectclientsandpublicresourcestowardsthoseindustries.
EVALUATION OF EMPLOYMENT PROGRAM OUTCOMESThe Self-Sufficiency Standard can be used to evaluate outcomes for clients in a range of employment programs, fromshort-termjobsearchandplacementprograms,toprogramsprovidingextensiveeducationorjobtraining.ByevaluatingwageoutcomesintermsoftheStandard,programsareusingameasureoftrueeffectivenessinreachingthegoalofeconomicself-sufficiency.Suchevaluationscanhelpredirectresourcestoapproachesthatresultinimprovedoutcomesforparticipants.
Example: • TheColoradoCenteronLawandPolicysuccessfullylobbiedtheEasternRegionWorkforceBoardinFortMorgan,ColoradotoofficiallyadopttheSelf-SufficiencyStandardtodetermineeligibilityforintensivetrainingservices.
TARGETING EDUCATION RESOURCES The Self-Sufficiency Standard helps demonstrate the “pay off” for investing in various education resources suchaspost-secondaryeducationandtraining,includingtrainingforoccupationsthatarenontraditionalforwomenandpeopleofcolor.
Example: • TheMissouriWomen’sCounciloftheDepartmentofEconomicDevelopmentusedtheStandardtobeginaprogramtopromotenontraditionalcareerdevelopmentamonglow-incomewomen.TheprogramencourageswomenandgirlstoexplorenontraditionalcareeroptionsthatwillpaySelf-SufficiencyWages.
DETERMINATION OF NEED FOR SERVICES The Self-Sufficiency Standard has been used to determine which individuals are eligible and/or most in need of specific support or training services.
Example: • InVirginia,VoicesforVirginia’sChildrensuccessfullyadvocatedforthestate’sTANFAuthorizationCommitteetousetheVirginiaSelf-SufficiencyStandardasatoolforsettingeligibilityguidelines.
COUNSELING TOOL FOR PARTICIPANTS IN WORK & TRAINING PROGRAMSThe Self-Sufficiency Standard has been used as a counseling tool to help participants in work and training programs access benefits and develop strategies to become self-sufficient.Computer-basedcounselingtoolsallowuserstoevaluatepossiblewages,thencompareinformationonavailableprogramsandworksupportstotheirowncostsandneeds.Computer-basedSelf-SufficiencyCalculators,forusebycounselorswithclientsandthepublic,havebeendevelopedfortheBayAreainCalifornia,Colorado,theDistrictofColumbia,Illinois,NewYorkCity,Oregon,Pennsylvania,andWashingtonState.Thesetoolsintegrateawidevarietyofdatanotusuallybroughttogether,allowingclientstoaccessinformationaboutthebenefitsofvariousprogramsandworksupportsthatcanmovethemtowardsself-sufficiency.Throughonlinecalculators,clientsareempoweredwithinformationandtoolsthatallowthemtodevelopandtestouttheirownstrategiesforachievingself-sufficientincomes.
Example: • InWashingtonState,astatewideSelf-SufficiencyCalculatorisusedacrossworkforcecouncilsasacounselingtoolandcanbeviewedathttp://www.thecalculator.org.
PUBLIC EDUCATIONThe Self-Sufficiency Standard has been used as a public education tool.Asaneducationtool,theStandardhelpsthepublicatlargeunderstandwhatisinvolvedinmakingthetransitiontoself-sufficiency;showsemployerstheimportanceofprovidingbenefits,especiallyhealthcare;and,demonstratestoserviceprovidershowvarioussocialservicecomponentsfittogether,facilitatingthecoordinationofarangeofservicesandsupports.Forpolicymakersandlegislators,theStandardshowsboththeneedforandimpactofworksupportprogramsonlow-wageworkers’familybudgets.
Example: • VoicesforUtahChildrendistributedcopiesoftheUtahSelf-SufficiencyStandardtostatelegislatorsand
34 — tHE SELF-SUFFICIENCY STANDARD FOR NEW YORK STATE
candidatesduringthe2003legislativesessiontoframeadiscussionaboutincreasingfundingforUtah’sChildren’sHealthInsuranceProgram.
SUPPORTING RESEARCHBecause the Self-Sufficiency Standard provides an accurate and specific measure of income adequacy, it is frequently used in research.TheStandardprovidesameansofestimatinghowincomeadequacydiffersfromplacetoplaceandamongdifferentfamilytypes.TheStandardalsoprovidesameanstomeasuretheadequacyofvariousworksupports,suchaschildsupportorchildcareassistance,givenafamily’sincome,placeofresidence,andcomposition.
Inseveralstates,theSelf-SufficiencyStandardhasbeen• usedalongwithdatafromtheU.S.CensusBureautomeasurethenumberoffamiliesaboveandbelowtheSelf-SufficiencyStandard,aswellastheircharacteristics(e.g.,race,ethnicity,familytype,education,employment).Findingsfromthesestudiescanbefoundinthe
followingreportsandareavailableonlineathttp://www.selfsufficiencystandard.org/pubs.html#addpubs:
California:• Overlooked and Undercounted 2009: Struggling to Make Ends Meet in California
Colorado:• Overlooked and Undercounted: Struggling to Make Ends Meet in Colorado
Connecticut:• Overlooked and Undercounted: Where Connecticut Stands
Mississippi:• Overlooked and Undercounted: Struggling to Make Ends Meet in Mississippi
NewJersey:• Not Enough to Live on: Characteristics of Households Below the Real Cost of Living in New Jersey, 2008
Pennsylvania:• Overlooked and Undercounted: Struggling to Make Ends Meet in Pennsylvania
WashingtonState:• Overlooked and Undercounted: Wages, Work and Poverty in Washington State
ConclusionNewYorkisfacinganimportantopportunitytomakeitpossibleforlow-incomehouseholdstobecomeeconomicallyself-sufficient.Therisingcostsofhousing,childcare,andhealthcare;thelackofeducationandskills;welfaretimelimits;andrestrictionsontrainingandeducationalladdtotheproblemsfacedbymanyparentsseekingself-sufficiency.Inaddition,therearethousandsoffamiliesinNewYorkwhoaretrappedinlow-wagejobsandstrugglingtomakeendsmeet.
TheSelf-SufficiencyStandarddocumentstheincomerequiredforfamiliestoliveindependently,withoutpublicorprivateassistance.TheSelf-SufficiencyStandardshowsthat,formostparents,earningsthatarewellabovetheofficialFederalPovertyLevelareneverthelessfarbelowwhatisneededtomeettheirfamilies’basicneeds.
TheSelf-SufficiencyStandardiscurrentlybeingusedtobetterunderstandissuesofincomeadequacy,toanalyzepolicy,andtohelpindividualsstrivingforself-sufficiency.Communityorganizations,academicresearchers,policyinstitutes,legaladvocates,trainingproviders,communityactionagencies,andstateandlocalofficials,amongothers,areusingtheSelf-SufficiencyStandard.
In addition to New York, the Standard has been calculated for Alabama, Arizona, California, Colorado,
Connecticut, Delaware, Florida, Georgia, Hawaii, Illinois, Indiana, Iowa, kentucky, Louisiana, Maryland,
Massachusetts, Mississippi, Missouri, Montana, Nebraska, Nevada, New Jersey, North Carolina, Ohio,
Oklahoma, Oregon, Pennsylvania, South Dakota, Tennessee, Texas, Utah, virginia, Washington State,
West virginia, Wisconsin, Wyoming, and the Washington, D.C. metropolitan area.
For further information about the Standard, how it is calculated or used, or the findings reported here,
as well as information about other states or localities, contact Dr. Diana Pearce at [email protected] or
(206) 616-2850, or the Center for Women’s Welfare staff at (206) 685-5264, or visit
http://www.selfsufficiencystandard.org.
To view The Self-Sufficiency Standard for New York State 2010, or the Standard wage tables for any
of New York’s counties, visit http://www.nyscommunityaction.org or http://www.fiscalpolicy.org. To
order a printed version this publication or to find out more about the New York State Community Action
Association, contact Denise Harlow at (518) 690-0491 or [email protected], or visit
http://www.nyscommunityaction.org.
36 — tHE SELF-SUFFICIENCY STANDARD FOR NEW YORK STATE tHE SELF-SUFFICIENCY STANDARD FOR NEW YORK STATE — 37
Endnotes 1.Bernstein,J.(2008).Crunch: Why do I feel so squeezed (and other unsolved economic mysteries).SanFrancisco,CA:Berrett-KoehlerPublishers,Inc.
2.Women’sFoundationofGeneseeValley.(2004).Improving economic self-sufficiency: Current status, future goals, and intervention strategies project.RetrievedMay23,2005,fromhttp://www.womensfoundation.org/pdfs/Womens_Foundation_Research.pdf.
3.Therearetwofederalmeasurementsofpoverty.AdetailedmatrixofpovertythresholdsiscalculatedeachyearbytheU.S.CensusBureau.Thethresholdisusedtocalculatethenumberofpeopleinpovertyforthepreviousyear.Theotherformofthepovertymeasureiscalledthe“federalpovertyguidelines”orthe“FederalPovertyLevel”(FPG/FPL).TheFPLiscalculatedbytheU.S.DepartmentofHealthandHumanServiceseachFebruaryandisprimarilyusedbyfederalandstateprogramstodetermineeligibilityand/orcalculatebenefits,suchasforSNAP(formerlytheFoodStampProgram).TheFPLonlyvariesbyfamilysize,regardlessofcomposition;the2009FPLforafamilyofthreeis$18,310andwasstilleffectiveatthetimethisreportwascompleted.TheStandardreferencestheFPLinthisreport.Formoreinformationaboutthefederalpovertymeasurements,seehttp://aspe.hhs.gov/poverty/faq.shtml#thriftyandhttp://aspe.hhs.gov/poverty/09poverty.shtml.
4.DeNavas-Walt,C.,Proctor,B.&Hill-Lee,C.(2004).U.S.CensusBureau,CurrentPopulationReports,SeriesP60-229.Income, poverty, and health insurance coverage in the United States: 2004.Washington,D.C.:U.S.GovernmentPrintingOffice.RetrievedSeptember14,2005,fromhttp://www.census.gov/prod/2005pubs/p60-229.pdf.
5.NewYorkStateDepartmentofHealth.(2009).Child health plus. Who is eligible?RetrievedSeptember16,2009,fromhttp://www.nyhealth.gov/nysdoh/chplus/who_is_eligible.htm.USDAFoodandNutritionServices.SupplementalNutritionAssistanceProgram.Fact sheet on resources, income, and benefits.RetrievedOctober21,2009,fromhttp://www.fns.usda.gov/FSP/applicant_recipients/fs_Res_Ben_Elig.htm.NewYorkStateOfficeofTemporaryandDisabilityAssistance.(2010).Food stamp eligibility and transitional food stamp benefits.RetrievedApril30,2010,fromhttp://www.otda.state.ny.us/main/foodstamps/#eligibility.
6.Fremstad,S.(2008).Measuring poverty and economic inclusion: The current poverty measure, the NAS alternative, and the case for a truly new approach.RetrievedMarch24,2009,fromhttp://www.cepr.net/documents/publications/2008-12-Measuring-Poverty-and-Economic-Inclusion.pdf.
7.U.S.DepartmentofHealthandHumanServices.Frequently asked questions related to the poverty guidelines and poverty.RetrievedMarch25,2008,fromhttp://aspe.hhs.gov/poverty/faq.shtml.
8.In2008consumerexpenditureonfoodwas$6,133peryearor12.8%oftotalexpenditures.U.S.DepartmentofLabor,BureauofLaborStatistics.(2009).Consumer expenditures in 2008.RetrievedOctober21,2009,fromhttp://www.bls.gov/news.release/cesan.nr0.htm.
9.U.S.DepartmentofLabor,BureauofLaborStatistics.(2009).Employment characteristics of families in 2008.RetrievedJune4,2009,fromhttp://www.bls.gov/news.release/pdf/famee.pdf.
10.Usingthe2010FairMarketRents,thecostofhousing(includingutilities)atthe40thpercentile,foratwo-bedroomunitinthemostexpensiveplace—FairfieldCounty,Connecticut—is$1,800.Thisisoverthreeandahalftimesasmuchastheleastexpensivehousing,foundinseveralcountiesinKentucky,wheretwo-bedroomunitscost$507permonth.U.S.HousingandUrbanDevelopmentDepartment.(2010).Fair market rents.RetrievedOctober21,2009,fromhttp://www.huduser.org/datasets/fmr.html.
11.OneofthefirstpersonstoadvocateimplementingchangesovertimeintotheFederalPovertyLevelwasPatriciaRuggles.Ruggles,P.(1990).Drawing the line: Alternative poverty measures and their implications for public policy.Lanham,MD:UniversityPressofAmerica.
12.Althoughabout76%ofemployedwomenwithchildrenunder18yearsofageworkedfull-timein2008,workingpart-timeisclearlythedesirableoptionundermanycircumstancessuchaswhenthechildrenareveryyoungorinneedofspecialcare,orwhenaffordable/appropriatechildcareisnotavailable.Formanylow-incomemothersitisequallyclearthateconomicnecessity,aswellastheTANFrequirementsthatlimitbenefitsandstipulatethatrecipientsparticipateinjobsearches,precludethisoption.U.S.DepartmentofLabor,BureauofLaborStatistics.(2009).Employment characteristics of families in 2008.RetrievedJune4,2009,fromhttp://www.bls.gov/news.release/pdf/famee.pdf.
13.Gowdy,E.A.&Pearlmutter,S.R.(1994).Economicself-sufficiencyisaroadI’mon:Theresultsoffocusgroupresearchwithlow-incomewomen.InL.V.Davis(Ed.),Building on women’s strengths: A social work agenda for the twenty-first century(p.91).NewYork:TheHaworthPress.
14.TheNewYorkStateminimumwageisequaltothefederalminimumwageandis$7.25perhourasofJuly24,2009.NewYorkStateDepartmentofLabor.(2010).Minimum wages.RetrievedJanuary21,2010,fromhttp://www.labor.state.ny.us/workerprotection/laborstandards/workprot/minwage.shtm#MIN_WAGE_LAWS.
15.In2008theaverageconsumerexpenditureonfoodwas$6,133peryearor12.8%oftotalexpenditures.U.S.DepartmentofLabor,BureauofLaborStatistics.(2008).Consumer expenditures in 2008.RetrievedMarch10,2010,fromhttp://www.bls.gov/news.release/cesan.nr0.htm.
16.U.S.DepartmentofHealthandHumanServices,AgencyforHealthcareResearchandQuality.(2008).Medical expenditure panel survey (2006).TablesII.C.3andII.D.3.RetrievedonJanuary19,2010,fromhttp://www.meps.ahrq.gov/mepsweb/data_stats/quick_tables_results.jsp?component=2&subcomponent=2&year=2006&tableSeries=2&tableSubSeries=CDE&searchText=&searchMethod=1&Action=Search.
17.TheHUDmedianincomelimitforathree-personfamilyinOnondagaCountyis$57,330annually.U.S.DepartmentofHousingandUrbanDevelopment.(2009).FY2009IncomeLimitsDocumentationSystem.FY 2009 income limits summary,
36 — tHE SELF-SUFFICIENCY STANDARD FOR NEW YORK STATE tHE SELF-SUFFICIENCY STANDARD FOR NEW YORK STATE — 37
Onondaga County.RetrievedMay4,2010,fromhttp://www.huduser.org.
18.Familieswithincomesbetween$45,850and$28,650forafamilyofthreeinOnondagaCountyareconsidered“LowIncome.”Familieswithincomesbetween$28,650and$17,200areconsidered“VeryLowIncome”andfamilieswithincomeslessthan$17,200asconsidered“ExtremelyLowIncome.”Althoughtheseincomelimitsarebasedon80%,50%,and30%ofthemedianincome,thefinalincomelimitbenchmarksarecalculatedaftervariousadjustmentsareaccountedfor,suchashighorlowhousingcostadjustments.Thereforethefinalincomelimitsarenotnecessarilyanexactpercentoftheoriginalmedianincome.Mosthousingassistanceislimitedtothe“VeryLowIncome”category,andinsomeinstancestothe“ExtremelyLowIncome”category.U.S.DepartmentofHousingandUrbanDevelopment.(2009).FY2009IncomeLimitsDocumentationSystem.FY 2009 income limits summary, Onondaga County, New York.RetrievedFebruary23,2010,fromhttp://www.huduser.org.
19.Whilecostsarelikelytoincreaseatvaryingratesindifferentplaces,forconsistencytheU.S.BureauofLaborStatistics’RegionalConsumerPriceIndex(CPI)isusedtoestimateinflationwhenupdatingotherStandardsforthisanalysis.U.S.DepartmentofLabor,BureauofLaborStatistics.(2009).Consumer price index.August2009NewYorkAllItems,1982-84=100-CUURA101SA0;Washington-BaltimoreAllItems;NortheastRegionAllItems;MidwestRegionAllItems;SouthRegionAllItems;andWestRegionAllItems.RetrievedFebruary22,2010,fromhttp://data.bls.gov/cgi-bin/surveymost?cu.
20.U.S.DepartmentofLabor,BureauofLaborStatistics.(2010).Consumer price index.January2010NortheastRegionAllItems,1982-84=100-CUURA101SA0.RetrievedFebruary22,2010,fromhttp://data.bls.gov/cgi-bin/surveymost?cu.
21.Someworkersmaybeunawareoftheadvancepaymentoption,andothersmayhaveemployerswhodonotparticipate.Also,researchhasshownthatfamiliesmakefinancialdecisionsbasedonreceiptoftheEITC(togetherwithtaxrefunds)whentheyfiletheirtaxesearlyinthefollowingyear.Romich,J.L.&Weisner,T.(2000).How families view and use the EITC: The case for lump-sum delivery.NationalTaxJournal,53(4part2),1245-1265.
22.Ibid.
23.U.S.DepartmentofHealthandHumanServices.AdministrationforChildren&Families.OfficeofChildSupportEnforcement.2005 annual statistical report.(Tables4,14,15and61).RetrievedOctober20,2008,fromhttp://www.acf.hhs.gov/programs/cse/pubs/2008/annual_report.DatahasbeeninflatedusingtheBureauofLaborStatistics,ConsumerPriceIndex.U.S.DepartmentofLabor,BureauofLaborStatistics.(2009).Consumer price index.August2009NortheastRegionAllItems,1982-84=100-CUURA101SA0.RetrievedOctober9,2010,fromhttp://data.bls.gov/cgi-bin/surveymost?cu.
24.UlsterCountyDepartmentofSocialServices.(2010).PersonalCommunication:MariaRuffner,ProgramSupervisor,May3,2010.
25.Broaddus,M.,Blaney,S.,Dude,A.,Guyer,J.,Ku,L.,andPeterson,J.(2002).Expanding family coverage: States’ Medicaid eligibility policies for working families in the year 2000 (Table4).Washington,D.C.RetrievedDecember24,2008,fromhttp://www.cbpp.org/1-2-02health.htm.
26.USDAFoodandNutritionServices.HowtoApply:WICincomeeligibilityguidelines2009-2010.RetrievedOctober21,2009,fromhttp://www.fns.usda.gov/wic/howtoapply/incomeguidelines09-10.htm.SupplementalNutritionAssistanceProgram.Fact sheet on resources, income, and benefits.RetrievedOctober21,2009,fromhttp://www.fns.usda.gov/FSP/applicant_recipients/fs_Res_Ben_Elig.htm.NewYorkStateOfficeofTemporaryandDisabilityAssistance.(2010).Food stamp eligibility and transitional food stamp benefits.RetrievedApril30,2010,fromhttp://www.otda.state.ny.us/main/foodstamps/#eligibility.
27NewYorkStateDepartmentofHealth.(2009).ChildHealthPlus.Who is eligible?RetrievedSeptember16,2009,fromhttp://www.nyhealth.gov/nysdoh/chplus/who_is_eligible.htm.
28.Ibid.
29.Three-personfamilieswithchildrenareeligibleforFamilyHealthPluswithincomesupto$27,465.NewYorkStateDepartmentofHealth.FamilyHealthPlus.(2009).Who can join? RetrievedSeptember22,2009,fromhttp://www.nyhealth.gov/nysdoh/fhplus/who_can_join.htm.
30.IfNewYork’sminimumwagewasincreasedto$9.46perhourby2010,thentheminimumwagewouldberestoredtoitspeakpurchasingpower(obtainedinJuly1970).FiscalPolicyInstitute.(2010).New York state’s economic and fiscal outlook for 2010-2011.RetrievedMarch1,2010,fromhttp://www.fiscalpolicy.org.
31.NewYorkStateDepartmentofLabor.Occupational wages in Hudson Valley.DataisfromtheOccupationalEmploymentStatisticsSurvey,May2008.RetrievedApril19,2010,fromhttp://www.labor.ny.gov/stats/lswage2.asp.WagesadjustedforinflationusingtheEmploymentCostIndex.U.S.BureauofLaborStatistics.Employment cost index historical listing. Continuous occupational and industry series: September 1975 – December 2009.Allthreeoccupationsareadjustedtothethirdquarter2009usingnon-seasonaladjustmentsfromTable 9: Employment cost index for wages and salaries, for private industry workers, by occupation and industry. Continuous occupational and industry series.RetrievedApril19,2010,fromwww.bls.gov/web/ecicois.pdf.
32.Industrialtruckandtractordrivingisanoccupationrepresentativeofthoseassociatedwithbuildingretrofittingandconstruction.Pollin,R.,Heintz,J.,Garret-Peltier,H.(2009).The economic benefits of investing in clean energy: How the economic stimulus program and new legislation can boost U.S. economic growth and employment.DepartmentofEconomicsandPoliticalEconomyResearchInstitute(PERI),UniversityofMassachusetts,Amherst.RetrievedFebruary22,2010,fromhttp://www.americanprogress.org/issues/2009/06/pdf/peri_report.pdf.
33.Grall,T.(2007).Custodial mothers and fathers and their child support: 2005.U.S.CensusBureau,CurrentPopulationReports,SeriesP60-234.Washington,D.C.:U.S.GovernmentPrintingOffice.RetrievedAugust14,2008,fromhttp://www.census.gov/prod/2007pubs/p60-234.pdf.
34.Thisamountistheaverageofthosewhoparticipateinchildsupportenforcement.Notethattheaveragechildsupportfigureexcludesfamiliesonassistance,asanychildsupportcollectedontheirbehalfgoesdirectlytothestate.AlsonotethatbecausethemonthlychildsupportaverageexcludesthosecurrentlyreceivingTANF,itdisproportionatelyrepresentsthosewhohavereceivedcashassistance.Thechildsupportfiguresinthisreportwere
38 — tHE SELF-SUFFICIENCY STANDARD FOR NEW YORK STATE tHE SELF-SUFFICIENCY STANDARD FOR NEW YORK STATE — 39
compiledin2008usingFY2005data,andhavebeeninflatedtotheNortheastRegionAugust2009ConsumerPriceIndextomoreaccuratelyreflecttrendsforthelastcalendaryear.U.S.DepartmentofHealthandHumanServices.AdministrationforChildrenandFamilies.OfficeofChildSupportEnforcement(2008).FY 2005 annual report to congress (May 2008). Tables 4, 10, 11, and 52.RetrievedAugust14,2008,fromhttp://www.acf.hhs.gov/programs/cse/pubs/2008/annual_report/.
35.Schulman,K.andBlank,H.(September,2009).State child care assistance policies 2009: Most states hold the line, but some lose ground in hard times.NationalWomen’sLawCenter.IssueBrief.RetrievedOctober22,2009,fromhttp://www.nwlc.org/pdf/nwlcstatechildcareassistancepolicies2009.pdf.
36.U.S.DepartmentofHealthandHumanServices.AdministrationforChildrenandFamilies.Child care and development fund preliminary estimates. Average monthly adjusted number of families and children served (FFY 2008).RetrievedJanuary25,2010,fromhttp://www.acf.hhs.gov/programs/ccb/data/ccdf_data/08acf800_preliminary/table1.htm.
37.NationalCenterforChildreninPoverty.New York: Demographics of young, low-income children.RetrievedJanuary25,2010,fromhttp://www.nccp.org/profiles/NY_profile_8.html.NationalCenterforChildreninPoverty.New York: Demographics of low-income children.RetrievedJanuary25,2010,fromhttp://www.nccp.org/profiles/NY_profile_6.html.
38.NotethatthisincreasedoesnotcontrolforpopulationchangeoranyUSDAmethodologicalchanges.U.S.DepartmentofAgriculture.FoodandNutritionServices.ProgramData.SupplementalNutritionAssistanceProgram.Annual state level data: Persons participating.RetrievedJanuary25,2010,fromhttp://www.fns.usda.gov/pd/15SNAPpartPP.htm.
39.NotethatthisincreasedoesnotcontrolforpopulationchangeoranyUSDAmethodologicalchanges.UnitedStatesDepartmentofAgriculture.(2010).FoodandNutritionServices.Women,Infants,andChildren.ParticipationData.ProgramData.WIC program: Total participation.(DataasofJanuary8,2010.)RetrievedJanuary25,2010,fromhttp://www.fns.usda.gov/pd/26wifypart.htm.
40.NotethatthisincreasedoesnotcontrolforpopulationchangeoranyUSDAmethodologicalchanges.U.S.DepartmentofAgriculture,FoodandNutritionServices.(2010).ProgramData.SupplementalNutritionAssistanceProgram.Annual state level data: Persons participating.RetrievedJanuary25,2010,fromhttp://www.fns.usda.gov/pd/15SNAPpartPP.htm.U.S.DepartmentofAgriculture,FoodandNutritionServices.(2010).Women,Infants,andChildren.ParticipationData.ProgramData.WIC program: Total participation.(DataasofJanuary8,2010.)RetrievedJanuary25,2010,fromhttp://www.fns.usda.gov/pd/26wifypart.htm.
41.Leftin,J.,&Wolkwitz,K.(2009).U.S.DepartmentofAgriculture,FoodandNutritionService.Research.RecentReleases.(2009).Trends in supplemental nutrition assistance program participation rates: 2000-2007.RetrievedOctober21,2009,fromhttp://www.fns.usda.gov/oane/menu/Published/recentreleases.htm.Cunnyngham,K.E.,Castner,L.A.,&Schirm,A.L.(2009).U.S.DepartmentofAgriculture,FoodandNutritionService.Research.RecentReleases.Reaching those in need: State supplemental nutrition assistance program participation rates in 2007.RetrievedFebruary11,2010,fromhttp://www.fns.usda.gov/oane/menu/Published/recentreleases.htm.
42.In200715.3%ofAmericansand11%ofchildrennationwidelackedhealthinsurance.DeNavas-Walt,C.,Proctor,B.,&Smith,J.(2009).Income, poverty, and health insurance coverage in the United States: 2008.TableC-1:HealthInsuranceCoverage:1987to2008;andTableC-3:HealthInsuranceCoveragebyAge1999to2008.RetrievedOctober22,2009,fromhttp://www.census.gov/prod/2009pubs/p60-236.pdf.
43.CentersforMedicareandMedicaidServices.(2009).FY 2008 number of children ever enrolled by program type.RetrievedJanuary25,2010,fromhttp://www.cms.hhs.gov/NationalCHIPPolicy/downloads/FY2008StateTotalTable012309FINAL.pdf.
44.U.S.CensusBureau.(2009).Low income uninsured children by state: Number and percent of children under 19 at or below 200% of poverty by health insurance coverage and state: three year averages for 2006, 2007, and 2008.RetrievedJanuary25,2010,fromhttp://www.census.gov/hhes/www/hlthins/lowinckid.html.
45.Thelargestremainingstateandlocallyfinancedpublichousingprogramsnolongerhavestateorlocalsubsidiesavailableandareintheprocessofbeingconvertedtothefederalpublichousingprogram(20,000unitsinNYCandapproximately400unitselsewhere).Stateauthorizinglegislation(S.6430-A;A.09487),amendingstatePublicHousingLawSection402-b,signedintolawonMarch2,2010.
46.NewYorkStateDivisionofHousingandCommunityRenewal.(2007). 2007 Annual Report: Mitchell-Lama housing companies in New York State.RetrievedMay5,2010,fromhttp://www.dhcr.state.ny.us/Publications/Mitchell-LamaAnnualReport/mlhcar07.pdf.
47.ThenumberofhouseholdsservedinNewYorkbyfederalhousingassistanceprogramswascalculatedbytheEmpireJusticeCenter,baseduponNewYorkStatecensustractlevelfilesfromtheHUD2008PictureofSubsidizedHouseholds.U.S.DepartmentofHousingandUrbanDevelopment.(2008).A picture of subsidized households, 2008.Retrievedfromhttp://www.huduser.org/portal/picture2008/index.html.
48.Ibid.
49.Familiesreceivingtemporaryassistance(welfare)inNewYorkoftenpaytheequivalentoftheirshelterallowanceportionoftheirwelfaregranttowardsrent,bringingtheirrentfarabove30%oftheirincome.
50.ThenumbersofhouseholdsservedinNewYorkbyfederalhousingassistanceprogramswerecalculatedbytheEmpireJusticeCenter,baseduponNewYorkStatecensustractlevelfilesfromtheHUD2008PictureofSubsidizedHouseholds.U.S.DepartmentofHousingandUrbanDevelopment.(2008).A picture of subsidized households, 2008.Retrievedfromhttp://www.huduser.org/portal/picture2008/index.html.
51.Ibid.
52.AccordingtotheCenterforBudgetandPolicyPriorities,“Housingagenciesarerequiredtoensurethat75percentofhouseholdsnewlyadmittedtothevoucherprogrameachyearhaveincomesatorbelow30percentoftheareamedian.”CenteronBudgetandPolicyPriorities.(May,2009).Introduction to the housing voucher program.RetrievedJune4,2009,fromhttp://www.cbpp.org/cms/index.cfm?fa=view&id=2817.
38 — tHE SELF-SUFFICIENCY STANDARD FOR NEW YORK STATE tHE SELF-SUFFICIENCY STANDARD FOR NEW YORK STATE — 39
53.U.S.DepartmentofHousingandUrbanDevelopment.(2008).A picture of subsidized households, 2008.Retrievedfromhttp://www.huduser.org/portal/picture2008/index.html.
54.InternalRevenueService.(2008).EITC awareness kicks off today; free tax help available.RetrievedSeptember4,2008,fromhttp://www.irs.gov/newsroom/article/0,,id=178071,00.html.
55. U.S.DepartmentofLabor,BureauofLaborStatistics.(2010).OccupationalEmploymentStatistics.May 2008 occupational employment and wage estimates: New York.RetrievedMarch1,2010,fromhttp://www.bls.gov/oes/.WagesareadjustedforinflationusingtheEmploymentCostIndex.U.S.BureauofLaborStatistics.(2010).Employment cost index historical listing. Continuous occupational and industry series: September 1975 – December 2009.Alloccupationsareadjustedtothethirdquarter2009usingnon-seasonaladjustmentsfromTable 9: Employment cost index for wages and salaries, for private industry workers, by occupation and industry. Continuous occupational and industry series.RetrievedApril19,2010,fromwww.bls.gov/web/ecicois.pdf.
56.U.S.CensusBureau.2008AmericanCommunitySurvey1-YrEstimates.DetailedTables.B20004.Median earnings by sex by educational attainment for the population 25 years and over.RetrievedFebruary23,2010,fromhttp://factfinder.census.gov/.
57.CenterforWomenPolicyStudies.(2002). From poverty to self-sufficiency: The role of postsecondary education in welfare reform.RetrievedFebruary28,2006,fromhttp://www.centerwomenpolicy.org/pdfs/POV1.pdf.
58.Holzer,H.&Lerman,R.(2007).America’s forgotten middle skill jobs: Education and training requirements in the next decade and beyond.TheWorkforceAlliance.Washington,DC.RetrievedApril22,2009,fromhttp://www.urban.org/UploadedPDF/411633_forgottenjobs.pdf.
59.Prince,D.&Jenkins,D.(2005).Building pathways to success for low-skill adult students: Lessons for community college policy and practice from a statewide longitudinal student tracking study.CommunityCollegeResearchCenter,Teacher’sCollege.ColumbiaUniversity.RetrievedApril22,2009,fromhttp://ccrc.tc.columbia.edu/Publication.asp?UID=204.Baily,T.,Kienzl,G.,&Marcotte,D.E.(2004).The return to a sub-baccalaureate education: The effects of schooling, credentials and program of study on economic outcomes.U.S.DepartmentofEducation.RetrievedApril22,2009,fromhttp://www2.ed.gov/rschstat/eval/sectech/nave/subbac-ed.html.Grubb,W.N.(2002).LearningandEarningintheMiddle,Part1:NationalStudiesofPre-BaccalaureateEducation.Economics of education review 21(4), 299-321.RetrievedApril22,2009,fromhttp://ideas.repec.org/a/eee/ecoedu/v21y2002i4p299-321.html.
60.Ibid.
61.Bailey,T.,Kienzl,G.,&.Marcotte,D.E.(2004).The return to a sub-baccalaureate education: The effects of schooling, credentials and program of study on economic outcomes.Washington,D.C.:U.S.DepartmentofEducation.RetrievedApril22,2009,fromhttp://www.ed.gov/rschstat/eval/sectech/nave/subbac-ed.pdf.
62.Formoreinformationonsectoralemploymentinterventionseehttp://www.insightcced.organdhttp://www.wowonline.org/ourprograms/fess/sfess.asp#Targeting.
63.FormoreinformationaboutFunctionalContextEducationseehttp://www.wowonline.org/ourprograms/fess/sfess.asp#Targeting.
64.Formoreinformationaboutnontraditionaloccupations(NTOs)seeWorkplaceSolutions.Women in Nontraditional Occupations and Apprenticeships.Availableathttp://www.workplacesolutions.org/about/grantees.cfm.
65.FormoreinformationaboutNontraditionalEmploymentforWomen(NEW)seehttp://www.new-nyc.org/.
66.Formoreinformationaboutmicroenterprisetraininganddevelopmentseehttp://www.womensinitiative.org.
67.Montalto,C.P.(2002,May).Wealth of American households: Evidence from the survey of consumer finances.ReporttoConsumerFederationofAmerica.RetrievedFebruary9,2005,fromhttp://www.consumerfed.org/pdfs/cfa5_wealth_poor_final_report.pdf.
68.NationalCenterforChildreninPoverty.StateProfiles.NewYork.Temporary assistance for needy families (TANF) cash assistance.RetrievedJanuary25,2010,fromhttp://www.nccp.org/profiles/NY_profile_36.html.
69.FormoreinformationaboutIndividualDevelopmentAccountsseehttp://gwbweb.wustl.edu/csd/asset/idas.htm.
70.FormoreinformationonpayequityseetheNationalCommitteeonPayEquityathttp://www.pay-equity.org.
TExT BOx ENDNOTESa.OneofthefirstpersonstoadvocateimplementingchangesovertimeintotheFederalPovertyLevelwasPatriciaRuggles.Ruggles,P.(1990).Drawing the line: Alternative poverty measures and their implications for public policy.Lanham,MD:UniversityPressofAmerica.
b.Citro,C.&Michael,R.Eds.(1995).Measuring poverty: A new approach.Washington,DC:NationalAcademyPress.RetrievedMarch15,2010,fromhttp://www.census.gov/hhes/poverty/povmeas/toc.html.
c.U.S.DepartmentofCommerce,U.S.CensusBureau.(2010).PovertyMeasurementStudiesandAlternativeMeasures.Observations from the interagency technical working group on developing a supplemental poverty measure.RetrievedMarch15,2010,fromhttp://www.census.gov/hhes/www/povmeas/povmeas.html.
d.NewYorkCityCenterforEconomicOpportunity.(2010). The CEO poverty measure, 2005-2008: A working paper by the NYC Center for Economic Opportunity, March 2010.RetrievedApril26,2010,fromhttp://www.nyc.gov/html/ceo/html/home/home.shtml.
e.Short,K.&Garner,T.(2008).Creating a consistent poverty measure over time using NAS Procedures: 1996-2005.U.S.CensusBureau,WorkingPaperSeries,PovertyThresholds.RetrievedMarch30,2010,fromhttp://www.census.gov/hhes/www/povmeas/papers/experimental_measures_96_05v7.pdf.
f.Ibid.
g.U.S.DepartmentofCommerce,U.S.CensusBureau.(2010).PovertyMeasurementStudiesandAlternativeMeasures.Observations from the interagency technical working group on developing a supplemental poverty measure.RetrievedMarch15,2010,fromhttp://www.census.gov/hhes/www/povmeas/povmeas.html.
40 — tHE SELF-SUFFICIENCY STANDARD FOR NEW YORK STATE tHE SELF-SUFFICIENCY STANDARD FOR NEW YORK STATE — 41
Appendix A: Methodology, Assumptions and Sources Thisappendixexplainsthemethodology,assumptions,andsourcesusedtocalculatetheStandard.Itbeginswithadiscussionofthegeneralapproach,followedbythespecificsofhoweachcostiscalculated,endingwithalistofdatasources.MakingtheSelf-SufficiencyStandardasconsistentandaccurateaspossible,yetvariedbygeographyandtheageofchildren,requiresmeetingseveraldifferentcriteria.Totheextentpossible,thedatausedincalculatingtheStandardare:
collectedorcalculatedusingstandardizedorequivalent• methodologynationwideobtainedfromscholarlyorcrediblesourcessuchasthe• U.S.CensusBureauupdatedroutinely• geographically-and/orage-specific,asappropriate•
Coststhatvarysubstantiallybyplace,suchashousingandchildcare,arecalculatedatthemostgeographicallyspecificlevelforwhichdataisavailable.Othercosts,suchashealthcare,food,andtransportation,arevariedgeographicallytotheextentthereisvariationandappropriatedataavailable.Inaddition,asimprovedorstandardizeddatasourcesbecomeavailable,themethodologyusedbytheStandardisrefinedaccordingly,resultinginanimprovedStandardthatiscomparableacrossplaceaswellastime.
TheSelf-SufficiencyStandardiscalculatedforeachcountyinNewYork,includingtwotablesforNewYorkCountysplitintoaNorthManhattanareaandSouthManhattanareaandtwotablesforWestchesterCountysplitintoYonkersandWestchesterCountyexcludingYonkers.
TheSelf-SufficiencyStandardiscalculatedfor70familytypesineachcountyorgeographicarea,includingdifferentconfigurationsofoneandtwoadultfamiliesandfamilieswithnochildren,onechild,twochildren,andthreechildren.Inaddition,therearefouragerangesforchildren:infant,preschooler,school-age,andteenager.The70familytypesrangefromasingleadultwithnochildren,tooneadultwithoneinfant,oneadultwithonepreschooler,oneadultwithoneschool-agechild,andsoforth,uptotwo-adultfamilieswiththreeteenagersascanbeseeninTableA-1.These70familytypesrepresentthemajorityofhouseholds.TheSelf-SufficiencyStandardcanalsobe
calculatedforawiderrangeoffamilytypes,includinglargerandmulti-generationalfamilies.ThecostofeachbasicneedandtheSelf-SufficiencyWagesfortenselectedfamilytypesforeachcountyinNewYorkareincludedinAppendixCofthisreport.(Seehttp://www.selfsufficiencystandard.org/pubs.html,http://www.nyscommunityaction.org,orhttp://fiscalpolicy.orgtoviewthefulldatatables.)
TheSelf-SufficiencyStandardassumesadulthouseholdmembersworkfull-timeand therefore includes all major costs associated with employment for every adult household member (i.e.,taxes,transportation,andchildcareforfamilieswithyoungchildren).TheSelf-SufficiencyStandarddoesnotcalculatecostsforadultswithdisabilitiesorelderlyhouseholdmemberswhonolongerwork.ItshouldbenotedthatforfamilieswithpersonswithdisabilitiesorelderlyfamilymemberstherearecoststhattheStandarddoesnotaccountfor,suchasincreasedtransportationandhealthcarecosts.
TheStandardassumesadultswork8hoursperdayfor22dayspermonthand12monthsperyear.EachcostcomponentintheStandardisfirstcalculatedasamonthlycost.HourlyandannualSelf-SufficiencyWagesarecalculatedbasedonthemonthlyStandardbydividingthemonthlySelf-SufficiencyStandardby176hourspermonthtoobtainthehourlywageandmultiplyingby12monthsperyeartoobtaintheannualwage.TheStandardthereforeassumesafull-timeworkerworksatotalof2,112hoursperyear.
ThecomponentsofThe Self-Sufficiency Standard for New York State 2010andtheassumptionsincludedinthecalculationsaredescribedbelow.
Housing. Forhousingcosts,theStandardusesthemostrecentFiscalYear(FY)FairMarketRents(FMRs),calculatedannuallybytheU.S.DepartmentofHousingandUrbanDevelopment(HUD)foreachstate’smetropolitanandnonmetropolitanareas.Section8(c)(1)oftheUnitedStatesHousingActof1937(USHA)requirestheSecretarytopublishFairMarketRents(FMRs)periodically,butnotlessthanannually,tobeeffectiveonOctober1ofeachyear.Housingcostsinthe2010NewYorkCitySelf-Sufficiency
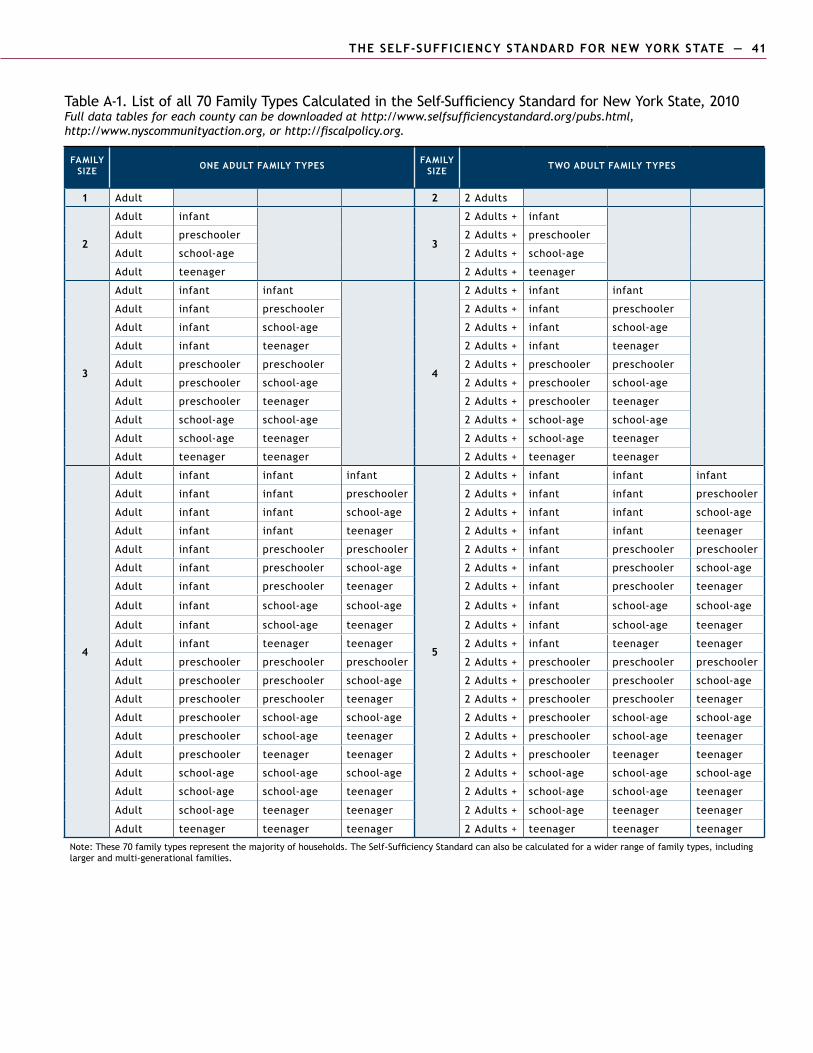
40 — tHE SELF-SUFFICIENCY STANDARD FOR NEW YORK STATE tHE SELF-SUFFICIENCY STANDARD FOR NEW YORK STATE — 41
Table A-1. List of all 70 Family Types Calculated in the Self-Sufficiency Standard for New York State, 2010 Full data tables for each county can be downloaded at http://www.selfsufficiencystandard.org/pubs.html, http://www.nyscommunityaction.org, or http://fiscalpolicy.org.
FAMILY size ONE ADULT FAMILY TYPES FAMILY
size TWO ADULT FAMILY TYPES
1 Adult 2 2 Adults
2
Adult infant
3
2 Adults + infant
Adult preschooler 2 Adults + preschooler
Adult school-age 2 Adults + school-age
Adult teenager 2 Adults + teenager
3
Adult infant infant
4
2 Adults + infant infant
Adult infant preschooler 2 Adults + infant preschooler
Adult infant school-age 2 Adults + infant school-age
Adult infant teenager 2 Adults + infant teenager
Adult preschooler preschooler 2 Adults + preschooler preschooler
Adult preschooler school-age 2 Adults + preschooler school-age
Adult preschooler teenager 2 Adults + preschooler teenager
Adult school-age school-age 2 Adults + school-age school-age
Adult school-age teenager 2 Adults + school-age teenager
Adult teenager teenager 2 Adults + teenager teenager
4
Adult infant infant infant
5
2 Adults + infant infant infant
Adult infant infant preschooler 2 Adults + infant infant preschooler
Adult infant infant school-age 2 Adults + infant infant school-age
Adult infant infant teenager 2 Adults + infant infant teenager
Adult infant preschooler preschooler 2 Adults + infant preschooler preschooler
Adult infant preschooler school-age 2 Adults + infant preschooler school-age
Adult infant preschooler teenager 2 Adults + infant preschooler teenager
Adult infant school-age school-age 2 Adults + infant school-age school-age
Adult infant school-age teenager 2 Adults + infant school-age teenager
Adult infant teenager teenager 2 Adults + infant teenager teenager
Adult preschooler preschooler preschooler 2 Adults + preschooler preschooler preschooler
Adult preschooler preschooler school-age 2 Adults + preschooler preschooler school-age
Adult preschooler preschooler teenager 2 Adults + preschooler preschooler teenager
Adult preschooler school-age school-age 2 Adults + preschooler school-age school-age
Adult preschooler school-age teenager 2 Adults + preschooler school-age teenager
Adult preschooler teenager teenager 2 Adults + preschooler teenager teenager
Adult school-age school-age school-age 2 Adults + school-age school-age school-age
Adult school-age school-age teenager 2 Adults + school-age school-age teenager
Adult school-age teenager teenager 2 Adults + school-age teenager teenager
Adult teenager teenager teenager 2 Adults + teenager teenager teenager
Note: These 70 family types represent the majority of households. The Self-Sufficiency Standard can also be calculated for a wider range of family types, including larger and multi-generational families.
42 — tHE SELF-SUFFICIENCY STANDARD FOR NEW YORK STATE tHE SELF-SUFFICIENCY STANDARD FOR NEW YORK STATE — 43
StandardarecalculatedusingtheFY2010HUDFairMarketRents,publishedOctober1,2009.
AnnualFMRs,usedtodeterminethelevelofrentforthosereceivinghousingassistancethroughSection8vouchers,arebasedondatafromthe2000decennialcensus,thebiannualAmericanHousingSurvey,andrandomdigitdialingtelephonesurveys,updatedforinflation.Thesurveysampleincludesrenterswhohaverentedtheirunitwithinthelasttwoyears,excludingnewhousing(twoyearsoldorless),substandardhousing,andpublichousing.FMRs,whichincludeutilities(excepttelephoneandcable),areintendedtoreflectthecostofhousingthatmeetsminimumstandardsofdecency.Inmostcases,FMRsaresetatthe40thpercentile;meaning40%ofthehousinginagivenareaislessexpensivethantheFMR.aAllofNewYork’sFMRsaresetatthe40thpercentile.
HUDcalculatesonesetofFMRsforanentiremetropolitanarea.InNewYorkthereare10metropolitanareaswithmorethanonecountythatsharethesameFMRs.Inordertodifferentiatethecostofhousingbycounty,theStandardusedmediangrossrentratiosbycountycalculatedfromtheU.S.CensusBureau’s2006-2008AmericanCommunitySurvey(ACS)3-YearEstimates.
Inaddition,housingcostsinManhattan(NewYorkCounty)arefurtheradjustedforvariationbetweentwogeographicareasofManhattan.The2008NewYorkCityHousingandVacancySurveymediangrossrentsforsub-boroughswithinManhattanwereusedtoadjusthousingcostsforwhatisreferredtoas“NorthManhattan”and“SouthManhattan”inthisreport.TheNorthandSouthManhattanareasweredelineatedtobestreflectthedifferenceinhousingcoststhroughoutsub-boroughsofManhattan.Theareasareconsistentwiththe2004NYCStandard.NotethattheseareasdonotnecessarilyalignwiththecommonlyunderstoodgeographicboundariesofLowerandUpperManhattan.Thetwoareasweredeterminedbygroupingtogethersub-boroughswithsimilarhousingcosts.Thetraditionalborderof14thStreetforLowerManhattanleftouthighhousingcostareassuchasChelsea,Clinton,TurtleBay,andtheUpperEastandUpperWestSide.
ThegeographicareaofNorthManhattanforthisreportincludesthefollowingsub-boroughs:MorningsideHeights/
HamiltonHeights,CentralHarlem,EastHarlem,andWashingtonHeights/Inwood.Thesub-boroughsincludedinthegeographicareaofSouthManhattanare:GreenwichVillage/FinancialDistrict,LowerEastSide/Chinatown,Chelsea/Clinton/Midtown,StuyvesantTown/TurtleBay,UpperWestSide,andUpperEastSide.
Todeterminethenumberofbedroomsrequiredforafamily,theStandardassumesthatparentsandchildrendonotsharethesamebedroomandnomorethantwochildrenshareabedroom.Therefore,theStandardassumesthatsinglepersonsandcoupleswithoutchildrenhaveone-bedroomunits,familieswithoneortwochildrenrequiretwobedrooms,andfamilieswiththreechildrenrequirethreebedrooms.Becausetherearefewefficiencies(studioapartments)insomeareas,andtheirqualityisveryuneven,theSelf-SufficiencyStandardusesone-bedroomunitsforthesingleadultandchildlesscouple.
Child Care. TheFamilySupportAct,ineffectfrom1988untilwelfarereformin1996,requiredstatestoprovidechildcareassistanceatmarket-rateforlow-incomefamiliesinemploymentand/oreducationandtraining.Stateswerealsorequiredtoconductcostsurveysbiannuallytodeterminethemarket-rate(definedasthe75thpercentile)bysetting,age,andgeographicallocationorsetastatewiderate.bManystates,includingNewYork,havecontinuedtoconductorcommissionthesurveysaswellasreimbursechildcareatorclosetothislevel.DataforNewYorkchildcarecostsarefromtheNewYorkChildCareandDevelopmentFundPlan2009ChildCareMarketRates,preparedbytheNewYorkStateOfficeofChildrenandFamilyServices.c
Carebyfamilyrelativesaccountsforthelargestproportionofcareforchildrenlessthanthreeyearsofage(30%comparedto15%infamilydaycareand18%inchildcarecenters).dHowever,sinceoneofthebasicassumptionsoftheStandardisthatitprovidesthecostsofmeetingneedswithoutpublicorprivatesubsidies,the“privatesubsidy”offreeorlowcostchildcareprovidedbyrelativesandothersisassumednottoexist.
Thusthequestionbecomes:whichpaidsettingismostusedforinfants(definedaschildrenunderthree),familydaycareorcentercare?Someproportionofrelativecareispaidcare,withestimatesrangingfromone-fourthtomorethanhalf.Inaddition,asubstantialproportionofrelativecaregivers
42 — tHE SELF-SUFFICIENCY STANDARD FOR NEW YORK STATE tHE SELF-SUFFICIENCY STANDARD FOR NEW YORK STATE — 43
alsoprovidecarefornon-relativechildren.Asaresult,relativecare,whenpaidfor,closelyresemblesthefamilydaycarehomesetting.
Whenevenaminimalproportionofrelativecareisaddedtothepaidfamilydaycaresettingamount(e.g.,itisassumedthatjust20%ofrelativecareispaid),thenthiscombinedgrouping(familydaycarehomespluspaidrelativecare)becomesthemostcommonpaiddaycaresettingforinfants.Thatis,15%ofchildreninfamilydaycareplus(atleast)6%whoareinrelativecare(20%ofthe30%)totals21%,andthusismorethanthe18%ofinfantswhoareinpaidcareindaycarecenters.e
Forchildrenthreeandfouryearsold,however,clearlythemostcommonchildcarearrangementisthechildcarecenter,accountingfor42%ofthecare(comparedto12%infamilychildcareand23%inrelativecare).f
Forthe2010NewYorkStateStandard,thecostofchildcareforinfantswascalculatedasthecostoffull-timechildcareatregulatedgroupfamilydaycarefacilitiesandregisteredfamilydaycarefacilitiesforchildrenunderthreeyearsofage.NotethattheNewYorkChildCareMarketRatescalculatechildrenunderoneandahalfyearsofageasoneagecategoryandchildrenbetweenoneandahalfandtwoyearsofageasanothercategory.FortheStandard,thesetwoagecategorieshavebeencombinedintoone‘infant’categorybyaveragingtheratesforbothagegroups.Thecostofchildcareforpreschoolerswascalculatedasfull-timecareatdaycarecentersforchildrenagesthreethroughfive.Tocalculatethemonthlycostofchildcareforinfantandpreschooleragedchildren,theweeklyNewYorkChildCareMarketRatesweremultipliedby4.3weekspermonth.Costsforschool-agechildrenintheStandardwerecalculatedaspart-daycareatschoolagechildcarefacilitiesforchildrenbetweentheagesofsixand12.Thepart-dayratesforschool-agechildrenintheNewYorkChildCareMarketRateswereportedasdailyrates;thedailyratesweremultipliedbyfivedaysperweekand4.3weekspermonthtocalculatethemonthlyrates.
TheNewYorkChildCareMarketRatesareestablishedinfivegeographicgroupingsofcountiesthatcorrespondtosocialservicedistricts.Theratesestablishedforeachgroupapplytoallcountiesordistrictsinthegroup.Forexample,theGroupFourregionincludesAlbany,Dutchess,Orange,
andUlsterCounties;thereforethesecountiessharethesamechildcarerates.TheNewYorkChildCareMarketRatescalculatethecostofchildcareatthe75thpercentileforeachgroup.
Food. AlthoughtheSupplementalNutritionAssistanceProgram(SNAP,formerlytheFoodStampProgram)usestheU.S.DepartmentofAgriculture(USDA)ThriftyFoodPlantocalculatebenefits,theStandardusestheLow-CostFoodPlanforfoodcosts.WhilebothoftheseUSDAdietsweredesignedtomeetminimumnutritionalstandards,SNAP(whichisbasedontheThriftyFoodPlan)isintendedtobeonlyatemporarysafetynet.g
TheLow-CostFoodPlanis25%higherthantheThriftyFoodPlan,andisbasedonmorerealisticassumptionsaboutfoodpreparationtimeandconsumptionpatterns,whilestillbeingaveryconservativeestimateoffoodcosts.Forinstance,theLow-CostFoodPlanalsodoesnotallowforanytake-out,fast-food,orrestaurantmeals,eventhough,accordingtotheConsumerExpenditureSurvey,theaverageAmericanfamilyspendsabout42%oftheirfoodbudgetonfoodpreparedawayfromhome.h
TheUSDALow-CostFoodPlanvariesbymonthanddoesnotgiveanannualaveragefoodcost,sotheStandardfollowstheSNAPprotocolofusingJunedataofthecurrentyeartorepresenttheannualaverage.The2010NewYorkStandardusesdataforJune2009.
BoththeLow-CostFoodPlanandtheStandard’sbudgetcalculationsvaryfoodcostsbythenumberandagesofchildrenandthenumberandgenderofadults.TheStandardassumesthatasingle-personhouseholdisoneadultmale,whilethesingle-parenthouseholdisoneadultfemale.Atwo-parenthouseholdisassumedtoincludeoneadultmaleandoneadultfemale.
GeographicdifferencesinfoodcostswithinNewYorkwerevariedusingtheACCRACostofLivingIndex,publishedbytheCouncilforCommunityandEconomicResearch.TheACCRAgroceryindexisstandardizedtopricebudgetgroceryitemsregardlessoftheshopper’ssocio-economicstatus.NewYorkfoodcostsrangefrom58%higherthanthenationalaveragecostoffoodinManhattanto5%lowerthanthenationalaveragecostoffoodintheRochestermetropolitanarea.i
44 — tHE SELF-SUFFICIENCY STANDARD FOR NEW YORK STATE tHE SELF-SUFFICIENCY STANDARD FOR NEW YORK STATE — 45
Public Transportation. Ifthereisan“adequate”publictransportationsysteminagivenarea,itisassumedthatworkersusepublictransportationtogettoandfromwork.Apublictransportationsystemisconsidered“adequate”ifitisusedbyasubstantialpercentageoftheworkingpopulation.AccordingtoastudydonebytheInstituteofUrbanandRegionalDevelopment,UniversityofCalifornia,ifabout7%ofthetotalpublicusespublictransportationthat“translates”toapproximately30%ofthelow-andmoderate-incomepopulation.jTheStandardassumesprivatetransportation(acar)wherepublictransportationusetocommutetoworkislessthan7%.ForNewYork,theStandarduses2006-2008AmericanCommunitySurvey3-YrEstimatesdatatocalculatethepercentofpublictransportationusetocommutetoworkbycounty.ThefollowingplacesorcountiesinNewYorkhaveover7%publictransportationusetocommutetowork:allNewYorkCityboroughs(30%toover60%publictransportationusedependingonborough),Nassau(16.2%),Putnam(7.1%),Rockland(9.1%),Tompkins(7.2%),andWestchester(20.8%).kTherefore,theStandardusespublictransportationtocalculatetransportationcostsforeachoftheseplacesorcounties,withtheexceptionofPutnamCounty.Duetoinadequatepublictransportationforwithincountytraveltoandfromwork,coupledwithpublictransportationcostsfortravelfromPutnamtoNewYorkCitythatarehigherthanthecostofprivatetransportation,theStandardforPutnamCountyiscalculatedusingprivatetransportation.
Thecostofpublictransportationiscalculatedassumingmonthlyunlimitedtransitpasseswhenavailableinacounty.NewYorkCitypublictransportationcostsareobtainedfromtheMetropolitanTransitAuthorityandarecalculatedasthecostofanunlimitedrideMetroCardperadult.NassauCountypublictransportationiscalculatedasthecostofamonthlylong-islandrailpassfromMetropolitanTransitAuthority.RocklandCountypublictransportationiscalculatedasthecostofSupersavorTicketbooksfromTransportationofRocklandforcommutingtoandfromworkaswellasextratripsforshoppinganderrands.TompkinsCountypublictransportationiscalculatedasthecostofamonthlypassfromTompkinsConsolidatedAreaTransit.WestchesterCountypublictransportationiscalculatedasthecostofamonthlymetro-northrailpassfromMetropolitanTransitAuthority.
Private Transportation. ForprivatetransportationtheStandardassumesthatadultsneedacartogettoandfromwork.Privatetransportationcostsarebasedontheaveragecostsofowningandoperatingacar.Onecarisassumedforhouseholdswithoneadultandtwocarsareassumedforhouseholdswithtwoadults.Itisunderstoodthatthecar(s)willbeusedtocommutetoandfromworkfivedaysperweek,plusonetripperweekforshoppinganderrands.Inaddition,oneparentineachhouseholdwithyoungchildrenisassumedtohaveaslightlylongerweekdaytriptoallowfor“linking”tripstoadaycaresite.Forper-milecosts,drivingcostdatafromtheAmericanAutomobileAssociationisused.Thecommutingdistanceiscomputedfromthemostrecentnationaldataavailable,the2009NationalHouseholdTravelSurvey(NHTS).Accordingtothe2009NHTS,theNewYorkStateaverageroundtripdistanceforcommutingtoworkis23miles.
TheautoinsurancepremiumistheaveragepremiumcostforagivenstatefromtheNationalAssociationofInsuranceCommissioners(NAIC)2005-2006StateAveragesExpendituresandPremiumsforPersonalAutomobileInsurance.ThestatewideautopremiumisupdatedforinflationtocurrentdollarsusingtheConsumerPriceIndex.
Tocreatewithinstatevariation(regionalorcounty)inautoinsurancepremiums,ratiosarecreatedusingsampleinsuranceratesforgeographicterritoriesinNewYork.Insuranceratesareobtainedfromthe2009autoinsurancepricecomparisontablesfromtheNewYorkStateInsuranceDepartmentAutomobile Insurance Information For Consumers.
Thefixedcostsofcarownershipsuchasfire,theft,propertydamageandliabilityinsurance,license,registration,taxes,repairs,monthlypayments,andfinancechargesareincluded.Themonthlyvariablecosts(e.g.,gas,oil,tires,andmaintenance)arealsoincluded,buttheinitialcostofpurchasingacarisnot.Toestimateprivatetransportationfixedcosts,theStandarduses2008ConsumerExpenditureSurveydataforfamilieswithincomesbetweenthe20thand40thpercentilelivingintheCensusSouthregionoftheUnitedStates.
Autoinsurancepremiumsandfixedautocostsareadjustedforinflationusingthemostrecentandarea-specificConsumerPriceIndex.
44 — tHE SELF-SUFFICIENCY STANDARD FOR NEW YORK STATE tHE SELF-SUFFICIENCY STANDARD FOR NEW YORK STATE — 45
Health Care. TheStandardassumesthatanintegralpartofaSelf-SufficiencyWageisemployer-sponsoredhealthinsuranceforworkersandtheirfamilies.NationallyandinNewYork,70%ofnon-elderlyindividualsinhouseholdswithatleastonefull-timeworkerhaveemployer-sponsoredhealthinsurance.lNationally,theemployerpays81%oftheinsurancepremiumfortheemployeeand75%oftheinsurancepremiumforthefamily.InNewYork,thefull-timeworker’semployerpaysanaverageof79%oftheinsurancepremiumfortheemployeeand78%forthefamily.m
HealthcarepremiumsareobtainedfromtheMedicalExpenditurePanelSurvey(MEPS),InsuranceComponentproducedbytheAgencyforHealthcareResearchandQuality,CenterforFinancing,Access,andCostTrends.TheMEPShealthcarepremiumsaretheaverageemployment-basedhealthpremiumpaidbyastate’sresidentsforasingleadultandforafamily.InNewYork,theaveragepremiumpaidbytheemployeeis$78.92forasingleadultand$281.33forafamily.nThesecostsarethenadjustedforinflationusingtheMedicalCareServicesConsumerPriceIndex.
TovarythestatepremiumcostsforNewYork,theStandardusesdatafromtheNewYorkStateDepartmentofInsuranceHMOratesbycounty.ThestatelevelMEPSdataisadjustedbycountyusingratioscalculatedfrompremiumratesforallavailablecompaniesineachNewYorkcounty.o
Healthcarecostsalsoincluderegionalout-of-pocketcostscalculatedforadults,infants,preschoolers,school-agechildren,andteenagers.Dataforout-of-pockethealthcarecosts(byage)arealsoobtainedfromtheMEPS,adjustedbyCensusregionusingtheMEPSHouseholdComponentAnalyticalTool,andadjustedforinflationusingtheMedicalCareConsumerPriceIndex.
AlthoughtheStandardassumesemployer-sponsoredhealthcoverage,notallworkershaveaccesstoaffordablehealthinsurancecoveragethroughtheiremployers,andtherearesomeindicatorsofemployeecostsrisingthroughincreasedpremiums,increaseddeductiblesandco-payments,andmorelimitedcoverage.InNewYorkState,theworker’sshareofhealthcarepremiumsnearlydoubledoverthepastdecade,increasingby92%(from$7,090to$13,632peryear)between2000and2009whiletheaverageworker’searningsincreasedbyjust14%between2000and2009.pThosewho
donothaveaccesstoaffordablehealthinsurancethroughtheiremployersmusteitherpurchasetheirowncoverageordowithouthealthinsurance.Whenanindividualorafamilycannotaffordtopurchasehealthcoverage,anillnessorinjurycanbecomeaveryseriousfinancialcrisis.Likewise,aserioushealthconditioncanmakeitextremelyexpensivetopurchaseindividualcoverage.
Miscellaneous. Thisexpensecategoryconsistsofallotheressentialsincludingclothing,shoes,paperproducts,diapers,nonprescriptionmedicines,cleaningproducts,householditems,personalhygieneitems,andtelephoneservice.Itdoesnotallowforrecreation,entertainment,savings,ordebtrepayment.
Miscellaneousexpensesarecalculatedbytaking10%ofallothercostsbeforetaxesandtaxcreditsarecalculated.Thispercentageisaconservativeestimateincomparisontoestimatesinotherbasicneedsbudgets,whichcommonlyuse15%.q
Taxes. TaxescalculatedintheStandardincludefederalandstateincometax,payrolltaxes,andstateandlocalsalestaxwhereapplicable.FederalpayrolltaxesforSocialSecurityandMedicarearecalculatedat7.65%ofeachdollarearned.Althoughthefederalincometaxrateishigherthanthepayrolltaxrate,federalexemptionsanddeductionsaresubstantial.Asaresult,whilepayrolltaxispaidoneverydollarearned,mostfamilieswillnotowefederalincometaxonthefirst$10,000to$15,000ormore,thusloweringtheeffectivefederaltaxratetoabout7%forsomefamilytypes.IncometaxcalculationsfortheStandardincludestateandlocalincometax.NewYorkStateincometaxratesrangefrom4%to6.85%dependingonincomelevelandfilingstatus.Inadditiontostateincometax,NewYorkCityhasanincometaxthatvariesfrom2.907%to3.648%dependingonincomeandYonkershasa10%flatlocalincometaxrate.r
CalculationsforsalestaxforNewYorkincludebothstateandlocalSalesandUseTax.Thestatesalestaxis4%.Inadditiontothestatesalestaxmostcountiesalsohavelocaljurisdictionsalestax,themajorityofwhicharebetween3%and5%.Forexample,thetotalsalestaxcalculatedforNewYorkCityis8.875%(includinga4%statesalestax,a4.5%NewYorkCitysalestax,anda3/8%metrosalestax).s
46 — tHE SELF-SUFFICIENCY STANDARD FOR NEW YORK STATE tHE SELF-SUFFICIENCY STANDARD FOR NEW YORK STATE — 47
Indirecttaxes(e.g.,propertytaxespaidbythelandlordonhousing)areassumedtobeincludedinthepriceofhousingpassedonbythelandlordtothetenant.
The Self-Sufficiency Standard for New York State 2010incorporateschangesinfederaltaxcreditsresultingfromtheAmericanRecoveryandReinvestmentAct(ARRA).TaxcreditscalculatedintheStandardthathavebeenimpactedbyARRAare:theEarnedIncomeTaxCredit,theChildTaxCredit,andtheMakingWorkPayTaxCredit.tNotehoweverthattheARRAchangestotaxcreditsarecurrentlyonlyeffectivethroughthe2010taxyear.IfusingthiseditionoftheStandardduringorbeyond2011,thetaxcreditsshownmaybeslightlylower.
The Earned Income Tax Credit (EITC),orasitisalsocalled,theEarnedIncomeCredit,isafederaltaxrefundintendedtooffsetthelossofincomefrompayrolltaxesowedbylow-incomeworkingfamilies.TheEITCisa“refundable”taxcredit,meaningworkingadultsmayreceivethetaxcreditwhetherornottheyoweanyfederaltaxes.
NewYorkhasastateEITCthatissetat30%ofthefederalEITC;inaddition,NewYorkCityhasacityEITCthatissetat5%ofthefederalEITC.
The Child Care Tax Credit (CCTC),alsoknownastheChildandDependentCareTaxCredit,isafederaltaxcreditthatallowsworkingparentstodeductapercentageoftheirchildcarecostsfromthefederalincometaxestheyowe.LiketheEITC,theCCTCisdeductedfromthetotalamountofmoneyafamilyneedstobeself-sufficient.UnliketheEITC,thefederalCCTCisnotarefundablefederaltaxcredit;thatis,afamilymayonlyreceivetheCCTCasacreditagainstfederalincometaxesowed.Therefore,familieswhooweverylittleornothinginfederalincometaxeswillreceivelittleornoCCTC.In2009,upto$3,000inchildcarecostswasdeductibleforonequalifyingchildandupto$6,000fortwoormorequalifyingchildren.
NewYorkhasastateCCTCthatis20%to110%ofthefederalCCTC,dependingonincome;andNewYorkCityhasacityCCTCthatisupto75%ofthestateCCTC,dependingonincome.
The Child Tax Credit (CTC)isapartiallyrefundablefederaltaxcredit.In2009,theCTCprovidedparentswith
adeductionof$1,000foreachchildunder17yearsold,or15%ofearnedincomeover$3,000,whicheverwasless.FortheStandard,theCTCisshownasreceivedmonthly.
NewYorkStatehasastateCTC,knownastheEmpireStateChildCredit,thatisthegreaterof33%ofthefederalCTCor$100multipliedbythenumberofqualifyingchildren.
The Making Work Pay Tax Credit (MWPTC),recentlypassedinthe2009AmericanRecoveryandReinvestmentAct,isarefundablefederaltaxcreditupto$400peryearforsingleadultsand$800peryearformarriedcouples.Thecreditisavailabletoworkingadultswithincomesupto$75,000peryearforsingleadultsand$150,000peryearformarriedcouples.FortheStandard,theMakingWorkPayTaxCreditisshownmonthly.TheMakingWorkPayTaxCreditiscurrentlyeffectivethroughthe2010taxyear.
The New York State and City Household Creditsarenon-refundabletaxcreditsthatcanbeusedascreditsagainstincometaxesowed.TheNewYorkStateHouseholdCreditisuptoa$75creditforsingletaxpayersanda$20to$90creditplus$5to$15moreperexemptionclaimedonfederaltaxreturnsformarriedorheadofhouseholdwithqualifyingdependenttaxpayers.TheNewYorkCityHouseholdCreditisuptoa$15creditforsingletaxpayersanda$10to$30creditplus$10to$30moreperexemptionclaimedonfederaltaxreturnformarriedorheadofhouseholdwithqualifyingdependenttaxpayers.
The New York City School Tax CreditisarefundabletaxcreditforNewYorkCityresidentsiftheamountismorethantheNewYorkCityincometaxowed.Thecreditisupto$290fortaxpayerswhoaremarriedfilingjointlyorisaqualifyingwidowerwithadependentchildandisupto$145forallothertaxpayers.
ENDNOTES FOR APPENDIx Aa.U.S.HousingandUrbanDevelopment.(2007).FairMarketRents. Fair market rents for the Section 8 housing assistance payments program.RetrievedOctober22,2009,fromhttp://www.huduser.org/datasets/fmr/fmrover_071707R2.doc.
b.AlmanacofPolicyIssues.(2000).Child care.(Excerptedfromthe2000HouseWaysandMeansGreenBook.)RetrievedOctober22,2009,fromhttp://www.policyalmanac.org/social_welfare/archive/child_care.shtml.
c.NewYorkStateOfficeofChildrenandFamilyServices,DivisionofChildCareServices.(2009).InformationalLetter.
46 — tHE SELF-SUFFICIENCY STANDARD FOR NEW YORK STATE tHE SELF-SUFFICIENCY STANDARD FOR NEW YORK STATE — 47
Transmittal09-OCFS-INF-05.Child care market rates advance notification: Child care market rates (EffectiveOctober1,2009-2011).RetrievedJanuary19,2010,fromhttp://www.ocfs.state.ny.us/main/policies/external/ocfs_2009/infs/09-ocfs-inf-05%20child%20care%20market%20rates%20advance%20notification.pdf.
d.Capizzano,J.,Adams,G.,&Sonenstein,F.(2000). Child Care arrangements for child under five: Variation across states.Newfederalism:NationalSurveyofAmerica’sFamilies.(SeriesB,No.B-7).WashingtonD.C.:TheUrbanInstitute;UrbanInstitutecalculationsfromthe1999NationalSurveyofAmerica’sFamiliesfromhttp://www.urban.org/UploadedPDF/anf_b7.pdf.Capizzanonotesina2003reportanalyzingupdatedNSAFdata“…thereseemstohavebeenlittlechangeinthedistributionofchildcarearrangementsamongbothlow-andhigher-incomefamiliesfrom1999to2002.”Capizzano,J.&Adams,G.(2003).Children in low-income families are less likely to be in center-based child care.WashingtonD.C.:TheUrbanInstitute.Retrievedfromhttp://www.urban.org/publications/310923.html.
e.Ibid.
f.Ibid.
g.FoodResearchandActionCenter. Federal food programs.RetrievedFebruary15,2006,fromhttp://www.frac.org/html/federal_food_programs/programs/fsp_faq.html.
h.U.S.DepartmentofLabor,BureauofLaborStatistics.(2009).EconomicNewsRelease.Consumer expenditures 2008.RetrievedOctober22,2009,fromhttp://www.bls.gov/news.release/cesan.nr0.htm.
i.CouncilforCommunityandEconomicResearch.ACCRACostofLivingIndex.Grocery Items. First, second, and third quarter average, 2007.RetrievedJanuary30,2008,fromhttp://www.c2er.org.
j.Porter,C.&Deakin,E.(1995). Socioeconomic and journey-to-work data: A compendium for the 35 largest U.S. metropolitan areas.Berkeley,CA:InstituteofUrbanandRegionalDevelopment,UniversityofCalifornia.
k.U.S.CensusBureau.(2010).2006-2008AmericanCommunitySurvey3-YearEstimates.B08101.Means of transportation to work by age-universe: Workers 16 years and over.RetrievedJanuary21,2010,fromhttp://www.factfinder.census.gov.
l.TheHenryJ.KaiserFoundationStateHealthFactsOnline.(2009).HealthCoverageandtheUninsured.Nonelderly with employers coverage, rate by employment status (2007-2008).RetrievedJanuary19,2010,fromhttp://statehealthfacts.org/profileind.jsp?ind=150&cat=3&rgn=34.
m.U.S.DepartmentofHealthandHumanServices.AgencyforHealthcareResearchandQuality.Medicalexpenditurepanelsurvey(2006).Tables II.C.3 and II.D.3: Average total employee contribution (percent) per enrolled employee for single/family coverage at private-sector establishments that offer health insurance by firm size and state.RetrievedonJanuary19,2010,fromhttp://www.meps.ahrq.gov/mepsweb/data_stats/quick_tables_results.jsp?component=2&subcomponent=2&year=2006&tableSeries=2&tableSubSeries=CDE&searchText=&searchMethod=1&Action=Search.
n.U.S.DepartmentofHealthandHumanServices.AgencyforHealthcareResearchandQuality.Medicalexpenditurepanelsurvey(2006).Tables II.C.2 and II.D.2: Average total employee contribution (in dollars) per enrolled employee for single/family coverage at private-sector establishments that offer health insurance by firm size and state.RetrievedonJanuary19,2010,fromhttp://www.meps.ahrq.gov/mepsweb/data_stats/quick_tables_results.jsp?component=2&subcomponent=2&year=2006&tableSeries=2&tableSubSeries=CDE&searchText=&searchMethod=1&Action=Search.
o.NewYorkStateDepartmentofInsurance.(2009).Healthy NY. HMO rates by county for the Healthy NY product as of January 1, 2009.RetrievedSeptember17,2009,fromhttp://www.ins.state.ny.us/website2/hny/english/hnyr.htm.
p.FamiliesUSA.(2009).Premiums versus paychecks, by state, 2000-2009.RetrievedOctober22,2009,fromhttp://www.familiesusa.org/assets/pdfs/premium-increases-2000-to-2009.pdf.
q.Citro,C.&Michael,R.Eds.(1995).Measuring poverty: A new approach.Washington,D.C.:NationalAcademyPress.RetrievedOctober12,2005,fromhttp://www.census.gov/hhes/poverty/povmeas/toc.htm.
r.NewYorkStateDepartmentofTaxationandFinance.(2010).IncomeTaxFullYearResidentForms(CurrentYear).Combined instructions for forms IT-150 and IT-201.RetrievedJanuary25,2010,fromhttp://www.tax.state.ny.us/forms/income_fullyear_forms.htm.
s.NewYorkStateDepartmentofTaxationandFinance.(2009).New York sales and use tax rates by jurisdiction, effective September 1, 2009.PUB-718.RetrievedJanuary25,2010,fromhttp://www.tax.state.ny.us/pubs_and_bulls/publications/sales_pubs.htm;NewYorkStateDepartmentofTaxationandFinance.(2009).Important Notice. Sales tax law changes in New York City-effective August 1, 2009.RetrievedSeptember22,2009,fromhttp://www.tax.state.ny.us/pdf/notices/n09_12.pdf;andNewYorkStateDepartmentofTaxationandFinance.Local sales and use tax rates on clothing and footwear.RetrievedSeptember22,2009,fromhttp://www.tax.state.ny.us/pdf/publications/sales/pub718c_808.pdf.
t.AmericanRecoveryandReinvestmentAct(ARRA).(2009).ChangestotaxcreditsduetoARRAareonlyeffectivethroughthe2010taxyear.Followingarethechangesthatareincorporatedintothecalculationsforthe2010NewYorkStandard.TheMakingWorkPayTaxCreditisarefundablecreditofupto$400forworkingindividualsand$800forworkingmarriedcouples.ThemaximumEarnedIncomeTaxCreditfortaxpayerswiththreeormorequalifyingchildrenisincreasedto$5,657peryearduetoARRA.TheminimumearnedincomeamountusedtocalculatetheadditionalChildTaxCredithasreducedfrom$12,550to$3,000duetoARRA.Benefits and tax credits.RetrievedMay3,2010,fromhttp://www.recovery.gov/FAQ/Pages/benefits.aspx.
DATA SOURCES
HOUSING
Housing Cost:U.S.DepartmentofHousingandUrbanDevelopment.(2010).Schedule B: FY 2010 final fair market
48 — tHE SELF-SUFFICIENCY STANDARD FOR NEW YORK STATE tHE SELF-SUFFICIENCY STANDARD FOR NEW YORK STATE — 49
rents for existing housing.RetrievedJanuary19,2010,fromhttp://www.huduser.org/datasets/fmr.html.
County-Level Housing Costs:U.S.CensusBureau.(2010).AmericanFactfinder.2006-2008AmericanCommunitySurvey3-YearEstimates.DetailedTables.B25064 median gross rent.RetrievedJanuary19,2010,fromhttp://factfinder.census.gov.
Manhattan Housing Costs: U.S.CensusBureau,HousingandHouseholdEconomicStatisticsDivision.(2009).New York City housing and vacancy survey 2008.RetrievedOctober6,2009,fromhttp://www.census.gov/hhes/www/housing/nychvs/nychvs.html.
CHILD CARE
Child Care Costs:NewYorkStateOfficeofChildrenandFamilyServices,DivisionofChildCareServices.(2009).InformationalLetter.Transmittal09-OCFS-INF-05.Child care market rates advance notification: Child care market rates.RetrievedJanuary19,2010,fromhttp://www.ocfs.state.ny.us/main/policies/external/ocfs_2009/infs/09-ocfs-inf-05%20child%20care%20market%20rates%20advance%20notification.pdf.
FOOD
Food Costs: U.S.DepartmentofAgriculture,CenterforNutritionPolicyandPromotion.(2009).Official USDA food plans: cost of food at home at four levels, U.S. average, June 2009.RetrievedSeptember23,2009,fromhttp://www.cnpp.usda.gov/Publications/FoodPlans/2009/CostofFoodJun09.pdf.
County-Level Food Costs: CouncilforCommunityandEconomicResearch.(2008).ACCRA.ACCRA Cost of living index. First, second, and third quarter average, 2007. RetrievedJanuary30,2008,fromhttp://www.c2er.org.
PUBLIC TRANSPORTATION
Public Transportation Use:U.S.CensusBureau.(2009).2006-2008AmericanCommunitySurvey3-YearEstimates.B08101.Means of transportation to work by age-universe: Workers 16 years and over.RetrievedJanuary21,2010,fromhttp://www.factfinder.census.gov.
New York City:MetropolitanTransitAuthority.(2009).NewYorkCityTransit.Faresandmetrocard.Monthly
unlimited metrocard.RetrievedSeptember16,2009,fromhttp://www.mta.info/metrocard/mcgtreng.htm#unlimited.
Nassau County: MetropolitanTransitAuthority.(2010).LongIslandRailRoad.Monthly pass for travel between Hemstead or Mineola and Penn Station.RetrievedJanuary21,2010,fromhttp://mta.info/lirr/.
Rockland County:TransportationofRockland.(2010).PublicTransportation.Fares.Supersavor tickets for travel to and from work and weekly shopping/errands.RetrievedJanuary21,2010,fromhttp://www.co.rockland.ny.us/PublicTrans/index.htm.
Tompkins County: TompkinsConsolidatedAreaTransit,Inc.(2010).FaresandPassOptions.Monthly pass.RetrievedJanuary21,2010,fromhttp://www.tcatbus.com/content/view/fare-pass-options.html.
Westchester County: MetropolitanTransitAuthority.(2010).Metro-NorthRailRoad.Monthly pass for travel between Peekskill and Yonkers on the Hudson Line.RetrievedJanuary21,2010,fromhttp://mta.info/mnr/.
PriVate transPortation
Auto Insurance Premium:NationalAssociationofInsuranceCommissioners.(2009).Average expenditures for auto insurance by state, 2006.RetrievedJanuary13,2009,fromInsuranceInformationInstituteathttp://www.iii.org/media/facts/statsbyissue/auto.
Auto Insurance Company Market Share:NewYorkStateInsuranceDepartment.(2009).2009 annual ranking of automobile insurance complaints.RetrievedJanuary25,2010,fromhttp://www.ins.state.ny.us/arkidx.htm.
County-Level Insurance Premium:NewYorkStateInsuranceDepartment.(2009).Automobile Insurance Information For Consumers. Appendix 1: Auto insurance price comparison tables in New York State as of July 1, 2009.RetrievedJanuary25,2010,fromhttp://www.ins.state.ny.us/cauto.htm.
Distance to Work:U.S.DepartmentofTransportation.(2009).NationalHouseholdTransportationSurvey.Online analysis tools.RetrievedJanuary21,2010,fromhttp://nths.ornl.gov.

48 — tHE SELF-SUFFICIENCY STANDARD FOR NEW YORK STATE tHE SELF-SUFFICIENCY STANDARD FOR NEW YORK STATE — 49
Fixed Auto Costs:CalculatedandadjustedforregionusingBureauofLaborStatisticsdataqueryfortheConsumerExpenditureSurvey.U.S.BureauofLaborStatistics.(2009).Consumer expenditure survey 2008.RetrievedOctober6,2010,fromhttp://www.bls.gov/data.
Inflation:U.S.DepartmentofLabor,BureauofLaborStatistics.(2009).Consumer price index – all urban consumers, U.S. city average.Retrievedfromhttp://www.bls.gov/cpi/home.htm.
Per Mile Costs:AmericanAutomobileAssociation(2009).Your driving costs: 2009.AAAAssociationCommunication.RetrievedApril20,2009,fromhttp://www.aaanewsroom.net/Assets/Files/20093271039350.DrivingCosts2009.pdf.
HEALTH CARE
Inflation: U.S.DepartmentofLabor,BureauofLaborStatistics.Consumer price index – all urban consumers, U.S. city average.Medicalcareservices(forpremiums)andmedicalservices(forout-of-pocketcosts).Retrievedfromhttp://www.bls.gov/cpi/home.htm.
Out-of-Pocket Costs: U.S.DepartmentofHealthandHumanServices,AgencyforHealthcareResearchandQuality,CenterforFinancing,Access,andCostTrends.(2009).Medical expenditure panel survey-household component analytical tool (2006). Total amount paid by self/family, all types of service.RetrievedSeptember23,2009,fromhttp://www.meps.ahrq.gov/mepsweb/data_stats/MEPSnetHC.jsp.
New York State Premiums: U.S.DepartmentofHealthandHumanServices,AgencyforHealthcareResearchandQuality,CenterforFinancing,Access,andCostTrends.(2009).Medicalexpenditurepanelsurvey-insurancecomponent(2006).Tables II.C.2 and II.D.2: Average total employee contribution (in dollars) per enrolled employee for single/family coverage at private-sector establishments that offer health insurance by firm size and state.RetrievedSeptember17,2009,fromhttp://www.meps.ahrq.gov/mepsweb/data_stats/summ_tables/insr/state/series_2/2006/tiic2.pdf.
County Level Premium Costs:NewYorkStateDepartmentofInsurance.(2009).HealthyNY.HMO rates by county for the Healthy NY product as of January 1, 2009.Retrieved
September17,2009,fromhttp://www.ins.state.ny.us/website2/hny/english/hnyr.htm.
TAxES
Federal Income Tax:InternalRevenueService.(2009). 1040 Instructions 2008.RetrievedMay29,2009,fromhttp://www.irs.gov/pub/irs-pdf/i1040gi.pdf.InternalRevenueService.(2009).Publications.Indexofpub/irs-pub/.Revised procedures 2008-66. Section 3. 2009 adjusted items.RetrievedMay29,2009,fromwww.irs.gov/pub/irs-drop/rp-08-66.pdf.
State Income Tax: NewYorkStateDepartmentofTaxationandFinance.(2009).IncomeTaxFullYearResidentForms(CurrentYear).Combined instructions for forms IT-150 and IT-201.RetrievedSeptember16,2009,fromhttp://www.tax.state.ny.us/forms/income_fullyear_forms.htm.
State and Local Sales and Use Tax: NewYorkStateDepartmentofTaxationandFinance.(2009).ImportantNotice.Sales tax law changes in New York City-effective August 1, 2009.RetrievedSeptember22,2009,fromhttp://www.tax.state.ny.us/pdf/notices/n09_12.pdf.New York sales and use tax rates by jurisdiction.RetrievedSeptember22,2009,fromhttp://www.tax.state.ny.us/pdf/publications/sales/pub718_808.pdf.Local sales and use tax rates on clothing and footwear.RetrievedSeptember22,2009,fromhttp://www.tax.state.ny.us/pdf/publications/sales/pub718c_808.pdf.
FEDERAL TAx CREDITS
Federal Child Care Tax Credit:InternalRevenueService.(2009).Publication503.Child and dependent care expenses.RetrievedMay29,2009,fromhttp://www.irs.gov/pub/irs-pdf/p503.pdf.
Federal Child Tax Credit: InternalRevenueService.(2009).Publication972.Child tax credit.RetrievedMay29,2009,fromhttp://www.irs.gov/pub/irs-pdf/p972.pdf.U.S.LibraryofCongress,Thomas.Title V: Additional tax relief and other tax provisions, Sec. 501.$8,500incomethresholdusedtocalculaterefundableportionofchildtaxcredit.RetrievedOctober23,2008,fromhttp://thomas.loc.gov/.
Federal Earned Income Tax Credit:InternalRevenueService.(2009).EITC for individuals.RetrievedMay29,2009,fromhttp://www.irs.gov/individuals/
50 — tHE SELF-SUFFICIENCY STANDARD FOR NEW YORK STATE
article/0,id=150557,00.html.InternalRevenueService.(2009).Preview 2010 EITC income limits, maximum EITC amount and the EITC-related tax law changes.RetrievedFebruary17,2010,fromhttp://www.irs.gov/individuals/article/0,,id=215766,00.html.
Federal Making Work Pay Tax Credit:InternalRevenueService.(2009).Making work pay tax credit.RetrievedonFebruary16,2009,fromhttp://www.irs.gov/newsroom/article/0,,id=204447,00.html.SenateFinance,HouseWaysandMeansCommittees.(2009).The American Recovery and Reinvestment Act of 2009: Full summary of provisions from senate finance, house ways and means committees.RetrievedFebruary16,2009,fromhttp://finance.senate.gov/press/Bpress/2009press/prb021209.pdf.
Federal Tax Credits (General): InternalRevenueService.(2009).1040 instructions 2009.RetrievedOctober22,2009,fromhttp://www.irs.gov/pub/irs-pdf/i1040gi.pdf.
STATE AND LOCAL TAx CREDITS
Empire State Child Tax Credit: NewYorkStateDepartmentofTaxationandFinance.(2009).Empire state child credit.RetrievedSeptember16,2009,fromhttp://www.tax.state.ny.us/pit/income_tax/empire_state_child_credit.htm.
New York City and State Child Care Tax Credit:NewYorkStateDepartmentofTaxationandFinance.(2009).CreditClaimForms(CurrentYear).InstructionsforFormIT-216.Claim for Child and Dependent Care Credit.RetrievedSeptember16,2009,fromhttp://www.tax.state.ny.us/pdf/2008/inc/it216i_2008.pdf.
New York City and State Earned Income Tax Credit: NewYorkStateDepartmentofTaxationandFinance.(2009).InstructionsforFormIT-215.Claim for earned income credit.RetrievedSeptember16,2009,fromhttp://nystax.gov/pdf/2008/inc/it215i_2008.pdf.
New York City and State Household Credit:NewYorkStateDepartmentofTaxationandFinance.(2009).Household credit.RetrievedSeptember22,2009,fromhttp://www.tax.state.ny.us/pit/income_tax/household_credit.htm;andNewYorkStateDepartmentofTaxationandFinance.(2009).New York City credits.RetrievedSeptember22,2009,fromhttp://www.tax.state.ny.us/pit/income_tax/new_york_city_credits.htm.
New York City School Tax Credit:NewYorkStateDepartmentofTaxationandFinance.(2009).New York City credits.RetrievedSeptember22,2009,fromhttp://www.tax.state.ny.us/pit/income_tax/new_york_city_credits.htm.
tHE SELF-SUFFICIENCY STANDARD FOR NEW YORK STATE — 51
TheStandardisatoolthatcanbeusedacrossawidearrayofsettingstobenchmark,evaluate,educate,andilluminate.Belowweprovidespecificexamplesofsomeoftheseuses—withreferencesandwebsiteaddresses—sothatthereadercanexploretheseusesaswellascontactprogramsandpersonswhohaveappliedtheSelf-SufficiencyStandardintheirwork.
ASSESSMENT OF PUBLIC POLICY OPTIONSThe Self-Sufficiency Standard has been used as a tool to evaluate the impact of current and proposed policy changes.Asinthemodelingtablesinthisreport,theStandardcanbeusedtoevaluatetheimpactofavarietyofworksupports(SNAP/FoodStampProgram,Medicaid)orpolicyoptions(changesinchildcareco-payments,taxreformortaxcredits)onfamilybudgets.
TheSelf-SufficiencyStandardforMassachusettswas• usedintheCrittentonWomen’sUnion2007report,Unlocking the Doors to Higher Education and Training for Massachusetts’ Working Poor Familiestoadvocatefortuition-freecommunitycollegeeducationandotherwaystoaddressfinancialbarrierstoeducationinMassachusetts,citingtheneedforpost-secondaryeducationandtraininginordertoacquireSelf-SufficiencyWagejobs(seehttp://liveworkthrive.org/admin/Editor/assets/WPFR_Report_031108.pdf).
InColorado,theColoradoCenteronLawandPolicy• usedtheColoradoSelf-SufficiencyStandardtodeterminetheimpactofaffordablehousingonfamilystabilityandupwardmobility(seehttp://www.cclponline.org/pubs/SelfSufficiency10-05.pdf).Inaddition,theColoradoDivisionofHousingusedinformationfromtheColoradoSelf-SufficiencyStandardinits2002statewidereportHousing Colorado: The Challenge for a Growing State(seehttp://www.dola.state.co.us/Doh/Documents/HousingColo02.pdf).
InMaryland,AdvocatesforChildrenandYouthused• theSelf-SufficiencyStandardintheirMaryland Can Do Better for Childrencampaign,athree-yearplantoaddresscriticalneedsofchildrenandtheirfamiliesby2010.Duringthe2007specialsessionoftheMarylandGeneral
Assembly,thecampaignutilizedtheSelf-SufficiencyStandardforeachofMaryland’s24jurisdictionstosuccessfullyadvocateforexpandedRefundableEarnedIncomeTaxCreditsforlow-incomefamilies(seehttp://www.acy.org).
InDecember2005,theHumanServicesCoalitionof• DadeCountyinFloridaissuedapolicybrieftitledNonprofits, Government, and the New War on Poverty: Beating the Odds in a Global Economy,whichusedtheStandardtoexamineFlorida’shumanservicessectorfromaneconomicandcommunityperspective.FormoreinformationontheHumanServicesCoalitionofDadeCounty,seehttp://www.hscdade.org.
InPennsylvania,manygroups,includingPathWaysPA,• haveusedtheSelf-SufficiencyStandardtomodeltheimpactofastateEarnedIncomeTaxCreditontheabilityofafamilytoreachself-sufficientwages(seehttp://www.pathwayspa.org).
WhentheOklahomaDepartmentofHumanServices• proposedlargeincreasesinchildcareco-payments,theOklahomaCommunityActionProject(CAP)ofTulsaCountyusedanalysisbasedontheSelf-SufficiencyStandardintheirreport,Increased Child Care Co-Payments Threaten Access to Care for Low Income Families,resultingintheDepartmentrescindingtheproposedincreases.FormoreinformationabouttheworkoftheCommunityActionProjectofTulsaCounty,seehttp://www.captc.org.
EVALUATION OF ECONOMIC DEVELOPMENT PROPOSALSThe Self-Sufficiency Standard has been used to evaluate state and local level economic development proposals. UsingtheStandardcanhelpdetermineifbusinessesseekingtaxbreaksorothergovernmentsubsidieswill,orwillnot,createjobsthatpay“livingwages.”IfthejobstobecreatedpaywagesthatarebelowtheStandardsothattheemployeeswillneedpublicworksupportstobeabletomeettheirbasicneeds,thenewbusinessisessentiallyseekinga“doublesubsidy.”Economicdevelopmentproposalscanbeevaluatedfortheirnetpositiveornegativeeffectonthe
Appendix B: Examples of How the Standard Has Been Used
52 — tHE SELF-SUFFICIENCY STANDARD FOR NEW YORK STATE tHE SELF-SUFFICIENCY STANDARD FOR NEW YORK STATE — 53
localeconomy,aswellasonthewell-beingofthepotentialworkersandtheirfamilies.
Colorado’sFortCarsonisoneofthefirstmilitarybasesto• considerreviewingitsvendorcontractsusingtheSelf-SufficiencyStandard.Theirsustainabilityplanwouldseekvendorswhopay“livablewages”totheiremployees,asdefinedbytheStandard.
InNebraska,theNebraskaAppleseedCenterhas• developedasetofjobqualitystandardsthatcorporationsshouldfollowpriortoreceivingpublicfunds(seehttp://www.neappleseed.org).
TheDelawareEconomicDevelopmentOfficehasusedthe• DelawareSelf-SufficiencyStandardtoevaluatestrategicfundgrantapplicationsinordertofocusitsresourcesonqualityemploymentgrowth.
TARGETING OF JOB TRAINING RESOURCESThe Self-Sufficiency Standard has been used to target job training resources.Usinga“targetedjobsstrategy,”theStandardhelpstomatchjobseekerswithemploymentthatpaysSelf-SufficiencyWages.Throughanevaluationofthelocallabormarketandavailablejobtrainingandeducationinfrastructure,theskillsandgeographiclocationofcurrentorpotentialworkersareevaluatedandjobseekersarematchedtoemploymentwithfamily-sustainingwages.Throughthisanalysisitispossibletodeterminethejobsandsectorstotargettrainingandeducationresources.
InWashington,D.C.,theStandardwasusedinthe2000• WorkforceInvestmentActstatute,whichrequiresthattheWorkforceInvestmentBoardtargetjob-trainingdollarsin“highgrowth”occupationsandassessthequalityofthejobsinordertomeetthewageandsupportiveserviceneedsofjobseekers.ToseeamoredetaileddescriptionoftheDistrictofColumbia’sWorkforceInvestmentActgotohttp://www.does.dc.gov/does/cwp/view,a,1233,q,538394.asp.
EVALUATION OF EMPLOYMENT PROGRAM OUTCOMESThe Self-Sufficiency Standard can be used to evaluate outcomes for clients in a range of employment programs,fromshort-termjobsearchandplacementprogramstoprogramsprovidingextensiveeducationorjobtraining.
ByevaluatingwageoutcomesintermsoftheStandard,programsareusingameasureoftrueeffectiveness.Suchevaluationscanhelpredirectresourcestoapproachesthatresultinimprovedoutcomesforparticipants.
InWashingtonState,theWorkforceDevelopment• CouncilofSeattle-KingCountyadoptedtheSelf-SufficiencyStandardasitsofficialmeasureofself-sufficiencyandusestheStandardasaprogramevaluationbenchmark.UsingdatacollectedbycaseworkersandtheonlineSelf-SufficiencyCalculator,theCouncildemonstratestheimpactofitseducationandtrainingprogramsontheachievementofself-sufficiencybyitsparticipants.FormoreinformationontheSeattle-KingCountyWorkforceDevelopmentCouncil,seehttp://www.seakingwdc.org.
UnderitsWorkforceInvestmentAct,theChicago• WorkforceInvestmentBoardadoptedtheSelf-SufficiencyStandardasitsself-sufficiencybenchmark.FormoreinformationonChicago’sWorkforceInvestmentAct,seehttp://www.cityofchicago.org.
TheColoradoCenteronLawandPolicysuccessfully• lobbiedtheEasternRegionWorkforceBoardinFortMorgan,ColoradotoofficiallyadopttheSelf-SufficiencyStandardtodetermineeligibilityforintensivetrainingservices(seehttp://www.cclponline.org/pubs/SelfSufficiency10-05.pdf).
TARGETING EDUCATION RESOURCESThe Self-Sufficiency Standard helps demonstrate the “pay off” for investing in education and training suchaspost-secondaryeducationandtraining,includingtrainingforoccupationsthatarenontraditionalforwomenandpeopleofcolor.
Forexample,theMissouriWomen’sCouncilofthe• DepartmentofEconomicDevelopmentusedtheStandardtobeginaprogramforlow-incomewomenthatpromotesnontraditionalcareerdevelopment,leadingtojobspayingSelf-SufficiencyWages.FormoreinformationontheMissouriWomen’sCouncilseehttp://www.womenscouncil.org/about_WC.htm.
InCalifornia’sSantaClaraCounty,theSelf-Sufficiency• Standardwasusedinasectoralemploymentintervention

52 — tHE SELF-SUFFICIENCY STANDARD FOR NEW YORK STATE tHE SELF-SUFFICIENCY STANDARD FOR NEW YORK STATE — 53
analysisthatfocusedontheavailabilityofnontraditionaljobs,thegeographicalspreadofthosejobs,theavailabilityoftrainingresources,andwagerates.Theanalysisledtoacurriculumandcounselortrainingpackagethattargetedtransportationjobsandprovided$140,000tothecommunitycollegesystemtoexplorehowtostrengthenpreparationforthesejobs(seehttp://www.insightcced.org).
FollowingthereleaseoftheCrittentonWomen’sUnion• (CWU)2005reportAchieving Success in the New Economy: Which Jobs Help Women Reach Economic Self Sufficiency,CWUhasestablishedanonlineHotJobsforWomenguide.UsingtheSelf-SufficiencyStandardforMassachusetts,theonlineguideassistswomeninidentifyingjobsinhighdemandthatpaySelf-SufficiencyWages,yetrequiretwoyearsorlessinfull-timeeducationortraining(seehttp://www.liveworkthrive.org/hotjobs.php).
InNorthCarolina,theWilfordCountyworking• groupfortheNCStateprojectdevelopedaTargeting Higher-Wage JobsResource Guide forsocialservicescaseworkers.Theprojectpresentedlegislativetestimonyandmadepresentationsatconferencesandtrainings(seehttp://www.sixstrategies.org/states/statewhatdone.cfm?strStateProject=NC).
InConnecticut,theSelf-SufficiencyStandardhasbeen• adoptedatthestatelevelsince1998.Ithasbeenusedinplanningstate-supportedjobtraining,placementandemploymentretentionprograms,andhasbeendistributedtoallstateagenciesthatcounselindividualsseekingeducation,training,oremployment.Connecticut’sPermanentCommissionontheStatusofWomenregularlyusestheSelf-SufficiencyStandardinlegislativetestimony(seehttp://www.cga.ct.gov/PCSW).
InNewYork,theStandardhasbeenusedindeveloping• servicesforyoungadultsincareereducationtodemonstratehowtheirfuturecareerchoicesandeducationalpathsmightimpacttheirabilitytosupportafuturefamilyortoaddressfamilydynamics.TheStandardhasalsobeenusedinNewYorkforjobreadinessplanningforwomenseekingskilledemployment.
InDelaware,theStandardwasusedtotrainpeoplefrom• thedevelopmentaldisabilitycommunityonhowtoretaintheirbenefitswhenreturningtotheworkforce.
DETERMINATION OF NEED FOR SERVICES The Self-Sufficiency Standard has been used to determine which individuals are eligible and/or most in need of specific support or training services.
Forexample,inVirginia,VoicesforVirginia’sChildren• successfullyadvocatedforthestate’sTANFAuthorizationCommitteetousetheVirginiaSelf-SufficiencyStandardasatoolforsettingeligibilityguidelines.FormoreinformationontheprogramsofVoicesforVirginia’sChildrengotohttp://www.vakids.org/work/fes.htm
TheConnecticutLegislatureenactedastatestatutethat• identified“theunder-employedworker”asanindividualwithouttheskillsnecessarytoearnawageequaltotheSelf-SufficiencyStandard.Thestatutedirectedstatewideworkforceplanningboardstorecommendfundingtoassistsuchworkers(seehttp://www.larcc.org/documents/mapping_change_2002.pdf).
TheDirectorofHumanResourcesandHumanServices• forNevadaincorporatedtheNevadaSelf-SufficiencyStandardintoNevada’s2005needsprojections.Additionally,theDirectorusedtheStandardintherecommendationsrelatedtocaseloads.
COUNSELING TOOL FOR PARTICIPANTS IN WORK & TRAINING PROGRAMSThe Self-Sufficiency Standard has been used as a counseling tool to help participants in work and training programs access benefits and develop strategies to become self-sufficient.Computer-basedcounselingtoolsallowuserstoevaluatepossiblewages,thencompareinformationonavailableprogramsandworksupportstotheirowncostsandneeds.Computer-basedSelf-SufficiencyCalculators,forusebycounselorswithclientsandthepublic,havebeendevelopedfortheBayAreainCalifornia,Colorado,theDistrictofColumbia,Illinois,NewYorkCity,Oregon,Pennsylvania,andWashingtonState.Thesetoolsintegrateawidevarietyofdatanotusuallybroughttogether,allowingclientstoaccessinformationaboutthebenefitsofvariousprogramsandworksupportsthatcanmovethemtowards

54 — tHE SELF-SUFFICIENCY STANDARD FOR NEW YORK STATE tHE SELF-SUFFICIENCY STANDARD FOR NEW YORK STATE — 55
self-sufficiency.Throughonlinecalculators,clientsareempoweredwithinformationandtoolsthatallowthemtodevelopandtestouttheirownstrategiesforachievingself-sufficientincomes.
Forexample,inPennsylvania,PathWaysPAoffersT• he Online Training and Benefits Eligibility Tool,aninteractivecareer-counselingtoolbasedonthe2008PennsylvaniaSelf-SufficiencyStandard.Theonlinecounselingtoolcanbeusedbycounselorsandclientsto“test”theabilityofvariouswagestomeetafamily’sself-sufficiencyneeds,aswellaswhattrainingprogramstheymightbeeligibleforattheircurrentwage.Thistoolalsoallowsclientstoapplyforbenefitsimmediatelyorforcounselorstodosoonaclient’sbehalf.The Pennsylvania Online Training and Benefits Eligibility Toolcanbefoundathttp://www.pathwayspa.org.
TheDenverCountyOfficeofEconomicDevelopment,• DivisionofWorkforceDevelopmentusestheSelf-SufficiencyStandardaswellastheColoradoEconomicSelf-SufficiencyStandardCalculatortoinformparticipantsaboutthecareerchoicesthatwillmovethemtowardseconomicself-sufficiency.TheWorkplaceCenterattheCommunityCollegeofDenverutilizestheColoradoEconomicSelf-SufficiencyStandardCalculatortocounselparticipantsoncareerchoices,realwagedeterminationandavoidingpotentialobstaclestoeconomicself-sufficiencysuchasthesystemic“cliffeffect”builtintomanyworksupportprograms.TheColoradoCenteronLawandPolicyhoststheColoradoSelf-SufficiencyCalculatorathttp://www.Coloradoselfsufficiencystandardcalculator.org.
InWashingtonState,astatewideSelf-Sufficiency• Calculatorisusedacrossworkforcecouncilsasacounselingtoolandcanbeviewedathttp://www.thecalculator.org.Additionally,theSnohomishWorkforceDevelopmentCouncilinWashingtonhasdevelopedaself-sufficiencymatrixthatisusedincasemanagement.Theself-sufficiencymatrixcanbeusedasacasemanagementtool,aself-assessmenttool,ameasurementtool,andacommunicationtool.Thematrixiscomposedof25keyoutcomescales(e.g.,employmentstability,education,Englishlanguageskills,lifeskills,andchildcare).Thescalesarebasedonacontinuumof“incrisis”to“thriving.”Thecasemanagerworkswith
thecustomertoscorethescalesandmonitorprogress.Tolearnmoreaboutthematrix,pleasevisithttp://www.worksourceonline.com/js/documents/Instructions.pdf.
VirginiaKidsdeveloped• The Self-Sufficiency Standard for Virginia – Budget Worksheet Exerciseasacounselingtool(seehttp://www.vakids.org/Publications/budget_exercise.htm).
WomenWork!(NationalNetworkforWomen’s• Employment)usedtheStandardasacareer-counselingtoolinSouthDakota.FormoreinformationonWomenWork!,seehttp://www.womenwork.org.
IntheD.C.MetropolitanArea,WiderOpportunitiesfor• WomendevelopedandpilotedaTeenCurriculumbasedontheStandardthateducatesadolescentsaboutcareerchoices,lifedecisions,andself-sufficiency(seehttp://www.sixstrategies.org).Additionally,theWashington,D.C.MetroAreaSelf-SufficiencyCalculatorcanbefoundathttp://www.dcmassc.org.
InNewYorktheWomen’sCenterforEducationand• CareerAdvancementhasusedtheStandardtotraincounselorstobettercommunicateideasaboutSelf-Sufficiencyandeconomicissueswiththeirclientsandassessbenefiteligibility.TheWomen’sCenterforEducationandCareerAdvancementalsohostsanonlineSelf-SufficiencyCalculatorfortheCityofNewYork.TheCalculatorfortheCityofNewYorkcanbeaccessedathttp://www.wceca.org/index.html.
TheOregon• Prosperity Planner,acalculatorbasedonthe2008OregonSelf-SufficiencyStandard,canbefoundathttp://www.prosperityplanner.org.
TheChicago,IllinoisMayor’sOfficeofWorkforce• DevelopmenthoststheIllinoisSelf-SufficiencyCalculatorathttp://www.ides.state.il.us/calculator/default.asp.
TheBayAreaSelf-SufficiencyCalculatorinCalifornia• canbefoundathttp://www.insightcced.org/index.php/insight-communities/cfess/calculator.
PUBLIC EDUCATIONThe Self-Sufficiency Standard has been used as a public education tool. Asaneducationtool,theStandard:helpsthepublicatlargeunderstandwhatisinvolvedinmaking
54 — tHE SELF-SUFFICIENCY STANDARD FOR NEW YORK STATE tHE SELF-SUFFICIENCY STANDARD FOR NEW YORK STATE — 55
thetransitiontoself-sufficiency;showsemployerstheimportanceofprovidingbenefits,especiallyhealthcare,whichhelpfamiliesmeettheirneeds;and,demonstratestoserviceprovidershowvarioussocialservicecomponentsfittogether,facilitatingthecoordinationofarangeofservicesandsupports.Forpolicymakersandlegislators,theStandardshowsboththeneedforandimpactofworksupportprogramsonlow-wageworkers’familybudgets.
Forexample,VoicesforUtahChildrendistributed• copiesoftheUtahSelf-SufficiencyStandardtostatelegislatorsandcandidatesduringthe2003legislativesessiontoframeadiscussionaboutincreasingfundingforUtah’sChildren’sHealthInsuranceProgram.FormoreinformationonVoicesforUtahChildrengotohttp://www.utahchildren.org.
InSeattle,bookmarksweredistributedduringtherunof• aplaybasedonNickel and Dimed: On (Not) Getting By in America,abookbyBarbaraEhrenreichthatexploresthestrugglesconfrontedbylow-wageworkers.AcomputerwithamockwebsiteallowedparticipantstoentertheirincomesandcomparethemtotheStandardandbegintounderstandtheplightofworkingfamilies.
MassFESS(hostedbytheCrittentonWomen’sUnion)• developedanEconomicSelf-SufficiencyStandardCurriculumthatcanbeusedbyorganizationstosupporttheirworkincareerdevelopment,education/training,economicliteracy,livingwagecampaigns,andothertypesofcommunityorganizing,policymakingandadvocacyefforts.ForinformationontheCrittentonWomen’sUnion,seehttp://www.liveworkthrive.org.
InaninitiativestartedattheUniversityofWashington• SchoolofSocialWork,policymakersparticipateinthe“Walk-A-Mile”program,wherethey“walk”intheshoesofwelfarerecipientsbylivingonaSNAPbudgetforonemonth.TheWashingtonStandardwasusedtodevelopeducationaltoolsusedbypolicymakersabouttheimpactofbenefitsonfamilybudgets.
TheWisconsinWomen’sNetworkdistributedthe• WisconsinSelf-SufficiencyStandardtoitsmanyandvariedwomen’scoalitionmembers,manyofwhomcontinuetofindausefortheStandardintheiradvocacywork.TheWisconsinWomen’sNetworkwebsitecanbeaccessedathttp://www.wiwomensnetwork.org.
CREATING GUIDELINES FOR WAGE-SETTINGThe Self-Sufficiency Standard has been used as a guideline for wage-setting.Bydeterminingthewagesnecessarytomeetbasicneeds,theStandardprovidesinformationforsettingwagestandards.
Forexample,VanderbiltUniversityinTennesseeusesthe• Standardtoeducateemployeesandadministratorsabouttheneedtoincreasethetake-homepayofservicestaff.Formoreinformationgotohttp://studentorgs.vanderbilt.edu/students4livingwage/info.php.
Employersandeducationalinstitutionshaveusedthe• Self-SufficiencyStandardtosetorganizationalwagestandardsinColorado.TheintroductionoftheSelf-SufficiencyStandardinPitkinCounty,Coloradohasencouragedcountycommissionersanddirectorstoreviewcurrentpayscalesandworksupportpolicies.
TheStandardhasbeenusedinCalifornia,Hawaii,• Illinois,Nebraska,NewJersey,NewYork,SouthDakota,Tennessee,Virginia,andWashingtonStatetoadvocateforhigherwagesthroughLivingWageordinancesandinnegotiatinglaborunionagreements(seehttp://www.ncsl.org/programs/employ/livingwage2005.htm).
AttherequestofthestateofCalifornia,theCenterforthe• ChildCareWorkforceusedtheSelf-SufficiencyStandardin2002todevelopspecificsalaryguidelinesbycounty(seehttp://www.ccw.org/data.html).
InMaryland,theCenterforPovertySolutionsand• AdvocatesforChildrenandYouth(amongotherorganizations)proposedstatelegislationthatwouldrequiretheMarylandSecretaryofBudgetandManagementtoconsideraspecifiedSelf-SufficiencyStandardwhensettingoramendingapayrateandrequirethatastateemployeewhosepayrateislessthantheSelf-SufficiencyStandardreceiveaspecifiedpayincrease.FormoreinformationonAdvocatesforChildrenandYouth,seehttp://www.acy.org.
InCalifornia,theNationalEconomicDevelopmentand• LawCenter(nowtheInsightCenterforCommunityEconomicDevelopment,orInsightCCED)usedtheSelf-SufficiencyStandardinawageanalysisofUniversityofCaliforniaserviceworkers,entitledHigh Ideals, Low Pay.TheStandardwasusedtoassessthedegreeto
56 — tHE SELF-SUFFICIENCY STANDARD FOR NEW YORK STATE
whichUniversityofCaliforniaserviceworkers’wagesaresufficienttoprovidethebasicneedsforemployeesandtheirfamilies.InsightCCEDrecommendstheUniversityofCaliforniaconsiderusingtheStandardtodetermineandadoptlivingwagepolicies(seehttp://www.insightcced.org).
TheSelf-SufficiencyStandardwasanintegraltoolfor• increasingHawaii’sminimumwageto$6.75onJanuary1,2006and$7.25onJanuary1,2007.
GeorgetownUniversitystudentsendedaninedayhunger• strikewhentheUniversityadministrationagreedtoimprovewagesforthelow-paidcustodial,foodservice,andsecurityworkers.ThestudentgrouputilizedtheSelf-SufficiencyStandardfortheDistrictofColumbiaintheircampaignadvocacy.Thenegotiatedagreementincludedraisingtheminimumhourlywageto$13beginningJuly2006andannualwageadjustmentsbasedontheConsumerPriceIndex.
SUPPORTING RESEARCHBecause the Self-Sufficiency Standard provides an accurate and specific measure of income adequacy, it is frequently used in research.TheStandardprovidesameansofestimatinghowpovertydiffersfromplacetoplaceandamongdifferentfamilytypes.TheStandardalsoprovidesameanstomeasuretheadequacyofvariousworksupports,suchaschildsupportorchildcareassistance,givenafamily’sincome,placeofresidence,andcomposition.
Forexample,theSelf-SufficiencyStandardhasbeen• usedtoexaminethecostofhealthinsuranceinWashingtonandMassachusetts.Income Adequacy and the Affordability of Health Insurance in Washington StateandtheHealth Economic Sufficiency Standard for Massachusetts usedtheStandardtoexaminethecostofhealthinsurancefordifferentfamilytypes,withvaryinghealthstatusesandhealthcarecoverage,indifferentlocations(seehttp://www.ofm.wa.gov/healthcare/spg/affordability/default.aspandhttp://www.wowonline.org/ourprograms/fess/state-resources/documents/MAHealthEconomicSelf-SufficiencyStandard.pdf).
PathWaysPAcitestheSelf-SufficiencyStandard• frequentlyinitspublications,including Investing in Pennsylvania’s Families: Economic Opportunities for
All,arecentpolicypublicationlookingattheneedsofworkingfamiliesinPennsylvaniaearninglessthan200%oftheFederalPovertyLevel.PathWaysPAalsousestheStandardasameasureagainstwhichtobasetaxcredits,healthcarereform,andotherneeds.
Inseveralstates,theSelf-SufficiencyStandardhasbeen• usedalongwithdatafromtheU.S.CensusBureautomeasurethenumberoffamiliesaboveandbelowtheSelf-SufficiencyStandard,aswellastheircharacteristics(e.g.,race,ethnicity,familytype,education,employment).Findingsfromthesestudiescanbefoundinthefollowingreportsavailableonlineathttp://www.selfsufficiencystandard.org/pubs.html#addpubs:
California: » Overlooked and Undercounted 2009: Struggling to Make Ends Meet in California
Colorado: » Overlooked and Undercounted: Struggling to Make Ends Meet in Colorado
Connecticut: » Overlooked and Undercounted: Where Connecticut Stands
Mississippi: » Overlooked and Undercounted: Struggling to Make Ends Meet in Mississippi
NewJersey: » Not Enough to Live on: Characteristics of Households Beneath the Real Cost of Living
Pennsylvania: » Overlooked and Undercounted: Struggling to Make Ends Meet in Pennsylvania
WashingtonState: » Overlooked and Undercounted: Wages, Work and Poverty in Washington State
Appendix C: The Self-Sufficiency Standard for Select Family Types in New York State

58 — THE SELF-SUFFICIENCY STANDARD FOR NEW YORK STATE THE SELF-SUFFICIENCY STANDARD FOR NEW YORK STATE — 59
Table 1 The Self-Sufficiency Standard for Albany County, NY 2010
MONTHLY COSTS adultadult + Infant
adult + Preschooler
adult + Infant
Preschooler
adult + Preschooler School-age
adult + School-age Teenager
adult + Infant
Preschooler School-age
2 Adults+ Infant
Preschooler
2 Adults + Preschooler School-age
2 Adults + Preschooler School-ageTeenager
Housing 735 897 897 897 897 897 1073 897 897 1073
Child Care 0 872 882 1753 1419 538 2291 1753 1419 1419
food 236 350 358 469 536 622 632 673 737 900
Transportation 263 269 269 269 269 269 269 517 517 517
Health Care 150 364 363 378 388 421 403 451 461 508
Miscellaneous 138 275 277 377 351 275 467 429 403 442
Taxes 318 645 614 946 741 426 1336 1025 819 892
Earned Income Tax Credit (-) 0 0 0 0 0 -64 0 0 0 0
Child Care Tax Credit (-) 0 -53 -53 -100 -100 -58 -100 -100 -100 -100
Child Tax Credit (-) 0 -83 -83 -167 -167 -167 -250 -167 -167 -250
Making Work Pay Credit (-) -33 -33 -33 -33 -33 -33 -33 -67 -67 -67
SELF-SUFFICIENCY WAGE
Hourly $10.26 $19.90 $19.83 $27.21 $24.44 $17.76 $34.59 $15.38 $13.97 $15.16
per adult per adult per adult
MONTHLY $1,806 $3,503 $3,489 $4,789 $4,301 $3,126 $6,088 $5,412 $4,919 $5,335
annual $21,673 $42,031 $41,872 $57,473 $51,617 $37,512 $73,061 $64,946 $59,027 $64,021
Table 2 The Self-Sufficiency Standard for Allegany County, NY 2010
MONTHLY COSTS adultadult + Infant
adult + Preschooler
adult + Infant
Preschooler
adult + Preschooler School-age
adult + School-age Teenager
adult + Infant
Preschooler School-age
2 Adults+ Infant
Preschooler
2 Adults + Preschooler School-age
2 Adults + Preschooler School-ageTeenager
Housing 576 690 690 690 690 690 860 690 690 860
Child Care 0 617 688 1305 1140 452 1757 1305 1140 1140
food 236 350 358 469 536 622 632 673 737 900
Transportation 260 266 266 266 266 266 266 511 511 511
Health Care 144 340 339 355 364 397 380 427 437 485
Miscellaneous 122 226 234 308 300 243 389 361 351 390
Taxes 243 361 376 570 481 190 860 606 519 572
Earned Income Tax Credit (-) 0 -76 -50 0 0 -290 0 0 0 0
Child Care Tax Credit (-) 0 -65 -65 -100 -105 -69 -100 -100 -100 -100
Child Tax Credit (-) 0 -83 -83 -167 -167 -167 -250 -167 -167 -250
Making Work Pay Credit (-) -33 -33 -33 -33 -33 -33 -33 -67 -67 -67
SELF-SUFFICIENCY WAGE
Hourly $8.79 $14.74 $15.46 $20.81 $19.72 $13.08 $27.05 $12.04 $11.51 $12.61
per adult per adult per adult
MONTHLY $1,547 $2,594 $2,720 $3,663 $3,472 $2,301 $4,760 $4,239 $4,051 $4,440
annual $18,561 $31,126 $32,643 $43,960 $41,658 $27,616 $57,125 $50,870 $48,614 $53,275
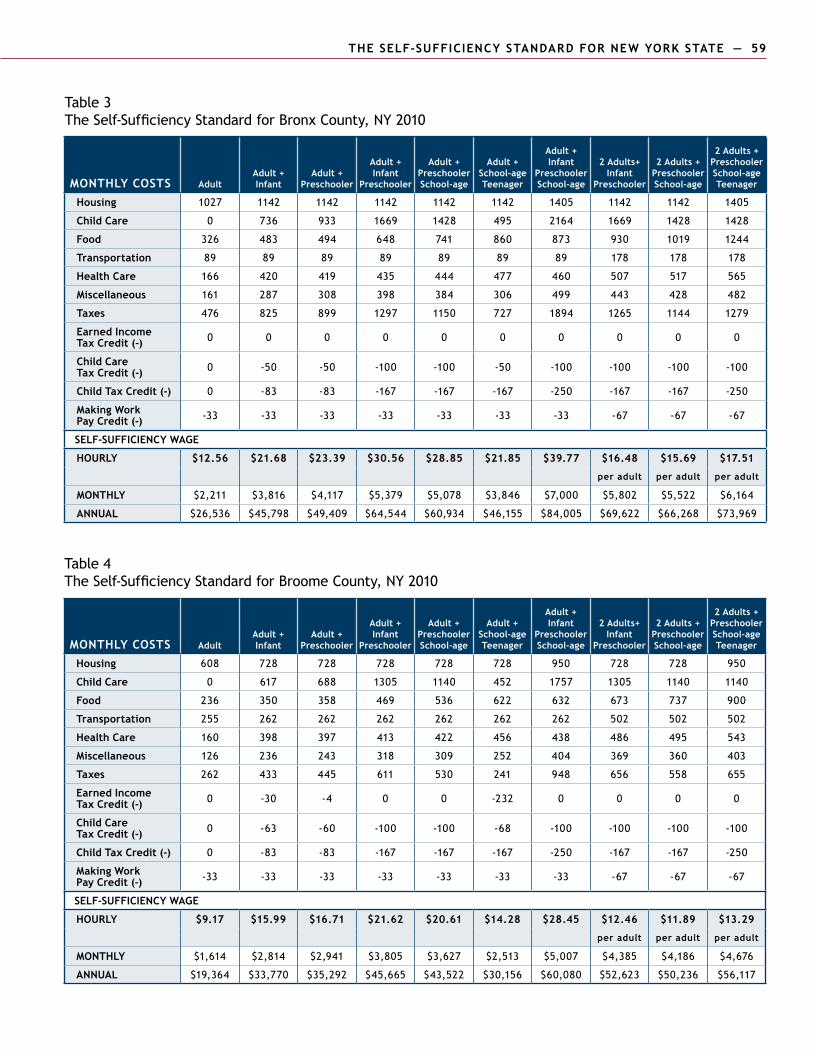
58 — THE SELF-SUFFICIENCY STANDARD FOR NEW YORK STATE THE SELF-SUFFICIENCY STANDARD FOR NEW YORK STATE — 59
Table 3 The Self-Sufficiency Standard for Bronx County, NY 2010
MONTHLY COSTS adultadult + Infant
adult + Preschooler
adult + Infant
Preschooler
adult + Preschooler School-age
adult + School-age Teenager
adult + Infant
Preschooler School-age
2 Adults+ Infant
Preschooler
2 Adults + Preschooler School-age
2 Adults + Preschooler School-ageTeenager
Housing 1027 1142 1142 1142 1142 1142 1405 1142 1142 1405
Child Care 0 736 933 1669 1428 495 2164 1669 1428 1428
food 326 483 494 648 741 860 873 930 1019 1244
Transportation 89 89 89 89 89 89 89 178 178 178
Health Care 166 420 419 435 444 477 460 507 517 565
Miscellaneous 161 287 308 398 384 306 499 443 428 482
Taxes 476 825 899 1297 1150 727 1894 1265 1144 1279
Earned Income Tax Credit (-) 0 0 0 0 0 0 0 0 0 0
Child Care Tax Credit (-) 0 -50 -50 -100 -100 -50 -100 -100 -100 -100
Child Tax Credit (-) 0 -83 -83 -167 -167 -167 -250 -167 -167 -250
Making Work Pay Credit (-) -33 -33 -33 -33 -33 -33 -33 -67 -67 -67
SELF-SUFFICIENCY WAGE
Hourly $12.56 $21.68 $23.39 $30.56 $28.85 $21.85 $39.77 $16.48 $15.69 $17.51
per adult per adult per adult
MONTHLY $2,211 $3,816 $4,117 $5,379 $5,078 $3,846 $7,000 $5,802 $5,522 $6,164
annual $26,536 $45,798 $49,409 $64,544 $60,934 $46,155 $84,005 $69,622 $66,268 $73,969
Table 4 The Self-Sufficiency Standard for Broome County, NY 2010
MONTHLY COSTS adultadult + Infant
adult + Preschooler
adult + Infant
Preschooler
adult + Preschooler School-age
adult + School-age Teenager
adult + Infant
Preschooler School-age
2 Adults+ Infant
Preschooler
2 Adults + Preschooler School-age
2 Adults + Preschooler School-ageTeenager
Housing 608 728 728 728 728 728 950 728 728 950
Child Care 0 617 688 1305 1140 452 1757 1305 1140 1140
food 236 350 358 469 536 622 632 673 737 900
Transportation 255 262 262 262 262 262 262 502 502 502
Health Care 160 398 397 413 422 456 438 486 495 543
Miscellaneous 126 236 243 318 309 252 404 369 360 403
Taxes 262 433 445 611 530 241 948 656 558 655
Earned Income Tax Credit (-) 0 -30 -4 0 0 -232 0 0 0 0
Child Care Tax Credit (-) 0 -63 -60 -100 -100 -68 -100 -100 -100 -100
Child Tax Credit (-) 0 -83 -83 -167 -167 -167 -250 -167 -167 -250
Making Work Pay Credit (-) -33 -33 -33 -33 -33 -33 -33 -67 -67 -67
SELF-SUFFICIENCY WAGE
Hourly $9.17 $15.99 $16.71 $21.62 $20.61 $14.28 $28.45 $12.46 $11.89 $13.29
per adult per adult per adult
MONTHLY $1,614 $2,814 $2,941 $3,805 $3,627 $2,513 $5,007 $4,385 $4,186 $4,676
annual $19,364 $33,770 $35,292 $45,665 $43,522 $30,156 $60,080 $52,623 $50,236 $56,117

60 — THE SELF-SUFFICIENCY STANDARD FOR NEW YORK STATE THE SELF-SUFFICIENCY STANDARD FOR NEW YORK STATE — 61
Table 5 The Self-Sufficiency Standard for Cattaraugus County, NY 2010
MONTHLY COSTS adultadult + Infant
adult + Preschooler
adult + Infant
Preschooler
adult + Preschooler School-age
adult + School-age Teenager
adult + Infant
Preschooler School-age
2 Adults+ Infant
Preschooler
2 Adults + Preschooler School-age
2 Adults + Preschooler School-ageTeenager
Housing 583 702 702 702 702 702 922 702 702 922
Child Care 0 617 688 1305 1140 452 1757 1305 1140 1140
food 236 350 358 469 536 622 632 673 737 900
Transportation 260 266 266 266 266 266 266 511 511 511
Health Care 144 340 339 355 364 397 380 427 437 485
Miscellaneous 122 228 235 310 301 244 396 362 353 396
Taxes 246 372 388 574 484 195 896 610 522 608
Earned Income Tax Credit (-) 0 -70 -42 0 0 -284 0 0 0 0
Child Care Tax Credit (-) 0 -65 -63 -100 -105 -70 -100 -100 -100 -100
Child Tax Credit (-) 0 -83 -83 -167 -167 -167 -250 -167 -167 -250
Making Work Pay Credit (-) -33 -33 -33 -33 -33 -33 -33 -67 -67 -67
SELF-SUFFICIENCY WAGE
Hourly $8.84 $14.91 $15.65 $20.91 $19.82 $13.21 $27.64 $12.09 $11.55 $12.91
per adult per adult per adult
MONTHLY $1,557 $2,623 $2,755 $3,680 $3,488 $2,324 $4,865 $4,257 $4,067 $4,544
annual $18,680 $31,481 $33,055 $44,161 $41,857 $27,890 $58,374 $51,082 $48,808 $54,525
Table 6 The Self-Sufficiency Standard for Cayuga County, NY 2010
MONTHLY COSTS adultadult + Infant
adult + Preschooler
adult + Infant
Preschooler
adult + Preschooler School-age
adult + School-age Teenager
adult + Infant
Preschooler School-age
2 Adults+ Infant
Preschooler
2 Adults + Preschooler School-age
2 Adults + Preschooler School-ageTeenager
Housing 626 750 750 750 750 750 998 750 750 998
Child Care 0 617 688 1305 1140 452 1757 1305 1140 1140
food 236 350 358 469 536 622 632 673 737 900
Transportation 260 266 266 266 266 266 266 511 511 511
Health Care 159 396 395 410 420 453 435 483 493 540
Miscellaneous 128 238 246 320 311 254 409 372 363 409
Taxes 271 448 458 622 542 249 979 673 575 687
Earned Income Tax Credit (-) 0 -19 0 0 0 -219 0 0 0 0
Child Care Tax Credit (-) 0 -63 -60 -100 -100 -68 -100 -100 -100 -100
Child Tax Credit (-) 0 -83 -83 -167 -167 -167 -250 -167 -167 -250
Making Work Pay Credit (-) -33 -33 -33 -33 -33 -33 -33 -67 -67 -67
SELF-SUFFICIENCY WAGE
Hourly $9.36 $16.29 $16.95 $21.83 $20.82 $14.54 $28.93 $12.59 $12.03 $13.55
per adult per adult per adult
MONTHLY $1,647 $2,867 $2,984 $3,843 $3,664 $2,559 $5,092 $4,433 $4,234 $4,768
annual $19,761 $34,404 $35,803 $46,115 $43,973 $30,713 $61,104 $53,200 $50,814 $57,215

60 — THE SELF-SUFFICIENCY STANDARD FOR NEW YORK STATE THE SELF-SUFFICIENCY STANDARD FOR NEW YORK STATE — 61
Table 7 The Self-Sufficiency Standard for Chautauqua County, NY 2010
MONTHLY COSTS adultadult + Infant
adult + Preschooler
adult + Infant
Preschooler
adult + Preschooler School-age
adult + School-age Teenager
adult + Infant
Preschooler School-age
2 Adults+ Infant
Preschooler
2 Adults + Preschooler School-age
2 Adults + Preschooler School-ageTeenager
Housing 592 710 710 710 710 710 916 710 710 916
Child Care 0 617 688 1305 1140 452 1757 1305 1140 1140
food 236 350 358 469 536 622 632 673 737 900
Transportation 260 266 266 266 266 266 266 511 511 511
Health Care 144 340 339 355 364 397 380 427 437 485
Miscellaneous 123 228 236 310 302 245 395 363 353 395
Taxes 249 376 392 576 487 198 891 614 524 602
Earned Income Tax Credit (-) 0 -66 -39 0 0 -279 0 0 0 0
Child Care Tax Credit (-) 0 -65 -63 -100 -105 -70 -100 -100 -100 -100
Child Tax Credit (-) 0 -83 -83 -167 -167 -167 -250 -167 -167 -250
Making Work Pay Credit (-) -33 -33 -33 -33 -33 -33 -33 -67 -67 -67
SELF-SUFFICIENCY WAGE
Hourly $8.92 $15.00 $15.74 $20.97 $19.88 $13.30 $27.57 $12.13 $11.59 $12.88
per adult per adult per adult
MONTHLY $1,570 $2,640 $2,771 $3,692 $3,499 $2,341 $4,853 $4,269 $4,078 $4,532
annual $18,841 $31,680 $33,253 $44,298 $41,993 $28,094 $58,231 $51,229 $48,942 $54,384
Table 8 The Self-Sufficiency Standard for Chemung County, NY 2010
MONTHLY COSTS adultadult + Infant
adult + Preschooler
adult + Infant
Preschooler
adult + Preschooler School-age
adult + School-age Teenager
adult + Infant
Preschooler School-age
2 Adults+ Infant
Preschooler
2 Adults + Preschooler School-age
2 Adults + Preschooler School-ageTeenager
Housing 661 793 793 793 793 793 1019 793 793 1019
Child Care 0 617 688 1305 1140 452 1757 1305 1140 1140
food 236 350 358 469 536 622 632 673 737 900
Transportation 259 265 265 265 265 265 265 509 509 509
Health Care 154 378 376 392 401 435 417 465 474 522
Miscellaneous 131 240 248 322 314 257 409 374 365 409
Taxes 284 469 469 634 553 265 980 686 589 687
Earned Income Tax Credit (-) 0 -6 0 0 0 -203 0 0 0 0
Child Care Tax Credit (-) 0 -60 -60 -100 -100 -65 -100 -100 -100 -100
Child Tax Credit (-) 0 -83 -83 -167 -167 -167 -250 -167 -167 -250
Making Work Pay Credit (-) -33 -33 -33 -33 -33 -33 -33 -67 -67 -67
SELF-SUFFICIENCY WAGE
Hourly $9.61 $16.65 $17.16 $22.05 $21.03 $14.89 $28.95 $12.70 $12.14 $13.55
per adult per adult per adult
MONTHLY $1,692 $2,930 $3,021 $3,880 $3,702 $2,621 $5,095 $4,472 $4,273 $4,769
annual $20,300 $35,156 $36,249 $46,564 $44,421 $31,448 $61,141 $53,665 $51,278 $57,230

62 — THE SELF-SUFFICIENCY STANDARD FOR NEW YORK STATE THE SELF-SUFFICIENCY STANDARD FOR NEW YORK STATE — 63
Table 9 The Self-Sufficiency Standard for Chenango County, NY 2010
MONTHLY COSTS adultadult + Infant
adult + Preschooler
adult + Infant
Preschooler
adult + Preschooler School-age
adult + School-age Teenager
adult + Infant
Preschooler School-age
2 Adults+ Infant
Preschooler
2 Adults + Preschooler School-age
2 Adults + Preschooler School-ageTeenager
Housing 590 707 707 707 707 707 891 707 707 891
Child Care 0 617 688 1305 1140 452 1757 1305 1140 1140
food 236 350 358 469 536 622 632 673 737 900
Transportation 260 266 266 266 266 266 266 511 511 511
Health Care 155 382 381 396 406 439 421 469 478 526
Miscellaneous 124 232 240 314 305 249 397 366 357 397
Taxes 254 410 418 596 505 222 902 638 543 614
Earned Income Tax Credit (-) 0 -46 -21 0 0 -253 0 0 0 0
Child Care Tax Credit (-) 0 -65 -63 -100 -105 -68 -100 -100 -100 -100
Child Tax Credit (-) 0 -83 -83 -167 -167 -167 -250 -167 -167 -250
Making Work Pay Credit (-) -33 -33 -33 -33 -33 -33 -33 -67 -67 -67
SELF-SUFFICIENCY WAGE
Hourly $9.01 $15.54 $16.24 $21.32 $20.23 $13.84 $27.74 $12.32 $11.76 $12.96
per adult per adult per adult
MONTHLY $1,585 $2,736 $2,857 $3,753 $3,560 $2,436 $4,883 $4,336 $4,139 $4,562
annual $19,024 $32,829 $34,290 $45,038 $42,726 $29,232 $58,593 $52,033 $49,674 $54,740
Table 10 The Self-Sufficiency Standard for Clinton County, NY 2010
MONTHLY COSTS adultadult + Infant
adult + Preschooler
adult + Infant
Preschooler
adult + Preschooler School-age
adult + School-age Teenager
adult + Infant
Preschooler School-age
2 Adults+ Infant
Preschooler
2 Adults + Preschooler School-age
2 Adults + Preschooler School-ageTeenager
Housing 665 797 797 797 797 797 1012 797 797 1012
Child Care 0 617 688 1305 1140 452 1757 1305 1140 1140
food 235 348 356 466 533 619 629 669 733 895
Transportation 254 261 261 261 261 261 261 500 500 500
Health Care 152 369 368 384 393 427 409 457 466 514
Miscellaneous 131 239 247 321 312 255 407 373 364 406
Taxes 283 457 464 628 547 257 965 676 578 670
Earned Income Tax Credit (-) 0 -13 0 0 0 -211 0 0 0 0
Child Care Tax Credit (-) 0 -63 -60 -100 -100 -65 -100 -100 -100 -100
Child Tax Credit (-) 0 -83 -83 -167 -167 -167 -250 -167 -167 -250
Making Work Pay Credit (-) -33 -33 -33 -33 -33 -33 -33 -67 -67 -67
SELF-SUFFICIENCY WAGE
Hourly $9.58 $16.46 $17.07 $21.95 $20.93 $14.72 $28.72 $12.62 $12.06 $13.41
per adult per adult per adult
MONTHLY $1,685 $2,896 $3,004 $3,863 $3,683 $2,591 $5,055 $4,443 $4,244 $4,720
annual $20,225 $34,754 $36,049 $46,351 $44,202 $31,096 $60,661 $53,320 $50,926 $56,636
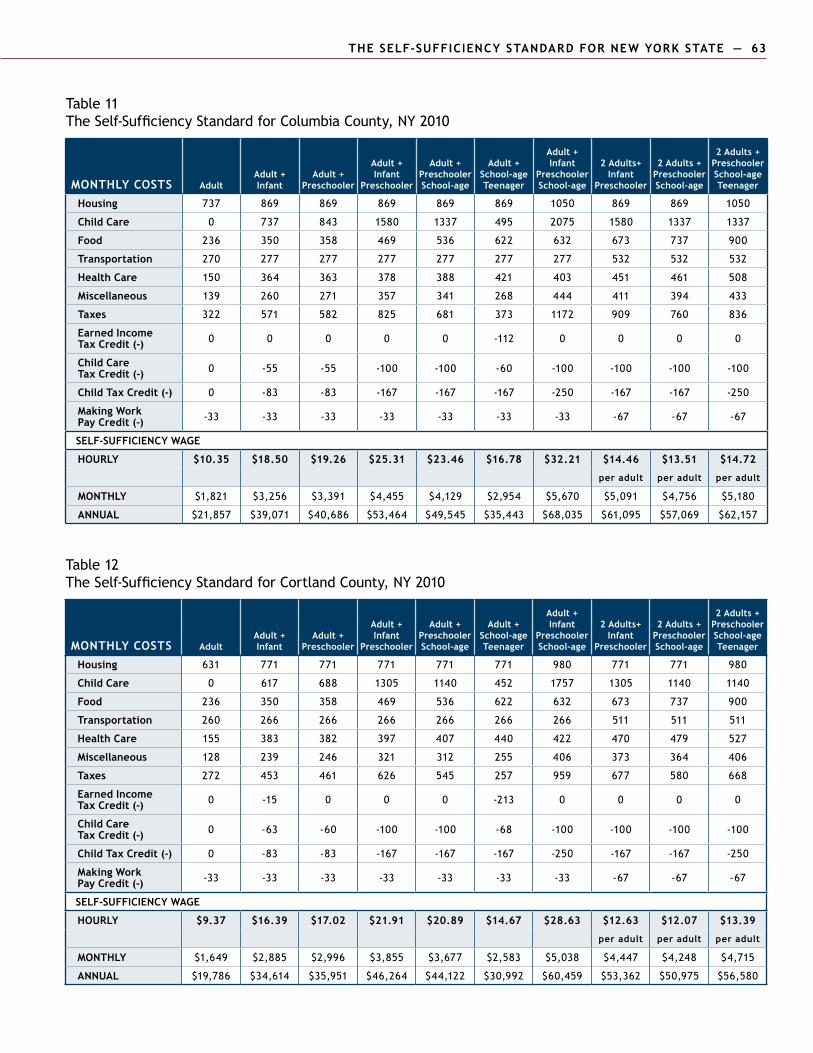
62 — THE SELF-SUFFICIENCY STANDARD FOR NEW YORK STATE THE SELF-SUFFICIENCY STANDARD FOR NEW YORK STATE — 63
Table 11 The Self-Sufficiency Standard for Columbia County, NY 2010
MONTHLY COSTS adultadult + Infant
adult + Preschooler
adult + Infant
Preschooler
adult + Preschooler School-age
adult + School-age Teenager
adult + Infant
Preschooler School-age
2 Adults+ Infant
Preschooler
2 Adults + Preschooler School-age
2 Adults + Preschooler School-ageTeenager
Housing 737 869 869 869 869 869 1050 869 869 1050
Child Care 0 737 843 1580 1337 495 2075 1580 1337 1337
food 236 350 358 469 536 622 632 673 737 900
Transportation 270 277 277 277 277 277 277 532 532 532
Health Care 150 364 363 378 388 421 403 451 461 508
Miscellaneous 139 260 271 357 341 268 444 411 394 433
Taxes 322 571 582 825 681 373 1172 909 760 836
Earned Income Tax Credit (-) 0 0 0 0 0 -112 0 0 0 0
Child Care Tax Credit (-) 0 -55 -55 -100 -100 -60 -100 -100 -100 -100
Child Tax Credit (-) 0 -83 -83 -167 -167 -167 -250 -167 -167 -250
Making Work Pay Credit (-) -33 -33 -33 -33 -33 -33 -33 -67 -67 -67
SELF-SUFFICIENCY WAGE
Hourly $10.35 $18.50 $19.26 $25.31 $23.46 $16.78 $32.21 $14.46 $13.51 $14.72
per adult per adult per adult
MONTHLY $1,821 $3,256 $3,391 $4,455 $4,129 $2,954 $5,670 $5,091 $4,756 $5,180
annual $21,857 $39,071 $40,686 $53,464 $49,545 $35,443 $68,035 $61,095 $57,069 $62,157
Table 12 The Self-Sufficiency Standard for Cortland County, NY 2010
MONTHLY COSTS adultadult + Infant
adult + Preschooler
adult + Infant
Preschooler
adult + Preschooler School-age
adult + School-age Teenager
adult + Infant
Preschooler School-age
2 Adults+ Infant
Preschooler
2 Adults + Preschooler School-age
2 Adults + Preschooler School-ageTeenager
Housing 631 771 771 771 771 771 980 771 771 980
Child Care 0 617 688 1305 1140 452 1757 1305 1140 1140
food 236 350 358 469 536 622 632 673 737 900
Transportation 260 266 266 266 266 266 266 511 511 511
Health Care 155 383 382 397 407 440 422 470 479 527
Miscellaneous 128 239 246 321 312 255 406 373 364 406
Taxes 272 453 461 626 545 257 959 677 580 668
Earned Income Tax Credit (-) 0 -15 0 0 0 -213 0 0 0 0
Child Care Tax Credit (-) 0 -63 -60 -100 -100 -68 -100 -100 -100 -100
Child Tax Credit (-) 0 -83 -83 -167 -167 -167 -250 -167 -167 -250
Making Work Pay Credit (-) -33 -33 -33 -33 -33 -33 -33 -67 -67 -67
SELF-SUFFICIENCY WAGE
Hourly $9.37 $16.39 $17.02 $21.91 $20.89 $14.67 $28.63 $12.63 $12.07 $13.39
per adult per adult per adult
MONTHLY $1,649 $2,885 $2,996 $3,855 $3,677 $2,583 $5,038 $4,447 $4,248 $4,715
annual $19,786 $34,614 $35,951 $46,264 $44,122 $30,992 $60,459 $53,362 $50,975 $56,580

64 — THE SELF-SUFFICIENCY STANDARD FOR NEW YORK STATE THE SELF-SUFFICIENCY STANDARD FOR NEW YORK STATE — 65
Table 13 The Self-Sufficiency Standard for Delaware County, NY 2010
MONTHLY COSTS adultadult + Infant
adult + Preschooler
adult + Infant
Preschooler
adult + Preschooler School-age
adult + School-age Teenager
adult + Infant
Preschooler School-age
2 Adults+ Infant
Preschooler
2 Adults + Preschooler School-age
2 Adults + Preschooler School-ageTeenager
Housing 596 715 715 715 715 715 884 715 715 884
Child Care 0 617 688 1305 1140 452 1757 1305 1140 1140
food 236 350 358 469 536 622 632 673 737 900
Transportation 264 271 271 271 271 271 271 520 520 520
Health Care 155 383 382 397 407 440 422 470 479 527
Miscellaneous 125 234 241 316 307 250 397 368 359 397
Taxes 259 420 427 602 521 223 902 649 551 616
Earned Income Tax Credit (-) 0 -39 -15 0 0 -247 0 0 0 0
Child Care Tax Credit (-) 0 -63 -63 -100 -100 -68 -100 -100 -100 -100
Child Tax Credit (-) 0 -83 -83 -167 -167 -167 -250 -167 -167 -250
Making Work Pay Credit (-) -33 -33 -33 -33 -33 -33 -33 -67 -67 -67
SELF-SUFFICIENCY WAGE
Hourly $9.10 $15.75 $16.41 $21.45 $20.43 $13.96 $27.73 $12.41 $11.84 $12.98
per adult per adult per adult
MONTHLY $1,602 $2,771 $2,888 $3,775 $3,596 $2,458 $4,881 $4,368 $4,168 $4,568
annual $19,228 $33,254 $34,656 $45,298 $43,155 $29,492 $58,567 $52,412 $50,020 $54,812
Table 14 The Self-Sufficiency Standard for Dutchess County, NY 2010
MONTHLY COSTS adultadult + Infant
adult + Preschooler
adult + Infant
Preschooler
adult + Preschooler School-age
adult + School-age Teenager
adult + Infant
Preschooler School-age
2 Adults+ Infant
Preschooler
2 Adults + Preschooler School-age
2 Adults + Preschooler School-ageTeenager
Housing 931 1139 1139 1139 1139 1139 1396 1139 1139 1396
Child Care 0 872 882 1753 1419 538 2291 1753 1419 1419
food 236 350 358 469 536 622 632 673 737 900
Transportation 312 319 319 319 319 319 319 612 612 612
Health Care 167 423 422 437 447 480 462 510 520 568
Miscellaneous 165 310 312 412 386 310 510 469 443 490
Taxes 438 815 784 1169 962 627 1653 1214 1052 1126
Earned Income Tax Credit (-) 0 0 0 0 0 0 0 0 0 0
Child Care Tax Credit (-) 0 -50 -50 -100 -100 -50 -100 -100 -100 -100
Child Tax Credit (-) 0 -83 -83 -167 -167 -167 -250 -167 -167 -250
Making Work Pay Credit (-) -33 -33 -33 -33 -33 -33 -33 -67 -67 -67
SELF-SUFFICIENCY WAGE
Hourly $12.59 $23.07 $23.00 $30.67 $27.89 $21.50 $39.09 $17.15 $15.88 $17.31
per adult per adult per adult
MONTHLY $2,215 $4,061 $4,048 $5,397 $4,908 $3,785 $6,880 $6,038 $5,589 $6,095
annual $26,580 $48,732 $48,572 $64,768 $58,893 $45,415 $82,555 $72,450 $67,064 $73,137

64 — THE SELF-SUFFICIENCY STANDARD FOR NEW YORK STATE THE SELF-SUFFICIENCY STANDARD FOR NEW YORK STATE — 65
Table 15 The Self-Sufficiency Standard for Erie County, NY 2010
MONTHLY COSTS adultadult + Infant
adult + Preschooler
adult + Infant
Preschooler
adult + Preschooler School-age
adult + School-age Teenager
adult + Infant
Preschooler School-age
2 Adults+ Infant
Preschooler
2 Adults + Preschooler School-age
2 Adults + Preschooler School-ageTeenager
Housing 616 740 740 740 740 740 916 740 740 916
Child Care 0 737 843 1580 1337 495 2075 1580 1337 1337
food 238 352 360 472 540 627 636 678 742 907
Transportation 301 308 308 308 308 308 308 594 594 594
Health Care 144 340 339 355 364 397 380 427 437 485
Miscellaneous 130 248 259 345 329 257 431 402 385 424
Taxes 281 509 527 754 629 268 1119 859 712 785
Earned Income Tax Credit (-) 0 0 0 0 0 -202 0 0 0 0
Child Care Tax Credit (-) 0 -60 -58 -100 -100 -65 -100 -100 -100 -100
Child Tax Credit (-) 0 -83 -83 -167 -167 -167 -250 -167 -167 -250
Making Work Pay Credit (-) -33 -33 -33 -33 -33 -33 -33 -67 -67 -67
SELF-SUFFICIENCY WAGE
Hourly $9.52 $17.38 $18.19 $24.17 $22.43 $14.91 $31.15 $14.05 $13.11 $14.29
per adult per adult per adult
MONTHLY $1,676 $3,058 $3,202 $4,255 $3,947 $2,624 $5,482 $4,947 $4,614 $5,030
annual $20,108 $36,697 $38,419 $51,056 $47,362 $31,486 $65,781 $59,366 $55,369 $60,358
Table 16 The Self-Sufficiency Standard for Essex County, NY 2010
MONTHLY COSTS adultadult + Infant
adult + Preschooler
adult + Infant
Preschooler
adult + Preschooler School-age
adult + School-age Teenager
adult + Infant
Preschooler School-age
2 Adults+ Infant
Preschooler
2 Adults + Preschooler School-age
2 Adults + Preschooler School-ageTeenager
Housing 625 750 750 750 750 750 998 750 750 998
Child Care 0 617 688 1305 1140 452 1757 1305 1140 1140
food 236 350 358 469 536 622 632 673 737 900
Transportation 254 261 261 261 261 261 261 500 500 500
Health Care 153 376 374 390 399 433 415 463 472 520
Miscellaneous 127 235 243 317 309 252 406 369 360 406
Taxes 265 430 443 609 528 235 961 652 555 666
Earned Income Tax Credit (-) 0 -31 -5 0 0 -236 0 0 0 0
Child Care Tax Credit (-) 0 -63 -60 -100 -100 -68 -100 -100 -100 -100
Child Tax Credit (-) 0 -83 -83 -167 -167 -167 -250 -167 -167 -250
Making Work Pay Credit (-) -33 -33 -33 -33 -33 -33 -33 -67 -67 -67
SELF-SUFFICIENCY WAGE
Hourly $9.25 $15.96 $16.68 $21.60 $20.58 $14.21 $28.67 $12.44 $11.87 $13.39
per adult per adult per adult
MONTHLY $1,627 $2,809 $2,935 $3,801 $3,623 $2,501 $5,046 $4,378 $4,180 $4,713
annual $19,530 $33,703 $35,225 $45,614 $43,472 $30,009 $60,549 $52,540 $50,154 $56,554
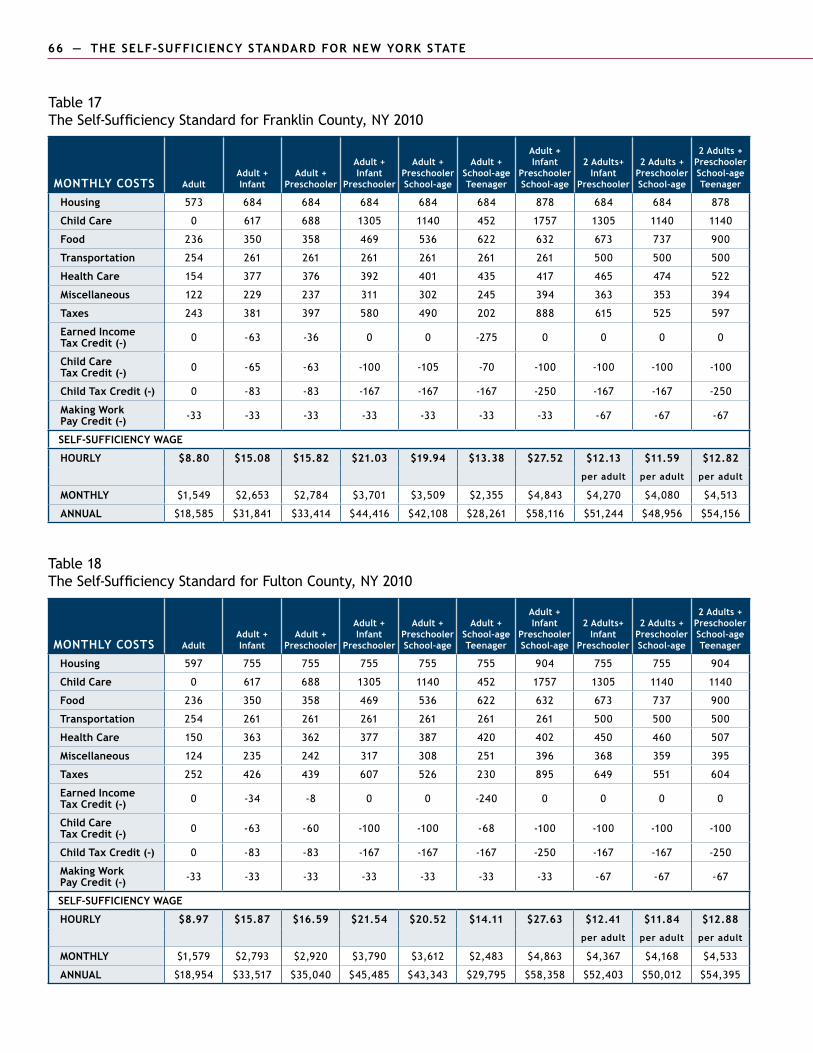
66 — THE SELF-SUFFICIENCY STANDARD FOR NEW YORK STATE THE SELF-SUFFICIENCY STANDARD FOR NEW YORK STATE — 67
Table 17 The Self-Sufficiency Standard for Franklin County, NY 2010
MONTHLY COSTS adultadult + Infant
adult + Preschooler
adult + Infant
Preschooler
adult + Preschooler School-age
adult + School-age Teenager
adult + Infant
Preschooler School-age
2 Adults+ Infant
Preschooler
2 Adults + Preschooler School-age
2 Adults + Preschooler School-ageTeenager
Housing 573 684 684 684 684 684 878 684 684 878
Child Care 0 617 688 1305 1140 452 1757 1305 1140 1140
food 236 350 358 469 536 622 632 673 737 900
Transportation 254 261 261 261 261 261 261 500 500 500
Health Care 154 377 376 392 401 435 417 465 474 522
Miscellaneous 122 229 237 311 302 245 394 363 353 394
Taxes 243 381 397 580 490 202 888 615 525 597
Earned Income Tax Credit (-) 0 -63 -36 0 0 -275 0 0 0 0
Child Care Tax Credit (-) 0 -65 -63 -100 -105 -70 -100 -100 -100 -100
Child Tax Credit (-) 0 -83 -83 -167 -167 -167 -250 -167 -167 -250
Making Work Pay Credit (-) -33 -33 -33 -33 -33 -33 -33 -67 -67 -67
SELF-SUFFICIENCY WAGE
Hourly $8.80 $15.08 $15.82 $21.03 $19.94 $13.38 $27.52 $12.13 $11.59 $12.82
per adult per adult per adult
MONTHLY $1,549 $2,653 $2,784 $3,701 $3,509 $2,355 $4,843 $4,270 $4,080 $4,513
annual $18,585 $31,841 $33,414 $44,416 $42,108 $28,261 $58,116 $51,244 $48,956 $54,156
Table 18 The Self-Sufficiency Standard for Fulton County, NY 2010
MONTHLY COSTS adultadult + Infant
adult + Preschooler
adult + Infant
Preschooler
adult + Preschooler School-age
adult + School-age Teenager
adult + Infant
Preschooler School-age
2 Adults+ Infant
Preschooler
2 Adults + Preschooler School-age
2 Adults + Preschooler School-ageTeenager
Housing 597 755 755 755 755 755 904 755 755 904
Child Care 0 617 688 1305 1140 452 1757 1305 1140 1140
food 236 350 358 469 536 622 632 673 737 900
Transportation 254 261 261 261 261 261 261 500 500 500
Health Care 150 363 362 377 387 420 402 450 460 507
Miscellaneous 124 235 242 317 308 251 396 368 359 395
Taxes 252 426 439 607 526 230 895 649 551 604
Earned Income Tax Credit (-) 0 -34 -8 0 0 -240 0 0 0 0
Child Care Tax Credit (-) 0 -63 -60 -100 -100 -68 -100 -100 -100 -100
Child Tax Credit (-) 0 -83 -83 -167 -167 -167 -250 -167 -167 -250
Making Work Pay Credit (-) -33 -33 -33 -33 -33 -33 -33 -67 -67 -67
SELF-SUFFICIENCY WAGE
Hourly $8.97 $15.87 $16.59 $21.54 $20.52 $14.11 $27.63 $12.41 $11.84 $12.88
per adult per adult per adult
MONTHLY $1,579 $2,793 $2,920 $3,790 $3,612 $2,483 $4,863 $4,367 $4,168 $4,533
annual $18,954 $33,517 $35,040 $45,485 $43,343 $29,795 $58,358 $52,403 $50,012 $54,395
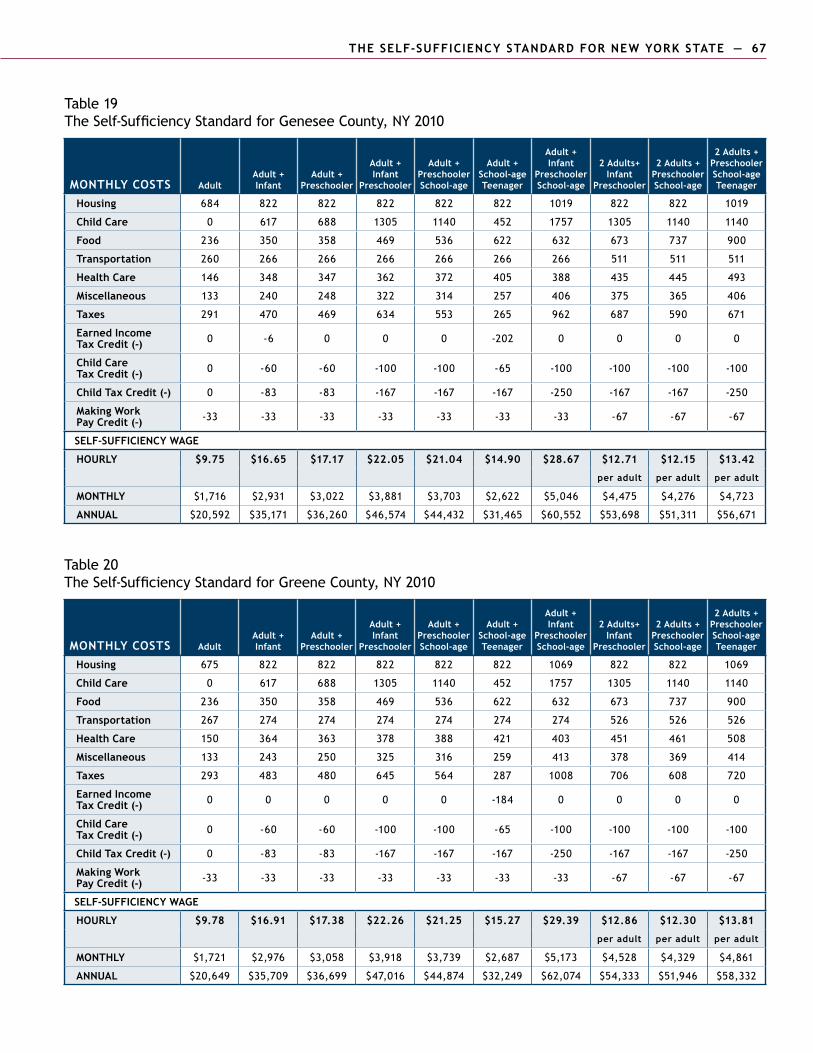
66 — THE SELF-SUFFICIENCY STANDARD FOR NEW YORK STATE THE SELF-SUFFICIENCY STANDARD FOR NEW YORK STATE — 67
Table 19 The Self-Sufficiency Standard for Genesee County, NY 2010
MONTHLY COSTS adultadult + Infant
adult + Preschooler
adult + Infant
Preschooler
adult + Preschooler School-age
adult + School-age Teenager
adult + Infant
Preschooler School-age
2 Adults+ Infant
Preschooler
2 Adults + Preschooler School-age
2 Adults + Preschooler School-ageTeenager
Housing 684 822 822 822 822 822 1019 822 822 1019
Child Care 0 617 688 1305 1140 452 1757 1305 1140 1140
food 236 350 358 469 536 622 632 673 737 900
Transportation 260 266 266 266 266 266 266 511 511 511
Health Care 146 348 347 362 372 405 388 435 445 493
Miscellaneous 133 240 248 322 314 257 406 375 365 406
Taxes 291 470 469 634 553 265 962 687 590 671
Earned Income Tax Credit (-) 0 -6 0 0 0 -202 0 0 0 0
Child Care Tax Credit (-) 0 -60 -60 -100 -100 -65 -100 -100 -100 -100
Child Tax Credit (-) 0 -83 -83 -167 -167 -167 -250 -167 -167 -250
Making Work Pay Credit (-) -33 -33 -33 -33 -33 -33 -33 -67 -67 -67
SELF-SUFFICIENCY WAGE
Hourly $9.75 $16.65 $17.17 $22.05 $21.04 $14.90 $28.67 $12.71 $12.15 $13.42
per adult per adult per adult
MONTHLY $1,716 $2,931 $3,022 $3,881 $3,703 $2,622 $5,046 $4,475 $4,276 $4,723
annual $20,592 $35,171 $36,260 $46,574 $44,432 $31,465 $60,552 $53,698 $51,311 $56,671
Table 20 The Self-Sufficiency Standard for Greene County, NY 2010
MONTHLY COSTS adultadult + Infant
adult + Preschooler
adult + Infant
Preschooler
adult + Preschooler School-age
adult + School-age Teenager
adult + Infant
Preschooler School-age
2 Adults+ Infant
Preschooler
2 Adults + Preschooler School-age
2 Adults + Preschooler School-ageTeenager
Housing 675 822 822 822 822 822 1069 822 822 1069
Child Care 0 617 688 1305 1140 452 1757 1305 1140 1140
food 236 350 358 469 536 622 632 673 737 900
Transportation 267 274 274 274 274 274 274 526 526 526
Health Care 150 364 363 378 388 421 403 451 461 508
Miscellaneous 133 243 250 325 316 259 413 378 369 414
Taxes 293 483 480 645 564 287 1008 706 608 720
Earned Income Tax Credit (-) 0 0 0 0 0 -184 0 0 0 0
Child Care Tax Credit (-) 0 -60 -60 -100 -100 -65 -100 -100 -100 -100
Child Tax Credit (-) 0 -83 -83 -167 -167 -167 -250 -167 -167 -250
Making Work Pay Credit (-) -33 -33 -33 -33 -33 -33 -33 -67 -67 -67
SELF-SUFFICIENCY WAGE
Hourly $9.78 $16.91 $17.38 $22.26 $21.25 $15.27 $29.39 $12.86 $12.30 $13.81
per adult per adult per adult
MONTHLY $1,721 $2,976 $3,058 $3,918 $3,739 $2,687 $5,173 $4,528 $4,329 $4,861
annual $20,649 $35,709 $36,699 $47,016 $44,874 $32,249 $62,074 $54,333 $51,946 $58,332
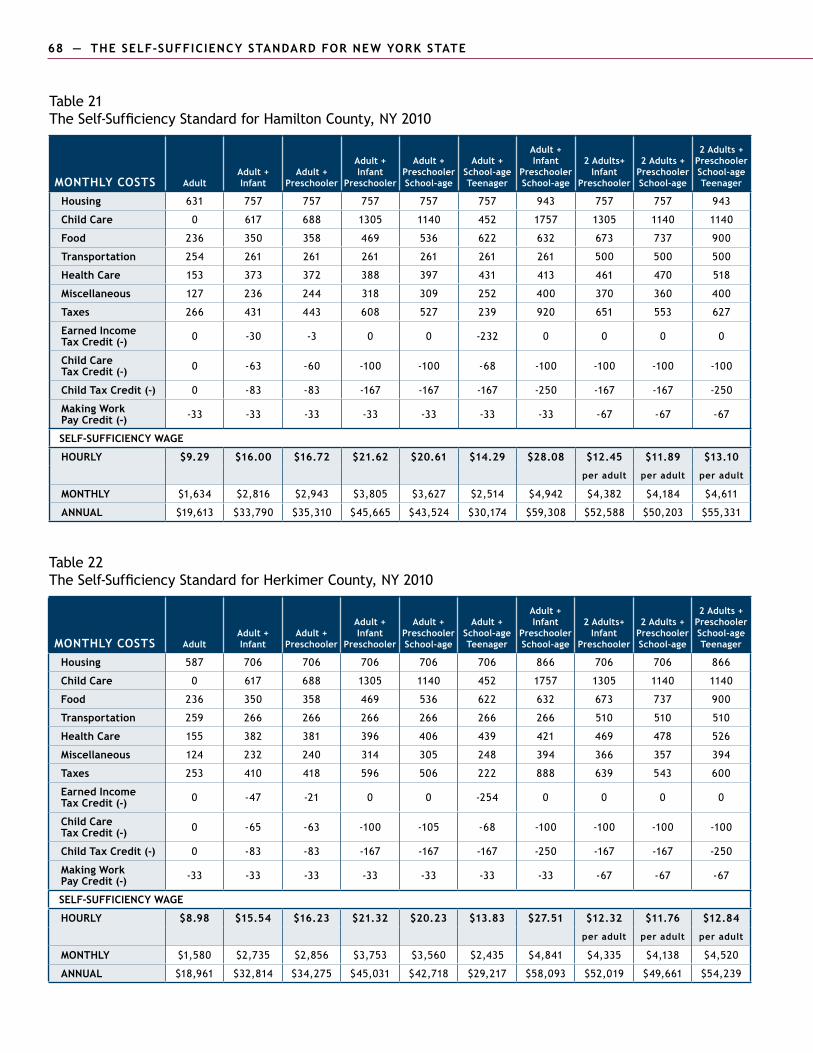
68 — THE SELF-SUFFICIENCY STANDARD FOR NEW YORK STATE THE SELF-SUFFICIENCY STANDARD FOR NEW YORK STATE — 69
Table 21 The Self-Sufficiency Standard for Hamilton County, NY 2010
MONTHLY COSTS adultadult + Infant
adult + Preschooler
adult + Infant
Preschooler
adult + Preschooler School-age
adult + School-age Teenager
adult + Infant
Preschooler School-age
2 Adults+ Infant
Preschooler
2 Adults + Preschooler School-age
2 Adults + Preschooler School-ageTeenager
Housing 631 757 757 757 757 757 943 757 757 943
Child Care 0 617 688 1305 1140 452 1757 1305 1140 1140
food 236 350 358 469 536 622 632 673 737 900
Transportation 254 261 261 261 261 261 261 500 500 500
Health Care 153 373 372 388 397 431 413 461 470 518
Miscellaneous 127 236 244 318 309 252 400 370 360 400
Taxes 266 431 443 608 527 239 920 651 553 627
Earned Income Tax Credit (-) 0 -30 -3 0 0 -232 0 0 0 0
Child Care Tax Credit (-) 0 -63 -60 -100 -100 -68 -100 -100 -100 -100
Child Tax Credit (-) 0 -83 -83 -167 -167 -167 -250 -167 -167 -250
Making Work Pay Credit (-) -33 -33 -33 -33 -33 -33 -33 -67 -67 -67
SELF-SUFFICIENCY WAGE
Hourly $9.29 $16.00 $16.72 $21.62 $20.61 $14.29 $28.08 $12.45 $11.89 $13.10
per adult per adult per adult
MONTHLY $1,634 $2,816 $2,943 $3,805 $3,627 $2,514 $4,942 $4,382 $4,184 $4,611
annual $19,613 $33,790 $35,310 $45,665 $43,524 $30,174 $59,308 $52,588 $50,203 $55,331
Table 22 The Self-Sufficiency Standard for Herkimer County, NY 2010
MONTHLY COSTS adultadult + Infant
adult + Preschooler
adult + Infant
Preschooler
adult + Preschooler School-age
adult + School-age Teenager
adult + Infant
Preschooler School-age
2 Adults+ Infant
Preschooler
2 Adults + Preschooler School-age
2 Adults + Preschooler School-ageTeenager
Housing 587 706 706 706 706 706 866 706 706 866
Child Care 0 617 688 1305 1140 452 1757 1305 1140 1140
food 236 350 358 469 536 622 632 673 737 900
Transportation 259 266 266 266 266 266 266 510 510 510
Health Care 155 382 381 396 406 439 421 469 478 526
Miscellaneous 124 232 240 314 305 248 394 366 357 394
Taxes 253 410 418 596 506 222 888 639 543 600
Earned Income Tax Credit (-) 0 -47 -21 0 0 -254 0 0 0 0
Child Care Tax Credit (-) 0 -65 -63 -100 -105 -68 -100 -100 -100 -100
Child Tax Credit (-) 0 -83 -83 -167 -167 -167 -250 -167 -167 -250
Making Work Pay Credit (-) -33 -33 -33 -33 -33 -33 -33 -67 -67 -67
SELF-SUFFICIENCY WAGE
Hourly $8.98 $15.54 $16.23 $21.32 $20.23 $13.83 $27.51 $12.32 $11.76 $12.84
per adult per adult per adult
MONTHLY $1,580 $2,735 $2,856 $3,753 $3,560 $2,435 $4,841 $4,335 $4,138 $4,520
annual $18,961 $32,814 $34,275 $45,031 $42,718 $29,217 $58,093 $52,019 $49,661 $54,239
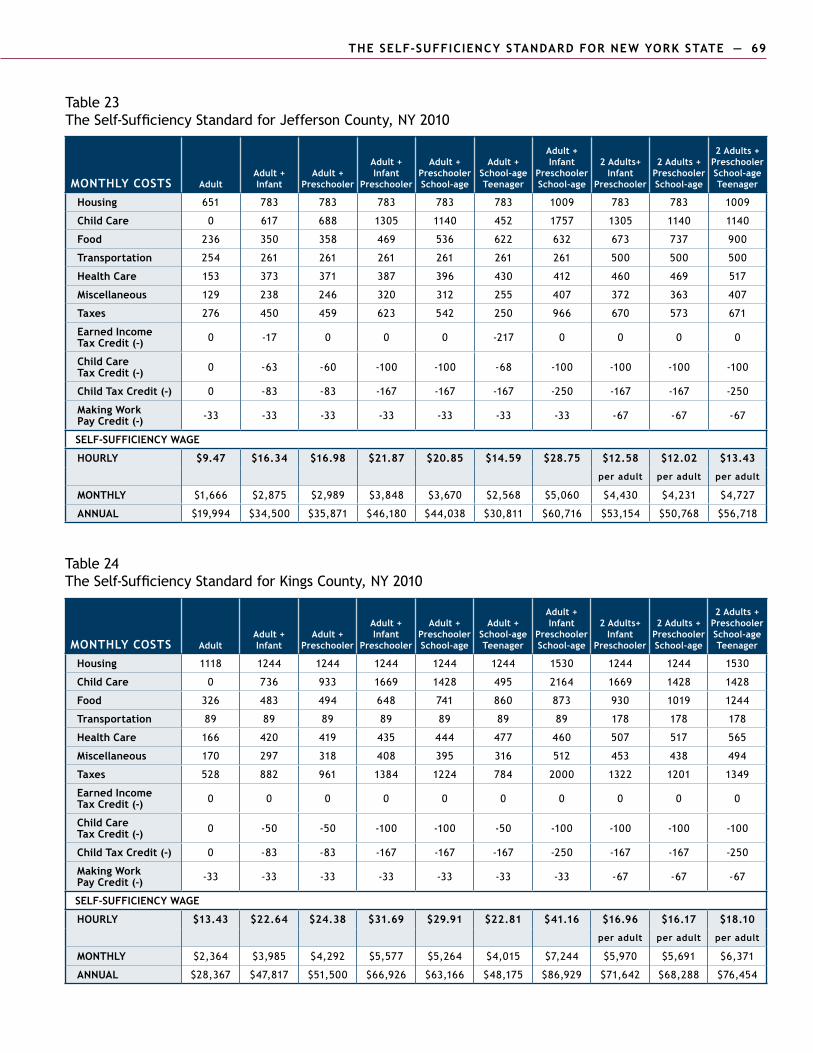
68 — THE SELF-SUFFICIENCY STANDARD FOR NEW YORK STATE THE SELF-SUFFICIENCY STANDARD FOR NEW YORK STATE — 69
Table 23 The Self-Sufficiency Standard for Jefferson County, NY 2010
MONTHLY COSTS adultadult + Infant
adult + Preschooler
adult + Infant
Preschooler
adult + Preschooler School-age
adult + School-age Teenager
adult + Infant
Preschooler School-age
2 Adults+ Infant
Preschooler
2 Adults + Preschooler School-age
2 Adults + Preschooler School-ageTeenager
Housing 651 783 783 783 783 783 1009 783 783 1009
Child Care 0 617 688 1305 1140 452 1757 1305 1140 1140
food 236 350 358 469 536 622 632 673 737 900
Transportation 254 261 261 261 261 261 261 500 500 500
Health Care 153 373 371 387 396 430 412 460 469 517
Miscellaneous 129 238 246 320 312 255 407 372 363 407
Taxes 276 450 459 623 542 250 966 670 573 671
Earned Income Tax Credit (-) 0 -17 0 0 0 -217 0 0 0 0
Child Care Tax Credit (-) 0 -63 -60 -100 -100 -68 -100 -100 -100 -100
Child Tax Credit (-) 0 -83 -83 -167 -167 -167 -250 -167 -167 -250
Making Work Pay Credit (-) -33 -33 -33 -33 -33 -33 -33 -67 -67 -67
SELF-SUFFICIENCY WAGE
Hourly $9.47 $16.34 $16.98 $21.87 $20.85 $14.59 $28.75 $12.58 $12.02 $13.43
per adult per adult per adult
MONTHLY $1,666 $2,875 $2,989 $3,848 $3,670 $2,568 $5,060 $4,430 $4,231 $4,727
annual $19,994 $34,500 $35,871 $46,180 $44,038 $30,811 $60,716 $53,154 $50,768 $56,718
Table 24 The Self-Sufficiency Standard for kings County, NY 2010
MONTHLY COSTS adultadult + Infant
adult + Preschooler
adult + Infant
Preschooler
adult + Preschooler School-age
adult + School-age Teenager
adult + Infant
Preschooler School-age
2 Adults+ Infant
Preschooler
2 Adults + Preschooler School-age
2 Adults + Preschooler School-ageTeenager
Housing 1118 1244 1244 1244 1244 1244 1530 1244 1244 1530
Child Care 0 736 933 1669 1428 495 2164 1669 1428 1428
food 326 483 494 648 741 860 873 930 1019 1244
Transportation 89 89 89 89 89 89 89 178 178 178
Health Care 166 420 419 435 444 477 460 507 517 565
Miscellaneous 170 297 318 408 395 316 512 453 438 494
Taxes 528 882 961 1384 1224 784 2000 1322 1201 1349
Earned Income Tax Credit (-) 0 0 0 0 0 0 0 0 0 0
Child Care Tax Credit (-) 0 -50 -50 -100 -100 -50 -100 -100 -100 -100
Child Tax Credit (-) 0 -83 -83 -167 -167 -167 -250 -167 -167 -250
Making Work Pay Credit (-) -33 -33 -33 -33 -33 -33 -33 -67 -67 -67
SELF-SUFFICIENCY WAGE
Hourly $13.43 $22.64 $24.38 $31.69 $29.91 $22.81 $41.16 $16.96 $16.17 $18.10
per adult per adult per adult
MONTHLY $2,364 $3,985 $4,292 $5,577 $5,264 $4,015 $7,244 $5,970 $5,691 $6,371
annual $28,367 $47,817 $51,500 $66,926 $63,166 $48,175 $86,929 $71,642 $68,288 $76,454

70 — THE SELF-SUFFICIENCY STANDARD FOR NEW YORK STATE THE SELF-SUFFICIENCY STANDARD FOR NEW YORK STATE — 71
Table 25 The Self-Sufficiency Standard for Lewis County, NY 2010
MONTHLY COSTS adultadult + Infant
adult + Preschooler
adult + Infant
Preschooler
adult + Preschooler School-age
adult + School-age Teenager
adult + Infant
Preschooler School-age
2 Adults+ Infant
Preschooler
2 Adults + Preschooler School-age
2 Adults + Preschooler School-ageTeenager
Housing 583 699 699 699 699 699 874 699 699 874
Child Care 0 617 688 1305 1140 452 1757 1305 1140 1140
food 236 350 358 469 536 622 632 673 737 900
Transportation 254 261 261 261 261 261 261 500 500 500
Health Care 153 373 371 387 396 430 412 460 469 517
Miscellaneous 123 230 238 312 303 246 394 364 354 393
Taxes 247 390 402 584 494 207 881 620 529 590
Earned Income Tax Credit (-) 0 -58 -32 0 0 -269 0 0 0 0
Child Care Tax Credit (-) 0 -65 -63 -100 -105 -70 -100 -100 -100 -100
Child Tax Credit (-) 0 -83 -83 -167 -167 -167 -250 -167 -167 -250
Making Work Pay Credit (-) -33 -33 -33 -33 -33 -33 -33 -67 -67 -67
SELF-SUFFICIENCY WAGE
Hourly $8.87 $15.22 $15.94 $21.12 $20.02 $13.51 $27.42 $12.18 $11.63 $12.77
per adult per adult per adult
MONTHLY $1,562 $2,679 $2,806 $3,716 $3,524 $2,377 $4,826 $4,286 $4,094 $4,497
annual $18,740 $32,150 $33,672 $44,596 $42,287 $28,528 $57,917 $51,438 $49,132 $53,960
Table 26 The Self-Sufficiency Standard for Livingston County, NY 2010
MONTHLY COSTS adultadult + Infant
adult + Preschooler
adult + Infant
Preschooler
adult + Preschooler School-age
adult + School-age Teenager
adult + Infant
Preschooler School-age
2 Adults+ Infant
Preschooler
2 Adults + Preschooler School-age
2 Adults + Preschooler School-ageTeenager
Housing 600 734 734 734 734 734 881 734 734 881
Child Care 0 617 688 1305 1140 452 1757 1305 1140 1140
food 215 319 326 428 489 568 577 614 673 821
Transportation 260 266 266 266 266 266 266 511 511 511
Health Care 144 342 341 356 366 399 381 429 439 486
Miscellaneous 122 228 236 309 299 242 386 359 350 384
Taxes 244 374 389 570 478 181 836 595 508 535
Earned Income Tax Credit (-) 0 -68 -41 0 0 -296 0 0 0 0
Child Care Tax Credit (-) 0 -65 -63 -100 -105 -67 -100 -100 -100 -100
Child Tax Credit (-) 0 -83 -83 -167 -167 -167 -250 -167 -167 -250
Making Work Pay Credit (-) -33 -33 -33 -33 -33 -33 -33 -67 -67 -67
SELF-SUFFICIENCY WAGE
Hourly $8.82 $14.94 $15.68 $20.84 $19.70 $12.95 $26.71 $11.97 $11.42 $12.33
per adult per adult per adult
MONTHLY $1,552 $2,630 $2,759 $3,668 $3,467 $2,278 $4,701 $4,213 $4,019 $4,341
annual $18,628 $31,555 $33,110 $44,016 $41,605 $27,341 $56,409 $50,560 $48,229 $52,091
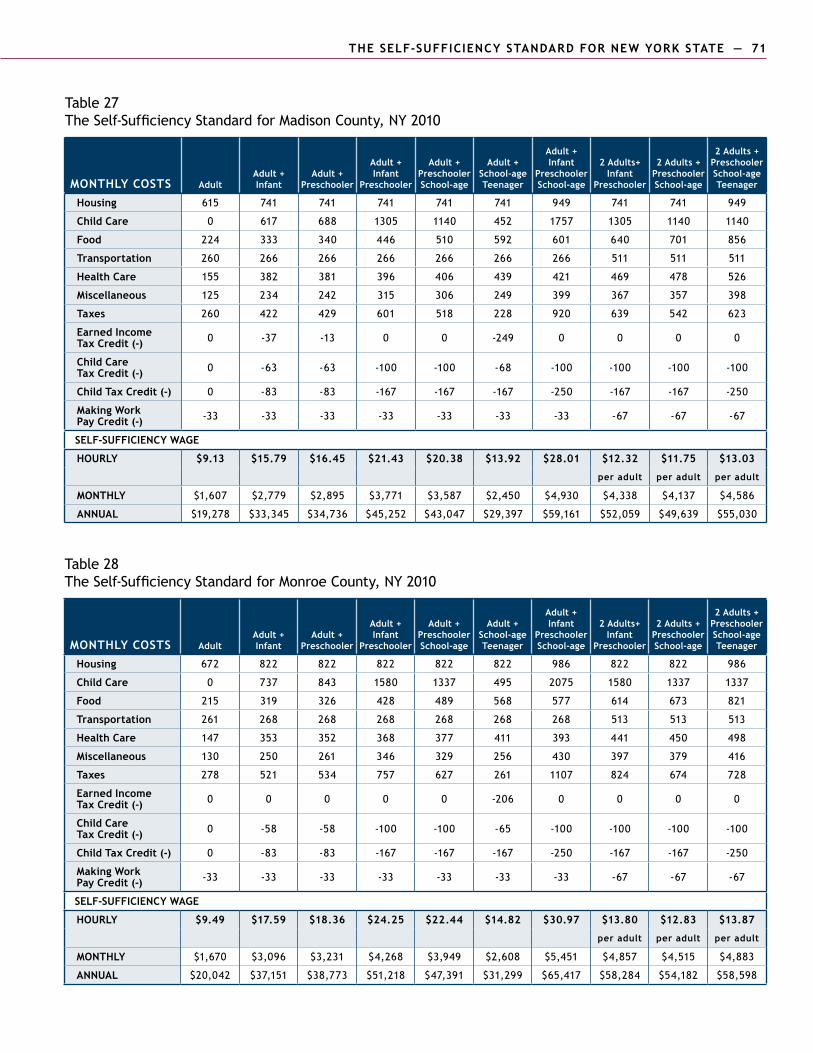
70 — THE SELF-SUFFICIENCY STANDARD FOR NEW YORK STATE THE SELF-SUFFICIENCY STANDARD FOR NEW YORK STATE — 71
Table 27 The Self-Sufficiency Standard for Madison County, NY 2010
MONTHLY COSTS adultadult + Infant
adult + Preschooler
adult + Infant
Preschooler
adult + Preschooler School-age
adult + School-age Teenager
adult + Infant
Preschooler School-age
2 Adults+ Infant
Preschooler
2 Adults + Preschooler School-age
2 Adults + Preschooler School-ageTeenager
Housing 615 741 741 741 741 741 949 741 741 949
Child Care 0 617 688 1305 1140 452 1757 1305 1140 1140
food 224 333 340 446 510 592 601 640 701 856
Transportation 260 266 266 266 266 266 266 511 511 511
Health Care 155 382 381 396 406 439 421 469 478 526
Miscellaneous 125 234 242 315 306 249 399 367 357 398
Taxes 260 422 429 601 518 228 920 639 542 623
Earned Income Tax Credit (-) 0 -37 -13 0 0 -249 0 0 0 0
Child Care Tax Credit (-) 0 -63 -63 -100 -100 -68 -100 -100 -100 -100
Child Tax Credit (-) 0 -83 -83 -167 -167 -167 -250 -167 -167 -250
Making Work Pay Credit (-) -33 -33 -33 -33 -33 -33 -33 -67 -67 -67
SELF-SUFFICIENCY WAGE
Hourly $9.13 $15.79 $16.45 $21.43 $20.38 $13.92 $28.01 $12.32 $11.75 $13.03
per adult per adult per adult
MONTHLY $1,607 $2,779 $2,895 $3,771 $3,587 $2,450 $4,930 $4,338 $4,137 $4,586
annual $19,278 $33,345 $34,736 $45,252 $43,047 $29,397 $59,161 $52,059 $49,639 $55,030
Table 28 The Self-Sufficiency Standard for Monroe County, NY 2010
MONTHLY COSTS adultadult + Infant
adult + Preschooler
adult + Infant
Preschooler
adult + Preschooler School-age
adult + School-age Teenager
adult + Infant
Preschooler School-age
2 Adults+ Infant
Preschooler
2 Adults + Preschooler School-age
2 Adults + Preschooler School-ageTeenager
Housing 672 822 822 822 822 822 986 822 822 986
Child Care 0 737 843 1580 1337 495 2075 1580 1337 1337
food 215 319 326 428 489 568 577 614 673 821
Transportation 261 268 268 268 268 268 268 513 513 513
Health Care 147 353 352 368 377 411 393 441 450 498
Miscellaneous 130 250 261 346 329 256 430 397 379 416
Taxes 278 521 534 757 627 261 1107 824 674 728
Earned Income Tax Credit (-) 0 0 0 0 0 -206 0 0 0 0
Child Care Tax Credit (-) 0 -58 -58 -100 -100 -65 -100 -100 -100 -100
Child Tax Credit (-) 0 -83 -83 -167 -167 -167 -250 -167 -167 -250
Making Work Pay Credit (-) -33 -33 -33 -33 -33 -33 -33 -67 -67 -67
SELF-SUFFICIENCY WAGE
Hourly $9.49 $17.59 $18.36 $24.25 $22.44 $14.82 $30.97 $13.80 $12.83 $13.87
per adult per adult per adult
MONTHLY $1,670 $3,096 $3,231 $4,268 $3,949 $2,608 $5,451 $4,857 $4,515 $4,883
annual $20,042 $37,151 $38,773 $51,218 $47,391 $31,299 $65,417 $58,284 $54,182 $58,598
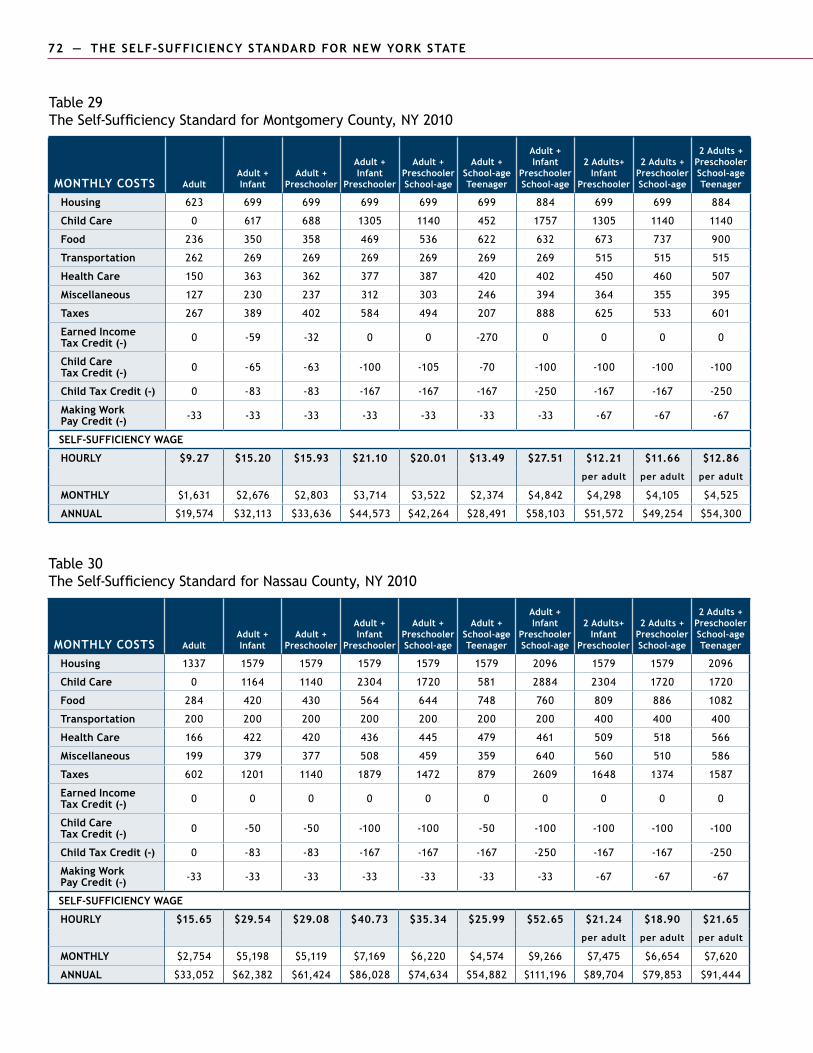
72 — THE SELF-SUFFICIENCY STANDARD FOR NEW YORK STATE THE SELF-SUFFICIENCY STANDARD FOR NEW YORK STATE — 73
Table 29 The Self-Sufficiency Standard for Montgomery County, NY 2010
MONTHLY COSTS adultadult + Infant
adult + Preschooler
adult + Infant
Preschooler
adult + Preschooler School-age
adult + School-age Teenager
adult + Infant
Preschooler School-age
2 Adults+ Infant
Preschooler
2 Adults + Preschooler School-age
2 Adults + Preschooler School-ageTeenager
Housing 623 699 699 699 699 699 884 699 699 884
Child Care 0 617 688 1305 1140 452 1757 1305 1140 1140
food 236 350 358 469 536 622 632 673 737 900
Transportation 262 269 269 269 269 269 269 515 515 515
Health Care 150 363 362 377 387 420 402 450 460 507
Miscellaneous 127 230 237 312 303 246 394 364 355 395
Taxes 267 389 402 584 494 207 888 625 533 601
Earned Income Tax Credit (-) 0 -59 -32 0 0 -270 0 0 0 0
Child Care Tax Credit (-) 0 -65 -63 -100 -105 -70 -100 -100 -100 -100
Child Tax Credit (-) 0 -83 -83 -167 -167 -167 -250 -167 -167 -250
Making Work Pay Credit (-) -33 -33 -33 -33 -33 -33 -33 -67 -67 -67
SELF-SUFFICIENCY WAGE
Hourly $9.27 $15.20 $15.93 $21.10 $20.01 $13.49 $27.51 $12.21 $11.66 $12.86
per adult per adult per adult
MONTHLY $1,631 $2,676 $2,803 $3,714 $3,522 $2,374 $4,842 $4,298 $4,105 $4,525
annual $19,574 $32,113 $33,636 $44,573 $42,264 $28,491 $58,103 $51,572 $49,254 $54,300
Table 30 The Self-Sufficiency Standard for Nassau County, NY 2010
MONTHLY COSTS adultadult + Infant
adult + Preschooler
adult + Infant
Preschooler
adult + Preschooler School-age
adult + School-age Teenager
adult + Infant
Preschooler School-age
2 Adults+ Infant
Preschooler
2 Adults + Preschooler School-age
2 Adults + Preschooler School-ageTeenager
Housing 1337 1579 1579 1579 1579 1579 2096 1579 1579 2096
Child Care 0 1164 1140 2304 1720 581 2884 2304 1720 1720
food 284 420 430 564 644 748 760 809 886 1082
Transportation 200 200 200 200 200 200 200 400 400 400
Health Care 166 422 420 436 445 479 461 509 518 566
Miscellaneous 199 379 377 508 459 359 640 560 510 586
Taxes 602 1201 1140 1879 1472 879 2609 1648 1374 1587
Earned Income Tax Credit (-) 0 0 0 0 0 0 0 0 0 0
Child Care Tax Credit (-) 0 -50 -50 -100 -100 -50 -100 -100 -100 -100
Child Tax Credit (-) 0 -83 -83 -167 -167 -167 -250 -167 -167 -250
Making Work Pay Credit (-) -33 -33 -33 -33 -33 -33 -33 -67 -67 -67
SELF-SUFFICIENCY WAGE
Hourly $15.65 $29.54 $29.08 $40.73 $35.34 $25.99 $52.65 $21.24 $18.90 $21.65
per adult per adult per adult
MONTHLY $2,754 $5,198 $5,119 $7,169 $6,220 $4,574 $9,266 $7,475 $6,654 $7,620
annual $33,052 $62,382 $61,424 $86,028 $74,634 $54,882 $111,196 $89,704 $79,853 $91,444
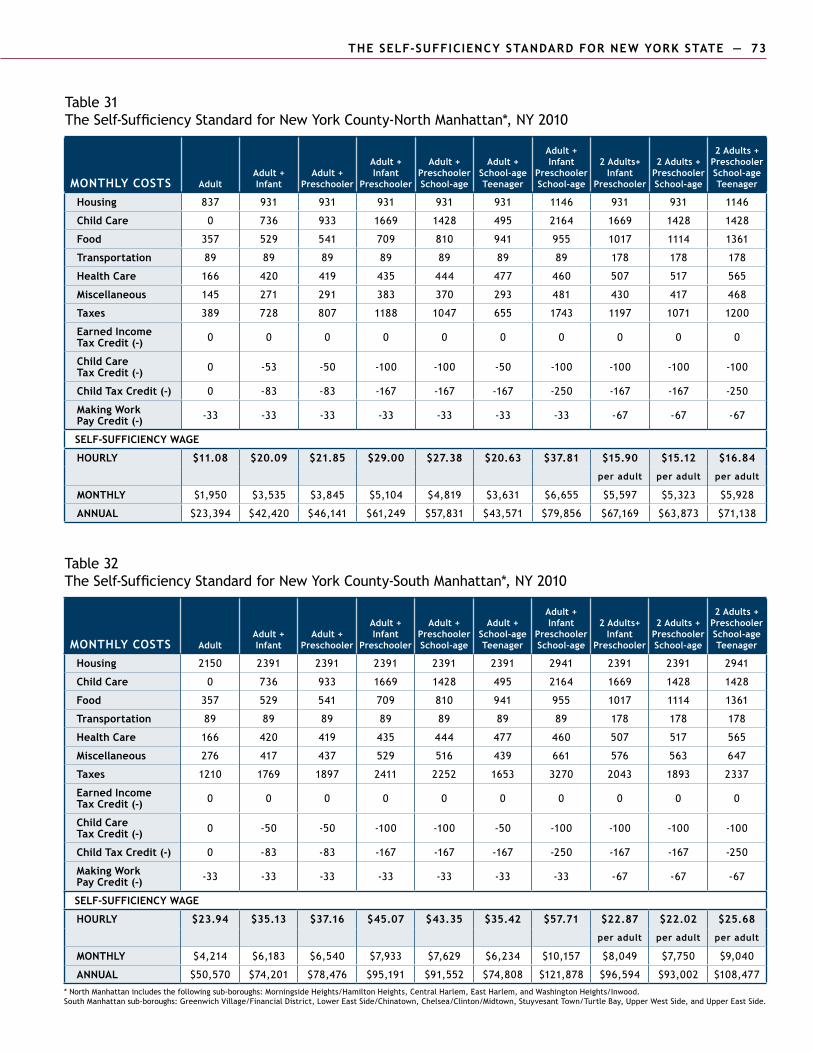
72 — THE SELF-SUFFICIENCY STANDARD FOR NEW YORK STATE THE SELF-SUFFICIENCY STANDARD FOR NEW YORK STATE — 73
Table 31 The Self-Sufficiency Standard for New York County-North Manhattan*, NY 2010
MONTHLY COSTS adultadult + Infant
adult + Preschooler
adult + Infant
Preschooler
adult + Preschooler School-age
adult + School-age Teenager
adult + Infant
Preschooler School-age
2 Adults+ Infant
Preschooler
2 Adults + Preschooler School-age
2 Adults + Preschooler School-ageTeenager
Housing 837 931 931 931 931 931 1146 931 931 1146
Child Care 0 736 933 1669 1428 495 2164 1669 1428 1428
food 357 529 541 709 810 941 955 1017 1114 1361
Transportation 89 89 89 89 89 89 89 178 178 178
Health Care 166 420 419 435 444 477 460 507 517 565
Miscellaneous 145 271 291 383 370 293 481 430 417 468
Taxes 389 728 807 1188 1047 655 1743 1197 1071 1200
Earned Income Tax Credit (-) 0 0 0 0 0 0 0 0 0 0
Child Care Tax Credit (-) 0 -53 -50 -100 -100 -50 -100 -100 -100 -100
Child Tax Credit (-) 0 -83 -83 -167 -167 -167 -250 -167 -167 -250
Making Work Pay Credit (-) -33 -33 -33 -33 -33 -33 -33 -67 -67 -67
SELF-SUFFICIENCY WAGE
Hourly $11.08 $20.09 $21.85 $29.00 $27.38 $20.63 $37.81 $15.90 $15.12 $16.84
per adult per adult per adult
MONTHLY $1,950 $3,535 $3,845 $5,104 $4,819 $3,631 $6,655 $5,597 $5,323 $5,928
annual $23,394 $42,420 $46,141 $61,249 $57,831 $43,571 $79,856 $67,169 $63,873 $71,138
Table 32 The Self-Sufficiency Standard for New York County-South Manhattan*, NY 2010
MONTHLY COSTS adultadult + Infant
adult + Preschooler
adult + Infant
Preschooler
adult + Preschooler School-age
adult + School-age Teenager
adult + Infant
Preschooler School-age
2 Adults+ Infant
Preschooler
2 Adults + Preschooler School-age
2 Adults + Preschooler School-ageTeenager
Housing 2150 2391 2391 2391 2391 2391 2941 2391 2391 2941
Child Care 0 736 933 1669 1428 495 2164 1669 1428 1428
food 357 529 541 709 810 941 955 1017 1114 1361
Transportation 89 89 89 89 89 89 89 178 178 178
Health Care 166 420 419 435 444 477 460 507 517 565
Miscellaneous 276 417 437 529 516 439 661 576 563 647
Taxes 1210 1769 1897 2411 2252 1653 3270 2043 1893 2337
Earned Income Tax Credit (-) 0 0 0 0 0 0 0 0 0 0
Child Care Tax Credit (-) 0 -50 -50 -100 -100 -50 -100 -100 -100 -100
Child Tax Credit (-) 0 -83 -83 -167 -167 -167 -250 -167 -167 -250
Making Work Pay Credit (-) -33 -33 -33 -33 -33 -33 -33 -67 -67 -67
SELF-SUFFICIENCY WAGE
Hourly $23.94 $35.13 $37.16 $45.07 $43.35 $35.42 $57.71 $22.87 $22.02 $25.68
per adult per adult per adult
MONTHLY $4,214 $6,183 $6,540 $7,933 $7,629 $6,234 $10,157 $8,049 $7,750 $9,040
annual $50,570 $74,201 $78,476 $95,191 $91,552 $74,808 $121,878 $96,594 $93,002 $108,477
* North Manhattan includes the following sub-boroughs: Morningside Heights/Hamilton Heights, Central Harlem, East Harlem, and Washington Heights/Inwood.South Manhattan sub-boroughs: Greenwich village/Financial District, Lower East Side/Chinatown, Chelsea/Clinton/Midtown, Stuyvesant Town/Turtle Bay, Upper West Side, and Upper East Side.

74 — THE SELF-SUFFICIENCY STANDARD FOR NEW YORK STATE THE SELF-SUFFICIENCY STANDARD FOR NEW YORK STATE — 75
Table 33 The Self-Sufficiency Standard for Niagara County, NY 2010
MONTHLY COSTS adultadult + Infant
adult + Preschooler
adult + Infant
Preschooler
adult + Preschooler School-age
adult + School-age Teenager
adult + Infant
Preschooler School-age
2 Adults+ Infant
Preschooler
2 Adults + Preschooler School-age
2 Adults + Preschooler School-ageTeenager
Housing 557 670 670 670 670 670 829 670 670 829
Child Care 0 617 688 1305 1140 452 1757 1305 1140 1140
food 238 352 360 472 540 627 636 678 742 907
Transportation 260 266 266 266 266 266 266 511 511 511
Health Care 144 340 339 355 364 397 380 427 437 485
Miscellaneous 120 225 232 307 298 241 387 359 350 387
Taxes 235 342 363 560 471 168 840 593 510 554
Earned Income Tax Credit (-) 0 -87 -58 0 0 -304 0 0 0 0
Child Care Tax Credit (-) 0 -68 -65 -100 -105 -64 -100 -100 -100 -100
Child Tax Credit (-) 0 -83 -83 -167 -167 -167 -250 -167 -167 -250
Making Work Pay Credit (-) -33 -33 -33 -33 -33 -33 -33 -67 -67 -67
SELF-SUFFICIENCY WAGE
Hourly $8.64 $14.44 $15.22 $20.65 $19.57 $12.80 $26.77 $11.96 $11.44 $12.48
per adult per adult per adult
MONTHLY $1,520 $2,542 $2,678 $3,634 $3,444 $2,252 $4,711 $4,210 $4,025 $4,394
annual $18,242 $30,500 $32,141 $43,612 $41,324 $27,027 $56,533 $50,517 $48,302 $52,731
Table 34 The Self-Sufficiency Standard for Oneida County, NY 2010
MONTHLY COSTS adultadult + Infant
adult + Preschooler
adult + Infant
Preschooler
adult + Preschooler School-age
adult + School-age Teenager
adult + Infant
Preschooler School-age
2 Adults+ Infant
Preschooler
2 Adults + Preschooler School-age
2 Adults + Preschooler School-ageTeenager
Housing 634 764 764 764 764 764 937 764 764 937
Child Care 0 617 688 1305 1140 452 1757 1305 1140 1140
food 236 350 358 469 536 622 632 673 737 900
Transportation 264 271 271 271 271 271 271 520 520 520
Health Care 155 382 381 396 406 439 421 469 478 526
Miscellaneous 129 238 246 320 312 255 402 373 364 402
Taxes 276 454 462 628 547 254 939 682 584 652
Earned Income Tax Credit (-) 0 -16 0 0 0 -216 0 0 0 0
Child Care Tax Credit (-) 0 -63 -60 -100 -100 -68 -100 -100 -100 -100
Child Tax Credit (-) 0 -83 -83 -167 -167 -167 -250 -167 -167 -250
Making Work Pay Credit (-) -33 -33 -33 -33 -33 -33 -33 -67 -67 -67
SELF-SUFFICIENCY WAGE
Hourly $9.44 $16.36 $17.00 $21.89 $20.88 $14.62 $28.26 $12.65 $12.08 $13.24
per adult per adult per adult
MONTHLY $1,662 $2,880 $2,993 $3,853 $3,674 $2,573 $4,974 $4,452 $4,253 $4,659
annual $19,941 $34,555 $35,910 $46,232 $44,089 $30,871 $59,691 $53,425 $51,037 $55,913
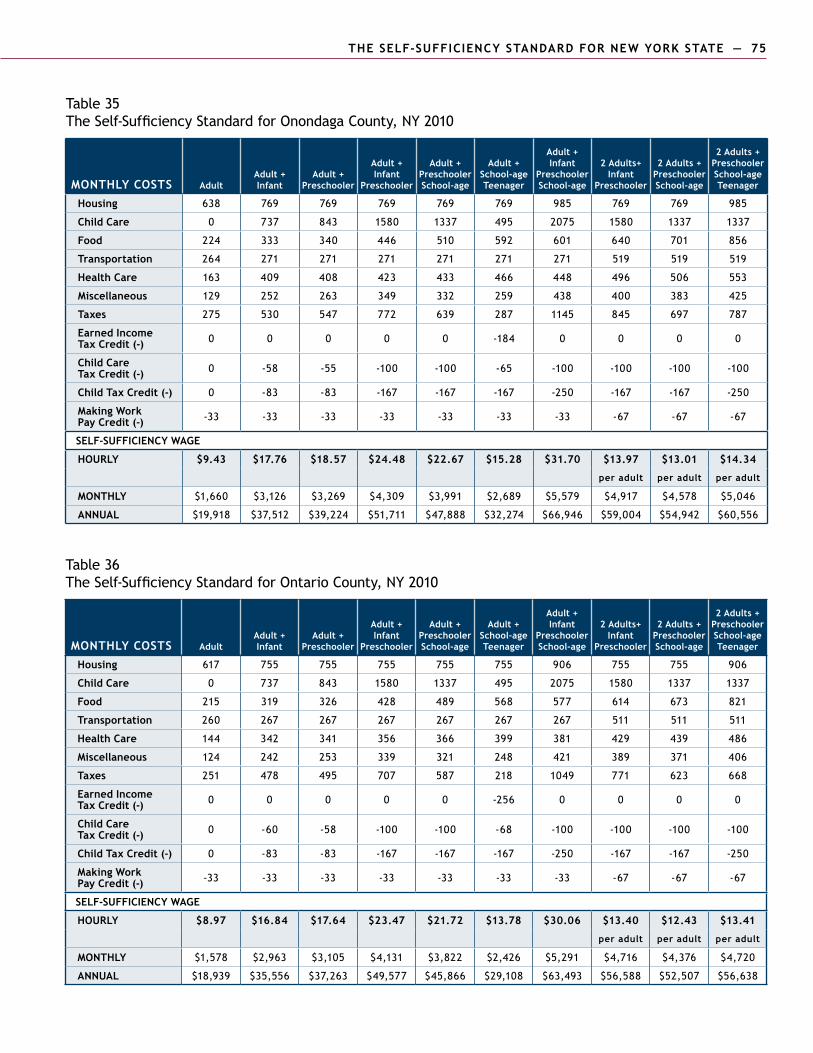
74 — THE SELF-SUFFICIENCY STANDARD FOR NEW YORK STATE THE SELF-SUFFICIENCY STANDARD FOR NEW YORK STATE — 75
Table 35 The Self-Sufficiency Standard for Onondaga County, NY 2010
MONTHLY COSTS adultadult + Infant
adult + Preschooler
adult + Infant
Preschooler
adult + Preschooler School-age
adult + School-age Teenager
adult + Infant
Preschooler School-age
2 Adults+ Infant
Preschooler
2 Adults + Preschooler School-age
2 Adults + Preschooler School-ageTeenager
Housing 638 769 769 769 769 769 985 769 769 985
Child Care 0 737 843 1580 1337 495 2075 1580 1337 1337
food 224 333 340 446 510 592 601 640 701 856
Transportation 264 271 271 271 271 271 271 519 519 519
Health Care 163 409 408 423 433 466 448 496 506 553
Miscellaneous 129 252 263 349 332 259 438 400 383 425
Taxes 275 530 547 772 639 287 1145 845 697 787
Earned Income Tax Credit (-) 0 0 0 0 0 -184 0 0 0 0
Child Care Tax Credit (-) 0 -58 -55 -100 -100 -65 -100 -100 -100 -100
Child Tax Credit (-) 0 -83 -83 -167 -167 -167 -250 -167 -167 -250
Making Work Pay Credit (-) -33 -33 -33 -33 -33 -33 -33 -67 -67 -67
SELF-SUFFICIENCY WAGE
Hourly $9.43 $17.76 $18.57 $24.48 $22.67 $15.28 $31.70 $13.97 $13.01 $14.34
per adult per adult per adult
MONTHLY $1,660 $3,126 $3,269 $4,309 $3,991 $2,689 $5,579 $4,917 $4,578 $5,046
annual $19,918 $37,512 $39,224 $51,711 $47,888 $32,274 $66,946 $59,004 $54,942 $60,556
Table 36 The Self-Sufficiency Standard for Ontario County, NY 2010
MONTHLY COSTS adultadult + Infant
adult + Preschooler
adult + Infant
Preschooler
adult + Preschooler School-age
adult + School-age Teenager
adult + Infant
Preschooler School-age
2 Adults+ Infant
Preschooler
2 Adults + Preschooler School-age
2 Adults + Preschooler School-ageTeenager
Housing 617 755 755 755 755 755 906 755 755 906
Child Care 0 737 843 1580 1337 495 2075 1580 1337 1337
food 215 319 326 428 489 568 577 614 673 821
Transportation 260 267 267 267 267 267 267 511 511 511
Health Care 144 342 341 356 366 399 381 429 439 486
Miscellaneous 124 242 253 339 321 248 421 389 371 406
Taxes 251 478 495 707 587 218 1049 771 623 668
Earned Income Tax Credit (-) 0 0 0 0 0 -256 0 0 0 0
Child Care Tax Credit (-) 0 -60 -58 -100 -100 -68 -100 -100 -100 -100
Child Tax Credit (-) 0 -83 -83 -167 -167 -167 -250 -167 -167 -250
Making Work Pay Credit (-) -33 -33 -33 -33 -33 -33 -33 -67 -67 -67
SELF-SUFFICIENCY WAGE
Hourly $8.97 $16.84 $17.64 $23.47 $21.72 $13.78 $30.06 $13.40 $12.43 $13.41
per adult per adult per adult
MONTHLY $1,578 $2,963 $3,105 $4,131 $3,822 $2,426 $5,291 $4,716 $4,376 $4,720
annual $18,939 $35,556 $37,263 $49,577 $45,866 $29,108 $63,493 $56,588 $52,507 $56,638
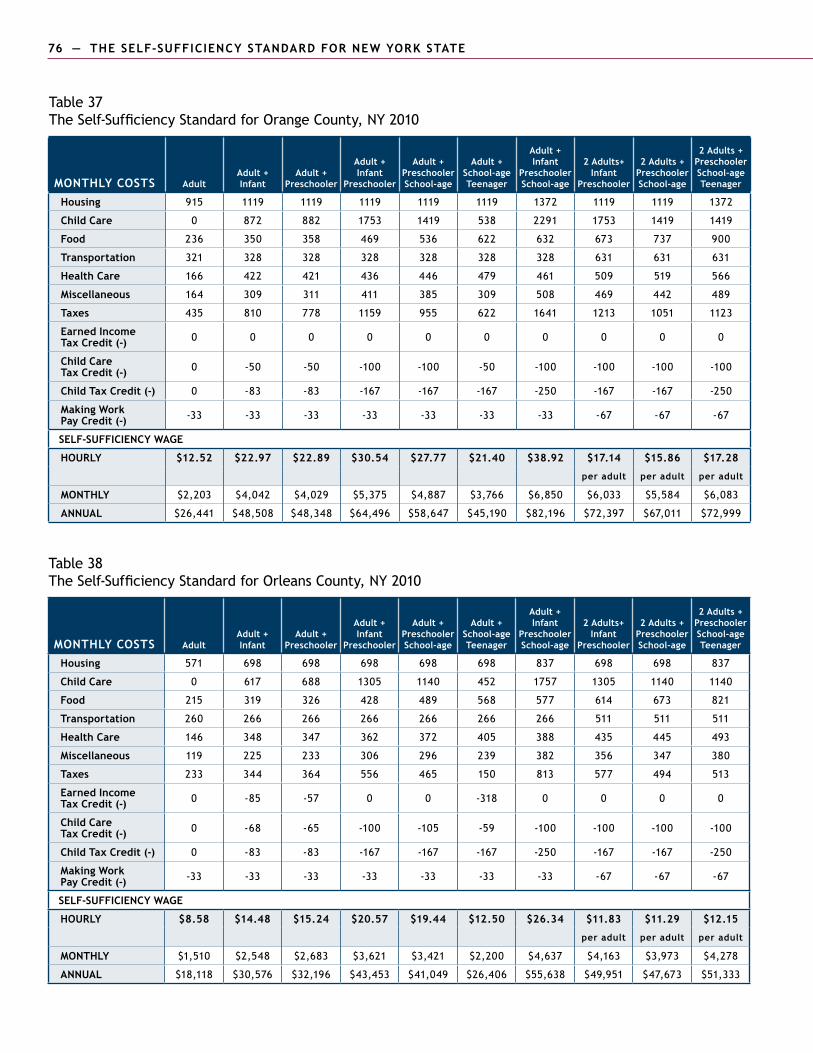
76 — THE SELF-SUFFICIENCY STANDARD FOR NEW YORK STATE THE SELF-SUFFICIENCY STANDARD FOR NEW YORK STATE — 77
Table 37 The Self-Sufficiency Standard for Orange County, NY 2010
MONTHLY COSTS adultadult + Infant
adult + Preschooler
adult + Infant
Preschooler
adult + Preschooler School-age
adult + School-age Teenager
adult + Infant
Preschooler School-age
2 Adults+ Infant
Preschooler
2 Adults + Preschooler School-age
2 Adults + Preschooler School-ageTeenager
Housing 915 1119 1119 1119 1119 1119 1372 1119 1119 1372
Child Care 0 872 882 1753 1419 538 2291 1753 1419 1419
food 236 350 358 469 536 622 632 673 737 900
Transportation 321 328 328 328 328 328 328 631 631 631
Health Care 166 422 421 436 446 479 461 509 519 566
Miscellaneous 164 309 311 411 385 309 508 469 442 489
Taxes 435 810 778 1159 955 622 1641 1213 1051 1123
Earned Income Tax Credit (-) 0 0 0 0 0 0 0 0 0 0
Child Care Tax Credit (-) 0 -50 -50 -100 -100 -50 -100 -100 -100 -100
Child Tax Credit (-) 0 -83 -83 -167 -167 -167 -250 -167 -167 -250
Making Work Pay Credit (-) -33 -33 -33 -33 -33 -33 -33 -67 -67 -67
SELF-SUFFICIENCY WAGE
Hourly $12.52 $22.97 $22.89 $30.54 $27.77 $21.40 $38.92 $17.14 $15.86 $17.28
per adult per adult per adult
MONTHLY $2,203 $4,042 $4,029 $5,375 $4,887 $3,766 $6,850 $6,033 $5,584 $6,083
annual $26,441 $48,508 $48,348 $64,496 $58,647 $45,190 $82,196 $72,397 $67,011 $72,999
Table 38 The Self-Sufficiency Standard for Orleans County, NY 2010
MONTHLY COSTS adultadult + Infant
adult + Preschooler
adult + Infant
Preschooler
adult + Preschooler School-age
adult + School-age Teenager
adult + Infant
Preschooler School-age
2 Adults+ Infant
Preschooler
2 Adults + Preschooler School-age
2 Adults + Preschooler School-ageTeenager
Housing 571 698 698 698 698 698 837 698 698 837
Child Care 0 617 688 1305 1140 452 1757 1305 1140 1140
food 215 319 326 428 489 568 577 614 673 821
Transportation 260 266 266 266 266 266 266 511 511 511
Health Care 146 348 347 362 372 405 388 435 445 493
Miscellaneous 119 225 233 306 296 239 382 356 347 380
Taxes 233 344 364 556 465 150 813 577 494 513
Earned Income Tax Credit (-) 0 -85 -57 0 0 -318 0 0 0 0
Child Care Tax Credit (-) 0 -68 -65 -100 -105 -59 -100 -100 -100 -100
Child Tax Credit (-) 0 -83 -83 -167 -167 -167 -250 -167 -167 -250
Making Work Pay Credit (-) -33 -33 -33 -33 -33 -33 -33 -67 -67 -67
SELF-SUFFICIENCY WAGE
Hourly $8.58 $14.48 $15.24 $20.57 $19.44 $12.50 $26.34 $11.83 $11.29 $12.15
per adult per adult per adult
MONTHLY $1,510 $2,548 $2,683 $3,621 $3,421 $2,200 $4,637 $4,163 $3,973 $4,278
annual $18,118 $30,576 $32,196 $43,453 $41,049 $26,406 $55,638 $49,951 $47,673 $51,333

76 — THE SELF-SUFFICIENCY STANDARD FOR NEW YORK STATE THE SELF-SUFFICIENCY STANDARD FOR NEW YORK STATE — 77
Table 39 The Self-Sufficiency Standard for Oswego County, NY 2010
MONTHLY COSTS adultadult + Infant
adult + Preschooler
adult + Infant
Preschooler
adult + Preschooler School-age
adult + School-age Teenager
adult + Infant
Preschooler School-age
2 Adults+ Infant
Preschooler
2 Adults + Preschooler School-age
2 Adults + Preschooler School-ageTeenager
Housing 599 722 722 722 722 722 924 722 722 924
Child Care 0 617 688 1305 1140 452 1757 1305 1140 1140
food 224 333 340 446 510 592 601 640 701 856
Transportation 254 261 261 261 261 261 261 500 500 500
Health Care 163 409 408 423 433 466 448 496 506 553
Miscellaneous 124 234 242 316 306 249 399 366 357 397
Taxes 254 423 434 602 519 229 917 637 540 617
Earned Income Tax Credit (-) 0 -37 -11 0 0 -248 0 0 0 0
Child Care Tax Credit (-) 0 -63 -63 -100 -100 -68 -100 -100 -100 -100
Child Tax Credit (-) 0 -83 -83 -167 -167 -167 -250 -167 -167 -250
Making Work Pay Credit (-) -33 -33 -33 -33 -33 -33 -33 -67 -67 -67
SELF-SUFFICIENCY WAGE
Hourly $9.00 $15.81 $16.50 $21.44 $20.40 $13.94 $27.97 $12.31 $11.73 $12.98
per adult per adult per adult
MONTHLY $1,584 $2,783 $2,904 $3,774 $3,590 $2,454 $4,923 $4,332 $4,131 $4,570
annual $19,013 $33,391 $34,844 $45,285 $43,080 $29,445 $59,082 $51,981 $49,568 $54,838
Table 40 The Self-Sufficiency Standard for Otsego County, NY 2010
MONTHLY COSTS adultadult + Infant
adult + Preschooler
adult + Infant
Preschooler
adult + Preschooler School-age
adult + School-age Teenager
adult + Infant
Preschooler School-age
2 Adults+ Infant
Preschooler
2 Adults + Preschooler School-age
2 Adults + Preschooler School-ageTeenager
Housing 629 739 739 739 739 739 982 739 739 982
Child Care 0 617 688 1305 1140 452 1757 1305 1140 1140
food 236 350 358 469 536 622 632 673 737 900
Transportation 264 271 271 271 271 271 271 520 520 520
Health Care 156 385 384 399 409 442 424 472 482 530
Miscellaneous 129 236 244 318 309 253 407 371 362 407
Taxes 273 437 450 614 534 247 965 665 568 677
Earned Income Tax Credit (-) 0 -27 -1 0 0 -227 0 0 0 0
Child Care Tax Credit (-) 0 -63 -60 -100 -100 -68 -100 -100 -100 -100
Child Tax Credit (-) 0 -83 -83 -167 -167 -167 -250 -167 -167 -250
Making Work Pay Credit (-) -33 -33 -33 -33 -33 -33 -33 -67 -67 -67
SELF-SUFFICIENCY WAGE
Hourly $9.40 $16.08 $16.80 $21.68 $20.67 $14.38 $28.72 $12.54 $11.97 $13.46
per adult per adult per adult
MONTHLY $1,654 $2,829 $2,956 $3,816 $3,638 $2,531 $5,054 $4,413 $4,214 $4,739
annual $19,849 $33,953 $35,476 $45,795 $43,652 $30,367 $60,648 $52,950 $50,564 $56,863
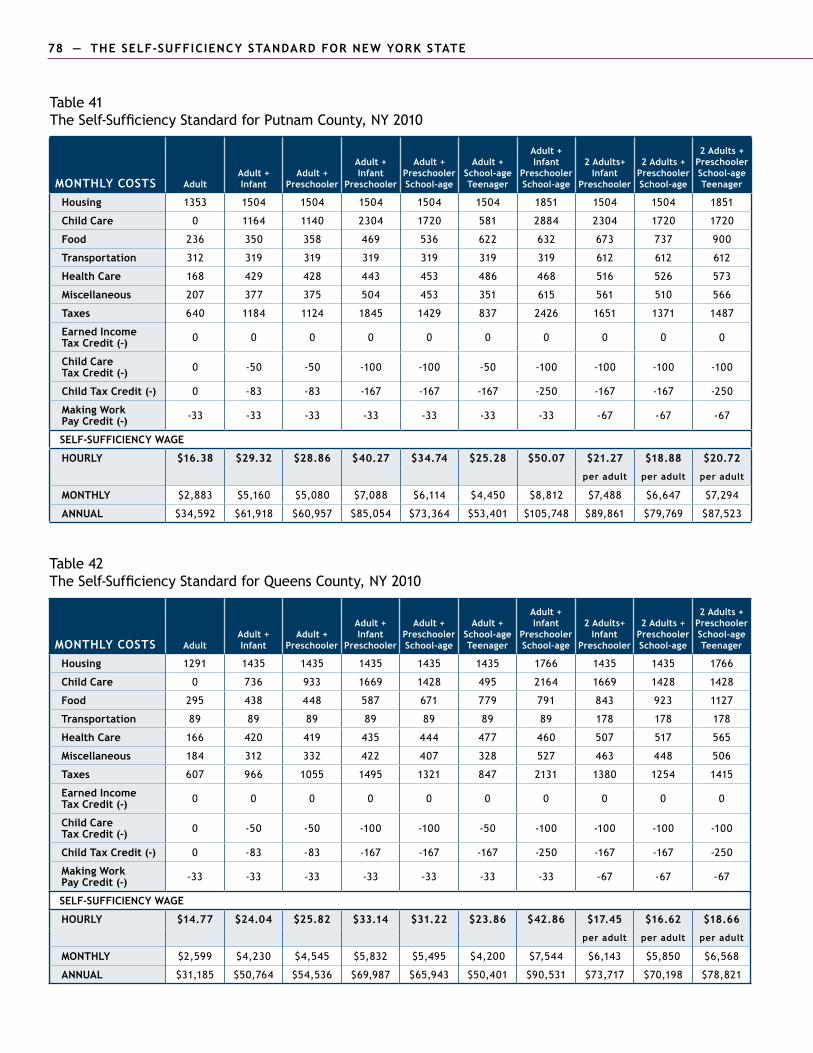
78 — THE SELF-SUFFICIENCY STANDARD FOR NEW YORK STATE THE SELF-SUFFICIENCY STANDARD FOR NEW YORK STATE — 79
Table 41 The Self-Sufficiency Standard for Putnam County, NY 2010
MONTHLY COSTS adultadult + Infant
adult + Preschooler
adult + Infant
Preschooler
adult + Preschooler School-age
adult + School-age Teenager
adult + Infant
Preschooler School-age
2 Adults+ Infant
Preschooler
2 Adults + Preschooler School-age
2 Adults + Preschooler School-ageTeenager
Housing 1353 1504 1504 1504 1504 1504 1851 1504 1504 1851
Child Care 0 1164 1140 2304 1720 581 2884 2304 1720 1720
food 236 350 358 469 536 622 632 673 737 900
Transportation 312 319 319 319 319 319 319 612 612 612
Health Care 168 429 428 443 453 486 468 516 526 573
Miscellaneous 207 377 375 504 453 351 615 561 510 566
Taxes 640 1184 1124 1845 1429 837 2426 1651 1371 1487
Earned Income Tax Credit (-) 0 0 0 0 0 0 0 0 0 0
Child Care Tax Credit (-) 0 -50 -50 -100 -100 -50 -100 -100 -100 -100
Child Tax Credit (-) 0 -83 -83 -167 -167 -167 -250 -167 -167 -250
Making Work Pay Credit (-) -33 -33 -33 -33 -33 -33 -33 -67 -67 -67
SELF-SUFFICIENCY WAGE
Hourly $16.38 $29.32 $28.86 $40.27 $34.74 $25.28 $50.07 $21.27 $18.88 $20.72
per adult per adult per adult
MONTHLY $2,883 $5,160 $5,080 $7,088 $6,114 $4,450 $8,812 $7,488 $6,647 $7,294
annual $34,592 $61,918 $60,957 $85,054 $73,364 $53,401 $105,748 $89,861 $79,769 $87,523
Table 42 The Self-Sufficiency Standard for Queens County, NY 2010
MONTHLY COSTS adultadult + Infant
adult + Preschooler
adult + Infant
Preschooler
adult + Preschooler School-age
adult + School-age Teenager
adult + Infant
Preschooler School-age
2 Adults+ Infant
Preschooler
2 Adults + Preschooler School-age
2 Adults + Preschooler School-ageTeenager
Housing 1291 1435 1435 1435 1435 1435 1766 1435 1435 1766
Child Care 0 736 933 1669 1428 495 2164 1669 1428 1428
food 295 438 448 587 671 779 791 843 923 1127
Transportation 89 89 89 89 89 89 89 178 178 178
Health Care 166 420 419 435 444 477 460 507 517 565
Miscellaneous 184 312 332 422 407 328 527 463 448 506
Taxes 607 966 1055 1495 1321 847 2131 1380 1254 1415
Earned Income Tax Credit (-) 0 0 0 0 0 0 0 0 0 0
Child Care Tax Credit (-) 0 -50 -50 -100 -100 -50 -100 -100 -100 -100
Child Tax Credit (-) 0 -83 -83 -167 -167 -167 -250 -167 -167 -250
Making Work Pay Credit (-) -33 -33 -33 -33 -33 -33 -33 -67 -67 -67
SELF-SUFFICIENCY WAGE
Hourly $14.77 $24.04 $25.82 $33.14 $31.22 $23.86 $42.86 $17.45 $16.62 $18.66
per adult per adult per adult
MONTHLY $2,599 $4,230 $4,545 $5,832 $5,495 $4,200 $7,544 $6,143 $5,850 $6,568
annual $31,185 $50,764 $54,536 $69,987 $65,943 $50,401 $90,531 $73,717 $70,198 $78,821
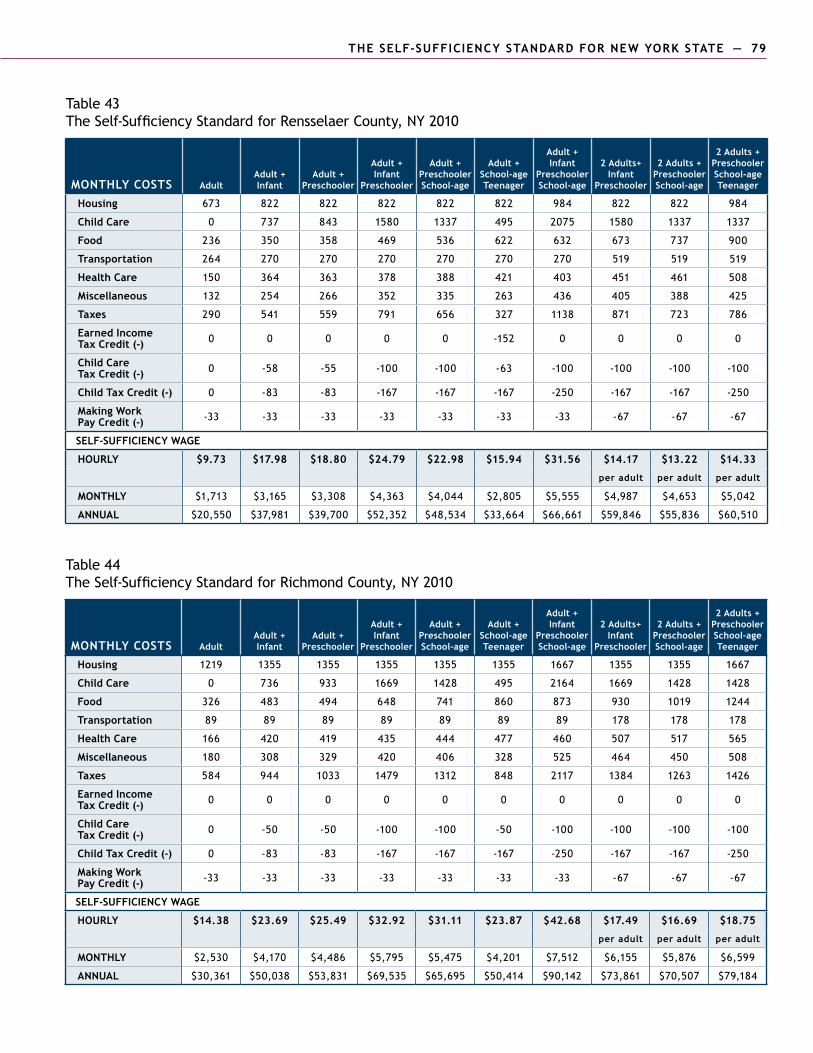
78 — THE SELF-SUFFICIENCY STANDARD FOR NEW YORK STATE THE SELF-SUFFICIENCY STANDARD FOR NEW YORK STATE — 79
Table 43 The Self-Sufficiency Standard for Rensselaer County, NY 2010
MONTHLY COSTS adultadult + Infant
adult + Preschooler
adult + Infant
Preschooler
adult + Preschooler School-age
adult + School-age Teenager
adult + Infant
Preschooler School-age
2 Adults+ Infant
Preschooler
2 Adults + Preschooler School-age
2 Adults + Preschooler School-ageTeenager
Housing 673 822 822 822 822 822 984 822 822 984
Child Care 0 737 843 1580 1337 495 2075 1580 1337 1337
food 236 350 358 469 536 622 632 673 737 900
Transportation 264 270 270 270 270 270 270 519 519 519
Health Care 150 364 363 378 388 421 403 451 461 508
Miscellaneous 132 254 266 352 335 263 436 405 388 425
Taxes 290 541 559 791 656 327 1138 871 723 786
Earned Income Tax Credit (-) 0 0 0 0 0 -152 0 0 0 0
Child Care Tax Credit (-) 0 -58 -55 -100 -100 -63 -100 -100 -100 -100
Child Tax Credit (-) 0 -83 -83 -167 -167 -167 -250 -167 -167 -250
Making Work Pay Credit (-) -33 -33 -33 -33 -33 -33 -33 -67 -67 -67
SELF-SUFFICIENCY WAGE
Hourly $9.73 $17.98 $18.80 $24.79 $22.98 $15.94 $31.56 $14.17 $13.22 $14.33
per adult per adult per adult
MONTHLY $1,713 $3,165 $3,308 $4,363 $4,044 $2,805 $5,555 $4,987 $4,653 $5,042
annual $20,550 $37,981 $39,700 $52,352 $48,534 $33,664 $66,661 $59,846 $55,836 $60,510
Table 44 The Self-Sufficiency Standard for Richmond County, NY 2010
MONTHLY COSTS adultadult + Infant
adult + Preschooler
adult + Infant
Preschooler
adult + Preschooler School-age
adult + School-age Teenager
adult + Infant
Preschooler School-age
2 Adults+ Infant
Preschooler
2 Adults + Preschooler School-age
2 Adults + Preschooler School-ageTeenager
Housing 1219 1355 1355 1355 1355 1355 1667 1355 1355 1667
Child Care 0 736 933 1669 1428 495 2164 1669 1428 1428
food 326 483 494 648 741 860 873 930 1019 1244
Transportation 89 89 89 89 89 89 89 178 178 178
Health Care 166 420 419 435 444 477 460 507 517 565
Miscellaneous 180 308 329 420 406 328 525 464 450 508
Taxes 584 944 1033 1479 1312 848 2117 1384 1263 1426
Earned Income Tax Credit (-) 0 0 0 0 0 0 0 0 0 0
Child Care Tax Credit (-) 0 -50 -50 -100 -100 -50 -100 -100 -100 -100
Child Tax Credit (-) 0 -83 -83 -167 -167 -167 -250 -167 -167 -250
Making Work Pay Credit (-) -33 -33 -33 -33 -33 -33 -33 -67 -67 -67
SELF-SUFFICIENCY WAGE
Hourly $14.38 $23.69 $25.49 $32.92 $31.11 $23.87 $42.68 $17.49 $16.69 $18.75
per adult per adult per adult
MONTHLY $2,530 $4,170 $4,486 $5,795 $5,475 $4,201 $7,512 $6,155 $5,876 $6,599
annual $30,361 $50,038 $53,831 $69,535 $65,695 $50,414 $90,142 $73,861 $70,507 $79,184
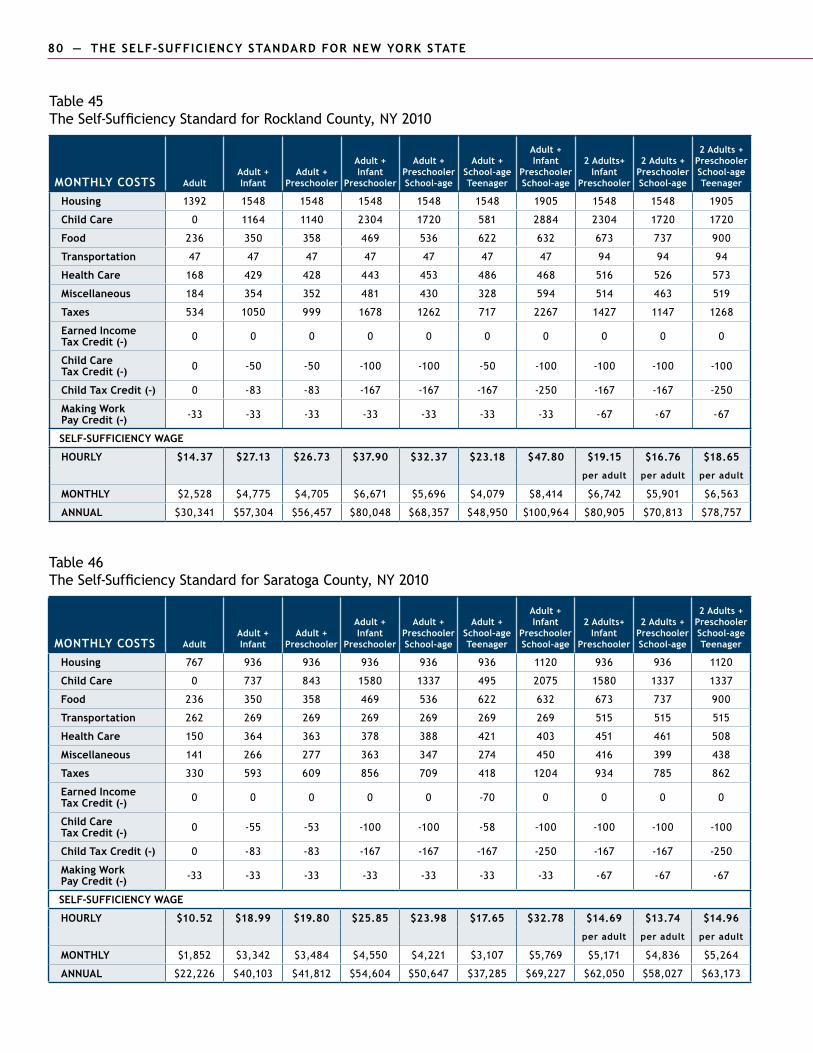
80 — THE SELF-SUFFICIENCY STANDARD FOR NEW YORK STATE THE SELF-SUFFICIENCY STANDARD FOR NEW YORK STATE — 81
Table 45 The Self-Sufficiency Standard for Rockland County, NY 2010
MONTHLY COSTS adultadult + Infant
adult + Preschooler
adult + Infant
Preschooler
adult + Preschooler School-age
adult + School-age Teenager
adult + Infant
Preschooler School-age
2 Adults+ Infant
Preschooler
2 Adults + Preschooler School-age
2 Adults + Preschooler School-ageTeenager
Housing 1392 1548 1548 1548 1548 1548 1905 1548 1548 1905
Child Care 0 1164 1140 2304 1720 581 2884 2304 1720 1720
food 236 350 358 469 536 622 632 673 737 900
Transportation 47 47 47 47 47 47 47 94 94 94
Health Care 168 429 428 443 453 486 468 516 526 573
Miscellaneous 184 354 352 481 430 328 594 514 463 519
Taxes 534 1050 999 1678 1262 717 2267 1427 1147 1268
Earned Income Tax Credit (-) 0 0 0 0 0 0 0 0 0 0
Child Care Tax Credit (-) 0 -50 -50 -100 -100 -50 -100 -100 -100 -100
Child Tax Credit (-) 0 -83 -83 -167 -167 -167 -250 -167 -167 -250
Making Work Pay Credit (-) -33 -33 -33 -33 -33 -33 -33 -67 -67 -67
SELF-SUFFICIENCY WAGE
Hourly $14.37 $27.13 $26.73 $37.90 $32.37 $23.18 $47.80 $19.15 $16.76 $18.65
per adult per adult per adult
MONTHLY $2,528 $4,775 $4,705 $6,671 $5,696 $4,079 $8,414 $6,742 $5,901 $6,563
annual $30,341 $57,304 $56,457 $80,048 $68,357 $48,950 $100,964 $80,905 $70,813 $78,757
Table 46 The Self-Sufficiency Standard for Saratoga County, NY 2010
MONTHLY COSTS adultadult + Infant
adult + Preschooler
adult + Infant
Preschooler
adult + Preschooler School-age
adult + School-age Teenager
adult + Infant
Preschooler School-age
2 Adults+ Infant
Preschooler
2 Adults + Preschooler School-age
2 Adults + Preschooler School-ageTeenager
Housing 767 936 936 936 936 936 1120 936 936 1120
Child Care 0 737 843 1580 1337 495 2075 1580 1337 1337
food 236 350 358 469 536 622 632 673 737 900
Transportation 262 269 269 269 269 269 269 515 515 515
Health Care 150 364 363 378 388 421 403 451 461 508
Miscellaneous 141 266 277 363 347 274 450 416 399 438
Taxes 330 593 609 856 709 418 1204 934 785 862
Earned Income Tax Credit (-) 0 0 0 0 0 -70 0 0 0 0
Child Care Tax Credit (-) 0 -55 -53 -100 -100 -58 -100 -100 -100 -100
Child Tax Credit (-) 0 -83 -83 -167 -167 -167 -250 -167 -167 -250
Making Work Pay Credit (-) -33 -33 -33 -33 -33 -33 -33 -67 -67 -67
SELF-SUFFICIENCY WAGE
Hourly $10.52 $18.99 $19.80 $25.85 $23.98 $17.65 $32.78 $14.69 $13.74 $14.96
per adult per adult per adult
MONTHLY $1,852 $3,342 $3,484 $4,550 $4,221 $3,107 $5,769 $5,171 $4,836 $5,264
annual $22,226 $40,103 $41,812 $54,604 $50,647 $37,285 $69,227 $62,050 $58,027 $63,173
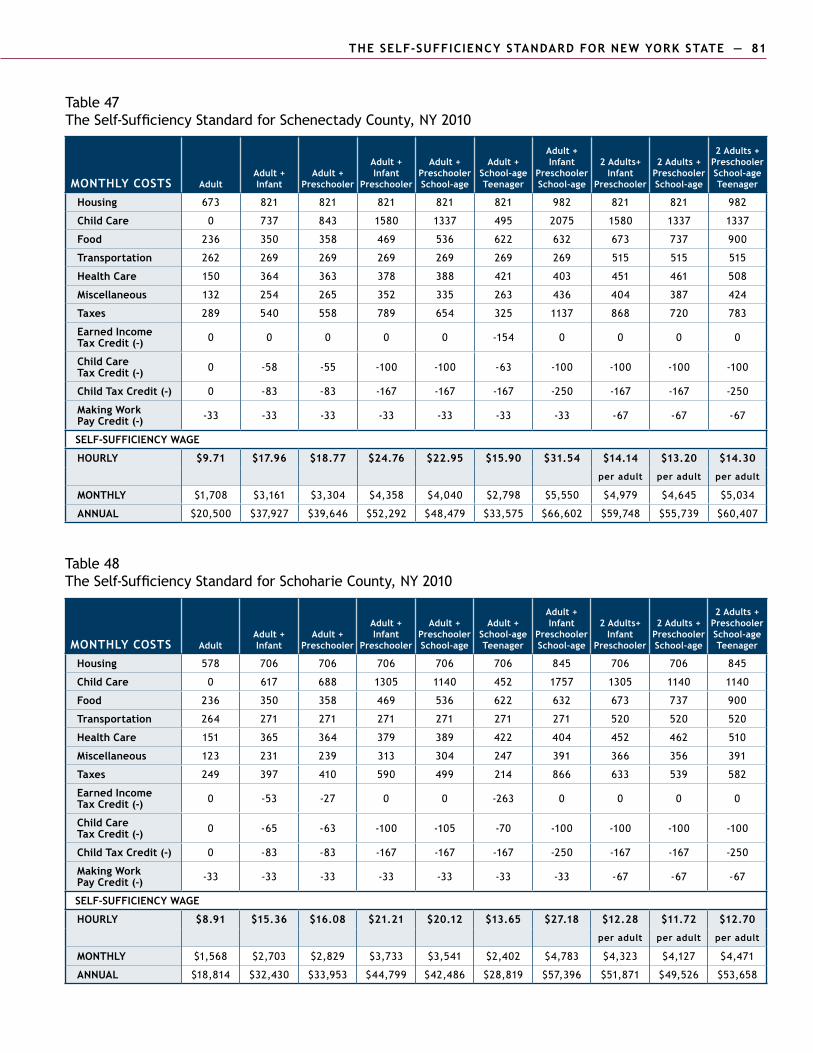
80 — THE SELF-SUFFICIENCY STANDARD FOR NEW YORK STATE THE SELF-SUFFICIENCY STANDARD FOR NEW YORK STATE — 81
Table 47 The Self-Sufficiency Standard for Schenectady County, NY 2010
MONTHLY COSTS adultadult + Infant
adult + Preschooler
adult + Infant
Preschooler
adult + Preschooler School-age
adult + School-age Teenager
adult + Infant
Preschooler School-age
2 Adults+ Infant
Preschooler
2 Adults + Preschooler School-age
2 Adults + Preschooler School-ageTeenager
Housing 673 821 821 821 821 821 982 821 821 982
Child Care 0 737 843 1580 1337 495 2075 1580 1337 1337
food 236 350 358 469 536 622 632 673 737 900
Transportation 262 269 269 269 269 269 269 515 515 515
Health Care 150 364 363 378 388 421 403 451 461 508
Miscellaneous 132 254 265 352 335 263 436 404 387 424
Taxes 289 540 558 789 654 325 1137 868 720 783
Earned Income Tax Credit (-) 0 0 0 0 0 -154 0 0 0 0
Child Care Tax Credit (-) 0 -58 -55 -100 -100 -63 -100 -100 -100 -100
Child Tax Credit (-) 0 -83 -83 -167 -167 -167 -250 -167 -167 -250
Making Work Pay Credit (-) -33 -33 -33 -33 -33 -33 -33 -67 -67 -67
SELF-SUFFICIENCY WAGE
Hourly $9.71 $17.96 $18.77 $24.76 $22.95 $15.90 $31.54 $14.14 $13.20 $14.30
per adult per adult per adult
MONTHLY $1,708 $3,161 $3,304 $4,358 $4,040 $2,798 $5,550 $4,979 $4,645 $5,034
annual $20,500 $37,927 $39,646 $52,292 $48,479 $33,575 $66,602 $59,748 $55,739 $60,407
Table 48 The Self-Sufficiency Standard for Schoharie County, NY 2010
MONTHLY COSTS adultadult + Infant
adult + Preschooler
adult + Infant
Preschooler
adult + Preschooler School-age
adult + School-age Teenager
adult + Infant
Preschooler School-age
2 Adults+ Infant
Preschooler
2 Adults + Preschooler School-age
2 Adults + Preschooler School-ageTeenager
Housing 578 706 706 706 706 706 845 706 706 845
Child Care 0 617 688 1305 1140 452 1757 1305 1140 1140
food 236 350 358 469 536 622 632 673 737 900
Transportation 264 271 271 271 271 271 271 520 520 520
Health Care 151 365 364 379 389 422 404 452 462 510
Miscellaneous 123 231 239 313 304 247 391 366 356 391
Taxes 249 397 410 590 499 214 866 633 539 582
Earned Income Tax Credit (-) 0 -53 -27 0 0 -263 0 0 0 0
Child Care Tax Credit (-) 0 -65 -63 -100 -105 -70 -100 -100 -100 -100
Child Tax Credit (-) 0 -83 -83 -167 -167 -167 -250 -167 -167 -250
Making Work Pay Credit (-) -33 -33 -33 -33 -33 -33 -33 -67 -67 -67
SELF-SUFFICIENCY WAGE
Hourly $8.91 $15.36 $16.08 $21.21 $20.12 $13.65 $27.18 $12.28 $11.72 $12.70
per adult per adult per adult
MONTHLY $1,568 $2,703 $2,829 $3,733 $3,541 $2,402 $4,783 $4,323 $4,127 $4,471
annual $18,814 $32,430 $33,953 $44,799 $42,486 $28,819 $57,396 $51,871 $49,526 $53,658

82 — THE SELF-SUFFICIENCY STANDARD FOR NEW YORK STATE THE SELF-SUFFICIENCY STANDARD FOR NEW YORK STATE — 83
Table 49 The Self-Sufficiency Standard for Schuyler County, NY 2010
MONTHLY COSTS adultadult + Infant
adult + Preschooler
adult + Infant
Preschooler
adult + Preschooler School-age
adult + School-age Teenager
adult + Infant
Preschooler School-age
2 Adults+ Infant
Preschooler
2 Adults + Preschooler School-age
2 Adults + Preschooler School-ageTeenager
Housing 636 762 762 762 762 762 1016 762 762 1016
Child Care 0 617 688 1305 1140 452 1757 1305 1140 1140
food 236 350 358 469 536 622 632 673 737 900
Transportation 260 266 266 266 266 266 266 511 511 511
Health Care 154 379 377 393 402 436 418 466 475 523
Miscellaneous 129 237 245 320 311 254 409 372 362 409
Taxes 274 445 455 620 539 242 979 669 572 687
Earned Income Tax Credit (-) 0 -22 0 0 0 -224 0 0 0 0
Child Care Tax Credit (-) 0 -63 -60 -100 -100 -68 -100 -100 -100 -100
Child Tax Credit (-) 0 -83 -83 -167 -167 -167 -250 -167 -167 -250
Making Work Pay Credit (-) -33 -33 -33 -33 -33 -33 -33 -67 -67 -67
SELF-SUFFICIENCY WAGE
Hourly $9.40 $16.22 $16.91 $21.79 $20.77 $14.44 $28.94 $12.57 $12.00 $13.55
per adult per adult per adult
MONTHLY $1,655 $2,855 $2,975 $3,835 $3,656 $2,542 $5,093 $4,424 $4,225 $4,769
annual $19,856 $34,263 $35,704 $46,015 $43,873 $30,502 $61,119 $53,092 $50,705 $57,229
Table 50 The Self-Sufficiency Standard for Seneca County, NY 2010
MONTHLY COSTS adultadult + Infant
adult + Preschooler
adult + Infant
Preschooler
adult + Preschooler School-age
adult + School-age Teenager
adult + Infant
Preschooler School-age
2 Adults+ Infant
Preschooler
2 Adults + Preschooler School-age
2 Adults + Preschooler School-ageTeenager
Housing 671 805 805 805 805 805 1059 805 805 1059
Child Care 0 617 688 1305 1140 452 1757 1305 1140 1140
food 236 350 358 469 536 622 632 673 737 900
Transportation 260 266 266 266 266 266 266 511 511 511
Health Care 144 342 341 356 366 399 381 429 439 486
Miscellaneous 131 238 246 320 311 254 409 372 363 410
Taxes 285 449 458 623 542 249 983 673 575 691
Earned Income Tax Credit (-) 0 -19 0 0 0 -219 0 0 0 0
Child Care Tax Credit (-) 0 -63 -60 -100 -100 -68 -100 -100 -100 -100
Child Tax Credit (-) 0 -83 -83 -167 -167 -167 -250 -167 -167 -250
Making Work Pay Credit (-) -33 -33 -33 -33 -33 -33 -33 -67 -67 -67
SELF-SUFFICIENCY WAGE
Hourly $9.62 $16.30 $16.96 $21.84 $20.83 $14.55 $29.00 $12.60 $12.03 $13.58
per adult per adult per adult
MONTHLY $1,693 $2,869 $2,985 $3,844 $3,666 $2,562 $5,104 $4,435 $4,236 $4,780
annual $20,318 $34,430 $35,821 $46,133 $43,991 $30,739 $61,249 $53,220 $50,833 $57,357
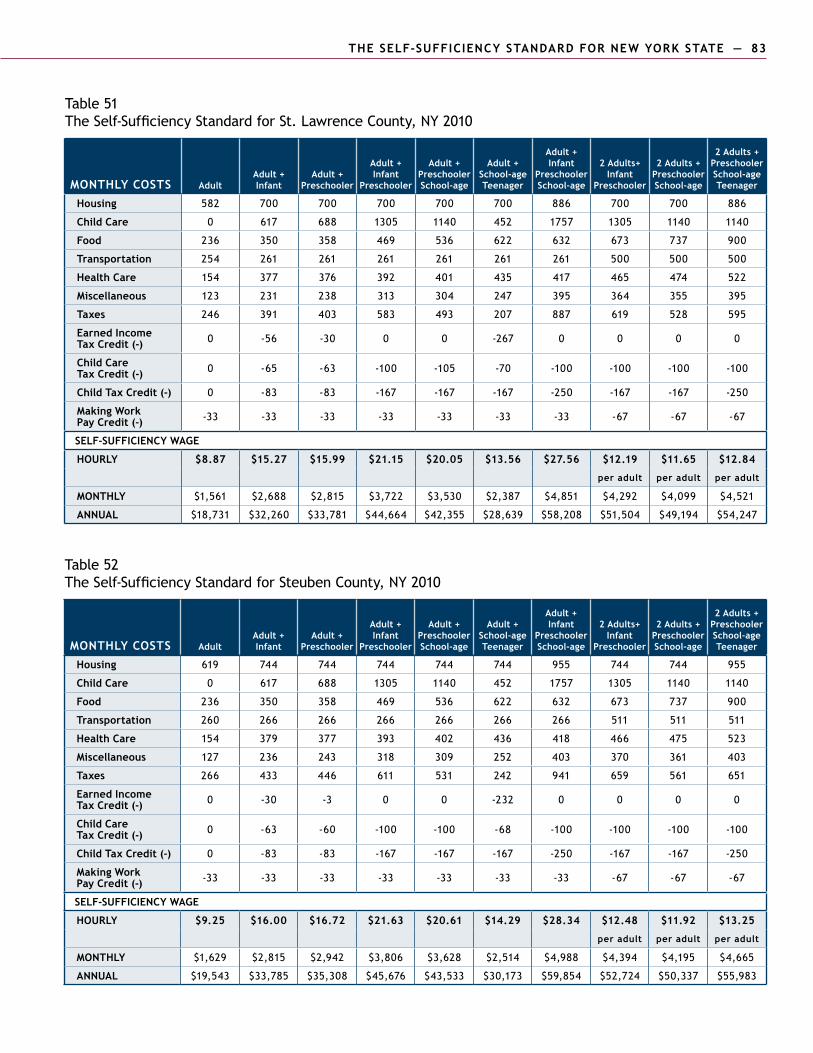
82 — THE SELF-SUFFICIENCY STANDARD FOR NEW YORK STATE THE SELF-SUFFICIENCY STANDARD FOR NEW YORK STATE — 83
Table 51 The Self-Sufficiency Standard for St. Lawrence County, NY 2010
MONTHLY COSTS adultadult + Infant
adult + Preschooler
adult + Infant
Preschooler
adult + Preschooler School-age
adult + School-age Teenager
adult + Infant
Preschooler School-age
2 Adults+ Infant
Preschooler
2 Adults + Preschooler School-age
2 Adults + Preschooler School-ageTeenager
Housing 582 700 700 700 700 700 886 700 700 886
Child Care 0 617 688 1305 1140 452 1757 1305 1140 1140
food 236 350 358 469 536 622 632 673 737 900
Transportation 254 261 261 261 261 261 261 500 500 500
Health Care 154 377 376 392 401 435 417 465 474 522
Miscellaneous 123 231 238 313 304 247 395 364 355 395
Taxes 246 391 403 583 493 207 887 619 528 595
Earned Income Tax Credit (-) 0 -56 -30 0 0 -267 0 0 0 0
Child Care Tax Credit (-) 0 -65 -63 -100 -105 -70 -100 -100 -100 -100
Child Tax Credit (-) 0 -83 -83 -167 -167 -167 -250 -167 -167 -250
Making Work Pay Credit (-) -33 -33 -33 -33 -33 -33 -33 -67 -67 -67
SELF-SUFFICIENCY WAGE
Hourly $8.87 $15.27 $15.99 $21.15 $20.05 $13.56 $27.56 $12.19 $11.65 $12.84
per adult per adult per adult
MONTHLY $1,561 $2,688 $2,815 $3,722 $3,530 $2,387 $4,851 $4,292 $4,099 $4,521
annual $18,731 $32,260 $33,781 $44,664 $42,355 $28,639 $58,208 $51,504 $49,194 $54,247
Table 52 The Self-Sufficiency Standard for Steuben County, NY 2010
MONTHLY COSTS adultadult + Infant
adult + Preschooler
adult + Infant
Preschooler
adult + Preschooler School-age
adult + School-age Teenager
adult + Infant
Preschooler School-age
2 Adults+ Infant
Preschooler
2 Adults + Preschooler School-age
2 Adults + Preschooler School-ageTeenager
Housing 619 744 744 744 744 744 955 744 744 955
Child Care 0 617 688 1305 1140 452 1757 1305 1140 1140
food 236 350 358 469 536 622 632 673 737 900
Transportation 260 266 266 266 266 266 266 511 511 511
Health Care 154 379 377 393 402 436 418 466 475 523
Miscellaneous 127 236 243 318 309 252 403 370 361 403
Taxes 266 433 446 611 531 242 941 659 561 651
Earned Income Tax Credit (-) 0 -30 -3 0 0 -232 0 0 0 0
Child Care Tax Credit (-) 0 -63 -60 -100 -100 -68 -100 -100 -100 -100
Child Tax Credit (-) 0 -83 -83 -167 -167 -167 -250 -167 -167 -250
Making Work Pay Credit (-) -33 -33 -33 -33 -33 -33 -33 -67 -67 -67
SELF-SUFFICIENCY WAGE
Hourly $9.25 $16.00 $16.72 $21.63 $20.61 $14.29 $28.34 $12.48 $11.92 $13.25
per adult per adult per adult
MONTHLY $1,629 $2,815 $2,942 $3,806 $3,628 $2,514 $4,988 $4,394 $4,195 $4,665
annual $19,543 $33,785 $35,308 $45,676 $43,533 $30,173 $59,854 $52,724 $50,337 $55,983

84 — THE SELF-SUFFICIENCY STANDARD FOR NEW YORK STATE THE SELF-SUFFICIENCY STANDARD FOR NEW YORK STATE — 85
Table 53 The Self-Sufficiency Standard for Suffolk County, NY 2010
MONTHLY COSTS adultadult + Infant
adult + Preschooler
adult + Infant
Preschooler
adult + Preschooler School-age
adult + School-age Teenager
adult + Infant
Preschooler School-age
2 Adults+ Infant
Preschooler
2 Adults + Preschooler School-age
2 Adults + Preschooler School-ageTeenager
Housing 1359 1605 1605 1605 1605 1605 2130 1605 1605 2130
Child Care 0 1164 1140 2304 1720 581 2884 2304 1720 1720
food 284 420 430 564 644 748 760 809 886 1082
Transportation 362 368 368 368 368 368 368 712 712 712
Health Care 166 422 420 436 445 479 461 509 518 566
Miscellaneous 217 398 396 528 478 378 660 594 544 621
Taxes 689 1356 1298 2021 1615 985 2758 1839 1534 1757
Earned Income Tax Credit (-) 0 0 0 0 0 0 0 0 0 0
Child Care Tax Credit (-) 0 -50 -50 -100 -100 -50 -100 -100 -100 -100
Child Tax Credit (-) 0 -83 -83 -167 -167 -167 -250 -167 -167 -250
Making Work Pay Credit (-) -33 -33 -33 -33 -33 -33 -33 -67 -67 -67
SELF-SUFFICIENCY WAGE
Hourly $17.29 $31.63 $31.20 $42.76 $37.37 $27.81 $54.77 $22.84 $20.42 $23.22
per adult per adult per adult
MONTHLY $3,044 $5,567 $5,491 $7,526 $6,576 $4,894 $9,639 $8,038 $7,187 $8,173
annual $36,522 $66,803 $65,895 $90,310 $78,916 $58,731 $115,665 $96,458 $86,245 $98,071
Table 54 The Self-Sufficiency Standard for Sullivan County, NY 2010
MONTHLY COSTS adultadult + Infant
adult + Preschooler
adult + Infant
Preschooler
adult + Preschooler School-age
adult + School-age Teenager
adult + Infant
Preschooler School-age
2 Adults+ Infant
Preschooler
2 Adults + Preschooler School-age
2 Adults + Preschooler School-ageTeenager
Housing 707 907 907 907 907 907 1086 907 907 1086
Child Care 0 617 688 1305 1140 452 1757 1305 1140 1140
food 236 350 358 469 536 622 632 673 737 900
Transportation 312 319 319 319 319 319 319 615 615 615
Health Care 162 405 404 420 429 463 445 493 502 550
Miscellaneous 142 260 268 342 333 276 424 399 390 429
Taxes 333 571 567 728 645 437 1073 838 739 813
Earned Income Tax Credit (-) 0 0 0 0 0 -54 0 0 0 0
Child Care Tax Credit (-) 0 -55 -55 -100 -100 -58 -100 -100 -100 -100
Child Tax Credit (-) 0 -83 -83 -167 -167 -167 -250 -167 -167 -250
Making Work Pay Credit (-) -33 -33 -33 -33 -33 -33 -33 -67 -67 -67
SELF-SUFFICIENCY WAGE
Hourly $10.56 $18.51 $18.97 $23.80 $22.78 $17.98 $30.40 $13.91 $13.34 $14.54
per adult per adult per adult
MONTHLY $1,858 $3,257 $3,338 $4,189 $4,008 $3,164 $5,351 $4,898 $4,697 $5,116
annual $22,293 $39,087 $40,062 $50,272 $48,102 $37,972 $64,212 $58,771 $56,358 $61,397

84 — THE SELF-SUFFICIENCY STANDARD FOR NEW YORK STATE THE SELF-SUFFICIENCY STANDARD FOR NEW YORK STATE — 85
Table 55 The Self-Sufficiency Standard for Tioga County, NY 2010
MONTHLY COSTS adultadult + Infant
adult + Preschooler
adult + Infant
Preschooler
adult + Preschooler School-age
adult + School-age Teenager
adult + Infant
Preschooler School-age
2 Adults+ Infant
Preschooler
2 Adults + Preschooler School-age
2 Adults + Preschooler School-ageTeenager
Housing 585 700 700 700 700 700 914 700 700 914
Child Care 0 617 688 1305 1140 452 1757 1305 1140 1140
food 236 350 358 469 536 622 632 673 737 900
Transportation 260 266 266 266 266 266 266 511 511 511
Health Care 159 397 396 411 421 454 436 484 494 541
Miscellaneous 124 233 241 315 306 249 400 367 358 401
Taxes 253 416 423 599 518 230 926 643 546 637
Earned Income Tax Credit (-) 0 -42 -17 0 0 -247 0 0 0 0
Child Care Tax Credit (-) 0 -63 -63 -100 -100 -68 -100 -100 -100 -100
Child Tax Credit (-) 0 -83 -83 -167 -167 -167 -250 -167 -167 -250
Making Work Pay Credit (-) -33 -33 -33 -33 -33 -33 -33 -67 -67 -67
SELF-SUFFICIENCY WAGE
Hourly $9.00 $15.67 $16.34 $21.40 $20.38 $13.97 $28.12 $12.36 $11.80 $13.14
per adult per adult per adult
MONTHLY $1,584 $2,758 $2,875 $3,766 $3,587 $2,459 $4,948 $4,350 $4,152 $4,626
annual $19,004 $33,100 $34,502 $45,189 $43,046 $29,512 $59,379 $52,196 $49,823 $55,515
Table 56 The Self-Sufficiency Standard for Tompkins County, NY 2010
MONTHLY COSTS adultadult + Infant
adult + Preschooler
adult + Infant
Preschooler
adult + Preschooler School-age
adult + School-age Teenager
adult + Infant
Preschooler School-age
2 Adults+ Infant
Preschooler
2 Adults + Preschooler School-age
2 Adults + Preschooler School-ageTeenager
Housing 818 958 958 958 958 958 1159 958 958 1159
Child Care 0 737 843 1580 1337 495 2075 1580 1337 1337
food 232 344 351 460 526 611 621 661 724 884
Transportation 45 45 45 45 45 45 45 90 90 90
Health Care 154 379 377 393 402 436 418 466 475 523
Miscellaneous 125 246 257 344 327 254 432 375 358 399
Taxes 257 499 517 739 616 250 1116 693 548 629
Earned Income Tax Credit (-) 0 0 0 0 0 -219 0 0 0 0
Child Care Tax Credit (-) 0 -60 -58 -100 -100 -68 -100 -100 -100 -100
Child Tax Credit (-) 0 -83 -83 -167 -167 -167 -250 -167 -167 -250
Making Work Pay Credit (-) -33 -33 -33 -33 -33 -33 -33 -67 -67 -67
SELF-SUFFICIENCY WAGE
Hourly $9.08 $17.22 $18.04 $23.97 $22.23 $14.56 $31.14 $12.75 $11.81 $13.08
per adult per adult per adult
MONTHLY $1,598 $3,031 $3,175 $4,219 $3,912 $2,562 $5,481 $4,490 $4,158 $4,606
annual $19,176 $36,377 $38,094 $50,627 $46,942 $30,744 $65,777 $53,877 $49,891 $55,266
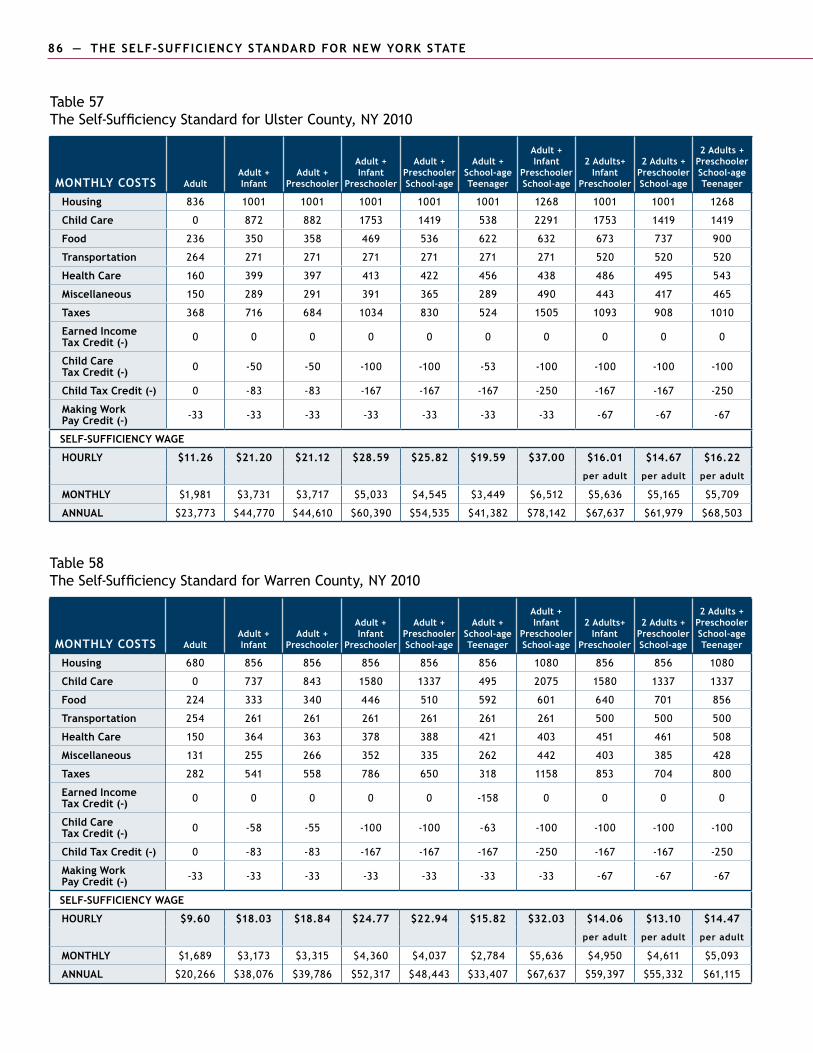
86 — THE SELF-SUFFICIENCY STANDARD FOR NEW YORK STATE THE SELF-SUFFICIENCY STANDARD FOR NEW YORK STATE — 87
Table 57 The Self-Sufficiency Standard for Ulster County, NY 2010
MONTHLY COSTS adultadult + Infant
adult + Preschooler
adult + Infant
Preschooler
adult + Preschooler School-age
adult + School-age Teenager
adult + Infant
Preschooler School-age
2 Adults+ Infant
Preschooler
2 Adults + Preschooler School-age
2 Adults + Preschooler School-ageTeenager
Housing 836 1001 1001 1001 1001 1001 1268 1001 1001 1268
Child Care 0 872 882 1753 1419 538 2291 1753 1419 1419
food 236 350 358 469 536 622 632 673 737 900
Transportation 264 271 271 271 271 271 271 520 520 520
Health Care 160 399 397 413 422 456 438 486 495 543
Miscellaneous 150 289 291 391 365 289 490 443 417 465
Taxes 368 716 684 1034 830 524 1505 1093 908 1010
Earned Income Tax Credit (-) 0 0 0 0 0 0 0 0 0 0
Child Care Tax Credit (-) 0 -50 -50 -100 -100 -53 -100 -100 -100 -100
Child Tax Credit (-) 0 -83 -83 -167 -167 -167 -250 -167 -167 -250
Making Work Pay Credit (-) -33 -33 -33 -33 -33 -33 -33 -67 -67 -67
SELF-SUFFICIENCY WAGE
Hourly $11.26 $21.20 $21.12 $28.59 $25.82 $19.59 $37.00 $16.01 $14.67 $16.22
per adult per adult per adult
MONTHLY $1,981 $3,731 $3,717 $5,033 $4,545 $3,449 $6,512 $5,636 $5,165 $5,709
annual $23,773 $44,770 $44,610 $60,390 $54,535 $41,382 $78,142 $67,637 $61,979 $68,503
Table 58 The Self-Sufficiency Standard for Warren County, NY 2010
MONTHLY COSTS adultadult + Infant
adult + Preschooler
adult + Infant
Preschooler
adult + Preschooler School-age
adult + School-age Teenager
adult + Infant
Preschooler School-age
2 Adults+ Infant
Preschooler
2 Adults + Preschooler School-age
2 Adults + Preschooler School-ageTeenager
Housing 680 856 856 856 856 856 1080 856 856 1080
Child Care 0 737 843 1580 1337 495 2075 1580 1337 1337
food 224 333 340 446 510 592 601 640 701 856
Transportation 254 261 261 261 261 261 261 500 500 500
Health Care 150 364 363 378 388 421 403 451 461 508
Miscellaneous 131 255 266 352 335 262 442 403 385 428
Taxes 282 541 558 786 650 318 1158 853 704 800
Earned Income Tax Credit (-) 0 0 0 0 0 -158 0 0 0 0
Child Care Tax Credit (-) 0 -58 -55 -100 -100 -63 -100 -100 -100 -100
Child Tax Credit (-) 0 -83 -83 -167 -167 -167 -250 -167 -167 -250
Making Work Pay Credit (-) -33 -33 -33 -33 -33 -33 -33 -67 -67 -67
SELF-SUFFICIENCY WAGE
Hourly $9.60 $18.03 $18.84 $24.77 $22.94 $15.82 $32.03 $14.06 $13.10 $14.47
per adult per adult per adult
MONTHLY $1,689 $3,173 $3,315 $4,360 $4,037 $2,784 $5,636 $4,950 $4,611 $5,093
annual $20,266 $38,076 $39,786 $52,317 $48,443 $33,407 $67,637 $59,397 $55,332 $61,115
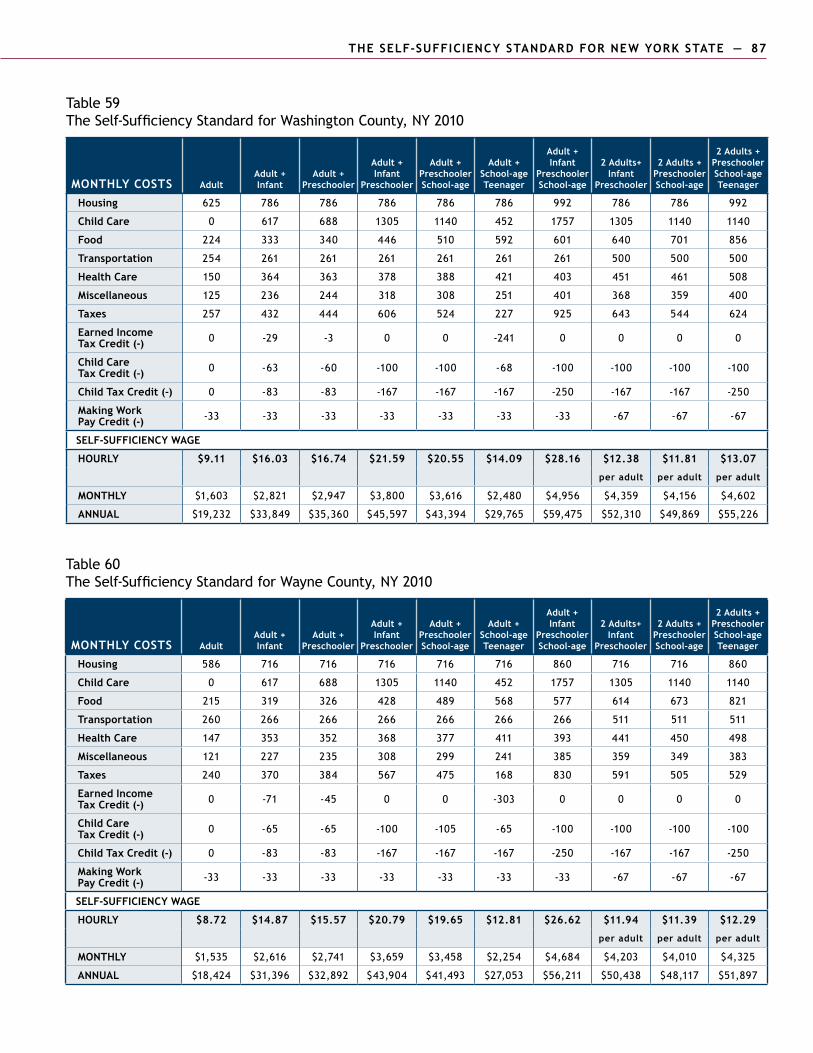
86 — THE SELF-SUFFICIENCY STANDARD FOR NEW YORK STATE THE SELF-SUFFICIENCY STANDARD FOR NEW YORK STATE — 87
Table 59 The Self-Sufficiency Standard for Washington County, NY 2010
MONTHLY COSTS adultadult + Infant
adult + Preschooler
adult + Infant
Preschooler
adult + Preschooler School-age
adult + School-age Teenager
adult + Infant
Preschooler School-age
2 Adults+ Infant
Preschooler
2 Adults + Preschooler School-age
2 Adults + Preschooler School-ageTeenager
Housing 625 786 786 786 786 786 992 786 786 992
Child Care 0 617 688 1305 1140 452 1757 1305 1140 1140
food 224 333 340 446 510 592 601 640 701 856
Transportation 254 261 261 261 261 261 261 500 500 500
Health Care 150 364 363 378 388 421 403 451 461 508
Miscellaneous 125 236 244 318 308 251 401 368 359 400
Taxes 257 432 444 606 524 227 925 643 544 624
Earned Income Tax Credit (-) 0 -29 -3 0 0 -241 0 0 0 0
Child Care Tax Credit (-) 0 -63 -60 -100 -100 -68 -100 -100 -100 -100
Child Tax Credit (-) 0 -83 -83 -167 -167 -167 -250 -167 -167 -250
Making Work Pay Credit (-) -33 -33 -33 -33 -33 -33 -33 -67 -67 -67
SELF-SUFFICIENCY WAGE
Hourly $9.11 $16.03 $16.74 $21.59 $20.55 $14.09 $28.16 $12.38 $11.81 $13.07
per adult per adult per adult
MONTHLY $1,603 $2,821 $2,947 $3,800 $3,616 $2,480 $4,956 $4,359 $4,156 $4,602
annual $19,232 $33,849 $35,360 $45,597 $43,394 $29,765 $59,475 $52,310 $49,869 $55,226
Table 60 The Self-Sufficiency Standard for Wayne County, NY 2010
MONTHLY COSTS adultadult + Infant
adult + Preschooler
adult + Infant
Preschooler
adult + Preschooler School-age
adult + School-age Teenager
adult + Infant
Preschooler School-age
2 Adults+ Infant
Preschooler
2 Adults + Preschooler School-age
2 Adults + Preschooler School-ageTeenager
Housing 586 716 716 716 716 716 860 716 716 860
Child Care 0 617 688 1305 1140 452 1757 1305 1140 1140
food 215 319 326 428 489 568 577 614 673 821
Transportation 260 266 266 266 266 266 266 511 511 511
Health Care 147 353 352 368 377 411 393 441 450 498
Miscellaneous 121 227 235 308 299 241 385 359 349 383
Taxes 240 370 384 567 475 168 830 591 505 529
Earned Income Tax Credit (-) 0 -71 -45 0 0 -303 0 0 0 0
Child Care Tax Credit (-) 0 -65 -65 -100 -105 -65 -100 -100 -100 -100
Child Tax Credit (-) 0 -83 -83 -167 -167 -167 -250 -167 -167 -250
Making Work Pay Credit (-) -33 -33 -33 -33 -33 -33 -33 -67 -67 -67
SELF-SUFFICIENCY WAGE
Hourly $8.72 $14.87 $15.57 $20.79 $19.65 $12.81 $26.62 $11.94 $11.39 $12.29
per adult per adult per adult
MONTHLY $1,535 $2,616 $2,741 $3,659 $3,458 $2,254 $4,684 $4,203 $4,010 $4,325
annual $18,424 $31,396 $32,892 $43,904 $41,493 $27,053 $56,211 $50,438 $48,117 $51,897
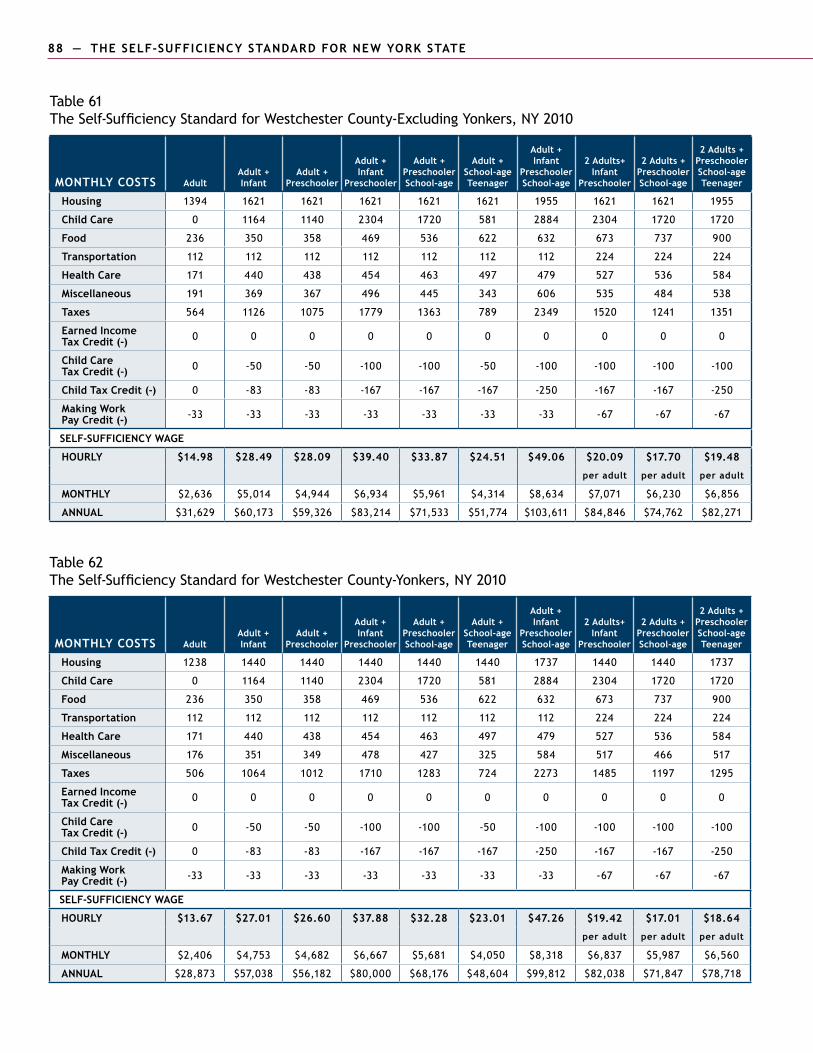
88 — THE SELF-SUFFICIENCY STANDARD FOR NEW YORK STATE THE SELF-SUFFICIENCY STANDARD FOR NEW YORK STATE — 89
Table 61 The Self-Sufficiency Standard for Westchester County-Excluding Yonkers, NY 2010
MONTHLY COSTS adultadult + Infant
adult + Preschooler
adult + Infant
Preschooler
adult + Preschooler School-age
adult + School-age Teenager
adult + Infant
Preschooler School-age
2 Adults+ Infant
Preschooler
2 Adults + Preschooler School-age
2 Adults + Preschooler School-ageTeenager
Housing 1394 1621 1621 1621 1621 1621 1955 1621 1621 1955
Child Care 0 1164 1140 2304 1720 581 2884 2304 1720 1720
food 236 350 358 469 536 622 632 673 737 900
Transportation 112 112 112 112 112 112 112 224 224 224
Health Care 171 440 438 454 463 497 479 527 536 584
Miscellaneous 191 369 367 496 445 343 606 535 484 538
Taxes 564 1126 1075 1779 1363 789 2349 1520 1241 1351
Earned Income Tax Credit (-) 0 0 0 0 0 0 0 0 0 0
Child Care Tax Credit (-) 0 -50 -50 -100 -100 -50 -100 -100 -100 -100
Child Tax Credit (-) 0 -83 -83 -167 -167 -167 -250 -167 -167 -250
Making Work Pay Credit (-) -33 -33 -33 -33 -33 -33 -33 -67 -67 -67
SELF-SUFFICIENCY WAGE
Hourly $14.98 $28.49 $28.09 $39.40 $33.87 $24.51 $49.06 $20.09 $17.70 $19.48
per adult per adult per adult
MONTHLY $2,636 $5,014 $4,944 $6,934 $5,961 $4,314 $8,634 $7,071 $6,230 $6,856
annual $31,629 $60,173 $59,326 $83,214 $71,533 $51,774 $103,611 $84,846 $74,762 $82,271
Table 62 The Self-Sufficiency Standard for Westchester County-Yonkers, NY 2010
MONTHLY COSTS adultadult + Infant
adult + Preschooler
adult + Infant
Preschooler
adult + Preschooler School-age
adult + School-age Teenager
adult + Infant
Preschooler School-age
2 Adults+ Infant
Preschooler
2 Adults + Preschooler School-age
2 Adults + Preschooler School-ageTeenager
Housing 1238 1440 1440 1440 1440 1440 1737 1440 1440 1737
Child Care 0 1164 1140 2304 1720 581 2884 2304 1720 1720
food 236 350 358 469 536 622 632 673 737 900
Transportation 112 112 112 112 112 112 112 224 224 224
Health Care 171 440 438 454 463 497 479 527 536 584
Miscellaneous 176 351 349 478 427 325 584 517 466 517
Taxes 506 1064 1012 1710 1283 724 2273 1485 1197 1295
Earned Income Tax Credit (-) 0 0 0 0 0 0 0 0 0 0
Child Care Tax Credit (-) 0 -50 -50 -100 -100 -50 -100 -100 -100 -100
Child Tax Credit (-) 0 -83 -83 -167 -167 -167 -250 -167 -167 -250
Making Work Pay Credit (-) -33 -33 -33 -33 -33 -33 -33 -67 -67 -67
SELF-SUFFICIENCY WAGE
Hourly $13.67 $27.01 $26.60 $37.88 $32.28 $23.01 $47.26 $19.42 $17.01 $18.64
per adult per adult per adult
MONTHLY $2,406 $4,753 $4,682 $6,667 $5,681 $4,050 $8,318 $6,837 $5,987 $6,560
annual $28,873 $57,038 $56,182 $80,000 $68,176 $48,604 $99,812 $82,038 $71,847 $78,718
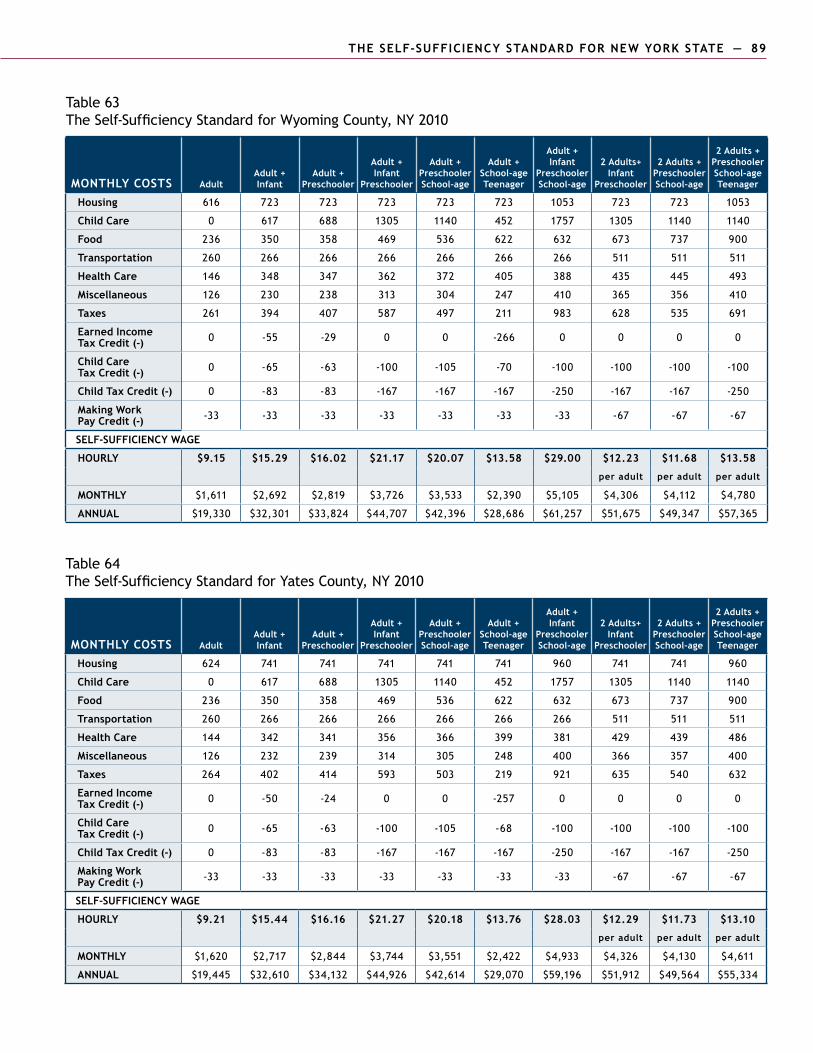
88 — THE SELF-SUFFICIENCY STANDARD FOR NEW YORK STATE THE SELF-SUFFICIENCY STANDARD FOR NEW YORK STATE — 89
Table 63 The Self-Sufficiency Standard for Wyoming County, NY 2010
MONTHLY COSTS adultadult + Infant
adult + Preschooler
adult + Infant
Preschooler
adult + Preschooler School-age
adult + School-age Teenager
adult + Infant
Preschooler School-age
2 Adults+ Infant
Preschooler
2 Adults + Preschooler School-age
2 Adults + Preschooler School-ageTeenager
Housing 616 723 723 723 723 723 1053 723 723 1053
Child Care 0 617 688 1305 1140 452 1757 1305 1140 1140
food 236 350 358 469 536 622 632 673 737 900
Transportation 260 266 266 266 266 266 266 511 511 511
Health Care 146 348 347 362 372 405 388 435 445 493
Miscellaneous 126 230 238 313 304 247 410 365 356 410
Taxes 261 394 407 587 497 211 983 628 535 691
Earned Income Tax Credit (-) 0 -55 -29 0 0 -266 0 0 0 0
Child Care Tax Credit (-) 0 -65 -63 -100 -105 -70 -100 -100 -100 -100
Child Tax Credit (-) 0 -83 -83 -167 -167 -167 -250 -167 -167 -250
Making Work Pay Credit (-) -33 -33 -33 -33 -33 -33 -33 -67 -67 -67
SELF-SUFFICIENCY WAGE
Hourly $9.15 $15.29 $16.02 $21.17 $20.07 $13.58 $29.00 $12.23 $11.68 $13.58
per adult per adult per adult
MONTHLY $1,611 $2,692 $2,819 $3,726 $3,533 $2,390 $5,105 $4,306 $4,112 $4,780
annual $19,330 $32,301 $33,824 $44,707 $42,396 $28,686 $61,257 $51,675 $49,347 $57,365
Table 64 The Self-Sufficiency Standard for Yates County, NY 2010
MONTHLY COSTS adultadult + Infant
adult + Preschooler
adult + Infant
Preschooler
adult + Preschooler School-age
adult + School-age Teenager
adult + Infant
Preschooler School-age
2 Adults+ Infant
Preschooler
2 Adults + Preschooler School-age
2 Adults + Preschooler School-ageTeenager
Housing 624 741 741 741 741 741 960 741 741 960
Child Care 0 617 688 1305 1140 452 1757 1305 1140 1140
food 236 350 358 469 536 622 632 673 737 900
Transportation 260 266 266 266 266 266 266 511 511 511
Health Care 144 342 341 356 366 399 381 429 439 486
Miscellaneous 126 232 239 314 305 248 400 366 357 400
Taxes 264 402 414 593 503 219 921 635 540 632
Earned Income Tax Credit (-) 0 -50 -24 0 0 -257 0 0 0 0
Child Care Tax Credit (-) 0 -65 -63 -100 -105 -68 -100 -100 -100 -100
Child Tax Credit (-) 0 -83 -83 -167 -167 -167 -250 -167 -167 -250
Making Work Pay Credit (-) -33 -33 -33 -33 -33 -33 -33 -67 -67 -67
SELF-SUFFICIENCY WAGE
Hourly $9.21 $15.44 $16.16 $21.27 $20.18 $13.76 $28.03 $12.29 $11.73 $13.10
per adult per adult per adult
MONTHLY $1,620 $2,717 $2,844 $3,744 $3,551 $2,422 $4,933 $4,326 $4,130 $4,611
annual $19,445 $32,610 $34,132 $44,926 $42,614 $29,070 $59,196 $51,912 $49,564 $55,334

THE SELF-SUFFICIENCY STANDARD FOR NEW YORK STATE — 91

THE SELF-SUFFICIENCY STANDARD FOR NEW YORK STATE — 91
Appendix D. The Self-Sufficiency Standard as a Percent of the Federal Poverty Level, 2010 Three Family Types, All New York Counties
COUNTY
ONE ADULT, ONE PRESCHOOLER ONE ADULT, ONE PRESCHOOLER, ONE SCHOOL-AGE
TWO ADULTS, ONE PRESCHOOLER, ONE SCHOOL-AGE
Annual Self-Sufficiency
Standard
Self-Sufficiency Standard as
Percentage of Federal Poverty
Level (FPL)
Annual Self-Sufficiency
Standard
Self-Sufficiency Standard as
Percentage of Federal Poverty
Level (FPL)
Annual Self-Sufficiency
Standard
Self-Sufficiency Standard as
Percentage of Federal Poverty
Level (FPL)
Albany County $41,872 287% $51,617 282% $59,027 268%
Allegany County $32,643 224% $41,658 228% $48,614 220%
Bronx County $49,409 339% $60,934 333% $66,268 301%
Broome County $35,292 242% $43,522 238% $50,236 228%
Cattaraugus County $33,055 227% $41,857 229% $48,808 221%
Cayuga County $35,803 246% $43,973 240% $50,814 230%
Chautauqua County $33,253 228% $41,993 229% $48,942 222%
Chemung County $36,249 249% $44,421 243% $51,278 233%
Chenango County $34,290 235% $42,726 233% $49,674 225%
Clinton County $36,049 247% $44,202 241% $50,926 231%
Columbia County $40,686 279% $49,545 271% $57,069 259%
Cortland County $35,951 247% $44,122 241% $50,975 231%
Delaware County $34,656 238% $43,155 236% $50,020 227%
Dutchess County $48,572 333% $58,893 322% $67,064 304%
Erie County $38,419 264% $47,362 259% $55,369 251%
Essex County $35,225 242% $43,472 237% $50,154 227%
Franklin County $33,414 229% $42,108 230% $48,956 222%
Fulton County $35,040 240% $43,343 237% $50,012 227%
Genesee County $36,260 249% $44,432 243% $51,311 233%
Greene County $36,699 252% $44,874 245% $51,946 236%
Hamilton County $35,310 242% $43,524 238% $50,203 228%
Herkimer County $34,275 235% $42,718 233% $49,661 225%
Jefferson County $35,871 246% $44,038 241% $50,768 230%
Kings County $51,500 353% $63,166 345% $68,288 310%
Lewis County $33,672 231% $42,287 231% $49,132 223%
Livingston County $33,110 227% $41,605 227% $48,229 219%
Madison County $34,736 238% $43,047 235% $49,639 225%
Monroe County $38,773 266% $47,391 259% $54,182 246%
Montgomery County $33,636 231% $42,264 231% $49,254 223%
Nassau County $61,424 422% $74,634 408% $79,853 362%
North Manhattan* $46,141 317% $57,831 316% $63,873 290%
South Manhattan* $78,476 539% $91,552 500% $93,002 422%
Niagara County $32,141 221% $41,324 226% $48,302 219%
Oneida County $35,910 246% $44,089 241% $51,037 231%
Onondaga County $39,224 269% $47,888 262% $54,942 249%
Ontario County $37,263 256% $45,866 250% $52,507 238%
Orange County $48,348 332% $58,647 320% $67,011 304%
Orleans County $32,196 221% $41,049 224% $47,673 216%
Oswego County $34,844 239% $43,080 235% $49,568 225%
The 2009 FPL is: $14,570 for a family of two, $18,310 for a family of three, and $22,050 for a family of four. The 2009 FPL is effective at least through May 31, 2010. See http://aspe.hhs.gov/poverty/09poverty.shtml.* North and South Manhattan are mutually exclusive areas of New York County, see Appendix A: Methodology, Assumptions, and Sources for a full description.
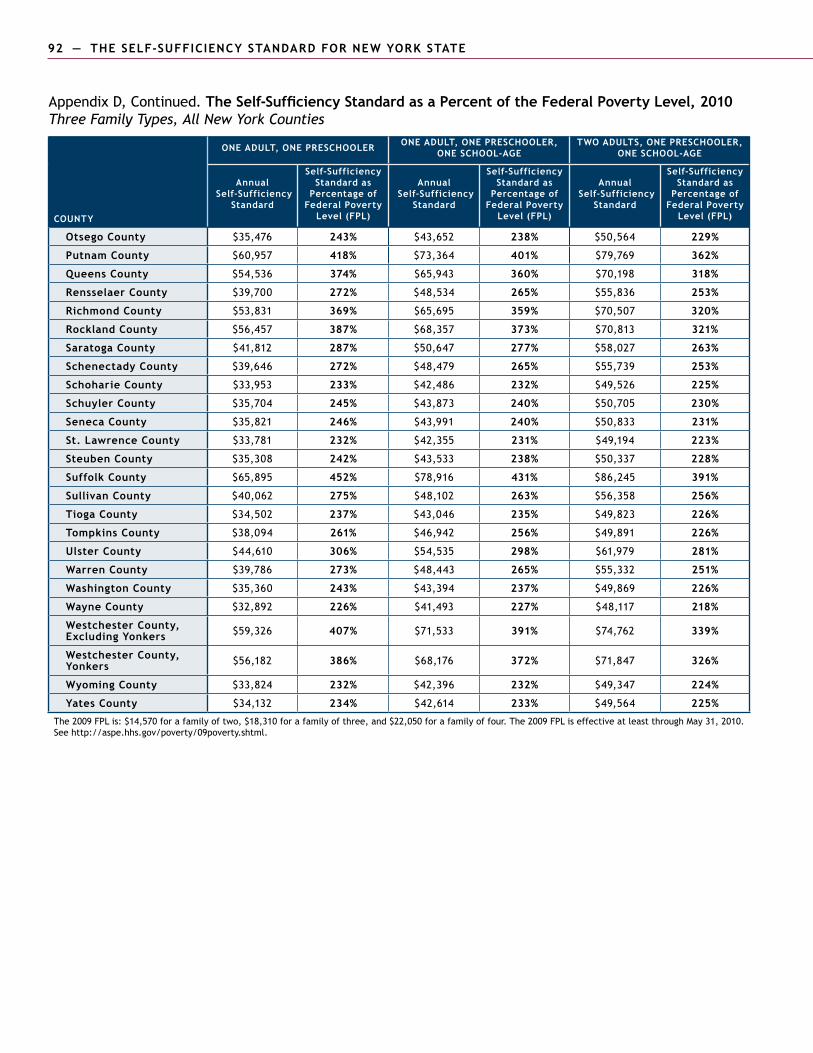
92 — THE SELF-SUFFICIENCY STANDARD FOR NEW YORK STATE
Appendix D, Continued. The Self-Sufficiency Standard as a Percent of the Federal Poverty Level, 2010 Three Family Types, All New York Counties
COUNTY
ONE ADULT, ONE PRESCHOOLER ONE ADULT, ONE PRESCHOOLER, ONE SCHOOL-AGE
TWO ADULTS, ONE PRESCHOOLER, ONE SCHOOL-AGE
Annual Self-Sufficiency
Standard
Self-Sufficiency Standard as
Percentage of Federal Poverty
Level (FPL)
Annual Self-Sufficiency
Standard
Self-Sufficiency Standard as
Percentage of Federal Poverty
Level (FPL)
Annual Self-Sufficiency
Standard
Self-Sufficiency Standard as
Percentage of Federal Poverty
Level (FPL)
Otsego County $35,476 243% $43,652 238% $50,564 229%
Putnam County $60,957 418% $73,364 401% $79,769 362%
Queens County $54,536 374% $65,943 360% $70,198 318%
Rensselaer County $39,700 272% $48,534 265% $55,836 253%
Richmond County $53,831 369% $65,695 359% $70,507 320%
Rockland County $56,457 387% $68,357 373% $70,813 321%
Saratoga County $41,812 287% $50,647 277% $58,027 263%
Schenectady County $39,646 272% $48,479 265% $55,739 253%
Schoharie County $33,953 233% $42,486 232% $49,526 225%
Schuyler County $35,704 245% $43,873 240% $50,705 230%
Seneca County $35,821 246% $43,991 240% $50,833 231%
St. Lawrence County $33,781 232% $42,355 231% $49,194 223%
Steuben County $35,308 242% $43,533 238% $50,337 228%
Suffolk County $65,895 452% $78,916 431% $86,245 391%
Sullivan County $40,062 275% $48,102 263% $56,358 256%
Tioga County $34,502 237% $43,046 235% $49,823 226%
Tompkins County $38,094 261% $46,942 256% $49,891 226%
Ulster County $44,610 306% $54,535 298% $61,979 281%
Warren County $39,786 273% $48,443 265% $55,332 251%
Washington County $35,360 243% $43,394 237% $49,869 226%
Wayne County $32,892 226% $41,493 227% $48,117 218%
Westchester County, Excluding Yonkers $59,326 407% $71,533 391% $74,762 339%
Westchester County, Yonkers $56,182 386% $68,176 372% $71,847 326%
Wyoming County $33,824 232% $42,396 232% $49,347 224%
Yates County $34,132 234% $42,614 233% $49,564 225%
The 2009 FPL is: $14,570 for a family of two, $18,310 for a family of three, and $22,050 for a family of four. The 2009 FPL is effective at least through May 31, 2010. See http://aspe.hhs.gov/poverty/09poverty.shtml.
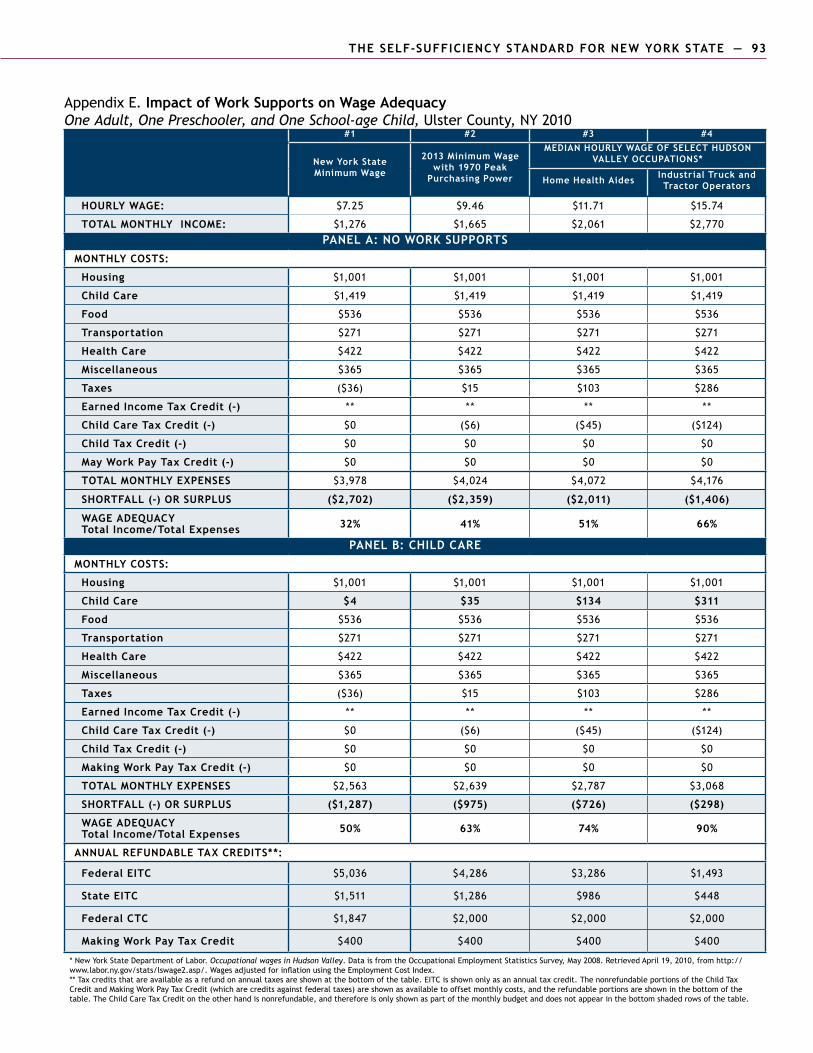
THE SELF-SUFFICIENCY STANDARD FOR NEW YORK STATE — 93
Appendix E. Impact of Work Supports on Wage Adequacy One Adult, One Preschooler, and One School-age Child, Ulster County, NY 2010
#1 #2 #3 #4
new york state Minimum Wage
2013 Minimum Wage with 1970 Peak
Purchasing Power
MEDIAN HOURLY WAGE OF SELECT HUDSON VALLEY OCCUPATIONS*
Home Health Aides Industrial Truck and Tractor Operators
HOURLY WAGE: $7.25 $9.46 $11.71 $15.74
TOTAL MONTHLY INCOME: $1,276 $1,665 $2,061 $2,770PANEL A: NO WORK SUPPORTS
MONTHLY COSTS:
Housing $1,001 $1,001 $1,001 $1,001
Child Care $1,419 $1,419 $1,419 $1,419
food $536 $536 $536 $536
Transportation $271 $271 $271 $271
Health Care $422 $422 $422 $422
Miscellaneous $365 $365 $365 $365
Taxes ($36) $15 $103 $286
Earned Income Tax Credit (-) ** ** ** **
Child Care Tax Credit (-) $0 ($6) ($45) ($124)
Child Tax Credit (-) $0 $0 $0 $0
May Work Pay Tax Credit (-) $0 $0 $0 $0
TOTAL MONTHLY ExPENSES $3,978 $4,024 $4,072 $4,176
SHORTFALL (-) OR SURPLUS ($2,702) ($2,359) ($2,011) ($1,406)
WAGE ADEQUACY Total Income/Total Expenses 32% 41% 51% 66%
PANEL B: CHILD CAREMONTHLY COSTS:
Housing $1,001 $1,001 $1,001 $1,001
Child Care $4 $35 $134 $311
food $536 $536 $536 $536
Transportation $271 $271 $271 $271
Health Care $422 $422 $422 $422
Miscellaneous $365 $365 $365 $365
Taxes ($36) $15 $103 $286
Earned Income Tax Credit (-) ** ** ** **
Child Care Tax Credit (-) $0 ($6) ($45) ($124)
Child Tax Credit (-) $0 $0 $0 $0
Making Work Pay Tax Credit (-) $0 $0 $0 $0
TOTAL MONTHLY ExPENSES $2,563 $2,639 $2,787 $3,068
SHORTFALL (-) OR SURPLUS ($1,287) ($975) ($726) ($298)
WAGE ADEQUACY Total Income/Total Expenses 50% 63% 74% 90%
ANNUAL REFUNDABLE TAx CREDITS**:
Federal EITC $5,036 $4,286 $3,286 $1,493
State EITC $1,511 $1,286 $986 $448
Federal CTC $1,847 $2,000 $2,000 $2,000
Making Work Pay Tax Credit $400 $400 $400 $400
* New York State Department of Labor. Occupational wages in Hudson Valley. Data is from the Occupational Employment Statistics Survey, May 2008. Retrieved April 19, 2010, from http://www.labor.ny.gov/stats/lswage2.asp/. Wages adjusted for inflation using the Employment Cost Index.** Tax credits that are available as a refund on annual taxes are shown at the bottom of the table. EITC is shown only as an annual tax credit. The nonrefundable portions of the Child Tax Credit and Making Work Pay Tax Credit (which are credits against federal taxes) are shown as available to offset monthly costs, and the refundable portions are shown in the bottom of the table. The Child Care Tax Credit on the other hand is nonrefundable, and therefore is only shown as part of the monthly budget and does not appear in the bottom shaded rows of the table.
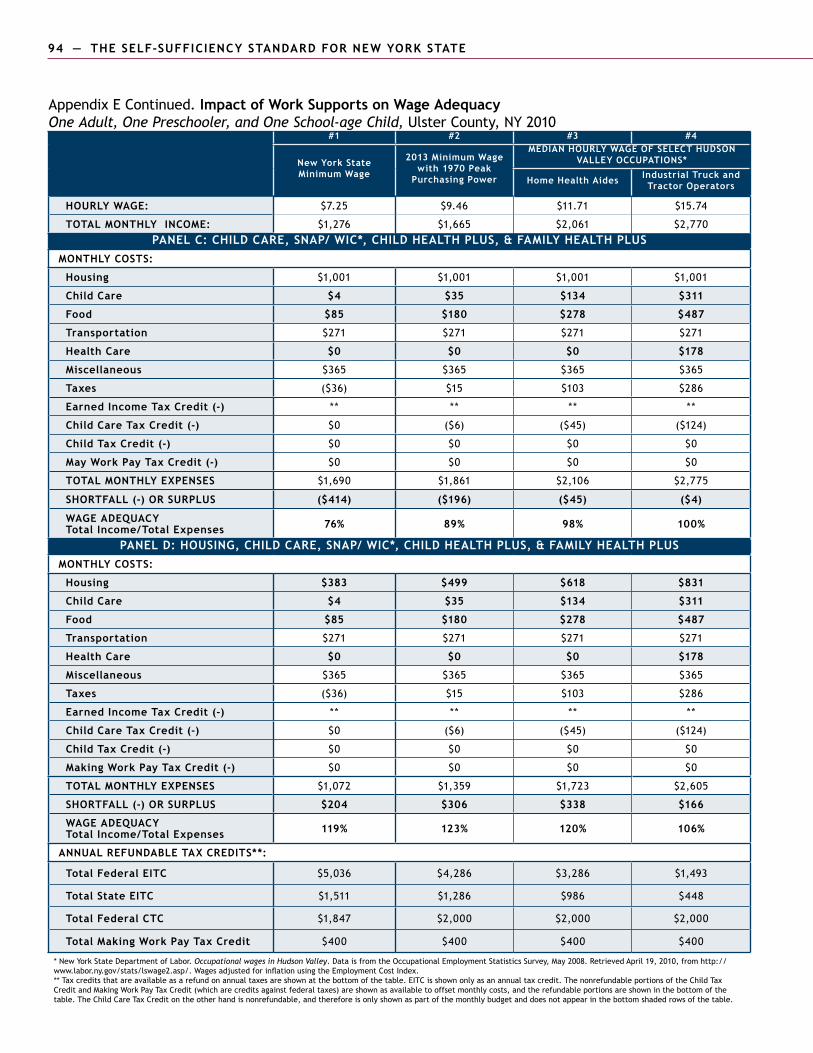
94 — THE SELF-SUFFICIENCY STANDARD FOR NEW YORK STATE
Appendix E Continued. Impact of Work Supports on Wage Adequacy One Adult, One Preschooler, and One School-age Child, Ulster County, NY 2010
#1 #2 #3 #4
new york state Minimum Wage
2013 Minimum Wage with 1970 Peak
Purchasing Power
MEDIAN HOURLY WAGE OF SELECT HUDSON VALLEY OCCUPATIONS*
Home Health Aides Industrial Truck and Tractor Operators
HOURLY WAGE: $7.25 $9.46 $11.71 $15.74
TOTAL MONTHLY INCOME: $1,276 $1,665 $2,061 $2,770PANEL C: CHILD CARE, SNAP/ WIC*, CHILD HEALTH PLUS, & FAMILY HEALTH PLUS
MONTHLY COSTS:
Housing $1,001 $1,001 $1,001 $1,001
Child Care $4 $35 $134 $311
food $85 $180 $278 $487
Transportation $271 $271 $271 $271
Health Care $0 $0 $0 $178
Miscellaneous $365 $365 $365 $365
Taxes ($36) $15 $103 $286
Earned Income Tax Credit (-) ** ** ** **
Child Care Tax Credit (-) $0 ($6) ($45) ($124)
Child Tax Credit (-) $0 $0 $0 $0
May Work Pay Tax Credit (-) $0 $0 $0 $0
TOTAL MONTHLY ExPENSES $1,690 $1,861 $2,106 $2,775
SHORTFALL (-) OR SURPLUS ($414) ($196) ($45) ($4)
WAGE ADEQUACY Total Income/Total Expenses 76% 89% 98% 100%
PANEL D: HOUSING, CHILD CARE, SNAP/ WIC*, CHILD HEALTH PLUS, & FAMILY HEALTH PLUSMONTHLY COSTS:
Housing $383 $499 $618 $831
Child Care $4 $35 $134 $311
food $85 $180 $278 $487
Transportation $271 $271 $271 $271
Health Care $0 $0 $0 $178
Miscellaneous $365 $365 $365 $365
Taxes ($36) $15 $103 $286
Earned Income Tax Credit (-) ** ** ** **
Child Care Tax Credit (-) $0 ($6) ($45) ($124)
Child Tax Credit (-) $0 $0 $0 $0
Making Work Pay Tax Credit (-) $0 $0 $0 $0
TOTAL MONTHLY ExPENSES $1,072 $1,359 $1,723 $2,605
SHORTFALL (-) OR SURPLUS $204 $306 $338 $166
WAGE ADEQUACY Total Income/Total Expenses 119% 123% 120% 106%
ANNUAL REFUNDABLE TAx CREDITS**:
Total Federal EITC $5,036 $4,286 $3,286 $1,493
Total State EITC $1,511 $1,286 $986 $448
Total Federal CTC $1,847 $2,000 $2,000 $2,000
Total Making Work Pay Tax Credit $400 $400 $400 $400
* New York State Department of Labor. Occupational wages in Hudson Valley. Data is from the Occupational Employment Statistics Survey, May 2008. Retrieved April 19, 2010, from http://www.labor.ny.gov/stats/lswage2.asp/. Wages adjusted for inflation using the Employment Cost Index.** Tax credits that are available as a refund on annual taxes are shown at the bottom of the table. EITC is shown only as an annual tax credit. The nonrefundable portions of the Child Tax Credit and Making Work Pay Tax Credit (which are credits against federal taxes) are shown as available to offset monthly costs, and the refundable portions are shown in the bottom of the table. The Child Care Tax Credit on the other hand is nonrefundable, and therefore is only shown as part of the monthly budget and does not appear in the bottom shaded rows of the table.