THE SECOND REPORT OF THE NATIONAL CATARACT · PDF fileHead, Ophthalmology Department : Dr....
105
National Cataract Surgery Registry Ministry of Health Malaysia THE SECOND REPORT OF THE NATIONAL CATARACT SURGERY REGISTRY 2003 Edited by Goh Pik Pin Shamala Retnasabapathy Rajalakshmi Gopal Ronald Arun Das A publication of the National Cataract Surgery Registry And Clinical Research Centre, Ministry of Health
Transcript of THE SECOND REPORT OF THE NATIONAL CATARACT · PDF fileHead, Ophthalmology Department : Dr....

National Cataract Surgery Registry
Ministry of Health Malaysia
THE SECOND REPORT OF THE
NATIONAL CATARACT SURGERY REGISTRY 2003
Edited by
Goh Pik Pin
Shamala Retnasabapathy Rajalakshmi Gopal Ronald Arun Das
A publication of the National Cataract Surgery Registry
And Clinical Research Centre, Ministry of Health

October 2004 © National Cataract Surgery Registry, Malaysia. Published by the National Cataract Surgery Registry (NCSR) C/O Clinical Research Centre, Level 3, Dermatology Block, Kuala Lumpur Hospital, Jalan Pahang, 50586 Kuala Lumpur. General Line: 603-2698 0310 Fax: 603-2691 1682 Email [email protected] Website: http://www.crc.gov.my/ncsr Disclaimer The data reported here have been supplied by NCSR. The interpretation and reporting of these data are the responsibility of the Editor and in no way should be seen as an official policy or interpretation of the NCSR. Suggested citation The suggested citation for this report is as follows: Goh Pik Pin, Shamala Retnasabapathy, Rajalakshmi Gopal, Ronald Arun Das.(Eds) THE SECOND REPORT OF THE NATIONAL CATARACT SURGERY 2003 Kuala Lumpur, Malaysia 2004 Electronic version Electronic version of this report can be downloaded at http://www.crc.gov.my/ncsr
ISSN 1675-8447

i
Forward I am proud to present you the second National Cataract Surgery Registry annual report of 2003. We have now 32 participating centres, with 3 new source data producers, i.e. Hospital Selayang, Hospital Kuala Lipis and, Klinik Pakar Mata Azman . With the 2-year data, we can now compare the trend in cataract surgery. We have data from 16,815 patients in 2003 as compared to 13,025 in the year 2002. There was a 5 % increase in the number of phacoemulsification surgery performed and a 2% increase in the proportion of patients with good visual outcome, when comparing to 2002 report. We have made some changes in the outcome clinical record form for the year 2004. This is aim to capture data inline with the national indicator approach (NIA), collected by the Quality Assurance Programme of the Medical Development Division, Ministry of Health. One of them is the rate of unplanned return to operating theatre within one week post-operation. We look forward to see the 2004 report, which will certainly provide us with more information about the trend of practice pattern and surgery outcome. The 2004 report will also include data from the Department of Ophthalmology, Hospital UKM. I would like to take this opportunity to express my gratitude to Dr. Mariam Ismail, the chairperson of NCSR in the year 2002 for her continuous support and advice. Once again, I thank all source data producers for your contribution. Dr. Goh Pik Pin Chairperson NCSR 2004

ii
ACKNOWLEDGMENTS The prospective nature of data collection in NCSR is a challenge to all participating centres. We appreciate the commitment and effort of all doctors, optometrists, paramedics and site coordinators in each participating centers. We would like to thank the staff at CSRU, particularly Dr. Jamaiyah Haniff, the head of Clinical Registry Unit, the Clinical Registry Manager, Staff Nurse Lee Poe Poay and the Clinical Registry Assistant, Ms Sharmila Bt Saari, and En Fauzan Jamaludddin for data management and Dr. LimTeck Onn and Ms Teh Poh Geok for data analysis. We are grateful to the support of the Deputy Director General (Research and Technical Support) of Ministry of Health, Dato` Dr. Mohd Ismail Merican, Dr. Mariam Ismail, the Head of Ophthalmology Service, and the Director, Kuala Lumpur Hospital, as well as the NCSR sponsors: the Medical Development Division, Ophthalmology Service and Clinical Research Centre, of the Ministry of Health . Many thanks to the editors : Dr. Goh Pik Pin, Dr. Shamala Retnasabapathy, Dr. Rajalakshmi Gopal, and Dr. Ronald Arun Das. Last but not least, we would like to thank our financial sponsors: Alcon Laboratories (M) Sdn Bhd, Advanced Medical Optics and Pharmacia Ophthalmology Malaysia Sdn Bhd ( currently as Pfizer ( Malaysia) Sdn Bhd) for their continuous support. Thank you very much.
National Cataract Surgery Registry Advisory Committee

iii
PARTICIPATING CENTRES
1. Angkatan Tentera Kem Terendak Hospital Head, Ophthalmology Department : Lt. Kol. (Dr) Nor Aishah Malik
Dr In Charge : - Coordinator : Sarjan Jawariah Ali Participating From : January-November 2002
January-December 2003
2 Alor Setar Hospital Head, Ophthalmology Department : Dr. Ahmad Mat Saad
Dr In Charge : Dr. Zaharidah Abd Kadir Coordinator : T/AN Siti Aishah Salim Participating From : January-December 2002
January-December 2003
3 Duchess Of Kent Hospital, Sandakan Head, Ophthalmology Department : Dr. Adarsh Bhardwaj
Dr In Charge : - Coordinator : MA Linjabat Mandasah Participating From : January-October 2002 January-October 2003
4 Ipoh Hospital
Head, Ophthalmology Department : Dato` Dr. P. Balaravi Dr In Charge : Dr. Indarjit Singh Coordinator : MA Bernard Participating From : January 2002 January-December 2003
5 Kangar Hospital
Head, Ophthalmology Department : Dr. Mohd Nazri Sulaiman Dr In Charge : - Coordinator : MA Nasihat Dahaman Participating From : January-December 2002 January-December 2003
6 Kuala Lumpur Hospital
Head, Ophthalmology Department : Dr. Joseph Alagaratnam Dr In Charge : Dr. Sharifah Intan Coordinator : SN Hazizah Mohamed Participating From : January-December 2002 January-December 2003 7 Kuala Terengganu Hospital
Head, Ophthalmology Department : Dr. Zuraidah Mustari Dr In Charge : - Coordinator : SN Juriffah Mohd Amin Participating From : January-December 2002 January-December 2003
iv
8 Umum Sarawak Hospital , Kuching
Head, Ophthalmology Department : Dr. Intan Gudom Dr In Charge : - Coordinator : SN Hajah Fatimah Hassan Participating From : January-December 2002 January-December 2003
9 Melaka Hospital Head, Ophthalmology Department : Dr. S. Anusiah
Dr In Charge : - Coordinator : SN Siti Asiah Yusop Participating From : January-December 2002 January-December 2003
10 Miri Hospital Head, Ophthalmology Department : Dr. V. Prabhu
Dr In Charge : Dr. Maheran Coordinator : SN Wong Chu Hiong Participating From : January-June 2002 2003- Excluded due to absent of Ophthalmologist
11 SultanahFatimah Hospital,Muar
Head, Ophthalmology Department : Dr. Adnan Abas Dr In Charge : - Coordinator : MA Nuruhadi B Ghani Participating From : January-December 2002 January-December 2003
12 Pulau Pinang Hospital
Head, Ophthalmology Department : Dr. Elizabeth John Dr In Charge : - Coordinator : En. Azahari Ahmad (Optometrist) Participating From : January-December 2002 January-December 2003
13 Queen Elizabeth Hospital, Kota Kinabalu
Head, Ophthalmology Department : Dr. Kong Vui Yin Dr In Charge : - Coordinator : SN Euginie Participating From : January-December 2002 January-December 2003
v
14 Seremban Hospital Head, Ophthalmology Department : Dr. Bethel Livingstone
Dr In Charge : - Coordinator : MA Thivagaran Participating From : January-December 2002 January-December 2003
15 Sibu Hospital Head, Ophthalmology Department : Dr. Reddy
Dr In Charge : - Coordinator : MA Morni Morsen Participating From : January-December 2002 January-December 2003
16 Sultanah Aminah Hospital, Johor Bharu Head, Ophthalmology Department : Dr. Loh Swee Seng
Dr In Charge : Dr. Siow Yun Ching Coordinator : MA Tan Eng Chai Participating From : January-December 2002 January-December 2003
17 Sungei Petani Hospital Head, Ophthalmology Department : Dr. Foo Sui Wan
Dr In Charge : - Coordinator : SN Zainab Participating From : January-December 2002 January-December 2003
18 Taiping Hospital Head, Ophthalmology Department : Dr. Haji Mohamad Sharif Fahruddin
Dr In Charge : - Coordinator : SN Halina Sharom Participating From : January-December 2002 January-December 2003
19 Tawau Hospital Head, Ophthalmology Department : Dr. Ajit Majunder
Dr In Charge : - Coordinator : MA Bacho Nordin Participating From : January-November 2002 January-December 2003
vi
20 Teluk Intan Hospital Head, Ophthalmology Department : D. Vivian Gong Hee Meng
Dr In Charge : - Coordinator : MA Halim Participating From : January-December 2002 January-December 2003
21 Tengku Ampuan Afazan Hospital, Kuantan Head, Ophthalmology Department : Dr. Vasantha Kumar
Dr In Charge : - Coordinator : MA. Azizi SN Rozila Bt Ashaari Participating From : January-December 2002 January-December 2003
22 Tengku Ampuan Rahimah Hospital, Klang Head, Ophthalmology Department : Dr. Yogan Kanagasabai
Dr In Charge : Dr. Tan Lian Hong Coordinator : SN Wong Huey Fen Participating From : January-December 2002 January-December 2003
23 Kota Bharu Hospital Head, Ophthalmology Department : Dr. Zulkifli Abd Ghani
Dr In Charge : Dr. Sakinah Zakaria Coordinator : - Participating From : June-December 2002 January-December 2003
24 Kajang Hospital Head, Ophthalmology Department : Dr. Chandramalar A/P Santhirethilegan
Dr In Charge : Dr. Norazlina Sabri Coordinator : - Participating From : June-December 2002 January-December 2003
25 Putrajaya Hospital
Head, Ophthalmology Department : Dr. Salmah Othman Dr In Charge : - Coordinator : SN Sarniah Sidek Participating From : June-November 2002 January-December 2003

vii
26 Batu Pahat Hospital Head, Ophthalmology Department : Dr. Normah A. Khalid
Dr In Charge : - Coordinator : MA Zainuddin Ali Participating From : August-December 2002 January-December 2003
27 Kuala Pilah Hospital Head, Ophthalmology Department : Dr. Khairul Husnaini Mohd Khalid
Dr In Charge : - Coordinator : SN Rohaizah Baharin SN Zalina Participating From : June-November 2002 January-December 2003
28 Selayang Hospital Head, Ophthalmology Department : Dr. Mariam Ismail
Dr In Charge : Dr. Thaya A/P K. Sandragasu Coordinator : Ms. Arini Hanim Participating From : January-December 2003
29 Bukit Mertajam Hospital
Head,’ Ophthalmology Department : Dr. Sri Kumar Dr In Charge : Dr. Teoh Hian Jin Coordinator : SN Masheran Musa Participating From : January-December 2002 January-December 2003
30 Mentakab Hospital Head, Ophthalmology Department : Dr. Hanizasurana Bt Hashim
Dr In Charge : - Coordinator : MA Haji Abdul Akim Sabit Ali Participating From : January-December 2002 January-December 2003
31 Kuala Lipis Hospital Medical Officer : Dr. Ahmad Abir B Abd Ghani Dr In Charge : - Coordinator : MA Abdul Halim Jamion Participating From : February-November 2003

viii
32 Klinik Pakar Mata Azman Sdn. Bhd
Head, Ophthalmology Department : Dr. Azman Abd Aziz Dr In Charge : - Coordinator : Ms. Lina Participating From : May-October 2003
33 Universiti Sains Malaysia Hospital Head, Ophthalmology Department : Dr. Wan Hazabbah
Dr In Charge : Dr. Asokumaran A/L Thanaraj Coordinator : SN Sarimah Samsudin Participating From : January-December 2002 January-December 2003
34 Universiti Kebangsaan Malaysia Hospital Head, Ophthalmology Department : Prof. Dr. Muhaya Haji Mohammad
Dr In Charge : Dr. Jemaima Che Hamzah Coordinator : - Participating From : Year 2004

ix
NATIONAL CATARACT SURGERY REGISTRY ADVISORY COMMITTEE Dr. Goh Pik Pin Chairperson
Consultant Ophthalmologist, Ophthalmology Department, Hospital Selayang
Dr. Mariam Ismail Co-Chairperson
Head, Ophthalmology Service, MOH and Head, Ophthalmology Department, Selayang Hospital
Datuk Dr. Abdul Gani B. Mohammed Din
Director, Medical Development Division Ministry of Health
Dr. Gomathy Arumugam President, Ophthalmology Society Malaysian Medical Association
Dato' Dr. P. Balaravi Head, Ophthalmology Department, Ipoh Hospital
Dr. Bethel Livingstone Head, Ophthalmology Department, Seremban Hospital
Dr. Joseph Alagaratnam Head, Ophthalmology Department, Kuala Lumpur Hospital
Dr. Zuraidah Bt. Mustari Head, Ophthalmology Department, Kuala Terengganu Hospital
Dr. Choong Yee Fong Ophthalmologist, Ophthalmology Department, Hospital Selayang
Associate Prof. Dr. Muhaya Bt. Mohamad
Head, Ophthalmology Department, Universiti Kebangsaan Malaysia
Dr. Elias Hussein Head, Ophthalmology Department, Universiti Sains Malaysia
Dr. Hoh Hong Beng Private, Pantai Medical Centre, Kuala Lumpur
Dato Dr. Y. C. Lee Private, Lee Eye Centre, Ipoh, Perak
Dr. Lim Teck Onn Head, Clinical Research Centre, Kuala Lumpur Hospital
Dr. Jamaiyah Haniff Head Clinical Registry Unit Kuala Lumpur Hospital
S/N Lee Poe Poay Secretariat to NCSR Advisory Committee
x
ABOUT NATIONAL CATARACT SURGERY REGISTRY INTRODUCTION The National Cataract Surgery Registry is a disease outcome registry. It is a prospective, ongoing systematic collection of data pertaining to patients who have had cataract surgery. Data collected include demography, operative events, post-operative visual outcomes and probable causes for poor outcome. These data are used to calculate cataract surgery rates and to evaluate surgical outcome. Such information is useful for performance audit in each participating ophthalmology department, leading to improvement in cataract surgery service, and to assist Ministry of Health, non-governmental organization, private eye care providers and industry in blindness prevention programme planning and evaluation in the country. Analyzed data is presented in report and is disseminated to contributors and other users of the registry at a timely and regular fashion. NCSR was established in January 2002. In the first year, there are 30 source data producers (SDP) /participating centres in the registry consisting of 28 ophthalmology departments from the Ministry of Health Hospitals, Hospital Angkatan Tentera Kem Terendak, and Universiti Sains Malaysia Hospital. In the year 2003, there were 32 SDP, with addition of Hospital Kuala Lipis, Hospital Selayang and Klinik Azman , but with temporary exclusion of Hospital Miri, due to the absent of ophthalmologist and thus a small number of cataract surgery performed. OBJECTIVES The objectives of National Cataract Surgery Registery are to:
1 Determine the frequency and distribution of cataract surgery in Malaysia. These are useful measures of the health burden arising of cataract and its treatment provision in the country
2 Determine the outcomes, and factors influencing outcomes of cataract surgery. This serves the needs of outcome assessment.
3 Evaluate cataract surgery services. This serves the need of accountability. 4 Stimulate and facilitate research on cataract and its management.
The objectives listed above, while typical of any cataract surgery registry, is clearly rather ambitious and certainly cannot be met right away. Thus the registry is implemented in phases. Phase 1 of the proposed cataract surgery register shall be limited to Public Hospitals only. Phase 2 of the proposed cataract surgery register shall expand the coverage of Phase 1 to include university, private hospitals and private ophthalmologists in the country.
SPONSORS OF NCSR Ophthalmology Service, Ministry of Health Clinical Research Centre, Ministry of Health

xi
CLINICAL RESEARCH CENTRE
The Clinical Research Centre is the designated collaborating unit to the NCSR. It provides the functional capacity to support the operations of the NCSR. The CRC is the clinical research arm of the Ministry of Health. Apart from the NCSR, CRC currently also supports the National Renal Registry, National Cancer Registry, National Neonatal Registry, National Mental Health Registry, National HIV/AIDS Treatment Registry and National Transplant Registry. In recent years, CRC has emerged to become the preferred collaborating partner for medical professional groups to establish disease and treatment registries in the country. This is because CRC possesses sophisticated facility and equipment, state of the art technology, and most importantly the trained human resources such as registry managers, epidemiologists, statisticians, information technology professionals and other supporting staff skilled in registry operations. These resources are consolidated in the Disease and Treatment Registry Unit in the CRC. The unit specializes in assisting medical professionals to establish and operate their registries.
Staff of the Clinical Research Centre (CRC) and Cataract Surgery Registry Unit (CSRU) of Clinical Registry Unit (CRU)
Director Dr. Zaki Morad B Mohamad Zaher Head Dr. Lim Teck Onn Head of CRU Dr. Jamaiyah Binti Haniff Cataract Surgery Registry Manager CSRU
SN Lee Poe Poay
Clinical Registry Assistant CSRU Ms. Sharmila Bt Saari Clinical Registry Assistant CSRU Mr. Mohamad Fauzan B Jamaluddin Information Security Officer Ms Celine Tsai Pao Chien Network Administrator Mr. Kevin Ng Hong Heng Assistant Network Administrator Mr. Adlan Ab. Rahman Database Administrator Ms. Lim Jie Ying Webmaster/Desktop publisher Mr. Patrick Lum See Kai Programmer Mr. Sebastian Thoo Statistician Ms. Teh Poh Geok
1
CONTENTS
ACKNOWLEDGMENTS .........................................................................................ii
PARTICIPATING CENTRES..................................................................................iii
NATIONAL CATARACT SURGERY REGISTRY ADVISORY COMMITTEE.ix
ABOUT NATIONAL CATARACT SURGERY REGISTRY .................................x
INTRODUCTION .....................................................................................................x
OBJECTIVES ...........................................................................................................x
SPONSORS OF NCSR..............................................................................................x
CLINICAL RESEARCH CENTRE .........................................................................xi
CONTENTS ...........................................................................................................1
ABBREVIATIONS ...................................................................................................5
GLOSSARY ...........................................................................................................5
REGISTRY METHODS............................................................................................6
1.ORGANISATION AND ADMINISTRATIVE STRUCTURE .............................6
2.DATA STANDARDS ............................................................................................8
3.DATA FLOW PROCESS.......................................................................................8
Overall Data Management Flow ...........................................................................10
Overall Data Flow Process ...............................................................................11
4.LEGAL ASPECT AND CONFIDENTIALITY ...................................................12
REPORT SUMMARY.............................................................................................13
1. PATIENTS’ CHARACTERISTICS ....................................................................13
2. CATARACT SURGERY PRACTICE ................................................................14
3. CATARACT SURGERY OUTCOMES .............................................................16
3.1 Cataract Surgery Complications -Intra-Operative ...................................16
3.2 Cataract Surgery Complications -Post-Operative ....................................17
3.3 Post-Oeprative Follow Up Period.............................................................18
3.4 Post-Operative Visual Acuity ....................................................................18
3.5 post-Operative Refracted VA Improved By One Or More ........................20
Line Snellen Chart .............................................................................................20
3.6 Factors Contributing To Post-Operative VA Worse .................................21
Than 6/12...........................................................................................................21
APPENDIX I (CLINICAL RECORD FORMS) .....................................................92
2
LIST OF TABLE Table 1.1 : Age Distributions...........................................................................22 Table 1.2 : Gender Distributions .....................................................................23 Table 1.3(a) : Number Of Patients With First Eye And Second Eye Surgery .....23 Table 1.3(b) : Period Of Time Before Second Eye Surgery ................................23 Table 1.4 : Number Of Patients With Ocular Co-Morbidity ...........................24 Table 1.5 : Number Of Patients With Systemic Co-Morbidity .......................25 Table 1.6(a) : Pre-Operative Visual Acuity Measurement...................................26 Table 1.6(b) : Pre-Operative Visual Acuity Measurement By Gender ................27 Table 1.7 : Causes Of Cataract ........................................................................27 Table 2.1 : Number (%) Of Surgery Done By Month .....................................28 Table 2.2 : Number Of Surgery Done By Centre, 2002 And 2003 .................29 Table 2.3 : Distribution Of Day Care Setting By Centre, All Surgery And Those Excluded Children Below 18 Years And Combined Surgery...........................................................................................31 Table 2.4 : Distribution Of Types Of Cataract Surgery By Centre .................33 Table 2.5 : Distribution Of Combined Surgery By Centre ..............................34 Table 2.6 : Proportion Of Nature Of Cataract Surgery....................................35 Table 2.7 : Type Of Anaesthesia .....................................................................36 Table 2.8 : Type Of Local Anaesthesia ...........................................................38 Table 2.9 : Distribution Of Single And Multiple Local Anaesthesia ..............40 Table 2.10 : Type Of Sedation Given To Patient Who Had Local Anaesthesia41 Table 2.11 : Intraocular Lens Implantation .......................................................42 Table 2.12 : Distribution Of Cataract Surgery Without IOL.............................43 Table 2.13 : Distribution Of IOL- Materials And Types...................................44 Table 3.1.1 : Distribution Of Intra-Operative Complications By Type Of Cataract Surgery ...........................................................................45 Table 3.1.2 : Distribution Of Intra-Operative Complications By Combined Surgery...........................................................................................49 Table 3.1.3 : Distribution Of Intra-Operative Complications By Nature Of Cataract Surgery ...........................................................................50 Table 3.1.4 : Distribution Of Intra-Operative Complications By Type Of Anaesthesia....................................................................................51 Table 3.1.5 : Distribution Of Intra-Operative Complications By Type Of Local Anaesthesia....................................................................................52 Table 3.1.6 : Distribution Of Intra-Operative Complications By Single Or Multiple Local Anaesthesia ...........................................................54 Table 3.1.7 : Distribution Of Intra-Operative Complications By Type Of Sedation .........................................................................................55 Table 3.1.8 : Distribution Of Intra-Operative Complications By Sedation ........57 Table 3.1.9 : Distribution Of Intra-Operative Complications By Cataract Surgery With IOL........................................................................................58 Table 3.1.10 : Distribution Of Intra-Operative Complications By Cataract Surgery Without IOL...................................................................................60 Table 3.1.11 : Distribution Of Intra-Operative Complications By Surgeon Status.. .........................................................................................................62 Table 3.2.1 : Distribution Of Post-Operative Complications .............................63 Table 3.2.2 : Distribution Of Post-Operative Complications By IOL Types .....64 Table 3.2.3 : Distribution Of Post-Operative Complication By Material...........65 Table 3.2.4 : Post-Operative Complication By Centre .......................................66 Table 3.3.1 : Median Follow-Up Period In Weeks (Patients With Only Unaided Vision, Refraction Was Not Performed) .......................................71

3
Table 3.3.2 : Median Follow-Up Period In Weeks (Patients With Refracted Vision) ...........................................................................................71 Table 3.4.1 : Distribution Of Post-Operative VA...............................................72
: (a) All Patients, With Primary Cause Of Cataract And Not Combined Surgery.........................................................................72
: (b) All Patients, With Primary Cause Of Cataract, Not Combined Surgery And Without Ocular Co-Morbidity ................................73 Table 3.4.2 : Distribution Of Post-Operative Refracted VA 6/12 Or Better At The Last Follow Up Among Patients Without Ocular Co- Morbidities, By Surgery ..............................................................76 Table 3.4.3 : Distribution Of Post-Operative Refracted VA 6/12 Or Better In
Relation To Age And Type Of Surgery, Among Patients Without Ocular Co- Morbidities.................................................................77
Table 3.4.4 : Distribution Of Post-Operative Refracted VA 6/12 Or Better In Relation To Gender And Type Of Surgery, Among Patients Without Ocular Co-Morbidities.....................................................78 Table 3.4.5 : Distribution Of Post-Operative Refracted VA 6/12 Or Better In Relation To Comorbidity And Type Of Surgery, Among Patients Without Ocular Co-Morbidities.....................................................79 Table 3.4.6 : Distribution Of Post-Operative Refracted VA 6/12 Or Better In Relation To Complication And Type Of Surgery .........................80 Table 3.4.7 : Distribution Of Post-Operative Refracted VA 6/12 Or Better In Relation To Nature Of Surgery And Type Of Surgery .................81 Table 3.4.8 : Distribution Of Post-Operative Refracted VA 6/12 Or Better In Relation To Anaesthesia And Type Of Surgery............................82 Table 3.4.9 : Distribution Of Post-Operative Refracted VA 6/12 Or Better In Relation To Combined Surgery And Type Of Surgery.................83 Table 3.4.10 : Distribution Of Post-Operative Refracted VA 6/12 Or Better In Relation To IOL And Type Of Surgery.........................................84 Table 3.4.11 : Distribution Of Post-Operative Refracted VA 6/12 Or Better In
Relation To Surgeon Status And Type Of Surgery Without Ocular Co- Morbidity ................................................................................85
Table 3.4.12 : Distribution Of Post-Operative Refracted VA 6/12 Or Better In Relation To Centre And Type Of Surgery.....................................86 Table 3.5.1 : Distribution Of Post-Operative Refracted VA Improved By One Or More Line Of Snellen Chart, At The Last Follow Up..............88 Table 3.5.2 : Distribution Of Post- Operative Refracted VA Improved By One Or More Line Of Snellen Chart, With And Without Ocular Co- Morbidity At The Last Follow Up................................................88 Table 3.5.3 : Distribution Of Post- Operative Refracted VA Improved By One Or More Line Of Snellen Chart With Intra-Op Complication And Without Intra- Op Complication, At The Last Follow Up ............89 Table 3.5.4 : Distribution Of Post -Operative Refracted VA Improved By One Or More Line Of Snellen Chart With Systemic Co-Morbidity And Without Systemic Co-Morbidity, At The Last Follow Up...........89 Table 3.5.5 : Distribution Of Post -Operative Refracted VA Improved By One Or More Line Of Snellen Chart At The Last Follow Up In Relation To Surgeon Status And Type Of Surgery Without Ocular Comorbidity...................................................................................90 Table 3.6.1 : Distribution Of Factors Contributing To Post- Operative Refracted VA Of Worse Than 6/12 ...............................................................91

4
LIST OF FIGURE
Figure 1.1 : Age Distributions...........................................................................22 Figure 1.6 : Pre-Operative Visual Acuity Measurement...................................26 Figure 2.1 : Number (%) Of Surgery ................................................................28 Figure 2.2 : Number Of Surgery Done By Center ............................................30 Figure 2.3(a) : Distribution Of Day Care And In Patient By Centre, Year 2003..32 Figure 2.3(b) : Distribution Of Day Care And In Patient By Centre (Exclude Children And Those With Combined Surgery), Year 2003 ..........32 Figure 2.7 : Type Of Anaesthesia .....................................................................37 Figure 3.1.1.1 : Distribution Of Intra-Operative Complication ..............................46 Figure 3.1.1.2 : Distribution Of Intra-Operative Complication By Posterior Capsule
Rupture With Vitreous Loss And Posterior Capsule Rupture Without Vitreous Loss...................................................................47
Figure 3.1.1.3 : Distribution Of Intra-Operative Complication By Zonular Dialysis With Vitreous Loss And Zonular Dialysis Without Vitreous Loss................................................................................................48
Figure 3.1.3 : Distribution Of Intra-Operative Complications By Nature Of Cataract Surgery ...........................................................................50 Figure 3.1.4 : Distribution Of Intra-Operative Complications By Type Of Anaesthesia ....................................................................................51
Figure 3.1.6 : Distribution Of Intra-Operative Complications By Single Or Multiple Local Anaesthesia ...........................................................54
Figure 3.1.7 : Distribution Of Intra-Operative Complications By Type Of Sedation .........................................................................................56 Figure 3.1.8 : Distribution Of Intra-Operative Complications By Sedation ........57 Figure 3.1.9 : Distribution Of Intra-Operative Complications By Cataract Surgery With IOL..........................................................................59 Figure 3.1.10 : Distribution Of Intra-Operative Complications By Cataract Surgery Without IOL....................................................................61 Figure 3.1.11 : Distribution Of Intra-Operative Complications By Surgeon ............ Status .............................................................................................62 Figure 3.4.1.1(b) : Distribution Of Post-Operative VA ...........................................74 Figure 3.4.1.2 : Cumulative Distribution Of Visual Acuity By Pre- And Post- Operative Unaided VA ...............................................................75 Figure 3.4.1.3 : Cumulative Distribution Of Visual Acuity By Pre- And Post- Operative Refracted VA ................................................................75 Figure 3.4.2 : Percent Of Patients With Refracted VA 6/12 Or Better At The Last Follow Up, By Surgery..................................................................76

5
ABBREVIATIONS CF Counting finger CI Confidence interval CMO Cystoid macular oedema CSRU Cataract surgery registry unit ECCE Extracapsular cataract extraction HM Hand movement IOL Intraocular lens ICCE Intracapsular cataract extraction NPL No perception of light PCO Posterior capsule opacification PCR Posterior capsule rapture PE Phacoemulsification PL Perception of light SDP Source data producers VA Visual acuity ZD Zonular dialysis GLOSSARY Advisory Committee
A committee, board, council, panel or group thereof that is established by the sponsors of the registry to govern the registry. The Advisory Committee shall direct and control the activities of the designated collaborating unit, which manages the day-to-day operations of the registry.
Advisory Committee member
An individual appointed to serve on an advisory committee. Members may have relevant expertise and/or represent the interest of SDP, users or donor.
Chairperson An advisory committee member who is appointed to preside at committee meetings and ensure that all rules of order and conduct are maintained during each session.
Disease Register The ongoing systematic collection, analysis and interpretation of a specific disease data essential to the planning, implementation and evaluation of clinical and public health practice, closely integrated with dissemination of these data to those who need to know. The final link in the chain is the application of these data to the management, prevention and control of the disease. A registration system includes a functional capacity for data collection, analysis and dissemination linked to clinical and public health programs.
Secretary The individual responsible for an advisory committee’s overall administrative management. He/she is ordinarily a staff provided by the designated collaborating unit for the purpose.
Source data producer
The individuals or institutions that report the required data to the registry.
Sponsor The individuals or institutions that own the registry.

6
REGISTRY METHODS The following aspects of registry methods are described below.
1. Organization and Administrative structure 2. Data standards 3. Data flow process 4. Legal aspects and confidentiality
1.ORGANISATION AND ADMINISTRATIVE STRUCTURE In brief, the organizational structure of NCSR consists of sponsors, advisory committee, cataract surgery registry unit (CSRU), source data producers and target groups/users. The Ophthalmology Service and the Clinical Research Centre, both of the MOH, jointly sponsor the registry. The NCSR is governed by an advisory committee who oversees the operations of registry. The cataract surgery registry unit, which is based at the Clinical Research Centre, MOH, provides the functional capacity to support the operation of NCSR. The source data producers are Departments of Ophthalmology, both public and private, who provide data on patients who have had cataract surgeries. The users or target groups are individuals or institutions to which the regular registry reports are addressed. The description of the duties and functions of each entity depicted follows.
Sponsor The registry is jointly sponsored by the Ophthalmology Service and the Clinical Research Centre; both of the MOH. Sponsors shall
♦ Be responsible to Director General of Health, MOH for the effective, efficient and responsive operations of the registry.
♦ Provide leadership and direction for the registry. ♦ Establish an Advisory Committee, jointly chair the committee and appoint
members to the Advisory committee. Membership should represent all interested parties. These must include source data producers, Target groups or users and representative from the Cataract Surgery Registry Unit.
♦ Provide the financial, human and information resources required, if necessary with financial contribution from industry or donor agencies.
Sponsor
Advisory Committee
Source Data Producers
Cataract Surgery Registry Unit
Target Group or Users

7
Advisory Committee An Advisory Committee for cataract surgery register shall be established by sponsors to oversee the operations of registry. Interested parties including source data producers and target groups or users are represented on this committee. The Committee shall
♦ Provide leadership and direction for cataract surgery registry. ♦ Ensure the continuing relevance of registry. ♦ Determine policy and procedures for the operations of the registry. ♦ Designate a collaborating unit to be the Cataract Surgery Registry Unit. ♦ Oversee the progress of registry. ♦ Facilitate access to data sources. ♦ Galvanize commitment of all stakeholders.
Cataract Surgery Registry Unit (CSRU) The CSRU in the Clinical Research Centre (CRC) is established to provide functional capacity to support the operation of the NCSR. Here, the collection and analysis of data, and feedback of information collected are performed. CSRU is a sophisticated unit staffed by epidemiologist, statistician, information technology personnel and other supporting staff. To achieve the objectives of the NCSR, the function of CSRU is to ensure:
1. The complete enumeration of all cataract surgery done at the SDP centres 2. The validity of the data collected
Source Data Producers (SDP) These are individual Departments of Ophthalmology who collects the required data. It is the most costly and difficult element of the system. As the data collected has to be systematic and uniform, and producers of source data need to be trained and motivated to ensure high data quality. There are 30 Ophthalmology departments under Ministry of Health (MOH), one under Ministry of Defence and 3 in the local universities. Of these public operated ophthalmology departments, 32 registered as source data producers in the year 2003. This gives a coverage rate of 91% in the government hospitals. If only the MOH hospitals are taken into account, the coverage rate is 97%. Of the 32 SDPs, 30 participated for the full year. Users or Target groups These are the individuals or institutions to which the regular registry reports are addressed. They include • Public health practitioner • Health provider • Industry • Decision maker • Researcher • Press and public It is their needs for information to assist in planning and implementing disease management, control and prevention activity that justify the investment in registry.

8
2.DATA STANDARDS The data collected are patient demography, cause of cataract, first or second eye surgery, prior intra-ocular surgery, pre-existing ocular co-morbidity and systemic co-morbidity, pre-operative unaided and refracted vision, surgeon’s status, type of admission (day care or non day care surgery), urgency of surgery, type of anesthesia, types of sedation, types of IOL (placement of IOL, material, foldable or non-foldable), and intra-ocular complication, post-operative complications, post-operative best corrected visual acuity by 12 weeks, and possible factors contributing to post-operative refracted VA of worse than 6/12. 3.DATA FLOW PROCESS Inclusion criteria All patients, regardless of age, who have undergone cataract surgery, including those who have combined cataract surgery, are included in the registry. Patients who have their lens removal, decided by surgeons while performing the other surgeries, usually during vitreo-retinal surgery were excluded. Data Collection On Clinical Record Forms Three clinical record forms are used in NCSR. They are:
i. Pre-clerking record ii. Operative records
iii. Cataract surgery outcomes through 12 weeks post-op record These forms are used as medical records in the day-to-day patient care at the eye departments, with duplicate copies to be sent to CSRU. By doing so, there is no additional work in data collection. The pre-clerking records gather information on patient demography, cause of cataract, first or second eye surgery, prior intra-ocular surgery, pre-existing ocular co-morbidity and systemic co-morbidity, pre-operative unaided and refracted vision; the operative record forms capture data related to surgical procedure, surgeon’s status, type of admission (day care or non day care surgery), urgency of surgery, type of anesthesia, both local and systemic sedation, types of IOL (placement of IOL, material, foldable or non-foldable), and intra-ocular complication, and the cataract outcome records collect data on post-operative complications and post-operative best corrected visual acuity by 12 weeks, as well as the possible factors contributing to post-operative refracted VA of worse than 6/12. Refer appendix 1 for the clinical record forms. The data transferred to CSRU are kept strictly confidential with access only to authorized individual working in the CSRU.

9
Data flow Doctors complete the pre-clerking forms while doing pre-clerking of patients. Upon completion of surgery, the operative records are entered. Post-operative findings and visual outcome findings are filled in the post-operative records by 12 ± 2 weeks post-op. Site coordinators ensure completeness of case ascertainment and completeness of data collection. She/he will send the completed forms, together with the operating list to CSRU in a monthly basis. Data submission by SDP is tracked by CSRU computer system, which flags any late submission and automatically sends a reminder. An instruction manual is used as reference and is available at http://www.crc.gov.my/ncsr website . It is also used as a training manual to new doctors and other new staff who join the eye department.
Data Management At CSRU Visual review, data entry,data update and edit checks Data received by the CSRU were logged- in and manually reviewed to check for completeness and error. Data without apparent problems were entered into the registry database. Edit checks were performed periodically to identify potential data errors, such as missing data, non-allowed values, out of range numeric values, inconsistent data and error with deduplication. Data queries that are resolved are then updated to the database. To ensure complete enumeration and validity of data, a series of tasks as shown in the figure below have to be in place.
SDP-: EYE DEPARTMENTS Data collection by doctors, optometrists & paramedics. Site coordinators monitor and collect completed forms and send to CSRU.
CSRU: CRC Data analysis & interpretation. Report writing
Users : e.g. SDP, researchers, MOH etc

10
OVERALL DATA MANAGEMENT FLOW
( Audited ) ( Audited ) ( Audited )
No
Data Source
Data Receipt
Final Data Editing
Pre Entry Manual Review
Data Logging
Data Entry
Edit Checks Run ( Data Query )
Deduplication
Final Data Validation Check Run
Final CRF Received
Data Editing
Database required for interim report -data freezing
Statistical Analysis & Reporting
Repeat Flow
End of Period?
Archive
End
Data Clarification Queries
Yes
Data Verification Resolution

11
OVERALL DATA FLOW PROCESS Functions
Yes
Yes
CRF 1 & 2
No
SDP
Receive data from SDP
CRF 1 only /obvious
error/missing data?
End
End
Yes
Received CRF 3 data?
Manual review
Notes: CRF1 = Pre Clerking record CRF2 = Operative record CRF3 = Cataract Surgery Outcomes 12 weeks post-op
*Log receipt of CRF 1 and 2 in batch
How many CRFs?
*Enter CRF 1 and 2 data
*Log receipt of CRF 3
*Enter CRF 3 data
CRF 1,2 & 3
>120 days from Date of Cataract
Operation in CRF2?
*Generate query list to site
End
*Log receipt of CRF 3 in batch
*Enter CRF 1, 2 & 3 data
No

12
Statistical Analysis Descriptive analysis was employed in this report. All data were described in terms of percentages except continuous data, like follow-up period and age, where summary statistics like mean, median, 25th percentile and 75th percentile were calculated. We ignored the missing data and confined the analysis to available data. Therefore, no imputation was done. 4.LEGAL ASPECT AND CONFIDENTIALITY Data transfer from source data producers is entirely voluntary. There is no legal provision to compel any individual or institution to report or transfer its data to the CSRU. The data transferred to CSRU is of course highly sensitive and has to be kept strictly confidential with access only to authorized individual working in the CSRU. Strict data protection procedure will need to be put in place, following standard disease registration practice, and in compliance with applicable regulatory guidelines.

13
REPORT SUMMARY The 2003 annual report contains data from 16,815 patients who had cataract surgery performed in January to December 2003 from 32 SDPs/ centres and whose complete set of clinical record forms (CRF) were received by Cataract Surgery Registry Unit by 31st July, 2004. A total 15,821 patients had complete set of three CRFs. As not all the patients who had cataract surgery done had the complete set of CRFs, the number of surgeries did not reflect the true magnitude of cataract surgery performed in each centre. Two-year comparison was possible for 19 centres as they participated fully for the year 2002 and 2003.As returns of CRF continued after the printing of 2002 annual report, the data for 2002 displayed here may not be the same as that in the printed report. 1. PATIENTS’ CHARACTERISTICS 1.1 The mean age of patients operated was 63.7 years (minimum 1 month,
maximum 100 years). Most patients operated were in the age group of 65-74 years (39%). The age distributions were similar to that of the year 2002.
1.2 As of 2002, 50% of patients who had cataract operation was female. 1.3.a Like 2002, 70% of the patients had first eye operation while 30% had second
eye operation. 1.3.b Of the 3337 patients who had second eye surgery performed, the average time period for the second eye surgery was 10 months. 1.4 Ocular co-morbidity was noted in 36% of the patients. Among the commonest
were diabetic retinopathy (10%) and glaucoma (7%). Three hundred and twenty five patients (2%) had lens related problem such as phacomorphic, phacolytic and subluxated or dislocated lens. Twelve percent of the patients had poor view of the posterior segment and thus presence of pre-existing ocular co-morbidity could not be determined.
1.5 Systemic co-morbidity was noted in 59% of the patients. Hypertension was the
most common (38%) followed by diabetes mellitus (31%), ischaemic heart disease (9%) and asthma/ COAD (5%).
1.6.a Of the 16,815 patients, 16,723 (93.5%) have records of presenting vision and
only 2104 patients (12.6%) have records of refracted vision. Based on presenting vision as measurement, there was a bimodal trend of visual status at pre-clerking, i.e. vision between 6/24 to 6/60 (28%), and vision at worse than counting fingers (CF) (48%). While using refracted vision as measurement, most patients had vision between 6/12 to 6/36 (52%). Majority of the patients (61%) presented with vision of worse than 3/60 in the operated eye, which, based on WHO definition, fell into blindness category. Many of these patents did not have refraction done.
14
1.6.b There seems to be no gender differences in terms of preoperative visual acuity. Among those presented with unaided vision of 3/60 or worse 51% were women, (49% with refracted vision). Presumably there was no gender inequity in terms of accessibility to cataract surgery service.
1.7 Senile/age related cataract accounted for 93% and traumatic cataract
accounted for 2% of the causes of cataract. Four hundred and ninety two patients (2%) had congenital or developmental cataract.
2. CATARACT SURGERY PRACTICE
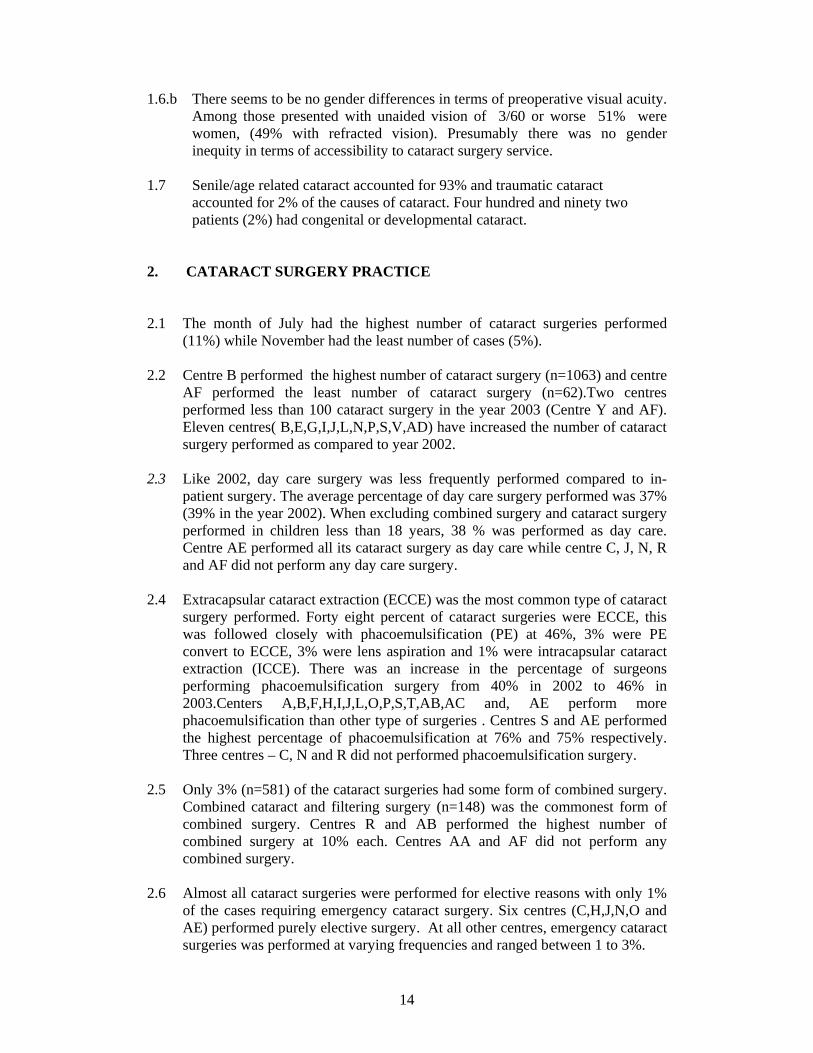
2.1 The month of July had the highest number of cataract surgeries performed
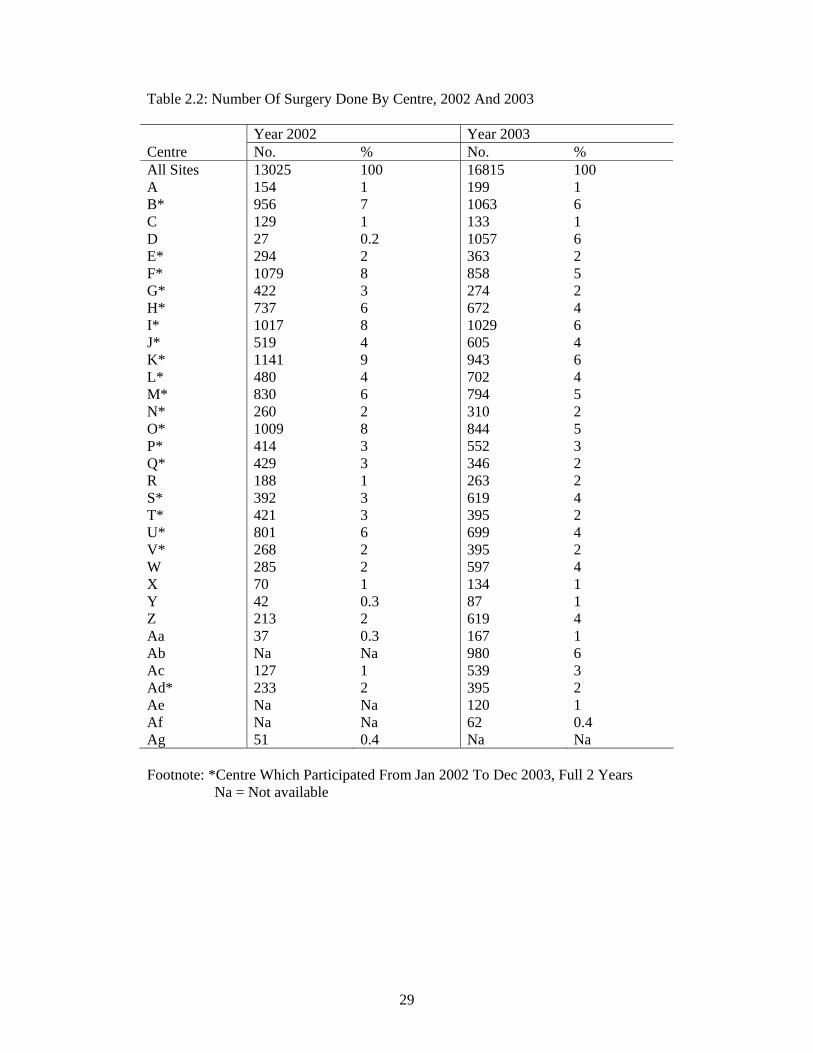
(11%) while November had the least number of cases (5%). 2.2 Centre B performed the highest number of cataract surgery (n=1063) and centre
AF performed the least number of cataract surgery (n=62).Two centres performed less than 100 cataract surgery in the year 2003 (Centre Y and AF). Eleven centres( B,E,G,I,J,L,N,P,S,V,AD) have increased the number of cataract surgery performed as compared to year 2002.
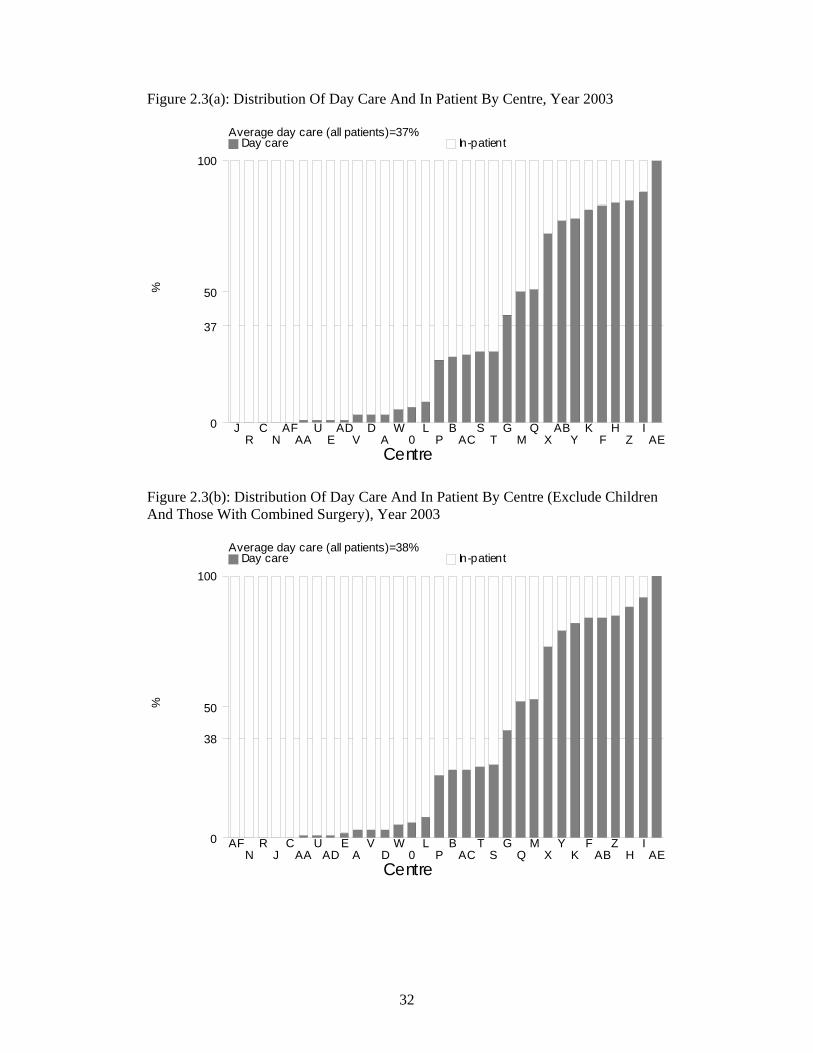
2.3 Like 2002, day care surgery was less frequently performed compared to in-
patient surgery. The average percentage of day care surgery performed was 37% (39% in the year 2002). When excluding combined surgery and cataract surgery performed in children less than 18 years, 38 % was performed as day care. Centre AE performed all its cataract surgery as day care while centre C, J, N, R and AF did not perform any day care surgery.
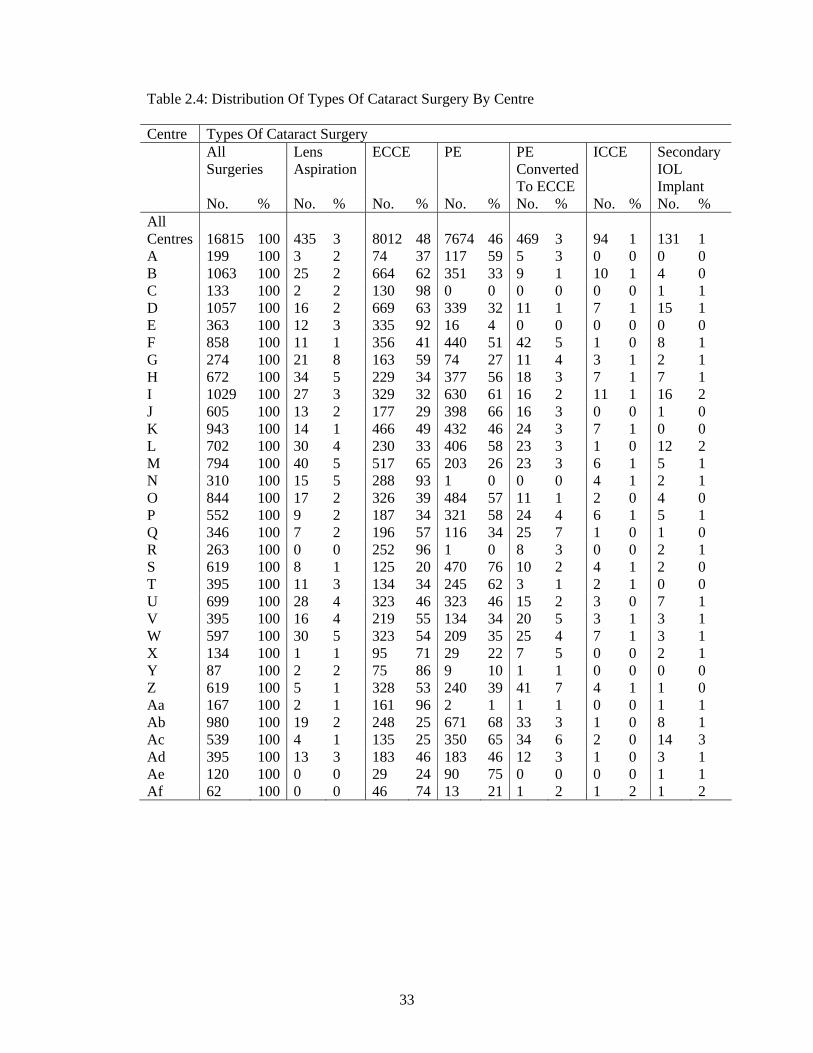
2.4 Extracapsular cataract extraction (ECCE) was the most common type of cataract
surgery performed. Forty eight percent of cataract surgeries were ECCE, this was followed closely with phacoemulsification (PE) at 46%, 3% were PE convert to ECCE, 3% were lens aspiration and 1% were intracapsular cataract extraction (ICCE). There was an increase in the percentage of surgeons performing phacoemulsification surgery from 40% in 2002 to 46% in 2003.Centers A,B,F,H,I,J,L,O,P,S,T,AB,AC and, AE perform more phacoemulsification than other type of surgeries . Centres S and AE performed the highest percentage of phacoemulsification at 76% and 75% respectively. Three centres – C, N and R did not performed phacoemulsification surgery.
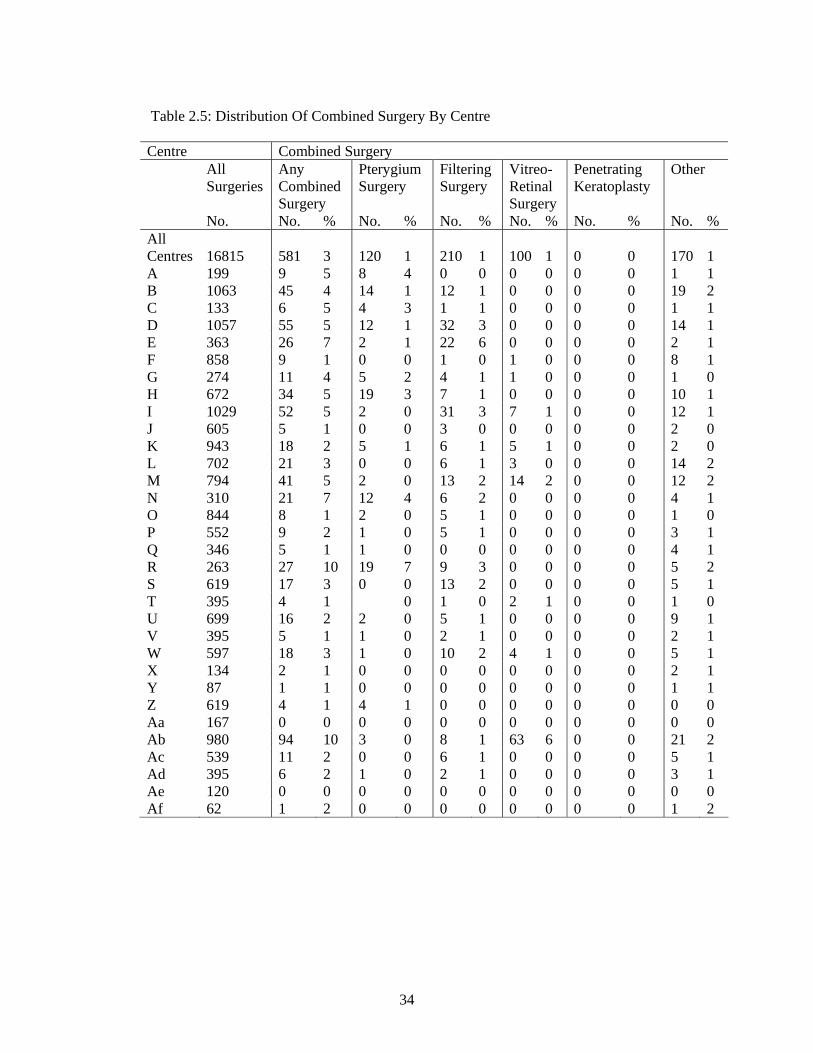
2.5 Only 3% (n=581) of the cataract surgeries had some form of combined surgery.
Combined cataract and filtering surgery (n=148) was the commonest form of combined surgery. Centres R and AB performed the highest number of combined surgery at 10% each. Centres AA and AF did not perform any combined surgery.
2.6 Almost all cataract surgeries were performed for elective reasons with only 1%
of the cases requiring emergency cataract surgery. Six centres (C,H,J,N,O and AE) performed purely elective surgery. At all other centres, emergency cataract surgeries was performed at varying frequencies and ranged between 1 to 3%.
15
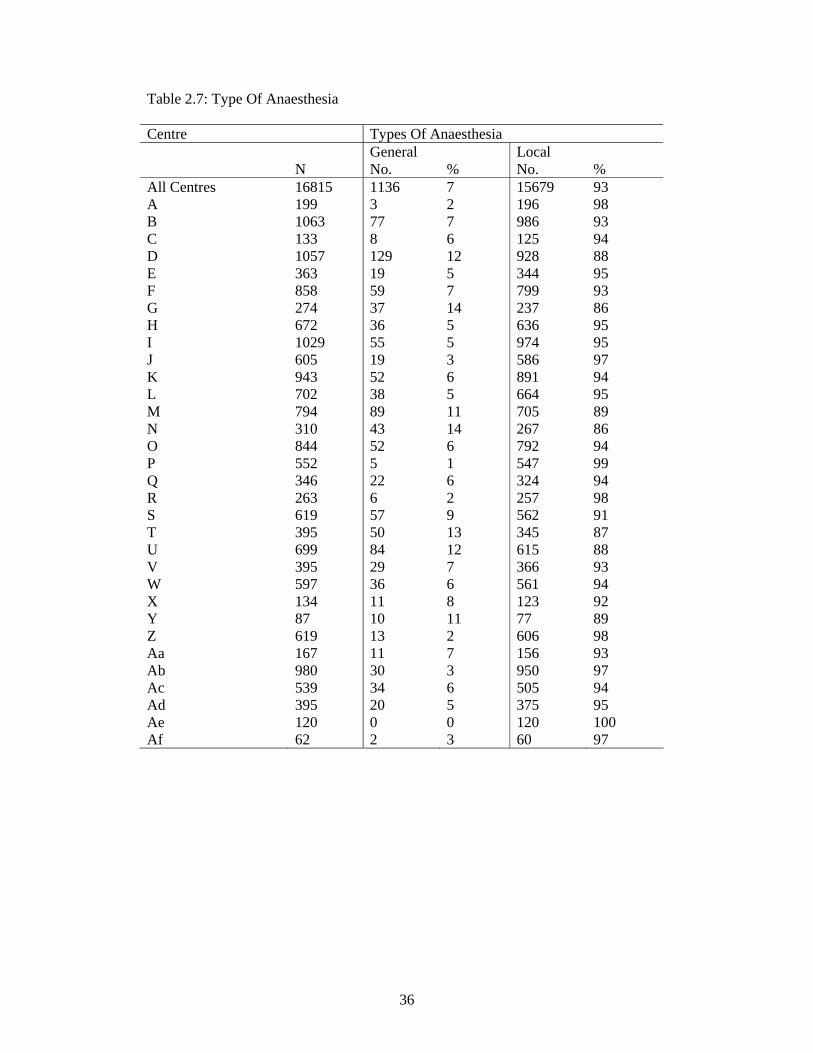
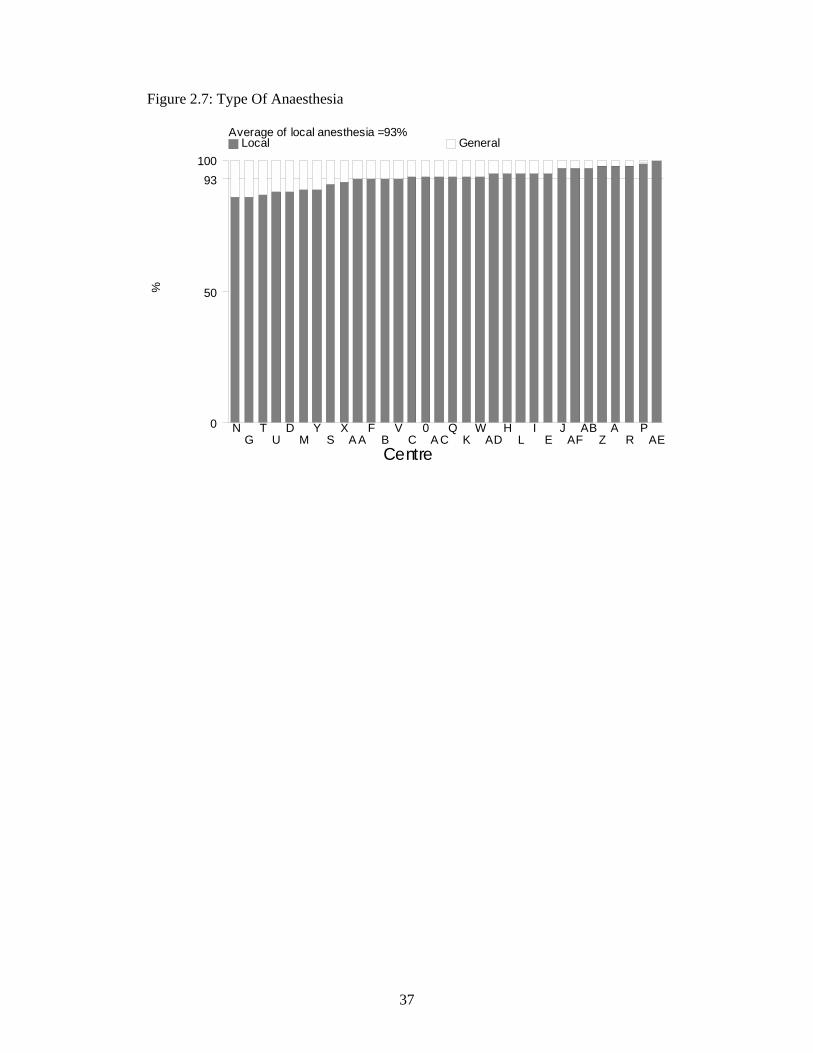
2.7 Ninety three percent of cataract surgeries were performed under local anaesthesia (LA). The frequency of utilization of LA ranged between 86% to 100% at the various centres. Seven percent of cataract surgeries were performed under general anaesthesia (GA). At centres D,G,M,N,T,U and Y GA was utilized for more than 10% of their cases and this ranged between 11-14%.
2.8 For cataract surgeries performed under LA, the type of LA most commonly
performed was subtenon anaesthesia (52%). This was followed by retrobulbar anaesthesia (19%), peribulbar anaesthesia (16%) and topical anaesthesia (18%). There was an increase in the usage of topical anaesthesia from 12% in 2002 to 18% in 2003.
Generally more than one type of LA was utilised at each centre. Though there was usually a preference towards one type of LA at each centre. Centres E and J performed purely subtenon anaesthesia while centre AF performed only retrobulbar anaesthesia.
Eleven of the 32 centres utilized facial block, a local anaesthesia aims to prevent over action of the orbicularis oculi muscle, this ranged between 1% to 98% ( mean of 6%).
2.9 Cataract surgery in some cases may require more than one type of LA to
provide adequate anaesthesia. Of the 93% of cataract surgeries requiring LA, 89% were given only one type of LA with the remaining 11% requiring more than one type of LA. There was an increase in the number of centres utilizing purely single LA ( i.e from 8 centres in 2002 to 14 centres in 2003.
2.10 Seventy seven percent of cataract surgeries undergoing LA did not have any
form of sedation. The number of centres not utilizing any form of sedation increased from 4 centres in 2002 to 10 centres) in 2003.
Among the 23% of patients who were given sedation, oral sedation was the commonest sedation used (21%). Intravenous and intramuscular sedation were infrequently used (between 1% to 8%) at most centres with the exception of centres C and E where 87% and 25% of the cases received intramuscular sedation.
2.11 Majority of the patients had intraocular lens implantation (97.5%). Posterior
chamber (PC) intraocular lens (IOL) is the normal placement of an IOL in uncomplicated surgery. PC IOLs were placed in 97% of the cataract surgeries. No centre had 100% PC IOL placement.
Anterior chamber (AC) IOLs were placed in 2.5% of cases and this ranged between 1% to 8% at the various centres. Some cases with AC IOL may not be a result of complication but planned based on preoperative assessment.

16
2.12 Four hundred and seventeen patients (2.5%) had cataract surgery without IOL implantation. Of these, 138 cases (33%), IOL had been planned but lens implantation was not possible at the time of surgery. In the remaining 279 (67%) cases no IOL was planned for implantation at the time of surgery. Lens implantation may not have been planned for various reason based on preoperative assessment.
2.13 There was a gradual decline in the usage of PMMA lens from 73% in 2002 to
62% in 2003. The utilization of acrylic IOLs on the other hand doubled from 13% in 2002 to 27% in 2003. Sixty two percent of the eyes have non-foldable IOLs and 38% had foldable IOLs.
3. CATARACT SURGERY OUTCOMES 3.1 CATARACT SURGERY COMPLICATIONS -INTRA-OPERATIVE 3.1.1 Overall, 10% of the cataract surgeries performed had intra-operative
complications. Posterior capsule rupture with vitreous loss was the commonest (5%), while posterior capsule rupture without vitreous loss (2%), zonular dialysis with vitreous loss (1%) and zonular dialysis without vitreous loss (1%) were the other types of intra-operative complications
As for surgical techniques, PE converted to ECCE cases had the highest complication rate (44%), followed by ICCE (41%). The rates of complication in ECCE and PE were almost similar, being 9% respectively.
3.1.2 In cases of combined surgeries, 18% had intra-operative complication.
Complication was most commonly seen among cataract surgeries combined with vitreo-retinal surgeries (24%). Of all the combined surgeries, posterior capsule rupture with vitreous loss was the commonest intra-operative complication (8%).
3.1.3 Eighteen percent of emergency cases had intra-operative complications
compared to 10% of elective cases. Posterior capsule rupture with vitreous loss was the most frequent complication in these patients (5%).
3.1.4 Proportion of patients who had intra-operative complications was similar
whether the operation was done under general or local anaesthesia. (10% respectively) Posterior capsule rupture with vitreous loss was the most frequent complication in these patients (5%).
3.1.5 The rate for intra-operative complication was higher among patients who had
subtenon, peribulbar, or subconjunctival anaesthesia (11% respectively) as compared to topical or retrobulbar anaesthesia (8% respectively).
3.1.6 The occurrence of intra-operative complications was almost similar whether
single (10%) or multiple (12%) administrations of local anaesthesia were given to patients.
17
3.1.7 Intravenous use of sedatives (20%) had a higher percentage of intra-operative complications compared to those given no sedation (10%), oral sedation alone (8%), intramuscular (7%) or intravenous plus oral (6%).
3.1.8 Patients who were not given any sedation have an almost similar rate of intra-
operative complication (10%) as compared to those who were given single sedation (9%) or those who had multiple sedations (7%).
3.1.9 Patients who had AC IOL implanted had the highest rate of intra-operative
complications (78%) as compared to those who had PCIOL (7%). There was a 26% complication rate for those who had scleral fixated IOLs. Among patients who had ACIOL, 46% of them had posterior capsule rupture with vitreous loss.
3.1.10 For those without IOL implantation, patients who were planned to have IOL
implanted had higher percent of intra-operative complications at 70% compared to those who were not planned to have IOL implantation (28%). Understandably, the earlier group was those who had intra-operative complication rendering IOL implantation impossible. Posterior capsule rupture with vitreous loss was the commonest complication among patients who did not have IOL implanted (20%).
3.1.11 Gazetting specialists were noted to have the highest rate of intra-operative
complication (12%), while the rate for specialists was 9% and for medical officers was 11%.
3.2 CATARACT SURGERY COMPLICATIONS -POST-OPERATIVE
(Note: Post-operative complications were recorded during the follow-up visits within 12 weeks post-operative period. They are based on clinical judgment.)
3.2.1 Overall, 9% of patients had postoperative complication. Central corneal edema
within 4 mm of visual axis (2 %) and astigmatism of more than 3 diopters (3 %) were the most common complications seen.
3.2.2 The rate of complication when foldable IOLs were implanted was 6% as
compared to 10% when non-foldable IOLs were implanted. Patients with non-foldable IOLs had higher percentages of astigmatism of more than 3 diopters (5%) compared to those with foldable IOLs (1%).
3.2.3 Without taking surgeon status and type of surgery into consideration, the rate of
complications was highest when PMMA IOLs were used (10%). This is followed by acrylic IOLs and silicone IOLs (6% respectively).
3.2.4 Nine centres (A, B, G, M, R, U, W, X, AB, AF) had post-operative
complication rates was worse than the average 9%.

18
3.3 POST-OEPRATIVE FOLLOW UP PERIOD 3.3.1 Of the 16,815 patients who had cataract surgery, 2106 (13%) patients did not
have refraction during the first 3 months following surgery. Their median post-operative follow-up period was at 4.1 weeks. Two third of them (75 percentile) had follow up period of 11.1 weeks.
3.3.2 Of the 16,815 patients who had cataract surgery, 13,645 (81%) patients had
post-operative refraction. Their median post-operative follow-up period was 10.7 weeks. Two third of them (75 percentile) had follow up period of 13.1 weeks. Of note, patients who underwent PE had shorter follow-up periods compared to patients who had other types of surgeries.
3.4 POST-OPERATIVE VISUAL ACUITY 3.4.1a Of the 16,815 patients operated, 14,683 (87%) had data on unaided post-
operative visual acuity. Of these, 38% obtained post-operative unaided VA of 6/12 or better.
Of the 16,815 patients operated 12,830 (76%) had data on post-operative refracted visual acuity. Of these, 82% obtained post-operative refracted VA of 6/12 or better.
One percent of the operated eyes had post-operative refracted VA (6% with unaided VA) at the blindness category (refracted VA 3/60 and worse). Thus, 5% of the operated eyes who were blind, measured with unaided vision, improved to better than 3/60 when refraction was performed.
3.4.1b Excluding patients with ocular co-morbidities , patients whose cataract were
due to secondary causes, and non-combined cataract surgery, 43% of the patients had post operative unaided vision of 6/12 or better, and 89% had post-op refracted vision of 6/12 or better.
Figures 3.4.1.2 and 3.4.1.3 showed the visual improvement before and after cataract surgery. In general, post-op VA was better than pre-op VA and the difference was more apparent when unaided VA was taken as the measurement.
3.4.2 When comparing post-op refracted VA in relation to types of surgery, patients
who had PE had a significantly higher percentage of good visual outcome (93% , 95% CI 92, 94) ) as compared to ECCE (85%, 95%CI 83, 86) ). Based on unaided VA, 51% of patients who had PE and 34% of patients who had ECCE achieved good visual outcome.
19
3.4.3 When comparing age and visual outcome for all cataract surgeries, patients who were younger than 14 years and older than 85 years had lower percentage of good VA outcome of 6/12 or better (64% in both groups respectively). Those between the ages of 25 to 65 had the highest percentage of refracted VA 6/12 or better. (92-95%)
3.4.4 In general, post-op visual outcome was similar among male (90%) and female
patients (88%). 3.4.5 In the presence of ocular co-morbidities, only 69% of the patients obtained
good visual outcome as compared to patients without ocular co-morbidities (89%).
In general, presence or absent of systemic co-morbidity did not affect the post-op visual outcome (89% vs. 88%).
3.4.6 In general patients who had intra-operative or post-operative complications have poorer visual outcome than patients who did not have complications.
Seventy eight percent of patients with intra-operative complications had post-operative VA 6/12 or better compared to 90% for those without intra-op complications.
For those with post-operative complications, 73% of them had refracted VA 6/12 or better compared to 90% for those without post-operative complications. In the presence of intra-operative or post-operative complications, PE had better outcome (83 and 78%) compared to any other type of cataract surgeries with complications.
3.4.7 In general, patients who had elective surgery have better visual outcome
(89%) compared to emergency cataract surgery (83%). 3.4.8 Patients who received local anaesthesia had a better visual outcome compared
to those who received general anesthesia (89% and 81% respectively).
Patients who had topical or subconjunctival anaesthesia had the highest percentage with good outcome (91%). This may be due to the fact that most of them had PE performed.
Percentage of good outcome was almost similar among those who had peribulbar (87%), retrobulbar (89%), and subtenon (89%). There is minimal difference in visual outcome among patients who were given and those who were not given systemic sedation (87 and 89%).
3.4.9 In general, patients who did not have combined surgeries had better outcome
(81%) compared to those who had combined surgery (64%).

20
3.4.10 Understandably, patients who had IOL implanted had better refracted visual outcome (89%) compared to those who did not had IOL (42%).
Ninety-four percent of patients with foldable IOLs had a postoperative visual acuity of 6/12 or better, compared to 86% of those with non-foldable IOLs. Among those who underwent PE, the percentage of good visual outcome was almost similar between foldable or non-foldable IOLs (94% vs.91%).
When comparing IOL material regardless of surgery type, 94% of patients who received both acrylic and silicone IOLs had a good visual outcome. 86% of patients using PMMA IOLs had refracted visual outcome of 6/12 or better.
Among patients who had ECCE, the visual outcome differs on whether PMMA (79%), acrylic (78%) or silicone IOL (76%) was implanted. However, among patients who had PE, patients who had PMMA had lower percent of good outcome (91%) while there was no difference in visual outcome between patient who had silicone or acrylic IOL implantation (94% and 94% respectively).
3.4.11 When comparing visual outcome among patients who were without ocular co-
morbidity (n=8679) in relation to surgeons status, percent of patient with good visual outcomes was highest amongst those performed by specialists ( 90%, 95% CI 89,90) followed by gazetting specialists (86%,95% CI 84,89) and medical officers (85%,95% CI 83,87). However, the differences in performance became not significant when they were compared by surgery types.
3.4.12 When comparing among centres, percent of post-operative visual outcome of
6/12 or better in the 32 centres ranged from 72% to 98%, with the average of 83%. Four out of 32 centres performed below the average.
Among ECCE cataract surgeries, percent of good outcome ranged from 61% to 100% in all centres, with the average of 81%. Nine out of 32 centres performed below average. Among PE cataract surgeries, percent of good outcome ranged from 82% to 100% in all centres, with the average of 85%. One out of 32 centres performed below average.
3.5 POST-OPERATIVE REFRACTED VA IMPROVED BY ONE OR MORE LINE SNELLEN CHART
3.5.1 Of the 16,815 patients operated, only 1105 ( 68%) patients had refracted
vision for both pre-op and post -op assessment. Among these 1105 patients, 93% of them had one or more line of visual improvement postoperatively, while 4% experienced no change in visual acuity and 3% had reduced vision. Among those with one line visual improvement, the highest percentage was lens aspiration (100%, but small sample, n=13), PE (94%), followed by ECCE (93%), and PE converted to ECCE (93%).
21
3.5.2 In the absence of ocular co-morbidity, 93% of patients had visual improvement of one line or more. With ocular co-morbidity, 86% of the patients had visual improvement.
3.5.3 In the absence of intra-op complications, 94% of patients had visual
improvement of one line or more. Even with the presence of intra-op complication, 84% of the patients had visual improvement.
3.5.4 Whether patients had or did not have systemic co-morbidity, there is no
difference in the proportion of patient with visual improvement (93%). 3.5.5 When comparing visual outcome in patients who were without ocular co-
morbidity in relation to surgeon’s status, there were no significant differences among patients who had cataract surgeries performed by specialists, gazetting specialists or medical officers. However, among patients who had PE, specialist performed better than gazetting specialist (95% vs. 82%).
3.6 FACTORS CONTRIBUTING TO POST-OPERATIVE VA WORSE THAN 6/12 3.6.1 Of the 986 patients who had postoperative refracted visual acuity of worse
than 6/12, only 888 (90%) had factors identified for poor outcome.
High astigmatism (40%) was the main cause for poor outcome followed by posterior capsular opacification (15%) and cystoid macular oedema (6%). Among the 41 patients who were noted to have post-operative endophthalmitis, 10 (24.4%) had post –operative best corrected visual acuity of worse than 6/12. The rate of post-operative endophthalmitis reported in the 2003 cataract surgery registry was 0.24% (41/16815).

22
1. PATIENTS’ CHARACTERISTICS
Table 1.1: Age Distributions Age, Years N=16811 Mean 63.7 Median 66 Minimum 1 Month Maximum 100 % Distributions Age Group <1 Year 0.1 1-14 Years 1 15-24 Years 1 25-34 Years 1 35-44 Years 3 45-54 Years 12 55-64 Years 27 65-74 Years 39 75-84 Years 15 >=85 Years 2 Figure 1.1: Age Distributions
%
Age group, years
0
10
20
30
40 percent
<11-14
15-2425-34
35-4445-54
55-6465-74
75-84>=85

23
Table 1.2: Gender Distributions Gender N=16815 % Male 50 Female 50 Table 1.3(a) : Number Of Patients With First Eye And Second Eye Surgery Type Of Surgery No. % N 16815 100 First Eye 11851 70 Second Eye 4964 30 Table 1.3(b): Period Of Time Before Second Eye Surgery Period, Months N= 3337 Mean 16.87 Sd 19.64 Minimum 0 Maximum 278.21 Median 10.18 Sd=Standard Deviation

24
Table 1.4: Number Of Patients With Ocular Co-Morbidity Patients With Ocular Co-Morbidity No. % N 16815 100 Patients With Any Ocular Co-Morbidity 6068 36 Patients With Specific Ocular Co-Morbidity Anterior Segment 1. Pterygium Involving The Cornea 393 2 2. Corneal Opacity 200 1 3. Glaucoma 1096 7 4. Chronic Uveitis 48 0.3 5. Pseudoexfoliation 254 2 Len Related Complication 1. Phacomorphic 152 1 2. Phacolytic 63 0.4 3. Subluxated/Disclosed 110 1 Posterior Segment 1. Diabetic Retinopathy: Non Proliferative 965 6 2. Diabetic Retinopathy: Proliferative 366 2 3. Diabetic Retinopathy: CSME 177 1 4. Diabetic Retinopathy: Vitreous Haemorrhage 106 1 5. ARMD 215 1 6. Other Macular Disease (Includes Hole Or Scar) 106 1 7. Optic Nerve Disease, Any Type 76 0.5 8. Retinal Detachment 177 1 9. Cannot Be Assessed 1962 12 Miscellaneous 1. Amblyopia 61 0.4 2. Significant Previous Eye Trauma 80 0.5 3. Pre-Existing Non Glaucoma Field Defect 3 0.02 Other 827 5

25
Table 1.5: Number Of Patients With Systemic Co-Morbidity Patients With Systemic Co-Morbidity No. % N 16815 100 Patients With Any Systemic Co-Morbidity 9933 59 Patients With Specific Systemic Co-Morbidity 1.Hypertension 6408 38 2.Diabetes Mellitus 5136 31 3.Ischaemic Heart Disease 1538 9 4.Renal Failure 303 2 5.Cerebrovascular Accident 165 1 6.Coad/Asthma 907 5 7.Hansen's Disease 5 0.03 8.Allergies 63 0.4 Other 1139 7

26
Table 1.6(a): Pre-Operative Visual Acuity Measurement Pre-Operative VA Unaided Refracted N=16723 100% N=2104 100% No. % No. % 6/5 2 0.01 0 0 6/6 20 0.1 22 1 6/9 92 1 94 4 6/12 282 2 211 10 6/18 647 4 319 15 6/24 1209 7 308 15 6/36 1510 9 254 12 6/60 1960 12 198 9 5/60 302 2 31 1 4/60 298 2 28 1 3/60 514 3 60 3 2/60 666 4 71 3 1/60 1001 6 74 4 CF 3408 20 186 9 HM 3567 21 174 8 PL 1211 7 73 3 NPLl 34 0.2 1 0.05 Figure 1.6: Pre-Operative Visual Acuity Measurement
%
Visual acuity
0
5
10
15
20
Unaided Refracted
6/56/6
6/96/12
6/186/24
6/366/60
5/604/60
3/602/60
1/60CF
HMPL
NPL

27
Table 1.6(b): Pre-Operative Visual Acuity Measurement By Gender Pre-Operative VA 3/60 Or Worse Unaided Refracted No. % No. % N 10401 100 639 100 Gender Male 5092 49 325 51 Female 5309 51 314 49 Table 1.7: Causes Of Cataract Causes Of Cataract No. % N 16815 100 Primary Cataract Senile/Age Related 15623 93 Congenital 175 1 Development 317 2 Other 46 0.3 Secondary Cataract Trauma 399 2 Drug Induced 81 0.5 Surgery Induced 67 0.4 Other 107 1
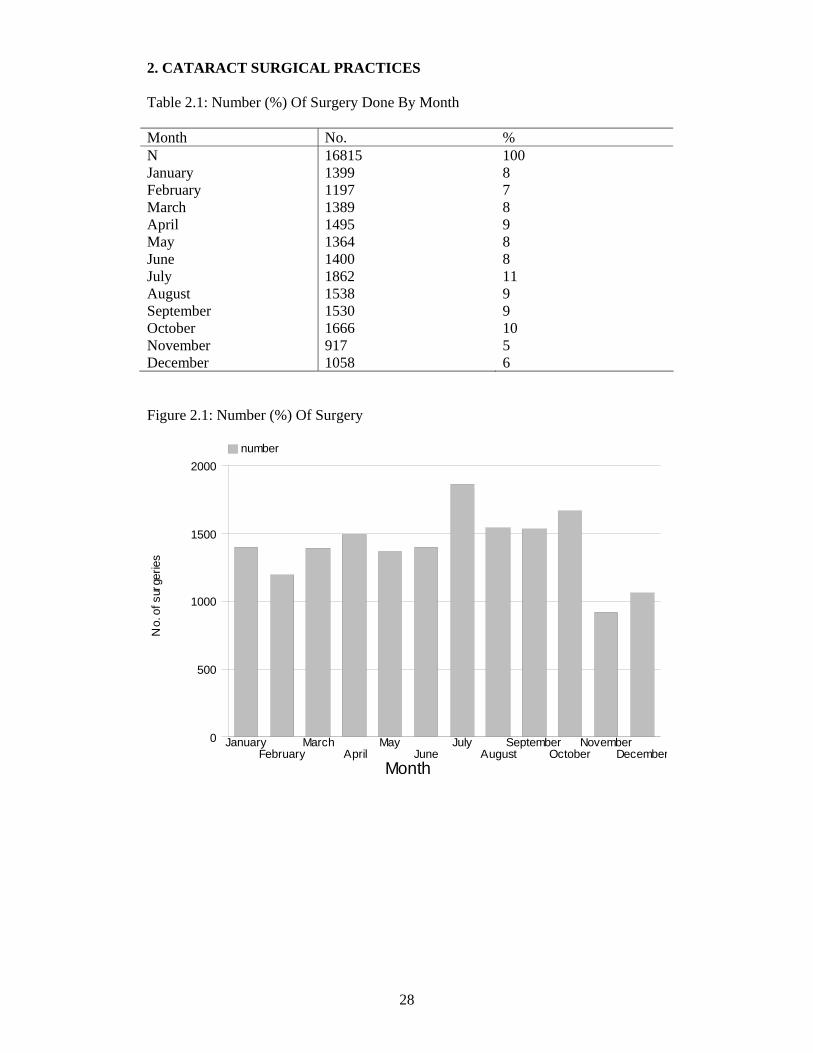
28
2. CATARACT SURGICAL PRACTICES Table 2.1: Number (%) Of Surgery Done By Month Month No. % N 16815 100 January 1399 8 February 1197 7 March 1389 8 April 1495 9 May 1364 8 June 1400 8 July 1862 11 August 1538 9 September 1530 9 October 1666 10 November 917 5 December 1058 6 Figure 2.1: Number (%) Of Surgery
No.
of s
urge
ries
Month
0
500
1000
1500
2000 number
JanuaryFebruary
MarchApril
MayJune
JulyAugust
SeptemberOctober
NovemberDecember
29
Table 2.2: Number Of Surgery Done By Centre, 2002 And 2003 Year 2002 Year 2003 Centre No. % No. % All Sites 13025 100 16815 100 A 154 1 199 1 B* 956 7 1063 6 C 129 1 133 1 D 27 0.2 1057 6 E* 294 2 363 2 F* 1079 8 858 5 G* 422 3 274 2 H* 737 6 672 4 I* 1017 8 1029 6 J* 519 4 605 4 K* 1141 9 943 6 L* 480 4 702 4 M* 830 6 794 5 N* 260 2 310 2 O* 1009 8 844 5 P* 414 3 552 3 Q* 429 3 346 2 R 188 1 263 2 S* 392 3 619 4 T* 421 3 395 2 U* 801 6 699 4 V* 268 2 395 2 W 285 2 597 4 X 70 1 134 1 Y 42 0.3 87 1 Z 213 2 619 4 Aa 37 0.3 167 1 Ab Na Na 980 6 Ac 127 1 539 3 Ad* 233 2 395 2 Ae Na Na 120 1 Af Na Na 62 0.4 Ag 51 0.4 Na Na Footnote: *Centre Which Participated From Jan 2002 To Dec 2003, Full 2 Years Na = Not available

30
Figure 2.2: Number Of Surgery Done By Center
No.
of s
urge
ries
Centre
0
500
1000
1500 Year 2002 Year 2003
AB
CD
EF
GH
IJ
KL
MN
OP
QR
ST
UV
WX
YZ
AAAB
A CAD
AEAF
AG

31
Table 2.3: Distribution Of Day Care Setting By Centre, All Surgery And Those Excluded Children Below 18 Years And Combined Surgery Day Care Year 2002 Day Care Year 2003 Centre All Surgery Exclude Children
And Combined Surgery
All Surgery
Exclude Children And Combined Surgery
N No. % N No. % N No. % N No. % All Sites
13025 4996 39 12445
4887
39 16815 6203 37 15981 6089 38
A 154 0 0 142 0 0 199 5 3 188 5 3 B 956 226 24 893 218 24 1063 270 25 1002 262 26 C 129 0 0 120 0 0 133 0 0 125 0 0 D 27 1 4 26 1 4 1057 30 3 994 27 3 E 294 10 3 279 10 4 363 5 1 329 5 2 F 1079 957 89 1023 926 91 858 712 83 841 708 84 G 422 223 53 382 206 54 274 111 41 246 100 41 H 737 599 81 694 578 83 672 567 84 617 544 88 I 1017 891 88 967 875 90 1029 905 88 957 884 92 J 519 10 2 509 10 2 605 0 0 594 0 0 K 1141 763 67 1104 759 69 943 764 81 922 759 82 L 480 51 11 457 51 11 702 55 8 663 55 8 M 830 349 42 790 345 44 794 396 50 736 390 53 N 260 0 0 253 0 0 310 0 0 282 0 0 O 1009 100 10 991 100 10 844 48 6 822 47 6 P 414 49 12 393 48 12 552 132 24 537 130 24 Q 429 34 8 409 34 8 346 175 51 339 175 52 R 188 0 0 173 0 0 263 1 0.4 234 1 0.4 S 392 209 53 382 207 54 619 168 27 599 166 28 T 421 175 42 405 172 42 395 106 27 384 105 27 U 801 21 3 773 21 3 699 8 1 667 8 1 V 268 2 1 246 2 1 395 11 3 379 11 3 W 285 14 5 274 14 5 597 27 5 562 26 5 X 70 56 80 68 55 81 134 97 72 132 96 73 Y 42 26 62 41 26 63 87 68 78 86 68 79 Z 213 208 98 212 207 98 619 525 85 611 519 85 Aa 37 1 3 37 1 3 167 2 1 167 2 1 Ab Na Na Na Na Na Na 980 750 77 876 733 84 Ac 127 20 16 126 20 16 539 140 26 527 139 26 Ad 233 1 0.4 225 1 0.4 395 5 1 383 5 1 Ae Na Na Na Na Na Na 120 120 100 119 119 100Af Na Na Na Na Na Na 62 0 0 61 0 0 Ag 51 0 0 51 0 0 Na Na Na Na Na Na
32
Figure 2.3(a): Distribution Of Day Care And In Patient By Centre, Year 2003
Average day care (all patients)=37%
%
Centre
0
37
50
100 Day care In-patient
JR
CN
AFAA
UE
ADV
DA
W0
LP
BAC
ST
GM
QX
ABY
KF
HZ
IAE
Figure 2.3(b): Distribution Of Day Care And In Patient By Centre (Exclude Children And Those With Combined Surgery), Year 2003
Average day care (all patients)=38%
%
Centre
0
38
50
100 Day care In-patient
AFN
RJ
CAA
UAD
EA
VD
W0
LP
BAC
TS
GQ
MX
YK
FAB
ZH
IAE
33
Table 2.4: Distribution Of Types Of Cataract Surgery By Centre Centre Types Of Cataract Surgery All
Surgeries Lens Aspiration
ECCE PE PE Converted To ECCE
ICCE Secondary IOL Implant
No. % No. % No. % No. % No. % No. % No. % All Centres 16815 100 435 3 8012 48 7674 46 469 3 94 1 131 1 A 199 100 3 2 74 37 117 59 5 3 0 0 0 0 B 1063 100 25 2 664 62 351 33 9 1 10 1 4 0 C 133 100 2 2 130 98 0 0 0 0 0 0 1 1 D 1057 100 16 2 669 63 339 32 11 1 7 1 15 1 E 363 100 12 3 335 92 16 4 0 0 0 0 0 0 F 858 100 11 1 356 41 440 51 42 5 1 0 8 1 G 274 100 21 8 163 59 74 27 11 4 3 1 2 1 H 672 100 34 5 229 34 377 56 18 3 7 1 7 1 I 1029 100 27 3 329 32 630 61 16 2 11 1 16 2 J 605 100 13 2 177 29 398 66 16 3 0 0 1 0 K 943 100 14 1 466 49 432 46 24 3 7 1 0 0 L 702 100 30 4 230 33 406 58 23 3 1 0 12 2 M 794 100 40 5 517 65 203 26 23 3 6 1 5 1 N 310 100 15 5 288 93 1 0 0 0 4 1 2 1 O 844 100 17 2 326 39 484 57 11 1 2 0 4 0 P 552 100 9 2 187 34 321 58 24 4 6 1 5 1 Q 346 100 7 2 196 57 116 34 25 7 1 0 1 0 R 263 100 0 0 252 96 1 0 8 3 0 0 2 1 S 619 100 8 1 125 20 470 76 10 2 4 1 2 0 T 395 100 11 3 134 34 245 62 3 1 2 1 0 0 U 699 100 28 4 323 46 323 46 15 2 3 0 7 1 V 395 100 16 4 219 55 134 34 20 5 3 1 3 1 W 597 100 30 5 323 54 209 35 25 4 7 1 3 1 X 134 100 1 1 95 71 29 22 7 5 0 0 2 1 Y 87 100 2 2 75 86 9 10 1 1 0 0 0 0 Z 619 100 5 1 328 53 240 39 41 7 4 1 1 0 Aa 167 100 2 1 161 96 2 1 1 1 0 0 1 1 Ab 980 100 19 2 248 25 671 68 33 3 1 0 8 1 Ac 539 100 4 1 135 25 350 65 34 6 2 0 14 3 Ad 395 100 13 3 183 46 183 46 12 3 1 0 3 1 Ae 120 100 0 0 29 24 90 75 0 0 0 0 1 1 Af 62 100 0 0 46 74 13 21 1 2 1 2 1 2
34
Table 2.5: Distribution Of Combined Surgery By Centre Centre Combined Surgery All
Surgeries Any Combined Surgery
Pterygium Surgery
Filtering Surgery
Vitreo-Retinal Surgery
Penetrating Keratoplasty
Other
No. No. % No. % No. % No. % No. % No. % All Centres 16815 581 3 120 1 210 1 100 1 0 0 170 1 A 199 9 5 8 4 0 0 0 0 0 0 1 1 B 1063 45 4 14 1 12 1 0 0 0 0 19 2 C 133 6 5 4 3 1 1 0 0 0 0 1 1 D 1057 55 5 12 1 32 3 0 0 0 0 14 1 E 363 26 7 2 1 22 6 0 0 0 0 2 1 F 858 9 1 0 0 1 0 1 0 0 0 8 1 G 274 11 4 5 2 4 1 1 0 0 0 1 0 H 672 34 5 19 3 7 1 0 0 0 0 10 1 I 1029 52 5 2 0 31 3 7 1 0 0 12 1 J 605 5 1 0 0 3 0 0 0 0 0 2 0 K 943 18 2 5 1 6 1 5 1 0 0 2 0 L 702 21 3 0 0 6 1 3 0 0 0 14 2 M 794 41 5 2 0 13 2 14 2 0 0 12 2 N 310 21 7 12 4 6 2 0 0 0 0 4 1 O 844 8 1 2 0 5 1 0 0 0 0 1 0 P 552 9 2 1 0 5 1 0 0 0 0 3 1 Q 346 5 1 1 0 0 0 0 0 0 0 4 1 R 263 27 10 19 7 9 3 0 0 0 0 5 2 S 619 17 3 0 0 13 2 0 0 0 0 5 1 T 395 4 1 0 1 0 2 1 0 0 1 0 U 699 16 2 2 0 5 1 0 0 0 0 9 1 V 395 5 1 1 0 2 1 0 0 0 0 2 1 W 597 18 3 1 0 10 2 4 1 0 0 5 1 X 134 2 1 0 0 0 0 0 0 0 0 2 1 Y 87 1 1 0 0 0 0 0 0 0 0 1 1 Z 619 4 1 4 1 0 0 0 0 0 0 0 0 Aa 167 0 0 0 0 0 0 0 0 0 0 0 0 Ab 980 94 10 3 0 8 1 63 6 0 0 21 2 Ac 539 11 2 0 0 6 1 0 0 0 0 5 1 Ad 395 6 2 1 0 2 1 0 0 0 0 3 1 Ae 120 0 0 0 0 0 0 0 0 0 0 0 0 Af 62 1 2 0 0 0 0 0 0 0 0 1 2

35
Table 2.6: Proportion Of Nature Of Cataract Surgery Centre Nature Of Cataract Surgery Emergency Elective N No. % No. % All Centres 16815 159 1 16656 99 A 199 1 1 198 99 B 1063 11 1 1052 99 C 133 0 0 133 100 D 1057 7 1 1050 99 E 363 6 2 357 98 F 858 11 1 847 99 G 274 6 2 268 98 H 672 3 0 669 100 I 1029 7 1 1022 99 J 605 1 0 604 100 K 943 11 1 932 99 L 702 16 2 686 98 M 794 8 1 786 99 N 310 1 0 309 100 O 844 3 0 841 100 P 552 3 1 549 99 Q 346 2 1 344 99 R 263 2 1 261 99 S 619 4 1 615 99 T 395 4 1 391 99 U 699 6 1 693 99 V 395 4 1 391 99 W 597 10 2 587 98 X 134 2 1 132 99 Y 87 1 1 86 99 Z 619 5 1 614 99 Aa 167 5 3 162 97 Ab 980 7 1 973 99 Ac 539 5 1 534 99 Ad 395 6 2 389 98 Ae 120 0 0 120 100 Af 62 1 2 61 98
36
Table 2.7: Type Of Anaesthesia Centre Types Of Anaesthesia General Local N No. % No. % All Centres 16815 1136 7 15679 93 A 199 3 2 196 98 B 1063 77 7 986 93 C 133 8 6 125 94 D 1057 129 12 928 88 E 363 19 5 344 95 F 858 59 7 799 93 G 274 37 14 237 86 H 672 36 5 636 95 I 1029 55 5 974 95 J 605 19 3 586 97 K 943 52 6 891 94 L 702 38 5 664 95 M 794 89 11 705 89 N 310 43 14 267 86 O 844 52 6 792 94 P 552 5 1 547 99 Q 346 22 6 324 94 R 263 6 2 257 98 S 619 57 9 562 91 T 395 50 13 345 87 U 699 84 12 615 88 V 395 29 7 366 93 W 597 36 6 561 94 X 134 11 8 123 92 Y 87 10 11 77 89 Z 619 13 2 606 98 Aa 167 11 7 156 93 Ab 980 30 3 950 97 Ac 539 34 6 505 94 Ad 395 20 5 375 95 Ae 120 0 0 120 100 Af 62 2 3 60 97
37
Figure 2.7: Type Of Anaesthesia
Average of local anesthesia =93%
%
Centre
0
93
50
100 Local General
NG
TU
DM
YS
XA A
FB
VC
0A C
QK
WAD
HL
IE
JAF
ABZ
AR
PAE

38
Table 2.8: Type Of Local Anaesthesia
Centre Local Anaesthesia Retrobulbar Peribulbar Subtenon Subconjunctival Facial Block Topical Other N No. % No. % No. % No. % No. % No. % No. % All Centres 15679 2952 19 2575 16 8076 52 141 1 865 6 2819 18 0 0 A 196 0 0 1 1 134 68 5 3 0 0 61 31 0 0 B 986 900 91 1 0 101 10 1 0 216 22 1 0 0 0 C 125 124 99 0 0 0 0 0 0 122 98 0 0 0 0 D 928 57 6 2 0 627 68 109 12 0 0 183 20 0 0 E 344 0 0 0 0 344 100 0 0 0 0 0 0 0 0 F 799 22 3 115 14 488 61 0 0 4 1 210 26 0 0 G 237 0 0 2 1 140 59 1 0 1 0 93 39 0 0 H 636 9 1 343 54 292 46 2 0 21 3 481 76 0 0 I 974 2 0 0 0 400 41 1 0 5 1 568 58 0 0 J 586 1 0 1 0 585 100 0 0 0 0 0 0 0 0 K 891 1 0 3 0 883 99 1 0 2 0 4 0 0 0 L 664 50 8 289 44 184 28 1 0 79 12 237 36 0 0 M 705 62 9 542 77 175 25 2 0 0 0 1 0 0 0 N 267 230 86 6 2 25 9 3 1 128 48 1 0 0 0 O 792 675 85 75 9 40 5 0 0 0 0 9 1 0 0 P 547 23 4 427 78 1 0 3 1 0 0 94 17 0 0 Q 324 0 0 1 0 240 74 0 0 0 0 84 26 0 0 R 257 1 0 254 99 2 1 0 0 23 9 0 0 0 0 S 562 0 0 0 0 184 33 4 1 0 0 386 69 0 0 T 345 220 64 71 21 65 19 1 0 39 11 18 5 0 0 U 615 21 3 13 2 582 95 0 0 0 0 0 0 0 0 V 366 12 3 5 1 308 84 1 0 2 1 41 11 0 0 W 561 3 1 0 0 558 99 0 0 0 0 0 0 0 0
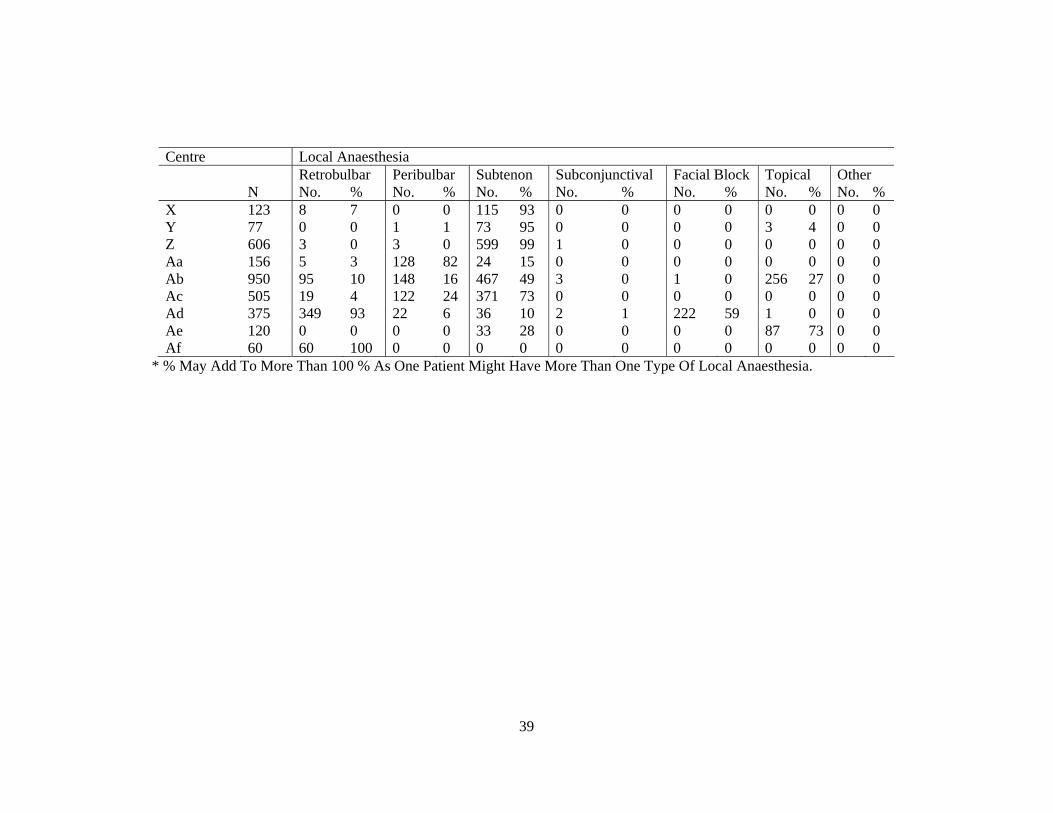
39
Centre Local Anaesthesia Retrobulbar Peribulbar Subtenon Subconjunctival Facial Block Topical Other N No. % No. % No. % No. % No. % No. % No. % X 123 8 7 0 0 115 93 0 0 0 0 0 0 0 0 Y 77 0 0 1 1 73 95 0 0 0 0 3 4 0 0 Z 606 3 0 3 0 599 99 1 0 0 0 0 0 0 0 Aa 156 5 3 128 82 24 15 0 0 0 0 0 0 0 0 Ab 950 95 10 148 16 467 49 3 0 1 0 256 27 0 0 Ac 505 19 4 122 24 371 73 0 0 0 0 0 0 0 0 Ad 375 349 93 22 6 36 10 2 1 222 59 1 0 0 0 Ae 120 0 0 0 0 33 28 0 0 0 0 87 73 0 0 Af 60 60 100 0 0 0 0 0 0 0 0 0 0 0 0
* % May Add To More Than 100 % As One Patient Might Have More Than One Type Of Local Anaesthesia.
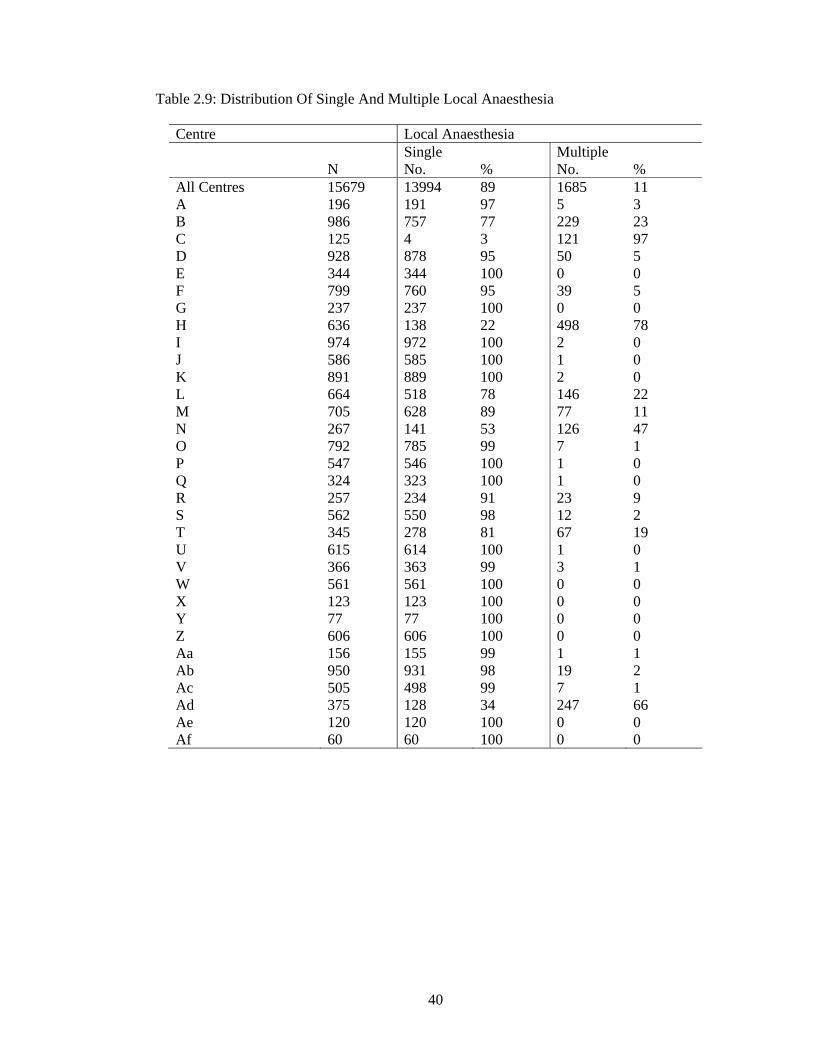
40
Table 2.9: Distribution Of Single And Multiple Local Anaesthesia
Centre Local Anaesthesia Single Multiple N No. % No. % All Centres 15679 13994 89 1685 11 A 196 191 97 5 3 B 986 757 77 229 23 C 125 4 3 121 97 D 928 878 95 50 5 E 344 344 100 0 0 F 799 760 95 39 5 G 237 237 100 0 0 H 636 138 22 498 78 I 974 972 100 2 0 J 586 585 100 1 0 K 891 889 100 2 0 L 664 518 78 146 22 M 705 628 89 77 11 N 267 141 53 126 47 O 792 785 99 7 1 P 547 546 100 1 0 Q 324 323 100 1 0 R 257 234 91 23 9 S 562 550 98 12 2 T 345 278 81 67 19 U 615 614 100 1 0 V 366 363 99 3 1 W 561 561 100 0 0 X 123 123 100 0 0 Y 77 77 100 0 0 Z 606 606 100 0 0 Aa 156 155 99 1 1 Ab 950 931 98 19 2 Ac 505 498 99 7 1 Ad 375 128 34 247 66 Ae 120 120 100 0 0 Af 60 60 100 0 0

41
Table 2.10: Type Of Sedation Given To Patient Who Had Local Anaesthesia Centre Types Of Sedation No
Sedation Oral Alone
Intravenous Alone
Intravenous Plus Oral
Intra-Muscular
N No. % No. % No. % No. % No. % All Centres 15679 12021 77 3354 21 91 1 53 0 261 2 A 196 191 97 2 1 0 0 0 0 3 2 B 986 352 36 601 61 9 1 27 3 0 0 C 125 15 12 0 0 1 1 0 0 109 87 D 928 796 86 90 10 43 5 0 0 0 0 E 344 142 41 202 59 0 0 0 0 87 25 F 799 764 96 32 4 2 0 2 0 0 0 G 237 222 94 9 4 6 3 0 0 0 0 H 636 623 98 1 0 7 1 2 0 3 0 I 974 968 99 3 0 1 0 1 0 1 0 J 586 584 100 1 0 0 0 0 0 1 0 K 891 313 35 555 62 4 0 2 0 17 2 L 664 663 100 1 0 0 0 0 0 0 0 M 705 139 20 552 78 1 0 11 2 7 1 N 267 235 88 30 11 2 1 0 0 0 0 O 792 114 14 677 85 1 0 0 0 0 0 P 547 199 36 344 63 2 0 3 1 0 0 Q 324 323 100 1 0 0 0 0 0 0 0 R 257 233 91 24 9 0 0 0 0 0 0 S 562 562 100 0 0 0 0 0 0 0 0 T 345 334 97 8 2 0 0 0 0 3 1 U 615 613 100 2 0 0 0 0 0 0 0 V 366 152 42 182 50 2 1 3 1 30 8 W 561 554 99 7 1 0 0 0 0 0 0 X 123 120 98 2 2 1 1 0 0 0 0 Y 77 77 100 0 0 0 0 0 0 0 0 Z 606 605 100 1 0 0 0 0 0 0 0 Aa 156 151 97 5 3 0 0 0 0 0 0 Ab 950 921 97 19 2 8 1 2 0 0 0 Ac 505 505 100 0 0 0 0 0 0 0 0 Ad 375 371 99 3 1 1 0 0 0 0 0 Ae 120 120 100 0 0 0 0 0 0 0 0 Af 60 60 100 0 0 0 0 0 0 0 0 * % May Add To More Than 100 % As One Patient Might Have More Than One Type Of Sedation.

42
Table 2.11: Intraocular Lens Implantation 2.11(a) IOL Implantation No. % With IOL 16397 97.5 Without IOL 417 2.5 All 16814 100 2.11(b) Distribution Of IOL Placement Centre Cataract Surgery With IOL Posterior Chamber
IOL Anterior Chamber IOL
Scleral Fixated IOL
N No. % No. % No. % All Centres 16397 15959 97 404 2 34 0.2 A 196 193 98 3 2 0 0 B 1047 1030 98 17 2 0 0 C 128 126 98 2 2 0 0 D 1036 1022 99 14 1 0 0 E 361 359 99 2 1 0 0 F 832 804 97 26 3 2 0.2 G 256 247 96 8 3 1 0.4 H 640 622 97 17 3 1 0.2 I 982 959 98 16 2 7 1 J 595 586 98 9 2 0 0 K 919 883 96 36 4 0 0 L 688 669 97 18 3 1 0.1 M 771 758 98 8 1 5 1 N 304 287 94 17 6 0 0 O 823 815 99 7 1 1 0.1 P 539 520 96 16 3 3 1 Q 339 329 97 10 3 0 0 R 256 250 98 6 2 0 0 S 619 611 99 8 1 0 0 T 392 387 99 5 1 0 0 U 685 641 94 44 6 0 0 V 391 385 98 4 1 2 1 W 579 563 97 12 2 4 1 X 131 121 92 10 8 0 0 Y 86 83 97 3 3 0 0 Z 617 582 94 35 6 0 0 Aa 165 163 99 2 1 0 0 Ab 935 915 98 19 2 1 0.1 Ac 528 515 98 7 1 6 1 Ad 376 357 95 19 5 0 0 Ae 119 117 98 2 2 0 0 Af 62 60 97 2 3 0 0

43
Table 2.12: Distribution Of Cataract Surgery Without IOL Centre Cataract Surgery Without IOL IOL Planned But Not
Implanted No IOL Was Planned
N No. % No. % All Centres 417 138 33 279 67 A 3 0 0 3 100 B 16 3 19 13 81 C 5 1 20 4 80 D 21 11 52 10 48 E 2 0 0 2 100 F 26 13 50 13 50 G 18 2 11 16 89 H 32 14 44 18 56 I 47 9 19 38 81 J 10 3 30 7 70 K 24 7 29 17 71 L 14 7 50 7 50 M 23 4 17 19 83 N 6 3 50 3 50 O 21 7 33 14 67 P 13 3 23 10 77 Q 7 1 14 6 86 R 7 3 43 4 57 S 0 0 0 0 0 T 3 0 0 3 100 U 14 8 57 6 43 V 3 0 0 3 100 W 18 3 17 15 83 X 3 0 0 3 100 Y 1 0 0 1 100 Z 2 0 0 2 100 Aa 2 1 50 1 50 Ab 45 19 42 26 58 Ac 11 8 62 3 23 Ad 19 8 42 11 58 Ae 1 0 0 1 100 Af 0 0 0 0 0

44
Table 2.13: Distribution Of IOL- Materials And Types IOL No. % N 16401 100 Materials Pmma 10203 62 Silicone 1776 11 Acrylic 4418 27 Other 4 0.02 Types Foldable 6197 38 Non-Foldable 10204 62

45
3. CATARACT SURGERY OUTCOMES 3.1 Cataract Surgery Complications - Intra-Operative Table 3.1.1: Distribution Of Intra-Operative Complications By Type Of Cataract Surgery Type Of Intra-Operative Complications
Types Of Cataract Surgery
All Surgeries Lens Aspiration
ECCE PE PE TO ECCE ICCE Secondary IOL Implant
No. % No. % No. % No. % No. % No. % No. % N 16815 100 435 100 8012 100 7674 100 469 100 94 100 131 100 Any Intra-Op Complication 1673 10 50 11 697 9 667 9 206 44 39 41 14 11 1.Posterior Capsule Rupture With Vitreous Loss 776 5 31 7 297 4 330 4 113 24 3 3 2 2 2.Posterior Capsule Rupture Without Vitreous Loss 260 2 10 2 77 1 159 2 12 3 2 2 0 0 3.Zonular Dialysis With Vitreous Loss 203 1 2 0.5 105 1 39 1 38 8 18 19 1 1 4.Zonular Dialysis Without Vitreous Loss 124 1 1 0.2 65 1 42 1 9 2 7 7 0 0 5.Loss Of Nucleus Material Into Vitreous 27 0.2 0 0 3 0.04 20 0.3 4 1 0 0 0 0 6.Choroidal/Suprachoroidal Haemorrhage 8 0.05 0 0 4 0.05 3 0.04 0 0 1 1 0 0 7.Significant Trauma To Cornea Or Iris 73 0.4 1 0.2 42 1 29 0.4 0 0 1 1 0 0 8.Other 266 2 7 2 129 2 72 1 40 9 8 9 10 8 * Number In Each Column Might Add Up To Be More Than That Recorded At Row With ‘ Any Intra-Op Complication’ As One Patient Might Have More Than One Type Of Intra-Operative Complications.

46
Figure 3.1.1.1 Distribution Of Intra-Operative Complication
%
Intra-operative complication
0
5
10 All surgeries
Any1
23
45
67
8
Intra-Operative Complication: Index Refers To Table 3.1.1
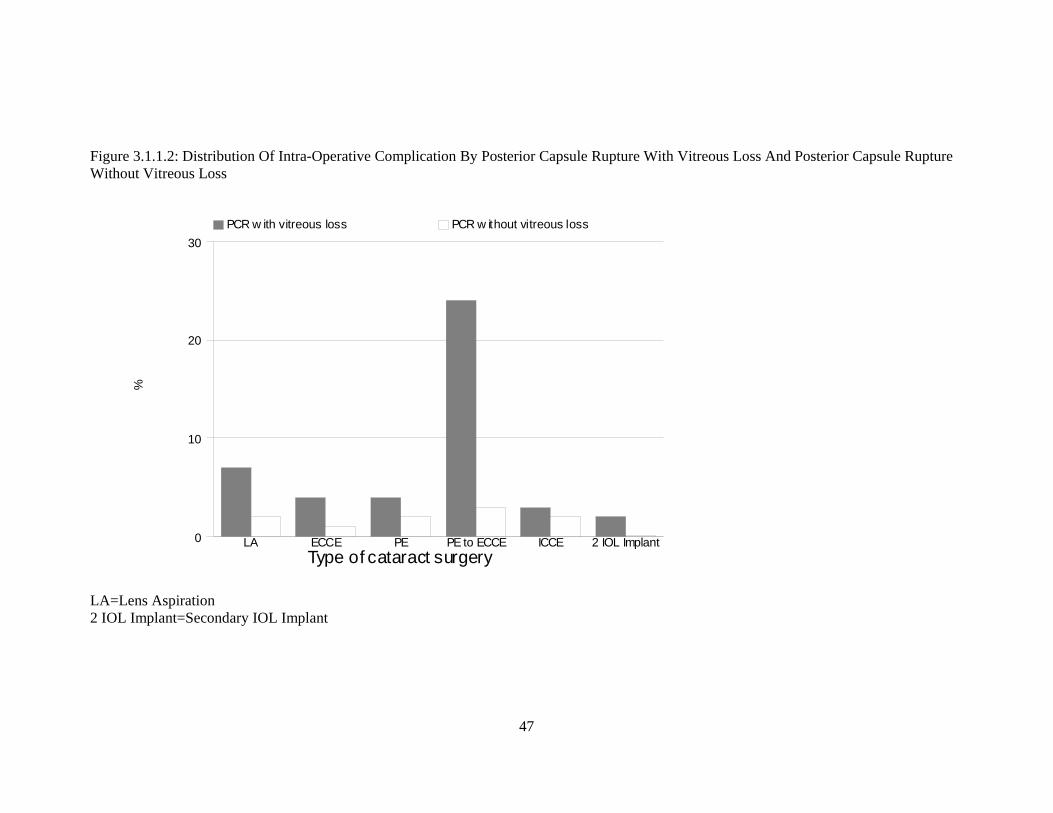
47
Figure 3.1.1.2: Distribution Of Intra-Operative Complication By Posterior Capsule Rupture With Vitreous Loss And Posterior Capsule Rupture Without Vitreous Loss
%
Type of cataract surgery0
10
20
30 PCR w ith vitreous loss PCR w ithout vitreous loss
LA ECCE PE PE to ECCE ICCE 2 IOL Implant
LA=Lens Aspiration 2 IOL Implant=Secondary IOL Implant

48
Figure 3.1.1.3: Distribution Of Intra-Operative Complication By Zonular Dialysis With Vitreous Loss And Zonular Dialysis Without Vitreous Loss
%
Type of cataract surgery0
5
10
15
20 ZD w ith vitreous loss ZD w ithout vitreous loss
LA ECCE PE PE to ECCE ICCE 2 IOL Implant
LA=Lens Aspiration 2 IOL Implant=Secondary IOL Implant

49
Table 3.1.2: Distribution Of Intra-Operative Complications By Combined Surgery
Type Of Intra-Operative Complications
Combined Surgery
All Surgeries Any Combined Surgery
Pterygium Surgery
Filtering Surgery
Vitreo-Retinal Surgery
Penetrating Keratoplasty
Other
No. % No. % No. % No. % No. % No. % No. % N 16815 100 581 100 120 100 210 100 100 100 0 0 170 100 Any Intra-Op Complication 1673 10 105 18 10 8 18 9 24 24 0 0 57 34 1.Posterior Capsule Rupture With Vitreous Loss
776 5 49 8 6 5 3 1 10 10 0 0 32 19
2.Posterior Capsule Rupture Without Vitreous Loss
260 2 11 2 1 1 3 1 4 4 0 0 3 2
3.Zonular Dialysis With Vitreous Loss
203 1 17 3 2 2 4 2 2 2 0 0 11 6
4.Zonular Dialysis Without Vitreous Loss
124 1 5 1 0 0 1 0.5 2 2 0 0 2 1
5.Loss Of Nucleus Material Into Vitreous
27 0.2 5 1 0 0 0 0 2 2 0 0 3 2
6.Choroidal/Suprachoroidal Haemorrhage
8 0.05 0 0 0 0 0 0 0 0 0 0 0 0
7.Significant Trauma To Cornea Or Iris
73 0.4 10 2 1 1 3 1 2 2 0 0 4 2
8.Other 266 2 18 3 1 1 4 2 4 4 0 0 9 5 *Number In Each Column Might Add Up To Be More Than That Recorded At Row With ‘ Any Intra-Operative Complication’ As One Patient Might Have More Than One Type Of Intra-Operative Complications

50
Table 3.1.3: Distribution Of Intra-Operative Complications By Nature Of Cataract Surgery Type Of Intra-Operative Complications Nature Of Cataract Surgery All Patients Emergency Elective No. % No. % No. % N 16815 100 159 100 16656 100 Any Intra-Op Complication 1673 10 28 18 1645 10 1.Posterior Capsule Rupture With Vitreous Loss 776 5 10 6 766 5 2.Posterior Capsule Rupture Without Vitreous Loss 260 2 2 1 258 2 3.Zonular Dialysis With Vitreous Loss 203 1 8 5 195 1 4.Zonular Dialysis Without Vitreous Loss 124 1 2 1 122 1 5.Loss Of Nucleus Material Into Vitreous 27 0.2 0 0 27 0.2 6.Choroidal/Suprachoroidal Haemorrhage 8 0.05 0 0 8 0.05 7.Significant Trauma To Cornea Or Iris 73 0.4 1 1 72 0.4 8.Other 266 2 6 4 260 2 Figure 3.1.3: Distribution Of Intra-Operative Complications By Nature Of Cataract Surgery
%
Intra-operative complication
0
5
10
15
20 Emergency Elective
Any1
23
45
67
8
Intra-Op Complication: Index Refers To Table 3.1.3

51
Table 3.1.4: Distribution Of Intra-Operative Complications By Type Of Anaesthesia Type Of Intra-Operative Complications Types Of Anaesthesia All Patients General Local No. % No. % No. % N 16815 100 1136 100 15679 100 Any Intra-Op Complication 1673 10 114 10 1559 10 1.Posterior Capsule Rupture With Vitreous Loss 776 5 38 3 738 5 2.Posterior Capsule Rupture Without Vitreous Loss 260 2 19 2 241 2 3.Zonular Dialysis With Vitreous Loss 203 1 25 2 178 1 4.Zonular Dialysis Without Vitreous Loss 124 1 11 1 113 1 5.Loss Of Nucleus Material Into Vitreous 27 0.2 2 0.2 25 0.2 6.Choroidal/Suprachoroidal Haemorrhage 8 0.05 0 0 8 0.1 7.Significant Trauma To Cornea Or Iris 73 0.4 4 0.4 69 0.4 8.Other 266 2 22 2 244 2 Figure 3.1.4: Distribution Of Intra-Operative Complications By Type Of Anaesthesia
%
Intra-operative complication
0
5
10 General Local
Any1
23
45
67
8
Intra-Op Complication: Index Refers To Table 3.1.4

52
Table 3.1.5: Distribution Of Intra-Operative Complications By Type Of Local Anaesthesia
Type Of Intra-Op Complications
Types Of Local Anaesthesia
Local Anaesthesia
Retrobulbar Peribulbar Subtenon Sub- Conjunctival
Facial Block Topical Other
No. % No. % No. % No. % No. % No. % No. % No. % N 15679 100 2952 100 2575 100 8076 100 141 100 865 100 2819 100 0 0 Any Intra-Op Complication
1559 10 236 8 275 11 906 11 16 11 104 12 232 8 0 0
1.Posterior Capsule Rupture With Vitreous Loss
738 5 107 4 126 5 430 5 10 7 51 6 130 5 0 0
2.Posterior Capsule Rupture Without Vitreous Loss
241 2 51 2 35 1 128 2 3 2 27 3 39 1 0 0
3.Zonular Dialysis With Vitreous Loss
178 1 25 1 34 1 106 1 1 1 6 1 19 1 0 0
4.Zonular Dialysis Without Vitreous Loss
113 1 15 1 17 1 79 1 0 0 7 1 6 0.2 0 0
5.Loss Of Nucleus Material Into Vitreous
25 0.2 6 0.2 4 0.2 12 0.1 0 0 2 0.2 5 0.2 0 0
6.Choroidal/Suprachoroidal Haemorrhage
8 0.1 0 0 0 0 5 0.1 1 1 0 0 3 0.1 0 0
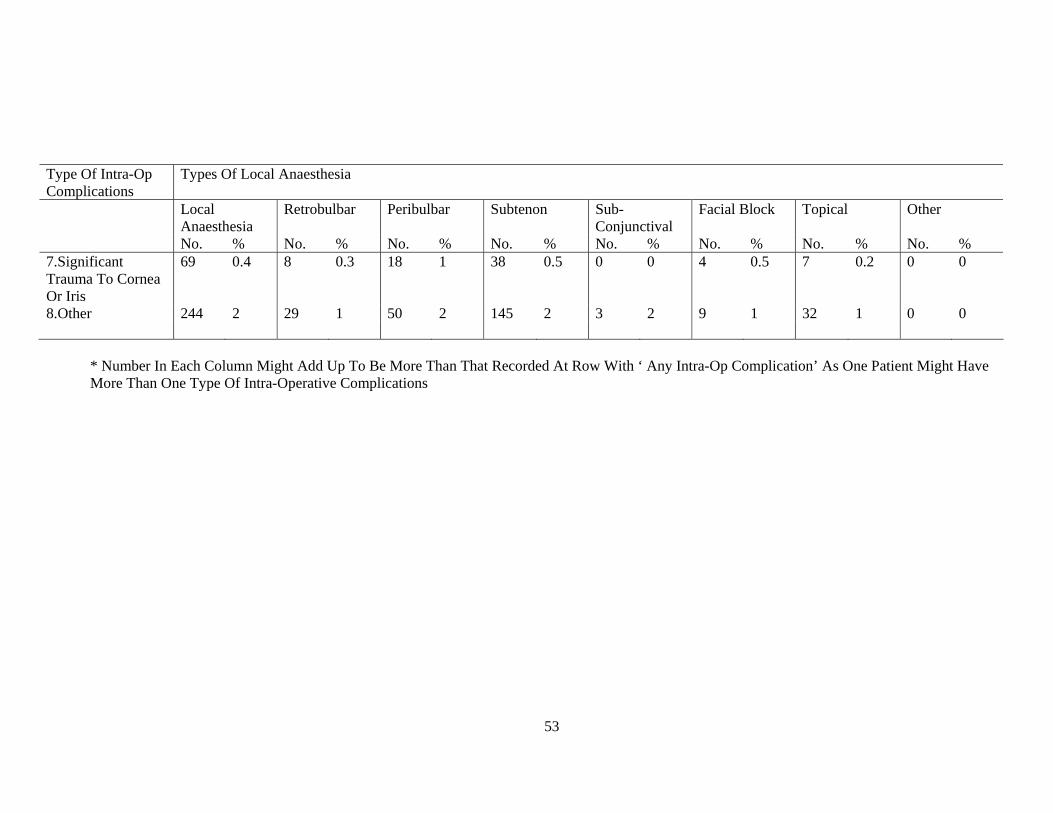
53
Type Of Intra-Op Complications
Types Of Local Anaesthesia
Local Anaesthesia
Retrobulbar Peribulbar Subtenon Sub- Conjunctival
Facial Block Topical Other
No. % No. % No. % No. % No. % No. % No. % No. % 7.Significant Trauma To Cornea Or Iris
69 0.4 8 0.3 18 1 38 0.5 0 0 4 0.5 7 0.2 0 0
8.Other 244 2 29 1 50 2 145 2 3 2 9 1 32 1 0 0
* Number In Each Column Might Add Up To Be More Than That Recorded At Row With ‘ Any Intra-Op Complication’ As One Patient Might Have More Than One Type Of Intra-Operative Complications

54
Table 3.1.6: Distribution Of Intra-Operative Complications By Single Or Multiple Local Anaesthesia Type Of Intra-Operative Complications Local Anaesthesia Single Multiple No. % No. % N 13994 100 1685 100 Any Intra-Op Complication 1353 10 206 12 1.Posterior Capsule Rupture With Vitreous Loss 624 4 114 7 2.Posterior Capsule Rupture Without Vitreous Loss 201 1 40 2 3.Zonular Dialysis With Vitreous Loss 165 1 13 1 4.Zonular Dialysis Without Vitreous Loss 102 1 11 1 5.Loss Of Nucleus Material Into Vitreous 22 0.2 3 0.2 6.Choroidal/Suprachoroidal Haemorrhage 7 0.1 1 0.1 7.Significant Trauma To Cornea Or Iris 63 0.5 6 0.4 8.Other 220 2 24 1 Figure 3.1.6: Distribution Of Intra-Operative Complications By Single Or Multiple Local Anaesthesia
%
Intra-operative complication
0
5
10
15 Single anaesthesia Multiple anaesthesia
Any1
23
45
67
8
Intra-Op Complication: Index Refers To Table 3.1.6

55
Table 3.1.7: Distribution Of Intra-Operative Complications By Type Of Sedation Type Of Intra-Operative Complications Types Of Sedation No Sedation Oral Alone Intravenous
Alone Intravenous Plus Oral
Intramuscular
No. % No. % No. % No. % No. % N 12021 100 3354 100 91 100 53 100 261 100 Any Intra-Op Complication 1249 10 278 8 18 20 3 6 18 7 1.Posterior Capsule Rupture With Vitreous Loss 587 5 132 4 12 13 3 6 8 3 2.Posterior Capsule Rupture Without Vitreous Loss 210 2 30 1 0 0 0 0 2 1 3.Zonular Dialysis With Vitreous Loss 145 1 29 1 1 1 0 0 4 2 4.Zonular Dialysis Without Vitreous Loss 92 1 19 1 2 2 0 0 0 0 5.Loss Of Nucleus Material Into Vitreous 20 0.2 5 0.1 0 0 0 0 0 0 6.Choroidal/Suprachoroidal Haemorrhage 6 0.05 1 0.03 1 1 0 0 0 0 7.Significant Trauma To Cornea Or Iris 57 0.5 11 0.3 1 1 0 0 0 0 8.Other 182 2 56 2 3 3 0 0 4 2
* Number In Each Column Might Add Up To Be More Than That Recorded At Row With ‘ Any Intra-Op Complication’ As One Patient Might Have More Than One Type Of Intra-Operative Complications
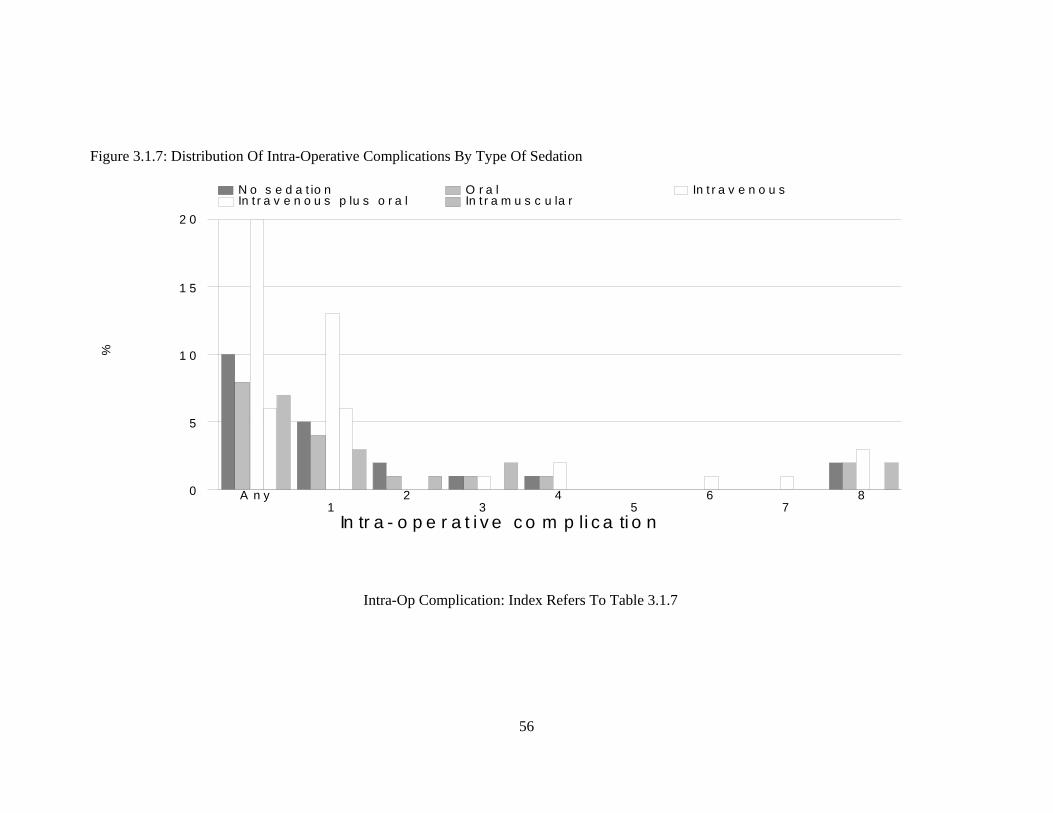
56
Figure 3.1.7: Distribution Of Intra-Operative Complications By Type Of Sedation
%
In tr a - o p e r a t i v e c o m p li c a ti o n
0
5
1 0
1 5
2 0
N o s e d a t io n O r a l In t r a v e n o u s In t r a v e n o u s p lu s o r a l In t r a m u s c u la r
A n y1
23
45
67
8
Intra-Op Complication: Index Refers To Table 3.1.7

57
Table 3.1.8: Distribution Of Intra-Operative Complications By Sedation Type Of Intra-Operative Complications Sedation No Sedation Single Multiple No. % No. % No. % N 12021 100 3557 100 101 100Any Intra-Op Complication 1249 10 303 9 7 7 1.Posterior Capsule Rupture With Vitreous Loss
587 5 147 4 4 4
2.Posterior Capsule Rupture Without Vitreous Loss
210 2 30 1 1 1
3.Zonular Dialysis With Vitreous Loss 145 1 32 1 1 1 4.Zonular Dialysis Without Vitreous Loss 92 1 21 1 0 0 5.Loss Of Nucleus Material Into Vitreous 20 0.2 5 0.1 0 0 6.Choroidal/Suprachoroidal Haemorrhage 6 0.05 2 0.1 0 0 7.Significant Trauma To Cornea Or Iris 57 0.5 12 0.3 0 0 8.Other 182 2 61 2 1 1 Figure 3.1.8: Distribution Of Intra-Operative Complications By Sedation
%
Intra-operative complication
0
5
10
No Sedation Single Sedation Multiple Sedation
Any1
23
45
67
8
Intra-Op Complication: Index Refers To Table 3.1.8
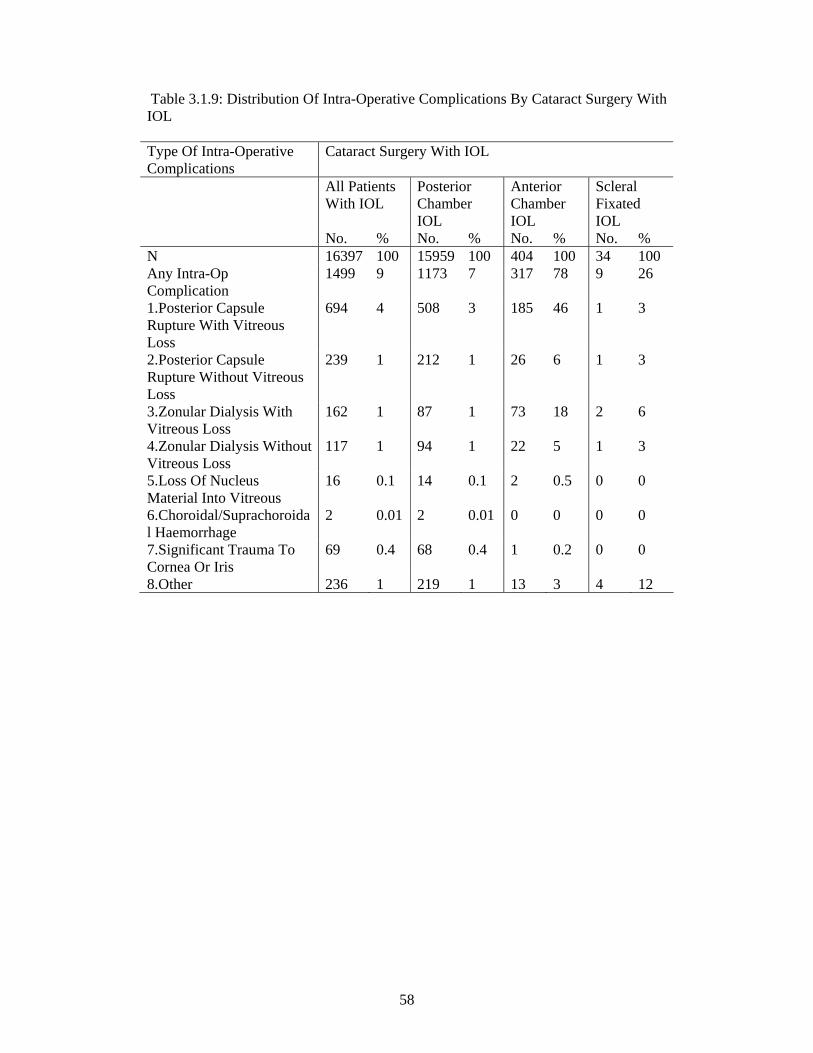
58
Table 3.1.9: Distribution Of Intra-Operative Complications By Cataract Surgery With IOL Type Of Intra-Operative Complications
Cataract Surgery With IOL
All Patients With IOL
Posterior Chamber IOL
Anterior Chamber IOL
Scleral Fixated IOL
No. % No. % No. % No. % N 16397 100 15959 100 404 100 34 100 Any Intra-Op Complication
1499 9 1173 7 317 78 9 26
1.Posterior Capsule Rupture With Vitreous Loss
694 4 508 3 185 46 1 3
2.Posterior Capsule Rupture Without Vitreous Loss
239 1 212 1 26 6 1 3
3.Zonular Dialysis With Vitreous Loss
162 1 87 1 73 18 2 6
4.Zonular Dialysis Without Vitreous Loss
117 1 94 1 22 5 1 3
5.Loss Of Nucleus Material Into Vitreous
16 0.1 14 0.1 2 0.5 0 0
6.Choroidal/Suprachoroidal Haemorrhage
2 0.01 2 0.01 0 0 0 0
7.Significant Trauma To Cornea Or Iris
69 0.4 68 0.4 1 0.2 0 0
8.Other 236 1 219 1 13 3 4 12

59
Figure 3.1.9: Distribution Of Intra-Operative Complications By Cataract Surgery With IOL
%
Intra-operative complication
0
20
40
60
80
Posterior Anterior Scleral
Any1
23
45
67
8
Intra-Op Complication: Index Refers To Table 3.1.09

60
Table 3.1.10: Distribution Of Intra-Operative Complications By Cataract Surgery Without IOL Type Of Intra-Operative Complications
Cataract Surgery Without IOL
All Patients Without IOL
IOL Planned, But Not Implanted
No IOL Was Planned
No. % No. % No. % N 417 100 138 100 279 100 Any Intra-Op Complication 174 42 96 70 78 28 1.Posterior Capsule Rupture With Vitreous Loss
82 20 50 36 32 11
2.Posterior Capsule Rupture Without Vitreous Loss
21 5 10 7 11 4
3.Zonular Dialysis With Vitreous Loss
41 10 21 15 20 7
4.Zonular Dialysis Without Vitreous Loss
7 2 4 3 3 1
5.Loss Of Nucleus Material Into Vitreous
11 3 8 6 3 1
6.Choroidal/Suprachoroidal Haemorrhage
6 1 5 4 1 0.4
7.Significant Trauma To Cornea Or Iris
4 1 2 1 2 1
8.Other 30 7 18 13 12 4

61
Figure 3.1.10: Distribution Of Intra-Operative Complications By Cataract Surgery Without IOL
%
Intra-operative complication
0
20
40
60
80 IOL Planned No IOL w as planned
Any1
23
45
67
8
Intra-Op Complication: Index Refers To Table 3.1.10
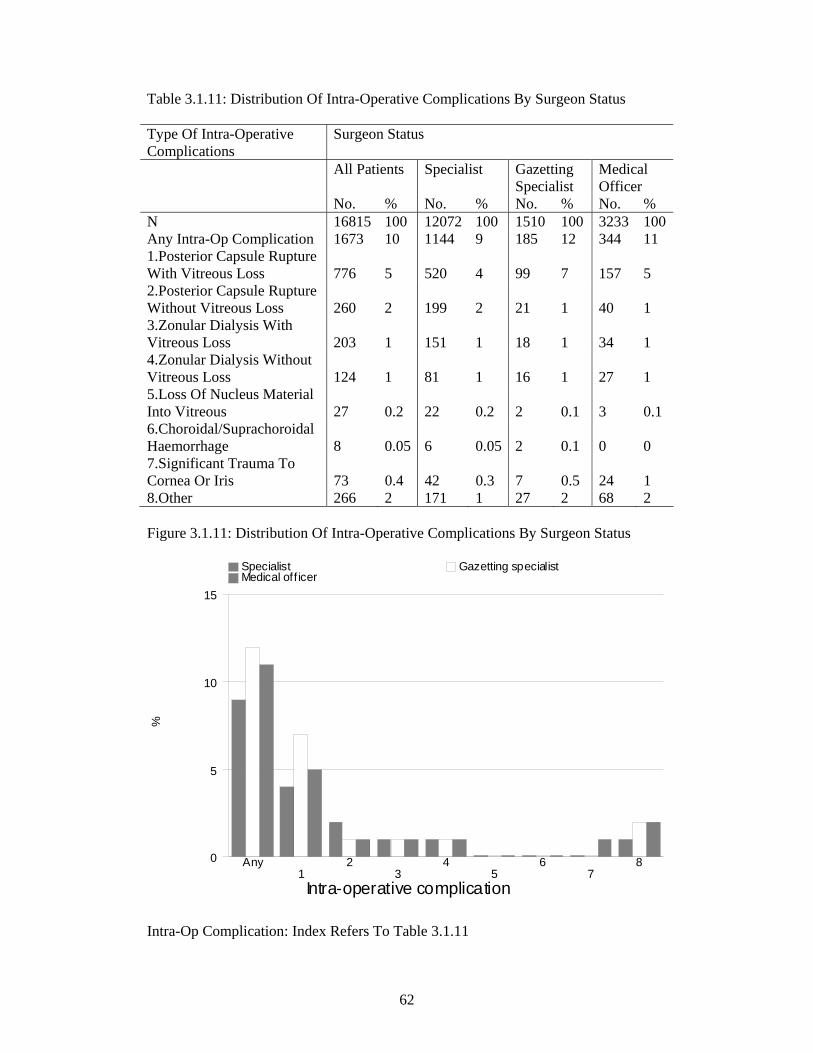
62
Table 3.1.11: Distribution Of Intra-Operative Complications By Surgeon Status Type Of Intra-Operative Complications
Surgeon Status
All Patients Specialist Gazetting Specialist
Medical Officer
No. % No. % No. % No. % N 16815 100 12072 100 1510 100 3233 100 Any Intra-Op Complication 1673 10 1144 9 185 12 344 11 1.Posterior Capsule Rupture With Vitreous Loss 776 5 520 4 99 7 157 5 2.Posterior Capsule Rupture Without Vitreous Loss 260 2 199 2 21 1 40 1 3.Zonular Dialysis With Vitreous Loss 203 1 151 1 18 1 34 1 4.Zonular Dialysis Without Vitreous Loss 124 1 81 1 16 1 27 1 5.Loss Of Nucleus Material Into Vitreous 27 0.2 22 0.2 2 0.1 3 0.1 6.Choroidal/Suprachoroidal Haemorrhage 8 0.05 6 0.05 2 0.1 0 0 7.Significant Trauma To Cornea Or Iris 73 0.4 42 0.3 7 0.5 24 1 8.Other 266 2 171 1 27 2 68 2 Figure 3.1.11: Distribution Of Intra-Operative Complications By Surgeon Status
%
Intra-operative complication
0
5
10
15
Specialist Gazetting specialist Medical off icer
Any1
23
45
67
8
Intra-Op Complication: Index Refers To Table 3.1.11
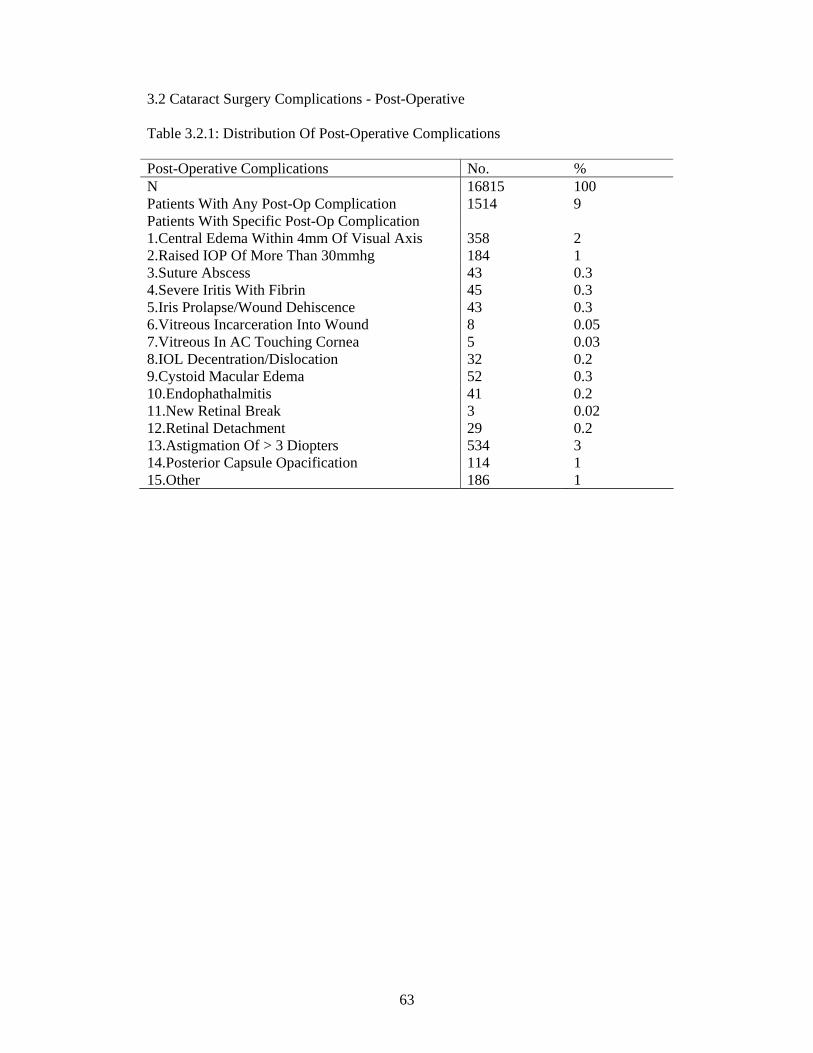
63
3.2 Cataract Surgery Complications - Post-Operative Table 3.2.1: Distribution Of Post-Operative Complications Post-Operative Complications No. % N 16815 100 Patients With Any Post-Op Complication 1514 9 Patients With Specific Post-Op Complication 1.Central Edema Within 4mm Of Visual Axis 358 2 2.Raised IOP Of More Than 30mmhg 184 1 3.Suture Abscess 43 0.3 4.Severe Iritis With Fibrin 45 0.3 5.Iris Prolapse/Wound Dehiscence 43 0.3 6.Vitreous Incarceration Into Wound 8 0.05 7.Vitreous In AC Touching Cornea 5 0.03 8.IOL Decentration/Dislocation 32 0.2 9.Cystoid Macular Edema 52 0.3 10.Endophathalmitis 41 0.2 11.New Retinal Break 3 0.02 12.Retinal Detachment 29 0.2 13.Astigmation Of > 3 Diopters 534 3 14.Posterior Capsule Opacification 114 1 15.Other 186 1

64
Table 3.2.2: Distribution Of Post-Operative Complications By IOL Types Type Of IOL Foldable Non-Foldable Post-Operative Complications N No. % No. % N 16815 6197 100 10204 100 Patients With Any Post-Op Complication
1514 380 6 1068 10
Patients With Specific Post-Op Complication
1.Central Edema Within 4mm Of Visual Axis
358 147 2 189 2
2.Raised IOP Of More Than 30mmhg 184 65 1 111 1 3.Suture Abscess 43 11 0.2 32 0.3 4.Severe Iritis With Fibrin 45 12 0.2 28 0.3 5.Iris Prolapse/Wound Dehiscence 43 2 0 40 0.4 6.Vitreous Incarceration Into Wound 8 0 0 6 0.1 7.Vitreous In AC Touching Cornea 5 0 0 4 0 8.IOL Decentration/Dislocation 32 6 0.1 26 0.3 9.Cystoid Macular Edema 52 10 0.2 42 0.4 10.Endophathalmitis 41 14 0.2 23 0.2 11.New Retinal Break 3 3 0 0 0 12.Retinal Detachment 29 6 0.1 15 0.1 13.Astigmation Of > 3 Diopters 534 50 1 473 5 14.Posterior Capsule Opacification 114 33 1 78 1 15.Other 186 55 1 111 1
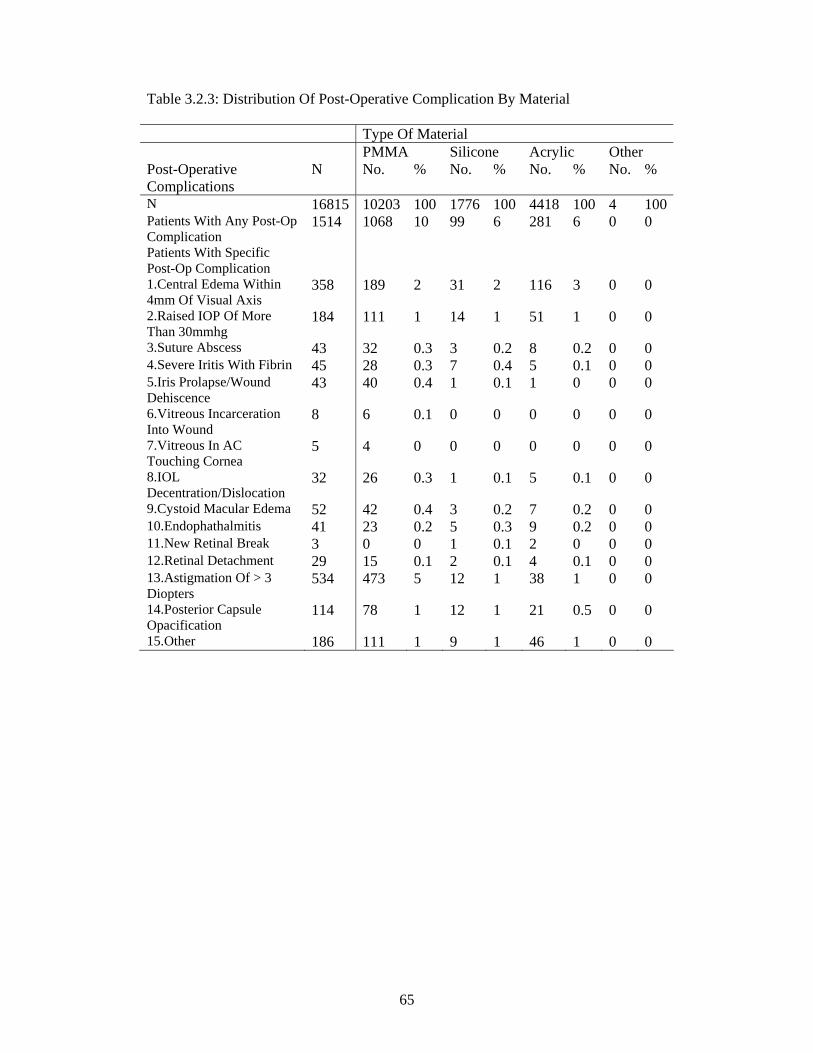
65
Table 3.2.3: Distribution Of Post-Operative Complication By Material Type Of Material PMMA Silicone Acrylic Other Post-Operative Complications
N No. % No. % No. % No. %
N 16815 10203 100 1776 100 4418 100 4 100Patients With Any Post-Op Complication
1514 1068 10 99 6 281 6 0 0
Patients With Specific Post-Op Complication
1.Central Edema Within 4mm Of Visual Axis
358 189 2 31 2 116 3 0 0
2.Raised IOP Of More Than 30mmhg
184 111 1 14 1 51 1 0 0
3.Suture Abscess 43 32 0.3 3 0.2 8 0.2 0 0 4.Severe Iritis With Fibrin 45 28 0.3 7 0.4 5 0.1 0 0 5.Iris Prolapse/Wound Dehiscence
43 40 0.4 1 0.1 1 0 0 0
6.Vitreous Incarceration Into Wound
8 6 0.1 0 0 0 0 0 0
7.Vitreous In AC Touching Cornea
5 4 0 0 0 0 0 0 0
8.IOL Decentration/Dislocation
32 26 0.3 1 0.1 5 0.1 0 0
9.Cystoid Macular Edema 52 42 0.4 3 0.2 7 0.2 0 0 10.Endophathalmitis 41 23 0.2 5 0.3 9 0.2 0 0 11.New Retinal Break 3 0 0 1 0.1 2 0 0 0 12.Retinal Detachment 29 15 0.1 2 0.1 4 0.1 0 0 13.Astigmation Of > 3 Diopters
534 473 5 12 1 38 1 0 0
14.Posterior Capsule Opacification
114 78 1 12 1 21 0.5 0 0
15.Other 186 111 1 9 1 46 1 0 0
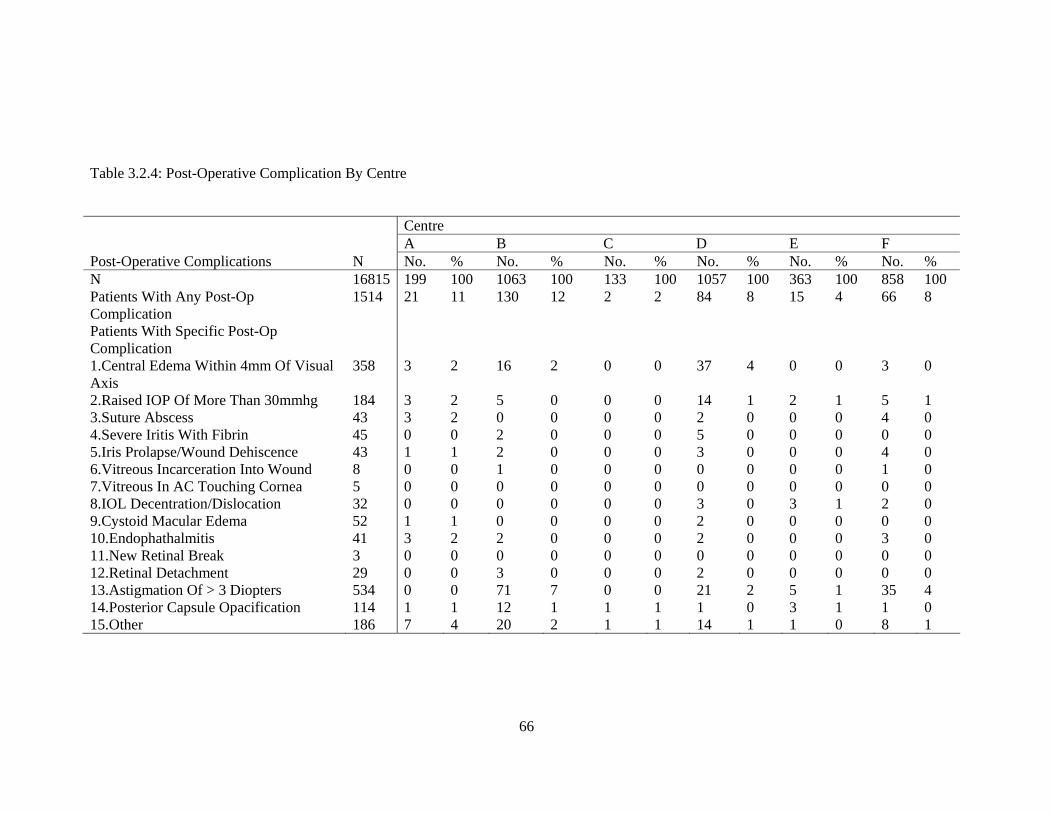
66
Table 3.2.4: Post-Operative Complication By Centre Centre A B C D E F Post-Operative Complications N No. % No. % No. % No. % No. % No. % N 16815 199 100 1063 100 133 100 1057 100 363 100 858 100 Patients With Any Post-Op Complication
1514 21 11 130 12 2 2 84 8 15 4 66 8
Patients With Specific Post-Op Complication
1.Central Edema Within 4mm Of Visual Axis
358 3 2 16 2 0 0 37 4 0 0 3 0
2.Raised IOP Of More Than 30mmhg 184 3 2 5 0 0 0 14 1 2 1 5 1 3.Suture Abscess 43 3 2 0 0 0 0 2 0 0 0 4 0 4.Severe Iritis With Fibrin 45 0 0 2 0 0 0 5 0 0 0 0 0 5.Iris Prolapse/Wound Dehiscence 43 1 1 2 0 0 0 3 0 0 0 4 0 6.Vitreous Incarceration Into Wound 8 0 0 1 0 0 0 0 0 0 0 1 0 7.Vitreous In AC Touching Cornea 5 0 0 0 0 0 0 0 0 0 0 0 0 8.IOL Decentration/Dislocation 32 0 0 0 0 0 0 3 0 3 1 2 0 9.Cystoid Macular Edema 52 1 1 0 0 0 0 2 0 0 0 0 0 10.Endophathalmitis 41 3 2 2 0 0 0 2 0 0 0 3 0 11.New Retinal Break 3 0 0 0 0 0 0 0 0 0 0 0 0 12.Retinal Detachment 29 0 0 3 0 0 0 2 0 0 0 0 0 13.Astigmation Of > 3 Diopters 534 0 0 71 7 0 0 21 2 5 1 35 4 14.Posterior Capsule Opacification 114 1 1 12 1 1 1 1 0 3 1 1 0 15.Other 186 7 4 20 2 1 1 14 1 1 0 8 1

67
Centre G H I J K L Post-Operative Complications N No. % No. % No. % No. % No. % No. % N 16815 274 100 672 100 1029 100 605 100 943 100 702 100 Patients With Any Post-Op Complication
1514 79 29 17 3 59 6 16 3 28 3 11 2
Patients With Specific Post-Op Complication
1.Central Edema Within 4mm Of Visual Axis
358 46 17 1 0 6 1 0 0 0 0 3 0
2.Raised IOP Of More Than 30mmhg 184 6 2 1 0 3 0 2 0 9 1 0 0 3.Suture Abscess 43 5 2 1 0 0 0 0 0 0 0 0 0 4.Severe Iritis With Fibrin 45 1 0 0 0 1 0 0 0 0 0 1 0 5.Iris Prolapse/Wound Dehiscence 43 1 0 1 0 1 0 0 0 0 0 0 0 6.Vitreous Incarceration Into Wound 8 0 0 0 0 0 0 0 0 0 0 0 0 7.Vitreous In AC Touching Cornea 5 0 0 0 0 0 0 0 0 0 0 0 0 8.IOL Decentration/Dislocation 32 0 0 2 0 1 0 0 0 1 0 0 0 9.Cystoid Macular Edema 52 0 0 1 0 7 1 1 0 5 1 0 0 10.Endophathalmitis 41 2 1 4 1 3 0 1 0 3 0 0 0 11.New Retinal Break 3 0 0 0 0 1 0 0 0 0 0 0 0 12.Retinal Detachment 29 0 0 4 1 1 0 0 0 0 0 0 0 13.Astigmation Of > 3 Diopters 534 13 5 0 0 24 2 4 1 3 0 3 0 14.Posterior Capsule Opacification 114 6 2 0 0 7 1 4 1 3 0 1 0 15.Other 186 6 2 5 1 9 1 4 1 4 0 1 0

68
Centre M N O P Q R Post-Operative Complications N No. % No. % No. % No. % No. % No. % N 16815 794 100 310 100 844 100 552 100 346 100 263 100 Patients With Any Post-Op Complication
1514 178 22 11 4 56 7 1 0 7 2 63 24
Patients With Specific Post-Op Complication
1.Central Edema Within 4mm Of Visual Axis
358 41 5 2 1 21 2 0 0 2 1 16 6
2.Raised IOP Of More Than 30mmhg 184 15 2 0 0 3 0 0 0 1 0 14 5 3.Suture Abscess 43 8 1 0 0 3 0 0 0 0 0 0 0 4.Severe Iritis With Fibrin 45 1 0 2 1 6 1 0 0 0 0 1 0 5.Iris Prolapse/Wound Dehiscence 43 2 0 1 0 2 0 0 0 1 0 3 1 6.Vitreous Incarceration Into Wound 8 4 1 0 0 0 0 0 0 0 0 1 0 7.Vitreous In AC Touching Cornea 5 1 0 0 0 0 0 0 0 0 0 2 1 8.IOL Decentration/Dislocation 32 5 1 0 0 2 0 0 0 0 0 3 1 9.Cystoid Macular Edema 52 12 2 0 0 0 0 0 0 0 0 3 1 10.Endophathalmitis 41 1 0 0 0 2 0 0 0 1 0 2 1 11.New Retinal Break 3 1 0 0 0 0 0 0 0 0 0 0 0 12.Retinal Detachment 29 4 1 1 0 0 0 0 0 0 0 2 1 13.Astigmation Of > 3 Diopters 534 82 10 1 0 7 1 0 0 2 1 0 0 14.Posterior Capsule Opacification 114 13 2 5 2 0 0 0 0 0 0 4 2 15.Other 186 12 2 0 0 7 1 0 0 0 0 20 8

69
Centre S T U V W X Y Post-Operative Complications N No. % No. % No. % No. % No. % No. % No. % N 16815 619 100 395 100 699 100 395 100 597 100 134 100 87 100 Patients With Any Post-Op Complication
1514 32 5 26 7 182 26 18 5 122 20 24 18 5 6
Patients With Specific Post-Op Complication
1.Central Edema Within 4mm Of Visual Axis
358 13 2 11 3 40 6 3 1 20 3 1 1 0 0
2.Raised IOP Of More Than 30mmhg 184 4 1 2 1 21 3 1 0 27 5 1 1 0 0 3.Suture Abscess 43 9 1 0 0 0 0 0 0 1 0 0 0 0 0 4.Severe Iritis With Fibrin 45 0 0 1 0 7 1 0 0 4 1 1 1 0 0 5.Iris Prolapse/Wound Dehiscence 43 1 0 0 0 4 1 0 0 10 2 1 1 0 0 6.Vitreous Incarceration Into Wound 8 0 0 0 0 0 0 0 0 1 0 0 0 0 0 7.Vitreous In AC Touching Cornea 5 0 0 0 0 1 0 1 0 0 0 0 0 0 0 8.IOL Decentration/Dislocation 32 0 0 0 0 0 0 0 0 3 1 2 1 0 0 9.Cystoid Macular Edema 52 0 0 2 1 2 0 1 0 8 1 1 1 0 0 10.Endophathalmitis 41 0 0 0 0 0 0 0 0 0 0 1 1 1 1 11.New Retinal Break 3 0 0 0 0 0 0 0 0 0 0 0 0 0 0 12.Retinal Detachment 29 1 0 1 0 2 0 1 0 2 0 1 1 0 0 13.Astigmation Of > 3 Diopters 534 3 0 7 2 93 13 7 2 44 7 15 11 3 3 14.Posterior Capsule Opacification 114 3 0 3 1 21 3 0 0 16 3 5 4 0 0 15.Other 186 1 0 0 0 5 1 4 1 2 0 3 2 1 1

70
Centre Z Aa Ab Ac Ad Ae Af Post-Operative Complications N No. % No. % No. % No. % No. % No. % No. % N 16815 619 100 167 100 980 100 539 100 395 100 120 100 62 100 Patients With Any Post-Op Complication
1514 13 2 4 2 194 20 23 4 18 5 3 3 6 10
Patients With Specific Post-Op Complication
1.Central Edema Within 4mm Of Visual Axis
358 1 0 0 0 64 7 6 1 1 0 1 1 0 0
2.Raised IOP Of More Than 30mmhg 184 1 0 1 1 37 4 4 1 2 1 0 0 0 0 3.Suture Abscess 43 0 0 0 0 0 0 7 1 0 0 0 0 0 0 4.Severe Iritis With Fibrin 45 0 0 0 0 9 1 0 0 0 0 0 0 3 5 5.Iris Prolapse/Wound Dehiscence 43 0 0 0 0 4 0 0 0 1 0 0 0 0 0 6.Vitreous Incarceration Into Wound 8 0 0 0 0 0 0 0 0 0 0 0 0 0 0 7.Vitreous In AC Touching Cornea 5 0 0 0 0 0 0 0 0 0 0 0 0 0 0 8.IOL Decentration/Dislocation 32 0 0 0 0 2 0 0 0 2 1 1 1 0 0 9.Cystoid Macular Edema 52 1 0 1 1 3 0 1 0 0 0 0 0 0 0 10.Endophathalmitis 41 2 0 0 0 2 0 0 0 6 2 0 0 0 0 11.New Retinal Break 3 0 0 0 0 1 0 0 0 0 0 0 0 0 0 12.Retinal Detachment 29 0 0 0 0 4 0 0 0 0 0 0 0 0 0 13.Astigmation Of > 3 Diopters 534 7 1 0 0 75 8 5 1 0 0 2 2 2 3 14.Posterior Capsule Opacification 114 0 0 0 0 0 0 0 0 3 1 0 0 1 2 15.Other 186 0 0 2 1 45 5 1 0 3 1 0 0 0 0
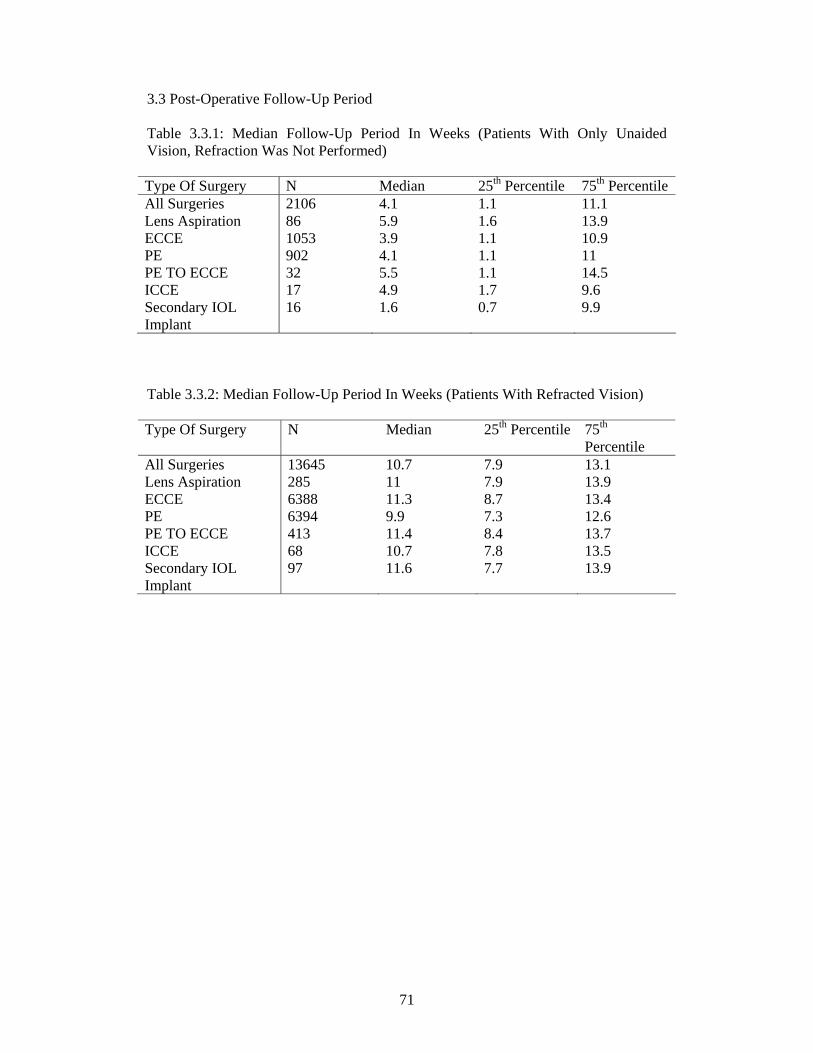
71
3.3 Post-Operative Follow-Up Period Table 3.3.1: Median Follow-Up Period In Weeks (Patients With Only Unaided Vision, Refraction Was Not Performed) Type Of Surgery N Median 25th Percentile 75th Percentile All Surgeries 2106 4.1 1.1 11.1 Lens Aspiration 86 5.9 1.6 13.9 ECCE 1053 3.9 1.1 10.9 PE 902 4.1 1.1 11 PE TO ECCE 32 5.5 1.1 14.5 ICCE 17 4.9 1.7 9.6 Secondary IOL Implant
16 1.6 0.7 9.9
Table 3.3.2: Median Follow-Up Period In Weeks (Patients With Refracted Vision) Type Of Surgery N Median 25th Percentile 75th
Percentile All Surgeries 13645 10.7 7.9 13.1 Lens Aspiration 285 11 7.9 13.9 ECCE 6388 11.3 8.7 13.4 PE 6394 9.9 7.3 12.6 PE TO ECCE 413 11.4 8.4 13.7 ICCE 68 10.7 7.8 13.5 Secondary IOL Implant
97 11.6 7.7 13.9

72
3.4 Post-Operative Visual Acuity Table 3.4.1: Distribution Of Post-Operative VA
(a) All Patients, With Primary Cause Of Cataract And Not Combined Surgery VA Post Operative Unaided Refracted N=14683 100% N=12830 100% No. % No. % 6/5 16 0.1 86 1 6/6 604 4 3626 28 6/9 2195 15 4666 36 6/12 2734 19 2191 17 6/18 2916 20 890 7 6/24 2342 16 476 4 6/36 1810 12 314 2 6/60 998 7 207 2 5/60 110 1 9 0.1 4/60 92 1 24 0.2 3/60 150 1 42 0.3 2/60 126 1 37 0.3 1/60 97 1 37 0.3 CF 259 2 109 1 HM 141 1 79 1 PL 56 0.4 22 0.2 NPL 37 0.3 15 0.1

73
(b) All Patients, With Primary Cause Of Cataract, Not Combined Surgery And Without Ocular Co-Morbidity VA Post Operative Unaided Refracted N=9857 100% N=8679 100% No. % No. % 6/5 9 0.1 65 1 6/6 485 5 2729 31 6/9 1662 17 3343 39 6/12 2025 21 1556 18 6/18 2017 20 466 5 6/24 1585 16 230 3 6/36 1117 11 133 2 6/60 575 6 71 1 5/60 58 1 3 0.03 4/60 40 0.4 4 0.05 3/60 68 1 12 0.1 2/60 58 1 8 0.1 1/60 25 0.3 6 0.1 CF 82 1 30 0.3 HM 31 0.3 13 0.1 PL 10 0.1 6 0.1 NPL 10 0.1 4 0.05
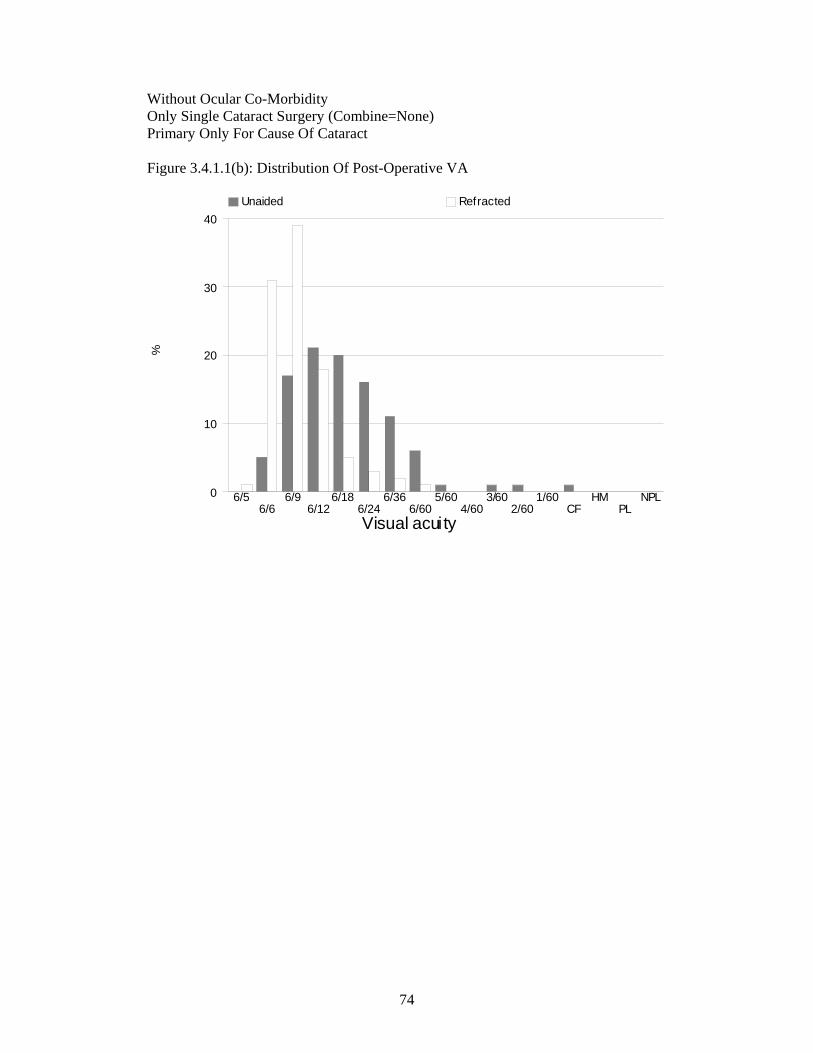
74
Without Ocular Co-Morbidity Only Single Cataract Surgery (Combine=None) Primary Only For Cause Of Cataract Figure 3.4.1.1(b): Distribution Of Post-Operative VA
%
Visual acuity
0
10
20
30
40 Unaided Refracted
6/56/6
6/96/12
6/186/24
6/366/60
5/604/60
3/602/60
1/60CF
HMPL
NPL
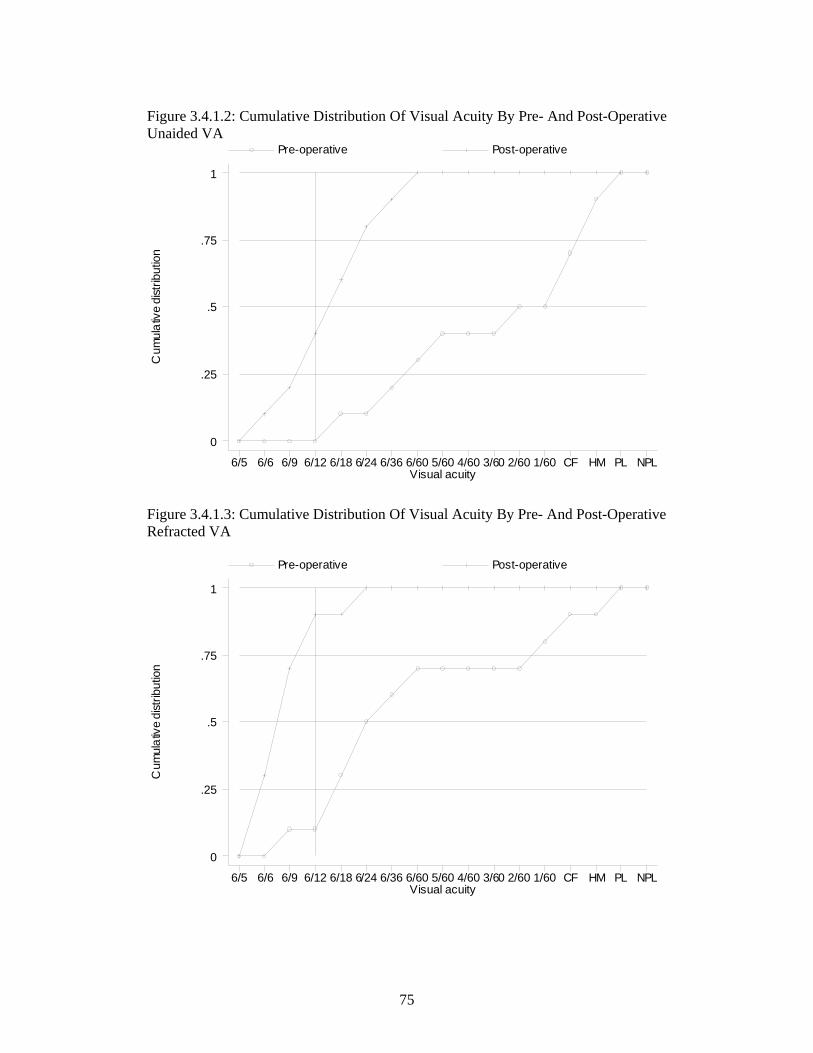
75
Figure 3.4.1.2: Cumulative Distribution Of Visual Acuity By Pre- And Post-Operative Unaided VA
Cum
ulat
ive
dist
ribut
ion
Visual acuity
Pre-operative Post-operative
6/5 6/6 6/9 6/12 6/18 6/24 6/36 6/60 5/60 4/60 3/60 2/60 1/60 CF HM PL NPL
0
.25
.5
.75
1
Figure 3.4.1.3: Cumulative Distribution Of Visual Acuity By Pre- And Post-Operative Refracted VA
Cum
ulat
ive
dist
ribut
ion
Visual acuity
Pre-operative Post-operative
6/5 6/6 6/9 6/12 6/18 6/24 6/36 6/60 5/60 4/60 3/60 2/60 1/60 CF HM PL NPL
0
.25
.5
.75
1

76
Table 3.4.2: Distribution Of Post-Operative Refracted VA 6/12 Or Better At The Last Follow Up Among Patients Without Ocular Co-Morbidities, By Surgery Type Of Surgery Unaided Refracted N VA 6/12 Or
Better N VA 6/12 Or Better
No. % No. % All Surgeries 9857 4181 42 8679 7693 89 Lens Aspiration 123 52 42 100 75 75 ECCE 4445 1507 34 3838 3245 85 PE 4928 2524 51 4410 4111 93 PE TO ECCE 311 88 28 289 236 82 ICCE 8 3 38 6 4 67 Secondary IOL Implant 42 7 17 36 22 61 Figure 3.4.2: Percent Of Patients With Refracted VA 6/12 Or Better At The Last Follow Up, By Surgery
% V
A 6
/12
or b
ette
r
Type of surgery0
50
100 Unaided Refracted
LA ECCE PE PE to ECCE ICCE 2 IOL Implant
* LA=Lens Aspiration * 2 IOL Implant=Secondary IOL Implant

77
Table 3.4.3: Distribution Of Post-Operative Refracted VA 6/12 Or Better In Relation To Age And Type Of Surgery, Among Patients Without Ocular Co-Morbidities
Factor Types Of Cataract Surgery All Surgeries Lens Aspiration ECCE PE PE TO ECCE ICCE Secondary IOL
Implant N No. % N No. % N No. % N No. % N No. % N No. % N No. % N 8677 7691 89 100 75 75 3838 3245 85 4408 4109 93 289 236 82 6 4 67 36 22 61 Age Group, Year
<1 1 0 0 1 0 0 0 0 0 0 0 0 0 0 0 0 0 0 0 0 0 1-14 53 34 64 48 33 69 3 0 0 1 1 100 0 0 0 0 0 0 1 0 0 15-24 27 22 81 23 18 78 3 3 100 0 0 0 1 1 100 0 0 0 0 0 0 25-34 40 38 95 7 7 100 12 10 83 17 17 100 1 1 100 0 0 0 3 3 100 35-44 222 208 94 9 8 89 82 77 94 123 116 94 5 5 100 1 1 100 2 1 50 45-54 963 898 93 4 3 75 389 353 91 532 509 96 35 31 89 1 1 100 2 1 50 55-64 2406 2214 92 4 3 75 1010 889 88 1304 1253 96 76 62 82 3 2 67 9 5 56 65-74 3529 3120 88 3 3 100 1578 1332 84 1815 1680 93 121 98 81 1 0 0 11 7 64 75-84 1311 1077 82 1 0 0 676 532 79 581 507 87 46 34 74 0 0 0 7 4 57 >=85 125 80 64 0 0 0 85 49 58 35 26 74 4 4 100 0 0 0 1 1 100

78
Table 3.4.4: Distribution Of Post-Operative Refracted VA 6/12 Or Better In Relation To Gender And Type Of Surgery, Among Patients Without Ocular Co-Morbidities
Factor Types Of Cataract Surgery All Surgeries Lens Aspiration ECCE PE PE TO ECCE ICCE Secondary IOL
Implant N No. % N No. % N No. % N No. % N No. % N No. % N No. % N 8679 7693 89 100 75 75 3838 3245 85 4410 4111 93 289 236 82 6 4 67 36 22 61 Gender Male 4217 3785 90 60 46 77 1763 1512 86 2228 2093 94 136 114 84 6 4 67 24 16 67 Female 4462 3908 88 40 29 73 2075 1733 84 2182 2018 92 153 122 80 0 0 0 12 6 50
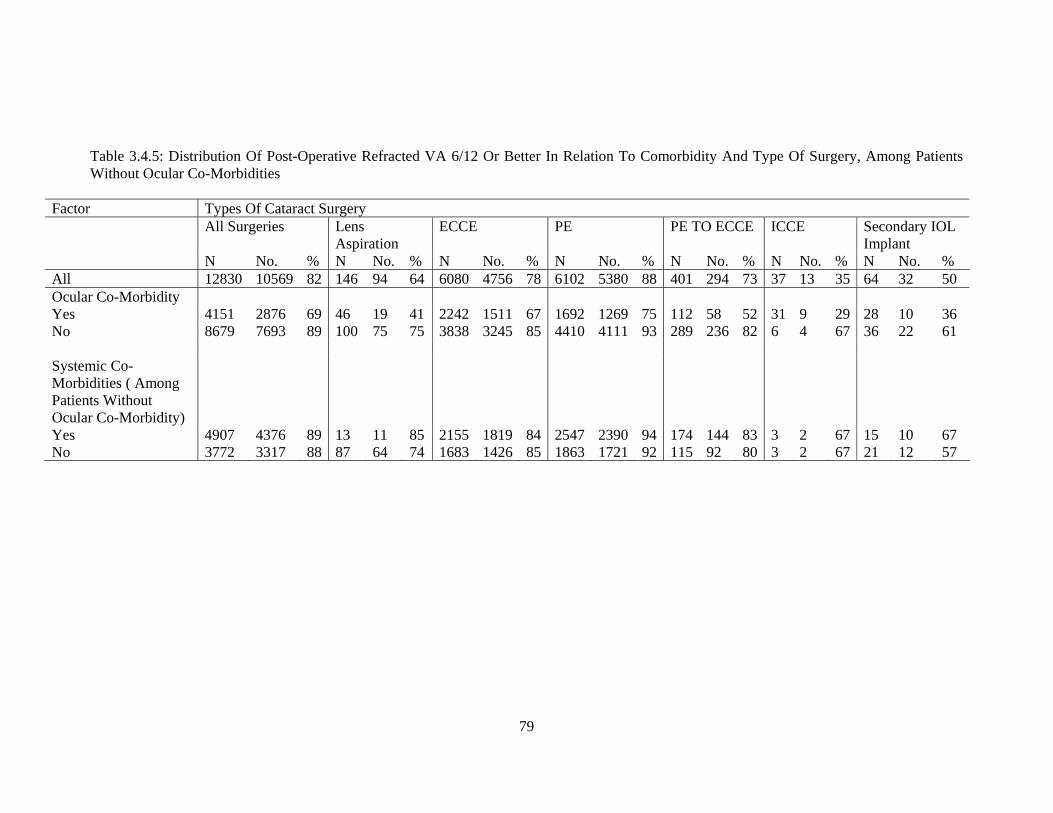
79
Table 3.4.5: Distribution Of Post-Operative Refracted VA 6/12 Or Better In Relation To Comorbidity And Type Of Surgery, Among Patients Without Ocular Co-Morbidities
Factor Types Of Cataract Surgery All Surgeries Lens
Aspiration ECCE PE PE TO ECCE ICCE Secondary IOL
Implant N No. % N No. % N No. % N No. % N No. % N No. % N No. % All 12830 10569 82 146 94 64 6080 4756 78 6102 5380 88 401 294 73 37 13 35 64 32 50 Ocular Co-Morbidity Yes 4151 2876 69 46 19 41 2242 1511 67 1692 1269 75 112 58 52 31 9 29 28 10 36 No 8679 7693 89 100 75 75 3838 3245 85 4410 4111 93 289 236 82 6 4 67 36 22 61 Systemic Co-Morbidities ( Among Patients Without Ocular Co-Morbidity)
Yes 4907 4376 89 13 11 85 2155 1819 84 2547 2390 94 174 144 83 3 2 67 15 10 67 No 3772 3317 88 87 64 74 1683 1426 85 1863 1721 92 115 92 80 3 2 67 21 12 57

80
Table 3.4.6: Distribution Of Post-Operative Refracted VA 6/12 Or Better In Relation To Complication And Type Of Surgery
Factor Types Of Cataract Surgery All Surgeries Lens Aspiration ECCE PE PE TO ECCE ICCE Secondary IOL
Implant N No. % N No. % N No. % N No. % N No. % N No. % N No. % N 8679 7693 89 100 75 75 3838 3245 85 4410 4111 93 289 236 82 6 4 67 36 22 61 Complication 1. Intra-Op Yes 812 630 78 10 3 30 320 239 75 352 293 83 123 92 75 2 2 100 5 1 20 No 7867 7063 90 90 72 80 3518 3006 85 4058 3818 94 166 144 87 4 2 50 31 21 68 2. Post-Op Yes 711 519 73 14 8 57 424 302 71 230 180 78 37 27 73 0 0 0 6 2 33 No 7968 7174 90 86 67 78 3414 2943 86 4180 3931 94 252 209 83 6 4 67 30 20 67
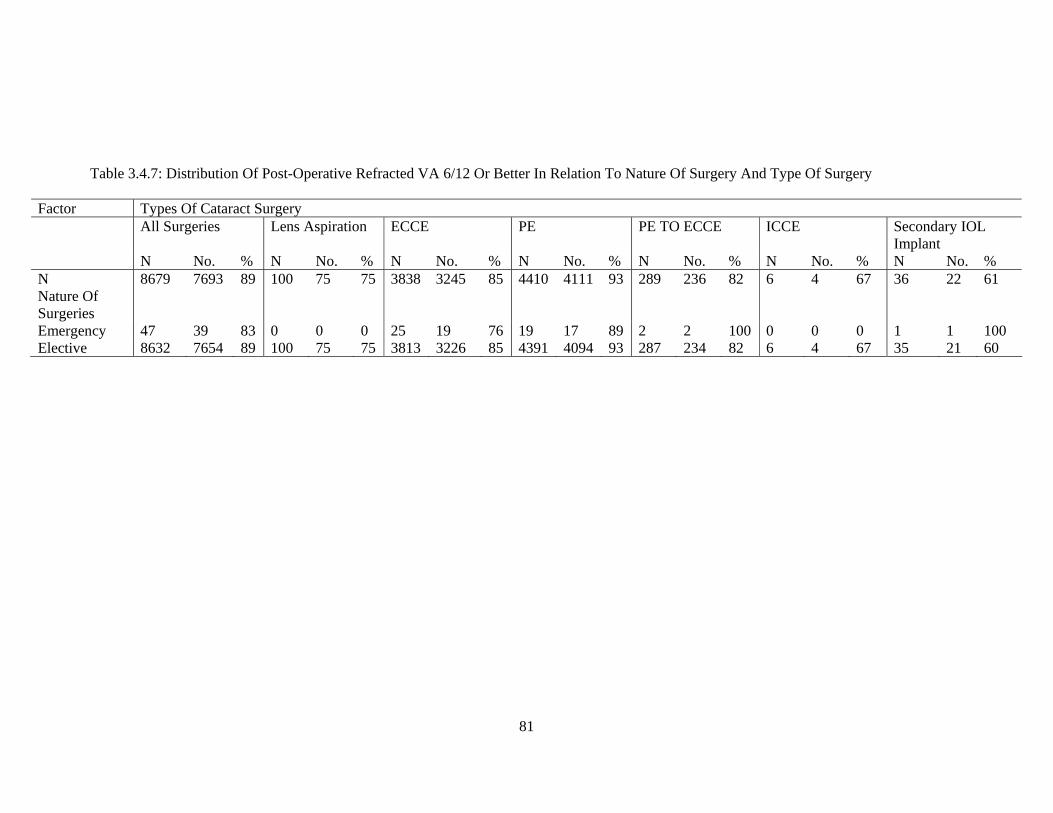
81
Table 3.4.7: Distribution Of Post-Operative Refracted VA 6/12 Or Better In Relation To Nature Of Surgery And Type Of Surgery
Factor Types Of Cataract Surgery All Surgeries Lens Aspiration ECCE PE PE TO ECCE ICCE Secondary IOL
Implant N No. % N No. % N No. % N No. % N No. % N No. % N No. % N 8679 7693 89 100 75 75 3838 3245 85 4410 4111 93 289 236 82 6 4 67 36 22 61 Nature Of Surgeries
Emergency 47 39 83 0 0 0 25 19 76 19 17 89 2 2 100 0 0 0 1 1 100 Elective 8632 7654 89 100 75 75 3813 3226 85 4391 4094 93 287 234 82 6 4 67 35 21 60

82
Table 3.4.8: Distribution Of Post-Operative Refracted VA 6/12 Or Better In Relation To Anaesthesia And Type Of Surgery Factor Types Of Cataract Surgery All Surgeries Lens
Aspiration ECCE PE PE TO ECCE ICCE Secondary IOL
Implant N No. % N No. % N No. % N No. % N No. % N No. % N No. % N 8679 7693 89 100 75 75 3838 3245 85 4410 4111 93 289 236 82 6 4 67 36 22 61 Anaesthesia 1. Anaesthesia General 320 258 81 78 58 74 121 97 80 111 96 86 2 2 100 0 0 0 8 5 63 Local 8359 7435 89 22 17 77 3717 3148 85 4299 4015 93 287 234 82 6 4 67 28 17 61 2. Local Anaesthesia
Retrobulbar 1345 1197 89 4 2 50 659 564 86 647 606 94 29 21 72 3 3 100 3 1 33 Peribulbar 1526 1335 87 3 3 100 845 719 85 619 573 93 54 39 72 0 0 0 5 1 20 Subtenon 4283 3792 89 15 12 80 2200 1855 84 1863 1752 94 184 159 86 4 2 50 17 12 71 Subconjunctival 35 32 91 0 0 0 9 7 78 24 23 96 2 2 100 0 0 0 0 0 0 Facialblock 352 311 88 2 0 0 231 200 87 105 100 95 12 10 83 1 1 100 1 0 0 Topical 1642 1488 91 0 0 0 181 145 80 1415 1310 93 38 29 76 0 0 0 8 4 50 Other 0 0 0 0 0 0 0 0 0 0 0 0 0 0 0 0 0 0 0 0 0 3. Sedation Any 1962 1715 87 10 7 70 1035 858 83 865 808 93 48 39 81 1 1 100 3 2 67 None 6717 5978 89 90 68 76 2803 2387 85 3545 3303 93 241 197 82 5 3 60 33 20 61
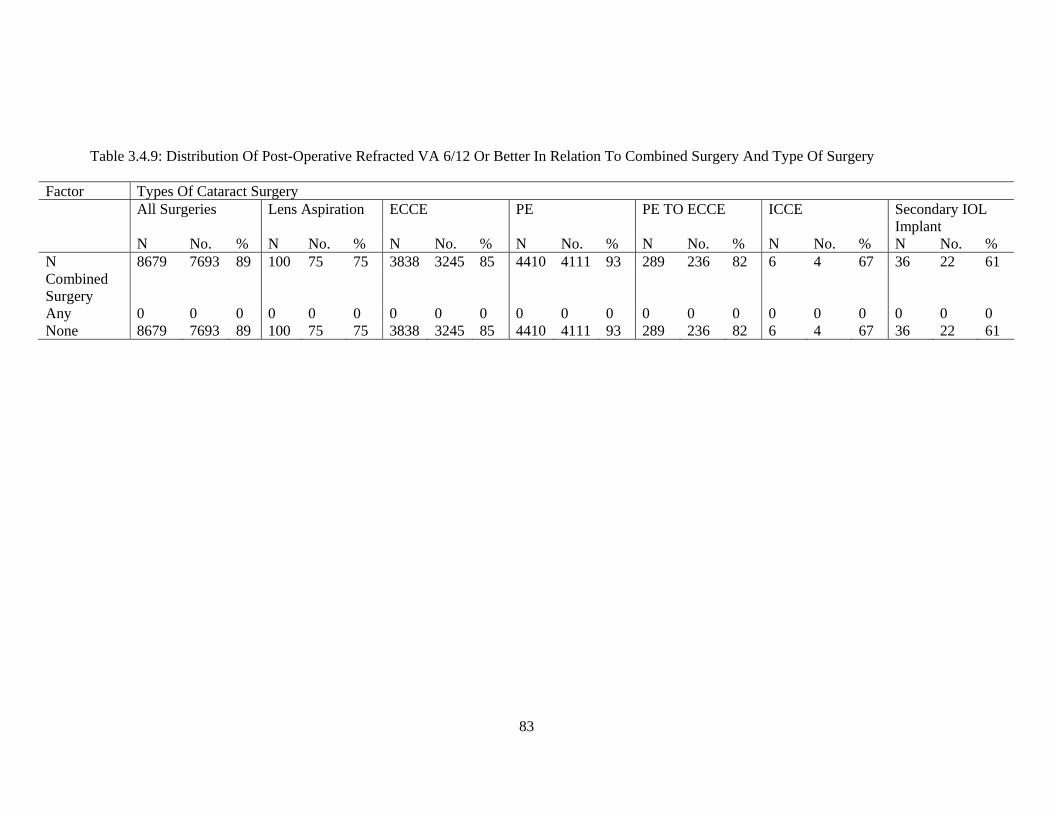
83
Table 3.4.9: Distribution Of Post-Operative Refracted VA 6/12 Or Better In Relation To Combined Surgery And Type Of Surgery
Factor Types Of Cataract Surgery All Surgeries Lens Aspiration ECCE PE PE TO ECCE ICCE Secondary IOL
Implant N No. % N No. % N No. % N No. % N No. % N No. % N No. % N 8679 7693 89 100 75 75 3838 3245 85 4410 4111 93 289 236 82 6 4 67 36 22 61 Combined Surgery
Any 0 0 0 0 0 0 0 0 0 0 0 0 0 0 0 0 0 0 0 0 0 None 8679 7693 89 100 75 75 3838 3245 85 4410 4111 93 289 236 82 6 4 67 36 22 61

84
Table 3.4.10: Distribution Of Post-Operative Refracted VA 6/12 Or Better In Relation To IOL And Type Of Surgery Factor Types Of Cataract Surgery All Surgeries Lens Aspiration ECCE PE PE TO ECCE ICCE Secondary IOL
Implant N No. % N No. % N No. % N No. % N No. % N No. % N No. % N 8679 7693 89 100 75 75 3838 3245 85 4410 4111 93 289 236 82 6 4 67 36 22 61 IOL 1. IOL With IOL 8627 7671 89 98 75 77 3812 3235 85 4395 4103 93 280 232 83 6 4 67 36 22 61 Without IOL
52 22 42 2 0 0 26 10 38 15 8 53 9 4 44 0 0 0 0 0 0
N 8627 7671 89 98 75 77 3812 3235 85 4395 4103 93 280 232 83 6 4 67 36 22 61 2. IOL-Type Foldable 3536 3315 94 43 30 70 110 101 92 3316 3122 94 65 60 92 0 0 0 2 2 100 Non-Foldable
5091 4356 86 55 45 82 3702 3134 85 1079 981 91 215 172 80 6 4 67 34 20 59
3.IOL-Material
Pmma 5090 4356 86 55 45 82 3701 3134 85 1079 981 91 215 172 80 6 4 67 34 20 59 Silicone 1149 1079 94 6 6 100 29 28 97 1104 1035 94 9 9 100 0 0 0 1 1 100 Acrylic 2387 2236 94 37 24 65 81 73 90 2212 2087 94 56 51 91 0 0 0 1 1 100 Other 1 0 0 0 0 0 1 0 0 0 0 0 0 0 0 0 0 0 0 0 0
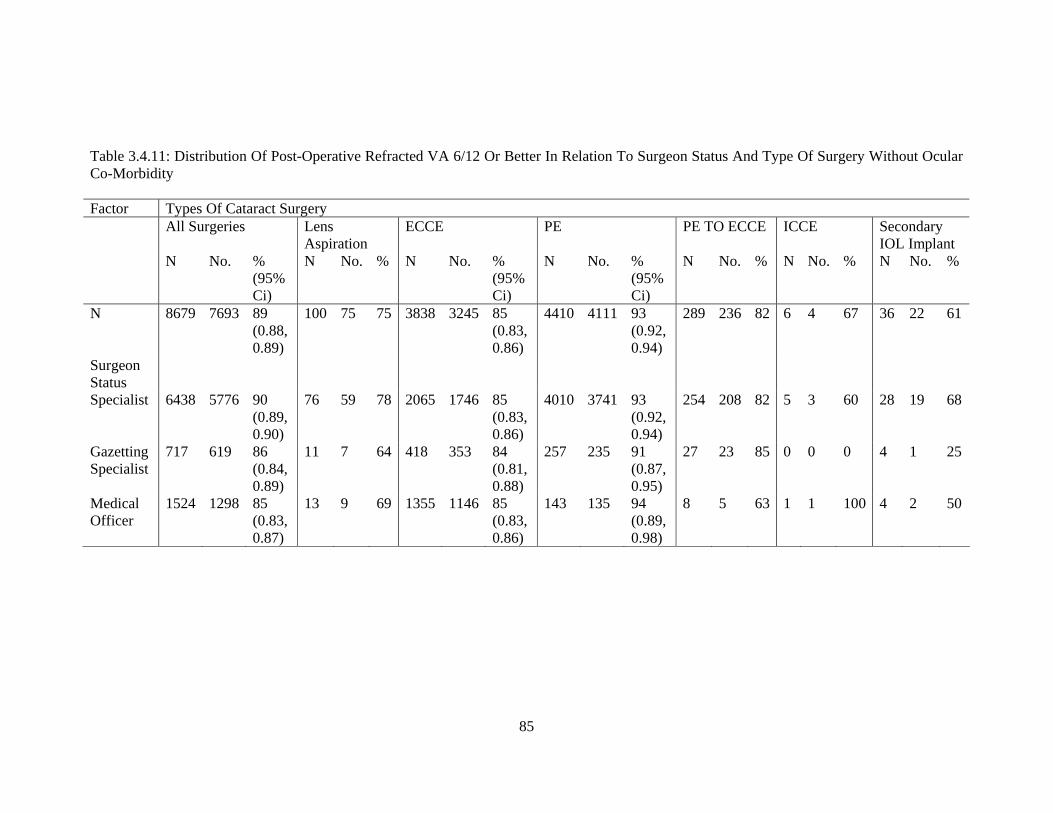
85
Table 3.4.11: Distribution Of Post-Operative Refracted VA 6/12 Or Better In Relation To Surgeon Status And Type Of Surgery Without Ocular Co-Morbidity Factor Types Of Cataract Surgery All Surgeries Lens
Aspiration ECCE PE PE TO ECCE ICCE Secondary
IOL Implant N No. %
(95% Ci)
N No. %
N No. % (95% Ci)
N No. % (95% Ci)
N No. % N No. % N No. %
N 8679 7693 89 (0.88, 0.89)
100 75 75 3838 3245 85 (0.83, 0.86)
4410 4111 93 (0.92, 0.94)
289 236 82 6 4 67 36 22 61
Surgeon Status
Specialist 6438 5776 90 (0.89, 0.90)
76 59 78 2065 1746 85 (0.83, 0.86)
4010 3741 93 (0.92, 0.94)
254 208 82 5 3 60 28 19 68
Gazetting Specialist
717 619 86 (0.84, 0.89)
11 7 64 418 353 84 (0.81, 0.88)
257 235 91 (0.87, 0.95)
27 23 85 0 0 0 4 1 25
Medical Officer
1524 1298 85 (0.83, 0.87)
13 9 69 1355 1146 85 (0.83, 0.86)
143 135 94 (0.89, 0.98)
8 5 63 1 1 100 4 2 50
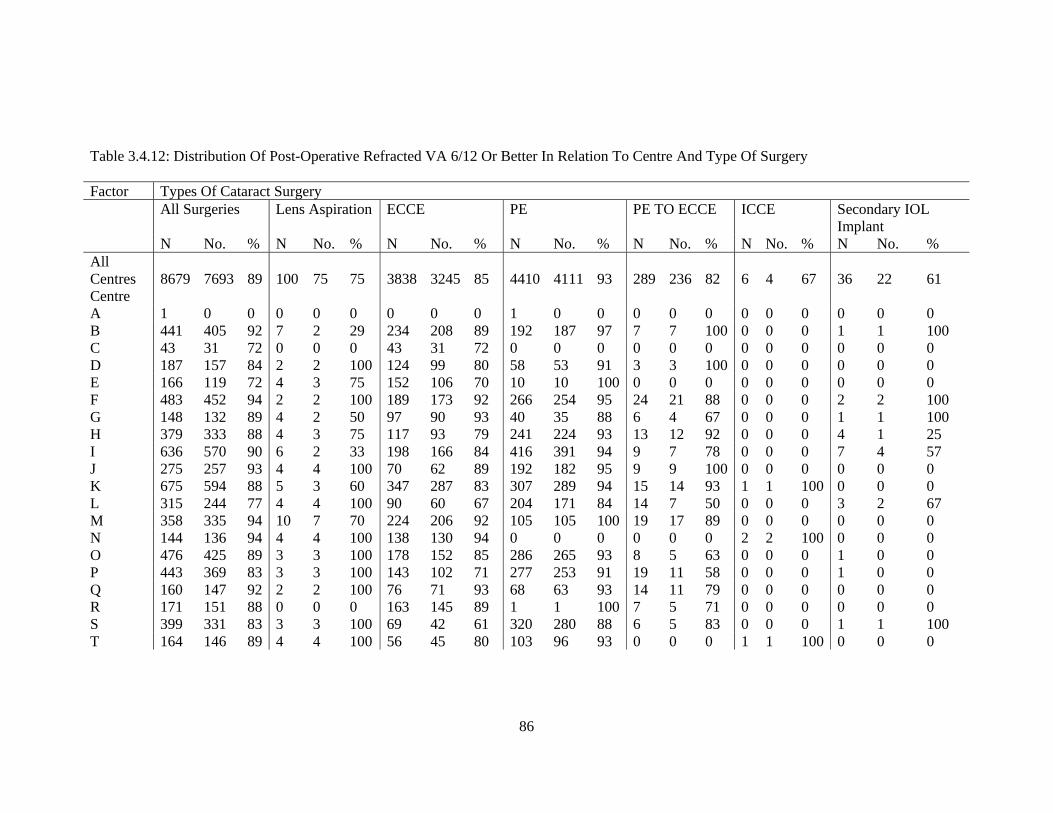
86
Table 3.4.12: Distribution Of Post-Operative Refracted VA 6/12 Or Better In Relation To Centre And Type Of Surgery Factor Types Of Cataract Surgery All Surgeries Lens Aspiration ECCE PE PE TO ECCE ICCE Secondary IOL
Implant N No. % N No. % N No. % N No. % N No. % N No. % N No. % All Centres 8679 7693 89 100 75 75 3838 3245 85 4410 4111 93 289 236 82 6 4 67 36 22 61 Centre A 1 0 0 0 0 0 0 0 0 1 0 0 0 0 0 0 0 0 0 0 0 B 441 405 92 7 2 29 234 208 89 192 187 97 7 7 100 0 0 0 1 1 100 C 43 31 72 0 0 0 43 31 72 0 0 0 0 0 0 0 0 0 0 0 0 D 187 157 84 2 2 100 124 99 80 58 53 91 3 3 100 0 0 0 0 0 0 E 166 119 72 4 3 75 152 106 70 10 10 100 0 0 0 0 0 0 0 0 0 F 483 452 94 2 2 100 189 173 92 266 254 95 24 21 88 0 0 0 2 2 100 G 148 132 89 4 2 50 97 90 93 40 35 88 6 4 67 0 0 0 1 1 100 H 379 333 88 4 3 75 117 93 79 241 224 93 13 12 92 0 0 0 4 1 25 I 636 570 90 6 2 33 198 166 84 416 391 94 9 7 78 0 0 0 7 4 57 J 275 257 93 4 4 100 70 62 89 192 182 95 9 9 100 0 0 0 0 0 0 K 675 594 88 5 3 60 347 287 83 307 289 94 15 14 93 1 1 100 0 0 0 L 315 244 77 4 4 100 90 60 67 204 171 84 14 7 50 0 0 0 3 2 67 M 358 335 94 10 7 70 224 206 92 105 105 100 19 17 89 0 0 0 0 0 0 N 144 136 94 4 4 100 138 130 94 0 0 0 0 0 0 2 2 100 0 0 0 O 476 425 89 3 3 100 178 152 85 286 265 93 8 5 63 0 0 0 1 0 0 P 443 369 83 3 3 100 143 102 71 277 253 91 19 11 58 0 0 0 1 0 0 Q 160 147 92 2 2 100 76 71 93 68 63 93 14 11 79 0 0 0 0 0 0 R 171 151 88 0 0 0 163 145 89 1 1 100 7 5 71 0 0 0 0 0 0 S 399 331 83 3 3 100 69 42 61 320 280 88 6 5 83 0 0 0 1 1 100 T 164 146 89 4 4 100 56 45 80 103 96 93 0 0 0 1 1 100 0 0 0
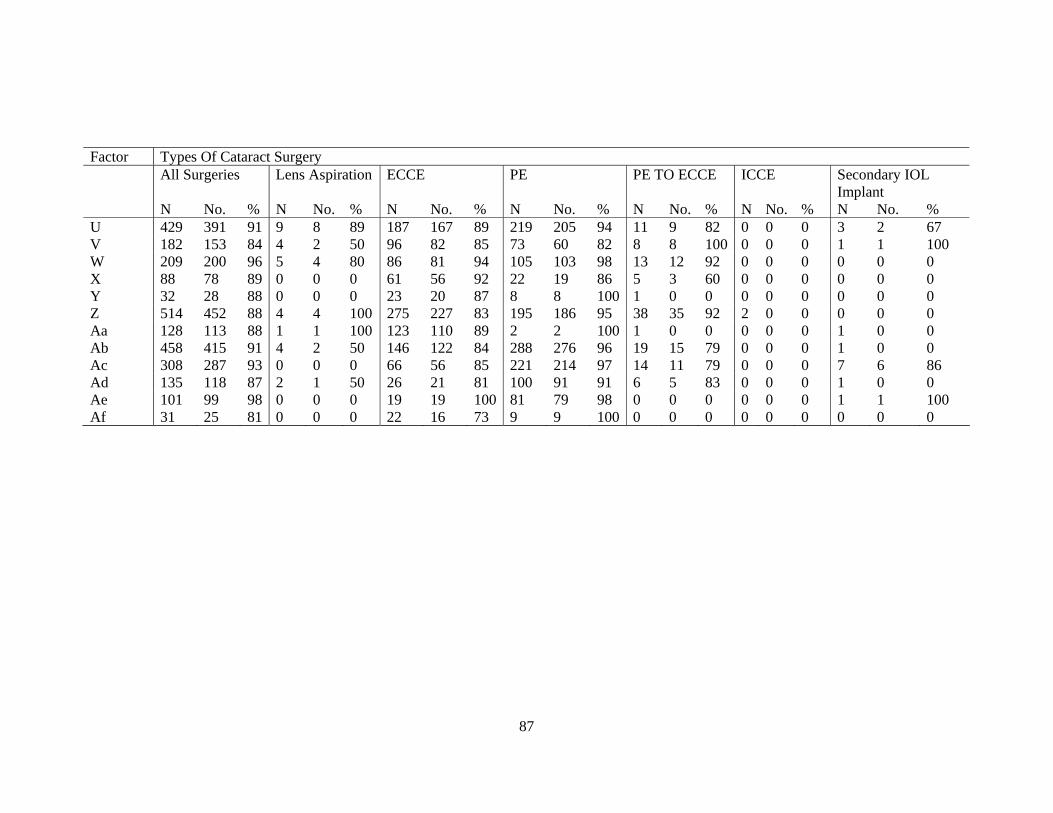
87
Factor Types Of Cataract Surgery All Surgeries Lens Aspiration ECCE PE PE TO ECCE ICCE Secondary IOL
Implant N No. % N No. % N No. % N No. % N No. % N No. % N No. % U 429 391 91 9 8 89 187 167 89 219 205 94 11 9 82 0 0 0 3 2 67 V 182 153 84 4 2 50 96 82 85 73 60 82 8 8 100 0 0 0 1 1 100 W 209 200 96 5 4 80 86 81 94 105 103 98 13 12 92 0 0 0 0 0 0 X 88 78 89 0 0 0 61 56 92 22 19 86 5 3 60 0 0 0 0 0 0 Y 32 28 88 0 0 0 23 20 87 8 8 100 1 0 0 0 0 0 0 0 0 Z 514 452 88 4 4 100 275 227 83 195 186 95 38 35 92 2 0 0 0 0 0 Aa 128 113 88 1 1 100 123 110 89 2 2 100 1 0 0 0 0 0 1 0 0 Ab 458 415 91 4 2 50 146 122 84 288 276 96 19 15 79 0 0 0 1 0 0 Ac 308 287 93 0 0 0 66 56 85 221 214 97 14 11 79 0 0 0 7 6 86 Ad 135 118 87 2 1 50 26 21 81 100 91 91 6 5 83 0 0 0 1 0 0 Ae 101 99 98 0 0 0 19 19 100 81 79 98 0 0 0 0 0 0 1 1 100 Af 31 25 81 0 0 0 22 16 73 9 9 100 0 0 0 0 0 0 0 0 0

88
3.5 Post-Operative Refracted VA Improved By One Or More Line Of Snellen Chart Table 3.5.1: Distribution Of Post-Operative Refracted VA Improved By One Or More Line Of Snellen Chart, At The Last Follow Up Type Of Surgery
Refracted Visual Acuity
N No Change Worse Improved No. % No. % No. % All Surgeries 1105 49 4 28 3 1028 93 Lens Aspiration
13 0 0 0 0 13 100
ECCE 320 17 5 7 2 296 93 PE 719 30 4 16 2 673 94 PE To ECCE 46 0 0 3 7 43 93 ICCE 0 0 0 0 0 0 0 Secondary IOL Implant
7 2 29 2 29 3 43
Table 3.5.2: Distribution Of Post- Operative Refracted VA Improved By One Or More Line Of Snellen Chart, With And Without Ocular Co-Morbidity At The Last Follow Up
Ocular Co-Morbidity
Refracted VA
Type Of Surgery
All Surgeries
Lens Aspiration
ECCE PE PE TO ECCE
ICCE Secondary IOL Implant
Yes N 616 8 269 306 23 1 9 No
Change No. 46 0 13 27 3 0 3
% 7 0 5 9 13 0 33 Worse No. 38 0 8 24 4 0 2 % 6 0 3 8 17 0 22 Improved No. 532 8 248 255 16 1 4 % 86 100 92 83 70 100 44 No. N 1105 13 320 719 46 0 7 No
Change No. 49 0 17 30 0 0 2
% 4 0 5 4 0 0 29 Worse No. 28 0 7 16 3 0 2 % 3 0 2 2 7 0 29 Improved No. 1028 13 296 673 43 0 3 % 93 100 93 94 93 0 43

89
Table 3.5.3: Distribution Of Post- Operative Refracted VA Improved By One Or More Line Of Snellen Chart With Intra-Op Complication And Without Intra-Op Complication, At The Last Follow Up
Intra-Op Complication
Refracted VA
Type Of Surgery
All Surgeries
Lens Aspiration
ECCE PE PE To ECCE
ICCE Secondary IOL Implant
Yes N 124 1 23 78 21 0 1 No
Change No. 10 0 4 5 0 0 1
% 8 0 17 6 0 0 100 Worse No. 10 0 4 5 1 0 0 % 8 0 17 6 5 0 0 Improved No. 104 1 15 68 20 0 0 % 84 100 65 87 95 0 0 No. N 981 12 297 641 25 0 6 No
Change No. 39 0 13 25 0 0 1
% 4 0 4 4 0 0 17 Worse No. 18 0 3 11 2 0 2 % 2 0 1 2 8 0 33 Improved No. 924 12 281 605 23 0 3 % 94 100 95 94 92 0 50
Table 3.5.4: Distribution Of Post -Operative Refracted VA Improved By One Or More Line Of Snellen Chart With Systemic Co-Morbidity And Without Systemic Co-Morbidity, At The Last Follow Up
Systemic Co-Morbidity
Refracted VA
Type Of Surgery
All Surgeries
Lens Aspiration
ECCE PE PE TO ECCE
ICCE Secondary IOL Implant
Yes N 677 3 207 436 28 0 3 No
Change No. 28 0 9 19 0 0 0
% 4 0 4 4 0 0 0 Worse No. 19 0 6 10 2 0 1 % 3 0 3 2 7 0 33 Improved No. 630 3 192 407 26 0 2 % 93 100 93 93 93 0 67 No. N 428 10 113 283 18 0 4 No
Change No. 21 0 8 11 0 0 2
% 5 0 7 4 0 0 50 Worse No. 9 0 1 6 1 0 1 % 2 0 1 2 6 0 25 Improved No. 398 10 104 266 17 0 1 % 93 100 92 94 94 0 25

90
Table 3.5.5: Distribution Of Post -Operative Refracted VA Improved By One Or More Line Of Snellen Chart At The Last Follow Up In Relation To Surgeon Status And Type Of Surgery Without Ocular Comorbidity Type Of Surgery Surgeon Status N No Change Worse Improved No. % (95% Ci) No. % (95% Ci) No. % (95% Ci) All Surgeries Specialist 891 37 4 (2.94, 5.68 ) 20 2 (1.38, 3.45) 834 94 (91.79, 95.12) Gazetting Specialist 103 8 8 (3.41, 14.73) 6 6 (2.17, 12.25) 89 86 (78.25, 92.37) Medical Officer 111 4 4 (0.99, 8.97) 2 2 (0.22, 6.36) 105 95 (88.61, 97.99) Lens Aspiration Specialist 10 0 0 0 0 10 100 Gazetting Specialist 3 0 0 0 0 3 100 Medical Officer 0 0 0 0 ECCE Specialist 216 14 6 (3.59, 10.64) 5 2 (0.76, 5.32) 197 91 (86.60, 94.62) Gazetting Specialist 23 0 0 (0.00, 14.82)* 1 4 (0.11, 21.95) 22 96 (78.05, 99.89) Medical Officer 81 3 4 (0.77, 10.44) 1 1 (0.03, 6.69) 77 95 (87.84, 98.64) PE Specialist 624 22 4 (2.22, 5.29) 11 2 (0.88, 3.13) 591 95 (92.65, 96.33) Gazetting Specialist 67 7 10 (4.30, 20.35) 5 7 (2.47, 16.56) 55 82 (70.80, 90.39) Medical Officer 28 1 4 (0.09, 18.35) 0 0 (0.00, 12.34)* 27 96 (81.65, 99.91) PE To ECCE Specialist 36 0 0 3 8 33 92 Gazetting Specialist 9 0 0 0 0 9 100 Medical Officer 1 0 0 0 0 1 100 ICCE Specialist 0 0 0 0 Gazetting Specialist 0 0 0 0 Medical Officer 0 0 0 0 Secondary IOL Implant Specialist 5 1 20 1 20 3 60 Gazetting Specialist 1 1 100 0 0 0 0 Medical Officer 1 0 0 1 100 0 0 *One-Sided, 97.5% Confidence Interval

91
3.6 Factors Contributing To Post-Operative Refracted Visual Acuity Of Worse Than 6/12 Table 3.6.1: Distribution Of Factors Contributing To Post- Operative Refracted Of Worse Than 6/12 Factor No. % N 986 100 Patients With Any Factor 888 90 Patients With Specific Factor 1.High Astigmatism 392 40 2.Posterior Capsular Opacity 152 15 3.Cystoid Macular Edema 59 6 4.Endophthalmitis 10 1 5.Corneal Decompensation 19 2 6.Decentered IOL 1 0.1 7.Retinal Detachment 8 1 8.Preexisting Ocular Co-Morbidity 94 10 9.Other 202 20

92
Appendix I (Clinical Record Forms)