The Scottsdale/Paradise Valley Tourism Study — …Reports/... · The Scottsdale/Paradise Valley...
29
February 2007 City of Scottsdale Economic Vitality Department The Scottsdale/Paradise Valley Tourism Study — Lodging Statistics August 2015 Tourism and Events Department
Transcript of The Scottsdale/Paradise Valley Tourism Study — …Reports/... · The Scottsdale/Paradise Valley...
February 2007 City of Scottsdale
Economic Vitality Department
The Scottsdale/Paradise Valley Tourism Study — Lodging Statistics
August 2015
Tourism and Events Department
2015 Lodging Statistics Report - City of Scottsdale 2
An annual publication of:
The City of Scottsdale Tourism and Events Department
7506 E. Indian School Rd. Scottsdale, AZ 85251
Phone: (480) 312-7177 www.scottsdaleaz.gov/tourism [email protected]
Last updated: August 24, 2015
Lodging Statistics
August 2015
Scottsdale City Council
David Smith
Suzanne Klapp
Linda Milhaven
Kathy Littlefield
Virginia Korte
Guy Phillips
Brian Biesemeyer Acting City Manager
W.J. “Jim” Lane Mayor
2015 Lodging Statistics Report - City of Scottsdale 3
Table of Contents
I Study Overview 5
II. Study: Introduction & Limitations 6
III. Executive Summary 7
IV. The Scottsdale/Paradise Valley Market Area 8
V. Trends in Tax Collection 12
VI. Trends in Room Inventory 15
VII. Average Room Rates and Occupancy 20
VIII. Room Revenues vs. Total Hotel Revenues 22
IX. Market Area Golf, Spas, and Destination Events 24
2015 Lodging Statistics Report - City of Scottsdale 4
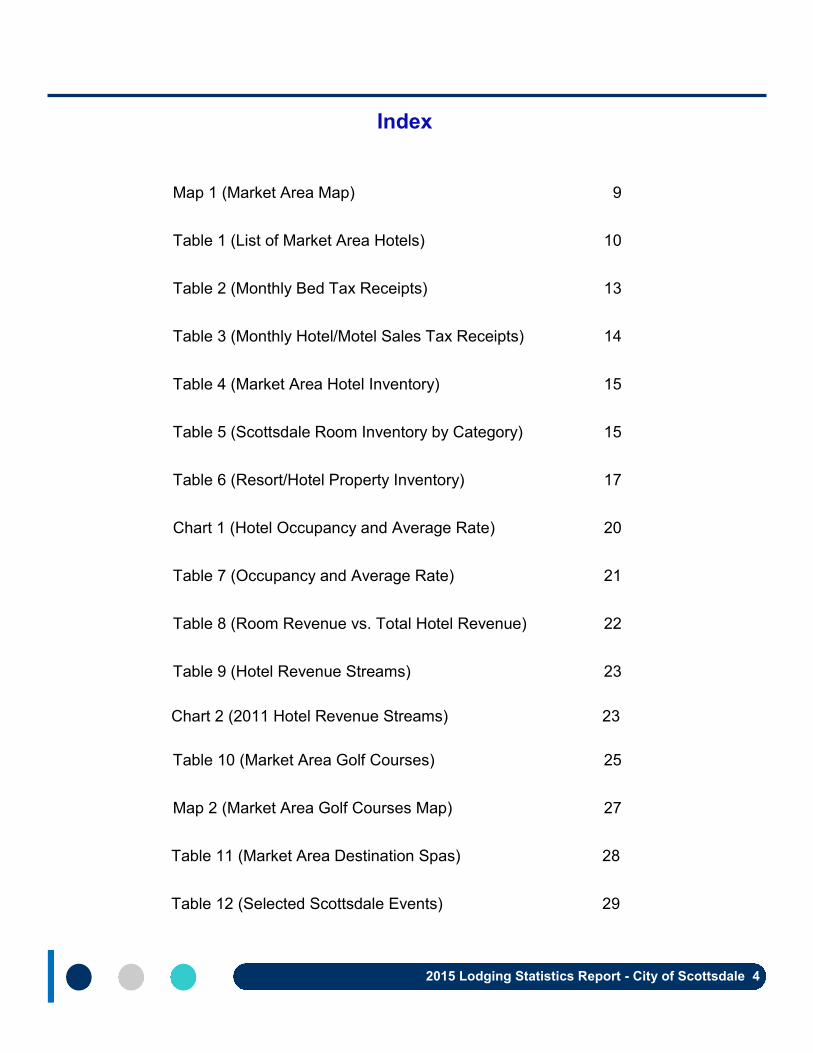
Index
Map 1 (Market Area Map) 9
Table 1 (List of Market Area Hotels) 10
Table 2 (Monthly Bed Tax Receipts) 13
Table 3 (Monthly Hotel/Motel Sales Tax Receipts) 14
Table 4 (Market Area Hotel Inventory) 15
Table 5 (Scottsdale Room Inventory by Category) 15
Table 6 (Resort/Hotel Property Inventory) 17
Chart 1 (Hotel Occupancy and Average Rate) 20
Table 7 (Occupancy and Average Rate) 21
Table 8 (Room Revenue vs. Total Hotel Revenue) 22
Table 9 (Hotel Revenue Streams) 23
Table 10 (Market Area Golf Courses) 25
Map 2 (Market Area Golf Courses Map) 27
Table 11 (Market Area Destination Spas) 28
Table 12 (Selected Scottsdale Events) 29
Chart 2 (2011 Hotel Revenue Streams) 23
2015 Lodging Statistics Report - City of Scottsdale 5
I. STUDY OVERVIEW
Part I: Lodging Statistics
Part I of The Scottsdale/Paradise Valley Tourism Study analyzes trends relating to the lodging industry in the Scottsdale/Paradise Valley tourist market area. The study looks specifically at trends in local transient occupancy tax (bed tax) collection, room inventory, average room rates, occupancy rates, and other factors relating to lodging trends. The Lodging Statistics study is designed to provide necessary data relating to the lodging industry for developers, local hoteliers, tourism marketing representatives, financing agencies, and others with an interest in hospitality industry trends. The Scottsdale/Paradise Valley Tourism Study, Part I: Lodging Statistics report is prepared annually and is available at no charge from the City of Scottsdale Tourism and Events Department, or http://www.scottsdaleaz.gov/tourism. The Tourism and Events Department welcomes your input and suggestions for changes and additions in future issues of this publication, and is pleased to grant permission to use excerpts from this material when credit is given to the City of Scottsdale. While information in this report is deemed accurate, no guarantees are made or implied. Users should rely on their own research and conclusions regarding the conditions and viability of the Scottsdale lodging market.
Part II: Visitor Statistics
Part II of the Tourism Study deals with trends relating to tourists themselves. It examines the total number of tourists, their spending patterns and socio-demographic profiles, and the overall economic impact of the tourism industry in the study area. The Visitor Statistics study is designed to provide data that gives a profile of the type of tourist that comes to the area, and to evaluate the economic impact tourism has on the community. The Scottsdale/Paradise Valley Tourism Study, Part II: Visitor Statistics report is prepared once a year, and is available at no charge from the City of Scottsdale Tourism and Events Department, or http://www.scottsdaleaz.gov/tourism.
2015 Lodging Statistics Report - City of Scottsdale 6
II. THE SCOTTSDALE/PARADISE VALLEY TOURISM STUDY: INTRODUCTION & LIMITATIONS
Introduction
The economy of the Scottsdale/ Paradise Valley area is integrally linked to the tourism industry. Yet, until the early 1990’s, limited information existed on the impact of tourism on our economy. The lack of information made it difficult to predict the impacts of new developments, track changes in the market, or to understand the best way to promote the market. The primary purpose of The Scottsdale/Paradise Valley Tourism Study: Parts I and II is to provide market information for the tourism, retail, and hospitality operations within the study area. The reports provide information to elected officials, city management, the general public, and private-sector entities regarding the tourism and hospitality markets.
Study Limitations
Much of the information contained in the Lodging Statistics study is based on tax collection figures, and will therefore have certain limitations. Bed tax collection figures are used because they are consistently tracked and readily available, but it is important to remember these three points:
The economy of the Scottsdale/Paradise Valley area is integrally
linked to the tourism industry.
The tax receipt figures shown for each month reflects actual sales tax and bed tax collections during the previous month. There is a lag of one month between sales activity and receipts.
With the exception of room stock data, no information is available for properties that lie just outside the corporate limits of the City of Scottsdale and the Town of Paradise Valley. It may be reasonable to assume the data for these properties would be very similar to similar properties in the market area, but no projections are made as part of this report.
The data in this report (with the exception of room stock figures) is based primarily on properties located within the City of Scottsdale.
2015 Lodging Statistics Report - City of Scottsdale 7
III. EXECUTIVE SUMMARY
Annual occupancy for the Scottsdale/Paradise Valley market area in 2014 was 67 percent, up from 64.9 percent in 2013.
The Scottsdale/ Paradise Valley market area has grown by nearly 1,630 rooms since 2005.
Scottsdale’s bed tax revenues totaled $15,747,851 in 2014, up 6.94 percent from 2013.
The average room rate for Scottsdale/Paradise Valley market area hotels in 2014 was $169.09, an increase from the 2013 average of $158.07 per room.
In the past 10 years, the bed tax has generated over $109 million in revenue for the City of Scottsdale.
The percentage of room revenue to total hotel revenues for the City of Scottsdale in 2014 was 61.1 percent.
Hotel/motel sales tax revenues for the City of Scottsdale in 2014 rose 6.9 percent from 2013 with $8,351,254 in collections.
2015 Lodging Statistics Report - City of Scottsdale 8
IV. THE SCOTTSDALE/PARADISE VALLEY MARKET AREA
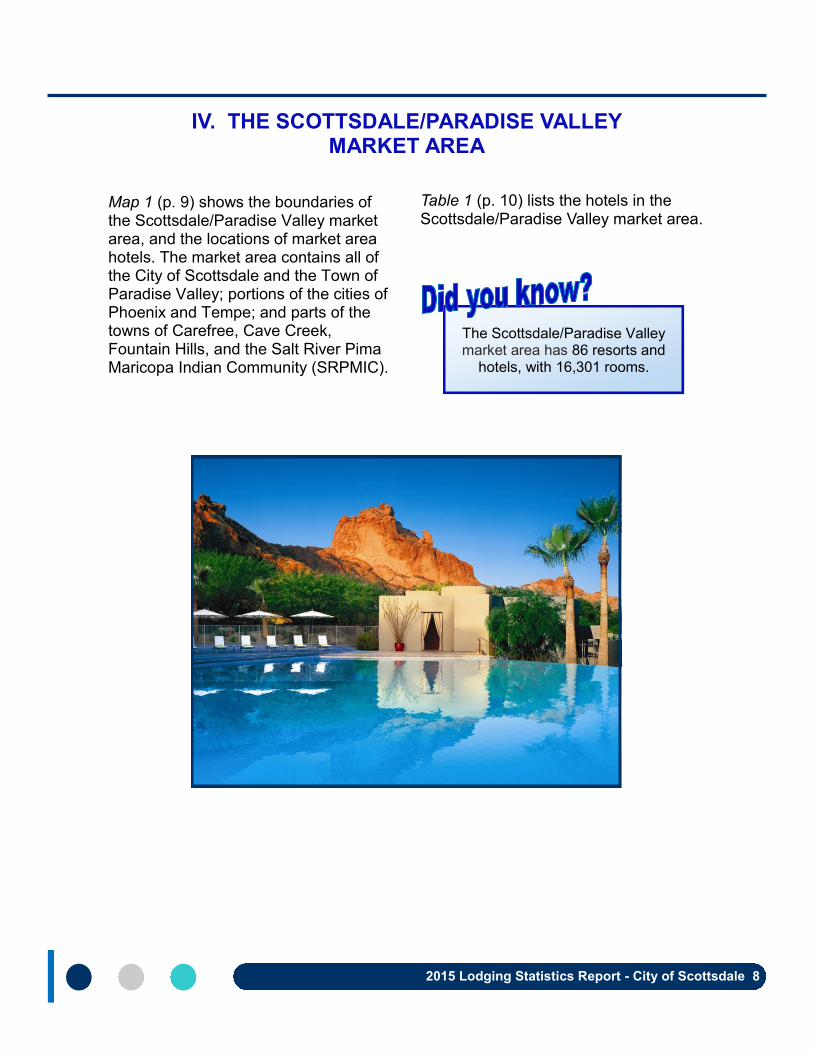
Map 1 (p. 9) shows the boundaries of the Scottsdale/Paradise Valley market area, and the locations of market area hotels. The market area contains all of the City of Scottsdale and the Town of Paradise Valley; portions of the cities of Phoenix and Tempe; and parts of the towns of Carefree, Cave Creek, Fountain Hills, and the Salt River Pima Maricopa Indian Community (SRPMIC).
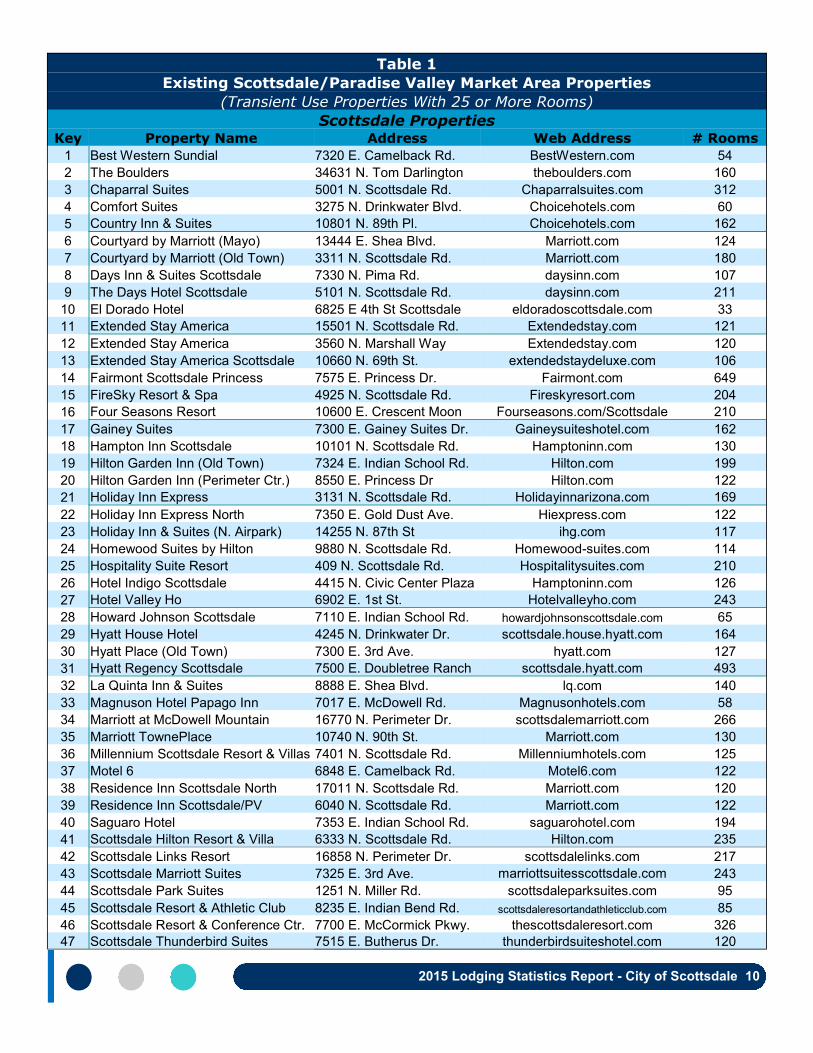
Table 1 (p. 10) lists the hotels in the Scottsdale/Paradise Valley market area.
The Scottsdale/Paradise Valley market area has 86 resorts and
hotels, with 16,301 rooms.

2015 Lodging Statistics Report - City of Scottsdale 9
2015 Lodging Statistics Report - City of Scottsdale 10
Table 1
Existing Scottsdale/Paradise Valley Market Area Properties
(Transient Use Properties With 25 or More Rooms)
Scottsdale Properties Key Property Name Address Web Address # Rooms
1 Best Western Sundial 7320 E. Camelback Rd. BestWestern.com 54
2 The Boulders 34631 N. Tom Darlington theboulders.com 160
3 Chaparral Suites 5001 N. Scottsdale Rd. Chaparralsuites.com 312
4 Comfort Suites 3275 N. Drinkwater Blvd. Choicehotels.com 60
5 Country Inn & Suites 10801 N. 89th Pl. Choicehotels.com 162
6 Courtyard by Marriott (Mayo) 13444 E. Shea Blvd. Marriott.com 124
7 Courtyard by Marriott (Old Town) 3311 N. Scottsdale Rd. Marriott.com 180
8 Days Inn & Suites Scottsdale 7330 N. Pima Rd. daysinn.com 107
9 The Days Hotel Scottsdale 5101 N. Scottsdale Rd. daysinn.com 211
10 El Dorado Hotel 6825 E 4th St Scottsdale eldoradoscottsdale.com 33
11 Extended Stay America 15501 N. Scottsdale Rd. Extendedstay.com 121
12 Extended Stay America 3560 N. Marshall Way Extendedstay.com 120
13 Extended Stay America Scottsdale 10660 N. 69th St. extendedstaydeluxe.com 106
14 Fairmont Scottsdale Princess 7575 E. Princess Dr. Fairmont.com 649
15 FireSky Resort & Spa 4925 N. Scottsdale Rd. Fireskyresort.com 204
16 Four Seasons Resort 10600 E. Crescent Moon Fourseasons.com/Scottsdale 210
17 Gainey Suites 7300 E. Gainey Suites Dr. Gaineysuiteshotel.com 162
18 Hampton Inn Scottsdale 10101 N. Scottsdale Rd. Hamptoninn.com 130
19 Hilton Garden Inn (Old Town) 7324 E. Indian School Rd. Hilton.com 199
20 Hilton Garden Inn (Perimeter Ctr.) 8550 E. Princess Dr Hilton.com 122
21 Holiday Inn Express 3131 N. Scottsdale Rd. Holidayinnarizona.com 169
22 Holiday Inn Express North 7350 E. Gold Dust Ave. Hiexpress.com 122
23 Holiday Inn & Suites (N. Airpark) 14255 N. 87th St ihg.com 117
24 Homewood Suites by Hilton 9880 N. Scottsdale Rd. Homewood-suites.com 114
25 Hospitality Suite Resort 409 N. Scottsdale Rd. Hospitalitysuites.com 210
26 Hotel Indigo Scottsdale 4415 N. Civic Center Plaza Hamptoninn.com 126
27 Hotel Valley Ho 6902 E. 1st St. Hotelvalleyho.com 243
28 Howard Johnson Scottsdale 7110 E. Indian School Rd. howardjohnsonscottsdale.com 65
29 Hyatt House Hotel 4245 N. Drinkwater Dr. scottsdale.house.hyatt.com 164
30 Hyatt Place (Old Town) 7300 E. 3rd Ave. hyatt.com 127
31 Hyatt Regency Scottsdale 7500 E. Doubletree Ranch scottsdale.hyatt.com 493
32 La Quinta Inn & Suites 8888 E. Shea Blvd. lq.com 140
33 Magnuson Hotel Papago Inn 7017 E. McDowell Rd. Magnusonhotels.com 58
34 Marriott at McDowell Mountain 16770 N. Perimeter Dr. scottsdalemarriott.com 266
35 Marriott TownePlace 10740 N. 90th St. Marriott.com 130
36 Millennium Scottsdale Resort & Villas 7401 N. Scottsdale Rd. Millenniumhotels.com 125
37 Motel 6 6848 E. Camelback Rd. Motel6.com 122
38 Residence Inn Scottsdale North 17011 N. Scottsdale Rd. Marriott.com 120
39 Residence Inn Scottsdale/PV 6040 N. Scottsdale Rd. Marriott.com 122
40 Saguaro Hotel 7353 E. Indian School Rd. saguarohotel.com 194
41 Scottsdale Hilton Resort & Villa 6333 N. Scottsdale Rd. Hilton.com 235
42 Scottsdale Links Resort 16858 N. Perimeter Dr. scottsdalelinks.com 217
43 Scottsdale Marriott Suites 7325 E. 3rd Ave. marriottsuitesscottsdale.com 243
44 Scottsdale Park Suites 1251 N. Miller Rd. scottsdaleparksuites.com 95
45 Scottsdale Resort & Athletic Club 8235 E. Indian Bend Rd. scottsdaleresortandathleticclub.com 85
46 Scottsdale Resort & Conference Ctr. 7700 E. McCormick Pkwy. thescottsdaleresort.com 326
47 Scottsdale Thunderbird Suites 7515 E. Butherus Dr. thunderbirdsuiteshotel.com 120

2015 Lodging Statistics Report - City of Scottsdale 11
Table 1 (Continued)
Existing Scottsdale/Paradise Valley Market Area Properties
Scottsdale Properties (Continued) Key Property Name Address Web Address # Rooms
48 Scottsdale Villa Mirage 7887 E. Princess Blvd. Villa-mirage.com 264
49 Sheraton's Desert Oasis 17700 N Hayden Rd. starwoodhotels.com/Sheraton 300
50 Three Palms Hotel 7707 E. McDowell Rd. scottsdale-resort-hotels.com 137
51 Travelodge Scottsdale 5th Ave. 6935 E. 5th Ave. travelodge.com 92
52 W Hotel 7277 E. Camelback Rd. starwoodhotels.com/whotels 230
Total Scottsdale Properties 8,997
Paradise Valley Properties* 53 Doubletree Paradise Valley Resort 5401 N. Scottsdale Rd. Doubletree.com 378
54 Hermosa Inn 5532 N. Palo Cristi Dr. Hermosainn.com 34
55 JW Marriott Camelback Inn 5402 E. Lincoln Dr. Marriott.com 453
56 Omni Scottsdale Resort & Spa at Montelucia 4949 E. Lincoln Dr. montelucia.com 293
57 Sanctuary Resort on Camelback 5700 E. McDonald Dr. Sanctuaryaz.com 105
58 Scottsdale Plaza Resort 7200 N. Scottsdale Rd. Scottsdaleplaza.com 404
59 Smoke Tree Resort 7101 E. Lincoln Dr. Smoketreeresort.com 28
Total Paradise Valley Properties 1,695
Other Market Properties (Carefree, Fountain Hills, Phoenix, Tempe, SRPMIC)* 60 aloft Tempe 951 E. Playa del Norte Dr. alofttempe.com 136
61 Best Western Inn of Tempe 670 N. Scottsdale Rd. bestwesternarizona.com 103
62 Carefree Resort & Conference Center 37220 N. Mule Train Rd. Carefree-resort.com 220
63 Comfort Inn (Fountain Hills) 17105 E. Shea Blvd. Choicehotels.com 48
64 CopperWynd (Fountain Hills) 13225 Eagle Ridge Dr. Copperwynd.com 32
65 Country Inn & Suites (Tempe) 808 N. Scottsdale Rd. countryinns.com 83
66 Courtyard by Marriott (North) 17010 N. Scottsdale Rd. Marriott.com 153
67 Courtyard by Marriott (SRPMIC) 5201 N. Pima Rd. Marriott.com 158
68 Desert Ridge JW Marriott (Phoenix) 5350 E. Marriott Dr. Desertridgeresort.com 956
69 Fairfield Inn (North) 13440 N. Scottsdale Rd. Marriott.com 132
70 Hampton Inn & Suites (Tempe) 1415 N. Scottsdale Rd. Hamptoninn.com 117
71 Hampton Inn/Suites (North) 16620 N. Scottsdale Rd. Hamptoninn.com 123
72 Hampton Inn/Suites (SRPMIC) 9550 E. Indian Bend Hamptoninn.com 101
73 Inn at Eagle Mountain 9800 Summer Hill Blvd. innateaglemountain.com 37
74 Lexington Hotel and Suites 12800 N. Saguaro Blvd. lexingtonhotels.com 104
75 Motel 6 (Tempe) 1612 N. Scottsdale Rd. Motel6.com 100
76 Orange Tree Golf Resort (Phoenix) 10601 N. 56th St. Orangetreegolfresort.com 162
77 Quality Suites/Suburban Extended Stay 1635 N. Scottsdale Rd. qualityinn.com 140
78 Red Lion Inn & Suites 1429 N. Scottsdale Rd. redlioninn.com 118
79 Royal Palms Inn & Spa (Phoenix) 5200 E. Camelback Rd. royalpalmshotel.com 119
80 Scottsdale Camelback Resort (Phx) 6302 E. Camelback Rd. Scottsdalecamelback.com 111
81 Sleep Inn (Phoenix) 16630 N. Scottsdale Rd. Choicehotels.com 107
82 Springhill Suites Marriot (Phoenix) 17020 N. Scottsdale Rd. Marriott.com 121
83 Talking Stick Resort (SRPMIC) 9800 E. Indian Bend Rd. Talkingstickresort.com 496
84 The Phoenician (Phoenix) 6000 E. Camelback Rd. thephoenician.com 654
85 Wekopa Resort & Conf. Center 10438 N. Ft. McDowell Rd. radisson.com/ftmcdowellaz 246
86 Westin Kierland Resort (Phoenix) 6902 E. Greenway Pkwy. Kierlandresort.com 732
Total Other Market Properties 5,609
Source: City of Scottsdale, Tourism & Events Department
*These properties do not pay bed taxes or hotel sales taxes to the City of Scottsdale, & not all are included in the Scottsdale market data.
2015 Lodging Statistics Report - City of Scottsdale 12
V. TRENDS IN TAX COLLECTION
Transient Occupancy Tax (Bed Tax)
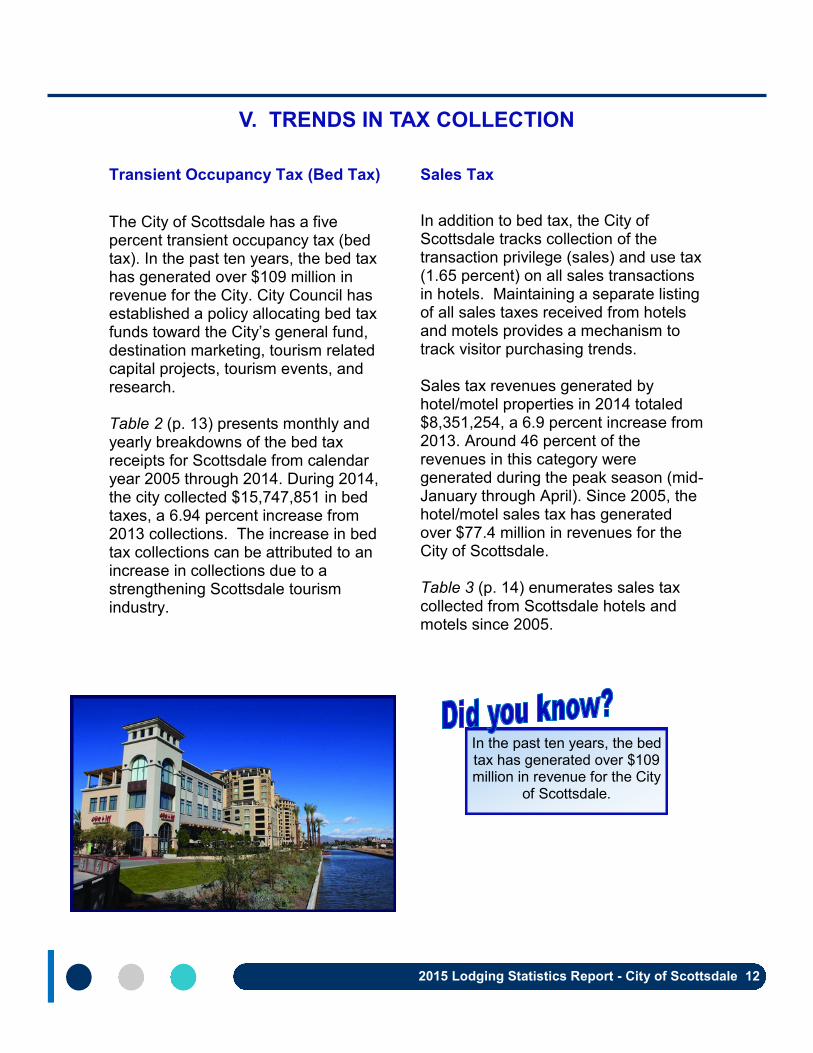
The City of Scottsdale has a five percent transient occupancy tax (bed tax). In the past ten years, the bed tax has generated over $109 million in revenue for the City. City Council has established a policy allocating bed tax funds toward the City’s general fund, destination marketing, tourism related capital projects, tourism events, and research. Table 2 (p. 13) presents monthly and yearly breakdowns of the bed tax receipts for Scottsdale from calendar year 2005 through 2014. During 2014, the city collected $15,747,851 in bed taxes, a 6.94 percent increase from 2013 collections. The increase in bed tax collections can be attributed to an increase in collections due to a strengthening Scottsdale tourism industry.
Sales Tax
In addition to bed tax, the City of Scottsdale tracks collection of the transaction privilege (sales) and use tax (1.65 percent) on all sales transactions in hotels. Maintaining a separate listing of all sales taxes received from hotels and motels provides a mechanism to track visitor purchasing trends. Sales tax revenues generated by hotel/motel properties in 2014 totaled $8,351,254, a 6.9 percent increase from 2013. Around 46 percent of the revenues in this category were generated during the peak season (mid-January through April). Since 2005, the hotel/motel sales tax has generated over $77.4 million in revenues for the City of Scottsdale. Table 3 (p. 14) enumerates sales tax collected from Scottsdale hotels and motels since 2005.
In the past ten years, the bed tax has generated over $109 million in revenue for the City
of Scottsdale.
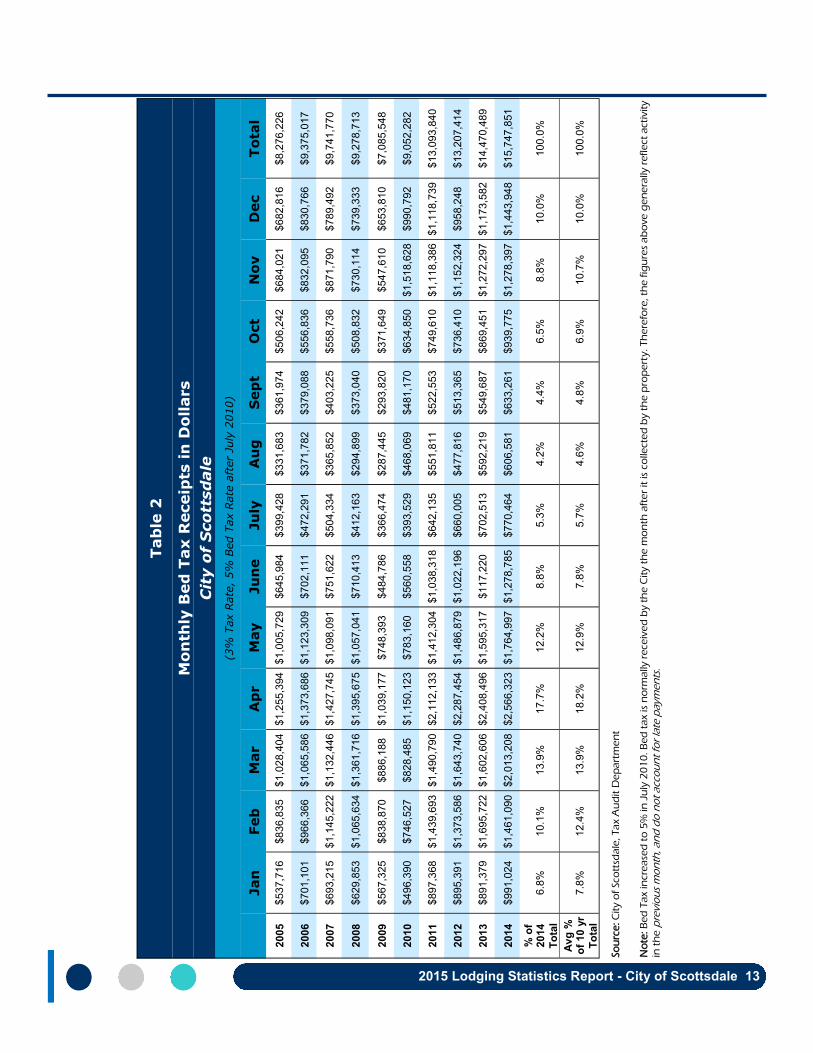
2015 Lodging Statistics Report - City of Scottsdale 13
Tab
le 2
Mon
thly
Bed
Tax R
eceip
ts in
Do
llars
Cit
y o
f S
co
ttsd
ale
(3%
Tax R
ate
, 5%
Bed T
ax R
ate
aft
er
July
2010)
Jan
Feb
M
ar
Ap
r
May
Ju
ne
Ju
ly
Au
g
Sep
t O
ct
No
v
Dec
To
tal
2005
$537,7
16
$836,8
35
$1,0
28,4
04
$1,2
55,3
94
$1,0
05,7
29
$645,9
84
$399,4
28
$331,6
83
$361,9
74
$506,2
42
$684,0
21
$682,8
16
$8,2
76,2
26
2006
$701,1
01
$966,3
66
$1,0
65,5
86
$1,3
73,6
86
$1,1
23,3
09
$702,1
11
$472,2
91
$371,7
82
$379,0
88
$556,8
36
$832,0
95
$830,7
66
$9,3
75,0
17
2007
$693,2
15
$1,1
45,2
22
$1,1
32,4
46
$1,4
27,7
45
$1,0
98,0
91
$751,6
22
$504,3
34
$365,8
52
$403,2
25
$558,7
36
$871,7
90
$789,4
92
$9,7
41,7
70
2008
$629,8
53
$1,0
65,6
34
$1,3
61,7
16
$1,3
95,6
75
$1,0
57,0
41
$710,4
13
$412,1
63
$294,8
99
$373,0
40
$508,8
32
$730,1
14
$739,3
33
$9,2
78,7
13
2009
$567,3
25
$838,8
70
$886,1
88
$1,0
39,1
77
$748,3
93
$484,7
86
$366,4
74
$287,4
45
$293,8
20
$371,6
49
$547,6
10
$653,8
10
$7,0
85,5
48
2010
$496,3
90
$746,5
27
$828,4
85
$1,1
50,1
23
$783,1
60
$560,5
58
$393,5
29
$468,0
69
$481,1
70
$634,8
50
$1,5
18,6
28
$990,7
92
$9,0
52,2
82
2011
$897,3
68
$1,4
39,6
93
$1,4
90,7
90
$2,1
12,1
33
$1,4
12,3
04
$1,0
38,3
18
$642,1
35
$551,8
11
$522,5
53
$749,6
10
$1,1
18,3
86
$1,1
18,7
39
$13,0
93,8
40
2012
$895,3
91
$1,3
73,5
86
$1,6
43,7
40
$2,2
87,4
54
$1,4
86,8
79
$1,0
22,1
96
$660,0
05
$477,8
16
$513,3
65
$736,4
10
$1,1
52,3
24
$958,2
48
$13,2
07,4
14
2013
$891,3
79
$1,6
95,7
22
$1,6
02,6
06
$2,4
08,4
96
$1,5
95,3
17
$117,2
20
$702,5
13
$592,2
19
$549,6
87
$869,4
51
$1,2
72,2
97
$1,1
73,5
82
$14,4
70,4
89
2014
$991,0
24
$1,4
61,0
90
$2,0
13,2
08
$2,5
66,3
23
$1,7
64,9
97
$1,2
78,7
85
$770,4
64
$606,5
81
$633,2
61
$939,7
75
$1,2
78,3
97
$1,4
43,9
48
$15,7
47,8
51
% o
f 2014
To
tal
6.8
%
10.1
%
13.9
%
17.7
%
12.2
%
8.8
%
5.3
%
4.2
%
4.4
%
6.5
%
8.8
%
10.0
%
100.0
%
Av
g %
o
f 10 y
r
To
tal
7.8
%
12.4
%
13.9
%
18.2
%
12.9
%
7.8
%
5.7
%
4.6
%
4.8
%
6.9
%
10.7
%
10.0
%
100.0
%
So
urc
e: C
ity o
f Sco
ttsd
ale
, T
ax A
ud
it D
ep
art
me
nt
No
te: B
ed
Ta
x in
cre
ase
d t
o 5
% in
Ju
ly 2
01
0. B
ed
ta
x is
no
rma
lly r
ece
ive
d b
y t
he
Cit
y t
he
mo
nth
aft
er
it is
co
llecte
d b
y t
he
pro
pe
rty. T
he
refo
re, th
e f
igu
res
ab
ove
ge
ne
rally
re
fle
ct
acti
vit
y
in t
he
pre
vio
us
mo
nth
, an
d d
o n
ot
acc
ou
nt
for
late
pa
ym
en
ts.
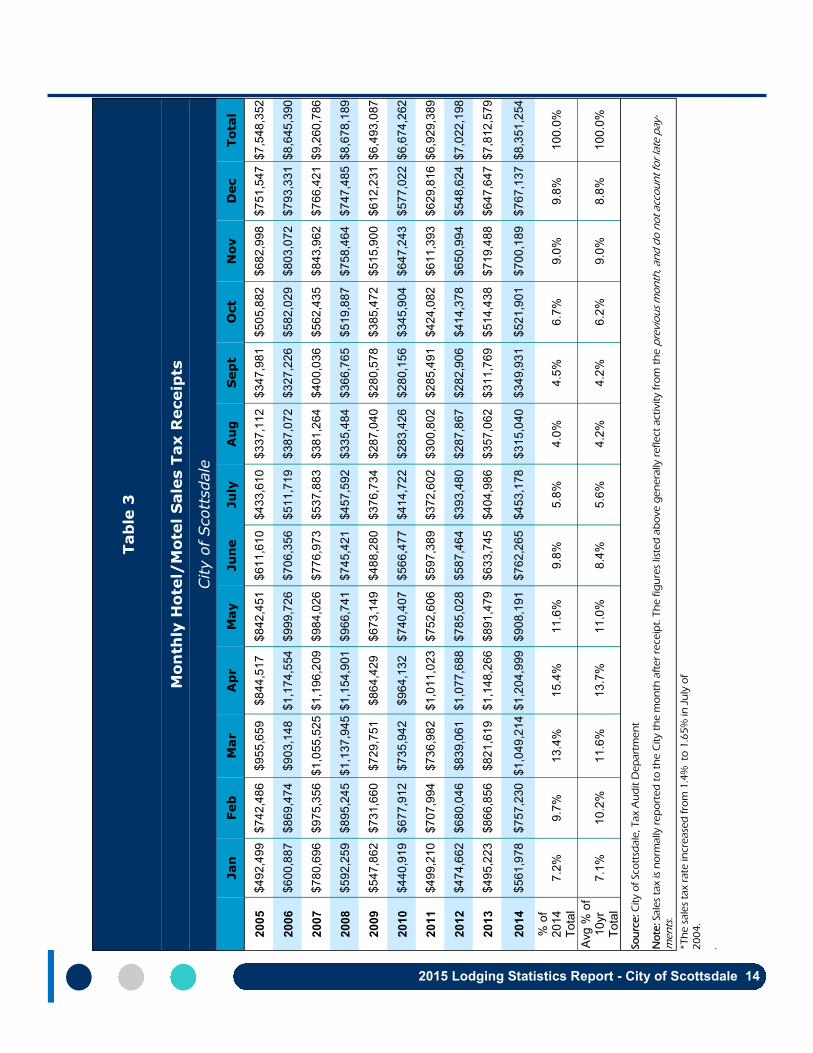
2015 Lodging Statistics Report - City of Scottsdale 14
Tab
le 3
Mon
thly
Ho
tel/
Mote
l S
ale
s T
ax R
eceip
ts
City o
f Scott
sdale
Jan
Feb
M
ar
Ap
r
May
Ju
ne
Ju
ly
Au
g
Sep
t O
ct
Nov
Dec
Tota
l
20
05
$4
92
,49
9
$7
42
,48
6
$9
55
,65
9
$8
44
,51
7
$8
42
,45
1
$6
11
,61
0
$4
33
,61
0
$3
37
,11
2
$3
47
,98
1
$5
05
,88
2
$6
82
,99
8
$7
51
,54
7 $
7,5
48
,352
20
06
$6
00
,88
7
$8
69
,47
4
$9
03
,14
8
$1
,174
,554
$
99
9,7
26
$
70
6,3
56
$
51
1,7
19
$
38
7,0
72
$
32
7,2
26
$
58
2,0
29
$
80
3,0
72
$
79
3,3
31
$
8,6
45
,390
20
07
$7
80
,69
6
$9
75
,35
6
$1
,055
,525
$1
,196
,209
$
98
4,0
26
$
77
6,9
73
$
53
7,8
83
$
38
1,2
64
$
40
0,0
36
$
56
2,4
35
$
84
3,9
62
$
76
6,4
21
$
9,2
60
,786
20
08
$5
92
,25
9
$8
95
,24
5
$1
,137
,945
$1
,154
,901
$
96
6,7
41
$
74
5,4
21
$
45
7,5
92
$
33
5,4
84
$
36
6,7
65
$
51
9,8
87
$
75
8,4
64
$
74
7,4
85
$
8,6
78
,189
20
09
$5
47
,86
2
$7
31
,66
0
$7
29
,75
1
$8
64
,42
9
$6
73
,14
9
$4
88
,28
0
$3
76
,73
4
$2
87
,04
0
$2
80
,57
8
$3
85
,47
2
$5
15
,90
0
$6
12
,23
1 $
6,4
93
,087
20
10
$4
40
,91
9
$6
77
,91
2
$7
35
,94
2
$9
64
,13
2
$7
40
,40
7
$5
66
,47
7
$4
14
,72
2
$2
83
,42
6
$2
80
,15
6
$3
45
,90
4
$6
47
,24
3
$5
77
,02
2 $
6,6
74
,262
20
11
$4
99
,21
0
$7
07
,99
4
$7
36
,98
2
$1
,011
,023
$
75
2,6
06
$
59
7,3
89
$
37
2,6
02
$
30
0,8
02
$
28
5,4
91
$
42
4,0
82
$
61
1,3
93
$
62
9,8
16
$
6,9
29
,389
20
12
$4
74
,66
2
$6
80
,04
6
$8
39
,06
1
$1
,077
,688
$
78
5,0
28
$
58
7,4
64
$
39
3,4
80
$
28
7,8
67
$
28
2,9
06
$
41
4,3
78
$
65
0,9
94
$
54
8,6
24
$
7,0
22
,198
20
13
$4
95
,22
3
$8
66
,85
6
$8
21
,61
9
$1
,148
,266
$
89
1,4
79
$
63
3,7
45
$
40
4,9
86
$
35
7,0
62
$
31
1,7
69
$
51
4,4
38
$
71
9,4
88
$
64
7,6
47
$
7,8
12
,579
20
14
$5
61
,97
8
$7
57
,23
0
$1
,049
,214
$1
,204
,999
$
90
8,1
91
$
76
2,2
65
$
45
3,1
78
$
31
5,0
40
$
34
9,9
31
$
52
1,9
01
$
70
0,1
89
$
76
7,1
37
$
8,3
51
,254
% o
f 2
01
4
To
tal
7.2
%
9.7
%
13
.4%
1
5.4
%
11
.6%
9
.8%
5
.8%
4
.0%
4
.5%
6
.7%
9
.0%
9
.8%
1
00
.0%
Avg
% o
f 1
0yr
To
tal
7.1
%
10
.2%
1
1.6
%
13
.7%
1
1.0
%
8.4
%
5.6
%
4.2
%
4.2
%
6.2
%
9.0
%
8.8
%
10
0.0
%
So
urc
e: C
ity o
f Sco
ttsd
ale
, T
ax A
ud
it D
ep
art
me
nt
No
te: Sa
les
tax is
no
rma
lly r
ep
ort
ed
to
th
e C
ity t
he
mo
nth
aft
er
rece
ipt.
Th
e f
igu
res
liste
d a
bo
ve
ge
ne
rally
re
fle
ct
acti
vit
y f
rom
th
e p
revio
us
mo
nth
, an
d d
o n
ot
acc
ou
nt
for
late
pa
y-
me
nts
.
*T
he
sa
les
tax r
ate
in
cre
ase
d f
rom
1.4
% to
1.6
5%
in
Ju
ly o
f
20
04
.
.

2015 Lodging Statistics Report - City of Scottsdale 15
VI. TRENDS IN ROOM INVENTORY
Room Supply
Table 4 reflects hotel room supply inventory for the study market area since 2005. Market area room inventory declined in 2009. However, in 2010 through 2012 there were slight increases in room inventory with decreases in 2013 and 2014. Overall, the market has grown by over 11 percent—1630 rooms—during the past ten years. Table 5a shows the room inventory of the City of Scottsdale by category. Table 5b shows the room inventory of the Town of Paradise Valley by category. Table 5c shows the room inventory of the surrounding market areas by category.
Table 4
Hotel Inventory
Total Hotel Market Area Properties
Year City of
Scottsdale
Town of
Paradise
Valley
Other Mar-
ket Area Ho-
tels
Total
2005 8,932 1,598 4,141 14,671
2006 9,021 1,564 4,679 15,264
2007 9,167 1,572 4,606 15,345
2008 9,444 1,865 4,928 16,237
2009 9,397 1,864 4,889 16,150
2010 9,354 1,862 5,375 16,591
2011 9,332 1,864 5,539 16,735
2012 9,378 1,863 5,517 16,758
2013 9,391 1,864 5,490 16,745
2014 8,997 1,695 5,609 16,301 Source: Smith Travel Research (STR); City of Scottsdale, Tourism & Events Department
Note: Only hotel properties with 25 or more rooms are included
Table 5a Table 5b Table 5c
Room Inventory by Category* Room Inventory by Category* Room Inventory by Category*
City of Scottsdale - 2014 Town of Paradise Valley - 2014 Market Areas- 2014
Category # of
Rooms
% of Mar-
ket Category
# of
Rooms
% of Mar-
ket Category
# of
Rooms
% of
Market
Resort 3,449 38% Resort 1,633 96% Resort 3,339 60%
Full Service 2,229 25% Full Service 34 2% Full Service 584 10%
Limited Ser-vice
3,319 37% Limited Ser-
vice 28 2%
Limited Ser-vice
1,686 30%
Total 8,997 100% Total 1,695 100% Total 5,609 100%
Source: Smith Travel Research, Tourism & Events Department
2015 Lodging Statistics Report - City of Scottsdale 16
New Market Area Hotels Property Inventory
Table 6 (p. 17) lists the existing hotel properties within the Scottsdale/ Paradise Valley market area. The properties are classified by facility type, and room information. Note: Hotel classifications are Resort, Full Service, and Limited Service.
The latest addition to the Scottsdale market area, the Howard Johnson in Downtown Scottsdale opened in March 2012 with 65 rooms. Outside of the Scottsdale area, Talking Stick Resort located in the Salt River Pima Maricopa Indian Community opened in 2010 with 496 rooms, along with the Hampton Inn and Suites (101) and the Courtyard by Marriott Scottsdale (158), which opened in early Spring 2012. Future hotel developments include the Princess Resort expansion (102) and Mountain Shadows Resort (180). Since 2008, other completed market area properties include the 224-room W Hotel and the 293 Omni Montelucia in Paradise Valley. The emergence of upscale “urban chic” properties in Downtown Scottsdale began in late 2005 with the opening of the renovated Hotel Valley Ho resort (234 rooms). More recently, an existing property was re-branded as the Saguaro Hotel (194 rooms) which included a $10 million dollar renovation that embraces the spirit of the Southwest. The Best Western Sundial hotel (54 rooms) also opened in downtown Scottsdale in 2009.
The market area has grown by nearly 1,630 rooms since
2005.

2015 Lodging Statistics Report - City of Scottsdale 17
Table 6
Resort Hotel Properties
Scottsdale/Paradise Valley Market Area
Property Name # of
Rooms Location
The Boulders 160 Scottsdale
Carefree Resort & Conference Center 220 Carefree
Doubletree Paradise Valley Resort 378 Paradise Valley
Fairmont Scottsdale Princess Resort 649 Scottsdale
FireSky Resort & Spa 204 Scottsdale
Four Seasons Resort 210 Scottsdale
Hilton Scottsdale Resort & Villas 235 Scottsdale
Hyatt Regency Scottsdale 493 Scottsdale
JW Marriott Desert Ridge Resort & Spa 956 Phoenix
JW Marriott Camelback Inn 453 Paradise Valley
Marriott at McDowell Mountain 266 Scottsdale
Millennium Scottsdale Resort & Villas 125 Scottsdale
Omni Scottsdale Resort & Spa at Montelucia 293 Paradise Valley
Orange Tree Golf Resort 162 Phoenix
The Phoenician Resort & Spa 654 Phoenix
Royal Palms Resort & Spa 119 Phoenix
Sanctuary Camelback Mountain Resort & Spa 105 Paradise Valley
Scottsdale Links Resort 217 Scottsdale
Scottsdale Plaza Resort 404 Paradise Valley
Scottsdale Resort & Conference Center 326 Scottsdale
Scottsdale Villa Mirage 264 Scottsdale
Sheraton's Desert Oasis 300 Scottsdale
Talking Stick Resort 496 SRPMIC
Westin Kierland Resort & Spa 732 Phoenix Source: City of Scottsdale, Tourism and Events Department
2015 Lodging Statistics Report - City of Scottsdale 18
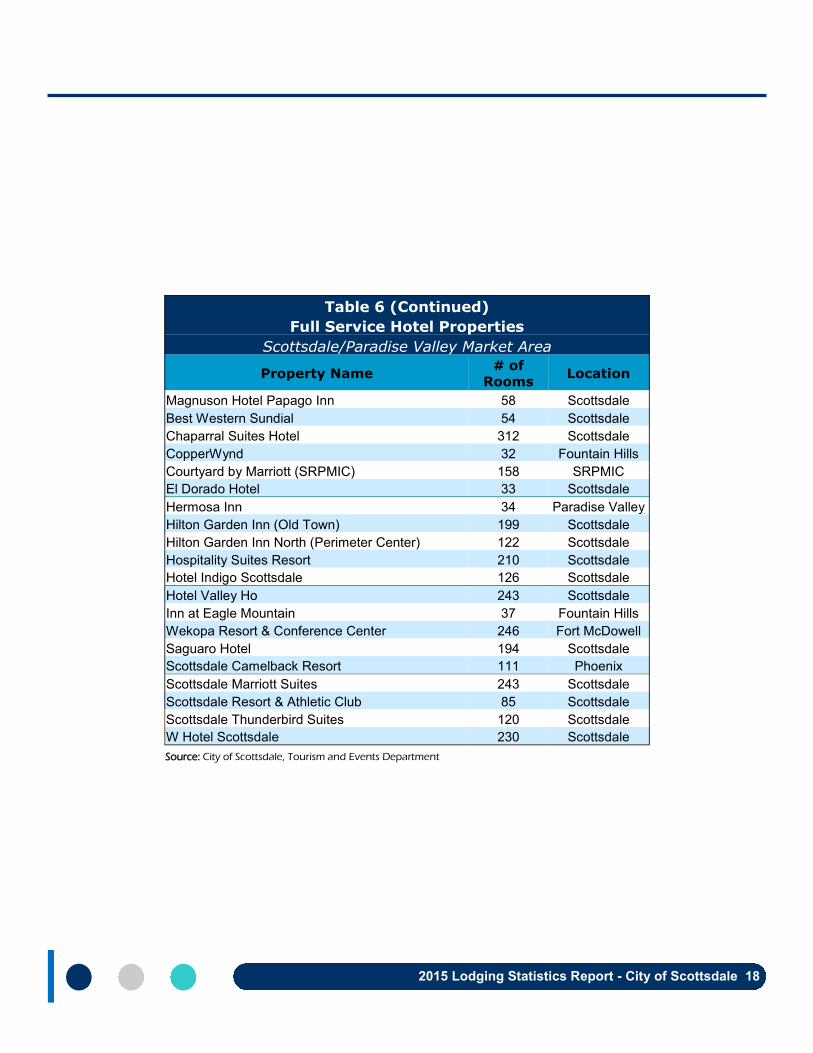
Table 6 (Continued)
Full Service Hotel Properties
Scottsdale/Paradise Valley Market Area
Property Name # of
Rooms Location
Magnuson Hotel Papago Inn 58 Scottsdale
Best Western Sundial 54 Scottsdale
Chaparral Suites Hotel 312 Scottsdale
CopperWynd 32 Fountain Hills
Courtyard by Marriott (SRPMIC) 158 SRPMIC
El Dorado Hotel 33 Scottsdale
Hermosa Inn 34 Paradise Valley
Hilton Garden Inn (Old Town) 199 Scottsdale
Hilton Garden Inn North (Perimeter Center) 122 Scottsdale
Hospitality Suites Resort 210 Scottsdale
Hotel Indigo Scottsdale 126 Scottsdale
Hotel Valley Ho 243 Scottsdale
Inn at Eagle Mountain 37 Fountain Hills
Wekopa Resort & Conference Center 246 Fort McDowell
Saguaro Hotel 194 Scottsdale
Scottsdale Camelback Resort 111 Phoenix
Scottsdale Marriott Suites 243 Scottsdale
Scottsdale Resort & Athletic Club 85 Scottsdale
Scottsdale Thunderbird Suites 120 Scottsdale
W Hotel Scottsdale 230 Scottsdale
Source: City of Scottsdale, Tourism and Events Department
2015 Lodging Statistics Report - City of Scottsdale 19
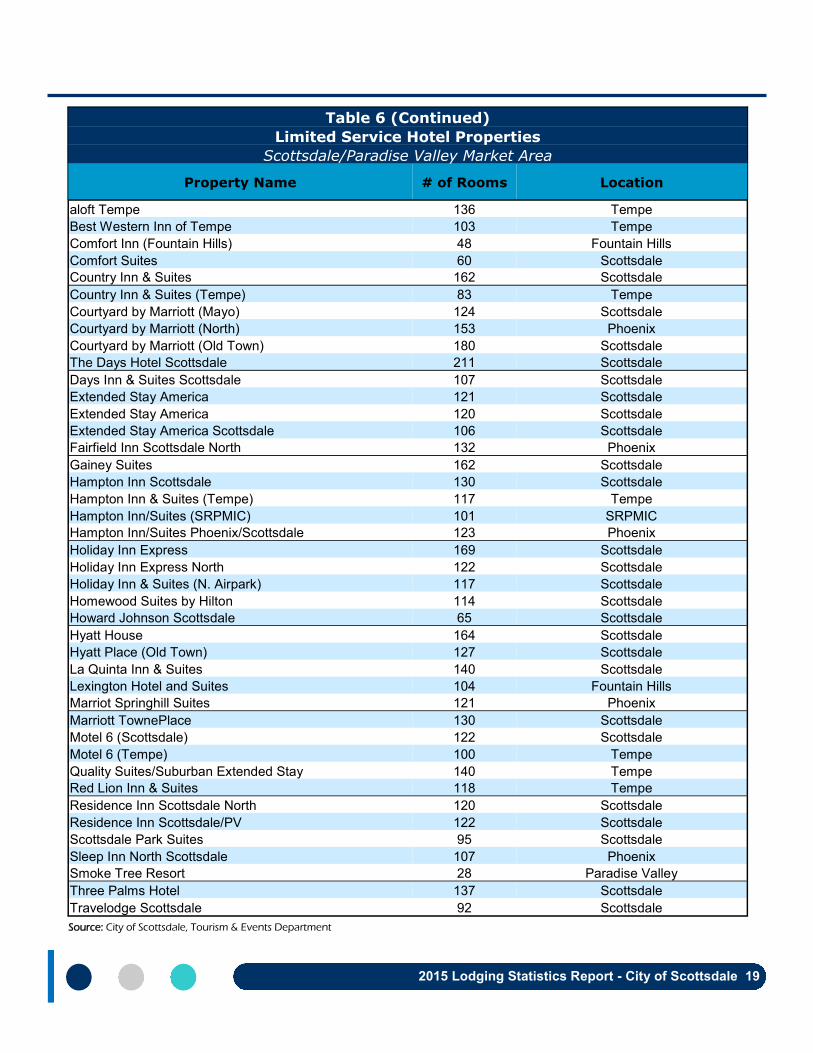
Table 6 (Continued)
Limited Service Hotel Properties
Scottsdale/Paradise Valley Market Area
Property Name # of Rooms Location
aloft Tempe 136 Tempe
Best Western Inn of Tempe 103 Tempe
Comfort Inn (Fountain Hills) 48 Fountain Hills
Comfort Suites 60 Scottsdale
Country Inn & Suites 162 Scottsdale
Country Inn & Suites (Tempe) 83 Tempe
Courtyard by Marriott (Mayo) 124 Scottsdale
Courtyard by Marriott (North) 153 Phoenix
Courtyard by Marriott (Old Town) 180 Scottsdale
The Days Hotel Scottsdale 211 Scottsdale
Days Inn & Suites Scottsdale 107 Scottsdale
Extended Stay America 121 Scottsdale
Extended Stay America 120 Scottsdale
Extended Stay America Scottsdale 106 Scottsdale
Fairfield Inn Scottsdale North 132 Phoenix
Gainey Suites 162 Scottsdale
Hampton Inn Scottsdale 130 Scottsdale
Hampton Inn & Suites (Tempe) 117 Tempe
Hampton Inn/Suites (SRPMIC) 101 SRPMIC
Hampton Inn/Suites Phoenix/Scottsdale 123 Phoenix
Holiday Inn Express 169 Scottsdale
Holiday Inn Express North 122 Scottsdale
Holiday Inn & Suites (N. Airpark) 117 Scottsdale
Homewood Suites by Hilton 114 Scottsdale
Howard Johnson Scottsdale 65 Scottsdale
Hyatt House 164 Scottsdale
Hyatt Place (Old Town) 127 Scottsdale
La Quinta Inn & Suites 140 Scottsdale
Lexington Hotel and Suites 104 Fountain Hills
Marriot Springhill Suites 121 Phoenix
Marriott TownePlace 130 Scottsdale
Motel 6 (Scottsdale) 122 Scottsdale
Motel 6 (Tempe) 100 Tempe
Quality Suites/Suburban Extended Stay 140 Tempe
Red Lion Inn & Suites 118 Tempe
Residence Inn Scottsdale North 120 Scottsdale
Residence Inn Scottsdale/PV 122 Scottsdale
Scottsdale Park Suites 95 Scottsdale
Sleep Inn North Scottsdale 107 Phoenix
Smoke Tree Resort 28 Paradise Valley
Three Palms Hotel 137 Scottsdale
Travelodge Scottsdale 92 Scottsdale
Source: City of Scottsdale, Tourism & Events Department
2015 Lodging Statistics Report - City of Scottsdale 20
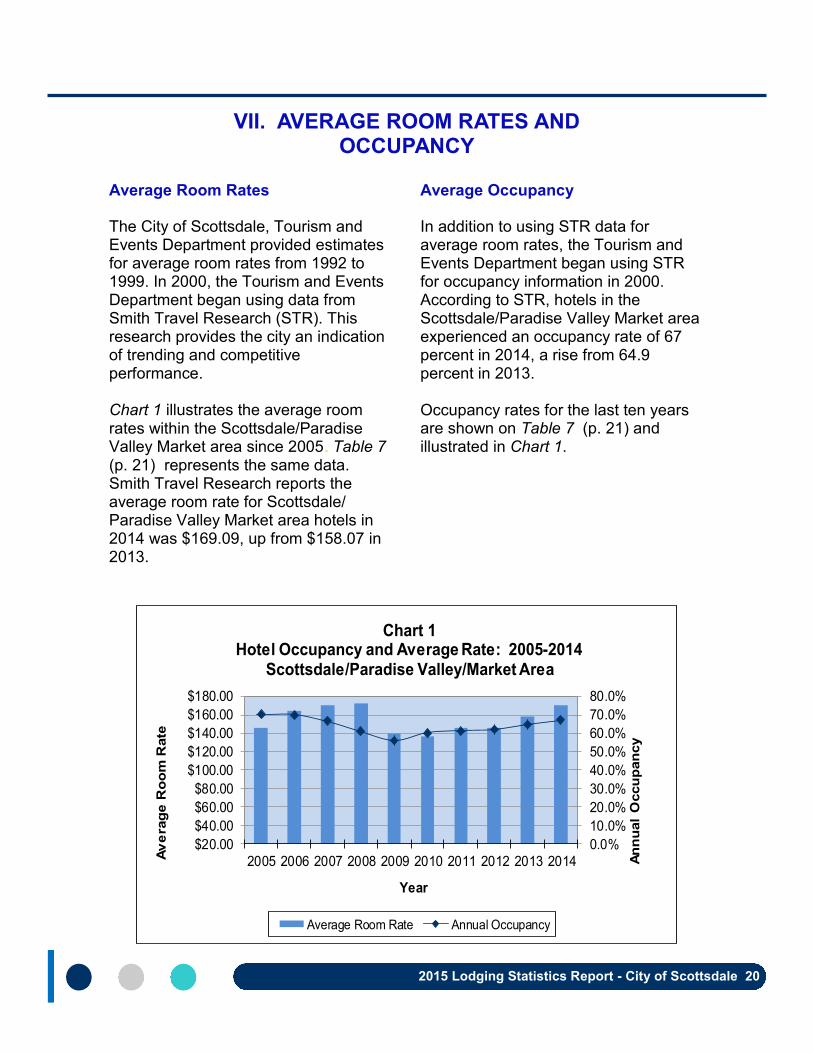
VII. AVERAGE ROOM RATES AND OCCUPANCY
Average Room Rates Average Occupancy
The City of Scottsdale, Tourism and Events Department provided estimates for average room rates from 1992 to 1999. In 2000, the Tourism and Events Department began using data from Smith Travel Research (STR). This research provides the city an indication of trending and competitive performance. Chart 1 illustrates the average room rates within the Scottsdale/Paradise Valley Market area since 2005. . . Table 7 (p. 21) represents the same data. Smith Travel Research reports the average room rate for Scottsdale/ Paradise Valley Market area hotels in 2014 was $169.09, up from $158.07 in 2013.
In addition to using STR data for average room rates, the Tourism and Events Department began using STR for occupancy information in 2000. According to STR, hotels in the Scottsdale/Paradise Valley Market area experienced an occupancy rate of 67 percent in 2014, a rise from 64.9 percent in 2013. Occupancy rates for the last ten years are shown on Table 7 (p. 21) and illustrated in Chart 1.
0.0%
10.0%
20.0%
30.0%
40.0%
50.0%
60.0%
70.0%
80.0%
$20.00
$40.00
$60.00
$80.00
$100.00
$120.00
$140.00
$160.00
$180.00
2005 2006 2007 2008 2009 2010 2011 2012 2013 2014 An
nu
al
Occu
pan
cy
Av
era
ge
Ro
om
Rate
Year
Chart 1Hotel Occupancy and Average Rate: 2005-2014
Scottsdale/Paradise Valley/Market Area
Average Room Rate Annual Occupancy
2015 Lodging Statistics Report - City of Scottsdale 21
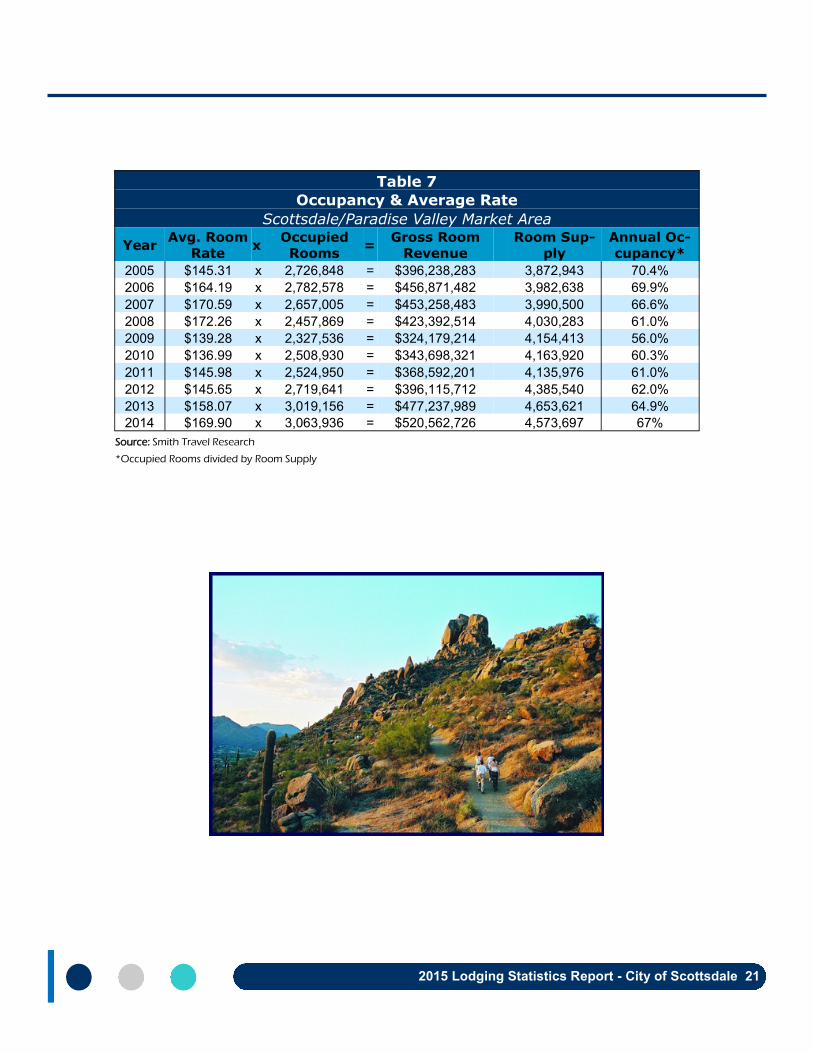
Table 7
Occupancy & Average Rate
Scottsdale/Paradise Valley Market Area
Year Avg. Room
Rate x
Occupied
Rooms =
Gross Room
Revenue
Room Sup-
ply
Annual Oc-
cupancy*
2005 $145.31 x 2,726,848 = $396,238,283 3,872,943 70.4%
2006 $164.19 x 2,782,578 = $456,871,482 3,982,638 69.9%
2007 $170.59 x 2,657,005 = $453,258,483 3,990,500 66.6%
2008 $172.26 x 2,457,869 = $423,392,514 4,030,283 61.0%
2009 $139.28 x 2,327,536 = $324,179,214 4,154,413 56.0%
2010 $136.99 x 2,508,930 = $343,698,321 4,163,920 60.3%
2011 $145.98 x 2,524,950 = $368,592,201 4,135,976 61.0%
2012 $145.65 x 2,719,641 = $396,115,712 4,385,540 62.0%
2013 $158.07 x 3,019,156 = $477,237,989 4,653,621 64.9%
2014 $169.90 x 3,063,936 = $520,562,726 4,573,697 67%
Source: Smith Travel Research
*Occupied Rooms divided by Room Supply
2015 Lodging Statistics Report - City of Scottsdale 22
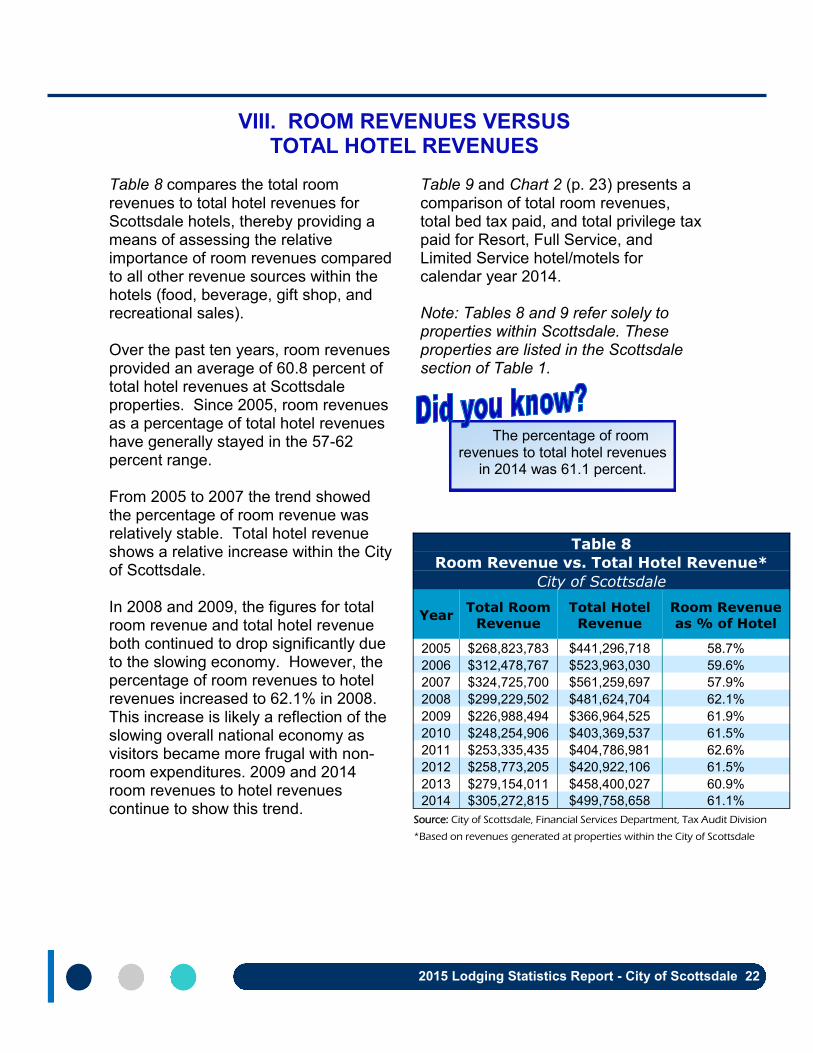
VIII. ROOM REVENUES VERSUS TOTAL HOTEL REVENUES
Table 8 compares the total room revenues to total hotel revenues for Scottsdale hotels, thereby providing a means of assessing the relative importance of room revenues compared to all other revenue sources within the hotels (food, beverage, gift shop, and recreational sales). Over the past ten years, room revenues provided an average of 60.8 percent of total hotel revenues at Scottsdale properties. Since 2005, room revenues as a percentage of total hotel revenues have generally stayed in the 57-62 percent range. From 2005 to 2007 the trend showed the percentage of room revenue was relatively stable. Total hotel revenue shows a relative increase within the City of Scottsdale. In 2008 and 2009, the figures for total room revenue and total hotel revenue both continued to drop significantly due to the slowing economy. However, the percentage of room revenues to hotel revenues increased to 62.1% in 2008. This increase is likely a reflection of the slowing overall national economy as visitors became more frugal with non-room expenditures. 2009 and 2014 room revenues to hotel revenues continue to show this trend.
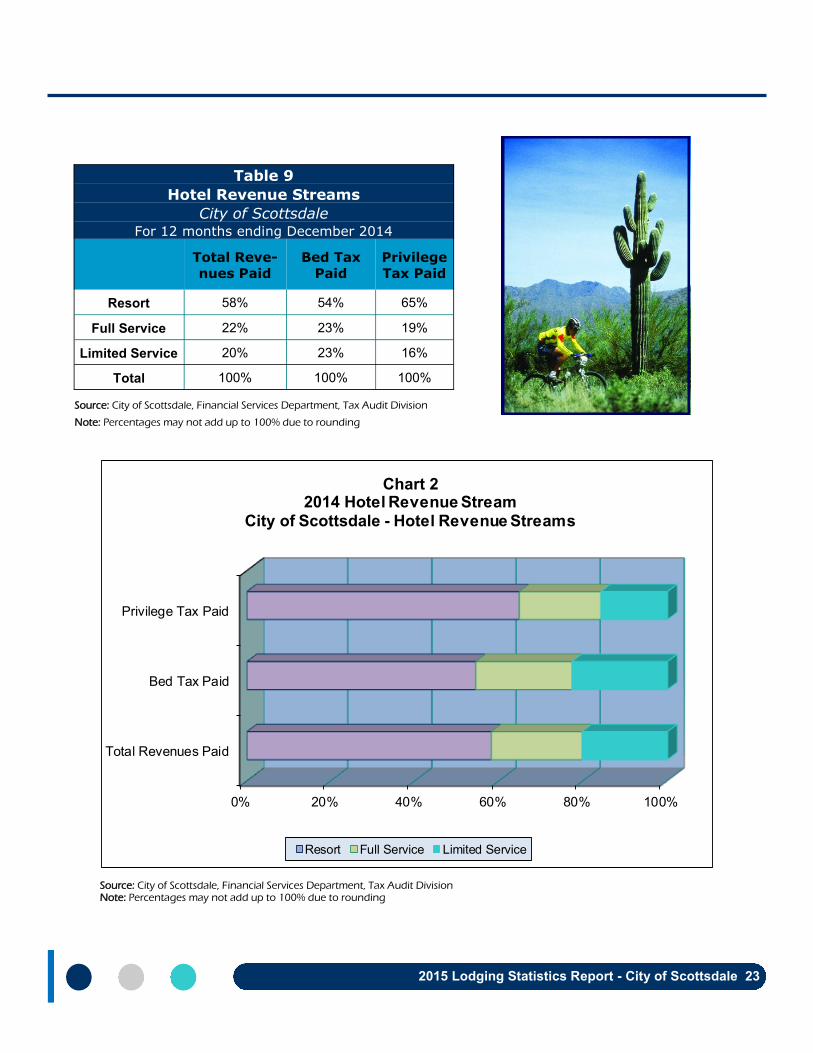
Table 9 and Chart 2 (p. 23) presents a comparison of total room revenues, total bed tax paid, and total privilege tax paid for Resort, Full Service, and Limited Service hotel/motels for calendar year 2014. Note: Tables 8 and 9 refer solely to properties within Scottsdale. These properties are listed in the Scottsdale section of Table 1.
The percentage of room revenues to total hotel revenues
in 2014 was 61.1 percent.
Table 8
Room Revenue vs. Total Hotel Revenue*
City of Scottsdale
Year Total Room
Revenue
Total Hotel
Revenue
Room Revenue
as % of Hotel
2005 $268,823,783 $441,296,718 58.7%
2006 $312,478,767 $523,963,030 59.6%
2007 $324,725,700 $561,259,697 57.9%
2008 $299,229,502 $481,624,704 62.1%
2009 $226,988,494 $366,964,525 61.9%
2010 $248,254,906 $403,369,537 61.5%
2011 $253,335,435 $404,786,981 62.6%
2012 $258,773,205 $420,922,106 61.5%
2013 $279,154,011 $458,400,027 60.9%
2014 $305,272,815 $499,758,658 61.1%
Source: City of Scottsdale, Financial Services Department, Tax Audit Division
*Based on revenues generated at properties within the City of Scottsdale
2015 Lodging Statistics Report - City of Scottsdale 23
Source: City of Scottsdale, Financial Services Department, Tax Audit Division Note: Percentages may not add up to 100% due to rounding
Table 9
Hotel Revenue Streams
City of Scottsdale For 12 months ending December 2014
Total Reve-
nues Paid
Bed Tax
Paid
Privilege
Tax Paid
Resort 58% 54% 65%
Full Service 22% 23% 19%
Limited Service 20% 23% 16%
Total 100% 100% 100%
Source: City of Scottsdale, Financial Services Department, Tax Audit Division
Note: Percentages may not add up to 100% due to rounding
0% 20% 40% 60% 80% 100%
Total Revenues Paid
Bed Tax Paid
Privilege Tax Paid
Chart 22014 Hotel Revenue Stream
City of Scottsdale - Hotel Revenue Streams
Resort Full Service Limited Service

2015 Lodging Statistics Report - City of Scottsdale 24
IX. MARKET AREA GOLF, SPAS, AND DESTINATION EVENTS
Golf
Tourism in the City of Scottsdale is driven by several factors—destination resorts, special events, golf, desert environment, southwestern culture, and, of course, warm winters. This section provides an overview of the market area’s golf courses, spa facilities, and special events.
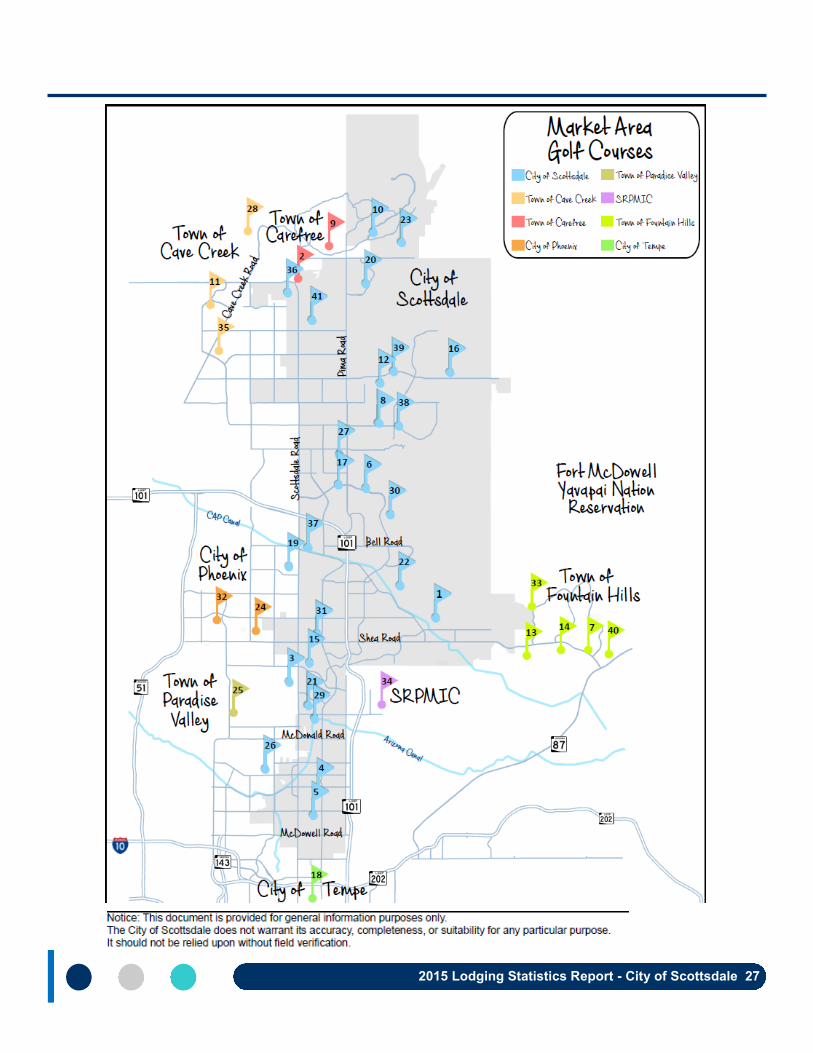
Tourists account for an extensive amount of golf play in Scottsdale, and accomplish a great deal of that play during peak season (January through April). Table 10 (p. 25) lists the golf courses in the Scottsdale/Paradise Valley market area. Map 2 (p. 27) shows where many of those golf courses are located. Access to private courses is not necessarily available to visitors. Further, some golf courses are open only to guests of adjacent hotels.
Scottsdale is widely known for its spectacular golf courses,
recreational amenities, climate, five-star resorts, numerous events and attractions, the
Sonoran desert, world-class restaurants, and art galleries.

2015 Lodging Statistics Report - City of Scottsdale 25
Table 10
Golf Courses
Scottsdale/Paradise Valley Market Area
Key Course Name Location Holes Course De-
sign
Course
Type Par Architect
1 Ancala C.C. Scottsdale 18 Desert Private* 72 Dye Design
2 Boulders Golf Club Carefree 36 Desert Semi-Private 72 Jay Morrish
3 Camelback Golf Club Scottsdale 36 Traditional Semi-Private 72 Arthur Hills/Hurdzan&Fry
4 Continental Golf Club Scottsdale 18 Traditional Public 60 Hardin/Nash
5 Coronado Golf Course Scottsdale 9 (exec) Traditional Public 31 Coggins/Lambe
6 DC Ranch C.C. Scottsdale 18 Traditional Private* 71 Lehman/Fought
7 Desert Canyon Fountain Hills 18 Desert Public 71 John Allen
8 Desert Highlands Scottsdale 18 Desert Private* 72 Jack Nicklaus
9 Desert Forest Carefree 18 Desert Private* 72 Robert Lawrence
10 Desert Mountain Scottsdale 108 Desert Private* 72 Jack Nicklaus
11 Dove Valley Ranch Cave Creek 18 Desert Public 72 Robert T. Jones Jr
12 The Estancia Club Scottsdale 18 Desert Private* 72 Tom Fazio
13 Eagle Mountain Fountain Hills 18 Desert Public 71 Scott Miller
14 Firerock C.C. Fountain Hills 18 Desert Private* 72 Gary Panks
15 Gainey Ranch Scottsdale 27 Traditional Private/Resort 72 Benz/Poellot
16 Scottsdale's National Golf Club Scottsdale 18 Desert Private* 72 Jay Morrish
17 Grayhawk Golf Club Scottsdale 36 Desert Public 72 Graham/Panks/Fazio
18 Karsten (ASU) Tempe 18 Scottish Links Public 70 Pete Dye
19 Kierland Golf Club Scottsdale 27 Desert Public 72 Scott Miller
20 Legend Trail Golf Club Scottsdale 18 Desert Public 72 Rees Jones
21 McCormick Ranch Scottsdale 36 Traditional Public/Resort 72 Desmond Muirhead
22 McDowell Mountain Golf Club Scottsdale 18 Desert Public 71 Randy Heckenkamper
23 Mirabel Club Scottsdale 18 Links Private* 71 Tom Fazio
24 Orange Tree Phoenix 18 Traditional Public/Resort 72 Bulla/Hughes
25 Paradise Valley C.C. Paradise Valley 18 Traditional Private* 72 Lawerence Hughes
26 The Phoenician Scottsdale 27 Desert Public/Resort 70 Flint/Richardson/Robinson
27 Pinnacle Peak C.C. Scottsdale 18 Traditional Private* 72 Dick Turner
28 Rancho Manana Cave Creek 18 Desert Semi-private 70 Bill Johnson
29 Silverado Golf Club Scottsdale 18 Traditinal Public 70 Gilmore/Graves
30 Silverleaf Club Scottsdale 18 Desert Private* 72 Tom Weiskopf
2015 Lodging Statistics Report - City of Scottsdale 26
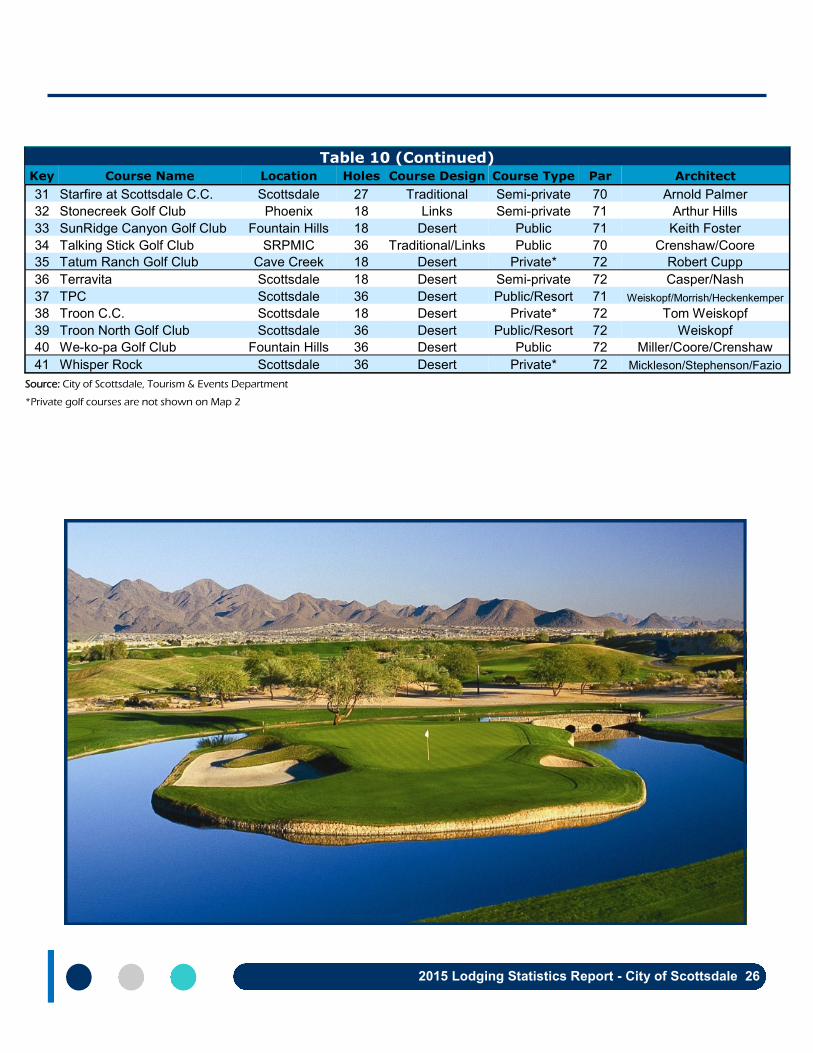
Table 10 (Continued) Key Course Name Location Holes Course Design Course Type Par Architect
31 Starfire at Scottsdale C.C. Scottsdale 27 Traditional Semi-private 70 Arnold Palmer
32 Stonecreek Golf Club Phoenix 18 Links Semi-private 71 Arthur Hills
33 SunRidge Canyon Golf Club Fountain Hills 18 Desert Public 71 Keith Foster
34 Talking Stick Golf Club SRPMIC 36 Traditional/Links Public 70 Crenshaw/Coore
35 Tatum Ranch Golf Club Cave Creek 18 Desert Private* 72 Robert Cupp
36 Terravita Scottsdale 18 Desert Semi-private 72 Casper/Nash
37 TPC Scottsdale 36 Desert Public/Resort 71 Weiskopf/Morrish/Heckenkemper
38 Troon C.C. Scottsdale 18 Desert Private* 72 Tom Weiskopf
39 Troon North Golf Club Scottsdale 36 Desert Public/Resort 72 Weiskopf
40 We-ko-pa Golf Club Fountain Hills 36 Desert Public 72 Miller/Coore/Crenshaw
41 Whisper Rock Scottsdale 36 Desert Private* 72 Mickleson/Stephenson/Fazio
Source: City of Scottsdale, Tourism & Events Department
*Private golf courses are not shown on Map 2
2015 Lodging Statistics Report - City of Scottsdale 27
2015 Lodging Statistics Report - City of Scottsdale 28
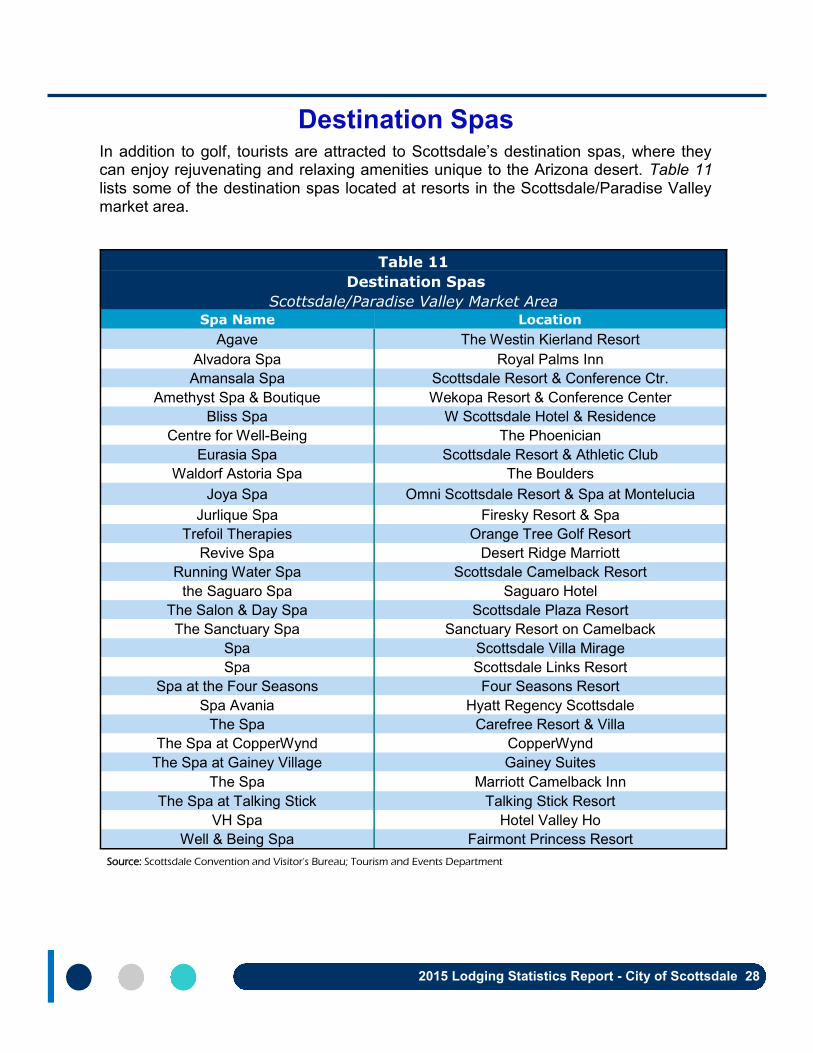
Destination Spas In addition to golf, tourists are attracted to Scottsdale’s destination spas, where they can enjoy rejuvenating and relaxing amenities unique to the Arizona desert. Table 11 lists some of the destination spas located at resorts in the Scottsdale/Paradise Valley market area.
Table 11
Destination Spas
Scottsdale/Paradise Valley Market Area Spa Name Location
Agave The Westin Kierland Resort
Alvadora Spa Royal Palms Inn
Amansala Spa Scottsdale Resort & Conference Ctr.
Amethyst Spa & Boutique Wekopa Resort & Conference Center
Bliss Spa W Scottsdale Hotel & Residence
Centre for Well-Being The Phoenician
Eurasia Spa Scottsdale Resort & Athletic Club
Waldorf Astoria Spa The Boulders
Joya Spa Omni Scottsdale Resort & Spa at Montelucia
Jurlique Spa Firesky Resort & Spa
Trefoil Therapies Orange Tree Golf Resort
Revive Spa Desert Ridge Marriott
Running Water Spa Scottsdale Camelback Resort
the Saguaro Spa Saguaro Hotel
The Salon & Day Spa Scottsdale Plaza Resort
The Sanctuary Spa Sanctuary Resort on Camelback
Spa Scottsdale Villa Mirage
Spa Scottsdale Links Resort
Spa at the Four Seasons Four Seasons Resort
Spa Avania Hyatt Regency Scottsdale
The Spa Carefree Resort & Villa
The Spa at CopperWynd CopperWynd
The Spa at Gainey Village Gainey Suites
The Spa Marriott Camelback Inn
The Spa at Talking Stick Talking Stick Resort
VH Spa Hotel Valley Ho
Well & Being Spa Fairmont Princess Resort
Source: Scottsdale Convention and Visitor's Bureau; Tourism and Events Department
2015 Lodging Statistics Report - City of Scottsdale 29
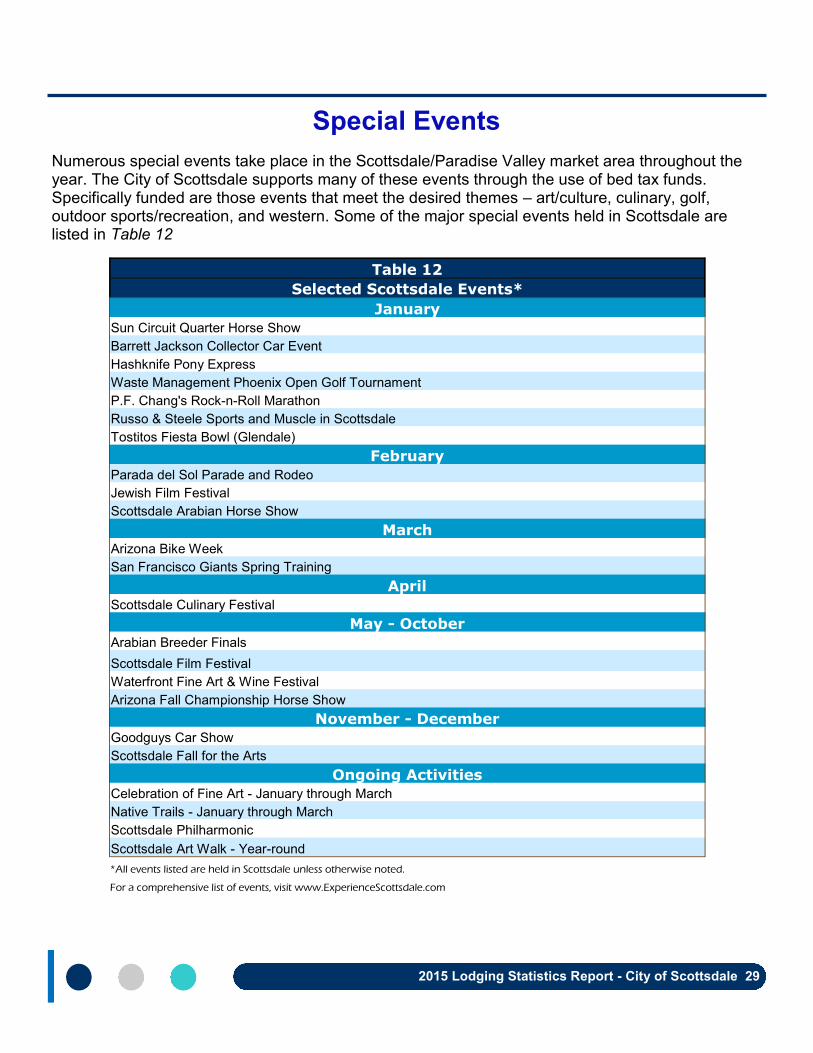
Numerous special events take place in the Scottsdale/Paradise Valley market area throughout the year. The City of Scottsdale supports many of these events through the use of bed tax funds. Specifically funded are those events that meet the desired themes – art/culture, culinary, golf, outdoor sports/recreation, and western. Some of the major special events held in Scottsdale are listed in Table 12
Special Events
Table 12
Selected Scottsdale Events*
January
Sun Circuit Quarter Horse Show
Barrett Jackson Collector Car Event
Hashknife Pony Express
Waste Management Phoenix Open Golf Tournament
P.F. Chang's Rock-n-Roll Marathon
Russo & Steele Sports and Muscle in Scottsdale
Tostitos Fiesta Bowl (Glendale)
February
Parada del Sol Parade and Rodeo
Jewish Film Festival
Scottsdale Arabian Horse Show
March
Arizona Bike Week
San Francisco Giants Spring Training
April
Scottsdale Culinary Festival
May - October
Arabian Breeder Finals
Scottsdale Film Festival
Waterfront Fine Art & Wine Festival
Arizona Fall Championship Horse Show
November - December
Goodguys Car Show
Scottsdale Fall for the Arts
Ongoing Activities
Celebration of Fine Art - January through March
Native Trails - January through March
Scottsdale Philharmonic
Scottsdale Art Walk - Year-round
*All events listed are held in Scottsdale unless otherwise noted.
For a comprehensive list of events, visit www.ExperienceScottsdale.com