The ScottMadden ENERGY INDUSTRY UPDATE · technologies can provide, but classifying it according to...
45
ENERGY NEITHER FISH NOR FOWL The ScottMadden INDUSTRY UPDATE Volume 16 - Issue 1
Transcript of The ScottMadden ENERGY INDUSTRY UPDATE · technologies can provide, but classifying it according to...

ENERGY
NEITHER FISH NOR FOWL
The ScottMadden
INDUSTRYUPDATE
Volume 16 - Issue 1

SCOTTMADDEN, INC. | 2
Energy Practice: ScottMadden Knows Energy 45
Executive Summary
Mergers & Acquisitions: Picking Up the Pace
4
View from the Executive Suite
What Is a Utility?
5-6
8-9
Rate and Regulatory Issues
Cybersecurity and IT/OT Convergence
31-32
Hawaii and Texas: What Utility Executives Learned From a Solar “Hot Spot” and One That Could Be
Infrastructure and Technology
Electric Vehicles: On the Cusp of Change
Renewable Energy Tax Credit: Extension Passed by Congress
36-38
Clean Tech and Environment
Wholesale Power Markets: How Are Adaptations Faring?
40-41Can the Future Come Fast Enough for Nuclear?
44
Energy Supply, Demand, and Markets
Clean Power Plan: An Unprecedented Stay of the EPA Rule
Energy Storage: Looking at Both Poles of the Battery (+ & -)
A Once-in-a-Lifetime Transformation of the Nation’s Power Generation Fuel Mix
Grid Transformation: Paths to the Future Diverge
FERC Jurisdiction: A Blurry, Not Bright, Line
10-11
20-22
12-13
26-30
15-17
33-34
TABLE OF CONTENTS
23-24LNG Exports: Supply to Outpace Demand…for Now
Decentralized Generation: By the Numbers
39
Recent Insights: Available at scottmadden.com
42-43
18-19

SCOTTMADDEN, INC. | 3
VIEW FROM THE EXECUTIVE SUITE

SCOTTMADDEN, INC. | 4EXECUTIVE SUMMARY
The energy industry is in a period of transition. Distributed resources, like rooftop solar photovoltaics, are taking hold. Non-traditional players are increasingly involved in energy-related endeavors. Natural gas remains cheap, which along with proposed environmental regulations and other mandates, is prompting changes in the power generation mix. Regulation and business models are evolving, too, as traditional utility roles and functions are being reconsidered. Thus, stakeholders are acting and reacting to technology, regulation, and operating models that are sometimes “neither fish nor fowl.”
Neither fish nor fowl (phrase): of indefinite character and difficult to identify or classify; like one thing in some ways and like another thing in other ways
Neither Fish Nor Fowl
Blurring Operating Boundaries
Blurring Technology Boundaries
• Roles and responsibilities that were the exclusive province of utilities are being assumed (or at least impacted) by new utility-related energy services such as distributed generation (largely solar photovoltaics) and microgrids. Critical questions remain, though, such as who is responsible for reliability?
• Operating technology and information technology are merging with increasingly ubiquitous digital systems, leading firms to seek converged cybersecurity solutions
• Energy storage is of increasing interest and proponents advocate looking at the multiple value streams that some storage technologies can provide, but classifying it according to the traditional power system rubric of generation, transmission, or distribution is proving tricky
• Gas-fired generation and utility-scale renewables continue to grow and are the nation’s shifting power supply portfolio. Influencing this trend is the still uncertain legal outcome of the Clean Power Plan
Blurring Regulatory Boundaries
• Frictions at the regulatory boundaries of each of the Federal Energy Regulatory Commission, the U.S. Environmental Protection Agency, and state regulators are having legal ramifications, as energy industry stakeholders seek to determine their limits—and the rules of the road—in “seams” areas such as wholesale power markets, emissions regulation of power generators, and demand response compensation
Some Highlights of This ScottMadden Energy Industry Update
Neither Fish Nor Fowl

SCOTTMADDEN, INC. | 5
NOTES:*Figures represent total transaction values (including assumed debt) based on year announced. ROE means return on equity.
MERGERS & ACQUISITIONS: PICKING UP THE PACE
Low interest rates, rising importance of natural gas, and a search for growth sends energy companies shopping.
Value of Announced Gas Utility and Power Corporate Acquisitions by Region*
(in $ Millions) (2010-2015)
$ M
illi
on
s
2010 2014201320122011 2015
Undesignated/Multi-Region
West
Southwest
Southeast
Northeast
Midwest
Mid Atlantic$0
$50,000
$40,000
$30,000
$20,000
$10,000
$60,000
$32,559
$55,313
$7,699
$18,254
$38,183
$53,779
Undesignated/Multi-Region
West
Southwest
Southeast
Northeast
Midwest
Mid Atlantic
Nu
mb
er
of
De
als
2010 2014201320122011 20150
2
4
12
10
8
6
14
Historical Deal Count by Target Region(2010-2015)
1211
5
9 9
7
We continue to believe that additional convergence mergers will be announced in 2016. In addition to pursuing local gas distribution utilities, we would not be surprised if an electric company (or two) were to pursue a natural gas pipeline company.
– Michael Worms, BMO Capital Markets
Source: SNL Financial
Source: SNL Financial
Convergence Is the Word; Rate Base Investment Is the Melody
• Energy companies face organic growth headwinds, including low usage growth, falling allowable ROEs, and compressed wholesale margins. In this environment, acquisition continues to be an appealing growth strategy (see charts at right)
• Major acquisitions have been announced since Spring 2015, with seven significant transactions (totaling nearly $50 billion) involving natural gas distribution properties:
• For Southern and Duke, natural gas infrastructure platforms (given the shift from coal to gas) and territory overlap were attractive features of their prospective partners
• Along with geographic and/or business mix diversification, growth through infrastructure investment was cited as a main driver for these combinations
› Regulated, rate base growth opportunities › Incremental capex through infrastructure replacement
programs, pipeline expansions, and investment in midstream and storage
› Southern Co./ AGL Resources
› Duke Energy/Piedmont
› Black Hills/SourceGas
› Emera/TECO Energy › Dominion/Questar › Fortis/ITC Holdings › Algonquin/Empire
District Electric

SCOTTMADDEN, INC. | 6
MERGERS & ACQUISITIONS: PICKING UP THE PACE
What’s Next for M&A?
• Regulatory hurdles, especially ratepayer relief and “home rule” concerns may continue to pose hurdles to completing transactions, as evidenced by proceedings in Exelon/Pepco and NextEra/Hawaii Electric deals
• Opportunistic acquisitions of upstream (and perhaps midstream) gas companies by players with strong balance sheets and patient capital may come. Low oil and gas prices continue to stress those sectors
• Rumors are mounting among investors about potential targets of interest: smaller electric utilities, large midstream/local gas distribution company players, and others conducting “strategic assessments”
• Price-earnings multiples for utility acquisitions in 2015 were generally higher than those seen in 2013 and 2014 (see chart below). According to UBS, implied 2017 P/E valuations for recent utility transactions have been over 20x compared to a regulated peer group trading at 14x to 16x. Some observers and industry executives expect those valuations to moderate in 2016. However, some investment bankers claim high premiums will continue as the number of potential dance partners thins out
NOTES:Deals shown include whole gas and electric utility (excluding minority share purchases) corporate deals >$50 million by date announced. Excluded from these are MLP and midstream transactions.SOURCES:Industry news; SNL Financial; UBS; BMO Capital Markets; ScottMadden analysis
High Premiums: Earnings Per Share Multiple of Selected Deals(2010-2016)
Eari
ng
s P
er
Sh
are
Mu
ltip
le
2010 20152014201320122011 20160
35
30
25
20
15
10
5
40
Fortis/ITC
Algonquin/EDE
Hunt/OncorDuke/Piedmont
Emera/TECO
Iberdrola/UIL Holdings
Southern Co./AGL
NextEra/Hawaiian Electric
WEC/Integrys
Investor group/Cleco
Exelon/Pepco
Fortis/UNS
Berkshire Hathaway/NV Energy
Fortis/CH Energy
AES/DPL
Duke/Progress
Gaz Métro/Central Vermont Public Service
ETE/Southern Union
FirstEnergy/Allegheny
AGL/Nicor
Emera/Maine & Maritimes
Dominion/Questar
Sources: SNL Financial; ScottMadden analysis

SCOTTMADDEN, INC. | 7
RATE AND REGULATORY ISSUES

SCOTTMADDEN, INC. | 8WHAT IS A UTILITY?
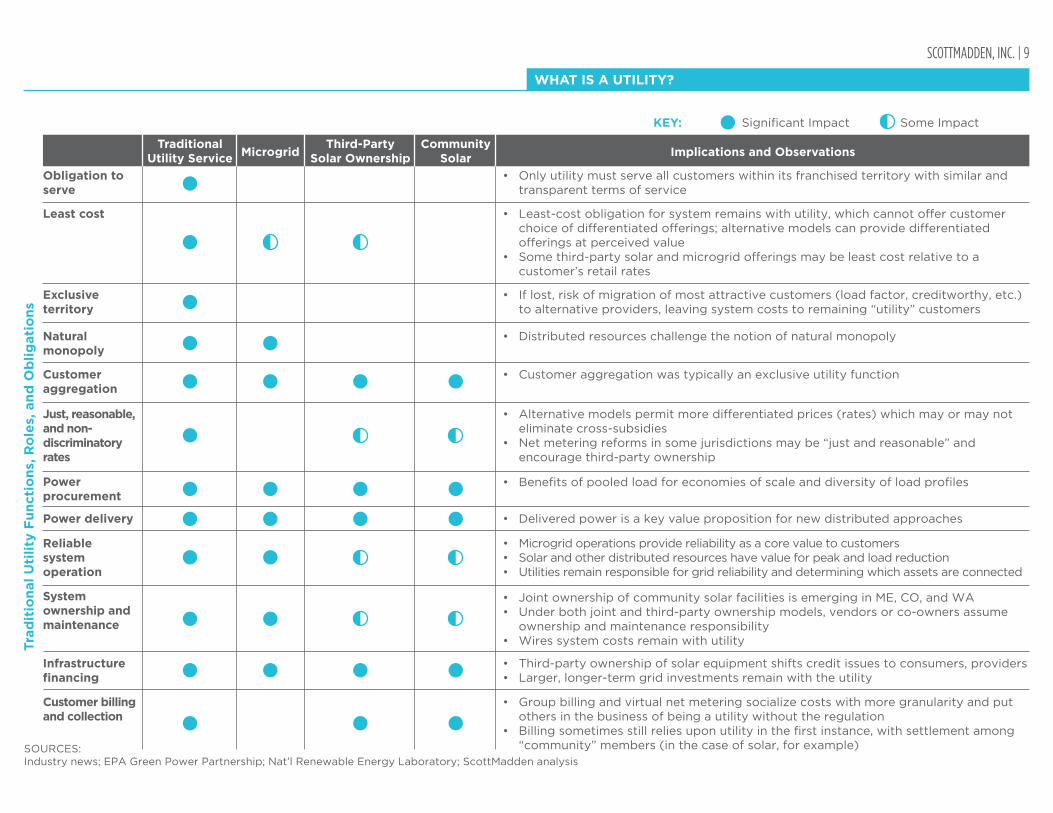
For years, electric utilities have had a special role in providing electricity to consumers, an exclusive franchise territory, and an obligation to serve all customers at reasonable rates. With the advance of distributed approaches to energy production and delivery and a DIY ethos, some utility functions are being assumed by customers and “non-utilities.” However, this splintering of responsibilities has implications both for consumers and utilities.
MicrogridE.g., Princeton University’s hybrid (islanded or connected)
• Generates power when prices are high, permitting lower consumption from traditional utility in high-demand periods• Bids into PJM ancillary markets• Islands from grid during emergencies
• Third-party developer owns, operates, and maintains the photovoltaic (PV) system• Host customer agrees to site the system on its roof or property and leases the system or purchases the electric output from
the developer for a predetermined period• Developer or another party acquires valuable financial benefits such as tax credits and income generated from the lease or
sale of electricity to the host customer
• A community solar project often includes multiple end users or subscribers purchasing a portion of the capacity or output from a solar PV facility and receiving the benefit on their electric bill
• “Up-front payment” programs require customers to purchase or lease panels; “on-going payment” programs require customers to provide monthly payments to access solar capacity or output
• Depending on program design, customer receives retail or partial retail bill credit for actual or guaranteed system output• Customers often pay a premium for solar output but receive hedge against future rate increases as costs are often locked in
for the duration of the contract
Third-Party Solar OwnershipE.g., SolarCity Model
Community Solar
Some New Energy Delivery Models That Encroach On Functions of Traditional Utility Service Functions and Its Special Role:
SCOTTMADDEN, INC. | 9
WHAT IS A UTILITY?
Obligation to serve
• Only utility must serve all customers within its franchised territory with similar and transparent terms of service
• Least-cost obligation for system remains with utility, which cannot offer customer choice of differentiated offerings; alternative models can provide differentiated offerings at perceived value
• Some third-party solar and microgrid offerings may be least cost relative to a customer’s retail rates
Least cost
• If lost, risk of migration of most attractive customers (load factor, creditworthy, etc.) to alternative providers, leaving system costs to remaining “utility” customers
Exclusive territory
• Distributed resources challenge the notion of natural monopolyNatural monopoly
• Customer aggregation was typically an exclusive utility functionCustomer aggregation
Implications and ObservationsTraditional
Utility Service MicrogridThird-Party
Solar OwnershipCommunity
Solar
Just, reasonable, and non-discriminatory rates
• Alternative models permit more differentiated prices (rates) which may or may not eliminate cross-subsidies
• Net metering reforms in some jurisdictions may be “just and reasonable” and encourage third-party ownership
• Benefits of pooled load for economies of scale and diversity of load profilesPower procurement
Significant Impact Some Impact
Tra
dit
ion
al
Uti
lity
Fu
ncti
on
s, R
ole
s, a
nd
Ob
lig
ati
on
s
• Delivered power is a key value proposition for new distributed approachesPower delivery
• Microgrid operations provide reliability as a core value to customers• Solar and other distributed resources have value for peak and load reduction• Utilities remain responsible for grid reliability and determining which assets are connected
Reliable system operation
• Joint ownership of community solar facilities is emerging in ME, CO, and WA• Under both joint and third-party ownership models, vendors or co-owners assume
ownership and maintenance responsibility• Wires system costs remain with utility
System ownership and maintenance
• Third-party ownership of solar equipment shifts credit issues to consumers, providers• Larger, longer-term grid investments remain with the utility
Infrastructure financing
• Group billing and virtual net metering socialize costs with more granularity and put others in the business of being a utility without the regulation
• Billing sometimes still relies upon utility in the first instance, with settlement among “community” members (in the case of solar, for example)
Customer billing and collection
KEY:
SOURCES:Industry news; EPA Green Power Partnership; Nat’l Renewable Energy Laboratory; ScottMadden analysis

SCOTTMADDEN, INC. | 10GRID TRANSFORMATION: PATHS TO THE FUTURE DIVERGE
As distributed energy resources proliferate, different jurisdictions and utilities therein are taking different approaches to adapting the traditional regulatory construct.
Laissez Faire to Radical Redesign: A Continuum of Responses
Key Questions
Pure Dereg Market Business Model RedesignNet Metering Pilot Programs Grid Modernization
Area
Stakeholders
Questions
• Who gets a say?• For what issues?
• What resources will be where, when?• How do I know it will be reliable?
System Planning
Operations • Who operates what, where, when, and how?• What’s actually out there anyway?
• How do we price the products we offer?• What are customers willing to pay?
Pricing
Regulatory • What are the rules?• How and when will they change?
• How does the utility make money?Revenue Generation
Customers • What do they really want?• What services?• How much control?• How much information?
Market Decides• Market determines
products; economics is king
Pay for DG• Customers get paid for net
excess generation • Rates differ (full retail,
avoided cost)• Alternatives (value of solar)
Try Some Things…• Investigation of alternatives• Focus areas include:
› Solar › Battery storage › Electric vehicles › DG
Upgrade for the Future• Upgrade T&D for current
and future needs• Integrate distributed
resources
Change the Game• Distributed system
operators• Expand revenue streams• Enable “transactive”
marketplace
LEAST CHANGE MOST CHANGE
Texas 45 States* and D.C.
Maryland, New Hampshire,
and Virginia MassachusettsNew York, California,
and Hawaii
NOTES:*Includes 4 states with statewide DG compensation rules other than net metering.

SCOTTMADDEN, INC. | 11
NOTES:*Some states fall into multiple categories, but for simplicity, we’ve assigned them to one category to illustrate approaches being used. Even within categories, approaches may differ, e.g., HI, CA, and NY diverge significantly in approach to, and degree of, business model redesign. DG means distributed generation; IOUs means investor-owned utilities; ROE means return on equity; DER means distributed energy resources; DPU means Massachusetts Department of Public Utilities; AMI means advanced metering infrastructure; ROR means rate of return; EE means energy efficiency.SOURCES:Industry news; ScottMadden analysis
Some examples by state:Texas• Complete wholesale deregulation for IOUs (wires companies that earn
an ROE on T&D)• Retail energy service providers create products that customers will buy
in IOU territories; mainly compete on price with limited DER offerings currently
Minnesota• Customers with qualifying facilities <1 MW at IOUs are eligible• IOUs cannot place a standby charge on net-metered facilities with a
capacity of 100 kW or less• Net excess generation (NEG) of customers with systems less than 40
kW compensated at “average retail utility energy rate”• Systems ≥40 kW but <1 MW, NEG is credited at the avoided cost rate
Virginia• Dominion launched a Community Solar Pilot program and experimental
rate rider to enable voluntary customer purchases of 100-kWh blocks of solar generation from a company-owned 2-MW solar facility
• Rate will be used to gather information about the “effects and benefits” to its distribution systems of subscription-based DG
Massachusetts• In mid-2014, DPU orders IOUs to develop 10-year grid modernization
plans along with time-varying rate proposals• In Aug. 2015, IOUs submitted plans focused on distribution-side
improvements, including AMI, improved distribution control, and flexibility to accommodate more DERs
CaliforniaMaintaining basic ROR construct but:• Requiring distribution resource plans (for DER-friendly grid investment)• Implementing policies to promote DER, e.g., loading order (EE/DER
first; central station generation last), solar initiative and DER programs (rebates), and storage mandate (1.325 GWs by 2020)
• Implementing structural measures to facilitate DER, including interconnection rules and long-term resource procurement
Pure Dereg Market
Five Selected Examples of State Grid Tranformation Activity*
Net Metering
Pilot Programs
Grid Modernization
Business Model Redesign
GRID TRANSFORMATION: PATHS TO THE FUTURE DIVERGE

SCOTTMADDEN, INC. | 12FERC JURISDICTION: A BLURRY, NOT BRIGHT, LINE
The Battlefront
Challenger’s Arguments
• Power generators challenge FERC Order 745, which requires wholesale market operators to pay the same compensation to demand response (DR) providers for conserving energy as paid to generators for producing it—implicit in these arguments is yet another regarding the increasingly hazy line between transmission (FERC) and distribution (states) jurisdictions resulting from the growing impacts of DERs (including DR)
• DR is an inherently retail activity, subject to the ratemaking authority of the states, not FERC
• DR has effect of “luring” retail customers into the wholesale markets and driving down compensation for “steel in the ground” projects
• If allowed to “affect” retail prices, a limiting principle may be hard to find – e.g., why couldn’t FERC regulate net metering?
• DR-induced avoidance of consumption is not a “sale of energy for resale” as typically characterized wholesale (FERC-jurisdictional) power
FERC, the states, and the EPA are pushing and testing the boundaries of their traditional jurisdictions to pursue their respective policy priorities. Border skirmishes ensue.
• Maryland and New Jersey authorize long-term contracts with power plant developers that guarantee a fixed price
• Factual debate over whether Maryland required those developers to bid in PJM capacity auction
• Guaranteed price to developer alters bidding behavior and undermines FERC-approved mechanism in PJM to set capacity and energy prices
• If a generator would get the guaranteed price only if it cleared PJM’s auction (and mitigate the state’s financial obligation), generator could bid low to ensure the assets in question cleared the PJM auction
• Artificially low prices affect efficiency of market because price signals for development are not fully seen by market participants
• EPA releases Clean Power Plan (CPP) with limited consultation with FERC
• “Building blocks” include resource and performance standards (more renewables, higher plant utilization rates, move to gas) and timeline that may impact reliability
• EPA’s “best system of emissions reduction” under the CPP goes beyond the fence line, attempting to regulate the bulk power system, not just the emitter, and encroaching on FERC’s jurisdiction
• As a result of CPP, state air regulators may make significant decisions that state utility commissioners have made for decades
Demand Response Compensation
Power Generation Markets and Price Formation
Environmental Regulation of Power Sector
Three Playing Fields for Contested Jurisdiction

SCOTTMADDEN, INC. | 13
SOURCES:Industry news; law firm newsletters; Energy Bar Journal; SCOTUS blog; ScottMadden analysis
The Outcome(or What’s Next)
• U.S. Supreme Court upheld FERC’s DR pricing order, FERC can regulate wholesale markets and other matters “directly affecting” wholesale rates even if this “affects—even substantially—the quantity or terms of retail sales”
• States still have authority to ban or limit customer participation in DR—the remaining blurriness was acknowledged by the Justices who deferred to the “inextricably linked” nature of the wholesale and retail markets
• The U.S. Supreme Court recently threw out the Maryland program that incentivized new in-state power generation, finding it intruded on FERC’s jurisdiction over wholesale energy markets. But its holding was narrow, focusing on the requirement of capacity having to clear auction, and it did not preclude all state generation incentive programs
• The decision will have implications for a similar New Jersey case, as well as a recent Ohio PUC ruling (see below)
• About half of the states, and others subject to the rule, have challenged the CPP while 18 states and tens of corporations (e.g., Apple, Amazon, Google) have filed in support
• U.S. Supreme Court stayed enforcement of CPP in an unprecedented ruling, but it is unclear whether it will be tolled or compliance deadlines will remain in place
• D.C. Circuit will review the case in June with decision due in fall 2016 and certain appeal to the U.S. Supreme Court
Proponent’s Arguments
• FERC has jurisdiction over wholesale power markets, and DR rules directly affect those markets (a negawatt = a megawatt) and FERC’s jurisdictional mandate of “just and reasonable” rates
• Per the U.S. Supreme Court: DR is not a FERC “power grab” but a “market generated innovation for more optimally balancing…supply and demand,” aimed at holding down prices and enhancing reliability in peak periods, within FERC’s purview
• Challenges to this state approach open door for attack on any state-directed mechanism to assure adequate generation capacity
• State authority over resource adequacy and reliability was not preempted by the Federal Power Act
• Market mechanisms were not working: volatile capacity prices were not encouraging generation in a particularly reliability-challenged area
• FERC, EPA, and other agencies can collaborate and coordinate on significant rulemakings like the CPP, and EPA has proposed such collaboration for a reliability safety valve and review of state plans for reliability issues
• EPA regulatory authority over CO2 is
not dissimilar to its jurisdiction over SO2
and thus has been accommodated by overlapping FERC jurisdiction
Demand Response Compensation
Power Generation Markets and Price Formation
Environmental Regulation of Power Sector
Three Playing Fields for Contested Jurisdiction
Ohio Tests Generation Support
• The Public Utilities Commission of Ohio (PUCO) on March 31 unanimously approved modified, yet controversial eight-year subsidy plans from AEP Ohio and FirstEnergy Corp.'s (FE) utilities designed to guarantee income for primarily coal-fired generation
• Commissioners cited the challenges utilities face due to low prices and decreasing demand and, through a contract for differences, the need for safe, reliable, and cost-effective electric services
• FERC rescinded market-based rate waivers tied to power sales restrictions for AEP and FE by the end of April and Wall Street predicts similar rejections of the PUCO-approved PPAs in the coming months
FERC JURISDICTION: A BLURRY, NOT BRIGHT, LINE

SCOTTMADDEN, INC. | 14
INFRASTRUCTURE AND TECHNOLOGY

SCOTTMADDEN, INC. | 15HAWAII AND TEXAS: WHAT UTILITY EXECUTIVES LEARNED FROM A SOLAR “HOT SPOT” AND ONE THAT COULD BE
Utility leaders, the Smart Electric Power Alliance (SEPA), and ScottMadden visited the states and got insights from the key players.
Why Examine Renewables in Hawaii and Texas?
• SEPA and ScottMadden hosted senior utility executives on fact-finding missions to Hawaii in September 2015 and to Texas in November 2015
• The trips explored how the electric grid accommodates high penetrations of renewables (Hawaii) and the impact of the role of solar in a competitive market with retail choice (Texas)
Understanding Hawaii: Microgrids in the Pacific
• Lacking interconnections, each island must be energy self-sufficient. Driven by expensive oil, retail electricity prices average more than 25¢/kWh, double the U.S. average
• Spurred by high electricity prices, non-hydro renewables have grown rapidly and accounted for 16% of electric generation in 2014. In addition, growth of customer-sited solar continues to reduce average daily load during midday periods (see chart)
Texas Two-Step: Public Power Versus Competitive Retail
Texas consists of two distinct energy markets (see map)• Served by 140 providers, municipal and cooperative utilities
account for 25% of ERCOT load. The utilities provide full retail service and have an ability to innovate to meet policy goals
• The competitive market is driven more by near-term economics. Served by 110 registered retail electric providers; competitively served retail deregulated markets account for 75% of ERCOT load
2014201220102008
Me
gaw
att
s
Hawaii Average Daily Load: Signs of a “Duck Curve”(2008-2014)
0:00 22:0020:0018:0016:0014:0012:0010:008:006:004:002:00600
1,000
800
1,200
A Patchwork: Texas End-Use Electric Territories by Provider Type
Competitive Retail Area
Municipality Owned Utilities and Electric Co-Ops *Shading and coloration for illustrative purposes
Sources: SNL Financial; ScottMadden analysis
Source: Texas Solar Power Association
In 2015, Texas installed 207 MW of solar electric capacity, ranking it ninth nationally. The 537 MW of solar energy currently installed in Texas ranks the state tenth in the country in installed solar capacity. In 2015, $372 million was invested on
solar installations in Texas. This represents a 48% increase over the previous year and SEIA expects
it to grow again this year.

SCOTTMADDEN, INC. | 16
Postcards from the Future: Distributed Generation Lessons from Hawaii
• As distributed and renewable energy choices become widely affordable and accessible in Hawaii, the status quo in the electricity market changed quickly
• This experience is often described as the “postcard from the future” as trip participants agreed that, despite market differences, mainland utilities could see similar shifts in utility, solar industry, and regulatory mindsets someday in the future
• However, mainland utilities and regulators can prepare by focusing on customer expectations and new ways to manage the grid
Area
Operational and Technical Issues
Key Observations and Lessons for Mainland Electric Utilities
Observations Key Lessons
• Reverse power flows are now normal on the distribution grid• Grid has not collapsed but requires more refined system
planning, detailed analytics, and new technology (e.g., advanced inverters)
• Expect that the grid can take more• Technical issues are challenging but not
impossible to solve with the right economics and regulatory environment
Customer and Stakeholder Relations
• Interest in reducing electricity bills drove customers to distributed solar
• Slow regulatory and planning processes hampered utility responses, including processing interconnection requests
• Utility responses need to align with customer desires while ensuring system improvements, if needed
• Utilities can lead the conversation—and should
• Recognize that market drivers can easily outpace regulatory and utility-planning cycles
• Do not underestimate customers’ off-grid options• Establish trust between stakeholders through two-way
communication• Be the enabler of solutions by saying “yes, with...”
Leadership and Managing Change
• Interconnection response rates led to customer and regulatory frustration
• Situation required utility to have a focused vision for moving forward
• Utility must have internal alignment before being able to partner with service providers, test new technologies, and respond to customer needs
• Anticipate change and get ahead of it before it overwhelms you• Ensure that leaders and all parts of the organization speak with one
voice. Internal alignment is crucial• Establish checkpoints and milestones. Don’t strive for perfection:
iterate and improve
FROM:The Future
Here are some things we’ve learned...
HAWAII AND TEXAS: WHAT UTILITY EXECUTIVES LEARNED
Change is coming and you can look to Hawaii to get ideas. There is great opportunity for an electric utility to play a vital role, but if you live in the past,
you won’t be part of the future.-Utility Executive

SCOTTMADDEN, INC. | 17
Fact-Finding Mission Discovers Early Solar Innovation and Significant Long-Term Potential
• The offering of full retail service to customers has allowed municipal and cooperative utilities to emerge as distributed energy resource innovators in Texas
• The combination of retail and wholesale restructuring has been unique in Texas—with an energy-only market and munis and co-ops exempt from retail choice—and the ongoing deployment of solar will be subject to its relative competitiveness with other resources
• Technical and program implementation challenges are very real, but stakeholders have the time and ability to figure them out
Economics and Resolving Technical Issues Will Be Critical Moving Forward
• Consumers and retail energy providers are subject to long-term price uncertainty in the competitive retail market. If the economics of utility-scale solar continue to improve, solar may be able to follow the example and success of Texas wind
• If economics improve, utility-scale solar development would likely occur in the western portion of Texas, where less cloud cover allows a 30% to 50% increase in solar production
• Solar can put new strain on distribution system infrastructure. Distributed energy resource deployment, such as smart inverters and batteries, can offer solutions but are not yet cost effective
Municipal and cooperative utilities meet customer demand with innovative solar programs.
In 2013, Austin Energy served 4% of Texas residents, yet accounted for 30%
of Texas’ solar capacity.
SOURCES:Austin Energy; CPS Energy; Georgetown Utility Systems; SEPA; ScottMadden
Austin Energy
CPS Energy
• Goal to meet 65% of energy with renewable resources by 2025, including 750 MW utility-scale solar and 200 MW local solar (half of which should be customer-sited PV)
• Shifted from net metering to value of solar payment which attempts to quantify value at which the utility is “neutral” to paying for locally generated PV
• Signed multiple utility-scale solar PPAs totaling more than 400 MW• Community solar project with storage integration under development
• CPS Energy pays a host fee to customers to allow developers to install solar on rooftop; developer owns panels and sells power to CPS Energy
• “Roofless” solar allows customers to own panels and receive bill credit from utility-scale system• Solar activity has driven economic development with multiple solar and smart grid companies committing to locate jobs in the
community or support education initiatives
Georgetown Utility Systems • City of Georgetown moving to 100% renewables thanks to storage and active scheduling through ERCOT• Utility will buy double their energy needs through:
› 144 MW wind PPA with EDF: 20-year fixed price; operations began in 2015 › 150 MW solar PPA with SunEdison: 25-year fixed price; operational before Jan. 2017
Utility Notable Solar Activity
HAWAII AND TEXAS: WHAT UTILITY EXECUTIVES LEARNED

SCOTTMADDEN, INC. | 18
Batteries, supercapacitors, flywheels, etc.
Batteries, pumped hydropower storage, CAES/
LAES, thermochecmical, redox flow, etc.
Sensible/latent thermal, PtG, etc.
ENERGY STORAGE: LOOKING AT BOTH POLES OF THE BATTERY (+ & -)
What is the value of energy storage, and what is it anyway—generation, distribution, transmission, or something else?
Tsunami Waiting to Happen
• Energy storage capacity continues to grow, adding 221 MWs in 2015, with 112 MWs coming in Q4 alone. One forecaster anticipates that installed storage capacity will cross the 1-GW threshold in 2019
• California is a significant market for storage, much driven by its state mandate (1,325 MWs by 2020). While it added only about 60 MWs since 2013, it has 3.5 GWs in the interconnection queue for 2016–2018
• While behind-the-meter installations have grown, most of the significant activity expected in the near term are front-of-meter installations pursuant to utility solicitations and providing ancillary services and similar support
Much Talk About Cost, But What About Value?
• Levelized cost of storage is a useful barometer of its economics, but increasingly, value is seen in storage for capacity and ancillary services rather than solely for energy applications
• Critical to economic success of storage is the potential for multiple revenue streams such as capacity, regulation service, and energy price arbitrage
• Industry stakeholders have commented on the need to develop common performance specifications for different storage use cases
Source: World Energy CouncilSource: GTM Research
Different Technologies Offer Different Applications for Storage
“Seconds to Minutes” Short-term energy storage systems
E2P ratio: 0-.25h
“Daily Storage” Medium-term energy storage systems
E2P ratio: 1-10h
“Weekly to Monthly” Long-term energy storage systems
E2P ratio: 50-500h
NOTES:E2P ratio is energy-to-power ratio or discharge time; CAES is Compressed Air Energy Storage; LAES is Liquid Air Energy Storage; PtG is power-to-gas.
Duration and frequency of power supply
• Grid services• Compensation for day-night
load imbalance• Peak shaving, valley filling,
load shifting• Correction of forecast errors
of renewable producers• Prevention of re-dispatch• Opportunity of spot market
price fluctuations
• Future application to bridge periods of low wind and photovoltaic generation
• Seasonal storage for thermal energy
California Dreamin’: The Golden State’s Energy Storage Goals
Currently in Queue: 3,500 MWs
Target: 1,325 MWs
Current: 60 MWs

SCOTTMADDEN, INC. | 19
SOURCES:World Energy Council; Lazard; Midcontinent ISO; RTO Insider; Moody’s Investors Service; Energy Storage Ass’n; Greentech Media; industry news; ScottMadden analysis
“Neither Fish Nor Fowl”
• Independent system operators, spurred by FERC rules such as Order 755, are making strides in incorporating storage into tariffs and operations. But technologies are heterogeneous, and classifying resources under current wholesale constructs has been problematic
› For example, short-term storage (flywheel, battery)—for frequency regulation, blackstart, and reactive supply and voltage control—has qualified under MISO’s tariff since 2009
› But under current rules, medium-term storage (battery, thermal storage) that can provide 4+ hours of power does not qualify as capacity, energy, or reserves
› Moreover, depending upon application, storage eludes clear categorization as a generation or transmission resource, which affects how it is compensated. But in some cases, storage could serve dual roles such as frequency regulation and demand-charge reduction
Chart Courtesy of California ISO; Moody’s Investor Service
Perhaps “Fowl”: In the Belly of the Duck Curve
• As distributed energy resources, particularly solar PV, make their way onto the grid, storage is seen as a potential partner to help moderate the rapid declines and increases in load during peak hours accompanying high solar production
• Battery storage might be used for both energy injection (e.g., demand response) and withdrawal (e.g., dispatchable load)
• According to Moody’s, this could help pull up the belly of the duck curve (above) during the day and flatten the neck. This could trim capacity prices and possibly lower some generators’ profit margins
ENERGY STORAGE: LOOKING AT BOTH POLES OF THE BATTERY (+ & -)
Tough to Classify:Determining a Category for Storage under Traditional Energy Value Chain
???
Illustrative Net Load – March 31 (California ISO)

SCOTTMADDEN, INC. | 20CYBERSECURITY AND IT/OT CONVERGENCE
A December 2015 Ukrainian power outage demonstrated how a cyber attack on an electric utility might unfold. The attack targeted utilities’ operational technology (OT), including an operator’s ability to monitor power flow. This demonstrates utilities’ need to include OT, along with information technology (IT), within their enterprise cybersecurity programs.
When compared with previous industrial revolutions, the Fourth Industrial Revolution [cyber-physical systems] is evolving at an exponential rather than a linear pace. Moreover, it is
disrupting almost every industry in every country. And the breadth and depth of these changes herald the transformation of entire systems of production, management, and governance.
-World Economic Forum
IT and OT Have Historically Been Distinct
• IT and OT have had distinct asset types, fulfilling distinct missions, managed by distinct organizations
• Corporate IT was responsible for the IT that supported corporate users, back office, and customer support functions
• Engineers supported the OT that supported generation, transmission, and distribution operations
• IT assets were commodity and open technologies, while OT assets were proprietary, often unchanged over years or decades
• IT priorities were generally related to the confidentiality of data, while OT priorities were focused on availability of systems
Recent Developments Are Challenging This Model
• OT systems are moving toward standard and commodity technology platforms (IP networks, Windows, etc.)
• New technologies (e.g., Internet of Things, mobility, cloud) are creeping into operating environments, providing monitoring, data collection, and asset and work management capabilities
• Real-time energy trading, demand response requirements, and grid transformation technologies have forced integration of IT and OT systems
• IT and OT are no longer independent actors; they are converging
IT/OT Convergence: A Macro Trend
There Have Been Differences in Security Priorities: IT vs. OT
IT focused here: Customer, employee, operational data, and intellectual property
OT focused here: Safety and reliability
CONFIDENTIALITY
INTEGRITY AVAILABILITY
SECURITY TRIAD

SCOTTMADDEN, INC. | 21
CYBERSECURITY AND IT/OT CONVERGENCE
Learning from Ukraine: A Cautionary Tale
Key Challenges to IT/OT Convergence
• Cultural/political: Finding common ground between IT and OT organizations has proven difficult (cats and dogs); each has its own perspectives on priorities and practices and struggles to reconcile these perspectives
• Technical: Even though the technology is converging, there are still differences in the system environments and tolerance requirements that prevent one-size-fits-all technologies and tools from being used throughout the enterprise
• Workforce: The nature of these systems requires knowledge of both current technologies and older, even outdated, technologies; organizations need to balance these competing priorities so they can continue to maintain critical systems, while not ignoring the benefits that new technologies can provide
• Security: Moving OT toward more current technologies introduces security risks; one of the unintended benefits of operating on dated, proprietary technology is “security through obscurity”—systems that are unique to a certain environment may be less vulnerable because of the special knowledge required to understand how they operate
To support these new developments, a converged cybersecurity model is required, but a number of challenges have slowed progress toward an IT/OT convergence.
My organization effectively manages security risks to information assets, enterprise systems, SCADA networks, and critical infrastructure.
Strongly Agree (9%)
Security Risk Management Confidence:Industry Leaders Speak
Agree (17%)
Unsure (46%)
Disagree (21%)
Strongly Disagree (8%)
Source: Ponemon Institute
How It Happened After installing malware to prevent technicians from detecting the attack in six different utilities, the hackers remotely switched breakers to cut power while simultaneously sabotaging operator workstations and flooding the utilities’ customer-service centers with calls to prevent customers from raising alerts
Lesson Learned Ultimately, the Ukraine outage demonstrates that utilities need to include OT, along with IT, within their enterprise cybersecurity programs
What Happened On December 23, 2015, hackers caused a six-hour outage affecting more than 225,000 customers across eight of Ukraine’s 24 regions
Why It’s Important Experts widely describe the incident as the first known power outage caused by a cyber attack, and specifically the first to target OT networks in addition to the utilities’ enterprise IT networks

SCOTTMADDEN, INC. | 22
Lessons From Successful Companies Addressing Convergence Challenges
• Scope and mandate convergence from the top: Because of the entrenched interests, leadership is required to set direction, monitor progress, and resolve issues that prove irresolvable
• Acknowledge and design for legitimate differences across IT and OT environments: A one-size-fits-all solution will not work, and security practices that may prove successful for an ERP system are not practical for a SCADA system. But that should not prevent moving toward a converged program. It only means that standards need to be robust enough to account for these differences. Leaders need to be able to distinguish between what are legitimate differences and what are simply personal or functional preferences
• Realize that cybersecurity is a journey: Companies should set priorities, establish responsibilities, focus on their biggest risks, and adjust their plans as new information becomes available
• Support efforts with strong project and change management: These changes are not trivial and require project management to execute successfully and change management to address the inevitable resistance that will come
Successful IT/OT convergence requires a strategic enterprise cybersecurity program backed by strong executive leadership and project and change management.
Key program elements: governance and oversight; an appropriate policy framework; cybersecurity functional management; and program implementation capabilities
CYBERSECURITY AND IT/OT CONVERGENCE
Developing a Strategic Cybersecurity Program
• Engage senior leadership in cybersecurity direction setting, decision making, and performance monitoring
• Define enterprise risks and cybersecurity priorities
• Develop and track meaningful measures of progress against priorities
• Tailor program to account for differences between OT and IT assets
• Integrate cybersecurity regulatory compliance into cybersecurity program
Program Implementation ImperativesManagement: Plan, Do, Check, Act
Technology and Automation
Capabilities
Business Processes and Employee
Behavior Changes
Cybersecurity Policies and Controls
EnterpriseRisks
Enterprise Mission and Strategic Objectives
Governance: Evaluate, Direct, Monitor

SCOTTMADDEN, INC. | 23LNG EXPORTS: SUPPLY TO OUTPACE DEMAND…FOR NOW
Cheap natural gas could turn the United States into a major global gas supplier, but concerns remain.
U.S. LNG Exports Set to Launch into a Bust Market
• Beginning of an era: On Feb. 24, 2016, Cheniere shipped the first cargo of U.S. (lower 48) domestically produced natural gas to international markets
• Increasing global supply: U.S. LNG export capacity of ~7.5 BCF/day is expected online by year-end 2018, with more than triple that pending or in pre-filing with FERC; Australia set to increase export capacity more than 70% by 2020 to ~33 BCF/day
• Amid decreasing global demand: Japanese and South Korean LNG imports are down 14.4% and 4.7% respectively year-over-year from 2014 to 2015; forecast Chinese gas demand growth down 6.5% through 2020; EU gas consumption decreasing since 2010
• And competition: Large players like Qatar and Australia continue to be active in locking in LNG contracts with aggressive pricing, as many LNG contract prices are linked to stubbornly low oil prices*
• Leads to unfavorable price differentials: As an example of challenging conditions, Cheniere has contracted 87% of its capacity with prices set at 115% of Henry Hub plus $2.25 fixed costs, mainly liquefaction. One analyst estimates at March’s global LNG spot prices, at $1 freight to Europe and $3 to Asia, this pricing would have netted a $1.25/MMBtu loss in European markets and an ~$2.95/MMBtu deficit in Asian markets
• But there’s hope: Some observers say the current LNG glut will clear in the 2020 to 2022 time frame. In addition, there are geopolitical considerations involving competition, diversification of supply, and security (e.g., unpredictable Russian supply) that can incentivize buyers to pay premiums for U.S. LNG—the question is how much and for how long?
Regional Natural Gas Price Benchmarks Used in Gas Trade
2002 2010200720052003 20132004 2014201120092006 20152008 2012
Henry Hub Nat. Gas Spot Price Japan LNG Import Price EU Natural Gas Import Price
$/M
MB
tu
$0$2
$6
$10
$14
$18
1
34
5
6
2
Source: World Energy Council
Challenging Breakeven: Selected LNG Export Costs/Contracts vs. Recent Landed Prices
Freight cost**
Pipeline cost
Gas lost for fuel
Liquefaction
ROI @ 10%
O&M expense
Maintenance cost
Gas***
Japan Landed LNGEuropean Landed LNG
Morgan Stanley LNG Cost Estimates
(Henry Hub to Asia)
Cheniere’s AsianContracts
Cheniere’s European Contracts
Morgan Stanley LNG Cost Estimates
(Henry Hub to Europe)
$/M
MB
tu
$8
$6
$4
$2
$0
$7.21 $7.54
$6.12$5.54$5.42
$4.14
Sources: Cheniere; Japan METI; Energy Intelligence; Morgan Stanley
NOTES:*One analyst says that oil prices would need to rise to $50 to $55 per barrel to make oil-linked LNG prices “in the money” for U.S. LNG sellers; **Morgan Stanley Research estimate of $0.95 to Europe and $2.04 to Asia, and Cheniere range of $0.50 to $1.00 to Europe and $1.50 to $3.00 to Asia; ***Assumes HH at $1.99/MMBtu, construction cost at $1,000/mtpa and 40-year useful life, 10% ROI.
EVENTS AND TRENDS1. U.S. shale gas boom begins2. Continued growth in U.S. shale gas supply; domestic supply glut
leads to depressed prices; 20+ proposals submitted for LNG export terminals; economics drive coal to gas switching
3. Fuel switching occurs due to flood of cheap coal on the market4. Asian demand growth dampens; oil price collapse followed by
LNG natural gas price collapse5. First Japanese nuclear reactor comes back online6. Five LNG export terminals approved; 60+ million tons/year
coming online through 2020

SCOTTMADDEN, INC. | 24
LNG EXPORTS: SUPPLY TO OUTPACE DEMAND…FOR NOW
NOTES:LNG is liquefied natural gas; BCF/day is billion cubic feet of gas per day; DOE is U.S. Department of Energy; MMBtu is millions of British thermal units. SOURCES:Energy Intelligence; EIA; U.S. Department of Energy; Japan METI; Deutsche Bank; World Energy Council; ICIS; Cheniere; Credit Suisse; FERC; Morgan Stanley; Macquarie Research; BMI Research; SNL Financial; ScottMadden analysis
How Might Large-Scale LNG Exports Affect the U.S. Market?
• EIA forecasts that the United States will be a net exporter of LNG by late 2016 and a net exporter of natural gas by late 2017, with 10% of domestic supply being exported by 2020
• A December 2015 DOE report found that increased LNG exports will boost domestic production and generate $7 billion to $20 billion annually through 2040, leading the Center for LNG to claim that “the time for U.S. LNG exports is now”
• Industrial groups claim that the report only examines the effects of increasing exports from 12 BCF/day to 20 BCF/day, thereby excluding the considerably higher costs of initiating exports from 0 BCF/day to 12 BCF/day—costs that would be to the specific detriment of “energy-intensive trade-exposed industries and the U.S. consumer”
• The DOE report acknowledges potential adverse domestic price impacts on energy-intensive sectors. Its base case assumes moving from 12 BCF/day to 20 BCF/day in exports will result in an ~25¢/MMBtu to 29¢/MMBtu increase in domestic gas prices. For comparison, NYMEX Henry Hub futures for February 2018 are trading at $3.09/MMBtu, while futures for February 2020 are trading at $3.24/MMBtu
• A key assumption is the ability of the domestic U.S. upstream gas sector to respond to increased demand with expanded production, and a key uncertainty is the level of gas demand in the power sector that will be generated by the Clean Power Plan
Cap
acit
y (
mil
lio
n t
on
s/y
r)
FERC-Approved LNG Export Terminals under Construction (by intended start date)
60
50
40
30
20
10
0
70
2016 202020182017 2019
Cameron T3 - 4.0 tons/yrFreeport T1 - 4.4 tons/yrCameron T2 - 4.0 tons/yrCameron T1 - 4.0 tons/yrSabine Pass T4 - 4.5 tons/yrCove Point T1 - 5.2 tons/yrSabine Pass T3 - 4.5 tons/yrSabine Pass T2 - 4.5 tons/yrSabine Pass T1 - 4.5 tons/yr
Cheniere
DominionSempra
Freeport
Sabine Pass T5 - 4.5 tons/yr
Corpus Christi T2 - 4.5 tons/yr
Corpus Christi T1 - 4.5 tons/yr
Freeport T3 - 4.4 tons/yrFreeport T2 - 4.4 tons/yr
Projected 2020 LNG Export Capacity ~13% of 2015 U.S. Production
Billio
n c
ub
ic fe
et/d
ay
70
60
50
40
30
10
0
80
20
74.22
Export Capacity 2015 U.S. Dry Natural Gas Production
9.62
Sources: Morgan Stanley; EIA; ScottMadden analysis

SCOTTMADDEN, INC. | 25
CLEAN TECH AND ENVIRONMENT

SCOTTMADDEN, INC. | 26CLEAN POWER PLAN: AN UNPRECEDENTED STAY OF THE EPA RULE
The Supreme Court agrees to review EPA’s Clean Power Plan (or CPP), extending—for a time—uncertainty in the utility and power generation sectors about the rule’s validity and timing.
Supreme Court Stay Puts Clean Power Plan in Flux
• On February 9, the U.S. Supreme Court stayed enforcement of the EPA’s Clean Power Plan in a 5-4 vote. This was widely viewed as unprecedented since, until now, the Court has not stayed a rule while challenges were pending in a lower court
• Some posit that the Court’s majority voted to stay the applicability of the CPP because of EPA’s “four corners” offense on MATS, effectively forcing utilities into compliance while they litigated the MATS rule’s validity
• The D.C. Circuit will hear challenges to the CPP in June, with a decision widely expected by Fall 2016 and a certain appeal to the Supreme Court expected for its 2017 docket
NOTES:Utility MATS is EPA’s final rule on mercury and air toxics standards for coal- and oil-fired electric utility steam generating units, issued in November 2014. Sources: Industry news; Sidley Austin; ScottMadden analysis
Potential Timing of Legal Outcomes
CPP Milestones vs. Potential Litigation Timing*
2016
2030
2017
2018
2019
2020
2021
2022
2023
2024
2025
2026
2027
2028
2029
Circuit Court CaseCircuit Court Decision
Supreme Court Appeal and Case
Supreme Court Decision
February 9, 2016Supreme Court stay of Clean Power Plan
June 2, 2016 Arguments scheduled for D.C. Circuit Court
September 6, 2016 States submit implementation plans or request extension
Key Dates and Milestones (Final Rule)
September 6, 2017 States with extensions submit progress report
September 6, 2018 States with extension submit implementation plan
January 1, 2022Begin first interim compliance period
January 1, 2025Begin second interim compliance period
January 1, 2028Begin third interim compliance period
January 1, 2030Begin full compliance
2016
2017
2018
2028
2030
2022
2025
*All dates and timelines shown are subject to CPP litigation outcomes.

SCOTTMADDEN, INC. | 27
CLEAN POWER PLAN: AN UNPRECEDENTED STAY OF THE EPA RULE
States Ponder Deadlines and Options
• In response to the stay, 19 of the 27 states with legal challenges suspended compliance planning. An equal number of states will continue planning (see charts at right)
• The EPA has offered voluntary assistance to states and plans to develop model trading plans and the Clean Energy Incentive Program
• If the rule is ultimately upheld, a significant question becomes the possible delay or “tolling” of rule deadlines*
• Under the CPP, final state plans are due to EPA in 2018. If EPA were to prevail in the U.S. Supreme Court, which may not happen until late 2017, and deadlines do not change, states could end up with one year or less to develop and submit implementation plans. Some believe this date would be pushed back to give states extra time to submit their plans
• Less certain is whether the 2022 start date and subsequent implementation dates of the CPP compliance period would also be similarly extended or tolled*
Numerous states suspend compliance planning; EPA mum on deadline revisions.
NOTES:*Tolling allows for pausing, delaying, or suspending of some or all of the deadlines of the CPP. **Based on U.S. Court of Appeals for the D.C. Circuit case No. 15-363 as of Jan. 21, 2016.
States’ Legal Stance in CPP Appeals**(as of January 2016)
Filed in opposition to EPA
Filed in support of EPA
No legal stance
Source: Nat’l Conf. of State Legislatures
States’ CPP Compliance Planning Activities Pending Appeals of Rule
Assessing Planning
Suspending Planning
Exempt
Continuing Planning
Source: E&E News
The Supreme Court did stay the rule. They did not speak to any tolling of the deadlines…We're not implementing or enforcing, but we're going to be there if states are asking us for help.
-Gina McCarthyEPA Administrator

SCOTTMADDEN, INC. | 28
CLEAN POWER PLAN: AN UNPRECEDENTED STAY OF THE EPA RULE
Announced CPP Plans for Selected “Generation-Heavy” Utilities
American Electric Power Company
We need to look in detail at what needs to be done in each particular state and we’ve looked at it in terms of a mass-based approach so that would allow trading to occur among states…In the integrated regulated states, which most of ours are, [this] would be a great opportunity for us to continue to invest in additional resources.
Duke Energy Corporation
The mass-based plan would be Duke’s choice…states and utilities have extensive experience with mass-based trading programs….Under a mass-based approach, where allowances are freely allocated to existing EGUs, utilities like Duke will be able to prevent rate spikes while still achieving appropriate emission reduction.
Ameren Corporation We think it’s mostly [the case that we] are going to see it [i.e., capital investments in generation projects, especially renewables] be more toward the back end of the timeline.
Dominion Resources We fully expect that we’re going to need significantly more gas and significantly more solar than what has been announced thus far to comply in the state of Virginia...But CPP can be implemented “in a way that is challenging but ultimately manageable for regulated power plants.”
Southern Company Southern Co.’s goal [as a result of the CPP and its acquisition of AGL Resources] is to increase natural gas’ share in its generation mix to 55% by 2020 from the current 40% while at the same time reducing coal’s share in its generation mix to 21% by 2020 from the current 40%. Southern Co. is also going strong on solar.
Owners of power generation are trying to navigate the time required to plan and implement CPP compliance strategies, their regulators’ and legislators’ wishes, and lack of clarity on the ultimate implementation dates of the CPP.
Affected Electric Generating Units (EGUs) Under the EPA’s CPP*
Fossil Steam Units
Natural Gas Combined Cycle Units
Source: EPA
NOTES:*Dots represent approximate unit location.

SCOTTMADDEN, INC. | 29
CLEAN POWER PLAN: AN UNPRECEDENTED STAY OF THE EPA RULE
The First Step in a State Implementation Plan Is Choosing a Mass- or Rate-Based Compliance Target
• States developing implementation plans must first decide if they will meet mass- or rate-based targets outlined by the EPA. The table below highlights key decision criteria and the direction in which the criteria may push a state. In addition to the criteria outlined below, a state must also consider the current generation portfolio, planned retirements and additions, physical infrastructure constraints (e.g., natural gas pipeline capacity), existing renewable energy policies, state energy policy, and current rates and regulations.
KEY:Key Decision Criteria for Mass- or Rate-Based Compliance Approach low highmedium
Participate in existing carbon trading system (i.e., RGGI or California)
• States can expand existing trading programs to incorporate CPP targets under an exclusively mass-based “state measures” approach
• States may leverage experience from mass-based cap-and-trade Acid Rain Program implementation (i.e., SO
2 and No
x)
Rely on prior experience regulating mass-based emission regulations
• The addition of zero-emission baseload generation may significantly lower the overall emission rate, thereby making rate-based compliance a potentially attractive option in the Southeast
Plan to complete construction of new nuclear generation
• Cost efficiencies are gained by joining regional trading markets; late movers may adopt the compliance strategies of neighboring states
Manage compliance costs by trading in multi-state markets
• Rate-based compliance would only apply to existing electric generating sources. New fossil units for demand growth would need to meet 111b new source standards but could operate outside of CPP 111d caps
Plan to construct new fossil generation to meet future load growth
Discussion
Plan to increase output from existing fossil units to meet future load growth
• Increasing generation from fossil units with low capacity factors would increase total emissions under a mass-based approach but will not adversely affect average rate of emissions
• Energy efficiency under mass-based compliance reduces carbon emissions; under rate-based compliance, these savings must be measured and verified in order to generate emission rate credits
Plan to maintain and/or expand energy efficiency programs
• The relative abundance of a building block in a state (e.g., high solar resource) has important implications for the state implementation plan but does not necessarily push a state toward mass- or rate-based compliance
Rely heavily on any or all of EPA’s “building blocks” (i.e., increase efficiency of coal plants, shift from coal to natural gas, or use zero-emission generation resources)
CriteriaImpact on Rate- vs.
Mass-Based DecisionDrives Towards
Rate ComplianceDrives Towards
Mass Compliance
TOSS-UP
TOSS-UP

SCOTTMADDEN, INC. | 30
NOTES:MJB&A defines electric system costs as fuel, capital, O&M, and energy efficiency program costs (both utility and program participant costs). NERA defines expenditures as changes in electricity generation costs (including allowance costs), energy efficiency costs, and increased natural gas costs for non-electric consumers. Where provided, natural gas assumptions were similar (MJB&A = $5.14/MMBtu to $6.00/MMBtu, NERA = $5.70/MMBtu to $5.80/MMBtu). BAU means business as usual (without CPP). ACCCE is American Coalition for Clean Coal Electricity.SOURCES:Company reports; industry news; E&E News; EPA; MJB&A; Morgan Stanley; Brattle Group; PURC; Nat’l Conf. of State Legislatures; NERA; Sidley Austin; SNL Financial; Bloomberg; Van Ness Feldman; ScottMadden analysis
Common Themes Emerge from Conflicting Reports
• Robust trading can mitigate compliance costs and impacts. National trading is ideal, but regional trading still results in benefits• Allocation of emission allowances is a critical design question in mass-based compliance. In a given state, utilities may have
very different interests in how allocation will work. Customers may be negatively impacted if auction revenue does not lower electric rates or bills
• Energy efficiency is a wildcard in terms of modeling, deployment potential, and economic impact. Energy efficiency may also impact electric rates and bills differently (i.e., rates can increase while bills decrease)
• A multi-year renewable energy tax credit extension was not considered in studies but could lower compliance cost impacts• Economic impact does not equate to cost-benefit analysis; only one study below offered a cost-benefit figure
Studies disagree on compliance costs and household impact of the final rule.
Key Findings of Reports Evaluating the Economic Impact of the Final Clean Power Plan Rule
CLEAN POWER PLAN: AN UNPRECEDENTED STAY OF THE EPA RULE
M.J. Bradley & Associates (MJB&A)
Morgan Stanley
• Models 14 compliance scenarios that consider varying compliance methods (mass v. rate) and energy efficiency deployment
Report Summary of Analysis Notable ObservationsHousehold ImpactCompliance Costs
• Electric system costs increase $0.8 to $6.2 billion in 2030 relative to BAU assumptions
• Efficiency investments reduce costs
• Monthly household electric bills decrease 5% to 20% in 2030
• Higher savings originate from allowance auction revenue being invested in customer programs
• A patchwork scenario that assumes multiple mass-based trading zones (with the exception of the Southeast) provides the lowest compliance cost
• Coal retirements reduced in mass-based scenarios with inclusion of national trading and higher efficiency
• Reference scenario assumes renewables are more than 23% of installed capacity in 2030
• Compliance costs consider national cap-and-trade and regional trading
• Annual customer rate impact in reference case is $1.6 to $11 billion
• Low end assumes national cap-and-trade
• Greatest rate impact is the Southeast; residential electricity rates increase ~5% from current levels
• CPP is expected to reduce carbon emissions 32% from 2005 to 2030
• BAU coal retirements and renewables development will result in a carbon reduction of 28% by 2030
NERA Economic Consulting (for ACCCE)
• Two mass-based scenarios compare intra-state trading and regional trading to BAU
• Study also considers various allocations of emission allowances, including auction among generators
• Average annual expenditures increase $29 to $39 billion relative to BAU
• Low end represents regional trading
• Average annual U.S. retail electricity rates increases by 11% to 14% relative to BAU
• Model assumes auction revenue returns to households, but not through lower electricity rate impacts
• Rate-based scenario in appendix shows lower compliance costs and household impacts

SCOTTMADDEN, INC. | 31RENEWABLE ENERGY TAX CREDIT: EXTENSION PASSED BY CONGRESS
A multi-year extension, part of a December 2015 budget deal, provides some certainty.
Big Winners: Solar and Wind with Phase-Out Periods
• The 30% business investment tax credit (ITC) for solar was extended through 2019; this steps down to 26% in 2020, 22% in 2021, and 10% thereafter. In addition, the “placed in service” requirement was replaced with a more flexible “commence construction” provision
• The production tax credit (PTC) was extended for wind, geothermal, landfill gas, and hydro projects commencing construction in 2015 and 2016
• For wind only: 80% of the PTC is available for projects commencing construction in 2017, 60% of PTC in 2018, and 40% of PTC in 2019
• In addition, 50% bonus depreciation was extended for renewable and conventional generation placed in service during 2015, 2016, and 2017; this phases down to 40% in 2018 and 30% in 2019
Actual and Projected Annual Solar and Wind Installations(2011-2021)
An
nu
al
Inst
all
ati
on
s (G
Ws)
Solar - Residential
Solar - Commercial & Industrial
Solar - Utility
Wind
0
20
15
10
5
25
2011 201420132012 2015 2020E2019E2018E2017E 2021E2016E
Actual Projected
HATCHED: After ITC Extension
SOLID: Before ITC Extension
Source: Bloomberg New Energy Finance

SCOTTMADDEN, INC. | 32
Unsubsidized Levelized Cost of Energy for Selected Generation Technologies
$30 $70$60$50$40 $80
Levelized Cost ($/MWh)
Solar PV - Crystalline Utility-Scale
Solar PV - Thin Film Utility-Scale
Wind
Natural Gas Combined Cycle
$56 $70
$50 $60
$32 $77
$52 $78
Source: Lazard
SOURCES:AWEA; Baker Tilly; Bloomberg; Bloomberg New Energy Finance; Lazard; SNL Financial; ScottMadden analysis
Will Tax Credit Extensions Be a Bridge to Long-Term Stability for Renewables Development?
• Utility-scale solar and wind projects located in ideal resource locations (i.e., solar in Southwest, wind in Texas) do not require tax credits to compete on economics with new natural gas generation (see chart above)
• Consequently, it is not surprising that Bloomberg New Energy Finance forecasts the ITC/PTC extension will result in a significant rise in solar and wind capacity additions from 2016 to 2021
› New solar capacity increases 44% or 41 GWs to 59 GWs › Residential solar benefits the most with a 54% increase in new capacity › New wind capacity increases 76% or 25 GWs to 44 GWs
• With this robust near-term pipeline, the extension is likely to support further cost reductions (driven by experience curve effects) and technology improvements that expand the competitive reach of unsubsidized solar and wind
At a time when the rest of the world is seeking to adjust to a world without incentives… and
auctions where solar has to compete with other forms of energy, it is almost staggering the level
of funding in what appears to be a once-in-a-lifetime blank cheque offering to local [solar]
installers and developers.- Finlay Colville,
Head of Market Intelligence, Solar Media
These policies will provide a critical level of certainty and continuity that will encourage
ongoing private investments in wind and solar energy resources at lower costs for customers.– Kyle Davis, Director, Congressional Relations,
Berkshire Hathaway Energy
Reaching Parity: Lower cost plus favorable resource helps solar and wind compete with gas generation.
RENEWABLE ENERGY TAX CREDIT: EXTENSION PASSED

SCOTTMADDEN, INC. | 33ELECTRIC VEHICLES: ON THE CUSP OF CHANGE
Increased EV range and competitive pricing, autonomous vehicles in development, and ride sharing might portend a paradigm shift in vehicle transportation and good news for EVs.
Could Convergence Be the Boost Electric Vehicles (EVs) Need?
• Information technology is disrupting the transportation sector through the “mobility trifecta:” EVs, autonomous driving, and the sharing economy (e.g., Uber and Lyft)
• Tech giants like Google and Apple are following the “Internet of Things” trend into transportation, but remain largely on the periphery for now, although Apple is spending $3 to $5 billion on its mobility project, looking at market entry for an autonomous vehicle by 2020. Meanwhile, Tesla is innovating with software that uploads new features similar to updating mobile apps
• Payback on EVs, especially given low gasoline prices, is a challenge with an individually owned vehicle. But analysts believe higher vehicle utilization (through ride sharing) and improved EV range could shorten the breakeven period
• Companies are forming alliances and making investments now › For example, GM has invested $500 million in ride-sharing service Lyft and is pursuing a national network of self-
driving cars › There is some discussion of a Google/Ford venture, but nothing has been announced yet
Nu
mb
er
of
Cars
So
ld (
in t
ho
usa
nd
s)
U.S. Plug-In Car Sales
Market Share in %
Mark
et S
hare
U.S. Plug-In Electric Vehicle Sales by Month and as Share of Total Car Sales
0
12
10
8
6
4
2
14
0%
3%
2%
1%
12/15
9/15
10/15
7/15
8/15
5/15
6/15
3/15
4/15
1/15
2/15
11/14
12/14
9/14
10/14
7/14
8/14
5/14
6/14
3/14
4/14
1/14
2/14
11/13
12/13
9/13
10/13
7/13
8/13
5/13
6/13
3/13
4/13
1/13
2/13
11/12
12/12
9/12
10/12
7/12
8/12
5/12
6/12
3/12
4/12
1/12
2/12
11/11
12/11
9/11
10/11
7/11
8/11
5/11
6/11
3/11
4/11
11/15
2/11
1/11
12/10
Source: Insideevs.com

SCOTTMADDEN, INC. | 34
NOTES:*At assumed 10,000 miles per year; **over average new car ownership period.SOURCES:Morgan Stanley; Automobile magazine; Bloomberg New Energy Finance; industry news; ScottMadden analysis
Moving from Niche to Mass Market Appeal
• Amidst this longer-dated evolution, EV manufacturers continue to improve vehicle charging range and pricing
• Chevrolet, Tesla, and Nissan plan to release next-gen vehicles in the next two years with extended ranges (~200 miles per charge) and a price point (after incentives) that competes with the average price of a new car ($31,000)
• With continued cost improvements, Bloomberg forecasts a $22,500 electric car would be a practical choice for almost 70% of car buyers
• Some key features of the vehicle point to the convergence model noted earlier (see sidebar)
Charging Infrastructure Models Tested in California
• California PUC will allow San Diego Gas & Electric (SDG&E) to spend $45 million to deploy 3,500 EV chargers under its Vehicle Grid Integration program and Southern California Edison (SCE) to spend $22 million to roll out 1,500 EV chargers as part of its Charge Ready program. Still pending is a Pacific Gas & Electric request for $160 million for 7,500 charging stations
• SCE will own all of the infrastructure except the EV charging units, while SDG&E will retain ownership of chargers, along with the distribution lines, transformers, and other gear needed to hook them to the grid
• As the first large-scale deployments being funded by rate-based investments, these pilots could provide an important model for how utilities and state regulators across the country approach their EV goals
Estimated EV Payback Period vs. 40 MPG Internal Combustion Engine* at Selected Gasoine Prices and Battery Costs ($/kWh)
Pay
back P
eri
od
(ye
ars
)
$1.500
$5.50$5.00$4.50$4.00$3.50$3.00$2.50$2.00 $6.00Gasoline Prices ($/Gal)
120
100
80
60
40
20
140Battery Cost at $100/kWh
Battery Cost at $200/kWh
Avg. New Car Ownership Period (77.8 mos.)
Sources: Morgan Stanley; Kelley Blue Book; ScottMadden analysis
Photo Courtesy of Chevrolet
Still a Long Payback at current Chevy Bolt battery cost of $145/kWh and current gas prices BUT increased
vehicle use via ride-sharing could improve this
ELECTRIC VEHICLES: ON THE CUSP OF CHANGE
• Expected release: late 2016• “Built for sharing” (built-in
app includes ride-sharing management, including reservations, payment, and tracking)
• Auto-valet function (car can drive itself into a garage and be retrieved upon command)
• Single-motor drive unit, electronic precision shift system, 7.05:1 final drive ratio (0 to 60 mph <7 seconds; 0 to 30 mph <2.9 seconds), 91 mph top speed
• Capable of up to 266 lb.-ft. of torque and 200 hp (150 kW) of power• 60 kWh lithium-ion battery pack with >200 miles of range, 288 lithium-ion
cells, 96 cell groups, 3 per group• 7.2 kW onboard charger for charging from 240 V, 50-mile recharge <2
hours, full charge ~9 hours; DC Fast Charging gives 90 miles of range in ~30 minutes
• Regen system provides one-pedal driving, slowing vehicle to a stop without using the brake pedal in certain conditions (instead using a steering-wheel-based paddle lever)
• 960 lbs. total weight
Chevy Bolt Concept Car Raises Stakes
EV breakeven** at selected battery and gasoline costs: $100/kWh - $4.30/gal$200/kWh - $7.35/gal

SCOTTMADDEN, INC. | 35
ENERGY SUPPLY, DEMAND, AND MARKETS

SCOTTMADDEN, INC. | 36WHOLESALE POWER MARKETS: HOW ARE ADAPTATIONS FARING?
Market operators and states make administrative changes to compensation of energy resources.
Paying for Capacity Performance
• In 2015 and early 2016, PJM’s Capacity Performance (CP) resource proposal was accepted by FERC. CP allows PJM to procure “pay for performance” capacity resources, including generation, demand response, and energy efficiency. Providers must produce power when called upon, regardless of extreme weather or system conditions, or incur significant financial penalties. CP was instituted in response to significant generator availability issues the prior two winters
• PJM has conducted two transitional auctions—for 2016–17 and 2017–18 capacity resources. The transition allows for changes—dual fuel for firm gas contracts, O&M, weatherization, etc.—to phase in support for the more stringent CP requirements
• CP requirements increased capacity prices (see chart at right), but did not raise them to the offer cap, which is based upon cost of a new entrant, typically the cost of a new gas-combustion turbine
• Additional transition auctions remain for delivery years 2018–19 and 2019–20. The 2020-21 auction will be the first 100% CP solicitation and therefore the first one without any transition effects
• Nuclear generators are supportive of CP, which compensates for their “always on” capabilities. Only as additional auctions occur, and any penalties for non-performance are assessed, will it be seen whether CP’s pricing signals will improve the capacity market and what types of resources will be most valuable
Selected ISO Capacity Auction Results by Delivery Year(in $/Megawatt-Day)
ISO-NE Rest of Pool(Fwd. Capacity Auction)
NYISO Rest of State(Summer; Strip Auction*)
PJM- RTO (Base Residual Auction)
PJM - Transition Incremental CP Auction Results
2010/11 2017/182016/172015/162014/152013/142012/132011/12 2018/19
Cap
acit
y P
rice
(in
$/M
W-D
ay)
Delivery Year
$0
$500
$400
$300
$200
$100
$600
With Capacity Performance
Sources: SNL Financial, ScottMadden analysis
Bearish Outlook: ISO-New England’s February 2016 auction for 2019–20 resources yielded prices lower than most analysts expected. Many point to higher bonus depreciation for new build alternatives, which may have contributed in lower prices than expected. This outcome came despite a resource performance program similar to PJM’s CP program. Some expect this to weigh on PJM’s next auction. One bright spot: expectation that full implementation of CP will lead to higher capacity prices by 2020–21.
NOTES:*As of this release, NYISO strip auction results for 2016/2017 were not yet announced.

SCOTTMADDEN, INC. | 37
Ohio Approves Contracts for Differences to Encourage Generation to Stay Online
• Ohio, which embarked on retail competition in 2001, has required its utilities to establish Electric Security Plans, aimed at setting rates and pricing for generation service. Typically, rates for wholesale power were set through auction
• Ohio-based AEP and FirstEnergy utilities recently proposed a new, supplemental approach—long-term power purchase agreements (PPAs) for capacity and energy from designated generation sources (see map) at rates that reflect fully embedded cost of plant operations. Pricing would be under a contract for differences, in which output would be sold into the PJM market with the excess or deficit over costs flowing to ratepayers via a non-bypassable distribution rider
• The Ohio PUC approved the arrangement, as the utilities argued that the PPAs will act as a financial hedge against future power price increases and will support the local economy through continued plant employment
• Other power suppliers are challenging these proposals—some referring to them as “bailouts” for utility generation that undermine both wholesale and retail competition
• If upheld by the Ohio courts, an appeal to FERC and federal courts is all but certain. Key questions for this arrangement:
› The U.S. Supreme Court recently rejected a Maryland arrangement for generation pricing. Given the narrow scope of the ruling, is the Ohio arrangement satisfactory or can it be reworked to be made so based upon that ruling?
› Will FERC see Ohio’s PPAs as adversely impacting the working of the wholesale power market and thus intervene?
OHIO
MICHIGANPENNSYLVANIA
WEST VIRGINIA
INDIANA
KENTUCKY
Davis-Besse908 MW
Clifty Creek1,198.2 MW
W.H. Zimmer1,344 MW
Kyger Creek990.7 MW
Cardinal1,800 MW
Conesville1,590 MW
W.H. Sammis2,110 MW
Plant NameOperating MWs
J.M. Stuart2,308 MW
Nuclear CoalPlant Name
Operating MWs
Source: SNL Financial
NOTES:On Feb. 22, AES Corp. subsidiary Dayton Power and Light filed for Ohio PUC approval of a new electric security plan (ESP) (Case No. 16-0395-EL-SSO) that appears to be modeled on the AEP and FirstEnergy PPAs.
Ohio Plants Whose Output Is Subject to Proposed PPAs
WHOLESALE POWER MARKETS: HOW ARE ADAPTATIONS FARING?

SCOTTMADDEN, INC. | 38
SOURCES:PJM; SNL Financial; industry news; RTO Insider; analyst reports; New England Clean Power Link; Northern Pass; Ohio PUC Case Nos. 13-2385-EL-SSO (AEP) and 14-1297-EL-SSO (FirstEnergy); complaints filed with the FERC by the Electric Power Supply Association, the Retail Energy Supply Association and a group of merchant generators (Dockets EL16-34 and EL-16-33); ScottMadden analysis
NEW YORK
MAINE
VERMONT
NEW HAMPSHIRE
MASSACHUSETTS
CANADA
Legend:
TITLE TITLE TITLE
Clean Power Link Proposed Lake Cable
Clean Power Link Proposed Ludlow Converter SiteClean Power Link Proposed Overland Cable
Northern Pass Proposed Underground RouteNorthern Pass Proposed Overground RouteNorthern Pass Existing Substation to be UpgradedNorthern Pass Proposed Converter Terminal
New England Clean Power Link
The Northern Pass
Source: Project websites
New England: Expanding Infrastructure to Ease Constraints
• New England’s generation mix is shifting: about 4.2 GWs are scheduled for retirement in the next five years (including more than 1 GW of nuclear generation)
• New England’s power markets are increasingly reliant upon natural gas as a fuel, while state regulators, its ISO, and politicians are looking to preserve reliability and to avoid price spikes
• To that end, several market adjustments are being pursued:
› Under a proposed process, Massachusetts electric distribution companies may sign long-term contracts for firm gas transportation and socialize those costs in rates in the same manner as a gas distribution company. This process is pending review by Massachusetts’ supreme court
› Massachusetts seeks to increase hydro and wind imports from Canada. Some large transmission projects are being pursued to support this effort:
› New England Clean Power Link: a $1.2 billion, 154-mile, 1,000-MW high-voltage DC line, being developed by a subsidiary of private equity firm Blackstone
› Northern Pass Line: a $1.6 billion, 192-mile, 1,090-MW high-voltage DC line, developed by an Eversource Energy affiliate
› For homegrown power, several New England states (CT, RI, and MA) have jointly solicited clean energy proposals for the region, including renewable development and transmission development
Importing Renewable Power: Two Large New England Projects
WHOLESALE POWER MARKETS: HOW ARE ADAPTATIONS FARING?

SCOTTMADDEN, INC. | 39A ONCE-IN-A-LIFETIME TRANSFORMATION OF THE NATION’S POWER GENERATION FUEL MIX
New natural gas, wind, and solar-powered generation represent the majority of capacity added since 2010 and projected through 2020. In the same time frame, coal and oil will have declined and will continue to decline at an historic pace.
Wind
Solar - Utility
Solar - Distributed**
Biomass
Hydro
Geothermal
Gas
Coal
Nuclear
Oil
Historic and Future* Power Plant Capacity(All NERC Regions; 2010, 2015, 2020e)
GW
s
1,400
1,200
1,000
800
600
100
200
02010
29%
42%
9%
9%
2015
25%
42%
9%
9%
2020e
21%
42%
8%
8%
9%4% 7%4%4%
Sources: SNL; GTM
SOURCES:SNL Financial; GTM Research; California ISO; NYISO; NERC 2015 Long-Term Reliability Assessment (LTRA); ScottMadden analysis
Texas (ERCOT)• Between 2015 and 2020, will add 20 GWs of
natural gas capacity and 21 GWs of wind• As wind capacity grows, system stability
challenges are possible, especially in areas far from load centers like the Panhandle
• “Sleeping giant” of solar is awakening: growing both utility and distributed solar (more than 2.2 GWs and 1.5 GWs, respectively)
California (CAISO)With high distributed solar penetration:• Short, steep ramps of dispatchable resources and
overgeneration risk (the “duck curve”)• Decreased frequency response with fewer flexible
resources
Midcontinent (MISO)• The combination of a 3-GW decrease in coal-fired
capacity (replaced with gas), a 14-GW increase in wind from 2010 to 2020, and tightening reserve margins (below 15% in 2021 down to 11% in 2025)will require use of all available resources
Southeast (SERC)• About 15% of coal capacity to be retired between
2010 and 2020 (more than 13 GWs), more than any other NERC region
• New gas-fired plants and 6 GWs of nuclear capacity expected to offset retirements and support demand growth
• A reliability task force is studying potential issues
Northeast (NPCC)• Economic and political pressures forcing coal and
nuclear units to retire, with potential resource deficiency and reduced fuel diversity
• Combined-cycle, gas turbines may not be capable of extended baseload or load-following operation
• Increasing variable resources as synchronous capacity is retired, replaced by wind (~3.5 GWs between 2015 and 2020), utility solar (0.6 GW), and distributed solar (1 GW)
The Regions Speak: Emerging Operational and Reserve Issues in Some Areas with a Changing Fuel Mix
NOTES:*Future capacity is based on actual planned/under construction projects, and not based on any projections of unreported new developments or retirements.**Distributed residential and non-residential data from GTM Research PV deployment estimates. Assumes distributed solar is additive to historical and projected capacity, not duplicative of other resources.
Projection: Non-hydro renewables and gas will account for 64% and 34% respectively of all capacity added from 2010 to 2020
Growth by Type as Percentage of Capacity Additions
2010 - 2015 2015 - 2020e
73.6% 56.2%Renewables (non-hydro)
23.8% 37.7%Gas
2.6% 6.2%Other

SCOTTMADDEN, INC. | 40CAN THE FUTURE COME FAST ENOUGH FOR NUCLEAR?
Difficult markets pressure the industry to streamline operations and pursue new technologies.
Despite Closures, Total Nuclear Capacity Scheduled to Increase by 2020
• Sustained low natural gas prices, capacity markets that some say do not compensate for nuclear’s full value as clean baseload generation, and the high cost of operating a single-unit plant are pressuring nuclear plant operators to consider early plant retirements
• A pocket of hope for new nuclear capacity is the Southeast, which continues to push new reactors toward completion, although the learning curve has proven more costly than expected
The NY Nuclear Debate: Tensions Are High
• Despite its profitability and $1.6 billion in annual economic output statewide, New York Governor Cuomo has repeatedly called for retirement of Entergy’s Indian Point nuclear plant due to “intolerable” operating performance and proximity to NYC. Some cry foul saying the NRC has sole jurisdiction over nuclear safety
• In stark contrast, Governor Cuomo has expedited the creation of zero-emission credit subsidies in order to exclusively support the continued operation of Entergy’s unprofitable upstate FitzPatrick nuclear plant. Governor Cuomo had earlier criticized Entergy for seeking similar subsidies
• Entergy responded by reaffirming that FitzPatrick will be decommissioned, thus dealing Governor Cuomo’s emission reduction plan a major blow
We need to build new reactors early in the next decade, demonstrate them through the 2020s,
and scale up by the 2030 time frame-Stephen Kuczynski
CEO, Southern Nuclear Operating Co.
Selected Nuclear Plants Under Construction, Under Pressure, or Annouced Retirement
Ginna (PWR)582 MWUnits: 1
N/A
Pilgrim (PWR)677 MWUnits: 1
Mid-2019
FitzPatrick (BWR)847 MWUnits: 1
Late 2015-Early 2017
Oyster Creek (BWR)615 MWUnits: 1
2019
Indian Point 2-3 (PWR)2,069 MW
Units: 2N/A
V.C. Summer 2-3 (PWR)2,234 MW*Units: 3**2019/2020
Vogtle 3-4 (PWR)2,234 MW*Units: 4**2019/2020
Watts Bar 2 (PWR)1,150 MW*Units: 2**
2016
Spot Natural Gas Prices at Selected Northeast Hubs (March 2011-March 2016)
$0
$25
$20
$15
$10
$5
$30
$/M
MB
tu
3/2011 3/2016
Announced Retirement
Under Pressure
Expected AdditionsPWR: Pressurized Water Reactor
BWR: Boiling Water Reactor Plant Name
2014 Net Summer Capacity (MW) (*incremental new capacity)# of units at plant (current or **upon completion of new construction)
Online/retirement date (as applicable)
Tennessee Zone 5Transco Zone 6 (Non-NY)Algonquin Citygates
3/2014 3/20153/20133/2012
Sources: NEI; EIA; IAEA; NRC; SNL

SCOTTMADDEN, INC. | 41
NOTES:DOE means U.S. Dept. of Energy; EPA means U.S. Environmental Protection Agency; EPRI means Electric Power Research Institute; INPO means Institute of Nuclear Power Operations; NEI means Nuclear Energy Institute; NRC means U.S. Nuclear Regulatory Commission; SMR means small modular reactor.SOURCES:EIA; Nuclear Energy Institute; EPA; American Nuclear Society; SNL Financial; Electric Utility Cost Group
But some potential growth signs are on the horizon.
The Clean Power Plan Sparks Hope…Kind Of
• The EPA’s Clean Power Plan (CPP) does not expressly recognize existing nuclear generation as a potential compliance avenue for CPP. New reactors and uprates clearly count toward compliance. In addition, closing existing nuclear plants could hinder compliance under an mass-based approach
• But the EPA acknowledges that nuclear generation makes emissions lower than they would otherwise be and are lower in emissions than gas-fired generation, with some of the same baseload characteristics
• There is some hope that state plans—through allocation, auction, or set-aside of emissions allowances or even financial incentives (see New York discussion earlier)—will provide economic signals to help keep low-emitting, existing nuclear generation online
Increased R&D for Advanced and Small Modular Reactor (SMR) Designs
• The Obama Administration’s Gateway for Accelerated Innovation in Nuclear (GAIN) initiative, announced in early November, connects the nuclear industry with DOE technical, regulatory, and financial expertise to expedite advanced nuclear reactor design commercialization
• The 2016 Omnibus Appropriations Act passed in December increased nuclear energy programs funding by 9% over the budget request, with notable increases in R&D funding to support advanced and SMR development. It also directed the NRC to submit a plan to review license renewal applications allowing existing nuclear plants to operate beyond 60 years
• In January, NEI’s SMR Start program began a consortium of leading developers and potential customers to advance SMR commercialization through cost-share funding structures and to provide a unified voice on policy and regulation
Realizing the “Nuclear Promise”
• Driven by low gas prices and near-zero load growth, INPO and EPRI joined NEI in December to launch a multi-year initiative—the Nuclear Promise—which aims to improve nuclear competitiveness through a 30% operating cost improvement by 2018 and a $12/MWh cost reduction industry-wide by 2020. Strategic focus areas include market reform, NRC accountability, and operational excellence
• Working groups led by chief nuclear officers have identified 53 immediate improvement opportunities
CAN THE FUTURE COME FAST ENOUGH FOR NUCLEAR?

SCOTTMADDEN, INC. | 42DECENTRALIZED GENERATION: BY THE NUMBERS
Decentralized Generation (DG) Grew by Nearly a Third in 2014
Solar Photovoltaic (PV) Capacity Is 1.7 Times All Other Decentralized Generation Combined
• How much: Year-end 2014 DG totaled 14.4 GW, nearly doubling since 2011. This remains a relatively small portion of the 1,164 GW of nameplate capacity in the United States
• Where: The top five states—CA, NJ, NY, FL and AZ—account for more than half of DG capacity in the United States. California alone accounts for 26% of all DG
Decentralized Generation by Use and State
Inst
all
ed
MW
s
4,000
1,500
3,000
2,000
CA GAMDPACONCHIMAAZFLNYNJ MO
750
500
250
1,000
0
1,250
KSWAAKIA ALKYVAILTX MENHOKINOH RIMTVTWIMI IDUTDENV WYDCWVNMCT NEMSTNLAORMN ARNDSC SD
Grid Synchronized
C&I Standby
Net Metered
Net Metered (Third-Party Owned)
Sources: EIA, ScottMadden analysis
NOTES:The grid-synchronized category includes commercial and industrial generators less than 1 MW in capacity that are grid connected and grid synchronized. The C&I standby category includes commercial and industrial generators less than 1 MW in capacity that are not connected nor synchronized to the grid. The net metered category refers to residential, commercial, and industrial generators that are less than 2 MW in capacity and maintain a net-metering agreement with the local utility. Due to the nature of the data, it is possible some systems may be double counted. Figures are from 2014, the most recent data available.
DG as Percentage of Total Nameplate Capacity within State
STATE % DG
California 4.8
New Jersey 5.5
New York 2.4
Florida 1.4
Arizona 3.0
Massachusetts 5.1
Hawaii 18.4
North Carolina 1.2
Colorado 2.3
Pennsylvania 0.7

SCOTTMADDEN, INC. | 43
U.S. Decentralized Generation by Use and Resource Type(Year-End 2014)
Inst
all
ed
MW
s
10,000
8,000
7,000
6,000
5,000
4,000
3,000
2,000
1,000
9,000
0
Grid Synchronized
C&I Standby
Net Metered
Net Metered (Third-Party Owned)
InternalCombustion
4,293
CombustionTurbine
251
Steam Turbine
30
Hydroelectric
109
Wind
202
Photovoltaic
9,238
Storage
14
Other
315
Sources: EIA; ScottMadden analysis
Top States for Cumulative Installed Decentalized Generation(2013 and 2014)
Inst
all
ed
MW
s
0
3,500
3,000
2,500
2,000
1,500
1,000
500
4,000
CA NYFLNJ AZ CA FLNYNJ AZ
2013 2014
2,332.3
929.6 917.3 818.6534.1
3,785.6
1,155.4 1,046.5 950.3 939.3
Sources: EIA; ScottMadden analysis
SOURCES:EIA; ScottMadden analysis
2014: Top 5 = 54.48%
of total DG
2013: Top 5 = 50.73%
of total DG
DECENTRALIZED GENERATION: BY THE NUMBERS
The Big Numbers: By State and Type
• What: Three primary types of DG exist. First is PV capacity, which is nearly 64% of DG. Second, internal combustion standby generation located at C&I customer sites. And third, grid-synchronized generation at C&I customer sites
• Why: Favorable policy (NJ, NY, MA) and solar resources (CA, AZ), as well as relatively high residential electricity prices, continue to be the key to DG expansion, aided by declining PV installed costs
• What It Means: DG continues to make headway, with solar PV clearly dominating. DG growth trajectory may be impacted by state policies, especially changes to net metering and third-party ownership

SCOTTMADDEN, INC. | 44RECENT INSIGHTS: AVAILABLE AT SCOTTMADDEN.COM
ScottMadden posts energy and utility industry-relevant content and publications on a regular basis. The list below is a sample of recent insights prepared by our consultants.
To view these and other insights, please visit our Insights Library.
Grid Transformation
Nuclear Generation
• Integration of DER: California and New York• Impacts of Distributed Energy Resources on T&D Organizations
• Markers of Nuclear Plant Performance Decline• Bruce Power: How to Streamline Your Environmental Monitoring Program
Utility Management
Regulation and Rates
• Jumpstarting the M&A Integration Process
• The Economic Consequences of New Models• Establishing Solar Tariffs in the New Reality of Distributed Generation
Fossil Generation
Natural Gas
• The Clean Power Plan
• The Value of Strategic Direction• Benchmarking for Natural Gas LDCs
Energy Cybersecurity
Clean Tech & Sustainability
• Utility of the Future Implications on Cybersecurity: A Spotlight on New York’s Reforming the Energy Vision• Strategic Cybersecurity
• The 51st State Initiative• Postcards from the Future: Lessons Learned in Hawaii on Grid Transformation• The Electric Vehicle Market: Utility Perspective and Considerations for Utility Infrastructure Deployment
Public Power and Electric Cooperatives
• Strategic Planning in Public Power and Cooperatives
Stay Connected
Get the latest highlights and noteworthy developments in our topical Minute series. See scottmadden.com for more.

SCOTTMADDEN, INC. | 45
Contact Us
ENERGY PRACTICE: SCOTTMADDEN KNOWS ENERGY
Brad Kitchens President & [email protected] 404-814-0020
Stuart PearmanPartnerEnergy Practice [email protected]
Chris VlahoplusPartner Clean Tech & Sustainability Practice Leader [email protected]
Cristin LyonsPartner Grid Transformation Practice [email protected]
Greg LitraPartnerEnergy, Clean Tech, and Sustainability Research [email protected] 919-781-4191
About ScottMadden
ScottMadden knows energy from the ground up. We have worked in every kind of company, business unit, and function in the sector. We understand that each client’s challenge calls for a unique solution. So we listen carefully to you and personalize our work to help you succeed—by solving the right problem in the right way and delivering real results.
We have supported 20 of the top 20 energy utilities—and hundreds of others, large and small. Our industry-leading clients trust us with their most important challenges. They know that chances are, we have seen and solved a similar problem. Our consultants have earned this confidence through decades of experience in the field and are ready to share industry-leading practices and management insights.
We can be counted upon to do what we say we will do, with integrity and tenacity.