
The science behind climate change policy What the most ... · The science behind climate change...
63
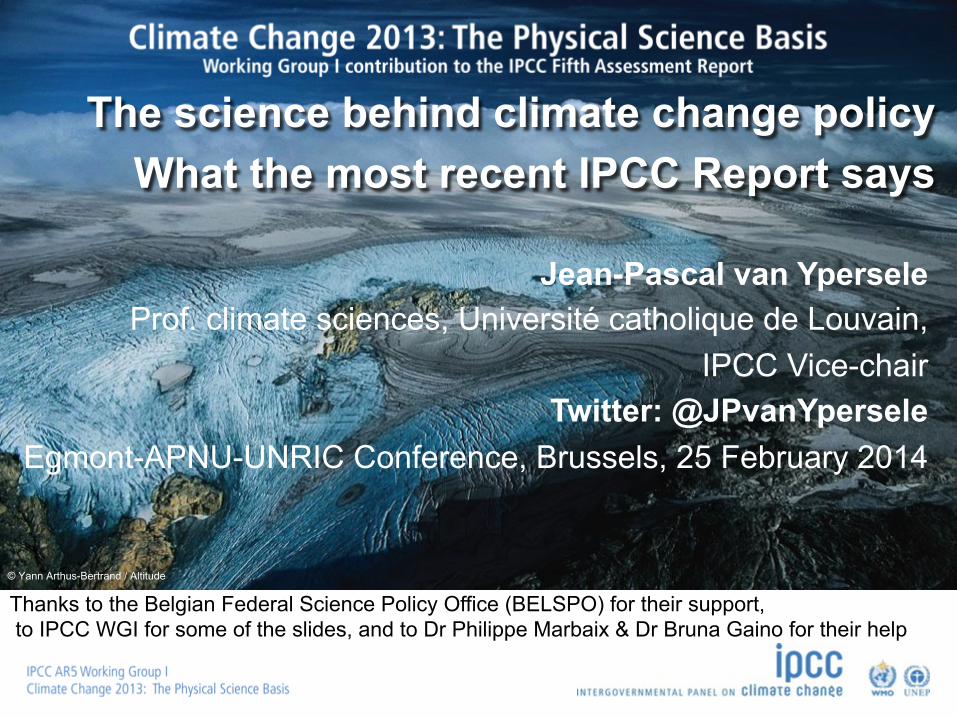
© Yann Arthus-Bertrand / Altitude The science behind climate change policy What the most recent IPCC Report says Jean-Pascal van Ypersele Prof. climate sciences, Université catholique de Louvain, IPCC Vice-chair Twitter: @JPvanYpersele Egmont-APNU-UNRIC Conference, Brussels, 25 February 2014 Thanks to the Belgian Federal Science Policy Office (BELSPO) for their support, to IPCC WGI for some of the slides, and to Dr Philippe Marbaix & Dr Bruna Gaino for their help
Transcript of The science behind climate change policy What the most ... · The science behind climate change...
© Yann Arthus-Bertrand / Altitude
The science behind climate change policy What the most recent IPCC Report says
Jean-Pascal van Ypersele Prof. climate sciences, Université catholique de Louvain,
IPCC Vice-chair Twitter: @JPvanYpersele
Egmont-APNU-UNRIC Conference, Brussels, 25 February 2014
Thanks to the Belgian Federal Science Policy Office (BELSPO) for their support, to IPCC WGI for some of the slides, and to Dr Philippe Marbaix & Dr Bruna Gaino for their help

h"p://www.ncdc.noaa.gov/sotc/service/global/map-‐percen8le-‐mntp/201401.gif
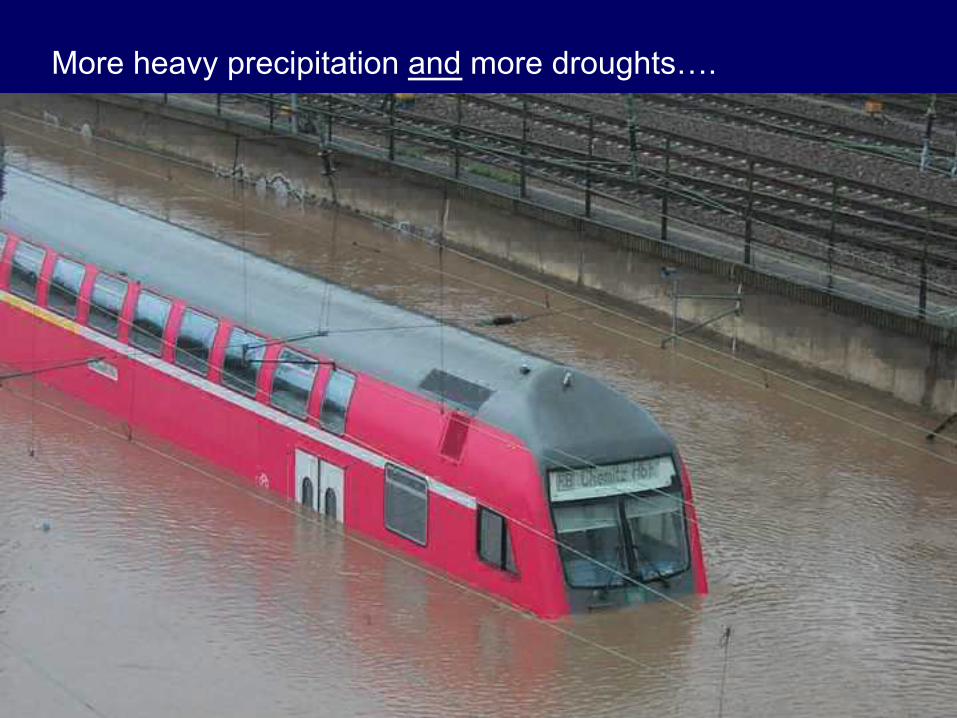
More heavy precipitation and more droughts….
• Warmer world implies more evaporation - but soils will dry out as a result. So dry regions will get drier unless storm tracks shift in a lucky way. And for some, they are expected to shift in an unlucky way.
• At mid to low latitudes - wet get wetter, dry get drier
• Warmer world implies more evaporation - more water goes to the atmosphere where water is available on the ground (e.g., oceans). The atmosphere therefore will contain more water vapor available to rain out. And most places receive the majority of their moisture in heavy rain events, which draw moisture from a big area.

IPCC - WGI
More heavy precipitation and more droughts….
• Warmer world implies more evaporation - but soils will dry out as a result. So dry regions will get drier unless storm tracks shift in a lucky way. And for some, they are expected to shift in an unlucky way.
• At mid to low latitudes - wet get wetter, dry get drier
• Warmer world implies more evaporation - more water goes to the atmosphere where water is available on the ground (e.g., oceans). The atmosphere therefore will contain more water vapor available to rain out. And most places receive the majority of their moisture in heavy rain events, which draw moisture from a big area.

Why the IPCC ?
to provide policy-‐makers with an objec8ve source of informa8on about
• causes of climate change, • poten8al environmental and
socio-‐economic impacts, • possible response op8ons.
WMO=World Meteorological Organiza8on UNEP= United Na8ons Environment
Programme
Established by WMO and UNEP in 1988

Jean-Pascal van Ypersele ([email protected])
IPCC Reports are policy-relevant,
NOT policy-prescriptive
Jean-Pascal van Ypersele ([email protected])
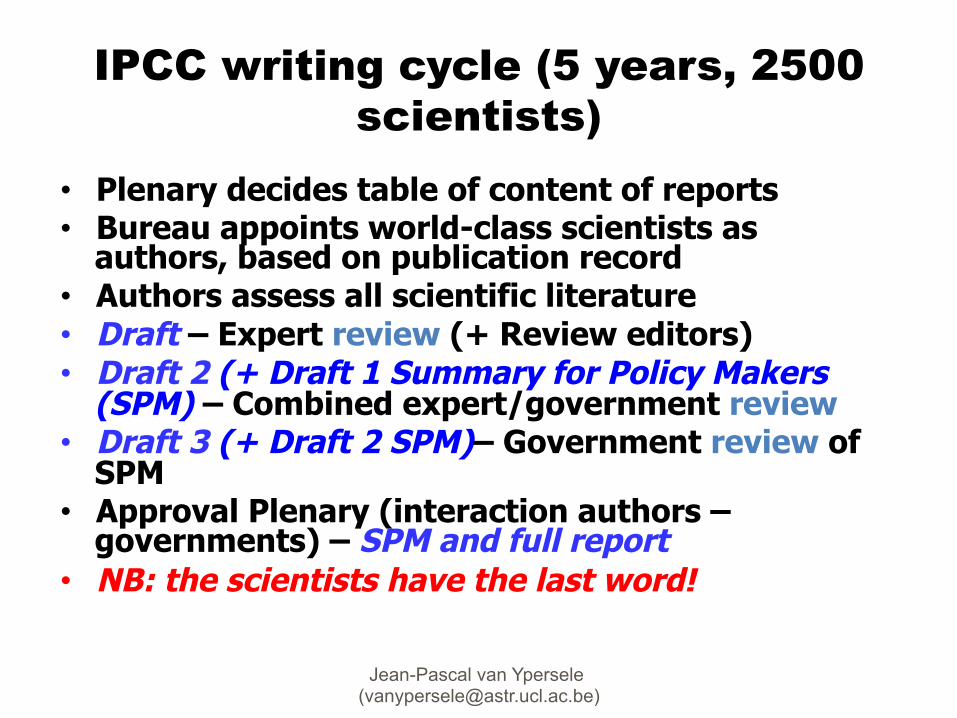
IPCC writing cycle (5 years, 2500 scientists)
• Plenary decides table of content of reports • Bureau appoints world-class scientists as
authors, based on publication record • Authors assess all scientific literature • Draft – Expert review (+ Review editors) • Draft 2 (+ Draft 1 Summary for Policy Makers
(SPM) – Combined expert/government review • Draft 3 (+ Draft 2 SPM)– Government review of
SPM • Approval Plenary (interaction authors –
governments) – SPM and full report • NB: the scientists have the last word!

Completed IPCC Reports
5 Assessment Reports (1990,1995, 2001, 2007, 2013-‐14)
1992 Supplementary Report and 1994 Special Report
8 Special Reports (1997,1999, 2000, 2005, 2011)
Guidelines for Na8onal GHG Inventories, Good Prac8ce Guidance (1995-‐2006)
6 Technical Papers (1996-‐2008)

Key SPM Messages
19 Headlines on less than 2 Pages
9
2009: WGI Outline Approved
14 Chapters Atlas of Regional Projections
54,677 Review Comments by 1089 Experts
2010: 259 Scientists Selected
Summary for Policymakers ~14,000 Words
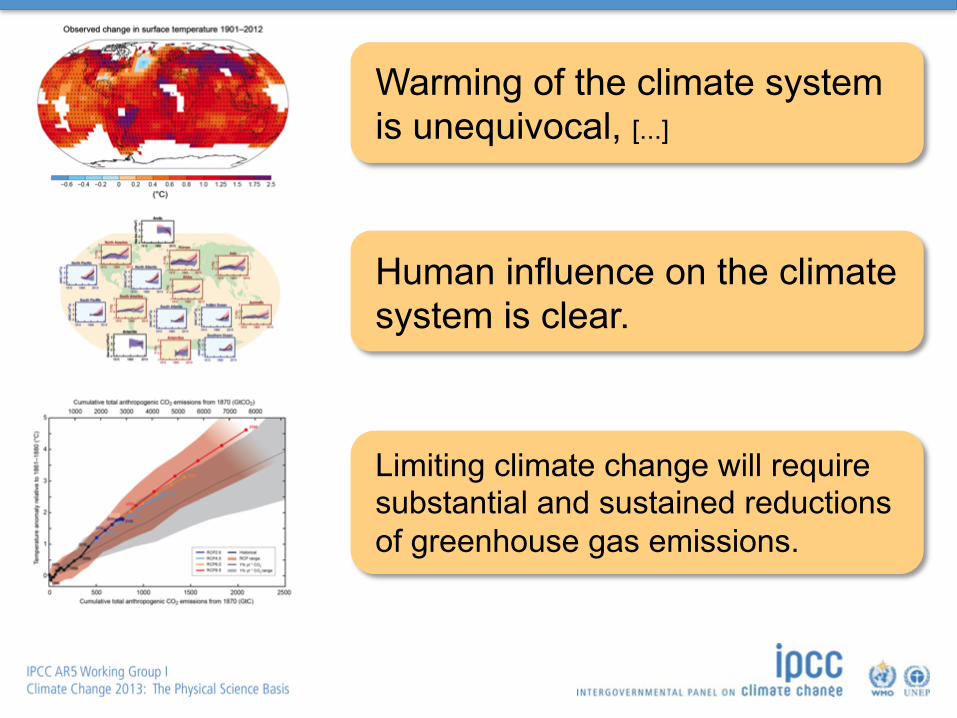
Warming of the climate system is unequivocal, [...]
Human influence on the climate system is clear.
Limiting climate change will require substantial and sustained reductions of greenhouse gas emissions.
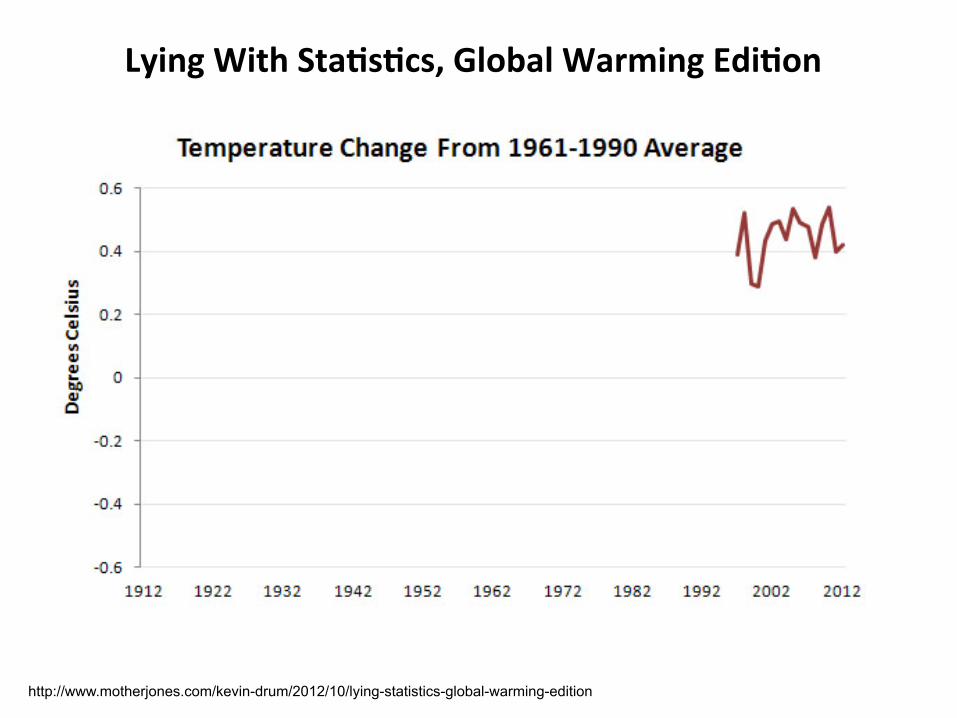
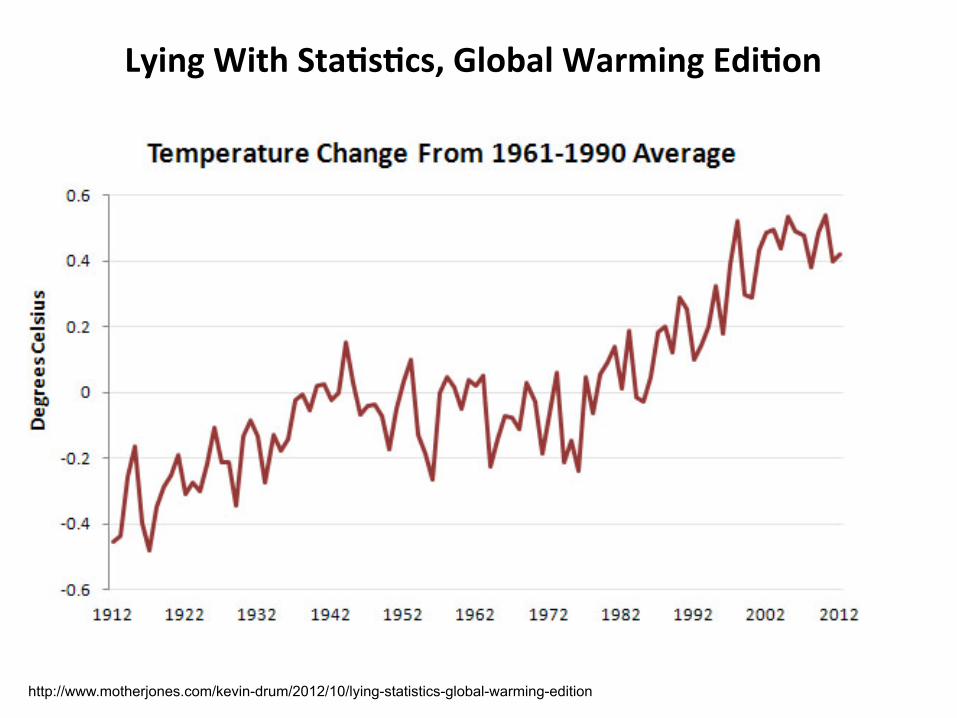
Lying With Sta2s2cs, Global Warming Edi2on
http://www.motherjones.com/kevin-drum/2012/10/lying-statistics-global-warming-edition
Lying With Sta2s2cs, Global Warming Edi2on
http://www.motherjones.com/kevin-drum/2012/10/lying-statistics-global-warming-edition
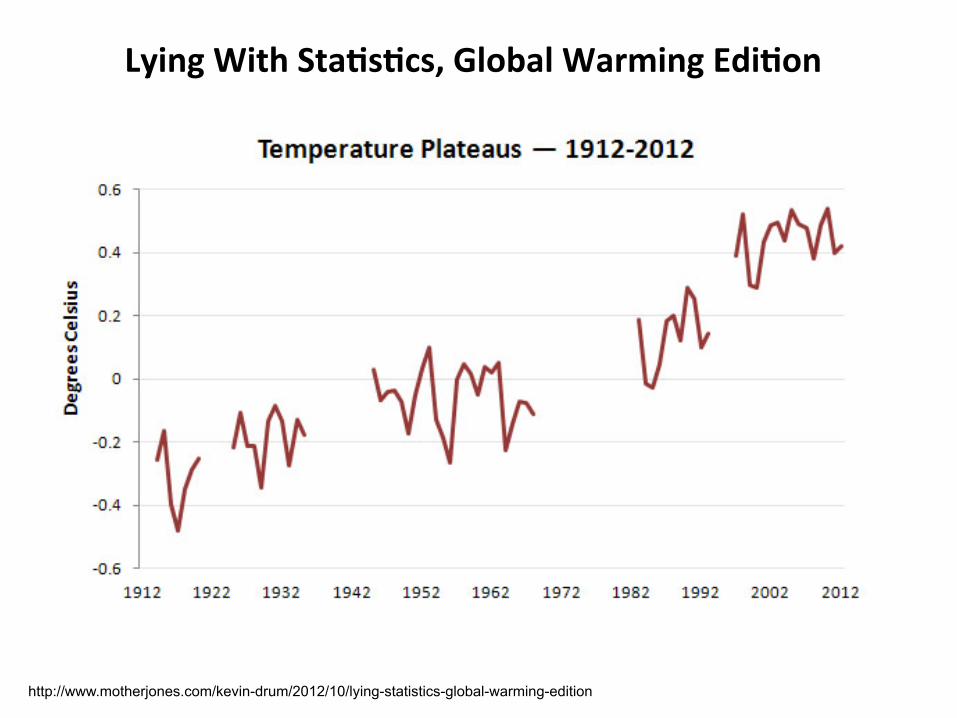
Lying With Sta2s2cs, Global Warming Edi2on
http://www.motherjones.com/kevin-drum/2012/10/lying-statistics-global-warming-edition

Each of the last three decades has been successively warmer at the Earth’s surface than any preceding decade since 1850.
In the Northern Hemisphere, 1983–2012 was likely the warmest 30-year period of the last 1400 years (medium confidence).
(IPC
C 2
013,
Fig
. SP
M.1
a)

AR5 WGI SPM - Approved version / subject to final copyedit
Change in average surface temperature 1901-2012
Warming in the climate system is unequivocal

AR5 WGI SPM - Approved version / subject to final copyedit
Change in average sea-level change

Muir Glacier and Inlet (1895) (Alaska)
h"p://www.weather.com/news/science/environment/alaskas-‐glaciers-‐capturing-‐earth-‐changing-‐our-‐eyes-‐20131125?cm_ven=Email&cm_cat=ENVIRONMENT_us_share
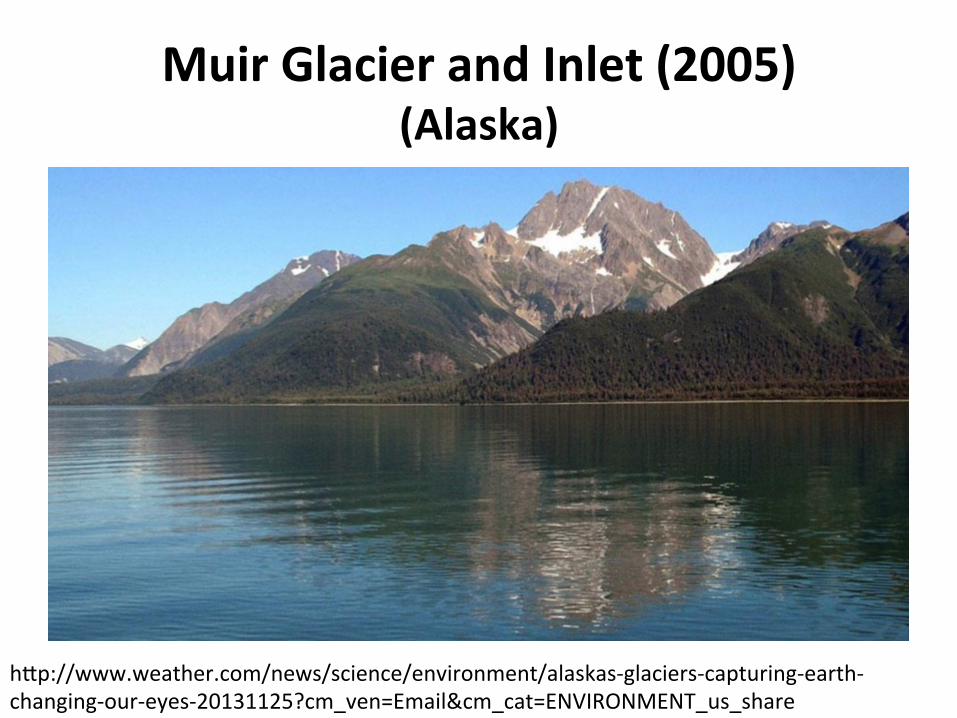
Muir Glacier and Inlet (2005) (Alaska)
h"p://www.weather.com/news/science/environment/alaskas-‐glaciers-‐capturing-‐earth-‐changing-‐our-‐eyes-‐20131125?cm_ven=Email&cm_cat=ENVIRONMENT_us_share
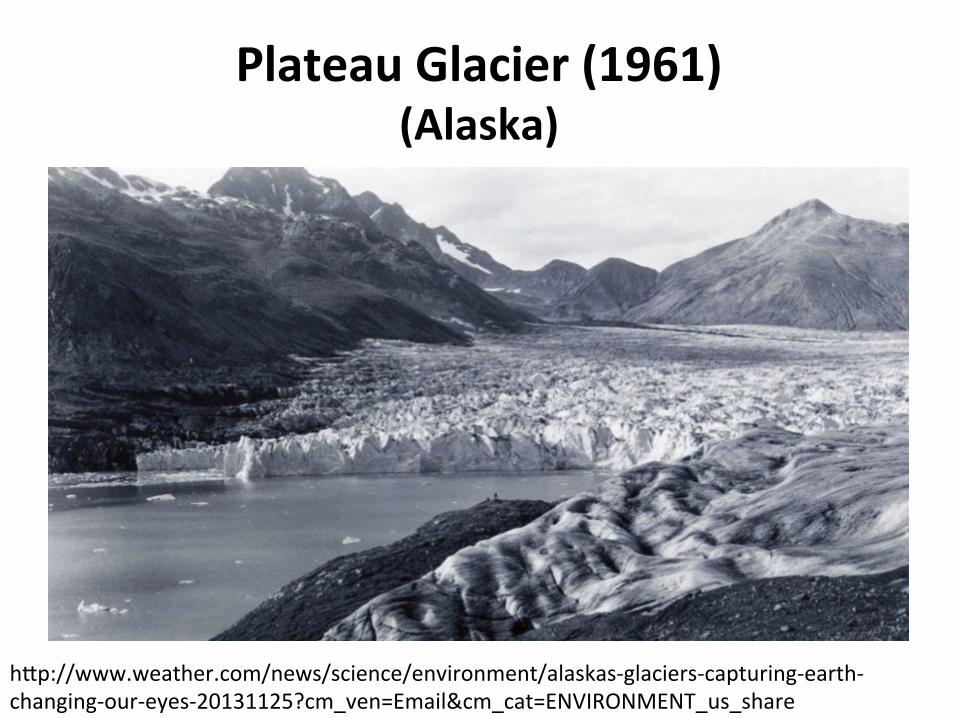
Plateau Glacier (1961) (Alaska)
h"p://www.weather.com/news/science/environment/alaskas-‐glaciers-‐capturing-‐earth-‐changing-‐our-‐eyes-‐20131125?cm_ven=Email&cm_cat=ENVIRONMENT_us_share
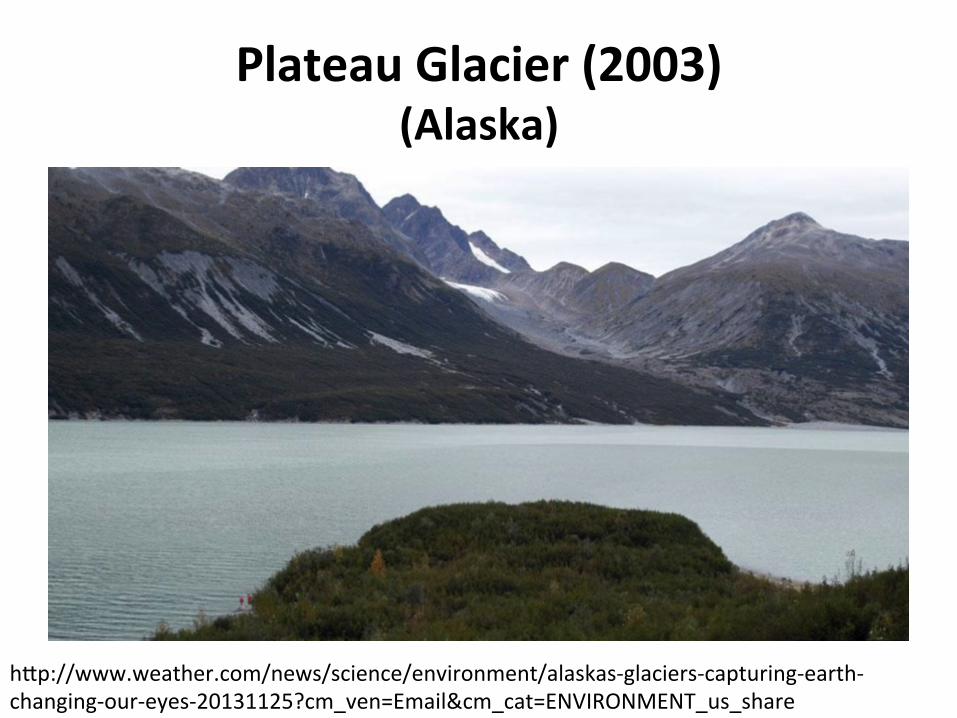
Plateau Glacier (2003) (Alaska)
h"p://www.weather.com/news/science/environment/alaskas-‐glaciers-‐capturing-‐earth-‐changing-‐our-‐eyes-‐20131125?cm_ven=Email&cm_cat=ENVIRONMENT_us_share
AR5 WGI SPM - Approved version / subject to final copyedit
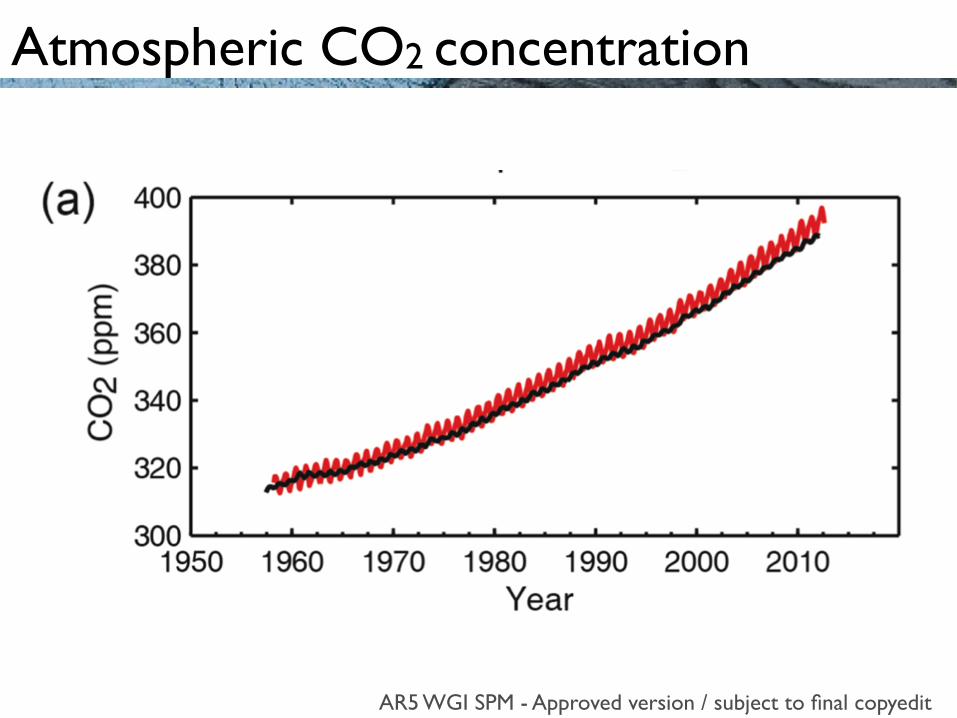
Atmospheric CO2 concentration
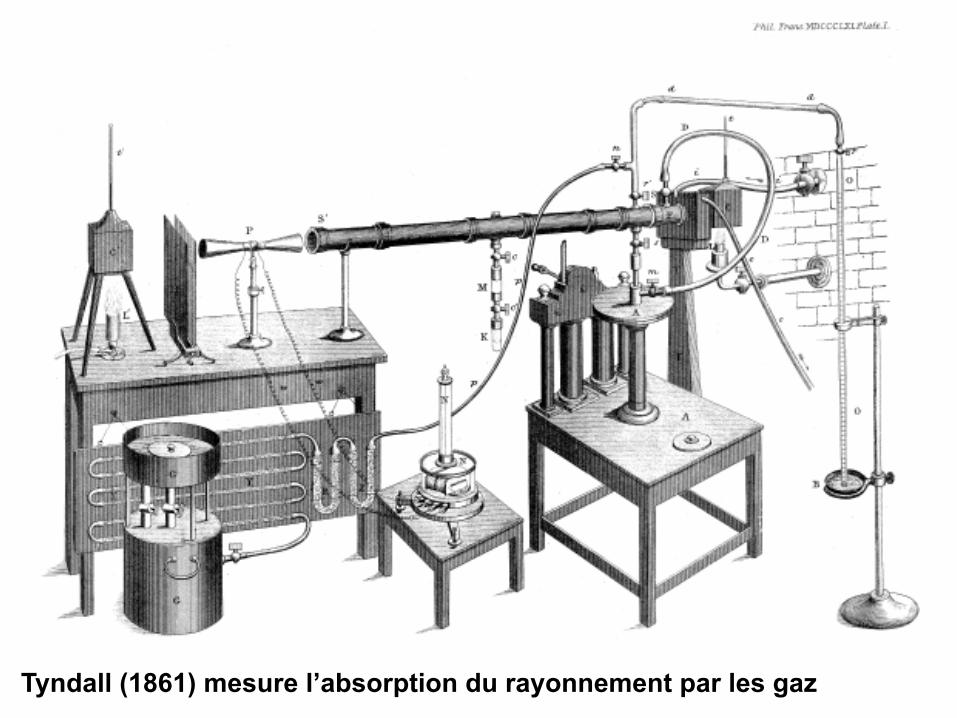
Tyndall (1861) mesure l’absorption du rayonnement par les gaz
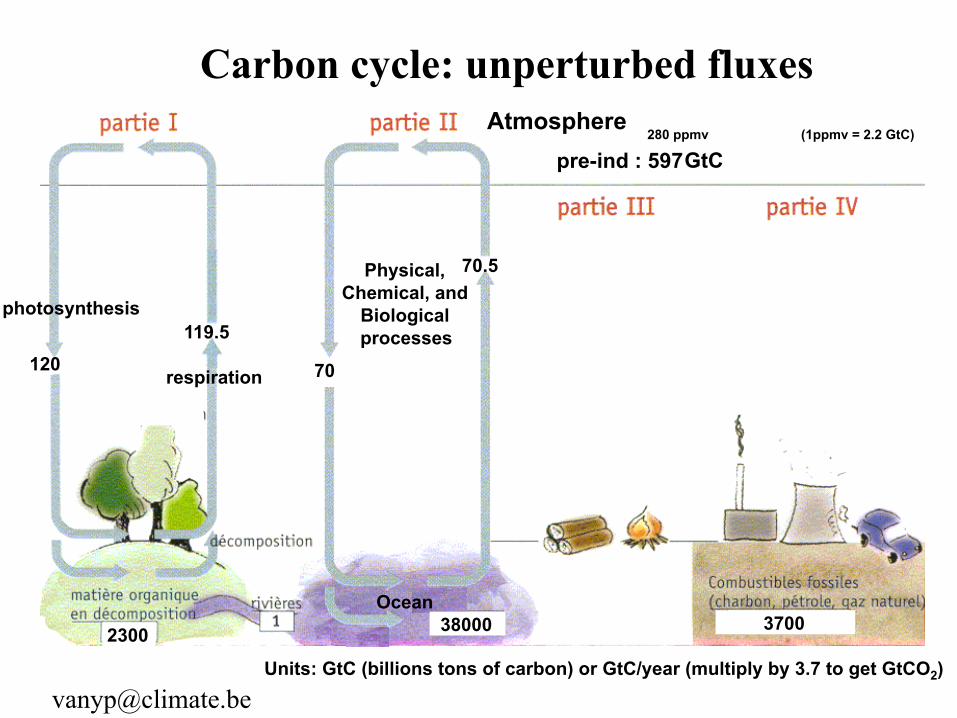
Carbon cycle: unperturbed fluxes
Units: GtC (billions tons of carbon) or GtC/year (multiply by 3.7 to get GtCO2)
120
70.5
70
2300
Atmosphere pre-ind : 597
38000 Ocean
3700
respiration
Physical,
Chemical, and Biological
processes photosynthesis
119.5
280 ppmv (1ppmv = 2.2 GtC) GtC

Carbon cycle: perturbed by human activities (numbers for the decade 1990-1999s, based on IPCC AR4)
Units: GtC (billions tons of carbon) or GtC/year
120
70.5
70
2300
Atmosphere pre-ind : 597
38000 Ocean
3700
GtC + 3.2/yr
déforestation (& land use changes) Fossil fuels
6.4
-244 +120 -40
1.6 sinks
2.6 respiration
2.2
Physical, Chemical, and
Biological processes
photosynthesis 119.5
[email protected] Stocks!
280 ppmv + 1.5 ppmv/yr (1ppmv = 2.2 GtC)

800,000 Year Record of Carbon Dioxide Concentration
U.S. Global Change Research Program:Lüthi et al.; Tans; IIASA2
Atmospheric CO2 over the last 800000 years
AR3 AR2
AR1 AR4
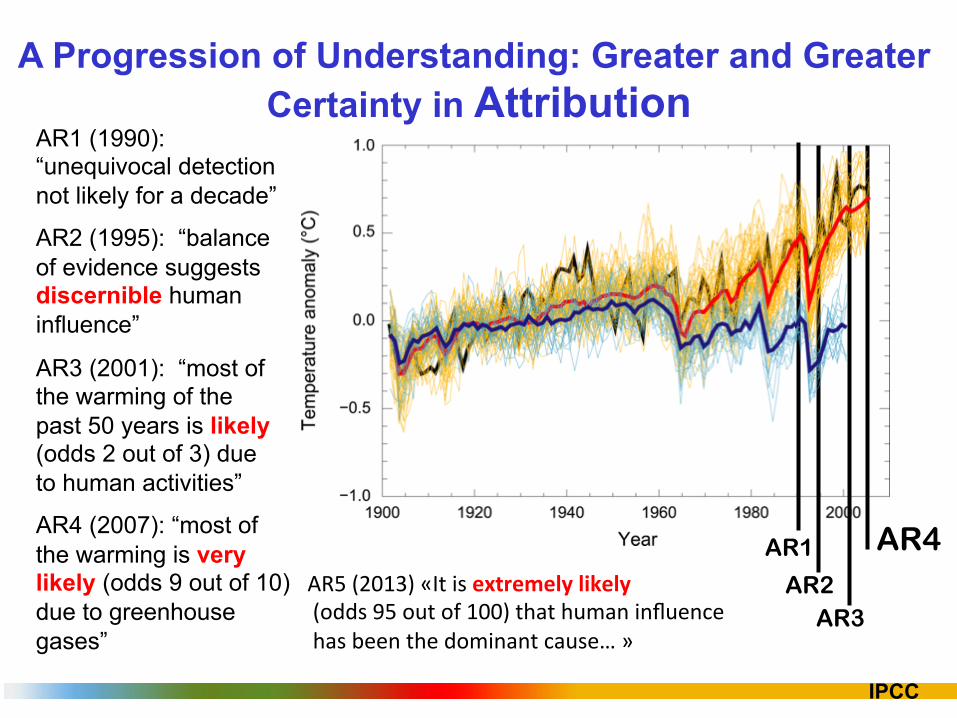
A Progression of Understanding: Greater and Greater Certainty in Attribution
AR1 (1990): “unequivocal detection not likely for a decade”
AR2 (1995): “balance of evidence suggests discernible human influence”
AR3 (2001): “most of the warming of the past 50 years is likely (odds 2 out of 3) due to human activities”
AR4 (2007): “most of the warming is very likely (odds 9 out of 10) due to greenhouse gases”
IPCC
AR5 (2013) «It is extremely likely (odds 95 out of 100) that human influence has been the dominant cause… »

RCP Scenarios: Atmospheric CO2 concentration
AR5, chapter 12. WGI- Adopted version / subject to final copyedit
Three stabilisation scenarios: RCP 2.6 to 6 One Business-as-usual scenario: RCP 8.5

Global surface temperature change for the end of the 21st century is likely to exceed 1.5°C
relative to 1850 for all scenarios
(IPC
C 2
013,
Fig
. SP
M.7
a)
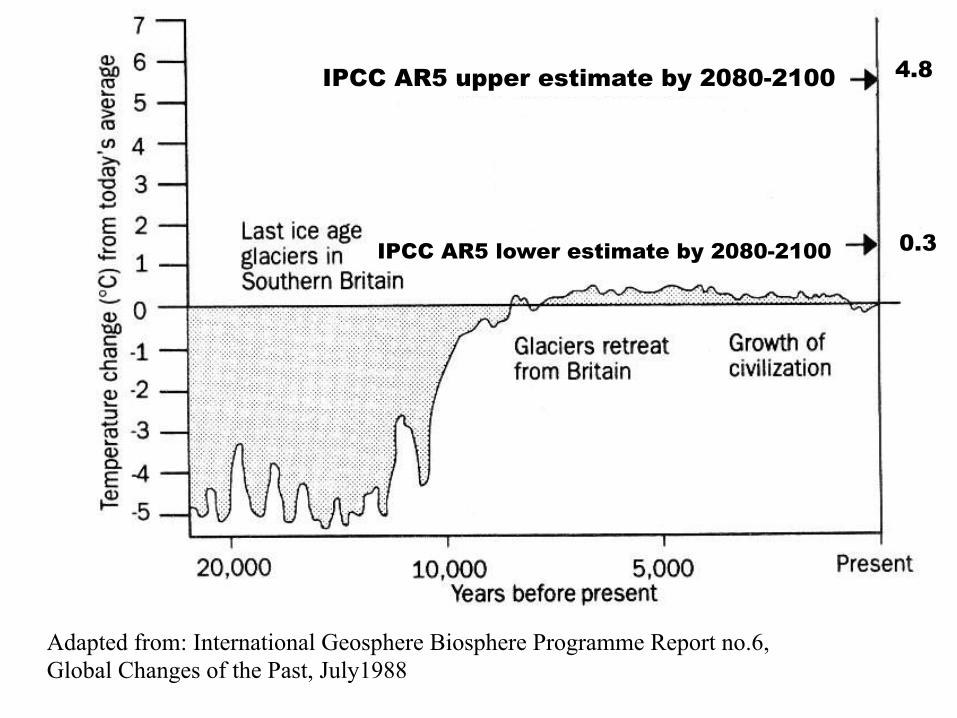
0.3
4.8
IPCC AR5 lower estimate by 2080-2100
IPCC AR5 upper estimate by 2080-2100
Adapted from: International Geosphere Biosphere Programme Report no.6, Global Changes of the Past, July1988

18-20000 years ago (Last Glacial Maximum) With permission from Dr. S. Joussaume, in « Climat d’hier à demain », CNRS éditions.

Today, with +4-5°C globally With permission from Dr. S. Joussaume, in « Climat d’hier à demain », CNRS éditions.

AR5 WGI SPM - Approved version / subject to final copyedit
Surface temperature projections
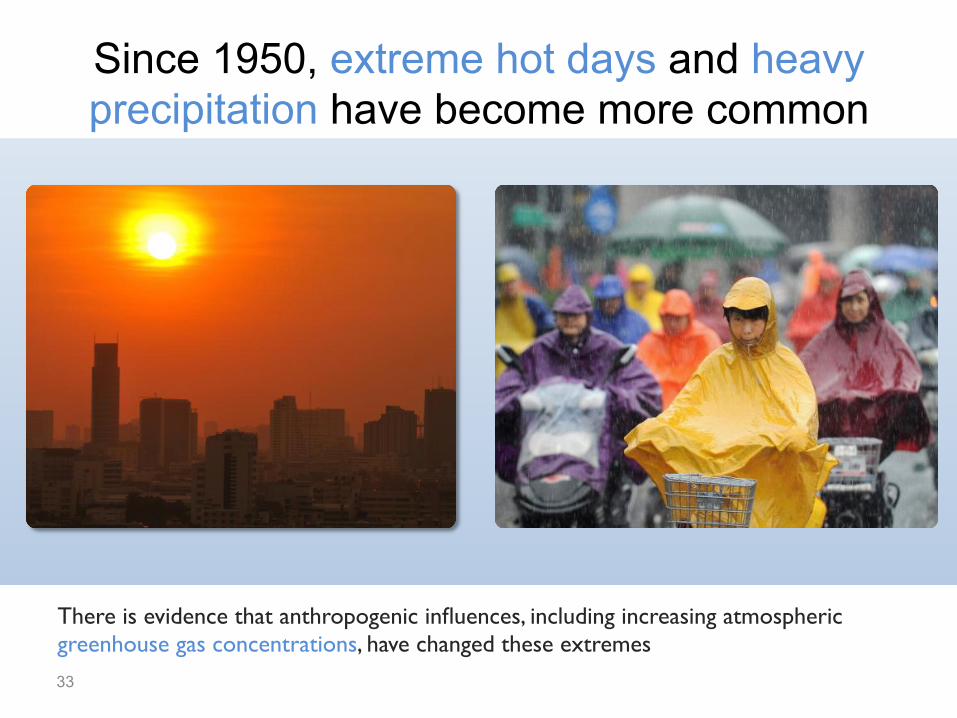
Since 1950, extreme hot days and heavy precipitation have become more common
33
There is evidence that anthropogenic influences, including increasing atmospheric greenhouse gas concentrations, have changed these extremes
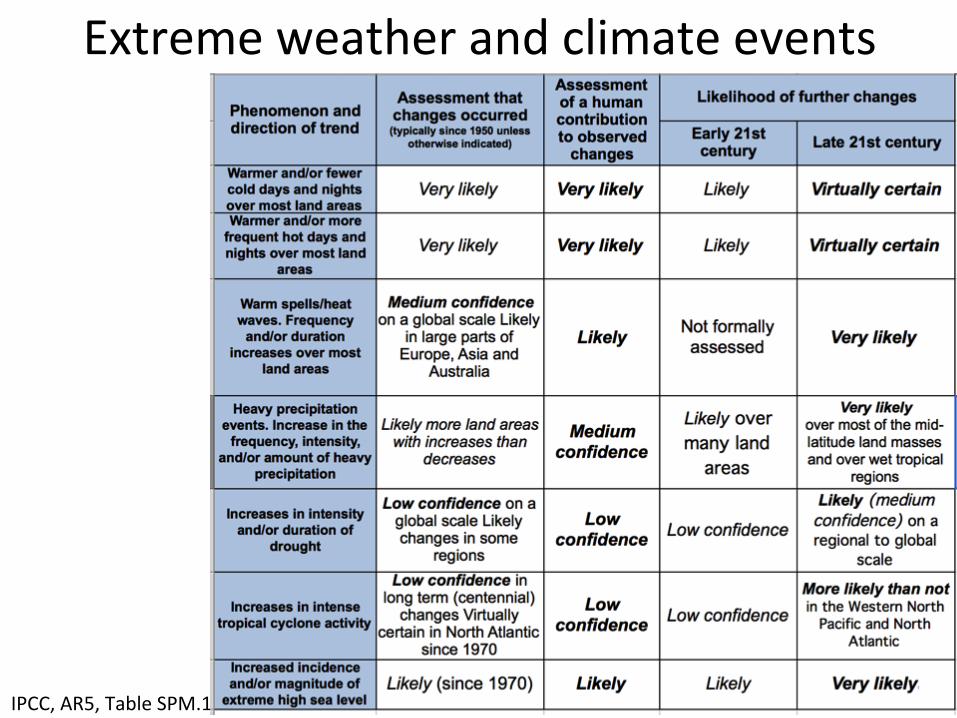
Extreme weather and climate events
IPCC, AR5, Table SPM.1
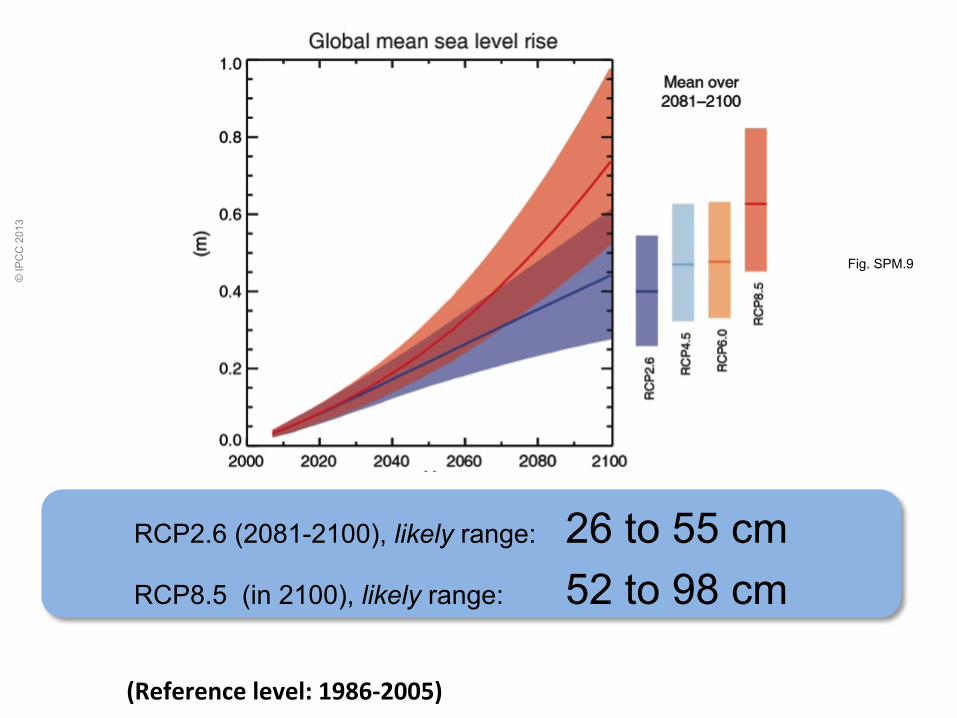
RCP2.6 (2081-2100), likely range: 26 to 55 cm RCP8.5 (in 2100), likely range: 52 to 98 cm
Fig. SPM.9
© IP
CC
201
3
(Reference level: 1986-‐2005)
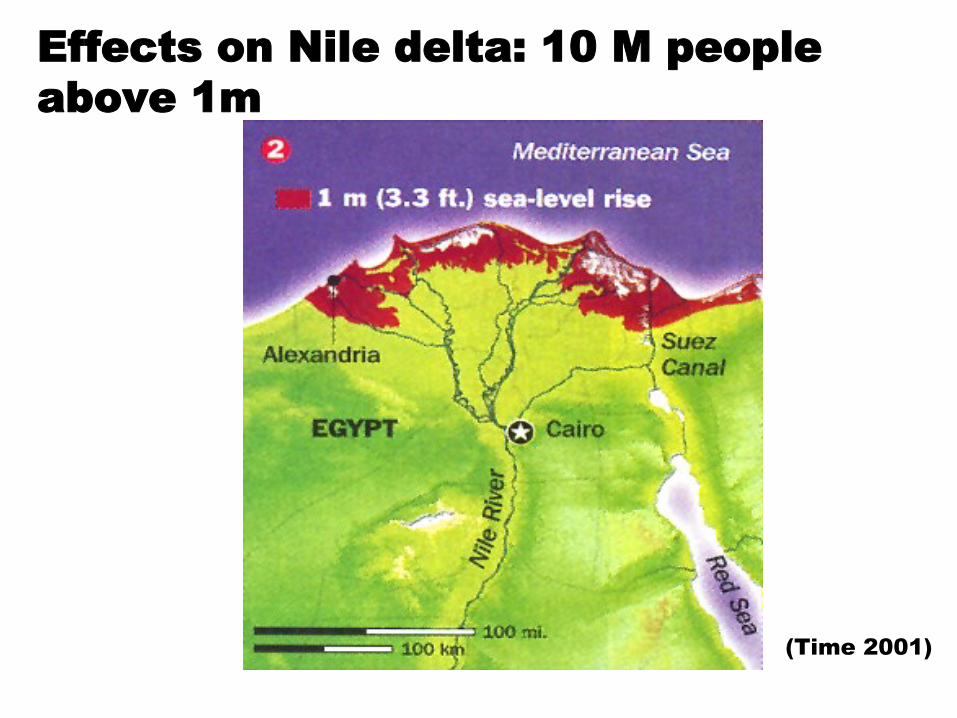
(Time 2001)
Effects on Nile delta: 10 M people above 1m
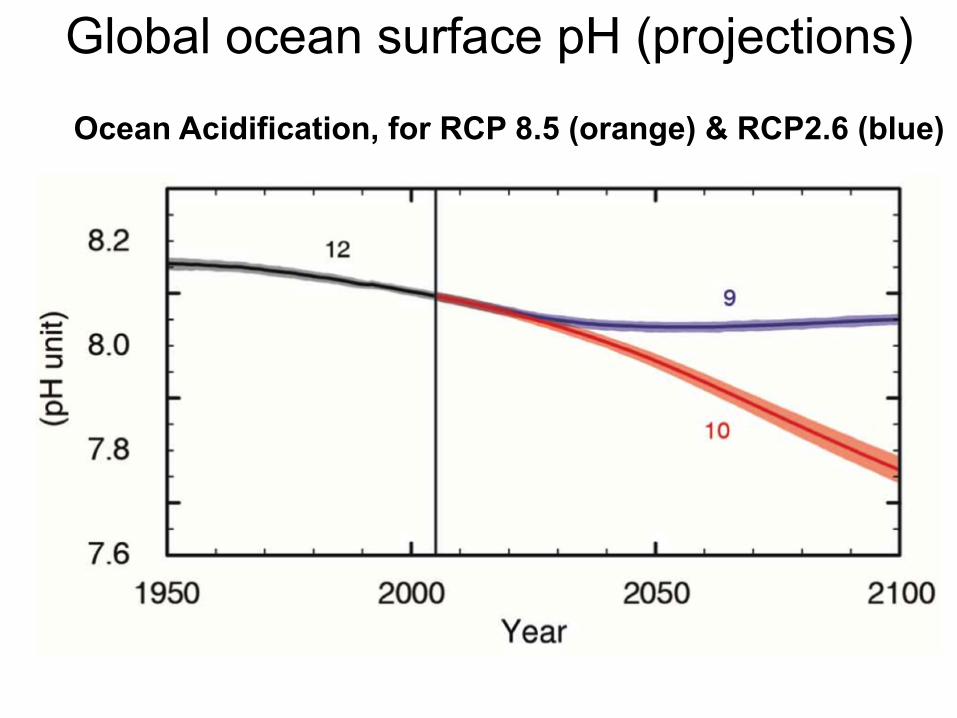
Global ocean surface pH (projections)
Ocean Acidification, for RCP 8.5 (orange) & RCP2.6 (blue)

Oceans are Acidifying Fast…
Changes in pH over the last 25 million years
Turley et al. 2006
• It is happening now, at a speed and to a level not experienced by marine organisms for about 60 million years • Mass extinctions linked to previous ocean acidification events
• Takes 10,000’s of years to recover
“Today is a rare event in the history of the World”
Slide courtesy of Carol Turley, PML
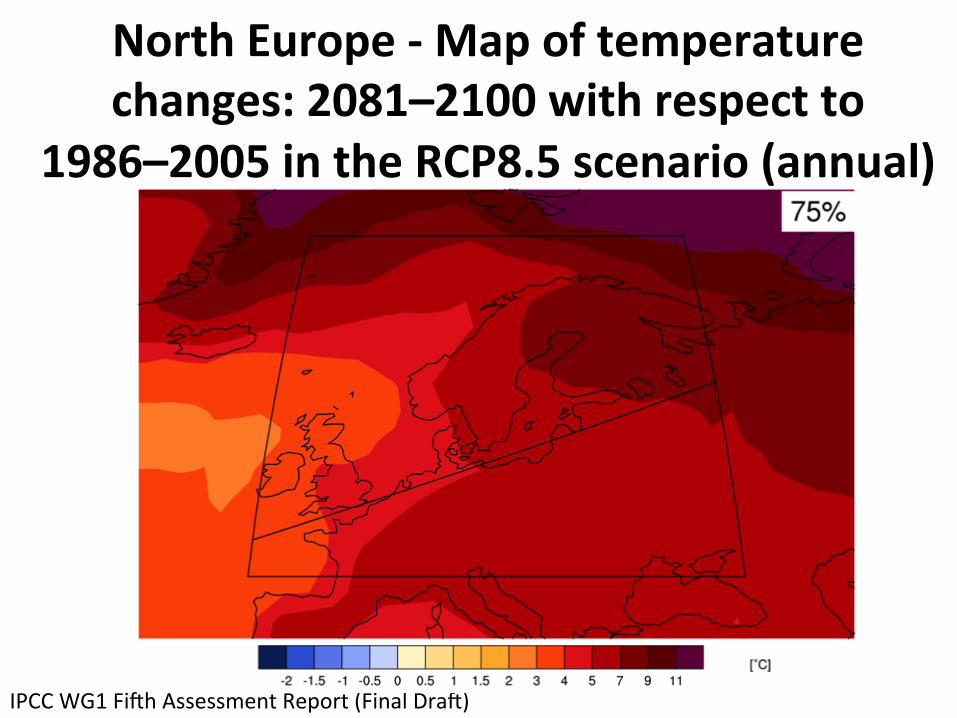
North Europe -‐ Map of temperature changes: 2081–2100 with respect to
1986–2005 in the RCP8.5 scenario (annual)
IPCC WG1 Fiih Assessment Report (Final Drai)
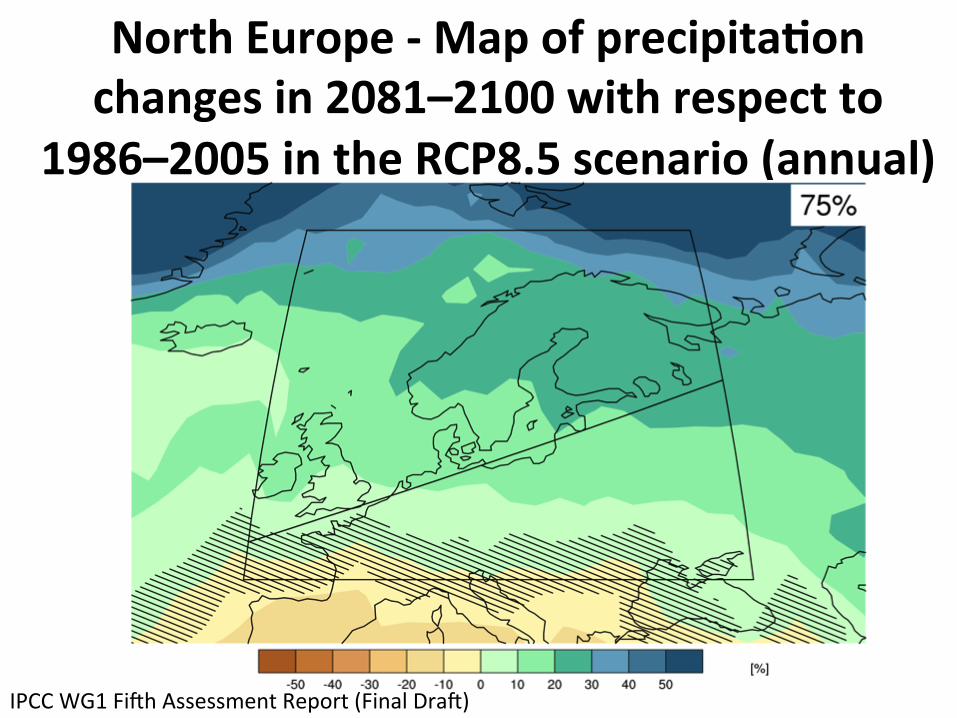
North Europe -‐ Map of precipita2on changes in 2081–2100 with respect to
1986–2005 in the RCP8.5 scenario (annual)
IPCC WG1 Fiih Assessment Report (Final Drai)

Precipita2on change South Europe/Mediterranean annual
IPCC WG1 Fiih Assessment Report-‐Atlas of Global and Regional Climate Projec8ons (Final Drai)

Figure TS.6. Projected risks due to critical climate change impacts on ecosystems
20% - 30% of plants and animals species likely at “increased risk of extinction”
if ∆T 2.0°C - 3.0°C (above pre-industrial
temperature)

Number of people (millions) with an increase in water stress"
Source: IPCC AR4 (2007), WGII, Ch.9.4.1"

AR4 Figure TS.7. Sensitivity of cereal yield to climate change
Regions most affected
• The Arctic • Sub-Saharan Africa • Small islands • Large megadeltas

In all regions, there are some areas and communities which
are particularly vulnerable • The poor • Young children • The elderly
Excerpts from IPCC AR4 WG2 (Chapter Africa)
• Africa is one of the most vulnerable continents to climate change and climate variability, a situation aggravated by the interaction of ‘multiple stresses’, occurring at various levels, and low adaptive capacity (high confidence).
• (…) and this vulnerability is exacerbated by existing developmental challenges (…) These in turn have contributed to Africa’s weak adaptive capacity, increasing the continent’s vulnerability to projected climate change.

Excerpts from IPCC AR4 WG2 (Chapter Africa)
• African farmers have developed several adaptation options to cope with current climate variability, but such adaptations may not be sufficient for future changes of climate (high confidence).
• Human or societal adaptive capacity, identified as being low for Africa in the TAR, is now better understood (…) However, such advances in the science of adaptation to climate change and variability (…), show that these adaptations may be insufficient to cope with future changes of climate.

Excerpts from IPCC AR4 WG2 (Chapter Africa)
• Agricultural production and food security (including access to food) in many African countries and regions are likely to be severely compromised by climate change and climate variability (high confidence).
• A number of countries in Africa already face semi-arid conditions that make agriculture challenging, and climate change will be likely to reduce the length of growing season as well as force large regions of marginal agriculture out of production. Projected reductions in yield in some countries could be as much as 50% by 2020, and crop net revenues could fall by as much as 90% by 2100, with small-scale farmers being the most affected. This would adversely affect food security in the continent.

Excerpts from IPCC AR4 WG2 (Chapter Africa)
• Climate change will aggravate the water stress currently faced by some countries, while some countries that currently do not experience water stress will become at risk of water stress (very high confidence).
• Climate change and variability are likely to impose additional pressures on water availability, water accessibility and water demand in Africa.

Excerpts from IPCC AR4 WG2 (Chapter Africa)
• Even without climate change, several countries in Africa, particularly in northern Africa, will exceed the limits of their economically usable land-based water resources before 2025. About 25% of Africa’s population (about 200 million people) currently experience high water stress.
• The population at risk of increased water stress in Africa is projected to be between 75-250 million and 350-600 million people by the 2020s and 2050s, respectively.

Excerpts from IPCC AR4 WG2 (Chapter Africa)
• Changes in a variety of ecosystems are already being detected, particularly in southern African ecosystems, at a faster rate than anticipated (very high confidence).
• Climate change, interacting with human drivers such as deforestation and forest fires, are a threat to Africa’s forest ecosystems. Changes in grasslands and marine ecosystems are also noticeable. It is estimated that, by the 2080s, the proportion of arid and semi-arid lands in Africa is likely to increase by 5-8%. Climate change impacts on Africa’s ecosystems will probably have a negative effect on tourism as, according to one study, between 25 and 40% of mammal species in national parks in sub-Saharan Africa will become endangered.
Excerpts from IPCC AR4 WG2 (Chapter Africa)
• Climate variability and change could result in low-lying lands being inundated, with resultant impacts on coastal settlements (high confidence).
• Climate variability and change, coupled with human-induced changes, may also affect ecosystems e.g., mangroves and coral reefs, with additional consequences for fisheries and tourism.
Excerpts from IPCC AR4 WG2 (Chapter Africa)
• Human health, already compromised by a range of factors, could be further negatively impacted by climate change and climate variability, e.g., malaria in southern Africa and the East African highlands (high confidence).
• It is likely that climate change will alter the ecology of some disease vectors in Africa, and consequently the spatial and temporal transmission of such diseases. Most assessments of health have concentrated on malaria and there are still debates on the attribution of malaria resurgence in some African areas.

Cumulative emissions of CO2 largely determine global mean surface warming by the late 21st century and beyond.
Fig. SPM.10
© IP
CC
201
3
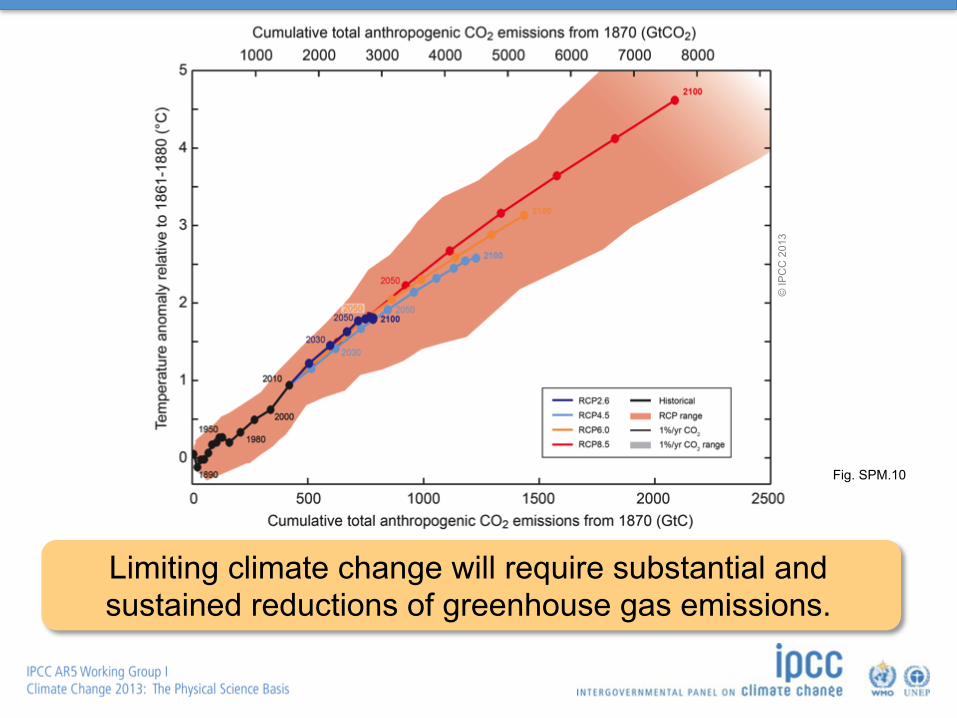
Fig. SPM.10
Limiting climate change will require substantial and sustained reductions of greenhouse gas emissions.
© IP
CC
201
3
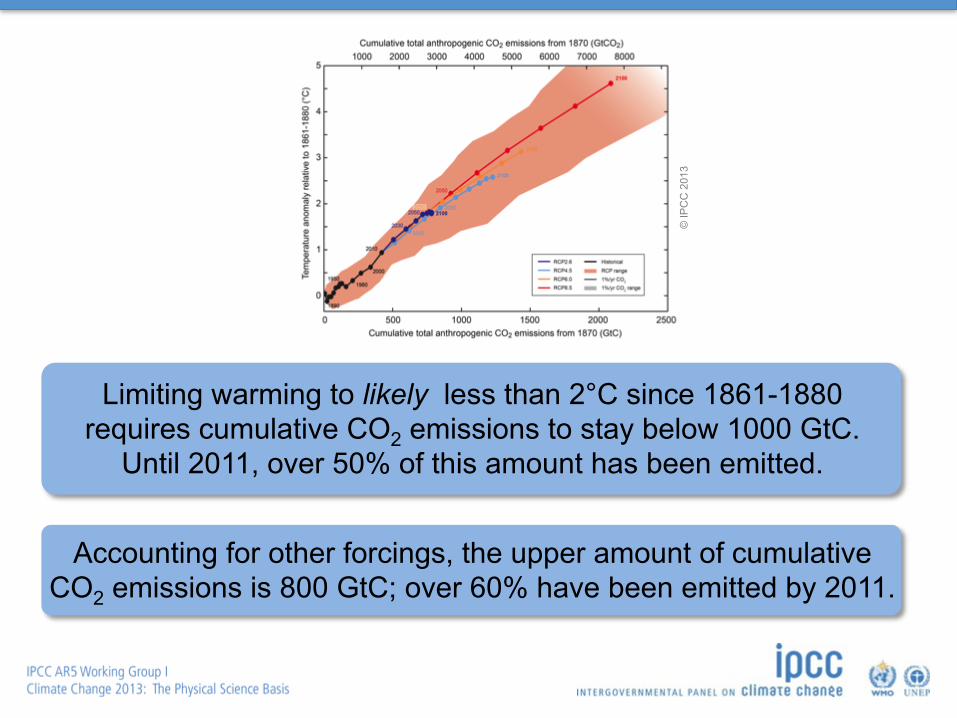
Limiting warming to likely less than 2°C since 1861-1880 requires cumulative CO2 emissions to stay below 1000 GtC.
Until 2011, over 50% of this amount has been emitted.
© IP
CC
201
3
Accounting for other forcings, the upper amount of cumulative CO2 emissions is 800 GtC; over 60% have been emitted by 2011.

Compatible fossil fuel emissions simulated by the CMIP5 models for the four RCP scenarios
AR5 WGI TS – Approved version/subject to final copy edit
IPCC
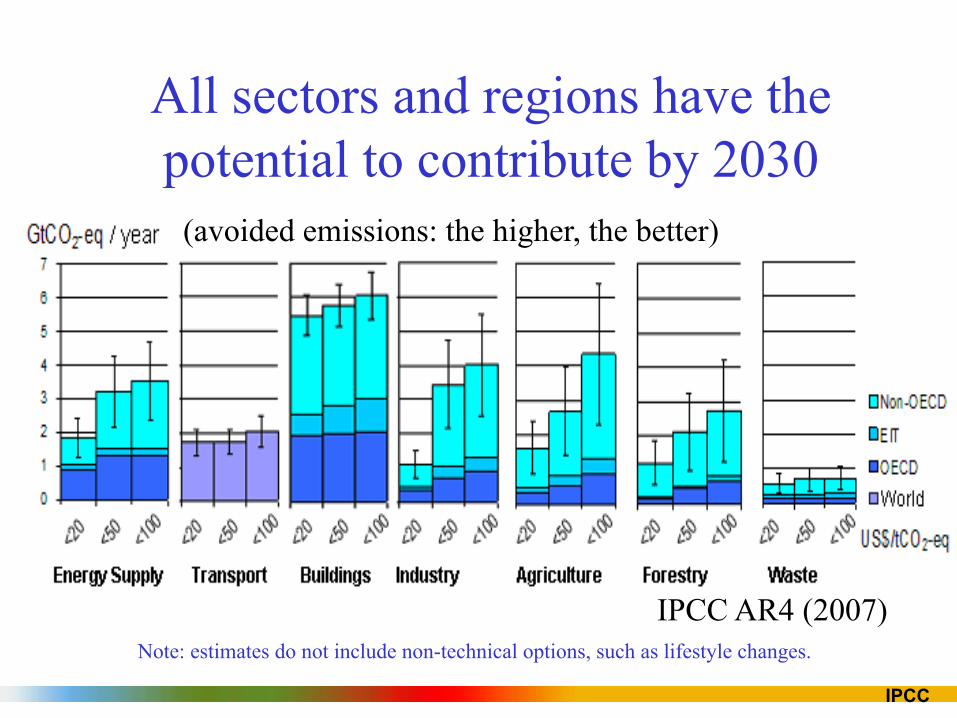
All sectors and regions have the potential to contribute by 2030
Note: estimates do not include non-technical options, such as lifestyle changes.
(avoided emissions: the higher, the better)
IPCC AR4 (2007)

IPCC
Role of Technology, following IPCC AR4
Models:

Jean-Pascal van Ypersele ([email protected])
Useful links:
www.ipcc.ch : IPCC www.climatechange2013.org : IPCC WGI AR5 www.climate.be/vanyp : my slides and other
documents www.skepticalscience.com: excellent
responses to contrarians arguments On Twitter: @JPvanYpersele