San Bernardino County - Official Website · 2017. 6. 5. · San Bernardino County - Official Website

Copyright © 2014 Chmura Economics & Analytics
The San Bernardino County Economy San Bernardino County
Regional Economic Update
April 9, 2014
Copyright © 2013 Chmura Economics & Analytics
Overview • National economy continues to grow
– Risk to up and downside fairly equal – Federal reductions in spending are a drag on growth
• Uncertainty is high • So we need to assess risk
– For the nation? – For industries/firms? – For regions?
• California employment growth at national pace but unemployment rate is higher
• Inland Empire employment growth is slower with elevated unemployment rate – Continued strategies needed around long-term unemployed – Obsolete skills due to increased productivity and off shoring – Strategies should be considered around ethnic groups/education
attainment
Copyright © 2013 Chmura Economics & Analytics
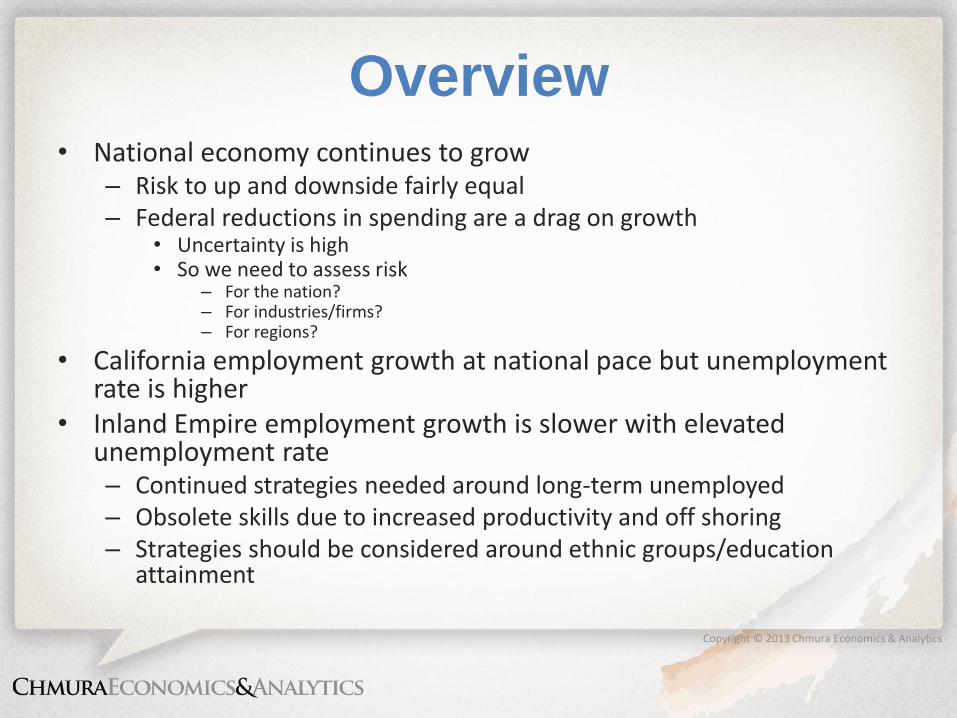
Recession Ended in June 2009
Employment Almost to Previous Peak
Source: U.S. Department of Labor. Data through January 2014 (preliminary)
126,000
128,000
130,000
132,000
134,000
136,000
138,000
140,000
Jan-02 Jan-04 Jan-06 Jan-08 Jan-10 Jan-12 Jan-14
Nonfarm Employment
Copyright © 2013 Chmura Economics & Analytics
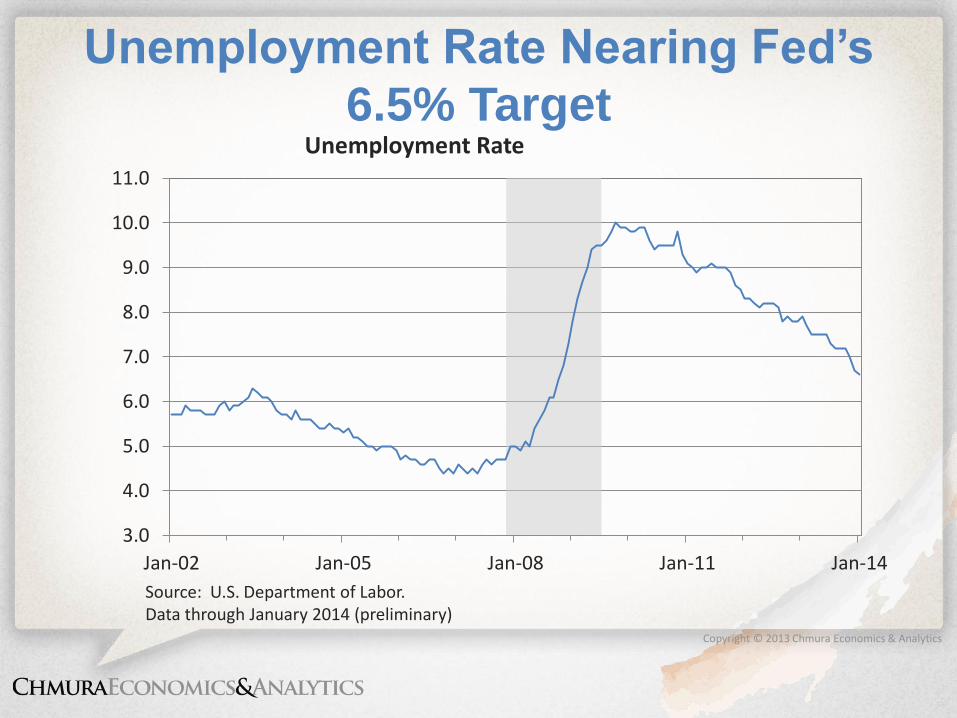
Unemployment Rate Nearing Fed’s
6.5% Target
3.0
4.0
5.0
6.0
7.0
8.0
9.0
10.0
11.0
Jan-02 Jan-05 Jan-08 Jan-11 Jan-14
Unemployment Rate
Source: U.S. Department of Labor. Data through January 2014 (preliminary)

Copyright © 2013 Chmura Economics & Analytics
Labor Market Remains Weak

Copyright © 2013 Chmura Economics & Analytics
Labor Market is Weaker than
Unemployment Rate Suggests Participation Rate: % 16 years and over in the labor market
Source: U.S. Department of Labor Statistics. Data through January 2014
Copyright © 2013 Chmura Economics & Analytics
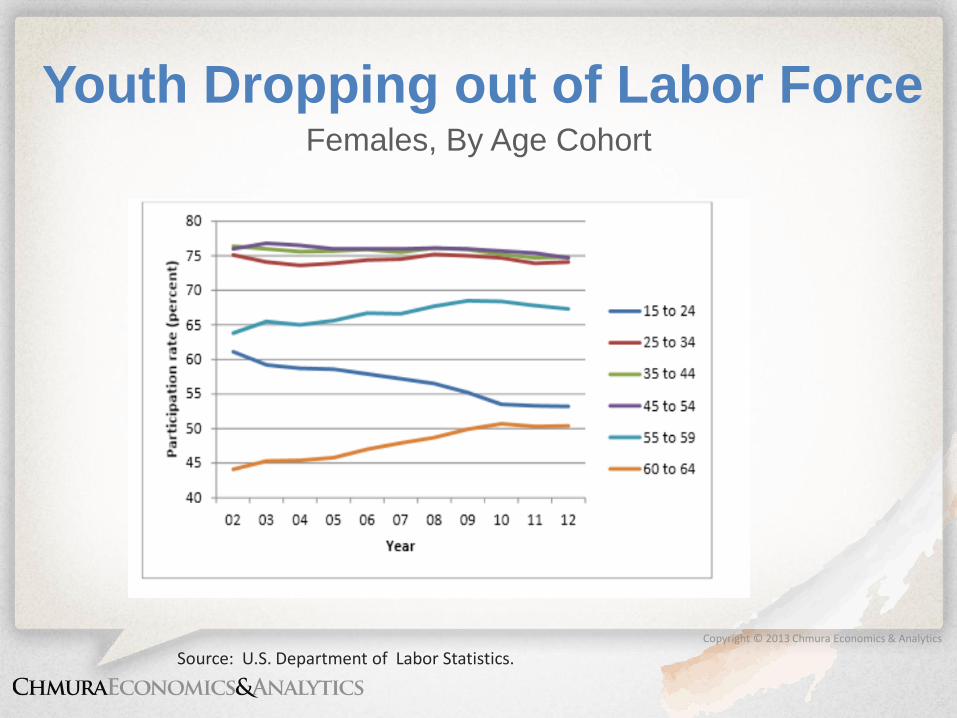
Youth Dropping out of Labor Force Females, By Age Cohort
Source: U.S. Department of Labor Statistics.

Copyright © 2013 Chmura Economics & Analytics
Housing Market Improving:
Home Prices are Increasing
Source: Federal Housing Finance Agency
Copyright © 2013 Chmura Economics & Analytics
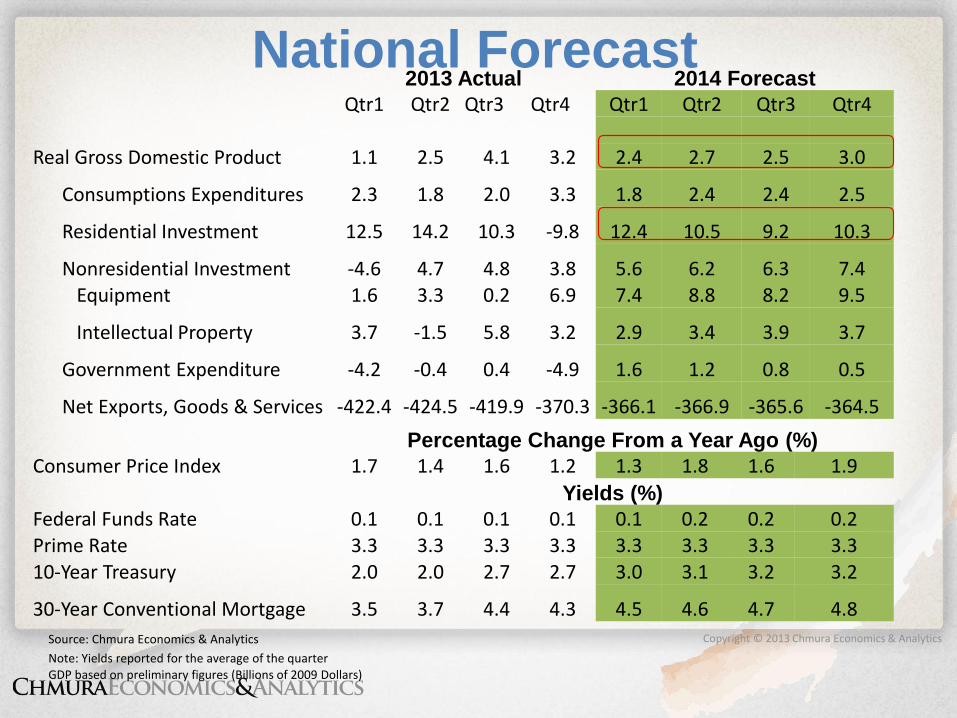
National Forecast 2013 Actual 2014 Forecast
Qtr1 Qtr2 Qtr3 Qtr4 Qtr1 Qtr2 Qtr3 Qtr4 Real Gross Domestic Product 1.1 2.5 4.1 3.2 2.4 2.7 2.5 3.0
Consumptions Expenditures 2.3 1.8 2.0 3.3 1.8 2.4 2.4 2.5
Residential Investment 12.5 14.2 10.3 -9.8 12.4 10.5 9.2 10.3
Nonresidential Investment -4.6 4.7 4.8 3.8 5.6 6.2 6.3 7.4 Equipment 1.6 3.3 0.2 6.9 7.4 8.8 8.2 9.5
Intellectual Property 3.7 -1.5 5.8 3.2 2.9 3.4 3.9 3.7
Government Expenditure -4.2 -0.4 0.4 -4.9 1.6 1.2 0.8 0.5
Net Exports, Goods & Services -422.4 -424.5 -419.9 -370.3 -366.1 -366.9 -365.6 -364.5
Percentage Change From a Year Ago (%)
Consumer Price Index 1.7 1.4 1.6 1.2 1.3 1.8 1.6 1.9 Yields (%)
Federal Funds Rate 0.1 0.1 0.1 0.1 0.1 0.2 0.2 0.2 Prime Rate 3.3 3.3 3.3 3.3 3.3 3.3 3.3 3.3 10-Year Treasury 2.0 2.0 2.7 2.7 3.0 3.1 3.2 3.2
30-Year Conventional Mortgage 3.5 3.7 4.4 4.3 4.5 4.6 4.7 4.8
Source: Chmura Economics & Analytics
Note: Yields reported for the average of the quarter GDP based on preliminary figures (Billions of 2009 Dollars)

Copyright © 2013 Chmura Economics & Analytics
Federal Cuts are Evident in Real GDP DoD Contracting since Q4 2012
-10.0
-8.0
-6.0
-4.0
-2.0
0.0
2.0
4.0
6.0
8.0
10.0
1997 1999 2001 2003 2005 2007 2009 2011 2013
Real Gross Domestic Product Quarterly Annualized Percent Change

Copyright © 2013 Chmura Economics & Analytics
Cuts are Evident in Real GDP DoD Contracting since Q4 2012
-10.0
-8.0
-6.0
-4.0
-2.0
0.0
2.0
4.0
6.0
8.0
10.0
1997 1999 2001 2003 2005 2007 2009 2011 2013
Real Gross Domestic Product Quarterly Annualized Percent Change

Copyright © 2013 Chmura Economics & Analytics
Change in Federal Contract
Spending Per Worker, 2011-2012
Source: USASpending.gov and Chmura Economics & Analytics

Copyright © 2013 Chmura Economics & Analytics
Federal Contract Awards Both DoD -15% & Non-DoD: +15% in California for FY 2013
$-
$10.000
$20.000
$30.000
$40.000
$50.000
$60.000
2006 2007 2008 2009 2010 2011 2012 2013
Non DoD $10.356 $11.220 $11.943 $13.321 $14.263 $11.879 $11.177 $12.835
DoD $33.439 $36.529 $38.955 $42.430 $41.938 $41.163 $40.705 $34.736
Bill
ion
s
Source: Chmura Economics & Analytics and USASpending.gov.

Copyright © 2013 Chmura Economics & Analytics
Federal Contract Awards Top 20 Firms, California, FY 2011 - 13
Rank Company Award Amount Contracts 1 Lockheed Martin Corp $17,358,176,338 4,407 2 Boeing Company $15,231,924,390 4,008 3 Huntington Ingalls Inds Inc $10,326,291,571 10,654 4 Health Net Federal Services $9,270,096,298 596 5 General Atomic Technologies Corp $6,701,899,802 1,864 6 California Institute Of Technology $5,021,519,004 7,966 7 Raytheon Company $4,155,392,388 4,112 8 Mckesson Corp $4,045,934,565 39,735 9 Lawrence Livermore National Security $3,876,143,455 155
10 California State Of $3,069,507,696 3,776 11 General Dynamics Corp $2,624,839,987 3,644 12 Aerospace Corp $2,575,609,854 602 13 Saic Inc $2,121,520,820 6,724 14 Bae Systems Plc $2,095,447,222 5,555 15 Lockheed Missiles & Space Comp $1,538,603,981 133 16 Chevron Corp $1,439,584,574 61 17 Leland Stanford Junior University, The $1,178,508,524 542 18 United Technologies Corp $1,097,143,556 1,655 19 L-3 Cmmunications Holdings Inc $918,508,101 4,680 20 Menlo Worldwide Government Services $892,847,377 53
Total $95,539,499,504 100,922
Source: Chmura Economics & Analytics and USASpending.gov.

Copyright © 2013 Chmura Economics & Analytics
Federal Contract Awards, Inland Empire
DoD -23% & Non-DoD +39% in FY 2013
0.0
0.5
1.0
1.5
2.0
2.5
3.0
2006 2007 2008 2009 2010 2011 2012 2013
Non DoD $0.111 $0.248 $0.201 $0.156 $0.228 $0.202 $0.160 $0.223
DoD $0.241 $0.887 $1.035 $1.027 $2.361 $0.907 $1.019 $0.788
Bill
ion
s
Source: Chmura Economics & Analytics and USASpending.gov.

Copyright © 2013 Chmura Economics & Analytics
Federal Contract Awards Top Firms, Inland Empire Region, FY 2011 - 13
Source: Chmura Economics & Analytics and USASpending.gov.
Company Award Amount Contracts Military Deli & Bakery Services $262,415,757 140 Raytheon Company $196,209,751 200 Huntington Ingalls Inds Inc $192,674,821 160 Turner Construction $162,336,483 7 Environmental Systems Res Inst $132,891,800 893 American Beef Packers $159,946,606 77 CDM Construction $100,039,229 5 Edison International $79,031,083 55 Straub-Martin A Joint Venture $78,783,024 29 Cerberus Capital Management Lp $64,303,286 102 Hal Hays Construction, Inc. $52,489,048 73 Parsons Corp $45,918,375 65 Ch2M Hill Companies Ltd $45,718,315 64 Johnson Controls Inc $39,156,319 80 Hensel Phelps Construction Co $38,100,721 42 Loma Linda University $37,703,353 133 Chicago Bridge & Iron Company N.V. $36,957,991 8 T.B. Penick & Sons $36,621,368 16 Management & Training Corp $36,154,834 42 Total $1,797,452,162 2,191

Copyright © 2013 Chmura Economics & Analytics
Courtesy IHS Economics.
Expected Return to Peak
Employment Varies Greatly
Source: IHS Economics.

Copyright © 2013 Chmura Economics & Analytics
-14.00%
-12.00%
-10.00%
-8.00%
-6.00%
-4.00%
-2.00%
0.00%
2.00%
0 7
14
21
28
35
42
49
56
63
70
77
84
91
98
10
5
11
2
11
9
12
6
Emp
loym
ent
as %
of
Pre
vio
us
Pea
k
US actual
CA actual
Inland Empire actual
US w/ 180k jobs per month
CA w/ 25k jobs per month
Inland Empire w/ 2,000 permonth
Source: BLS & JobsEQ
Jul-2014 Dec-2015 Dec-2018
How Long Will it Take to Regain
Lost Employment?

Copyright © 2013 Chmura Economics & Analytics
California’s Outlook
• Employment growth:
– 2.0% in 2013
– 1.8% in 2014
– 2.5% in 2015
• Unemployment falling:
– 8.7% average in 2013
– 8.1% average in 2014
– 7.4% average in 2015
• Housing is getting healthy
– Prices moving up
– Inventory is low
– Foreclosures/distressed sales on the decline
– Investors/cash buyers
– Sales # are good
Mar-2013 UCLA Anderson Forecast
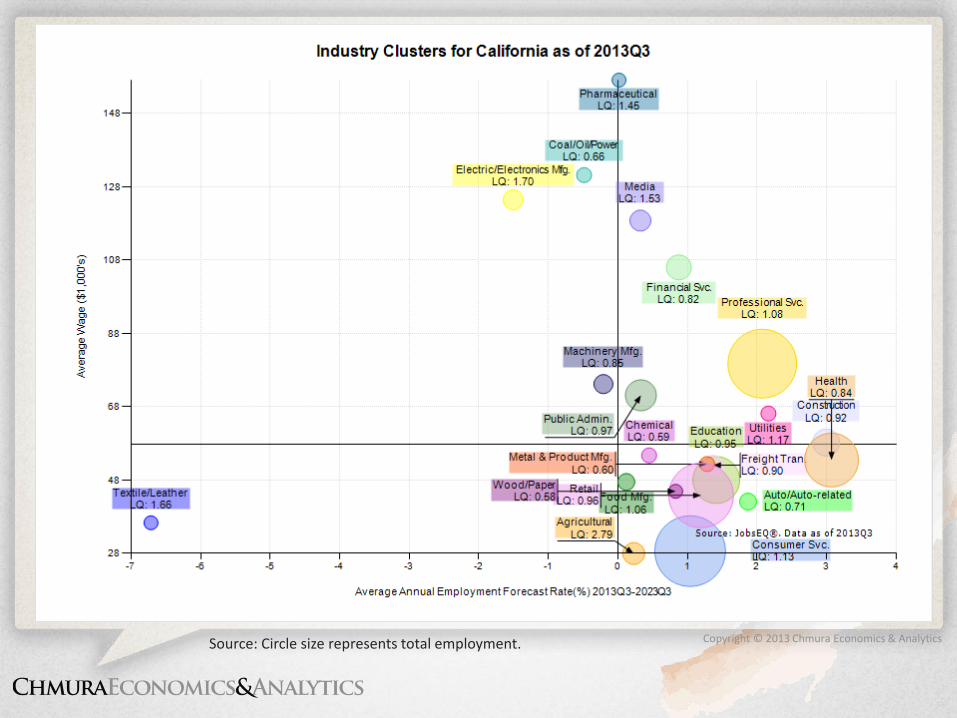
Copyright © 2013 Chmura Economics & Analytics Source: Circle size represents total employment.

Copyright © 2013 Chmura Economics & Analytics
Inland Empire Economy
• Demographic trends
• Recent economic performance & forecasts
• Housing situation
• Industry clusters & competitiveness
• Workforce alignment & training
• Findings/recommendations
Riverside-San Bernardino-Ontario MSA

Copyright © 2013 Chmura Economics & Analytics
Inland Empire Demographics
• Inland Empire
– Average Yearly Pop. Growth 2000-10 ≈ 2.2%
– Working Age Pop. Growth 2020 ≈ 24%
– < 18 years ≈ 29%
– Poverty rate ≈ 15%
– Poor English ≈ 17%
– 47.3% Hispanic or Latino and 6.1% Asian
• California
– Average Yearly Pop. Growth 2000-10 ≈ 0.9%
– Working Age Pop. Growth 2020 ≈ 7%
– < 18 years ≈ 25%
– Poverty rate ≈ 14%
– Poor English ≈ 20%
– 37.6% Hispanic or Latino and 13.0% Asian

Copyright © 2013 Chmura Economics & Analytics
Economic Growth Drivers
• Tailwinds to growth: – Improving national economy (job and wage
growth)
– Population and demographics
– Cyclical up-turn across several sectors
– Improving residential housing market; solid commercial market
• Headwinds to growth: – State & federal belt tightening

Copyright © 2013 Chmura Economics & Analytics
Economic Performance Actual Forecast
San Benardino MSA 2010 2011 2012 2013 2014 2015
Total Employment* -2.4% 0.9% 2.6% 2.1% 1.5% 1.7%
Wages and Salaries** -1.2% 2.7% 3.4% 3.2% 3.1% 3.4%
Real Retail Sales 2.8% 6.5% 6.1% 5.7% 4.8% 3.8%
Building Permits 5.0% -23.9% 23.3% 43.9% 24.8% 18.2%
California State Total 2010 2011 2012 2013 2014 2015
Total Employment* -1.5% 1.1% 2.7% 2.2% 1.8% 2.5%
Wages and Salaries** 1.8% 4.6% 5.9% 4.2% 4.0% 4.8%
Real Retail Sales 3.3% 6.3% 6.0% 6.2% 5.8% 5.9%
Building Permits 24.8% 7.2% 27.8% 36.8% 18.1% 16.6%
*Employment refers to nonagricultural employment.
**Wages and salaries include some options that were exercised. Actual data are through the 3rd quarter of 2013.
All reported series are seasonally adjusted.

Copyright © 2013 Chmura Economics & Analytics
Unemployment Rate Declining

Copyright © 2013 Chmura Economics & Analytics
Slow Road to Healthy Housing
Activity • Home sales are moving toward levels justified
by fundamentals:
– Household formation
– Population growth (including inward migration)
– Depreciation of old stock
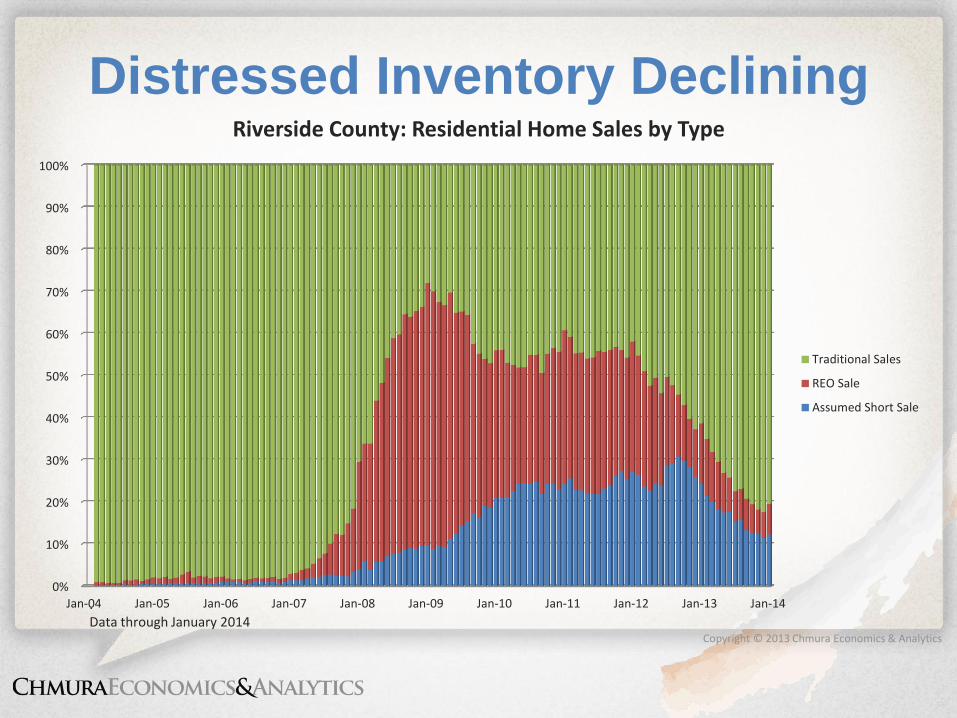
• Distressed inventory moving downward
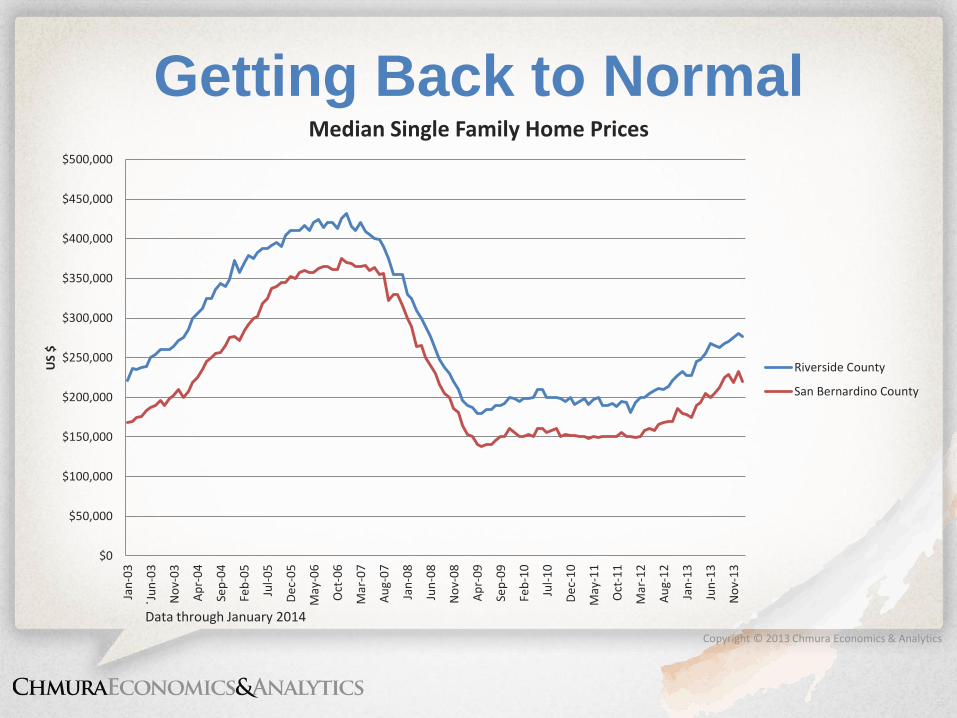
• Home prices are moving up
Copyright © 2013 Chmura Economics & Analytics
Getting Back to Normal
$0
$50,000
$100,000
$150,000
$200,000
$250,000
$300,000
$350,000
$400,000
$450,000
$500,000
Jan
-03
Jun
-03
No
v-0
3
Ap
r-0
4
Sep
-04
Feb
-05
Jul-
05
De
c-0
5
May
-06
Oct
-06
Mar
-07
Au
g-0
7
Jan
-08
Jun
-08
No
v-0
8
Ap
r-0
9
Sep
-09
Feb
-10
Jul-
10
De
c-1
0
May
-11
Oct
-11
Mar
-12
Au
g-1
2
Jan
-13
Jun
-13
No
v-1
3
US
$
Median Single Family Home Prices
Riverside County
San Bernardino County
. Data through January 2014
Copyright © 2013 Chmura Economics & Analytics
Distressed Inventory Declining
0%
10%
20%
30%
40%
50%
60%
70%
80%
90%
100%
Jan-04 Jan-05 Jan-06 Jan-07 Jan-08 Jan-09 Jan-10 Jan-11 Jan-12 Jan-13 Jan-14
Riverside County: Residential Home Sales by Type
Traditional Sales
REO Sale
Assumed Short Sale
. Data through January 2014

Copyright © 2013 Chmura Economics & Analytics
San Bernardino Making Progress
Source: DataQuick; DQNews.com
0%
10%
20%
30%
40%
50%
60%
70%
80%
90%
100%
Jan
-04
May
-04
Sep
-04
Jan
-05
May
-05
Sep
-05
Jan
-06
May
-06
Sep
-06
Jan
-07
May
-07
Sep
-07
Jan
-08
May
-08
Sep
-08
Jan
-09
May
-09
Sep
-09
Jan
-10
May
-10
Sep
-10
Jan
-11
May
-11
Sep
-11
Jan
-12
May
-12
Sep
-12
Jan
-13
May
-13
Sep
-13
San Bernardino County: Residential Home Sales by Type
Traditional Sale
REO Sale
Short Sale
. Data through January 2014

Copyright © 2013 Chmura Economics & Analytics Source: Circle size represents total employment.

Copyright © 2013 Chmura Economics & Analytics
Key Clusters Driving Job Growth
• Long-run growth rates; high location quotient; recent 3-year job gains; competitiveness – 31 separate sub-industries
• Health care and social assistance – 4 sub-industries w/ ≈ 48,000 current jobs
• Transportation and warehousing – 11 sub-industries w/ ≈ 67,000 current jobs
• Retail trade – 12 sub-industries w/ ≈ 67,000 current jobs
• Construction – 3 sub-industries w/ ≈ 21,000 current jobs

Copyright © 2013 Chmura Economics & Analytics
Key Clusters Current Historical Forecast
Four Quarters Ending with 2013q3
Total Change
over the Last
3 Years
Average Annual % Change in
Employment 2010q3-2013q3
Next 3-
Years
3-Year
Analytic
Sector Employment
Average
Annual
Wages
LQ Employ-
ment
Riverside-San
Bernardino-
Ontario, CA
MSA
CA USA
Average
Annual
Growth
Percent
Local
Compet-
itiveness
Health Care and Social
Assistance 149,790 $46,003 0.87 18,203 4.4% 3.8% 1.9% 3.7% P
Transportation and
Warehousing 71,322 $42,968 1.54 7,836 4.0% 1.3% 1.5% 2.7% P
Retail Trade 165,270 $28,568 1.21 9,213 1.9% 1.5% 1.3% 2.1% P
Wholesale Trade 53,635 $50,595 1.04 5,173 3.4% 2.5% 1.5% 2.2% P
Arts, Entertainment, and
Recreation 28,918 $29,967 1.33 -76 -0.1% 1.9% 1.7% 2.6%
Manufacturing 85,447 $48,070 0.79 1,463 0.6% 0.1% 1.3% 1.3%
Construction 63,293 $50,325 1.19 1,903 1.0% 2.8% 1.0% 3.9% P
Utilities 9,888 $84,898 1.35 -152 -0.5% 0.4% -0.3% 1.5%
Total All Industries 1,201,274 $40,383 1.00 54,241 1.6% 1.8% 1.5% 2.5%
Source: JobsEQ®
Copyright © 2013 Chmura Economics & Analytics
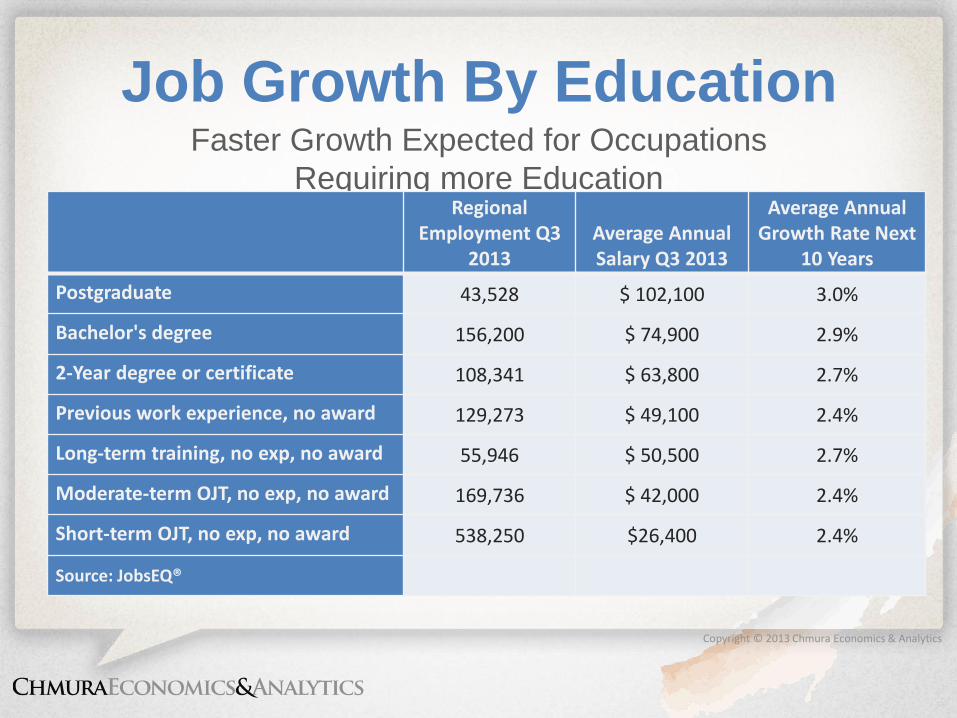
Job Growth By Education
Faster Growth Expected for Occupations
Requiring more Education Regional
Employment Q3 2013
Average Annual Salary Q3 2013
Average Annual Growth Rate Next
10 Years
Postgraduate 43,528 $ 102,100 3.0%
Bachelor's degree 156,200 $ 74,900 2.9%
2-Year degree or certificate 108,341 $ 63,800 2.7%
Previous work experience, no award 129,273 $ 49,100 2.4%
Long-term training, no exp, no award 55,946 $ 50,500 2.7%
Moderate-term OJT, no exp, no award 169,736 $ 42,000 2.4%
Short-term OJT, no exp, no award 538,250 $26,400 2.4%
Source: JobsEQ®
Copyright © 2013 Chmura Economics & Analytics
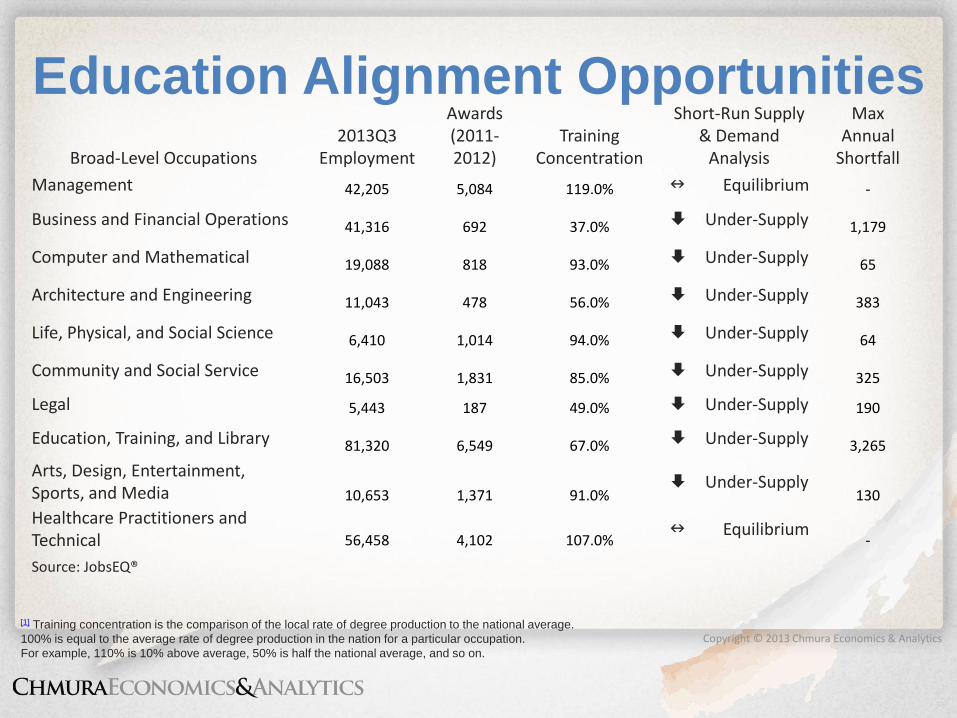
Education Alignment Opportunities
[1] Training concentration is the comparison of the local rate of degree production to the national average.
100% is equal to the average rate of degree production in the nation for a particular occupation.
For example, 110% is 10% above average, 50% is half the national average, and so on.
Broad-Level Occupations 2013Q3
Employment
Awards (2011-2012)
Training Concentration
Short-Run Supply & Demand
Analysis
Max Annual
Shortfall
Management 42,205 5,084 119.0% n Equilibrium -
Business and Financial Operations 41,316 692 37.0% Under-Supply 1,179
Computer and Mathematical 19,088 818 93.0% Under-Supply 65
Architecture and Engineering 11,043 478 56.0% Under-Supply 383
Life, Physical, and Social Science 6,410 1,014 94.0% Under-Supply 64
Community and Social Service 16,503 1,831 85.0% Under-Supply 325
Legal 5,443 187 49.0% Under-Supply 190
Education, Training, and Library 81,320 6,549 67.0% Under-Supply 3,265
Arts, Design, Entertainment, Sports, and Media 10,653 1,371 91.0%
Under-Supply 130
Healthcare Practitioners and Technical 56,458 4,102 107.0%
n Equilibrium -
Source: JobsEQ®

Copyright © 2013 Chmura Economics & Analytics

Copyright © 2013 Chmura Economics & Analytics
Key Occupational/Skill Gaps
• Current unemployment rates; current and long-run supply & demand, & recent job gains – 75 occupations that could impact long-run growth
& competitiveness • Overlap with statewide target jobs
• STEM heavy;
• Increasingly require some postsecondary training
• 27.5% of your residents have a 2-year degree or higher
Requiring at Least Secondary Education

Copyright © 2013 Chmura Economics & Analytics
Inland Empire Target Occupations
Installation, Maintenance, & Repair
Current Regional Employ-
ment
Average Annual Wages
Projected Average Annual Employ-
ment Growth
Estimated Unemploy-ment Rate
Potential Regional Current
Skill Deficiency
Emerging Regional Occupa-
tion Skills Gap
Training Recommendation
Aircraft Mechanics and Service Technicians
880 $63,500 2.0% 3.2%
P
P
Automotive Service Technicians and Mechanics
7,293 $39,800 2.6% 7.8% P P
Bus and Truck Mechanics and Diesel Engine Specialists
2,688 $44,500 2.3% 5.6% P P
Heating, Air Conditioning, and Refrigeration Mechanics and Installers
2,151 $50,200 3.9% 8.8% P P
Industrial Machinery Mechanics 2,312 $52,100 3.3% 6.2% P P
Mobile Heavy Equipment Mechanics, Except Engines
941 $53,200 2.8% 4.4% P P P
Telecommunications Line Installers and Repairers
924 $58,900 2.7% 10.3% P P
Telecommunications Equipment Installers and Repairers, Except Line Installers
1,387 $51,800 2.7% 8.7% P P P
Source: CA Workforce Investment Board & JobsEQ®
Data reflect 2013Q4.
Copyright © 2013 Chmura Economics & Analytics
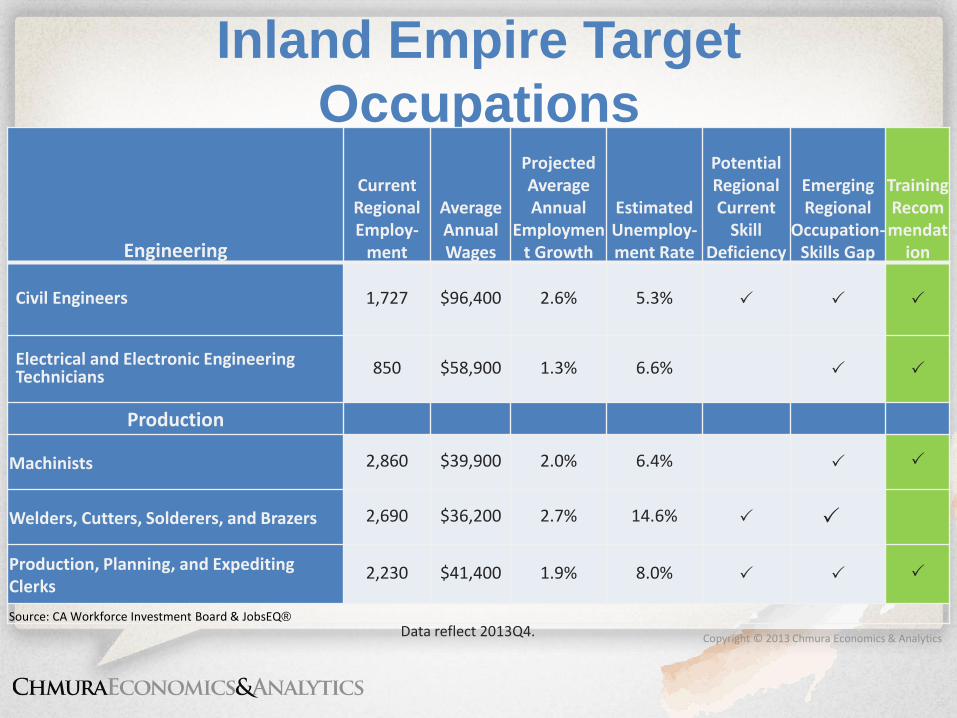
Inland Empire Target
Occupations
Engineering
Current Regional Employ-
ment
Average Annual Wages
Projected Average Annual
Employment Growth
Estimated Unemploy-ment Rate
Potential Regional Current
Skill Deficiency
Emerging Regional
Occupation-Skills Gap
Training Recommendat
ion
Civil Engineers 1,727 $96,400 2.6% 5.3% P P
P
Electrical and Electronic Engineering Technicians 850 $58,900 1.3% 6.6%
P
P
Production
Machinists 2,860 $39,900 2.0% 6.4% P P
Welders, Cutters, Solderers, and Brazers 2,690 $36,200 2.7% 14.6% P P
Production, Planning, and Expediting Clerks
2,230 $41,400 1.9% 8.0% P P P
Source: CA Workforce Investment Board & JobsEQ® Data reflect 2013Q4.
Copyright © 2013 Chmura Economics & Analytics
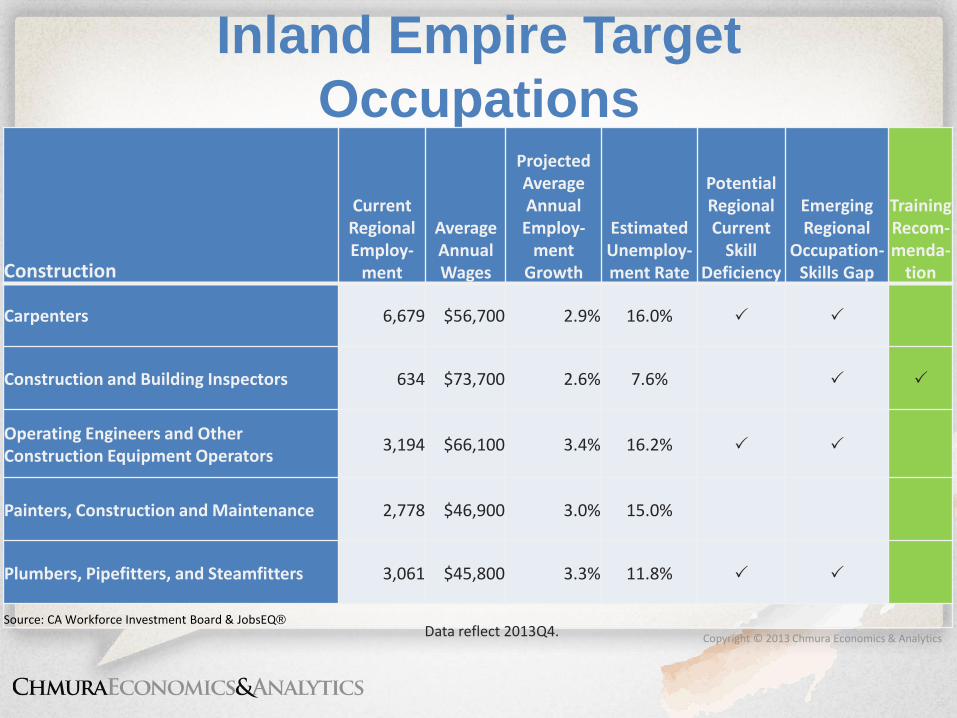
Inland Empire Target
Occupations
Construction
Current Regional Employ-
ment
Average Annual Wages
Projected Average Annual Employ-
ment Growth
Estimated Unemploy-ment Rate
Potential Regional Current
Skill Deficiency
Emerging Regional
Occupation-Skills Gap
Training Recom-menda-
tion
Carpenters 6,679 $56,700 2.9% 16.0% P P
Construction and Building Inspectors 634 $73,700 2.6% 7.6% P P
Operating Engineers and Other Construction Equipment Operators
3,194 $66,100 3.4% 16.2%
P
P
Painters, Construction and Maintenance 2,778 $46,900 3.0% 15.0%
Plumbers, Pipefitters, and Steamfitters 3,061 $45,800 3.3% 11.8% P P
Source: CA Workforce Investment Board & JobsEQ® Data reflect 2013Q4.
Copyright © 2013 Chmura Economics & Analytics
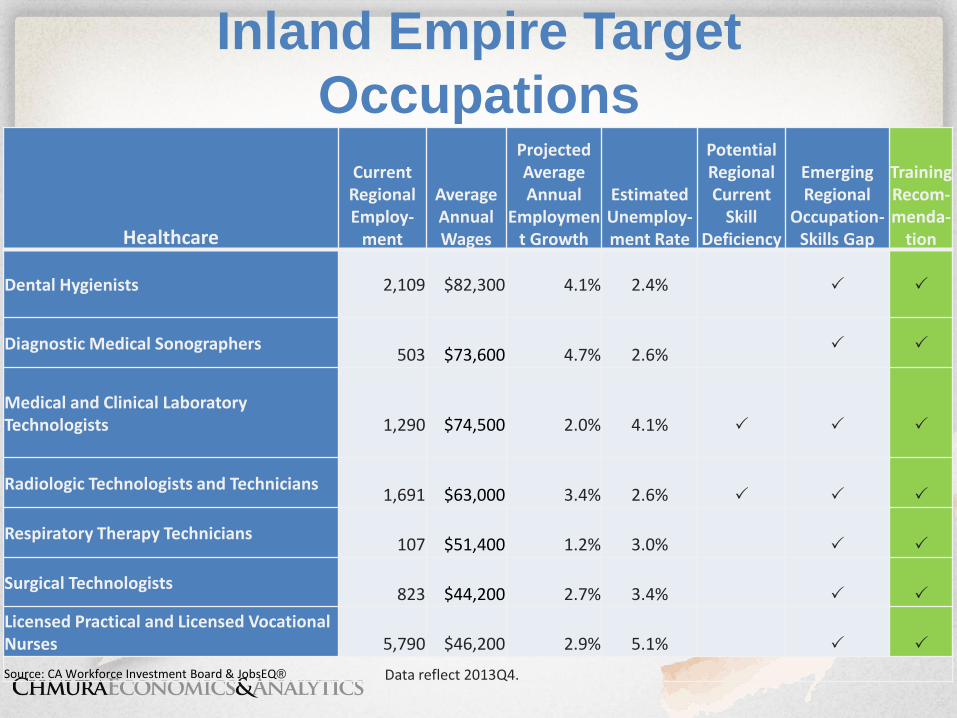
Inland Empire Target
Occupations
Healthcare
Current Regional Employ-
ment
Average Annual Wages
Projected Average Annual
Employment Growth
Estimated Unemploy-ment Rate
Potential Regional Current
Skill Deficiency
Emerging Regional
Occupation-Skills Gap
Training Recom-menda-
tion
Dental Hygienists
2,109
$82,300
4.1%
2.4%
P
P
Diagnostic Medical Sonographers
503
$73,600
4.7%
2.6% P P
Medical and Clinical Laboratory Technologists
1,290
$74,500
2.0%
4.1%
P
P
P
Radiologic Technologists and Technicians
1,691
$63,000
3.4%
2.6%
P
P
P
Respiratory Therapy Technicians
107
$51,400
1.2%
3.0%
P
P
Surgical Technologists
823
$44,200
2.7%
3.4%
P
P
Licensed Practical and Licensed Vocational Nurses
5,790
$46,200
2.9%
5.1%
P
P
Source: CA Workforce Investment Board & JobsEQ® Data reflect 2013Q4.

Copyright © 2013 Chmura Economics & Analytics
Key Industry Cluster
Occupations
Healthcare, Transportation-Logistics, & Wholesale/Retail
Typical Entry-Level Education
Chmura Regional Growth
Estimate 2020
Estimated Unemploy-ment Rate
Potential Regional Current
Skill Deficiency
Emerging Regional
Occupation Skills Gap
Cardiovascular Technologists and Technicians
Associate's degree 30.2% 2.0% P P
Occupational Therapy Assistants Associate's degree 36.1% 4.0% P P
Radiation Therapists Associate's degree 23.4% 2.0% P P
Health Technologists and Technicians, All Other*
Postsecondary non-degree award 24.8% 4.5% P P
Commercial Pilots Postsecondary non-degree award 20.4% 3.8% P P
Physical Therapist Aides High school diploma or equivalent 36.7% 4.6% P P
Loan Officers High school diploma or equivalent 20.6% 4.8% P P
Occupational Therapy Aides High school diploma or equivalent 29.8% 3.9% P P
Source: JobsEQ®
Unemployment estimate reflects 2013Q3.

Copyright © 2013 Chmura Economics & Analytics
Key Industry Cluster
Occupations
Healthcare, Transportation-Logistics, & Wholesale/Retail
Typical Entry-Level Education
Chmura Regional Growth
Estimate 2020
Estimated Unemploy-ment Rate
Potential Regional Current
Skill Deficiency
Emerging Regional
Occupation Skills Gap
Biomedical Engineers Bachelor's degree 50.8% 3.1% P P
Database Administrators Bachelor's degree 30.0% 5.6% P P
Athletic Trainers Bachelor's degree 29.1% 4.3% P P
Personal Financial Advisors Bachelor's degree 28.3% 2.7% P P
Geoscientists, Except Hydrologists and Geographers
Bachelor's degree 27.0% 1.9% P P
Financial Analysts Bachelor's degree 25.8% 2.7% P P
Architects, Except Landscape and Naval
Bachelor's degree 25.4% 4.1% P P
Credit Analysts Bachelor's degree 24.9% 4.1% P P
Medical and Health Services Managers
Bachelor's degree 24.0% 3.0% P P
Credit Counselors Bachelor's degree 23.5% 5.3% P P
Source: JobsEQ® Unemployment estimate reflects 2013Q3.

Copyright © 2013 Chmura Economics & Analytics
Other Occupations in Key Sectors
Manufacturing, Construction, & Utilities-Energy
Typical Entry-Level Education
Chmura Regional Growth
Estimate 2020
Estimated Unemploy-ment Rate
Potential Regional Current
Skill Deficiency
Emerging Regional
Occupation-Skills Gap
Heavy and Tractor-Trailer Truck Drivers High school diploma or equivalent
24.5% 9.8% P P
Brickmasons and Blockmasons High school diploma or equivalent
37.0% 19.7% P P
Sheet Metal Workers High school diploma or equivalent
22.4% 12.0% P P
Structural Iron and Steel Workers High school diploma or equivalent
25.2% 16.4% P P
Industrial Engineering Technicians Associate's degree 15.2% 4.4% P P
Reinforcing Iron and Rebar Workers High school diploma or equivalent
44.0% 16.1 % P
Crane and Tower Operators Less than high school 21.6% 15.6% P P
Mechanical Door Repairers High school diploma or equivalent
26.8% 8.0% P P
Aerospace Engineers Bachelor's degree 15.6% 2.9% P P
Boilermakers High school diploma or equivalent
25.6% 14.4% P P
Source: JobsEQ® Unemployment estimate reflects 2013Q3.
Copyright © 2013 Chmura Economics & Analytics
Recap
• San Bernardino-Riverside economy is recovering
– Housing is getting healthier
– Employment gains will be steady in 2014 and beyond
– California economy also poised for modest expansion
– The road to full recovery is a long one

Copyright © 2013 Chmura Economics & Analytics
Recommendations
• Incentivize more post-secondary education – Largest bang for the buck:
• Associates degrees/stackable postsecondary credential • 2+2 schema to finish the bachelor’s
– Several STEM-related occupations could become a constraint to business at the bachelor’s level
• Be aware of potential impacts from defense cuts • Consider strategies to draw youth into workplace
(internships, volunteer work) • Consider programs to increase higher-education
awards

Copyright © 2013 Chmura Economics & Analytics
THANK YOU!
Questions?