THE SAMPLING DISTRIBUTION OF THE MEAN - Cog Scinunez/COGS14B_W17/W3b.pdf · TODAY • Sampling...
38
THE SAMPLING DISTRIBUTION OF THE MEAN COGS 14B JANUARY 26, 2017
-
Upload
duongquynh -
Category
Documents
-
view
266 -
download
1
Transcript of THE SAMPLING DISTRIBUTION OF THE MEAN - Cog Scinunez/COGS14B_W17/W3b.pdf · TODAY • Sampling...

THE SAMPLING DISTRIBUTION
OF THE MEAN
COGS 14B
JANUARY 26, 2017

TODAY • Sampling Distributions
• Sampling Distribution of the Mean
• Central Limit Theorem

INFERENTIAL STATISTICS • Inferential statistics: allows us to generalize beyond
collections of actual observations and allows us to determine how confident we can be that our conclusions are correct

PROBABILITY AND STATISTICS • Probability plays an important role in inferential statistics.
• There is always variability that comes along with any particular result, and so each result is viewed within the context of many possible results that could have occurred by chance.
Common Outcomes Rare Outcomes
Rare Outcomes

PROBABILITY AND STATISTICS • Statisticians interpret different proportions of area under
theoretical curves as probabilities of random outcomes. • If I took all of your midterm scores and computed a z-score for
each one: • What is the probability that one quiz score taken at random
will be less than -1.5? • 6.7%
• What is the probability that one quiz score taken at random will be greater than 1?
• 15.9% • What is the probability that one quiz score taken at random
will be less than -1.5 OR greater than 1? • ADDITION RULE! (they are mutually exclusive) • 6.7% + 15.9% = 22.6%

REVIEW: NORMAL DISTRIBUTIONS • Many distributions found in nature
have some common properties:
• Symmetric, with mean, median and modes of equal value
• Distributions are bell-shaped • Examples: heights and weights
of people, physical characteristics of plants/animals, errors in measurement
• Sampling error (as an error in measurement) is normally distributed.

PROBABILITY AND STATISTICS • In inferential statistics, we are making an inferential leap
from interpreting probability as providing an estimated relative frequency of an event in a future random sampling from the population.
• When is an event (sample) common vs rare?

PROBABILITY AND STATISTICS • Common outcomes: nothing special has occurred
• Rare outcomes: something special has occurred

COGS 14B = 68 UCSD = 67
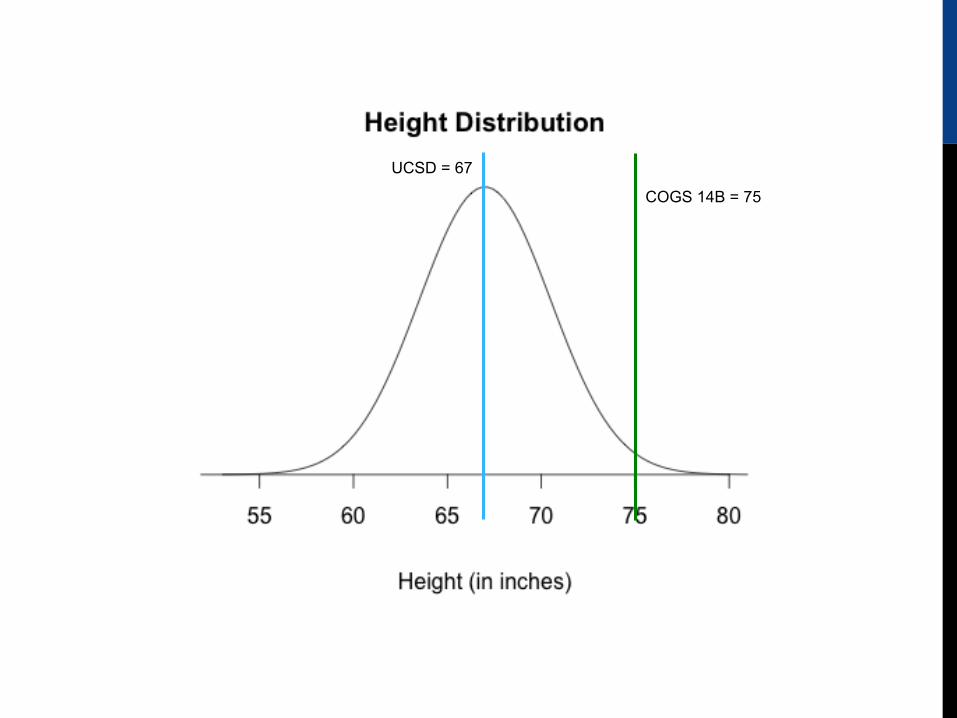
COGS 14B = 75
UCSD = 67

Imagine you measured the temperature (in F) each day in a week and got the following measurements:
• 70, 72, 68, 50, 90, 80, 72 • The average of these temperatures is 70 degrees. • If the standard deviation for temperature for that week is
typically 25 degrees, is a temperature of 90 unusually warm? • What if the standard deviation is typically 5 degrees?

SAMPLING DISTRIBUTIONS • A sampling distribution acts as a frame of reference for
statistical decision making.
• It is a theoretical probability distribution of the possible values of some sample statistic that would occur if we were to draw all possible samples of a fixed size from a given population.
• The sampling distribution allows us to determine whether, given the variability among all possible sample means, the one we observed is a common out come or a rare outcome.

Imagine that each one of you asks a random sample of 10 people in this class what their height is. (assume the population is all COGS 14B students this quarter).
You each calculate the average height of your sample to get the sample mean.
When you report back, would you expect all of your sample means to be the same?
How much would you expect them to differ?
SAMPLING DISTRIBUTIONS
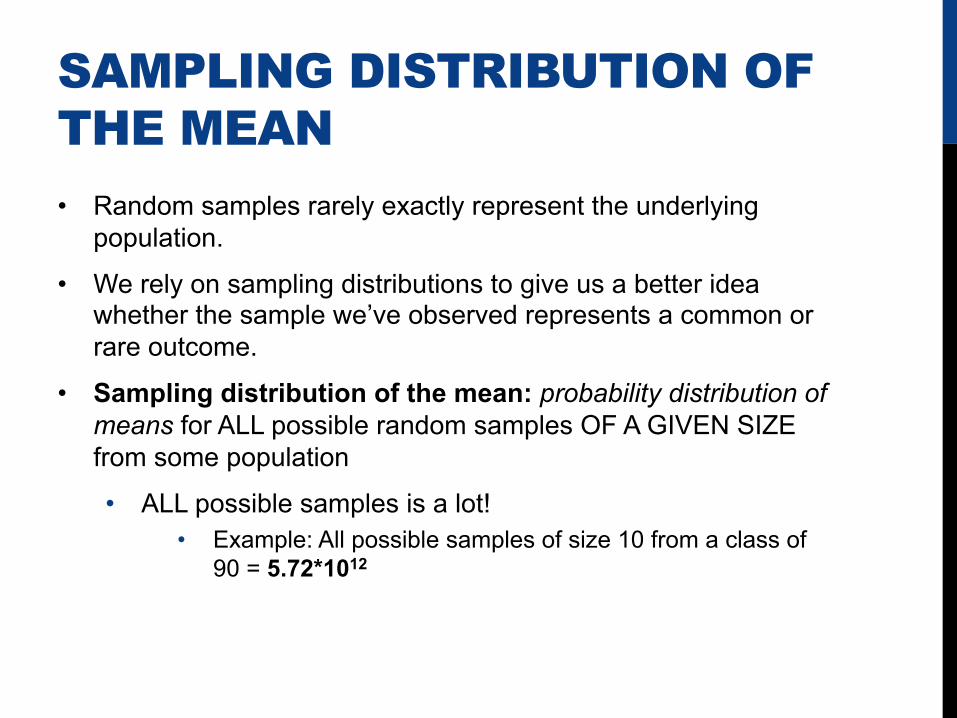
SAMPLING DISTRIBUTION OF THE MEAN • Random samples rarely exactly represent the underlying
population.
• We rely on sampling distributions to give us a better idea whether the sample we’ve observed represents a common or rare outcome.
• Sampling distribution of the mean: probability distribution of means for ALL possible random samples OF A GIVEN SIZE from some population
• ALL possible samples is a lot! • Example: All possible samples of size 10 from a class of
90 = 5.72*1012

EXAMPLE: SAT MATH SCORES Take a sample of 10 random students from a population of 100.
• You might get a mean of 502 for that sample. Then, you do it again with a new sample of 10 students.
• You might get a mean of 480 this time. Then, you do it again. And again. And again…… and get the following means for each of those three new samples of 10 people:
• 550, 517, 472

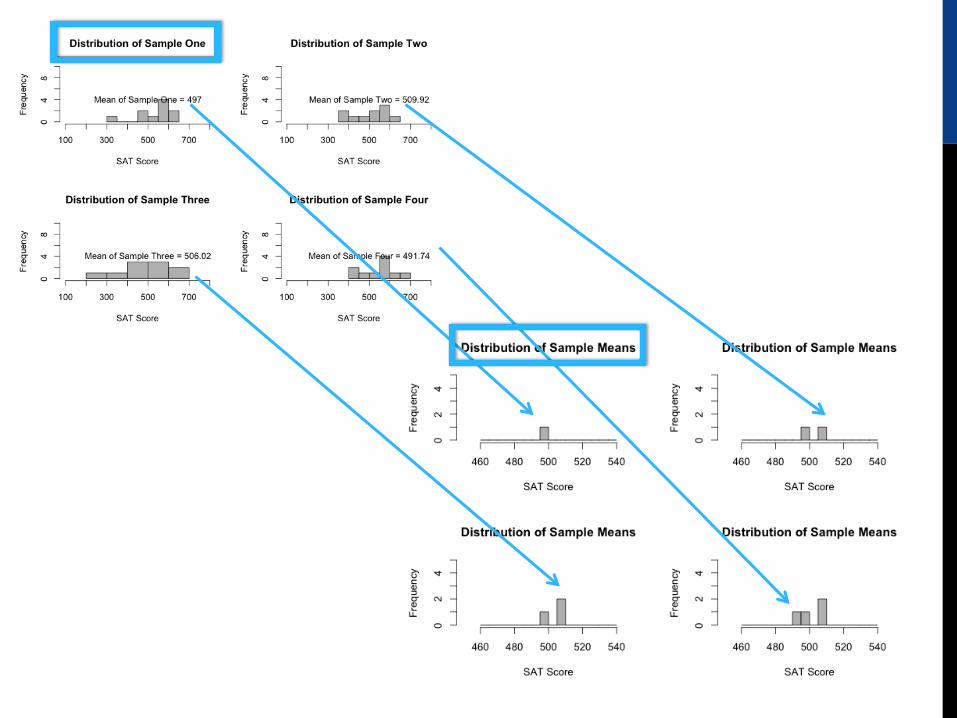


SAMPLING DISTRIBUTION OF THE MEAN • Sampling distribution of the mean: probability distribution of
means for ALL possible random samples OF A GIVEN SIZE from some population
• By taking a sample from a population, we don’t know whether the sample mean reflects the population mean.
• From the sampling distribution, we can calculate the possibility of a particular sample mean: chances are that our observed sample mean originates from the middle of the true sampling distribution.
• The sampling distribution of the mean has a mean, standard deviation, etc. just like other distributions you’ve encountered!

REVIEW: A particular observed sample mean:
A) equals the population mean
B) equals the mean of the sampling distribution
C) most likely has a value in the vicinity of the population mean
D) is equally likely to have a value either near to, or far from, the population mean.

SAMPLING DISTRIBUTION OF THE MEAN Keeping notation straight:
Type of Distribution
Mean Standard Deviation
Sample
Population
Sampling Distribution of the mean
(mean of all sample means)
(standard error of the mean)

SAMPLING DISTRIBUTION OF THE MEAN • The mean of the sampling distribution ALWAYS equals the
mean of the population.

SAMPLING DISTRIBUTION OF THE MEAN • Standard error of the mean: measures the variability in the
sampling distribution (roughly represents the average amount the sample means deviate from the mean of the sampling distribution)
• Sample size: n
• Remember, there’s a different distribution for each different sample size!
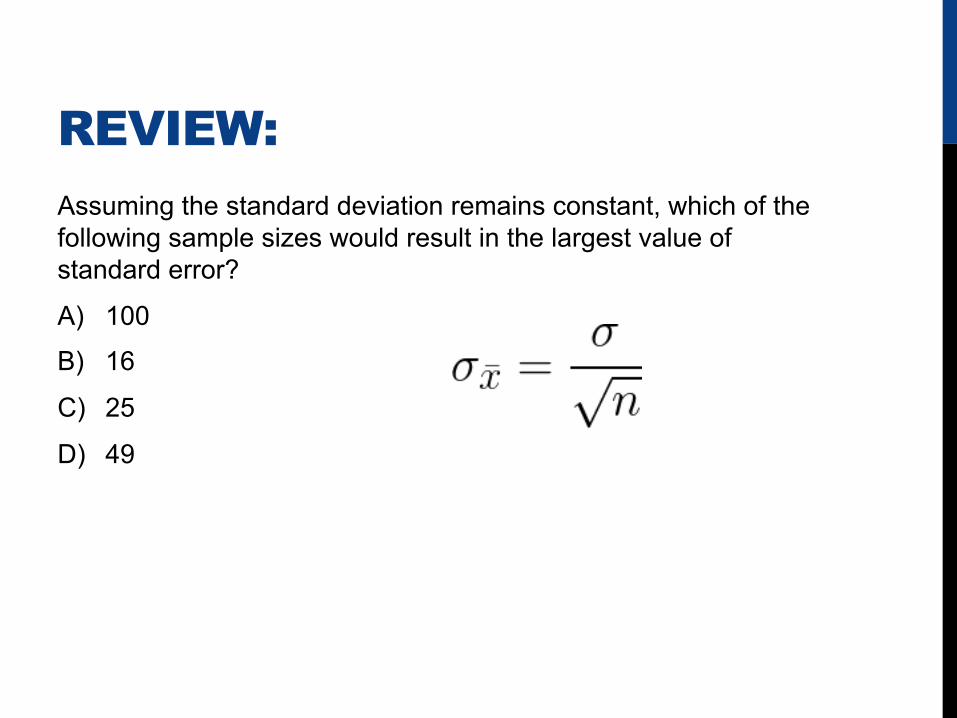
REVIEW: Assuming the standard deviation remains constant, which of the following sample sizes would result in the largest value of standard error?
A) 100
B) 16
C) 25
D) 49

INTUITION BUILDER
http://www.muelaner.com/uncertainty-of-measurement/
CENTRAL LIMIT THEOREM • When the sample size is sufficiently large, the shape of the
sampling distribution approximates a normal curve (regardless of the shape of the parent population)!
• The distribution of sample means is a more normal distribution than a distribution of scores, even if the underlying population is not normal.

CENTRAL LIMIT THEOREM
Parent Populations (can be of any shape, size, etc.)
Sampling Distribution of the Mean (approximates a normal curve, no
matter the parent population)
https://www.etsy.com/shop/NausicaaDistribution

DEMO: PUTTING IT ALL TOGETHER In a bag of M&Ms, there are 6 colors: brown, yellow, red, orange, green and blue.
In a single bag, which color do you think there is the most of?
Guess the proportion of orange M&Ms.
If each student took a random sample of the number of orange M&Ms in 10 M&Ms bags to get an average number of orange M&Ms, would you expect each sample to have the same average number of orange M&Ms? Why or why not?
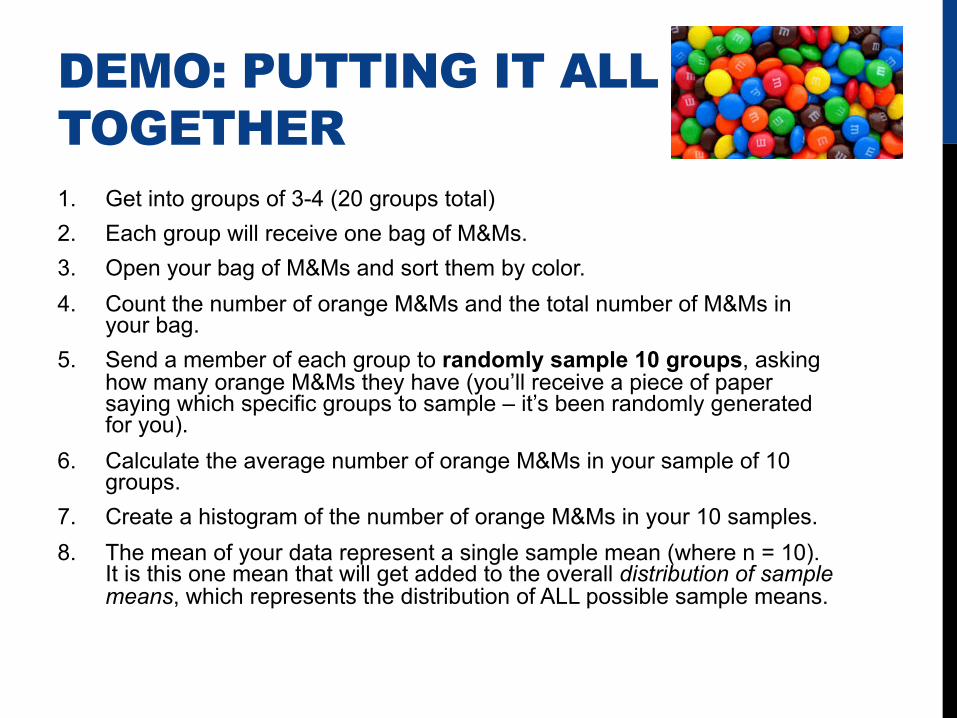
DEMO: PUTTING IT ALL TOGETHER 1. Get into groups of 3-4 (20 groups total) 2. Each group will receive one bag of M&Ms. 3. Open your bag of M&Ms and sort them by color. 4. Count the number of orange M&Ms and the total number of M&Ms in
your bag. 5. Send a member of each group to randomly sample 10 groups, asking
how many orange M&Ms they have (you’ll receive a piece of paper saying which specific groups to sample – it’s been randomly generated for you).
6. Calculate the average number of orange M&Ms in your sample of 10 groups.
7. Create a histogram of the number of orange M&Ms in your 10 samples. 8. The mean of your data represent a single sample mean (where n = 10).
It is this one mean that will get added to the overall distribution of sample means, which represents the distribution of ALL possible sample means.
DEMO: PUTTING IT ALL TOGETHER Create a histogram of all of our sample MEANS…

DEMO: PUTTING IT ALL TOGETHER • What is a sample in this context? • What is the parent population? • What is the sampling distribution of means?
• How does the histogram of your particular sample differ from the sampling distribution of the mean?
• What is the population parameter? • What is the statistic? • Do we know the value(s) of the parameter(s)?
• Do we know the value(s) of the statistic(s)? • Did each sample have the same average number of orange M&Ms?
• Describe the variability of the distribution of sample proportions (shape, central tendency, spread).
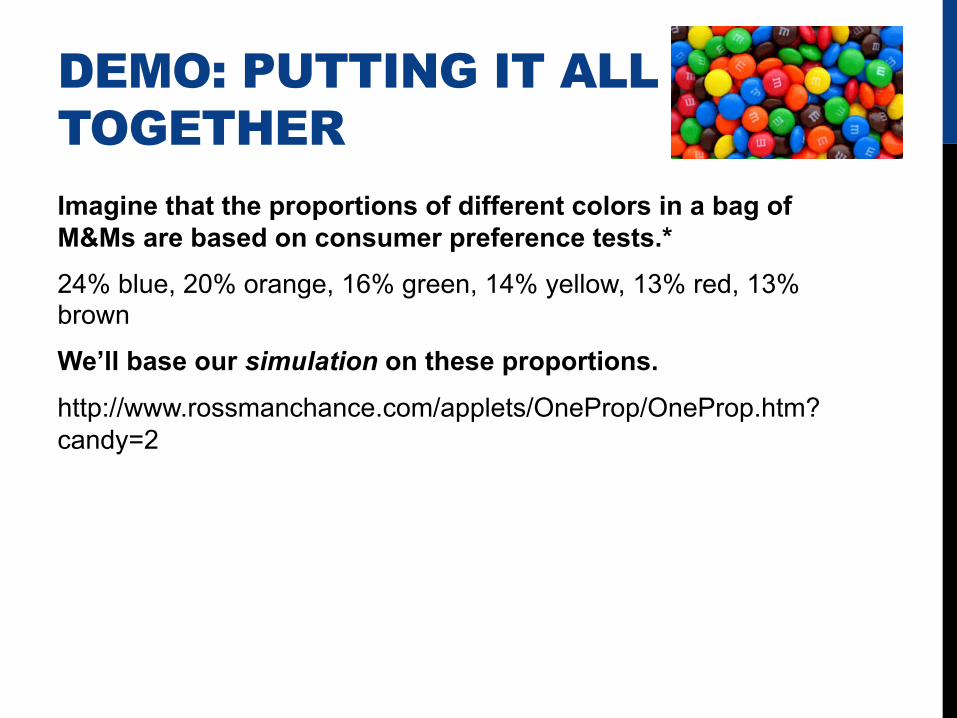
DEMO: PUTTING IT ALL TOGETHER Imagine that the proportions of different colors in a bag of M&Ms are based on consumer preference tests.* 24% blue, 20% orange, 16% green, 14% yellow, 13% red, 13% brown
We’ll base our simulation on these proportions.
http://www.rossmanchance.com/applets/OneProp/OneProp.htm?candy=2
DEMO: REVIEW 1. As sample size increases, does how well the sample statistic
resemble the population parameter change?
2. What value does the sampling distribution tend to center around?
3. Does this observation depend on sample size?
4. If M&M colors were uniformly distributed (~16.67% of each color in each bag), would the shape of the sampling distribution change? Why or why not?
5. How does this relate to the Central Limit Theorem?

DEMO: NEXT STEPS PREVIEW FOR WHAT’S NEXT: Inferential statistical tests!
Based on the claim that 20% of M&Ms in a bag are supposed to be orange, do we have evidence that our bags of M&Ms differ from that proportion?

SUMMARY • A sampling distribution acts as a frame of reference for
statistical decision making. • Sampling distribution of the mean: Probability distribution of
means for ALL possible random samples OF A GIVEN SIZE from some population
• The mean of sampling distribution of the mean is always equal to the mean of the population
• The standard error of the mean measures the variability in the sampling distribution
• Central limit theorem: regardless of the shape of the population, the shape of the sampling distribution approximates a normal curve IF THE SAMPLE SIZE IS SUFFICIENTLY LARGE

ONLINE DEMO 2 http://bcs.wiley.com/he-bcs/Books?action=mininav&bcsId=8500&itemId=1118450531&assetId=353506&resourceId=34768&newwindow=true

N=5 N=25
SAME PARENT DISTRIBUTION, DIFFERENT SAMPLE SIZES

FOR NEXT TIME… Play around with the sampling distribution demo online!