1 New Spitzer Results for Neon and Sulphur in NGC 6822 Reggie Dufour AU 10/07/2009.

MNRAS 000, 1–20 (2015) Preprint 5 November 2018 Compiled using MNRAS LATEX style file v3.0
The rotation of the halo of NGC 6822 from the radialvelocities of carbon stars
Graham P. Thompson,1? Sean G. Ryan,1 Lisette F. Sibbons11School of Physics, Astronomy and Mathematics, University of Hertfordshire, College Lane, Hatfield AL10 9AB, UK
Accepted XXX. Received YYY; in original form ZZZ
ABSTRACTUsing spectra taken with the AAOmega spectrograph, we measure the radial velocitiesof over 100 stars, many of which are intermediate age carbon stars, in the directionof the dwarf irregular galaxy NGC 6822. Kinematic analysis suggests that the carbonstars in the sample are associated with NGC 6822, and estimates of its radial velocityand galactic rotation are made from a star-by-star analysis of its carbon star popula-tion. We calculate a heliocentric radial velocity for NGC 6822 of −51±3 km s−1 andshow that the population rotates with a mean rotation speed of 11.2±2.1 km s−1 at amean distance of 1.1 kpc from the galactic centre, about a rotation axis with a positionangle of 26◦±13◦, as projected on the sky. This is close to the rotation axis of the HIgas disk and suggests that NGC 6822 is not a polar ring galaxy, but is dynamicallycloser to a late type galaxy. However, the rotation axis is not aligned with the minoraxis of the AGB isodensity profiles and this remains a mystery.
Key words: techniques: radial velocities – stars:AGB and post-AGB – galax-ies:individual:NGC 6822 – galaxies: kinematics and dynamics – Local Group – in-frared:stars
1 INTRODUCTION
NGC 6822 (Barnard’s galaxy) is a relatively bright and wellstudied dwarf irregular galaxy. It lies within the Local Group(LG), quite close to the Milky Way, and is the third nearestdwarf irregular galaxy after the Large and Small MagellanicClouds. It was the first object to be shown to lie outside theMilky Way by Edwin Hubble (Hubble 1925). It has no knownclose companions and lies in a region relatively devoid ofother galaxies (de Blok & Walter 2000). Despite its apparentisolation, there is some evidence of tidal interaction and aburst of star formation 100−200 Myr ago (de Blok & Walter(2000) and references therein).
The location of NGC 6822 has a range of publishedvalues for right ascension (α) and declination (δ )1, butfor the purposes of this paper we use α = 19h44m56s, δ =−14◦48′06′′ (J2000). This is at the centre of a 3 deg2 fieldused by Sibbons et al. (2012, 2015) and is adopted here forconsistency, since this study uses spectra drawn from theirsample.
The galactic distance is variously reported to lie be-
? E-mail: [email protected] SIMBAD: α = 19h44m56.199s, δ =−14◦47′51.29′′ (J2000).
NED: α = 19h44m57.7s, δ =−14◦48′12′′ (J2000).
McConnachie (2012): α = 19h44m56.6s, δ =−14◦47′21′′ (J2000).
tween 450 to over 500 kpc. For the purposes of this pa-per, its distance is not important, but where we do useit, we again adopt the same value as Sibbons et al. (2012,2015), 490± 40 kpc, for consistency with that work. Thisis the value quoted in Mateo (1998). Sibbons et al. (2012,2015) also quotes a distance modulus for NGC 6822 of(m−M)0 = 23.45±0.15 (≈ 490±34 kpc). In recent years, pa-pers have been published which have provided new distancemoduli using Cepheid variables. Many of these re-estimateshave reduced the radial distance to NGC 6822 by about10% from the value used herein. The distance modulus de-rived by Gieren et al. (2006) is (m−M)0 = 23.312± 0.021(≈ 460± 4.4 kpc), Feast et al. (2012) gives (m−M)0 =23.40± 0.052 (≈ 479± 11 kpc), and Rich et al. (2014) gives(m−M)0 = 23.38± 0.02stat± 0.04sys (≈ 474± 13tot kpc). InWhitelock et al. (2013), an alternative to Cepheid variablesis proposed using Mira variables for distance measurement.These are AGBs which vary in magnitude over periods ofseveral hundred days. NGC 6822 is used as one example ofthe measurement of distance using Mira variables and aftercalibration of the method using Miras in the Large Mag-ellanic Cloud, the distance module for NGC 6822 is given
2 Feast et al. (2012) does not claim any precision with the errorvalue, owing to the difficulty in measuring the true uncertainty
in the value of the distance modulus.
c© 2015 The Authors
arX
iv:1
605.
0558
2v1
[as
tro-
ph.G
A]
18
May
201
6

2 G. P. Thompson et al.
as (m−M)0 = 23.56± 0.03 mag (≈ 515± 7 kpc), somewhatgreater than the other estimates.
Morphologically, NGC 6822 has three components: agaseous disk of HI (Fig. 1, left hand panel), an outer spheroidof stars (Fig. 1, right hand panel) and a small central coreof young stars (Hodge et al. 1991). Its HI content has beenstudied by de Blok & Walter (2000) and its the stellar con-tent, especially Red Giant Branch (RGB) and AsymptoticGiant Branch (AGB) stars, by Letarte et al. (2002), Bat-tinelli et al. (2006), Demers et al. (2006) and Sibbons et al.(2012, 2015). The HI gas disk appears to lie at a positionangle (PA) of ∼ 130◦ when observed from tip to tip (de Blok& Walter 2000). However, it also appears to twist and inWeldrake et al. (2003), the PA is stated as ∼ 110◦, whichis closer to the major axis of the central part of the disk,as shown in Fig. 1 (left hand panel). Letarte et al. (2002)shows that carbon stars lie well outside the HI disc and De-mers et al. (2006) and Battinelli et al. (2006) show that theisophotes of RGBs of NGC 6822 are also elliptical, wherethe major axis PA changes from ∼ 65◦ (outermost contour)to ∼ 80◦ (innermost contour), as shown in Fig. 1 (right handpanel).
Much of the published velocity data for NGC 6822 hasbeen derived from the HI gas content of NGC 6822 usingthe 21 cm line (Koribalski et al. 2004; Weldrake et al. 2003).Koribalski et al. (2004) measures a heliocentric radial ve-locity, Vhelio, of −57± 2 km s−1 for NGC 6822 from itsHIPASS spectrum, and this now a commonly cited value.Mateo (1998), and sources therein, also provide Vhelio basedon the HI component, V�,radio of −54±6 km s−1, and Wel-drake et al. (2003) similarly provides a HI derived systemic(radial) velocity3 in the range −53.3 km s−1 to −54.7 km s−1
at the centre of the HI gas.Rotation of the gas disk has also been measured at 21
cm. Mateo (1998) provides a value for the rotation of the HIdisk, vrot,ISM, of 47±3 km s−1, and Weldrake et al. (2003)shows that the velocity of the HI disk ranges from −100km s−1 at the NW extreme (blue-shifted) to +10 km s−1 atthe SE extreme (red-shifted). McConnachie (2012) quotes apeak observed rotation speed of 47±2.0 km s−1, uncorrectedfor inclination or asymmetric drift, citing Koribalski et al.(2004); Weldrake et al. (2003).
With regard to the stellar kinematics of NGC 6822, Ma-teo (1998), and references therein, provide a value of Vhelio
based on optical measurements of V�,opt =−53±4 km s−1.Kirby et al. (2014) studies the kinematics of seven isolateddwarf galaxies in the LG from the radial velocities of redgiant stars, including NGC 6822, and derives a mean he-liocentric radial velocity, 〈Vhelio〉, of −54.5± 1.7 km s−1forNGC 6822.
However, while there are published data for Vhelio, thereare little regarding stellar rotation. Many publications referto Demers et al. (2006) for stellar rotation, where the ra-dial velocities for 110 carbon stars lying within 15′ (∼ 2.1kpc) of the HI major axis, taken from a sample in Letarteet al. (2002), are measured, although the individual stellarmeasurements are not published. A variation in residual ve-locity along the major axis of the outermost RGB isophote
3 We assume all velocities quoted in Weldrake et al. (2003) arecorrected to heliocentric
is interpreted to be a signature of rotation about the minoraxis. As a result, the paper suggests that the carbon starsappear to rotate about an axis roughly perpendicular to therotation axis of the HI disk, resembling a Polar Ring Galaxy(PRG). It would be extraordinarily useful if NGC 6822 is aPRG, since they are very rare. The Sloan Polar-Ring Cata-logue (SPRC), which uses images from the Sloan Digital SkySurvey, includes only 6 confirmed PRGs from a total of just275 candidates. Discovery of a nearby PRG would presenta remarkable opportunity to study these galactic types atclose hand. In a separate publication (Demers & Battinelli2007) suggest that radial velocities of individual NGC 6822giants might give some insight into rotation of the stellarpopulation.
Kirby et al. (2014) checked for signs of rotation in theirsample of 7 dwarf galaxies, and found that only the Pegasusdwarf irregular showed obvious signs. For NGC 6822, theyrefer to the findings of Demers et al. (2006). They commentthat while a rotation of the order of ∼ 10 km s−1 is possible inNGC 6822, their data were too highly obscured by velocitydispersions to be certain.
The published studies of the galaxy’s stellar rotationare complemented by other studies of the motion of globu-lar clusters (Veljanoski et al. 2015) and planetary nebulae(Flores-Duran et al. 2014). Veljanoski et al. (2015) studiesthe globular cluster (GC) system of NGC 6822, in which 8GCs are presently identified (see Table 1 therein). The radialvelocities of 6 of the GCs are given and 〈Vhelio〉 is deduced tobe between −59 and −60 km s−1. The spatial distribution ofthe GCs in their data is rather linear and lies approximatelyparallel to the major axis of the AGB isophotes. Three pos-sible dynamical models are considered:
• ‘Disk model’, in which the rotation axes are similar tothat suggested by Demers et al. (2006). The resulting rota-tion rate is 12±10 km s−1.• ‘Cigar model’, where the cluster system shares the same
rotation axis as the HI disk. In this case the rotation rate isdetermined to be 56±31 km s−1.• A scenario where there is no net rotation by discon-
necting any relationship between the gas disk and the stellarcomponent.
In none of these models are they able to independently deter-mine the PA of the rotation axis owing to the small numberof objects in their sample of GCs, but their preferred case isthe ‘Disk model’, owing to its low rotation rate. They arguethat in the case of the ‘Cigar model’ the rotation is too high,and would cause the sample to flatten into a disk which theydo not observe.
In Flores-Duran et al. (2014), the motion of 10 plane-tary nebulae (PNe) in the galaxy are studied. PNe are theevolutionary stage reached by AGBs after the end of theirlives, and may thus provide complementary kinematic infor-mation of the galaxy. Flores-Duran et al. (2014) compute themean 〈Vhelio〉 of the PNe to be −57.8 km s−1. They comparetheir result with four extended star clusters (ESGs) whichhave a mean Vhelio of −88.3 km s−1 (Hwang et al. 2014)and with a C-star mean Vhelio of −32.9 km s−1 derived byHwang et al. (2014). The ESGs lie ∼ 10.5 kpc from the cen-tre of NGC 6822 and show no signs of rotation (Hwang et al.2014). Flores-Duran et al. (2014) infer that the PNe, C-starsand clusters belong to different dynamical systems, but with
MNRAS 000, 1–20 (2015)

Carbon star rotation in NGC 6822 3
Figure 1. Left hand panel, HI isodensity curves of NGC 6822 (de Blok & Walter 2000). The HI curves exhibit a disk-like structure,
which is twisted with a major axis PA from ∼ 110◦ to ∼ 130◦. Right hand panel, RGB stellar isodensity profiles (Demers et al. 2006). TheRGB profiles exhibit elliptical contours, where the major axis PA changes from ∼ 65◦ (outermost contour) to ∼ 80◦ (innermost contour).
The solid line in the right hand panel lies at 65◦ and the dashed line lies 130◦. The panels are shown to approximately the same scale
and orientation.
so few PNe, they are unable to reliably fit the radial velocitydata to either system.
This paper provides the results of a new study of thekinematics of NGC 6822, based on the spectra of individualstars obtained in 2011 by Sibbons et al. (2015), and followsstudies by Sibbons et al. (2012, 2015) which classify stars,photometrically and spectroscopically, from a set taken fromthe catalogue of Letarte et al. (2002). These studies wereable to distinguish C-type and M-type AGBs from othertypes, so that although Demers & Battinelli (2007) cautionsthat the separation of carbon stars associated with NGC6822 from foreground Galactic dwarfs might be difficult, ourpresent study has the advantage of using the spectra of starswhich have already been classified as carbon stars in NGC6822, with a high degree of confidence.
The radial velocities of well over 100 stars within a 4 kpcradius of the centre of NGC 6822, (the inner region), andwell over 100 stars outside the 4 kpc radius, (the outer re-gion), are measured and reported. In the inner region manyof these stars are classified as carbon stars and are expectedto be associated with the galaxy (Sibbons et al. 2015). In theouter region, most of the stars are expected to be foregroundMilky Way stars (Sibbons et al. 2012, 2015).
Based on the aggregated sample of carbon stars in theinner region, a value for the heliocentric radial velocity ofNGC 6822 is derived. The kinematics of individual stars inthe sample indicate that they belong to the same population,supporting Sibbons et al. (2015). Moreover, the radial veloc-ity measurements are accurate enough to reveal rotation ofthe stellar component about an axis through the centre ofthe galaxy, and to derive its rotational speed and a new PAfor the axis of rotation. In §2, we discuss the data set, its
origins and its limitations. In §3, we discuss the method usedto analyse the data set including the selection of objects foranalysis. In §4, we discuss the results and in §5, we drawconclusions.
2 OBSERVATIONS AND DATA
This study uses AGB stars as tracers of kinematic propertiesof the galaxy. AGB stars are amongst the brightest stars inan intermediate-age or old stellar population and can be re-solved in galaxies beyond the Milky Way, making it possibleto study them individually. AGBs tend to divide into thosewith oxygen rich atmospheres (M-types), and those with car-bon rich atmospheres (C-types or carbon stars). They haverelatively low surface temperatures, Teff, ranging from as lowas 2200 K (Matthews et al. 2015) for old stars near the endof their lives up to ∼ 4000 K for intermediate age stars4. Thecontinuum peaks at wavelengths in the near infra red, withincreasing brightness through the I, J, H and K bands.
The spectrum of a typical AGB contains a number ofabsorption features, predominantly broad TiO bands in M-type AGBs, broad CN bands in C-type AGBs. The I−bandspectral region also contains the Ca ii triplet lines in bothtypes of AGB. The Ca ii triplet lines are ideal for measuringradial velocities as they are narrow atomic features and lie ina position where the continuum is relatively strong. In thisstudy, we use the spectra of carbon rich AGBs classified by
4 In van Belle et al. (2013), 12 carbon stars are found to be ina range of Teff = 2381± 81 K to 3884± 161 K, with a mean at
2800±270 K.
MNRAS 000, 1–20 (2015)
4 G. P. Thompson et al.
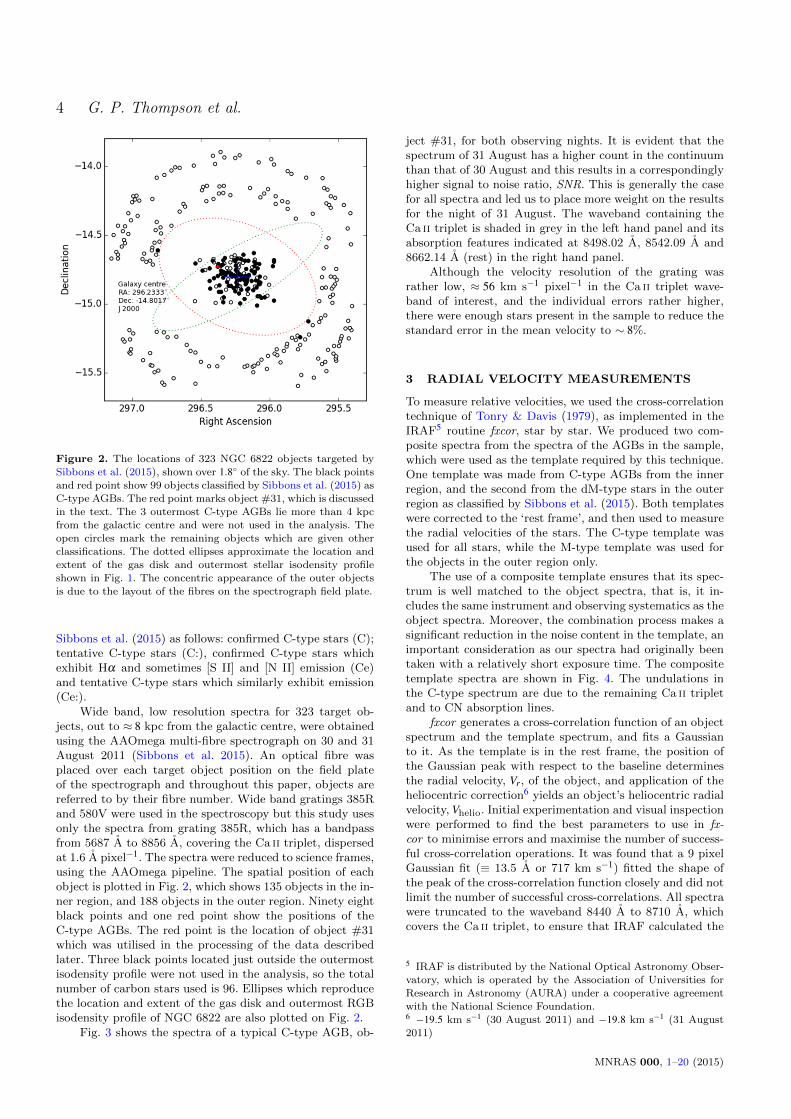
Figure 2. The locations of 323 NGC 6822 objects targeted by
Sibbons et al. (2015), shown over 1.8◦ of the sky. The black points
and red point show 99 objects classified by Sibbons et al. (2015) asC-type AGBs. The red point marks object #31, which is discussed
in the text. The 3 outermost C-type AGBs lie more than 4 kpc
from the galactic centre and were not used in the analysis. Theopen circles mark the remaining objects which are given other
classifications. The dotted ellipses approximate the location and
extent of the gas disk and outermost stellar isodensity profileshown in Fig. 1. The concentric appearance of the outer objects
is due to the layout of the fibres on the spectrograph field plate.
Sibbons et al. (2015) as follows: confirmed C-type stars (C);tentative C-type stars (C:), confirmed C-type stars whichexhibit Hα and sometimes [S II] and [N II] emission (Ce)and tentative C-type stars which similarly exhibit emission(Ce:).
Wide band, low resolution spectra for 323 target ob-jects, out to ≈ 8 kpc from the galactic centre, were obtainedusing the AAOmega multi-fibre spectrograph on 30 and 31August 2011 (Sibbons et al. 2015). An optical fibre wasplaced over each target object position on the field plateof the spectrograph and throughout this paper, objects arereferred to by their fibre number. Wide band gratings 385Rand 580V were used in the spectroscopy but this study usesonly the spectra from grating 385R, which has a bandpassfrom 5687 A to 8856 A, covering the Ca ii triplet, dispersedat 1.6 A pixel−1. The spectra were reduced to science frames,using the AAOmega pipeline. The spatial position of eachobject is plotted in Fig. 2, which shows 135 objects in the in-ner region, and 188 objects in the outer region. Ninety eightblack points and one red point show the positions of theC-type AGBs. The red point is the location of object #31which was utilised in the processing of the data describedlater. Three black points located just outside the outermostisodensity profile were not used in the analysis, so the totalnumber of carbon stars used is 96. Ellipses which reproducethe location and extent of the gas disk and outermost RGBisodensity profile of NGC 6822 are also plotted on Fig. 2.
Fig. 3 shows the spectra of a typical C-type AGB, ob-
ject #31, for both observing nights. It is evident that thespectrum of 31 August has a higher count in the continuumthan that of 30 August and this results in a correspondinglyhigher signal to noise ratio, SNR. This is generally the casefor all spectra and led us to place more weight on the resultsfor the night of 31 August. The waveband containing theCa ii triplet is shaded in grey in the left hand panel and itsabsorption features indicated at 8498.02 A, 8542.09 A and8662.14 A (rest) in the right hand panel.
Although the velocity resolution of the grating wasrather low, ≈ 56 km s−1 pixel−1 in the Ca ii triplet wave-band of interest, and the individual errors rather higher,there were enough stars present in the sample to reduce thestandard error in the mean velocity to ∼ 8%.
3 RADIAL VELOCITY MEASUREMENTS
To measure relative velocities, we used the cross-correlationtechnique of Tonry & Davis (1979), as implemented in theIRAF5 routine fxcor, star by star. We produced two com-posite spectra from the spectra of the AGBs in the sample,which were used as the template required by this technique.One template was made from C-type AGBs from the innerregion, and the second from the dM-type stars in the outerregion as classified by Sibbons et al. (2015). Both templateswere corrected to the ‘rest frame’, and then used to measurethe radial velocities of the stars. The C-type template wasused for all stars, while the M-type template was used forthe objects in the outer region only.
The use of a composite template ensures that its spec-trum is well matched to the object spectra, that is, it in-cludes the same instrument and observing systematics as theobject spectra. Moreover, the combination process makes asignificant reduction in the noise content in the template, animportant consideration as our spectra had originally beentaken with a relatively short exposure time. The compositetemplate spectra are shown in Fig. 4. The undulations inthe C-type spectrum are due to the remaining Ca ii tripletand to CN absorption lines.
fxcor generates a cross-correlation function of an objectspectrum and the template spectrum, and fits a Gaussianto it. As the template is in the rest frame, the position ofthe Gaussian peak with respect to the baseline determinesthe radial velocity, Vr, of the object, and application of theheliocentric correction6 yields an object’s heliocentric radialvelocity, Vhelio. Initial experimentation and visual inspectionwere performed to find the best parameters to use in fx-cor to minimise errors and maximise the number of success-ful cross-correlation operations. It was found that a 9 pixelGaussian fit (≡ 13.5 A or 717 km s−1) fitted the shape ofthe peak of the cross-correlation function closely and did notlimit the number of successful cross-correlations. All spectrawere truncated to the waveband 8440 A to 8710 A, whichcovers the Ca ii triplet, to ensure that IRAF calculated the
5 IRAF is distributed by the National Optical Astronomy Obser-vatory, which is operated by the Association of Universities for
Research in Astronomy (AURA) under a cooperative agreementwith the National Science Foundation.6 −19.5 km s−1 (30 August 2011) and −19.8 km s−1 (31 August
2011)
MNRAS 000, 1–20 (2015)

Carbon star rotation in NGC 6822 5
Figure 3. Spectra for Object #31. Left hand panel: Full red spectrum from AAOmega grating 385R for object # 31 on 30 and 31
August 2011. Object #31 is spectrally classified as a C-type star in Sibbons et al. (2015) and has CN absorption bands at 5730, 6206,6332, 6478, 6631, 6925, 7088, 7259, 7437, 7876, 8026 A which are characteristic of this type of star. The large absorption feature at 7594
A is due to telluric O2. The grey band indicates the waveband 8440A to 8710A containing the Ca ii triplet features. Right hand Panel:The same spectra expanded over the waveband 8440A to 8710A containing the Ca ii triplet features used for radial velocity measurement.
The centres of the Ca ii triplet absorption lines are indicated by the vertical dashed lines at 8498.02 A, 8542.09 A, 8662.14 A.
Figure 4. Composite template spectra in the rest frame used
for the radial velocity measurements. The centres of Ca ii triplet
features are shown by the vertical dashed lines.
velocity resolution appropriate to this waveband, and thecross-correlation bandwidth was restricted to 8450 A to 8700A to reduce spectral noise coming from outside this wave-band.
The quality of the spectra is important. As well as lowspectral resolution, many of our spectra had low SNR (< 10pixel−1), causing noisy cross-correlation functions. Thesesometimes returned unreliable results or failed to give a re-sult at all. To overcome these difficulties, selection criteriawere adopted to rule out any spectra which might give riseto unreliable results. The criteria were based on the strengthof the cross-correlation function, hght and on the radial ve-locities returned by fxcor as described below.
It was found, by inspection, that cross-correlation func-tions with hght > 0.4 give a strong peak with low side-
bands, but those with hght < 0.2 do not. In these cases, thepeaks are weak with respect to the sidebands and in somecases, multiple peaks occur. Between these limits, the qual-ity of the cross-correlations degrades but useful results canbe achieved in many cases. After visual inspection of eachcross-correlation function, we excluded all cross-correlationfunctions where hght< 0.2.
We then examined the fxcor velocity returns. In a num-ber of cases, unrealistically high values of Vhelio were ob-served. These can come about by selection of the ‘wrong’peak by fxcor in noisy or multi-peak cross-correlationfunctions. Values of Vhelio as large as ±1554 km s−1,±4184 km s−1 or ±5734 km s−1 arise, which are regarded asunrealistic, and such values tend to be associated with hghtvalues close to or less than 0.2. The distribution of velocitiesreturned from fxcor, corrected to Vhelio, was analysed andshowed that most velocities fall within ±200 km s−1. Allcross-correlation functions where hght> 0.4 yielded veloci-ties within this range so, on this basis, heliocentric velocitiesfalling outside this range were excluded.
MNRAS 000, 1–20 (2015)

6G.P.Thom
psonet
al.
Table 1. The first 18 lines of the individual results for objects meeting the criteria (hght> 0.2, −200 km s−1 6Vhelio 6 +200 km s−1). The full table can be found in Appendix A1 to the
electronic version of this paper
Objects meeting the criteria (hght> 0.2, −200 km s−1 6Vhelio 6 +200 km s−1).
[1] [2] [3] [4] [5] [6] [7] [8] [9] [10] [11] [12] [13] [14] [15] [16] [17]
30 August 2011 31 August 2011
#Fibre ID RA Dec I−band distance phot. spec. SNR hght Vhelio Verr SNR hght Vhelio Verr Flag
(◦) (◦) (mag.) (kpc) class. class. (km s−1) (km s−1) (km s−1) (km s−1)
1 217716 296.23 -14.86 19.3 0.52 M Ce: 7 0.39 -10 49 9 0.48 -35 36 C
2 239630 296.33 -14.95 19.4 1.52 C* C: 6 0.43 -55 41 7 0.54 -55 27 C
3 210316 296.43 -14.83 18.9 1.69 M C: 5 0.59 15 25 6 0.76 -11 16 C
4 174035 296.37 -14.71 19.1 1.4 M* C 3 0.37 -26 57 5 0.27 -43 67 C
6 199974 296.37 -14.8 19.2 1.17 M C ... ... ... ... 9 0.65 4 24 C
7 194949 296.35 -14.78 18.9 1 C* C: 12 0.72 -1 34 18 0.75 -14 23 C
8 242030 296.35 -14.96 18.8 1.64 ... ... 6 0.6 -53 21 9 0.7 -62 22 ...
9 220271 296.39 -14.87 ... 1.43 ... ... 5 0.48 -28 40 8 0.59 -63 27 ...
10 188246 296.49 -14.76 18.3 2.12 M C: 6 0.57 -40 29 10 0.8 -39 16 C
11 172656 296.54 -14.71 19.3 2.66 C* C 5 0.29 -125 69 8 0.39 -70 41 C
12 211898 296.31 -14.84 18.8 0.7 M C 9 0.57 -31 26 7 0.74 -21 20 C
14 246838 296.54 -14.98 ... 2.99 ... ... 4 0.36 -78 37 5 0.57 -61 28 ...
15 206867 296.3 -14.82 ... 0.59 ... ... 7 0.42 1 58 8 0.42 -3 38 ...
17 225812 296.32 -14.9 ... 1.06 ... ... 4 0.33 0 75 6 0.51 -10 31 ...
18 190283 296.34 -14.76 19.6 0.96 M C 6 0.45 -44 33 5 0.36 -51 36 C
19 168284 296.41 -14.69 19.0 1.78 C* C: 9 0.48 40 42 10 0.48 21 34 C
21 213379 296.24 -14.85 19.9 0.39 C* Ce: 4 0.4 -25 42 ... ... ... ... C
22 200573 296.27 -14.8 19.0 0.34 M Ce 8 0.37 10 73 9 0.72 -12 17 C
Column
1 & 2 Fibre number and the target identifier respectively as defined by Sibbons et al. (2015).
3 & 4 Right ascension (RA) and declination (Dec) of each object (J2000) according to Sibbons et al. (2015).
5 I−band magnitude of C-type AGBs in the inner region from the catalogue of Letarte et al. (2002).
6 Distance of the object from the putative galactic centre (α = 19h : 44m : 56s (296.2333◦), J2000 and δ = −14◦ : 48′ : 06′′ (−14.8017◦), J2000) centred on the optical co-ordinates of NGC
68227 adopted by Sibbons et al. (2012, 2015) and a galactic distance of 490 kpc (Mateo 1998).
7 & 8 Photometric classification of each object from Sibbons et al. (2012), and its corresponding spectroscopic classification from Sibbons et al. (2015).
9 & 13 SNR of each object calculated in the band 8560 A to 8650 A for the nights of 30 August 2011 and 31 August 2011 respectively.
10, 11 & 12 hght, the heliocentric radial velocity (Vhelio) and the velocity error (Verr) returned from fxcor for the night of 30 August 2011.
14, 15 & 16 hght, the heliocentric radial velocity (Vhelio) and the velocity error (Verr) returned from fxcor for the night of 31 August 2011.
17 Flag showing which objects were used in the composite templates: “C” for the C-type composite and “M” for the M-type composite.
MN
RA
S000
,1–20
(2015)

Carbon star rotation in NGC 6822 7
4 RESULTS AND ANALYSIS
4.1 Cross-correlation results with the C-typetemplate
All 323 objects were cross-correlated with the C-type com-posite template. Application of the criteria discussed in §3resulted in 128 successful cross correlations in the inner re-gion and 107 in the outer region on 30 August, and 129 inthe inner region and 124 in the outer region on 31 August.From the population of 96 C-type AGBs in the inner region,89 gave results meeting the selection criteria on 30 Augustand 92 on 31 August.
The full results of the radial velocity measurements andtheir individual errors over both nights are shown in full inthe Appendix to the electronic version of this paper. Thefirst 18 lines of these results are reproduced in Table 1, withexplanations of the column contents. Spectra which failed tomeet the selection criteria are not included.
Table 2 summarises the results. Column [3] shows themean heliocentric radial velocities, 〈Vhelio〉, of the sample.For the inner region, this can be considered a good approxi-mation to the heliocentric radial velocity of NGC 6822. Themean individual error in column [4] is large and reflects thelow resolution and low SNR of the spectra. σ(Vhelio) in Col-umn [5], is the velocity dispersion, which is also high, nev-ertheless, the standard error of the mean (SE) in column[6] is small, 3− 8 km s−1, implying that, provided the in-dividual errors are random, the mean and median (column[7]) heliocentric radial velocities are well constrained. Themean velocities show reasonable consistency from night tonight, with differences similar to the standard error in themean, SE. The inner region differs by > −24 km s−1 fromthe outer region8, supporting the suggestion that the objectsin the outer region are not part of NGC 6822.
Thus, we conclude that the heliocentric radial veloc-ity of NGC 6822, as based on the sample of the inner C-type AGB population, lies in the median range of −43±4 to−51±3 km s−1 (1σ). The data for 31 August are preferred,owing to their better SNR, lower errors and greater numberof successful cross-correlations than the data for 30 August,and provides Vhelio= −51± 3 km s−1 (1σ). This comparesfavourably with published values described earlier.
Fig. 5 plots Vhelio of all objects which meet the accep-tance criteria, by distance D from the galactic centre, forboth nights. It shows a number of differences between the in-ner and outer populations. The inner objects tend to clumpmore closely around the median value for the inner regionand they are therefore likely to be part of the same dynam-ical system, while the outer objects are much more widelyspread about a different median value, indicating a separatepopulation. This suggests that the inner population is as-sociated with NGC 6822, supporting similar conclusions inSibbons et al. (2012, 2015), while the outer population isnot.
The aggregated results of the cross-correlation of thespectra of objects in the outer region using the M-type tem-plate are also presented in Table 2. Both the formal errors,〈Verr〉, and the spread of results, σ(Vhelio), are reduced by
8 This supercedes the preliminary data stated in Sibbons et al.
(2015) and is the result of more detailed work.
switching to the M-type template in the outer region. Theimprovement observed in outer region errors when an M-startemplate is used supports the conclusion that the outer starsare predominantly dM-type, dK-type and other unclassifiedforeground stars of the Milky Way, (Sibbons et al. 2015).
4.2 Rotation of the carbon star population
In the inner region, the Vhelio of each C-type object wascompared to the sample mean, 〈Vhelio〉, which we take to bethe mean motion of the galaxy. This provides a measure ofthe motion of each object in the rest frame of the galacticcentre of NGC 6822. Fig. 6 plots the locations of the innerC-stars, colour coded by the value of its residual velocity,Vhelio−〈Vhelio〉, using a colour range from red (for positivevalues) to blue (for negative values). The colour range isconsistent with red and blue shift and indicates whetheran object is receding or approaching in the rest frame ofNGC 6822. In the lower panel for 31 August, it can be seenthat receding objects dominate the south east sector andapproaching objects the north west sector, suggesting rota-tion of the C-star population about an axis, oriented ap-proximately NE-SW. In the upper panel, for the night of 30August, the pattern is less obvious but still apparent.
To examine this further, an axis of rotation was hypoth-esised lying in the plane of the sky and passing through apivot point at the centre of the galaxy. The axis was rotatedthrough 360 steps of 1◦, starting at a position angle (PA) of0◦. At each step, the mean of the residual velocities of thestars on either side of the axis was computed. The subsampleof stars falling on one side of the line is termed the ‘NorthBin’, and for an axis with PA= 90◦, this is defined naturally.The subsample falling on the other side of the line is termedthe ‘South Bin’. Membership of each bin changes as the axisof rotation sweeps around and the value of its mean velocityresidual also changes. By plotting the mean velocity resid-uals over 360◦, a clear rotational signature is observed, seeFig. 7. The purple curves plot the mean rotational velocityof the ‘North Bin’ and the blue curves plot the mean rota-tional velocity of the ‘South Bin’. In both bins and on bothnights the curves rise and fall in opposition as the putativeaxis is rotated, confirming our impression of a rotating pop-ulation. Furthermore, the curves for the 30 August and 31August both suggest a similar sense of speed and rotation,even though the curves for 30 August are noisier.
The green curve in each case shows the sum of the aver-age ‘North’ and ‘South’ velocities, which is generally offsetfrom zero as the number of stars in the ‘North’ and ‘South’bins is not always equal at each step. Over the full 360◦,the offset should average to zero if the centre of the stellarsample and the pivot point of the hypothesised axis of ro-tation (the galaxy centre) are coincident. In this case, thegreen curve appears to lie mainly above the zero line, whichsuggests that the pivot point adopted does not coincide per-fectly with the rotational centre of the sample. Changing theco-ordinates of the galactic centre in our analysis to the cen-tre of the sample eliminates the offset, but has no significanteffect on the rotation characteristics.
Using a least squares method, a sinusoid of the formy = Vrot sin(θ − θ0) + y0 was fitted to the measured residualvelocities, y, for each bin, such that (y−y)2 is minimised. Thepeak amplitude gives the mean rotational velocity, Vrot, θ
MNRAS 000, 1–20 (2015)

8 G. P. Thompson et al.
Table 2. Summary of Results for spectra with hght ≥ 0.2 and |Vhelio|< 200 km s−1.
Template Object No. of 〈Vhelio〉 〈Verr〉 σ(Vhelio) SE Median Vhelio
Composite Template Objects [km s−1] [km s−1] [km s−1] [km s−1] [km s−1]
[2] [3] [4] [5] [6] [7]
30August2011Inner region (C-template) 128 −45 ±42 45 ±4 −43
Outer region (C-template) 107 −20 ±63 81 ±8 −19Outer region (M-template) 100 −28 ±54 60 ±6 −22
31August2011
Inner region (C-template) 129 −51 ±32 29 ±3 −51
Outer region (C-template) 124 −17 ±60 66 ±6 −9Outer region (M-template) 133 −18 ±49 58 ±5 −19
Figure 5. Relationship between Vhelio and distance D from the galactic centre, left panel for 30 August 2011 and right panel for 31
August 2011. The horizontal dashed lines represent the median radial velocity of the sample from Table 2. C-type AGBs are shown asblack points.
tracks the PA of the hypothesised axis and is stepped in 1◦
intervals, and θ0 is the value of θ when y− y0 = 0. y0 is theoffset. Solving for y0, θ0 and Vrot, y is plotted in Fig. 7, asdotted and dashed sinusoids for the ‘North’ and ‘South’ binsrespectively. The rotation axis PA occurs at the peak of thesinusoid, so its PA is given by the value of θ when y is amaximum. This occurs at θ0±90◦.
Table 3 provides a summary of the results obtained,with Vrot in column [1]. In column [2], we calculate the errorin the velocity amplitude, ∆Vrot, from the RMS of the resid-ual velocities found by deducting the sine function from eachmeasured value over 360◦, at the best fit PA. In columns [3]and [4], we show the PA of the galactic rotation axis andan estimate of its positional error found by taking the RMS,over 360◦, of θ − θ ′, where θ ′ is the angle which gives thevalue of y(θ) in the sine function at the best fit PA. Column[5] shows the mean offset of the sinusoid due to the axispivot point and the sample centre not being coincident.
The sense of rotation on both nights is the same and issuch that the south eastern side is receding and the north
western side is approaching, which corresponds with the ro-tation of HI gas in Weldrake et al. (2003). Moreover the ro-tation velocities and estimated PA for each night correspondwithin the estimated errors which gives us good confidencein the result. Nevertheless, owing to the better quality spec-tra for 31 August, better SNR and better error results, wetake the results for 31 August, i.e Vrot = 11.4± 2.1 km s−1
and PA = 26±13◦ as the more reliable.
Up to now, we have been considering only objects < 4kpc from the galaxy centre . These correspond to objects inthe Letarte et al. (2002) catalogue. Nevertheless there are 3outliers at distances ∼ 5 kpc, which lie close to the stellarellipse in Fig. 2 and which are classified as C-type AGBs(Sibbons et al. 2015). These objects lie in positions close tothe major axis of the ellipse. If we include these outliers inour estimates, the rotation rate and rotation axis becomeVrot = 11.2± 2.5 km s−1 PA = −5◦± 20◦ for 30 August andVrot = 12.1± 2.3 km s−1 PA = 19◦± 14◦ for 31 August, wellwithin the margins of error for our sample.
MNRAS 000, 1–20 (2015)

Carbon star rotation in NGC 6822 9
Figure 6. Residual velocity, Vhelio−〈Vhelio〉, plots of the carbon star sample in the inner region of NGC6822. The long axis represents aderived axis of rotation and passes through the galaxy centre at the intersection with the short axis.
MNRAS 000, 1–20 (2015)

10 G. P. Thompson et al.
Figure 7. Rotational signature of carbon star component in NGC 6822 derived by plotting the mean residual velocities, 〈Vhelio−〈Vhelio〉〉,on either side of the long axis as a function of its position angle.
MNRAS 000, 1–20 (2015)

Carbon star rotation in NGC 6822 11
Table 3. Summary of sinusoidal least squares fit to mean residual velocities.
Rotation rate Rotation axis Offset
Vrot ∆Vrot PA ∆PA y0km s−1 km s−1 ◦ ◦ km s−1
[1] [2] [3] [4] [5]
30 Aug 2011 8.7 ±2.2 2◦ ±22◦ 0.4
31 Aug 2011 11.2 ±2.1 26◦ ±13◦ 0.4
Table 4. Comparison of results with published velocity data.
Vhelio Vrot Rotation axis Commentskm s−1 km s−1 PA
This study −51±3 11.2±2.1 26◦±13◦ 92 carbon stars
Koribalski et al. (2004) [1] −57±2 ... ... HI measurements
Weldrake et al. (2003) [2] −53.3 to −54.7 −100 to +10 ... HI measurementsMcConnachie (2012) −57±2.0 47±2 ... Vhelio from [1]
Mateo (1998) ... 47±3 ... HI measurementsMateo (1998) −53±4 ... ... Optical measurements
Kirby et al. (2014) −54±1.7 ∼ 10 ... 7 red giant stars
Demers et al. (2006) [3] +10 to −70 ... 63◦ to 67◦ 110 carbon starsVeljanoski et al. (2015) −59 to −60 12±10 ... 8 GCs, “disk” model, see §1Flores-Duran et al. (2014) −57.8 ... ... 10 Planetary nebulae
Hwang et al. (2014) −88.3±22.7 .... ... 4 Extended star clustersHwang et al. (2014) −32.9±29.4 15.9±0.3 ... Derived from carbon star population of [3]
5 DISCUSSION AND CONCLUSION
Table 4 compares our results with the published data pre-viously summarised in §1. The heliocentric radial velocitywe obtained for NGC 6822 is −51±3 km s−1, based on theresults from the better of the two nights of observations of asample of its intermediate age carbon star population. Thisis a little lower than its HI counterpart - −57± 2 km s−1 -(Koribalski et al. 2004) but shows less than 1.6σ differenceto this and the other estimates above, except that of Hwanget al. (2014) where it is apparent that the errors in Hwanget al. (2014) are large enough to include our result. In oursample, the grouping of objects in the inner and outer re-gions of the observed field indicates that the inner objectsbelong to NGC 6822, while the outer objects are more likelyto be Milky Way stars, in support of the conclusion in Sib-bons et al. (2015).
Rotation of the carbon star population about an axishaving PA = 26±13◦ has been shown with a rotation speedVrot = 11.2±2.1 km s−1, based on the better of the two ob-serving nights. While we see some movement in the PA ofthe rotation axis due to the AGB outliers in Fig. 2, theirnumbers are too small to draw any real conclusions on itssignificance. Radial velocity data from more objects spreadbroadly throughout the stellar ellipse in Fig. 2 would pro-vide better data. Nevertheless, the sense of rotation of thesample is that the SE corner is receding and the NW corneris approaching, similar to the rotation of the HI disk (Wel-drake et al. 2003). We can infer from Weldrake et al. (2003),that the PA of the rotation axis of the HI disk is ∼ 20◦ to∼ 40◦ in the plane of the sky, assuming the rotation axis is
perpendicular to the major axis of the gas disk. This is com-parable to our estimate of the sky projected rotation axisof the C-type stellar population in this study. Thus we findthat both axes are approximately coincident and the senseof rotation of the stars and gas is the same, leading us toconclude that NGC 6822 is not a PRG.
The PA of the major axes of the isodensity contours ofthe RGB stars in Demers et al. (2006) varies from 80◦ forthe innermost contour (radius= 10′) to 65◦ for the outermostcontour (radius= 35′). Our inner sample has a angular ra-dius of ∼ 17′, and so falls between these extremes. Hence,there is a misalignment of ∼ 45◦ between our rotation axisand the respective isodensity profile. Furthermore, since Vrot
is derived from mean velocities, it is reasonable to adopt themean distance of our carbon star sample from the galaxycentre as a basis for further comparative discussion. This dis-tance is 〈D〉= 1.1 kpc. Interpreting the velocity diagrams ofWeldrake et al. (2003), the rotation speed of the HI disk canbe estimated to be ∼ 30 km s−1 at 1.1 kpc (≈ 8 arcmin) fromthe galactic centre. This rotation speed is faster than our C-star sample confirming differences in the rotation speeds ofthe rotationally supported gas and the pressure supportedintermediate age stellar populations.
The rotation misalignment, apparent separation of gasand stellar populations and effect of AGBs filling the gapbetween the central sample in this study and the stellar el-lipse depicted in Fig. 2 would benefit from further study,particularly at higher SNR and better resolving power.
MNRAS 000, 1–20 (2015)

12 G. P. Thompson et al.
ACKNOWLEDGEMENTS
We would like to thank Scott Croom for undertaking theAAOmega service observations and Sarah Brough for herassistance in reducing the data.
We would also like to thank the anonymous referee foruseful comments, which has helped us to write a more con-cise paper.
REFERENCES
Battinelli P., Demers S., Kunkel W. E., 2006, A&A, 451, 99Demers S., Battinelli P., 2007, in Kerschbaum F., Charbonnel C.,
Wing R. F., eds, Astronomical Society of the Pacific Confer-
ence Series Vol. 378, Why Galaxies Care About AGB Stars:Their Importance as Actors and Probes. p. 469
Demers S., Battinelli P., Kunkel W. E., 2006, ApJ, 636, L85
Feast M. W., Whitelock P. A., Menzies J. W., Matsunaga N.,2012, MNRAS, 421, 2998
Flores-Duran S. N., Pena M., Hernandez-Martınez L., Garcıa-
Rojas J., Ruiz M. T., 2014, A&A, 568, A82Gieren W., Pietrzynski G., Nalewajko K., Soszynski I., Bresolin
F., Kudritzki R.-P., Minniti D., Romanowsky A., 2006, ApJ,647, 1056
Hodge P., Smith T., Eskridge P., MacGillivray H., Beard S., 1991,
ApJ, 379, 621Hubble E., 1925, Contributions from the Mount Wilson Observa-
tory / Carnegie Institution of Washington, 304, 1
Hwang N., Park H. S., Lee M. G., Lim S., Hodge P. W., KimS. C., Miller B., Weisz D., 2014, ApJ, 783, 49
Kirby E. N., Bullock J. S., Boylan-Kolchin M., Kaplinghat M.,
Cohen J. G., 2014, MNRAS, 439, 1015Koribalski B. S., et al., 2004, AJ, 128, 16
Letarte B., Demers S., Battinelli P., Kunkel W. E., 2002, AJ, 123,
832Mateo M. L., 1998, ARA&A, 36, 435
Matthews L. D., Gerard E., Le Bertre T., 2015, MNRAS, 449,
220McConnachie A. W., 2012, AJ, 144, 4
Rich J. A., Persson S. E., Freedman W. L., Madore B. F., MonsonA. J., Scowcroft V., Seibert M., 2014, ApJ, 794, 107
Sibbons L. F., Ryan S. G., Cioni M.-R. L., Irwin M., Napiwotzki
R., 2012, A&A, 540, A135Sibbons L. F., Ryan S. G., Napiwotzki R., Thompson G. P., 2015,
A&A, 574, A102
Tonry J., Davis M., 1979, AJ, 84, 1511Veljanoski J., et al., 2015, MNRAS, 452, 320
Weldrake D. T. F., de Blok W. J. G., Walter F., 2003, MNRAS,
340, 12Whitelock P. A., Menzies J. W., Feast M. W., Nsengiyumva F.,
Matsunaga N., 2013, MNRAS, 428, 2216de Blok W. J. G., Walter F., 2000, ApJ, 537, L95van Belle G. T., Paladini C., Aringer B., Hron J., Ciardi D., 2013,
ApJ, 775, 45
MNRAS 000, 1–20 (2015)

Carbon star rotation in NGC 6822 13
APPENDIX A: TABLES OF DATA
Appendix A1 shows the individual fxcor returns for objects meeting the criteria hght> 0.2, −200 km s−1 6 Vhelio 6 +200km s−1 for 30 August 2011 and 31 August 2011. The meanings of the data in each column are described as follows:
Column1 & 2 Fibre number and the target identifier respectively as defined by Sibbons et al. (2015).3 & 4 Right ascension (RA) and declination (Dec) of each object (J2000) according to Sibbons et al.
(2015).5 I−band magnitude of C-type AGBs in the inner region from the catalogue of Letarte et al. (2002).
6 Distance of the object from the putative galactic centre (α = 19h : 44m : 56s (296.2333◦), J2000 andδ =−14◦ : 48′ : 06′′ (−14.8017◦), J2000) centred on the optical co-ordinates of NGC 68229 adoptedby Sibbons et al. (2012, 2015) and a galactic distance of 490 kpc (Mateo 1998).
7 & 8 Photometric classification of each object from Sibbons et al. (2012), and its corresponding spectro-scopic classification from Sibbons et al. (2015).
9 & 13 SNR of each object calculated in the band 8560 A to 8650 A for the nights of 30 August 2011 and31 August 2011 respectively.
10, 11 & 12 hght, the heliocentric radial velocity (Vhelio) and the velocity error (Verr) returned from fxcor forthe night of 30 August 2011.
14, 15 & 16 hght, the heliocentric radial velocity (Vhelio) and the velocity error (Verr) returned from fxcor forthe night of 31 August 2011.
17 Flag showing which objects were used in the composite templates: “C” for the C-type compositeand “M” for the M-type composite.
MNRAS 000, 1–20 (2015)

14G.P.Thom
psonet
al.
Appendix A1: Individual fxcor returns for objects meeting the criteria (hght> 0.2, −200 km s−1 6Vhelio 6 +200 km s−1).
[1] [2] [3] [4] [5] [6] [7] [8] [9] [10] [11] [12] [13] [14] [15] [16] [17]
30 August 2011 31 August 2011
#Fibre ID RA Dec I−band distance phot. spec. SNR hght Vhelio Verr SNR hght Vhelio Verr Flag
(◦) (◦) (mag.) (kpc) class. class. (km s−1) (km s−1) (km s−1) (km s−1)
1 217716 296.23 -14.86 19.3 0.52 M Ce: 7 0.39 -10 49 9 0.48 -35 36 C
2 239630 296.33 -14.95 19.4 1.52 C* C: 6 0.43 -55 41 7 0.54 -55 27 C
3 210316 296.43 -14.83 18.9 1.69 M C: 5 0.59 15 25 6 0.76 -11 16 C
4 174035 296.37 -14.71 19.1 1.4 M* C 3 0.37 -26 57 5 0.27 -43 67 C
6 199974 296.37 -14.8 19.2 1.17 M C ... ... ... ... 9 0.65 4 24 C
7 194949 296.35 -14.78 18.9 1 C* C: 12 0.72 -1 34 18 0.75 -14 23 C
8 242030 296.35 -14.96 18.8 1.64 ... ... 6 0.6 -53 21 9 0.7 -62 22 ...
9 220271 296.39 -14.87 ... 1.43 ... ... 5 0.48 -28 40 8 0.59 -63 27 ...
10 188246 296.49 -14.76 18.3 2.12 M C: 6 0.57 -40 29 10 0.8 -39 16 C
11 172656 296.54 -14.71 19.3 2.66 C* C 5 0.29 -125 69 8 0.39 -70 41 C
12 211898 296.31 -14.84 18.8 0.7 M C 9 0.57 -31 26 7 0.74 -21 20 C
14 246838 296.54 -14.98 ... 2.99 ... ... 4 0.36 -78 37 5 0.57 -61 28 ...
15 206867 296.3 -14.82 ... 0.59 ... ... 7 0.42 1 58 8 0.42 -3 38 ...
17 225812 296.32 -14.9 ... 1.06 ... ... 4 0.33 0 75 6 0.51 -10 31 ...
18 190283 296.34 -14.76 19.6 0.96 M C 6 0.45 -44 33 5 0.36 -51 36 C
19 168284 296.41 -14.69 19.0 1.78 C* C: 9 0.48 40 42 10 0.48 21 34 C
21 213379 296.24 -14.85 19.9 0.39 C* Ce: 4 0.4 -25 42 ... ... ... ... C
22 200573 296.27 -14.8 19.0 0.34 M Ce 8 0.37 10 73 9 0.72 -12 17 C
23 219598 296.3 -14.87 19.0 0.79 C* C 6 0.36 -94 77 10 0.48 -62 52 C
24 203106 296.34 -14.81 19.4 0.87 C* C: 7 0.64 -31 30 9 0.68 -35 21 C
25 209216 296.23 -14.83 19.1 0.25 M Ce ... ... ... ... 12 0.64 -11 21 C
26 197590 296.32 -14.79 19.3 0.72 C* M: 22 0.68 -9 43 9 0.45 -28 63 ...
28 197464 296.28 -14.79 19.0 0.43 M C 7 0.48 -80 47 9 0.7 -58 30 C
29 206129 296.24 -14.82 19.2 0.16 M dKe: 12 0.6 -32 39 12 0.54 -23 49 ...
31 180514 296.38 -14.73 17.8 1.33 M C 10 0.83 -40 15 11 0.89 -36 16 C
32 191382 296.3 -14.77 19.2 0.66 M* C 6 0.5 0 28 8 0.51 -25 22 C
33 306281 297.06 -15.27 ... 7.9 ... ... 4 0.26 148 63 ... ... ... ... ...
34 294767 296.99 -15.21 ... 7.19 ... ... 5 0.23 149 92 ... ... ... ... ...
36 292760 296.77 -15.2 ... 5.6 M dM 23 0.57 5 50 48 0.61 7 51 M
38 218420 296.36 -14.87 19.0 1.21 C* C 7 0.43 -25 26 7 0.32 -52 73 C
41 324220 297.01 -15.36 ... 8 ... ... 1 0.21 -6 26 ... ... ... ... ...
43 229856 296.37 -14.91 19.0 1.47 C* C ... ... ... ... 8 0.52 -31 31 C
45 201454 296.25 -14.8 19.4 0.15 C* Ce: 16 0.58 -21 45 21 0.66 -45 36 C
47 291854 296.82 -15.2 ... 5.92 ... ... ... ... ... ... 5 0.3 80 51 ...
48 184448 296.44 -14.74 19.0 1.75 M* C 4 0.3 -30 48 7 0.31 -6 38 C
49 335226 296.92 -15.41 ... 7.68 ... ... 5 0.31 -156 63 7 0.26 2 69 ...
51 341622 296.86 -15.44 ... 7.55 ... ... 4 0.23 71 106 ... ... ... ... ...
52 342923 296.85 -15.45 ... 7.52 ... ... 2 0.28 33 60 ... ... ... ... ...
53 248633 296.34 -14.99 18.9 1.82 C* C: 6 0.46 -17 46 7 0.47 -51 38 C
54 229643 296.35 -14.91 18.9 1.37 C* C 8 0.64 -55 24 10 0.71 -43 23 C
56 351371 296.84 -15.49 ... 7.73 ... ... 3 0.28 58 138 ... ... ... ... ...
57 186954 296.47 -14.75 21.0 2 Unid* dK 4 0.24 192 76 4 0.22 -35 65 ...
58 249091 296.39 -14.99 ... 2.08 ... ... 7 0.47 -86 20 7 0.44 -38 46 ...
62 299244 296.68 -15.24 ... 5.22 ... ... ... ... ... ... 4 0.28 19 62 ...
65 220153 296.24 -14.87 19.6 0.6 M Ce 9 0.31 -28 101 8 0.59 -2 31 C
68 240673 296.06 -14.96 19.7 1.93 M* C 3 0.31 -52 66 4 0.36 -46 64 C
69 310311 296.6 -15.29 ... 5.2 ... ... 4 0.37 -178 72 6 0.33 -32 68 ...
70 237395 296.07 -14.94 19.9 1.81 Unid* C 3 0.26 -32 133 ... ... ... ... C
71 228306 296.25 -14.91 19.8 0.91 M Ce 5 0.39 -33 61 6 0.56 -38 29 C
73 337540 296.5 -15.42 ... 5.74 ... ... 3 0.3 9 84 ... ... ... ... ...
75 223056 296.26 -14.88 19.6 0.74 M Ce 6 0.42 -59 55 9 0.33 -55 52 C
76 237999 296.09 -14.95 20.0 1.71 C* C 4 0.24 -110 37 5 0.48 -67 27 C
78 220391 296.21 -14.87 ... 0.63 ... ... 9 0.64 -24 33 11 0.66 -26 30 ...
Continued on next page
MN
RA
S000
,1–20
(2015)

Carbon
starrotation
inNGC
682215
Appendix A1 (cont.): Individual fxcor returns for objects meeting the criteria (hght> 0.2, −200 km s−1 6Vhelio 6 +200 km s−1).
[1] [2] [3] [4] [5] [6] [7] [8] [9] [10] [11] [12] [13] [14] [15] [16] [17]
30 August 2011 31 August 2011
#Fibre ID RA Dec I−band distance phot. spec. SNR hght Vhelio Verr SNR hght Vhelio Verr Flag
(◦) (◦) (mag.) (kpc) class. class. (km s−1) (km s−1) (km s−1) (km s−1)
80 231793 296.22 -14.92 19.0 1.04 C* C 4 0.5 -80 57 9 0.79 -39 21 C
81 219171 296.23 -14.87 ... 0.57 ... ... 7 0.46 -79 36 8 0.72 -61 17 ...
82 343626 296.38 -15.45 ... 5.69 ... ... 4 0.49 -72 24 ... ... ... ... ...
83 343571 296.44 -15.45 ... 5.81 ... ... ... ... ... ... 6 0.42 71 56 ...
84 248651 296.28 -14.99 18.9 1.65 ... ... 7 0.63 -43 29 10 0.85 -56 14 ...
85 208620 296.1 -14.83 18.5 1.12 M C 11 0.8 -68 23 11 0.85 -66 17 C
86 219351 296.28 -14.87 19.4 0.7 M Ce 7 0.52 -60 47 9 0.76 -38 22 C
88 226097 296.21 -14.9 19.3 0.84 M C 5 0.53 -53 27 5 0.65 -29 21 C
90 215861 296.17 -14.86 19.5 0.67 M Ce 5 0.5 -22 37 6 0.5 -13 26 C
91 250173 296.22 -15 19.2 1.67 Unid* C 6 0.39 -55 58 4 0.44 -8 29 C
94 225648 296.16 -14.89 18.8 0.98 C* C 11 0.84 -27 14 9 0.86 -33 16 C
95 242563 296.18 -14.96 19.8 1.43 C* C 7 0.41 -41 58 9 0.64 -77 25 C
96 208714 296.18 -14.83 19.3 0.48 M Ce 8 0.64 -29 22 11 0.74 -35 17 C
98 226603 296.12 -14.9 18.7 1.26 M C 6 0.65 -65 24 7 0.71 -74 23 C
99 330842 296.34 -15.39 ... 5.08 M dM 3 0.32 -46 62 7 0.32 24 62 M
101 220672 296.11 -14.87 ... 1.22 ... ... 3 0.36 -18 41 5 0.49 -1 35 ...
102 344297 296.12 -15.46 ... 5.66 M dM 5 0.35 85 56 12 0.52 16 46 M
104 209650 296.13 -14.83 19.4 0.9 M C 6 0.37 -51 33 7 0.35 -51 39 C
105 233186 296.16 -14.93 20.2 1.26 Unid* Unid 19 0.52 39 42 17 0.71 -39 26 ...
106 344467 296.18 -15.46 ... 5.61 M dK 7 0.48 -40 33 15 0.61 -14 44 ...
107 351774 296.12 -15.49 ... 6 ... ... 3 0.29 16 55 6 0.53 -62 30 ...
112 253239 296.09 -15.01 19.4 2.14 C* C 3 0.35 -32 26 4 0.49 -40 24 C
113 199754 296.21 -14.8 19.2 0.21 C* Ce 10 0.5 -92 54 8 0.67 -45 21 C
115 339686 296.09 -15.43 ... 5.52 ... ... 4 0.31 -100 52 ... ... ... ... ...
116 326339 295.95 -15.37 ... 5.41 ... ... 4 0.29 -94 75 4 0.46 24 48 ...
119 207586 296.21 -14.82 19.1 0.26 M C 11 0.6 -72 35 8 0.6 -61 32 C
122 223739 296.15 -14.89 19.8 0.98 M C 5 0.5 -40 36 7 0.44 -4 71 C
123 199930 296.24 -14.8 ... 0.04 ... ... 14 0.78 -83 26 14 0.78 -56 23 ...
124 239687 296.03 -14.95 19.3 2.08 M* C 7 0.4 -15 54 5 0.65 -67 20 C
125 216688 296.08 -14.86 18.8 1.36 M* C: 16 0.74 -22 18 14 0.75 -64 21 C
126 327377 296.01 -15.37 ... 5.23 M dK 6 0.43 -2 45 8 0.31 -9 86 ...
128 317678 295.95 -15.33 ... 5.09 M dM: 5 0.23 -3 60 9 0.35 17 72 M
129 337831 295.92 -15.42 ... 5.89 M dK 4 0.37 30 36 7 0.39 36 66 ...
130 313097 295.88 -15.31 ... 5.23 M dK 6 0.34 -62 114 12 0.48 -11 57 ...
131 355390 295.77 -15.51 ... 7.18 M dM: ... ... ... ... 11 0.38 45 185 M
132 300999 295.84 -15.25 ... 5.02 ... ... ... ... ... ... 5 0.23 -155 63 ...
133 372253 295.8 -15.59 ... 7.68 M dK 7 0.35 30 115 8 0.41 70 68 ...
134 317557 295.79 -15.33 ... 5.79 M dK: 5 0.49 6 52 7 0.41 16 80 ...
135 303607 295.81 -15.26 ... 5.25 M dM ... ... ... ... 7 0.39 26 94 M
136 222468 296.1 -14.88 19.5 1.32 M C 4 0.47 -105 31 7 0.59 -28 39 C
137 299996 295.78 -15.24 ... 5.32 M C: 3 0.42 -46 32 5 0.53 -67 38 ...
138 297583 295.8 -15.23 ... 5.12 M dM 8 0.44 -7 59 16 0.57 58 57 M
139 303122 295.74 -15.26 ... 5.62 M dM ... ... ... ... 7 0.59 15 41 M
141 310841 295.78 -15.3 ... 5.67 ... ... ... ... ... ... 8 0.46 -54 51 ...
142 309370 295.87 -15.29 ... 5.13 M dM 8 0.37 31 63 ... ... ... ... M
145 350411 295.59 -15.49 ... 7.93 M dK 5 0.24 26 103 8 0.48 -51 53 ...
147 340026 295.62 -15.43 ... 7.4 ... ... 4 0.23 52 77 4 0.26 -92 169 ...
148 276398 295.72 -15.13 ... 5.06 C C: 5 0.36 -132 46 9 0.65 -111 26 ...
149 332677 295.65 -15.4 ... 7 M dM: 5 0.35 -15 28 10 0.42 -29 50 M
152 336076 295.52 -15.41 ... 7.89 ... ... 3 0.3 -79 36 5 0.46 -39 56 ...
153 337060 295.6 -15.42 ... 7.45 ... ... 3 0.26 -73 76 7 0.39 73 86 ...
154 282194 295.69 -15.16 ... 5.41 ... ... 2 0.41 -27 72 4 0.39 -68 28 ...
155 332908 295.52 -15.4 ... 7.77 ... ... 4 0.44 -38 31 5 0.38 11 76 ...
156 329347 295.52 -15.38 ... 7.72 M dM: 7 0.36 12 53 12 0.55 -47 47 M
157 324005 295.54 -15.36 ... 7.46 M dM: ... ... ... ... 9 0.47 -82 46 M
Continued on next page
MN
RA
S000
,1–20
(2015)

16G.P.Thom
psonet
al.
Appendix A1 (cont.): Individual fxcor returns for objects meeting the criteria (hght> 0.2, −200 km s−1 6Vhelio 6 +200 km s−1).
[1] [2] [3] [4] [5] [6] [7] [8] [9] [10] [11] [12] [13] [14] [15] [16] [17]
30 August 2011 31 August 2011
#Fibre ID RA Dec I−band distance phot. spec. SNR hght Vhelio Verr SNR hght Vhelio Verr Flag
(◦) (◦) (mag.) (kpc) class. class. (km s−1) (km s−1) (km s−1) (km s−1)
158 312062 295.53 -15.3 ... 7.19 M dM: 8 0.4 -20 51 15 0.53 -16 60 M
159 318572 295.58 -15.33 ... 7.08 M dK 10 0.54 -19 52 15 0.61 -15 33 ...
160 312215 295.5 -15.3 ... 7.43 M dK ... ... ... ... 10 0.31 -9 94 ...
161 301044 295.48 -15.25 ... 7.29 ... ... ... ... ... ... 1 0.31 -171 36 ...
163 298121 295.48 -15.23 ... 7.24 M dM: ... ... ... ... 8 0.38 81 68 M
164 305736 295.49 -15.27 ... 7.32 M dK ... ... ... ... 11 0.34 -19 89 ...
165 271722 295.63 -15.1 ... 5.63 ... ... 4 0.37 -71 43 7 0.35 128 66 ...
166 301701 295.43 -15.25 ... 7.68 ... ... ... ... ... ... 4 0.24 -67 77 ...
167 277183 295.64 -15.13 ... 5.65 M dM 10 0.25 66 100 ... ... ... ... M
169 287590 295.45 -15.18 ... 7.24 ... ... 3 0.28 -156 42 6 0.49 -9 59 ...
171 276077 295.43 -15.12 ... 7.19 ... ... 5 0.31 -63 36 8 0.29 15 62 ...
172 289833 295.41 -15.19 ... 7.6 M dK 10 0.43 -17 71 15 0.73 -61 39 ...
173 286135 295.42 -15.17 ... 7.45 M dM 7 0.33 -80 52 10 0.35 -49 60 M
174 245610 295.97 -14.98 19.2 2.63 M C 3 0.33 -87 54 4 0.72 -53 28 C
176 248935 295.55 -14.99 ... 5.91 ... ... 2 0.24 -135 100 ... ... ... ... ...
178 246831 295.64 -14.98 ... 5.14 M dK: 5 0.48 55 37 9 0.53 -9 52 ...
180 267519 295.6 -15.08 ... 5.78 ... ... 2 0.3 162 69 ... ... ... ... ...
181 254251 295.4 -15.02 ... 7.09 M dK 12 0.55 7 38 19 0.69 -2 46 ...
183 222762 295.59 -14.88 ... 5.33 M dM ... ... ... ... 9 0.29 105 59 M
184 223794 295.55 -14.89 ... 5.72 M dM 10 0.31 -24 79 12 0.35 9 51 M
185 215764 295.52 -14.86 ... 5.88 M dMe: 5 0.31 -39 81 8 0.3 -40 54 M
186 223551 295.62 -14.89 ... 5.11 M dK 5 0.3 102 100 9 0.45 -52 56 ...
187 202875 296.09 -14.81 ... 1.16 ... ... 4 0.4 -21 47 8 0.61 -36 37 ...
188 239242 295.56 -14.95 ... 5.71 ... ... ... ... ... ... 6 0.39 -75 42 ...
189 234263 295.54 -14.93 ... 5.84 M dM: 6 0.39 -24 32 12 0.37 -85 31 M
190 220386 295.54 -14.87 ... 5.8 M dK 7 0.38 -190 49 9 0.54 -110 43 ...
191 183391 296.09 -14.74 18.5 1.31 C* C 6 0.41 -34 41 5 0.52 -43 48 C
193 193714 296.11 -14.78 19.4 1.02 C* C 7 0.42 -130 59 9 0.72 -41 26 C
194 184165 295.61 -14.74 ... 5.18 M dM: 5 0.41 -22 53 7 0.44 24 81 M
195 208174 295.51 -14.83 ... 5.96 M dMe 5 0.44 113 76 9 0.55 5 70 M
198 178893 296.11 -14.73 19.0 1.2 C* C 6 0.55 -40 49 6 0.69 -42 24 C
199 185402 295.52 -14.75 ... 5.95 M dMe 16 0.49 58 47 20 0.66 -2 49 M
201 197170 296.15 -14.79 19.0 0.68 M Ce 7 0.72 -85 20 6 0.73 -59 22 C
202 201578 295.53 -14.8 ... 5.83 M dMe: 9 0.45 -2 54 15 0.47 -43 34 M
203 216118 296.07 -14.86 ... 1.41 ... ... 5 0.46 -85 29 6 0.47 -108 41 ...
204 209652 296.08 -14.83 19.3 1.26 C* C: ... ... ... ... 6 0.44 -126 48 C
205 201803 295.62 -14.8 ... 5.06 M dM: 4 0.46 -122 50 5 0.3 -122 53 M
206 188974 296.13 -14.76 19.2 0.92 M Ce 7 0.48 -42 33 8 0.66 -105 19 C
207 201131 296.16 -14.8 19.2 0.61 M C 8 0.64 -130 25 9 0.72 -114 28 C
208 191195 296.11 -14.77 19.5 1.09 M C 5 0.46 -85 27 6 0.44 -141 45 C
209 200928 295.56 -14.8 ... 5.58 M dMe: 6 0.32 -45 69 9 0.52 -18 42 M
210 201043 296.07 -14.8 19.1 1.33 M C 4 0.38 -102 44 5 0.58 -77 21 C
211 205865 296.19 -14.82 19.3 0.38 C* Ce 8 0.55 -40 41 12 0.8 -64 23 C
213 143954 295.41 -14.57 ... 7.11 M dM 3 0.34 -89 39 5 0.36 -37 50 M
214 212970 296.07 -14.84 19.5 1.43 M* C 5 0.3 -87 88 7 0.31 -89 56 C
216 217770 296 -14.86 ... 1.97 ... ... 4 0.26 -90 44 4 0.46 -94 38 ...
218 135229 295.57 -14.53 ... 5.94 ... ... ... ... ... ... 2 0.21 66 65 ...
219 203778 296.03 -14.81 ... 1.68 ... ... 4 0.29 -101 94 3 0.48 -64 53 ...
220 207096 296.16 -14.82 19.3 0.62 M C 5 0.61 -21 25 5 0.4 -42 60 C
221 170279 295.97 -14.69 19.0 2.37 M C 4 0.66 -43 24 7 0.76 -65 18 C
222 147856 295.59 -14.59 ... 5.65 ... ... 4 0.31 -54 66 4 0.45 -45 60 ...
223 235703 296.02 -14.94 ... 2.13 ... ... 2 0.46 -26 61 4 0.44 -58 58 ...
225 166319 296.11 -14.68 ... 1.5 ... ... 3 0.36 -101 31 5 0.46 -71 49 ...
226 170004 296.11 -14.69 19.6 1.37 Unid* C 5 0.34 10 77 3 0.41 -75 39 C
228 212351 296.17 -14.84 19.7 0.64 M C 5 0.53 -84 42 6 0.69 -52 18 C
Continued on next page
MN
RA
S000
,1–20
(2015)

Carbon
starrotation
inNGC
682217
Appendix A1 (cont.): Individual fxcor returns for objects meeting the criteria (hght> 0.2, −200 km s−1 6Vhelio 6 +200 km s−1).
[1] [2] [3] [4] [5] [6] [7] [8] [9] [10] [11] [12] [13] [14] [15] [16] [17]
30 August 2011 31 August 2011
#Fibre ID RA Dec I−band distance phot. spec. SNR hght Vhelio Verr SNR hght Vhelio Verr Flag
(◦) (◦) (mag.) (kpc) class. class. (km s−1) (km s−1) (km s−1) (km s−1)
229 167638 295.97 -14.68 18.7 2.41 M* C 6 0.5 -54 34 7 0.83 -88 16 C
230 174226 296.08 -14.71 19.5 1.51 M C 2 0.43 -27 63 3 0.44 -21 33 C
232 100740 295.42 -14.34 ... 7.82 ... ... 3 0.2 -122 173 5 0.27 93 86 ...
233 179746 296.22 -14.73 ... 0.64 ... ... 6 0.45 -99 31 6 0.54 -96 32 ...
235 173378 296.1 -14.71 19.2 1.37 C* C 5 0.46 -132 28 4 0.55 -106 40 C
236 92831 295.56 -14.3 ... 7.03 ... ... ... ... ... ... 8 0.22 -180 54 ...
237 88989 295.46 -14.28 ... 7.77 M dM 6 0.22 -55 80 10 0.42 -143 56 M
238 186430 296.23 -14.75 19.0 0.44 M Unid 13 0.46 -83 59 9 0.56 -74 31 ...
242 78560 295.53 -14.23 ... 7.63 M dK 7 0.33 -15 76 13 0.55 -46 51 ...
244 67411 295.58 -14.17 ... 7.62 ... ... 2 0.26 185 88 ... ... ... ... ...
245 86214 295.59 -14.27 ... 7.01 M dM 10 0.38 29 49 ... ... ... ... M
246 191318 296.23 -14.77 18.9 0.29 C* C 14 0.68 -76 21 10 0.79 -84 21 C
252 195133 296.23 -14.78 19.4 0.18 C* Ce: 12 0.53 -63 42 10 0.6 -69 27 C
254 64581 295.6 -14.16 ... 7.57 M dM: 5 0.56 -41 31 9 0.55 -42 42 M
255 93873 295.87 -14.31 ... 5.19 ... ... 2 0.28 -52 67 3 0.25 -23 51 ...
256 50172 295.62 -14.09 ... 7.94 ... ... ... ... ... ... 2 0.35 14 64 ...
257 184858 296.17 -14.75 19.6 0.7 M C 5 0.4 -38 49 7 0.6 -33 28 C
258 173834 296.22 -14.71 ... 0.79 ... ... 6 0.44 -32 50 7 0.69 -83 23 ...
259 49090 295.74 -14.09 ... 7.39 ... ... ... ... ... ... 6 0.36 -137 119 ...
260 195884 296.21 -14.78 19.5 0.22 M C 9 0.62 -18 24 11 0.73 -57 21 C
261 83041 295.91 -14.25 ... 5.4 ... ... 4 0.38 -80 65 4 0.39 -141 59 ...
262 165760 296.2 -14.67 20.1 1.12 M C 6 0.44 40 37 6 0.49 -42 51 C
263 107892 295.81 -14.38 ... 5.03 M dK 5 0.38 -62 82 10 0.33 -82 88 ...
266 200300 296.18 -14.8 19.7 0.41 M Ce: 8 0.44 -44 50 8 0.53 -33 27 C
267 158986 296.19 -14.64 19.2 1.41 M C 5 0.61 -61 36 5 0.5 -65 45 C
268 157078 296.12 -14.63 18.2 1.74 M C: 6 0.66 -120 36 8 0.8 -88 22 C
269 200182 296.17 -14.8 18.9 0.52 C* Ce 7 0.69 -37 27 9 0.67 -33 37 C
271 42925 295.84 -14.06 ... 7.15 ... ... 3 0.37 -89 67 7 0.3 -153 75 ...
273 172060 296.2 -14.7 19.6 0.9 C* dK 4 0.36 162 98 6 0.23 -38 96 ...
274 168826 296.18 -14.69 19.0 1.07 M C 5 0.67 -42 34 9 0.69 -37 29 C
277 76159 295.96 -14.22 ... 5.5 ... ... ... ... ... ... 8 0.26 -120 69 ...
279 181364 296.13 -14.73 ... 1.05 ... ... 9 0.69 -54 26 9 0.64 -71 28 ...
281 30076 295.97 -13.99 ... 7.3 ... ... 4 0.33 82 56 7 0.49 -23 34 ...
282 22972 295.99 -13.95 ... 7.55 ... ... 4 0.42 50 36 6 0.49 76 35 ...
283 194386 296.19 -14.78 ... 0.44 ... ... 10 0.76 -52 21 10 0.86 -59 15 ...
284 173114 296.33 -14.71 18.6 1.14 M* dM: 19 0.82 -63 22 ... ... ... ... ...
285 78272 296.07 -14.23 ... 5.09 M dM: ... ... ... ... 7 0.48 23 47 M
286 27278 296.08 -13.97 ... 7.19 M dM: ... ... ... ... 9 0.39 44 89 M
287 179183 295.98 -14.73 19.7 2.21 C* C ... ... ... ... 4 0.44 -53 32 C
289 64658 296.14 -14.16 ... 5.53 ... ... 4 0.42 1 47 5 0.42 46 60 ...
290 192177 296.33 -14.77 19.7 0.87 M C 4 0.43 -61 56 5 0.59 -51 20 C
291 74535 296.29 -14.21 ... 5.08 ... ... 3 0.26 -85 46 6 0.27 -62 47 ...
292 169202 296.25 -14.69 19.1 0.96 M C 5 0.57 -56 46 7 0.66 -54 15 C
293 159727 296.25 -14.65 ... 1.34 ... ... 3 0.5 -15 28 5 0.47 -57 33 ...
294 17384 296.22 -13.92 ... 7.51 ... ... ... ... ... ... 5 0.38 -5 42 ...
295 165127 296.23 -14.67 18.8 1.12 M C 6 0.76 -52 19 8 0.68 -59 20 C
296 171315 296.4 -14.7 ... 1.66 ... ... 5 0.5 -33 37 5 0.69 -66 14 ...
297 21034 296.25 -13.94 ... 7.36 M dK 4 0.45 70 43 7 0.65 -104 36 ...
298 194777 296.28 -14.78 19.0 0.42 C* Ce: 9 0.61 -72 37 9 0.72 -29 23 C
301 164620 296.22 -14.67 ... 1.14 ... ... 4 0.62 -101 29 6 0.63 -114 32 ...
302 182253 296.31 -14.74 ... 0.85 ... ... 5 0.58 -69 38 5 0.62 -33 25 ...
304 62395 296.37 -14.15 ... 5.68 M dM 6 0.46 -59 52 ... ... ... ... M
305 167938 296.26 -14.68 18.8 1.03 M* C 5 0.55 -67 41 7 0.82 -76 18 C
306 12243 296.36 -13.9 ... 7.81 M dM: 6 0.4 21 39 8 0.37 10 46 M
307 20479 296.33 -13.94 ... 7.43 M dK 8 0.4 -65 53 9 0.61 -26 43 ...
Continued on next page
MN
RA
S000
,1–20
(2015)

18G.P.Thom
psonet
al.
Appendix A1 (cont.): Individual fxcor returns for objects meeting the criteria (hght> 0.2, −200 km s−1 6Vhelio 6 +200 km s−1).
[1] [2] [3] [4] [5] [6] [7] [8] [9] [10] [11] [12] [13] [14] [15] [16] [17]
30 August 2011 31 August 2011
#Fibre ID RA Dec I−band distance phot. spec. SNR hght Vhelio Verr SNR hght Vhelio Verr Flag
(◦) (◦) (mag.) (kpc) class. class. (km s−1) (km s−1) (km s−1) (km s−1)
308 71601 296.34 -14.2 ... 5.26 ... ... 2 0.22 -35 84 4 0.33 -136 57 ...
309 72678 296.37 -14.2 ... 5.26 ... ... 4 0.27 -128 87 ... ... ... ... ...
311 61106 296.33 -14.14 ... 5.69 ... ... ... ... ... ... 5 0.38 81 77 ...
313 193220 296.29 -14.77 19.1 0.53 M Ce: 7 0.36 -86 87 5 0.46 10 32 C
314 198595 296.26 -14.79 19.7 0.22 M Ce: 15 0.7 -51 28 12 0.79 -46 24 C
316 162531 296.28 -14.66 ... 1.28 ... ... 3 0.35 -7 32 4 0.44 -26 38 ...
317 29959 296.4 -13.99 ... 7.09 M dM: 6 0.48 -11 35 9 0.51 -53 43 M
318 61790 296.46 -14.15 ... 5.9 ... ... 5 0.29 -66 53 6 0.51 -48 32 ...
319 32087 296.55 -14 ... 7.36 M dK 5 0.29 17 76 10 0.5 88 53 ...
320 183545 296.29 -14.74 ... 0.68 ... ... 9 0.58 -27 34 7 0.69 -43 28 ...
321 196632 296.25 -14.79 ... 0.16 ... ... 17 0.64 -56 46 14 0.72 -117 28 ...
322 188333 296.35 -14.76 18.6 1.05 M* C: 27 0.74 -17 39 12 0.84 -51 19 C
323 174472 296.34 -14.71 19.0 1.17 C* C 5 0.51 -57 34 7 0.57 -72 29 C
324 67487 296.49 -14.17 ... 5.78 M dM: 6 0.31 30 71 8 0.42 63 54 M
325 170941 296.29 -14.7 19.4 1 M* dK 14 0.64 -20 42 16 0.66 -47 32 ...
326 176863 296.35 -14.72 19.0 1.19 C* C 7 0.53 -37 27 6 0.51 -62 23 C
327 83584 296.46 -14.26 ... 5.03 M dM: 9 0.34 -18 83 15 0.59 37 34 M
328 187649 296.24 -14.75 18.7 0.41 M C: 9 0.66 -75 25 11 0.72 -46 18 C
330 167230 296.34 -14.68 20.0 1.33 C* C 4 0.49 -31 46 7 0.51 -123 41 C
332 35137 296.65 -14.02 ... 7.57 M dK: 5 0.29 -27 116 8 0.27 -76 105 ...
334 177839 296.25 -14.72 19.4 0.68 M C 8 0.63 0 27 9 0.65 -32 28 C
336 38421 296.71 -14.03 ... 7.68 M dK: ... ... ... ... 6 0.28 -23 34 ...
337 45220 296.77 -14.07 ... 7.68 ... ... ... ... ... ... 8 0.3 48 77 ...
338 164010 296.33 -14.67 19.1 1.39 M C 4 0.34 -100 66 7 0.6 -53 20 C
345 117821 296.71 -14.43 ... 5.06 ... ... 7 0.34 -40 72 ... ... ... ... ...
348 80533 296.85 -14.24 ... 7.03 ... ... 4 0.37 -26 67 ... ... ... ... ...
349 176619 296.23 -14.72 ... 0.7 ... ... 6 0.54 -62 34 9 0.65 -28 25 ...
351 98241 296.65 -14.33 ... 5.32 M dM 5 0.52 -138 30 10 0.41 -42 95 M
352 91537 296.61 -14.3 ... 5.35 ... ... 3 0.44 -107 46 ... ... ... ... ...
354 165802 296.41 -14.67 ... 1.81 ... ... 3 0.26 -12 82 6 0.53 -37 40 ...
355 82795 296.95 -14.25 ... 7.54 ... ... ... ... ... ... 7 0.28 -141 111 ...
357 84888 297 -14.26 ... 7.81 ... ... 3 0.31 -194 34 ... ... ... ... ...
358 123455 296.83 -14.46 ... 5.71 ... ... ... ... ... ... 5 0.42 -48 71 ...
359 127636 296.79 -14.49 ... 5.31 M dK: 4 0.29 -14 96 9 0.56 -15 53 ...
360 104563 296.96 -14.36 ... 7.07 ... ... 3 0.43 -197 49 ... ... ... ... ...
361 112177 296.82 -14.4 ... 5.94 M dM: 5 0.24 33 66 11 0.5 -4 75 M
362 81011 296.98 -14.24 ... 7.81 M dM ... ... ... ... 8 0.33 74 94 M
364 110475 297.01 -14.39 ... 7.28 ... ... 3 0.35 -5 90 5 0.4 9 64 ...
366 152918 296.81 -14.61 ... 5.06 M C: 4 0.24 82 99 9 0.58 14 26 ...
368 119903 296.79 -14.45 ... 5.54 ... ... ... ... ... ... 7 0.43 -33 85 ...
369 167631 296.51 -14.68 ... 2.49 ... ... 3 0.36 -12 22 ... ... ... ... ...
370 140011 296.8 -14.55 ... 5.16 M dM: 6 0.43 28 32 12 0.49 -9 41 M
371 117981 297.05 -14.44 ... 7.45 ... ... ... ... ... ... 8 0.4 -7 46 ...
372 117401 297.1 -14.43 ... 7.84 M dK: ... ... ... ... 6 0.3 57 57 ...
373 158905 296.83 -14.64 ... 5.09 ... ... 3 0.27 150 64 7 0.59 -22 28 ...
374 141439 296.83 -14.56 ... 5.4 ... ... 2 0.49 17 40 5 0.33 18 43 ...
375 130447 297.13 -14.5 ... 7.86 ... ... 2 0.27 163 55 5 0.34 11 40 ...
376 148616 296.85 -14.59 ... 5.43 M dK: ... ... ... ... 8 0.28 5 44 ...
377 152475 296.85 -14.61 ... 5.4 ... ... ... ... ... ... 10 0.26 -150 45 ...
378 124695 297.06 -14.47 ... 7.44 ... ... 5 0.24 110 93 9 0.43 75 45 ...
379 128222 297.02 -14.49 ... 7.06 M dM: 5 0.35 -40 36 9 0.25 -149 72 M
380 141960 297.05 -14.56 ... 7.05 ... ... 3 0.34 -178 53 ... ... ... ... ...
381 136987 297.06 -14.53 ... 7.21 ... ... 6 0.3 -11 59 7 0.23 22 47 ...
382 168122 296.87 -14.69 ... 5.35 ... ... ... ... ... ... 8 0.21 18 116 ...
383 146932 297.07 -14.58 ... 7.19 M dM: ... ... ... ... 8 0.4 39 43 M
Continued on next page
MN
RA
S000
,1–20
(2015)

Carbon
starrotation
inNGC
682219
Appendix A1 (cont.): Individual fxcor returns for objects meeting the criteria (hght> 0.2, −200 km s−1 6Vhelio 6 +200 km s−1).
[1] [2] [3] [4] [5] [6] [7] [8] [9] [10] [11] [12] [13] [14] [15] [16] [17]
30 August 2011 31 August 2011
#Fibre ID RA Dec I−band distance phot. spec. SNR hght Vhelio Verr SNR hght Vhelio Verr Flag
(◦) (◦) (mag.) (kpc) class. class. (km s−1) (km s−1) (km s−1) (km s−1)
384 165837 296.92 -14.67 ... 5.79 ... ... 3 0.27 -96 94 ... ... ... ... ...
388 157802 296.91 -14.64 ... 5.78 M dK: 11 0.34 7 51 ... ... ... ... ...
389 165036 297.1 -14.67 ... 7.28 ... ... ... ... ... ... 7 0.25 77 136 ...
390 155389 297.11 -14.62 ... 7.42 M dM: ... ... ... ... 14 0.27 -108 81 M
393 159040 297.1 -14.64 ... 7.3 ... ... ... ... ... ... 6 0.25 78 47 ...
394 165107 297.15 -14.67 ... 7.65 M dM: 4 0.29 -139 53 9 0.53 12 28 M
395 170606 296.9 -14.7 ... 5.56 ... ... ... ... ... ... 5 0.33 21 58 ...
398 204144 296.41 -14.81 19.0 1.42 Unid* C 11 0.73 -43 25 11 0.63 -50 32 C
399 174894 296.85 -14.71 ... 5.14 ... ... ... ... ... ... 10 0.64 4 43 ...
MN
RA
S000
,1–20
(2015)

20 G. P. Thompson et al.
This paper has been typeset from a TEX/LATEX file prepared by the author.
MNRAS 000, 1–20 (2015)