The - iariajournals.org · Rong Zhao, Detecon ... Gerard Damm, Alcatel-Lucent, France ... Yu Zheng,...
67
Transcript of The - iariajournals.org · Rong Zhao, Detecon ... Gerard Damm, Alcatel-Lucent, France ... Yu Zheng,...


The International Journal On Advances in Telecommunications is Published by IARIA.
ISSN: 1942-2601
journals site: http://www.iariajournals.org
contact: [email protected]
Responsibility for the contents rests upon the authors and not upon IARIA, nor on IARIA volunteers,
staff, or contractors.
IARIA is the owner of the publication and of editorial aspects. IARIA reserves the right to update the
content for quality improvements.
Abstracting is permitted with credit to the source. Libraries are permitted to photocopy or print,
providing the reference is mentioned and that the resulting material is made available at no cost.
Reference should mention:
International Journal On Advances in Telecommunications, issn 1942-2601
vol. 2, no. 1, year 2009, http://www.iariajournals.org/telecommunications/
The copyright for each included paper belongs to the authors. Republishing of same material, by authors
or persons or organizations, is not allowed. Reprint rights can be granted by IARIA or by the authors, and
must include proper reference.
Reference to an article in the journal is as follows:
<Author list>, “<Article title>”
International Journal On Advances in Telecommunications, issn 1942-2601
vol. 2, no. 1, year 2009,<start page>:<end page> , http://www.iariajournals.org/telecommunications/
IARIA journals are made available for free, proving the appropriate references are made when their
content is used.
Sponsored by IARIA
www.iaria.org
Copyright © 2009 IARIA

International Journal On Advances in Telecommunications
Volume 2, Number 1, 2009
Editor-in-Chief
Tulin Atmaca, IT/Telecom&Management SudParis, France
Editorial Advisory Board
Michael D. Logothetis, University of Patras, Greece
Jose Neuman De Souza, Federal University of Ceara, Brazil
Eugen Borcoci, University "Politehnica" of Bucharest (UPB), Romania
Reijo Savola, VTT, Finland
Haibin Liu, Aerospace Engineering Consultation Center-Beijing, China
Advanced Telecommunications
Tulin Atmaca, IT/Telecom&Management SudParis, France
Rui L.A. Aguiar, Universidade de Aveiro, Portugal
Eugen Borcoci, University "Politehnica" of Bucharest (UPB), Romania
Symeon Chatzinotas, University of Surrey, UK
Denis Collange, Orange-ftgroup, France
Todor Cooklev, Indiana-Purdue University - Fort Wayne, USA
Jose Neuman De Souza, Federal University of Ceara, Brazil
Sorin Georgescu, Ericsson Research, Canada
Paul J. Geraci, Technology Survey Group, USA
Christos Grecos, University if Central Lancashire-Preston, UK
Manish Jain, Microsoft Research – Redmond
Michael D. Logothetis, University of Patras, Greece
Natarajan Meghanathan, Jackson State University, USA
Masaya Okada, ATR Knowledge Science Laboratories - Kyoto, Japan
Jacques Palicot, SUPELEC- Rennes, France
Maciej Piechowiak, Kazimierz Wielki University - Bydgoszcz, Poland
Dusan Radovic, TES Electronic Solutions - Stuttgart, Germany
Matthew Roughan, University of Adelaide, Australia
Sergei Semenov, Nokia Corporation, Finland
Carlos Becker Westphal, Federal University of Santa Catarina, Brazil
Rong Zhao, Detecon International GmbH - Bonn, Germany
Piotr Zwierzykowski, Poznan University of Technology, Poland
Digital Telecommunications
Bilal Al Momani, Cisco Systems, Ireland

Tulin Atmaca, IT/Telecom&Management SudParis, France
Claus Bauer, Dolby Systems, USA
Claude Chaudet, ENST, France
Gerard Damm, Alcatel-Lucent, France
Michael Grottke, Universitat Erlangen-Nurnberg, Germany
Yuri Ivanov, Movidia Ltd. – Dublin, Ireland
Ousmane Kone, UPPA - University of Bordeaux, France
Wen-hsing Lai, National Kaohsiung First University of Science and Technology, Taiwan
Pascal Lorenz, University of Haute Alsace, France
Jan Lucenius, Helsinki University of Technology, Finland
Dario Maggiorini, University of Milano, Italy
Pubudu Pathirana, Deakin University, Australia
Mei-Ling Shyu, University of Miami, USA
Communication Theory, QoS and Reliability
Eugen Borcoci, University "Politehnica" of Bucharest (UPB), Romania
Piotr Cholda, AGH University of Science and Technology - Krakow, Poland
Michel Diaz, LAAS, France
Ivan Gojmerac, Telecommunications Research Center Vienna (FTW), Austria
Patrick Gratz, University of Luxembourg, Luxembourg
Axel Kupper, Ludwig Maximilians University Munich, Germany
Michael Menth, University of Wuerzburg, Germany
Gianluca Reali, University of Perugia, Italy
Joel Rodriques, University of Beira Interior, Portugal
Zary Segall, University of Maryland, USA
Wireless and Mobile Communications
Tommi Aihkisalo, VTT Technical Research Center of Finland - Oulu, Finland
Zhiquan Bai, Shandong University - Jinan, P. R. China
David Boyle, University of Limerick, Ireland
Bezalel Gavish, Southern Methodist University - Dallas, USA
Xiang Gui, Massey University-Palmerston North, New Zealand
David Lozano, Telefonica Investigacion y Desarrollo (R&D), Spain
D. Manivannan (Mani), University of Kentucky - Lexington, USA
Himanshukumar Soni, G H Patel College of Engineering & Technology, India
Radu Stoleru, Texas A&M University, USA
Jose Villalon, University of Castilla La Mancha, Spain
Natalija Vlajic, York University, Canada
Xinbing Wang, Shanghai Jiaotong University, China
Ossama Younis, Telcordia Technologies, USA
Systems and Network Communications

Fernando Boronat, Integrated Management Coastal Research Institute, Spain
Anne-Marie Bosneag, Ericsson Ireland Research Centre, Ireland
Huaqun Guo, Institute for Infocomm Research, A*STAR, Singapore
Jong-Hyouk Lee, Sungkyunkwan University, Korea
Elizabeth I. Leonard, Naval Research Laboratory – Washington DC, USA
Sjouke Mauw, University of Luxembourg, Luxembourg
Reijo Savola, VTT, Finland
Multimedia
Dumitru Dan Burdescu, University of Craiova, Romania
Noel Crespi, Institut TELECOM SudParis-Evry, France
Mislav Grgic, University of Zagreb, Croatia
Atsushi Koike, KDDI R&D Labs, Japan
Polychronis Koutsakis, McMaster University, Canada
Chung-Sheng Li, IBM Thomas J. Watson Research Center, USA
Artur R. Lugmayr, Tampere University of Technology, Finland
Parag S. Mogre, Technische Universitat Darmstadt, Germany
Chong Wah Ngo, University of Hong Kong, Hong Kong
Justin Zhan, Carnegie Mellon University, USA
Yu Zheng, Microsoft Research Asia - Beijing, China
Space Communications
Emmanuel Chaput, IRIT-CNRS, France
Alban Duverdier, CNES (French Space Agency) Paris, France
Istvan Frigyes, Budapest University of Technology and Economics, Hungary
Michael Hadjitheodosiou ITT AES & University of Maryland, USA
Mark A Johnson, The Aerospace Corporation, USA
Massimiliano Laddomada, Texas A&M University-Texarkana, USA
Haibin Liu, Aerospace Engineering Consultation Center-Beijing, China
Elena-Simona Lohan, Tampere University of Technology, Finland
Gerard Parr, University of Ulster-Coleraine, UK
Cathryn Peoples, University of Ulster-Coleraine, UK
Michael Sauer, Corning Incorporated/Corning R&D division, USA

International Journal On Advances in Telecommunications
Volume 2, Number 1, 2009
Foreword
The first 2009 number of the International Journal On Advances in Telecommunications compiles a set
of papers with major enhancements based on previously awarded publications. It brings together a set
of articles that share a common link to telecommunications. For this issue, five contributions have been
selected.
The first article by Rong Zhao et al. presents an enhancement of optical broadband networks design with
biconnectivity. A series of strategic decisions are shown in order to efficiently generate new networks
making use of existing infrastructure.
The second article touches on the subject of overlay topology. Serban Obreja and Eugen Borcoci address
the issue of finding inter-domain routes under QoS constraints.
An online mobility simulation is presented by Anders Nickelsen and Hans-Peter Schwefel in the third
article. Emulating wireless multi-hop technologies is required as a real setup is subject to a multitude of
variables which can contaminate end results.
As proposed by Kazumasa Takami et al., the user’s state of mind can be evaluated from emoticons used
in mobile phone emails. In turn, this can create a profile which benefits the selection of customized
content delivery. As a self-assessment, the conclusions based on emoticons are used to select a relevant
piece of music, which arguable is also tied to the emotional state of the user.
Last but not least, Jaroslav Kral and Michal Zemlicka present a system of development patterns catered
to service-oriented software (SOA). As there are several approaches to SOA, the appropriate one must
be selected on a case by case basis.
We hope that the contents of this journal will add to your understanding of telecommunications, and
that you will be inspired to contribute to IARIA’s conferences that include topics relevant to this journal.
Tulin Atmaca, Editor-in-Chief
Petre Dini, IARIA Advisory Committees Board Chair

International Journal On Advances in Telecommunications
Volume 2, Number 1, 2009
CONTENTS
Enhanced Survivable Topology Redesign of Optical Broadband Networks with
Biconnectivity
Rong Zhao, Detecon International GmbH, Germany
Christian Minge, Dimension Data Germany AG&Co.KG, Germany
Mathias Schweigel, Detecon International GmbH, Germany
1 - 15
Finding Inter-domain QoS Enabled Routes Using an Overlay Topology Approach
Serban Gerogica Obreja, University POLITEHNICA Bucharest, Romania
Eugen Borcoci, , University POLITEHNICA Bucharest, Romania
16 - 26
Emulation of Wireless Multi-Hop Topologies with Online Mobility Simulation
Anders Nickelsen, Aalborg University, Denmark
Hans-Peter Schwefel, Aalborg University, Denmark
27 - 36
Deducing a User’s State of Mind from Analysis of the Pictographic Characters and
Emoticons used in Mobile Phone Emails for Personal Content Delivery Services
Kazumasa Takami, Soka University, Japan
Ryo Yamashita, Soka University, Japan
Kenji Tani, Soka University, Japan
Yoshikazu Honma, Soka University, Japan
Shinichiro Goto, Soka University, Japan
37 - 46
System of Development Patterns in Service-Oriented Software
Jaroslav Král, Charles University, Czech Republic
Michal Žemlička, Charles University, Czech Republic
47 - 59

Enhanced Survivable Topology Redesign of Optical Broadband Networks withBiconnectivity
Rong ZhaoDetecon International GmbH
53227 Bonn, Germany
Christian MingeDimension Data Germany AG&Co.KG
61440 Oberursel, Germany
Mathias SchweigelDetecon International GmbH
01187 Dresden, Germany
Abstract
This paper presents an efficient strategy for the optimalnetwork redesign with a biconnectivity-oriented topology(both edge and vertex biconnected). It helps re-designingexisting networks or generating new networks consider-ing practically relevant constraints (such as leased lineswith long running contracts to remain, maximum numberof ports per device) typically found in these phases. Theproposed strategy is composed of Reduction, Augmentation,and Fine-Tuning Reduction. Empirical tests using severalIP network topologies showed the robustness and applica-bility of the method. Its application to other optical back-bone (or access) network redesign problems is possible.
Keywords - Optical Networks, Redesign, BroadbandNetworks, Survivability, Biconnectivity
1 Introduction
When designing/redesigning telecommunications net-works, we have to face up to two opposing objectives:high survivability and low costs. The former leads to afully meshed topology (expensive and highly redundant),whereas the latter results in a minimum spanning tree topol-ogy (cheap with no redundancy). The main idea of thisapproach is to redesign a network by retaining essentialnetwork links (reduce network migration costs), improvingtheir utilization (but not to overload), and ensuring networksurvivability. If necessary, only a few links are allowed tobe added into networks subject to minimum costs. Simul-taneously, some constraints are considered, such as routing,maximal hop number, and node degree. A part of this workwas presented at AICT2008 conference [1].
Some prior approaches addressed the topological de-sign for backbone networks by [2][3][4][5][6] and accessnetworks by [7][8][9][10][11]. Generally, network struc-tures are illustrated by hierarchical star-star, tree-star, or
mesh-star topology. Most of these optimization problemsare NP-hard [12]. Due to the complexity of the tasks dif-ferent methodologies were investigated, such as the linearprogramming, Simulated Annealing(SA), Tabu search(TS),Genetic Algorithms(GA). A detailed formulation for gen-eral network design problems with connectivity require-ments was introduced in [13][14]. Furthermore, the net-work redesign is discussed in [15][16].
IP networks reportedly suffer from node failures as fre-quently as from link failures [17]. To avoid service degra-dation (and related penalties) the design of reliable com-munication networks is a significant problem for networkproviders. The general planning problem is finding the bestpositions of components and their links subject to minimalcosts and a high reliability [18]. An essential summary ofapproaches to different reliability problems, such as con-strained reliability measures and reliability optimization, isprovided in [19]. A general definition of reliability of net-work components is the probability that the network is func-tioning [20]. In comparison with reliability, survivabilityis to describe the resilient ability of networks when one ormore network components fails. More precisely, the surviv-ability analysis is to make a conservative assumption of fail-ures and study how to prevent them. Typical network sur-vivability techniques are based on well designed networksand network restoration [21][22], e.g. link restoration orlink/node protection.
A possible solution for the above mentioned design prob-lem is a two-connected topology that can be described bymeans of graph theory. Graph connectivity properties aremeaningful for transport network designs. In order to sur-vive all single edge failures, a graph must be at least two-edge connected. Furthermore, it has been shown that ev-ery two-vertex connected graph is also two-edge connected,while the reverse is not valid [23]. In this work a redesignednetwork has to be at least two-vertex connected. In the fol-lowing we characterize the two-vertex connected graph asbiconnected graph.
The proposed strategy for network topology redesign to
1
International Journal On Advances in Telecommunications, vol 2 no 1, year 2009, http://www.iariajournals.org/telecommunications/

improve network reliability and to find out a cost-effectivestructure is composed of three parts: Reduction, Augmen-tation and Fine-Tuning Reduction. An approximation algo-rithm for the Augmentation problem was introduced in 1981in [24]. In 1993 another heuristic for the same problem withbetter time complexity was proposed in [25]. Later, this ap-proach has been improved [26] and it has been solved byapplying a Genetic Algorithm [27]. In [28] Hackbarth etal. introduced a heuristic that covered the whole problem oftelecommunications network design from a totally meshednetwork to a two-edge connected topology solving the Re-duction and Augmentation problem. This contribution ex-tended their approach:
• The problem is extended to a two-vertex connectedtopology;
• An additional step is proposed to remove redundantedges through (Fine-Tuning Reduction) for the finalsolution set;
• Time complexity and efficiency of the Augmenta-tion are improved by applying a modified Depth FirstSearch (DFS)[29] and classifying the candidate edgesbefore Augmentation;
• Links are classified for efficient manipulation of theoptimization considering practically relevant networkoptimization constraints.
The paper is organized as follows: firstly, it provides amathematical formulation of the considered problem anda discussion of the related work. In terms of biconnectiv-ity, several relevant concepts of graph theory are introducedand analyzed. Next, a detailed description of the algorithmis given. Furthermore, the efficiency of algorithm by meansof the presentation of optimization results of AT&T back-bone network and G-WiN network is shown. Finally, someparameters of the redesign algorithm are analyzed.
2 Problem Statement
2.1 Objective Function
The existing telecommunications network can be de-scribed as an undirected Graph G(V, E, W ) with node v ∈V , edge e ∈ E and weight w ∈ W . The weight W is aproblem-specific parameter. In this approach the weight ofedges is not the same for all calculation steps. For calculat-ing network costs, it is based on bandwidth and length. Butfor other redesign steps, different functions are defined torepresent the weight of an edge. This will be discussed indetail by the introduction of the redesign procedure.
The objective is to minimize total network costs by re-designing the network structure. Some links can be re-moved or added to the network considering the given con-straints at all the time. All network nodes are fixed withoutany change and their costs are ignored in this work. Theobjective function is defined as:
Cnet =∑
e∈E
xece (1)
where e is an edge in E; xe is a binary variable to check ifedge e is accepted or not. ce is the leasing cost of edge e,see Eq.2.
ce = f(le, μe) + Ce,k (2)
where f(le, μe) is the leasing cost function of edge (opticalcable) e depending on edge length le and bandwidth (i.e.capacity) μe. Ce,k is the fixed cost for different edge (link)types k in terms of bandwidth μe. A practical example willbe introduced in the section IV.
2.2 Constraints
A packet transmitted over an asynchronous, time–multiplexed, packet switched network (like IP networks)undergoes a queuing and serialization delay at theend/beginning of a link (router entrance/exit respectively)which depends on the link utilization [30][31]. Mean packetdelay depends on the traffic rate λe and capacities of linksμe, i.e. utilization ρe = λe/μe. In this work the maximumlink utilization is taken as the first constraint. Therefore,we firstly study the relationship between link utilization anddelay. A number of systems models have been proposedto describe different characterized IP networks in the lastyears. Here each edge is modeled as an independent M/M/1queuing system [32]. To apply this queueing model in thiswork, the following assumptions are used: 1) each queuehas an exponentially distributed mean service time; 2) anaverage arrival rate of new packets, which follows a Poissondistribution; 3) the packet length is also exponentially dis-tributed; 4) the network structure should have a fixed rout-ing, where the channels are error-free, etc. If mean packetlength is E[lP ], mean packet delay is derived as Eq.3.
tM/M/1 =E[lP ]μe
· 11 − ρe
(3)
If ρe increases, mean packet delay will be incremented,too. The maximum link utilization allows us to keep theexpected delay low.
The second constraint in this approach is the maximumhop number between source and destination, which influ-ences delay, reliability and survivability of networks. Thehop number is given as number of links one packet has topass on its way from the source to the destination node. A
2
International Journal On Advances in Telecommunications, vol 2 no 1, year 2009, http://www.iariajournals.org/telecommunications/

network solution is only valid, if the maximum hop numberis not exceeded by any relevant source-destination combi-nation. Thus, by limiting the maximum number of usededges per routed path an additional indirect constraint fora low end-to-end delay is given. Generally, every link hasa certain reliability. By limiting the maximum hop numberalso the end-to-end reliability is manipulated, because alongone path the single link reliabilities affect the total end-to-end reliability. Moreover, too high hop number makes itdifficult to apply some routing protocols, such as Distance-vector Routing Protocol. The actual propagation delay onthe edges is not directly incorporated in the optimization al-gorithm, which can be studied as further work.
In addition, the proposed algorithm also takes into ac-count the maximum node degree (maximum number of linkswhich are connected to a node). For some network planningtasks the maximum node degree was a limiting requirementin [8][33][34].
Furthermore, network survivability should be fulfilledduring the redesign. The link restoration assumes single,total failures of individual links and restores the entire (orpartial) capacity of the failed link on one or several pathsbetween two end nodes of the link [6]. In this work theedge/node-biconnectivity is applied to protect single link ornode failures during the network redesign.
3 Graph Analysis
3.1 Node/Edge-Connectivity
A graph is connected, if there exists at least one pathfrom any point to any other point in the graph; otherwisethe graph is called disconnected. The edge (or node) con-nectivity of a graph G is the minimum number of edge (ornode) deletions sufficient to disconnect G, which is char-acterized by Menger’s theorem [35]. In view of the dis-joint paths, an undirected graph G = (V, E) is defined ask-edge-connected, if there are k paths between two nodesv, v′ ∈ V and these paths do not share any edge. If thesepaths do not have node between v and v ′ in common, graphG is defined as k-node-connected. Two connected graphsare shown in Fig.1, where the left tree-topology is a 1-edge/node-connected graph (or edge/node-connected) andthe right mesh-topology is 3-edge/node-connected. Theterm mesh does not imply that the network topology is afull mesh, but rather that the network is at least two (edge)connected [36][23]. Therefore, the mesh structure has ahigher survivability than the tree structure in telecommuni-cations networks, but is more expensive due to additionaledges. There is a close relationship between edge- andnode-connectivity. The node connectivity is never smallerthan the edge connectivity, since deleting one node inci-dent on each edge in a cut set succeeds in disconnecting
the graph [37][38].
Figure 1. Connected graph: tree and mesh
3.2 Biconnectivity
A graph is called two-edge connected (edge-biconnected), if there are at least two edge-disjointpaths between every pair of nodes. Similarly, a graph iscalled two-node connected (node-biconnected), if there areat least two node-disjoint paths between each pair of nodes.An example is shown in Fig.2. Every node-biconnectivitygraph is also edge-biconnectivity, while the reverse is notvalid [23]. A biconnected topology can effectively ensurethe network survivability. If an efficient method is appliedto change a graph from one-connectivity to biconnectivity,the network cost will not be significantly incremented. Forinstance, adding only a few necessary links can make atree topology biconnected. Hence, this work addresses thenode-biconnectivity to improve the network survivability,where two node-disjoint paths can be available for theflows between source and destination.
Figure 2. Two-node/edge-connected topology
3.3 Block Structure and Articulation
The articulation of a connected graph is a node whoseremoval will disconnect the graph [39]. Fig.3 shows twographs with articulation nodes, which are depicted withgray color. The right graph represents a graph with 1-node-connectivity, but 3-edge-connectivity for more thantwo edge-disjoint paths for any pair of nodes.
3
International Journal On Advances in Telecommunications, vol 2 no 1, year 2009, http://www.iariajournals.org/telecommunications/
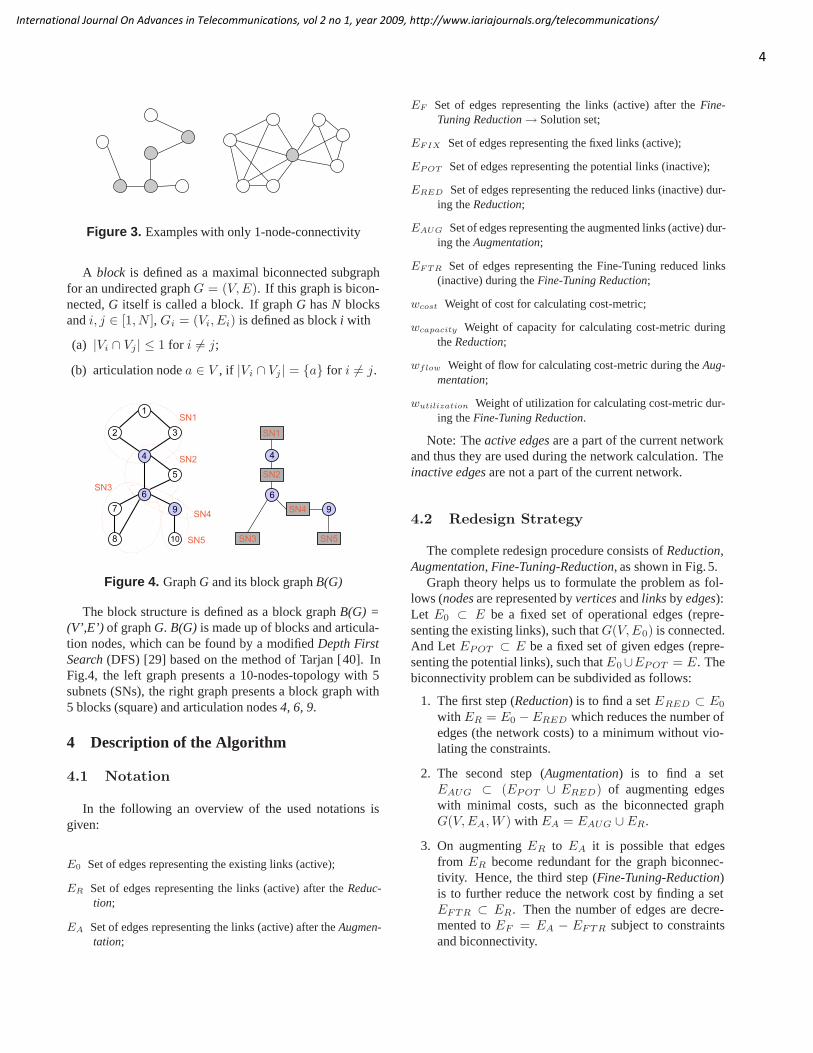
Figure 3. Examples with only 1-node-connectivity
A block is defined as a maximal biconnected subgraphfor an undirected graph G = (V, E). If this graph is bicon-nected, G itself is called a block. If graph G has N blocksand i, j ∈ [1, N ], Gi = (Vi, Ei) is defined as block i with
(a) |Vi ∩ Vj | ≤ 1 for i �= j;
(b) articulation node a ∈ V , if |Vi ∩ Vj | = {a} for i �= j.
Figure 4. Graph G and its block graph B(G)
The block structure is defined as a block graph B(G) =(V’,E’) of graph G. B(G) is made up of blocks and articula-tion nodes, which can be found by a modified Depth FirstSearch (DFS) [29] based on the method of Tarjan [40]. InFig.4, the left graph presents a 10-nodes-topology with 5subnets (SNs), the right graph presents a block graph with5 blocks (square) and articulation nodes 4, 6, 9.
4 Description of the Algorithm
4.1 Notation
In the following an overview of the used notations isgiven:
E0 Set of edges representing the existing links (active);
ER Set of edges representing the links (active) after the Reduc-tion;
EA Set of edges representing the links (active) after the Augmen-tation;
EF Set of edges representing the links (active) after the Fine-Tuning Reduction → Solution set;
EF IX Set of edges representing the fixed links (active);
EPOT Set of edges representing the potential links (inactive);
ERED Set of edges representing the reduced links (inactive) dur-ing the Reduction;
EAUG Set of edges representing the augmented links (active) dur-ing the Augmentation;
EF TR Set of edges representing the Fine-Tuning reduced links(inactive) during the Fine-Tuning Reduction;
wcost Weight of cost for calculating cost-metric;
wcapacity Weight of capacity for calculating cost-metric duringthe Reduction;
wflow Weight of flow for calculating cost-metric during the Aug-mentation;
wutilization Weight of utilization for calculating cost-metric dur-ing the Fine-Tuning Reduction.
Note: The active edges are a part of the current networkand thus they are used during the network calculation. Theinactive edges are not a part of the current network.
4.2 Redesign Strategy
The complete redesign procedure consists of Reduction,Augmentation, Fine-Tuning-Reduction, as shown in Fig. 5.
Graph theory helps us to formulate the problem as fol-lows (nodes are represented by vertices and links by edges):Let E0 ⊂ E be a fixed set of operational edges (repre-senting the existing links), such that G(V, E0) is connected.And Let EPOT ⊂ E be a fixed set of given edges (repre-senting the potential links), such that E0∪EPOT = E. Thebiconnectivity problem can be subdivided as follows:
1. The first step (Reduction) is to find a set ERED ⊂ E0
with ER = E0 − ERED which reduces the number ofedges (the network costs) to a minimum without vio-lating the constraints.
2. The second step (Augmentation) is to find a setEAUG ⊂ (EPOT ∪ ERED) of augmenting edgeswith minimal costs, such as the biconnected graphG(V, EA, W ) with EA = EAUG ∪ ER.
3. On augmenting ER to EA it is possible that edgesfrom ER become redundant for the graph biconnec-tivity. Hence, the third step (Fine-Tuning-Reduction)is to further reduce the network cost by finding a setEFTR ⊂ ER. Then the number of edges are decre-mented to EF = EA − EFTR subject to constraintsand biconnectivity.
4
International Journal On Advances in Telecommunications, vol 2 no 1, year 2009, http://www.iariajournals.org/telecommunications/

Figure 5. Flow chart of the redesign strategy
It is assumed that the network consisting of initial links (E0)and potential links (EPOT ) must fulfill the constraints andguarantee the biconnectivity.
The advantage of our edge redesign is that the historyof the network and the experience of the network planneris taken into consideration because Reduction bases on theset of edges E0 which represents the real existing links.Moreover, we introduce another possibility to further in-fluence the direction of optimization by implementing theset EFIX ⊂ E0. Edges of the set EFIX are not allowedto be reduced by the algorithm and hence they constitute adefinitive part of the solution set EF . EFIX makes it possi-ble to consider practical relevant situation, e.g. a long termof a leased line link. (Note that real existing links as wellas potential links can be assigned to the set EFIX at thebeginning of the optimization.)
4.3 Reduction
Suppose E0 is the set of edges in a graph G. The objec-tive of the Reduction is to find a set ERED that decreasesthe set of edges E0 to a minimum ER (ER, ERED ⊂ E0
and ER ∪ ERED = E0) such that ER is a graph with min-
imal number of edges (costs) still fulfilling the constraints(maxHop, maxUtil, maxNodeDegree). Ideally, this graphis a minimal spanning tree. Any edge e ∈ E0 is evaluatedby a cost metric MetricRED
e with normalized cost ce andbandwidth μe:
MetricREDe =
wcost · min{ce,e∈E0}ce
+wcapacity · μe
max{μe,e∈E0}(4)
with constraints:
wcapacity + wcost = 1
0 ≤ wcapacity ≤ 10 ≤ wcost ≤ 1
0 < MetricREDe ≤ 1
The normalized values are used to efficiently representthe cost metric. The cost and capacity weights influence theevaluation of the cost metric. We assumed a cost functionfor the links, which is derived and estimated from basis net-work rate for leased lines of the Deutsche Telekom (2004)[41]. Depending on the link capacity and length, the costsconsist of a base rate and a piecewise linear increasing costfunction (CU: Cost Unit), as shown in Fig. 6. In a sense,the leasing cost of 10 Gbit/s is less than the leasing cost of2.5 Gbit/s multiplied by 4. Therefore, the edges with highcost (long optical cable) and low capacity will be preferablyremoved. The smaller MetricRED
e is, the earlier the edge eis reduced. During the Reduction the constraints have to befulfilled, such as capacity, utilization, etc.
Figure 6. Cost function for calculation of leased linelink cost per year in terms of link capacity and linklength
We suppose that all demands are routed, and the edgeloads, edge utilizations are calculated. The Reduction algo-rithm can then be described as follows:
5
International Journal On Advances in Telecommunications, vol 2 no 1, year 2009, http://www.iariajournals.org/telecommunications/

1. The edge weights composed of a weighted standard-ized sum of real edge cost and load, are calculated forall edges of E0.
2. On basis of the edge weights one edge is selected andtemporarily added to the set ERED: Thus, the selectededge is deactivated.
3. The demands are rerouted and then edge loads andedge utilizations are calculated considering all edgesbelonging to the sets E0 and ER.
4. If all constraints are fulfilled, the selected edge isreduced, which means it is finally added to the setERED. If a constraint is not fulfilled, the selected edgeis marked as required, which means it is added to theset ER.
5. The algorithm recalculates the edge weights and se-lects the next edge.
This process is repeated until all edges from E0 are trans-ferred to the sets ERED or ER. The program flow chart(PFC) of the Reduction is depicted in Fig. 7.
Figure 7. Program flow chart of the Reduction
Note that the Reduction algorithm solution depends onthe sequence of selected edges. Hence, a unique branch ofthe complete combinatorial solution tree is calculated.
4.4 Augmentation
The objective of the Augmentation is to find out a setEAUG from sets ERED and EPOT so that the graph G
Figure 8. Program flow chart of the Augmentation
with the edges EA = ER ∪ EAUG between vertices is bi-connected. In Fig. 8 the PFC of the Augmentation is de-picted. At first the graph is analyzed by means of the modi-fied Depth First Search (DFS) mentioned in the last section.The DFS finds all articulation points of G, marks them, andsplits the graph into its biconnected components (subnets).If the graph is biconnected without any articulation point),the Augmentation will be stopped, otherwise the next Aug-mentation step is done.
Figure 9. Augmentation network example: DFSmarks articulation points and divides network intosubnets: In black are the edges of the set ER and ingray (dashed lines) are the edges depicted of the setsERED and EPOT (potential candidates for the Aug-mentation). The three articulation points are markedwith a dark color and the different subnets are sur-rounded by dashed lines.
Figure 9 shows an example of a not biconnected graphafter the DFS. Next, we classify the potential candidateedges in a way that only edges between vertices of different
6
International Journal On Advances in Telecommunications, vol 2 no 1, year 2009, http://www.iariajournals.org/telecommunications/

Figure 10. Augmentation network example: Classi-fication of the potential candidate edges (EPOT andERED) depending on source and destination vertex
subnets are accepted as candidates for the Augmentation,while no vertex is an articulation point (Inter-Subnet). InFigure 10, the edge classification is shown for our networkexample. Due to the classification Intra-Subnet edges like{2,3} or {1,4} are not considered. Furthermore, we disre-gard Intra-Articulation edges like {4,9}, since their intro-duction would not improve the network situation regardingto the Augmentation problem. As a rule, we do not consideredges between different subnets, if one vertex is an articula-tion point (Inter-Subnet-Articulation), e.g. {7,9} or {10,6},because in comparison with the Inter-Subnet edges they areonly the second best option. Only in case that the graphis not biconnected, and no Inter-Subnet edge is left, theseedges are accepted.
After that, a special cost metric MetricAUGe is used to
evaluate edge e subject to edge cost, subnet flow and nodedegree:
MetricAUGe =
wcost · min{ce,e∈(EPOT ∪ERED)}(dv + dv′) · ce
+wflow · fsn−sn
e
(dv + dv′) · max{fsn−sne,e∈(EPOT ∪ERED)}
(5)
with constraints:
wflow + wcost = 1
0 ≤ wflow ≤ 10 ≤ wcost ≤ 1
0 < MetricAUGe ≤ 0.5
where v and v′ are end nodes of edge e between twoblocks (unbiconnected subnets). dv and dv′ are node de-grees of v and v′, respectively. f sn−sn
e is the flow overedge e between two subnets. min{ce,e∈(EPOT ∪ERED)} andmax{fsn−sn
e,e∈(EPOT ∪ERED)} present the minimal cost metric
and maximal flow for e ∈ (EPOT ∪ ERED)}. The exist-ing network topology is connected so that dv and dv′ areno less than 1. Hence, MetricAUG
e is between 0 and 0.5.Edges are preferably introduced when they are not costly,highly loaded (due to a high subnet-subnet-flow) and wherethe average degree of source and destination vertex is small.More precisely, the edges with a high cost metric preferablyadded.
Regularly for each edge a single routing has to be donewhere all other candidates are deactivated. Due to the timecomplexity of calculating the edge loads, an estimator isused. Therefore, all candidates are temporarily added toEAUG. Then a routing of the demands and a load calcula-tion is done considering the edges of EAUG and ER. On ba-sis of the weights, one edge is selected and then definitivelyadded to the set EAUG, the remaining temporarily addededges are retransferred to their former sets. The describedprocedure is repeated until the DFS algorithm confirms bi-connectivity of the graph.
4.5 Fine-Tuning Reduction
Figure 11. Fine-Tuning Reduction example: a)shows graph after Reduction b) shows that due to theAugmentation one edge from ER becomes mathemat-ically redundant for the biconnectivity of the graph
On augmenting ER to EA it is possible that edges fromER become redundant for the graph biconnectivity of E A.The example in Fig. 11 shows a graph, where ER hasthe shape of a tree structure (Fig. 11a). The Augmenta-tion added the minimal number of two edges {1,3}, {1,4}.Hence, EA is biconnected. From the viewpoint of graphtheory, the graph would still be biconnected, if we dis-card the edge {1,2} of the former tree structure (Fig. 11b).Thus, objective of the Fine-Tuning Reduction is to find aset EFTR ⊂ ER that reduces the number of edges toEF = EA − EFTR with a minimum total cost, consider-ing constraints and graph biconnectivity at any time. How-ever, we only consider edges of the set ER as candidatesfor the Fine-Tuning Reduction, because if the Augmenta-tion performs well hardly edges from EAUG will become
7
International Journal On Advances in Telecommunications, vol 2 no 1, year 2009, http://www.iariajournals.org/telecommunications/

redundant.The PFC of the Fine-Tuning Reduction is in general the
same as the PFC of the Reduction (Fig.7). At the begin-ning we have a set of edges EA. At each loop one edgeout of the former set ER is selected and temporarily addedto the set EFTR. Then this edge is deactivated. Then thenetwork is calculated, such as routing of the demands, cal-culation of edge loads and edge utilizations. After that, theselected edge is either definitely assigned to the set EF , ifa constraint is not fulfilled or the remaining graph is not bi-connected. Or it is assigned to the set EFTR, if the graphis still valid. This procedure is repeated until all edges ofthe former set ER have been tested. The sequence of testededges is defined by the edge weights, which are recalculatedin every cycle. The cost metric MetricFTR
e is composed ofa weighted, standardized sum of edge leasing cost ce andedge utilization ρe in Eq.6. The edges with a low cost met-ric will be firstly considered to be reduced.
MetricFTRe =
wcost · min{ce,e∈ER}ce
+wutilization · ρe
max{ρe,e∈ER}(6)
with constraints:
wcost + wutilization = 1
0 ≤ wcost ≤ 10 ≤ wutilization ≤ 1
0 < MetricFTRe ≤ 1
4.6 Random Selection
To avoid trapping into local optima, a random pro-cess is applied to determine which edges are removed oradded. In addition, we assume pThresRED, pThresAUG,pThresFTR as potential thresholds for Reduction, Aug-mentation and Fine-Tuning-Reduction to efficiently limitthe search space. The random selection is described as fol-lowing:
1. Evaluate cost metrics for all candidate edges and sortmetrics from the minimal metric (Min Metric) to themaximal metric (Max Metric);
2. Find all edges with metric ≥ Min Metric(1 +pThresRED) for Reduction, or all edges with met-ric ≤ Min Metric(1 − pThresAUG) for Augmen-tation, or all edges with metric ≥ Min Metric(1 +pThresFTR) for Fine-Tuning-Reduction;
3. Select one edge by means of a uniformly distributedrandom number.
5 Results and Analysis
5.1 Redesign Environment
The algorithm is implemented in C++ and applied usinga commercial network planning tool - NetWorks [42], de-signed for optimizing large scale telecommunications andIP networks. We studied the practical behavior of the algo-rithm on a set of real network examples. Two test networkswill be introduced in this section. The optimization envi-ronment is based on a standard PC (Pentium III with 800MHz and 384 Mbyte RAM). Each scenario with differentparameters has been tested for at least 10 times.
We estimated demands between the nodes by applyingthe gravity coefficient method [43]. Therefore, for each pairof nodes the demands were calculated in direct proportionto the population of the corresponding area, and in indi-rect proportion to the distance between the individual nodes.Furthermore, the edge cost is derived from the leasing lines,see Fig. 6 and Eq. 2.
The information on the following networks has beencollected from public sources. Since the traffic matriceshaven’t been available, the previously mentioned gravitymodel was used to generate one. This means that the fol-lowing results are not absolutely applicable to the studiednetworks. But this is not the intention of the study. Theidea is to show the application of the algorithm using reallife topologies.
5.2 Test Network I: G-WiN
G–WiN was a part of Germany Research Education Net-works by DFN-Association [44], which connects 42 corenodes by 75 links at two levels. The bandwidth of linksranges from 622 Mbit/s to 10 Gbit/s. In this approach wefocus on the 10 core nodes (level 1) and their connecting21 links (see Fig. 12). The potential edges are assumed tohave a capacity of 2.5 Gbit/s. Furthermore, the maximaledge utilization is 99.9999% without limit of maximal hopnumber and node degree.
Fig. 12 shows the original links used for G–WiN. As re-sult of the redesign redundant and high capacity (expensive)edges are successfully removed in Fig. 13. During the re-design all constraints have to be fulfilled.
More details are presented in the Tab. 1. The cost andnumber of links are significantly reduced. Mean edge uti-lization is increased, which should be taken into account.However, the original average link utilization was low. Af-ter the redesign the maximum utilization value is decreased.Hence, this increment of the edge utilization has no remark-able influence on the redesigned G–WiN. The reduced nodedegree can save the ports of core nodes.
8
International Journal On Advances in Telecommunications, vol 2 no 1, year 2009, http://www.iariajournals.org/telecommunications/

Figure 12. Original G–WiN (level 1)
Table 1. Optimization results of G–WiNG–WiN Original AverageCost in cost unit (CU) 1 402 247.49 671 915.49Number of edges 21 13Mean edge utilization 17.5% 41%Max. edge utilization 97% 93%Mean hop number 1.64 2.29Max. hop number 3 5Mean node degree 4.2 2.6Max. node degree 6 4
5.3 Test Network II: AT&T
The level one and two of the AT&T backbone network(shown in Fig. 14a) is applied to redesign, which is com-prised of 37 nodes in major US cities and 58 links (10 Gbit/sor 2.5 Gbit/s link capacities) interconnecting them [42].
Figure 14 shows the procedure of the algorithm from theinitial network with the existing links (set E0) and the po-tential links (set EPOT ) and to the final biconnected solu-tion with the following settings and constraints:
• all links of the set EPOT have a capacity of 2.5 Gbit/s
• maximum link utilization = 99%
• maximum hop number = 16
• maximum node degree = 4
Figure 14b) depicts the network after the Reduction (ER =37 links). The algorithm almost achieves a pure tree struc-ture, only the 10 Gbit/s link {Chicago, New York} can not
Figure 13. G–WiN after the redesign
be reduced due to the effect of a too high utilization result-ing from its removal. During the Augmentation 18 links(with dashed lines marked links in Fig. 14c) are added tothe network in order to make it biconnected, whereupon theFine-Tuning Reduction discards 15 links again (set EFTR
in Fig. 14d) taking into account the constraints and bicon-nectivity. Figure 15 compares the network topology beforeand after the optimization. The corresponding optimizationresults are summarized in Table 2.
Table 2. Optimization results of AT&T backbonenetwork
AT&T Original Best Average
Cost in CU 8 901 599 3 712 977 4 259 874
Number of edges 58 40 42.1
Mean edge util. 16% 51% 41.8%
Max. edge util. 54% 96% 92.4%
Mean hop number 3.47 6.59 6.1
Max. hop number 9 16 15.5
Mean node degree 3.13 2.14 2.25
Max. node degree 9 3 3.5
As mentioned, the solution depends on the sequence ofedges (selected during Reduction, Augmentation and Fine-Tuning Reduction). If the edge with the best weight isalways selected, the same unique branch of the completecombinatorial solution tree will be generated again and
9
International Journal On Advances in Telecommunications, vol 2 no 1, year 2009, http://www.iariajournals.org/telecommunications/

Figure 14. AT&T backbone network redesign: Suc-cessive depiction of the network after every optimiza-tion step. a) initial network, b) after Reduction, c)after Augmentation, d) after Fine-Tuning Reduction
again. But the deterministic solution is not always the best.Therefore, we implemented a random function that controlsedge selection such that not always the best one is selected,but also the second or third best. For the AT&T network op-timization we generated 50 solution sets (EF ) with an indi-vidual set of parameters. Afterward a statistical analysis hasbeen performed and evaluated the efficiency of the chosenparameter. The algorithm took about 30 seconds calculat-
Figure 15. AT&T backbone network: Link capac-ities a) before and b) after optimization (maxHop =16). The optimization process is illustrated in Fig. 14
ing one AT&T network parameter set (one EF ). The resultpresented in Table 2 (column Best) and Fig. 15 is the bestone out of fifty solution sets. The average values of the fiftysolution sets are shown in column Average of Tab. 2.
Finally network cost are reduced to less than 50%. Butthe price is high: the mean link utilization, mean hop num-ber and maximum hop number are increased. This resultsfrom a weakly restricted optimization. Hence, what we seeis the potential saving of cost, if the network is operated atthe limit and in consequence with a higher probability ofhaving bad quality of service (QoS). This can be improvedby tightening up the constraints. The degree of meshingcan be decreased by adjusting the maximum hop number orthe maximum link utilization. Our tests showed, that thehop number constraint is a better control because routingalgorithm mostly finds the shortest path (with the least hopnumber), but does not consider link utilization. So a maxi-mum utilization constraint can be easily exceeded and thusdisturb the success of the optimization result (network couldbe not valid), although traffic engineering methods like loadsharing or routing metric optimization [45] could balancenetwork utilization situation.
In Fig. 16 an optimization result is shown with the sameparameters like in the previous example, but with a maxi-mum node degree of 5 and a maximum hop number of 9.Thus, the maximum hop number is as big as in the originalAT&T network. This optimized network has 51 active linksand costs 4 284 965 CU. The average link utilization is 31%.
10
International Journal On Advances in Telecommunications, vol 2 no 1, year 2009, http://www.iariajournals.org/telecommunications/

Figure 16. AT&T backbone network: Link capaci-ties after optimization with constraints: max. Hop =9; max. link utilization = 99%; max. node degree = 5
Although maximum utilization is still high (96%), the net-work performs much better, since only one link is utilizedwith more than eighty percent and the average hop numberis 4.59. However, too high utilization has negative influ-ence on the network operation. Therefore, the maximumutilization can be decreased from 99% to a lower threshold,or the mechanism of sharing load can be applied to reducethe link utilization. This paper provides only some resultsbased on the predefined scenarios to show the characteris-tics of three-steps algorithms.
An interesting effect is the counter balancing behavior ofthe three optimization steps. Imagine an unfavorable Aug-mentation, adding a more than necessary number of edgesto the graph. This does not necessarily lead to a bad over-all result, because the supplementary edges also introduceadditional optimization potential to the Fine-Tuning Reduc-tion. In this case Fine-Tuning Reduction can compensatethe bad Augmentation performance.
Besides the described directed optimization (network re-design) also the opposite is possible (designing new net-works) by assigning all potential and real existing edges tothe initial set E0. Thus, the algorithm has all degrees offreedom to create a completely new solution set. Applyingthe new design method, our tests show e.g. for the AT&Tnetwork (Fig. 15, same constraints) a best solution set withminimal cost of over again 10% less compared to the bestredesign method.
5.4 Parameter Studies
Different parameters influence the overall performanceof the proposed algorithm. This paper presents some re-sults of cost metrics, maximal hop number and potentialthreshold for network calculation and redesign. The pointsin the following figures are derived from 50 trials with con-fidence level 95%. Furthermore, a specified new-design isdefined. Only one difference from the redesign is that this
new-design takes all active and potential edges as opera-tional edges, i.e. E0 is extended. Referring to empiricalresults, both design processes are similar. Hence, the new-design of AT&T network is fulfilled to evalute the parame-ters mentioned above. The new-design has no limitation ofnode degree, but with maximal hop number and maximaledge utilization.
5.4.1 Reduction–Metric
By evaluating the cost metric for Reduction, wcost andwcapacity play an important role. As mentioned in Re-duction, the metrics with low values will be removed witha higher probability. In addition, the weight of cost hasmore positive influence in the redesign than the weight ofcapacity. Namely, the expensive edges are preferably re-moved. In terms of wcost and wcapacity, Fig. 17 presents op-timization results after Reduction, Augmentation and Fine-Tuning-Reduction. A high weight of cost can lead to a betteroptimization solution, e.g. the right side of the figure wCost
close to 1.0. Several unusual slight increment on the curves,such as Fine-Tuning-Reduction, stand the reason that thesetting of wcost and wcapacity also depends on other param-eters and could lead local optima.
3000000
3500000
4000000
4500000
5000000
5500000
6000000
6500000
7000000
0.0-1.0 0.1-0.9 0.2-0.8 0.3-0.7 0.4-0.6 0.5-0.5 0.6-0.4 0.7-0.3 0.8-0.2 0.9-0.1 1.0-0.0
Net
wor
k C
ost i
n C
U
Weight of Reduction-CostMetric (Cost - Capacity)
Influence of Reduction-CostMetric (Capacity)
ReductionAugmentationFT-Reduction
Figure 17. Influence of wcost and wcapacity forReduction–Metric on overall network cost:
Constraints: max.Hop = 20 max.Util. = 99.999%
Random in %: pThresRED = 20 pThresAUG = 10
MetricAUGe : wcost = 0.7 wflow = 0.3
MetricF TRe : wcost = 0.7 wutilization = 0.3
5.4.2 Augmentation– and FT–Reduction-Metrics
Instead of wcapacity , the cost metrics of Augmentation–and FT–Reduction-Metrics take advantage of wflow andwutilization . Subject to hard constraints during the de-sign, the candidate edges for both steps are strictly lim-ited. Hence, Augmentation– and FT–Reduction-Metrics
11
International Journal On Advances in Telecommunications, vol 2 no 1, year 2009, http://www.iariajournals.org/telecommunications/

have similar characteristics in terms of optimization results.Hereby, only the optimization results of Augmentation-Metrics are presented and analyzed. Fig. 18 compares wcost
and wflow of the Augmentation–Metric for three steps. Thechange of weights wcost and wflow has no explicit improve-ment for network design. However, the solutions with w cost
close to 1 are a little better than those with wcost near 0.
2800000
3000000
3200000
3400000
3600000
3800000
4000000
4200000
4400000
0.0-1.0 0.1-0.9 0.2-0.8 0.3-0.7 0.4-0.6 0.5-0.5 0.6-0.4 0.7-0.3 0.8-0.2 0.9-0.1 1.0-0.0
Net
wor
k C
ost i
n C
U
Weight of Augmentation-CostMetric (Cost - Flow)
Influence of Augmentation-CostMetric
ReductionAugmentationFT-Reduction
Figure 18. Influence of wcost and wflow forAugmentation–Metric on overall network cost:
Constraints: max.Hop = 20 max.Util. = 99.999%
Random in %: pThresF TR = 10 pThresAUG = 10
MetricRdkte : wcost = 1.0 wcapacity = 0.0
MetricF TRe : wcost = 1.0 wutilization = 0.0
5.4.3 Maximal Hop Number
The maximal number of hops has been mentioned for AT&Tnetwork redesign. More test results are shown in Fig. 19for AT&T network new–design. The lower the maximalnumber of hops is, the more expensive the designed networktopology is. In this case more links are required to savehops for point–to–point connections and the node degree(maximal and mean) can increase. Therefore, maximal hopnumber significantly influences design results. However, ifthe node degree is limited, the influence of the maximal hopnumber could be changed.
5.4.4 Potential Threshold
Fig. 20 provides an overview of the optimization results interms of different potential thresholds for Reduction, i.e.pThresRED ∈ [0%, 700%] with constant pThresAUG andpThresFTR. The lower thresholds can lead to better so-lutions. Due to limited candidate edges, different potentialthresholds of pThresAUG and pThresFTR have no largechange. Hence, they are disregarded in this paper.
2500000
3000000
3500000
4000000
4500000
5000000
5500000
15 14 13 12 11 10 9 8 7
Net
wor
k C
ost i
n C
U
Maximum Hop Number
Influence of Maximum Hop Number
ReductionAugmentationFT-Reduction
Figure 19. Influence of maximal hop number on net-work cost:
Constraints: max.Util. = 99.999%
Random in %: pThresRED = 10 pThresAUG = 10
MetricREDe : wcost = 1.0 wcapacity = 0.0
MetricF TRe : wcost = 1.0 wutilization = 0.0
2500000
3000000
3500000
4000000
4500000
5000000
5500000
0 100 200 300 400 500 600 700
Net
wor
k C
ost i
n C
U
Threshold in %
Influence of the Upper Border for Selecting Links Randomly
ReductionAugmentationFT-Reduction
Figure 20. Influence of potential thresholds on over-all network cost:
Constraints: max.Hop = 20 max.Util. = 99.999%
Random in %: pThresAUG = 0 pThresF TR = 0
MetricREDe : wcost = 1.0 wcapacity = 0.0
MetricF TRe : wcost = 1.0 wutilization = 0.0
5.4.5 Summary
With the different configuration of parameters, several net-works have been investigated. Tab. 3 summarizes the mostuseful parameter set, found empirically during the study.
6 Conclusion
In this paper we proposed a three-steps algorithm fornetwork redesign problems to find a new fully biconnected
12
International Journal On Advances in Telecommunications, vol 2 no 1, year 2009, http://www.iariajournals.org/telecommunications/

Table 3. The best found parameter setting for IP–Network design
Parameters ValuesReduction:
MetricREDe wcost = 0.9 wcapacity = 0.1
pThresRED 10%Augmentation:
MetricAUGe wcost = 0.8 wflow = 0.2
pThresAUG 0% ↔ 10%FT–Reduction:
MetricFTRe wcost = 0.8 wutilization = 0.2
pThresFTR 0%
cost-effective network topology. Hard constraints, such ashop number, edge utilization and node degree, are consid-ered. In terms of numerical simulation results, the algo-rithm was verified to be flexibly applicable for redesignexisting networks and creating new networks. The imple-mented algorithm has successfully applied to different net-work topologies, fulfilling the constraints and consideringthe biconnectivity, particularly with two-vertex connectiv-ity. The redundant edges can be efficiently removed bythe third step - Fine-Tuning Reduction, which improves thequality of network redesign in comparison with the previouswork. A parameter study helps understanding the sensitiv-ity of the results on algorithm settings.
In real network design situations, keeping the networkoperational is the most important task. A cost saving of e.g.5% will always be critically examined by the network oper-ator, since the occurrence of critical transition states duringthe migration has to be taken into consideration. Further-more, network requirements continuously change, due tonew services, new customers and new technologies. Thus,for a network operator it is not crucial to have (a temporar-ily) optimal network, but it is more important to know theoptimal network. This knowledge helps making the right(most cost efficient) decision for necessary network exten-sions. The presented strategy supports network planners inthese situations. Its high transparency and the possibility toclosely interact by adjusting intermediate results manuallyassures its applicability.
References
[1] C. Minge, R. Zhao, M. Schweigel, “Improved Opti-cal Network Topology Redesign Ensuring Biconnectiv-ity”, The Fourth Advanced International Conference onTelecommunications (AICT2008), p.398–403, Athens,Greece, June, 2008
[2] G.M. Schneider, M.N. Zastrow, “An Algorithm for theDesign of Multilevel Concentrator Networks”, Com-puter Networks, vol.6(1), p.1–11, 1982
[3] B. Gavish, “Topological design of Telecommunica-tion Networks-the Overall Design Problem”, EuropeanJournal of Operations Research, vol.58(2), p.149–172,1992
[4] J. Petrek, V. Siedt, “A Large Hierarchical Network Star-Star Topology Design Algorithm”, European Trans-actions on Telecommunications, vol.12(6), p.511–522,2001
[5] A. Bley, T. Koch, R. Wessaely, “Large-scale hierarchi-cal networks: How to compute an optimal architec-ture?”, Proceeding of Networks 2004, p.13–16, Vienna,Austria, 2004
[6] M. Pioro, Deepannkar Medhi, “Routing, Flow, and Ca-pacity Design in Communication and Computer Net-works”, Elsevier Inc. America, 2004
[7] B. Gavish, Topological design of TelecommunicationNetworks-local Access Design Methods”, Annals ofOperations Research, vol.33(1), p.17–71, 1991
[8] S. Chamberland, B. Sanso, O. Marcotte, “Topolog-ical Design of Two–Level Telecommunication Net-works with Modular Switches”, Operations Research,vol.48(5), p.745–760, 2000
[9] A. Girard, B. Sanso, L. Dadjo, “A Tabu Search Algo-rithm for Access Network Design”, Annals of Opera-tions Research, vol.106(1–4), p.229–262, 2001
[10] I. Godor, G. Magyar, “Cost-optimal Topology Plan-ning of Hierarchical Access Network”, Computers &Operations Research, vol.32, p.59–86, 2005
[11] R. Zhao, S. Goetze, R. Lehnert, “A Visual PlanningTool for Hybrid Fiber-VDSL Access Networks withHeuristic Algorithms”, The 5th International Work-shop on Design of Reliable Communication Networks(DRCN 2005), p.541–548, Island of Ischia (Naples),Italy, 2005
[12] M.R. Garey, D.S. Johnson, “Computers and In-tractability: A Guide to the Theory of NP-completeness”, San Francisco, CA, Freeman, 1979
[13] S. Chopra, “Polyhedra of the Equivalent SubgraphProblem and Some Edge Connectivity Problems”,SIAM Journal on Discrete Mathematics, vol.5, p.321–337, 1992
13
International Journal On Advances in Telecommunications, vol 2 no 1, year 2009, http://www.iariajournals.org/telecommunications/

[14] T.L. Magnanti, S. Raghavan, “Strong Formulations forNetwork Design Problems with Connectivity Require-ments”, Networks, vol.45(2), p.61–79, 2005
[15] T.L. Magnanti, S. Raghavan, “Redesigning networktopology with technology considerations”, Interna-tional Journal of Network Management, vol.18(1), p.1–13, 2008
[16] M. Weiss, F. Zeyer, “Redesign of Local Area Net-works Using Similarity-based Adaption”, Proc. 10thConference on AI for Applications, p.284–290, SanAntonia, TX, USA, 1994
[17] W.D. Grover, “Mesh–Based Survivable Networks”,Prentice Hall, New Jersey, 2004
[18] R.H. Jan, F.J. Hwang, S.T. Chen, “Topological Opti-mization of A Communication Network Subject to AReliablity Constraint”, IEEE Transactions on Reliabil-ity, Vol.42, p.63–70, 1993
[19] S. Rai, D.P. Agrawal, “Distributed Computing Net-work Reliability”, IEEE Computer Society Press Tuto-rial, USA, 1990
[20] T.G. Robertazzi, “Planning Telecommunication Net-works”, IEEE Press, USA, 1999
[21] L. Nederlof, K. Struyue, C. Shea, H. Misser, Y. Du,B. Tamayo, “End-to-End Survivable Broadband Net-works”, IEEE Commun. Mag., vol.9, p.63-70, 1995
[22] Y. Liu, D. Tipper, P. Siripongwutikorn, “Approximat-ing Optimal Spare Capacity Allocation by SuccessiveSurvivable Routing”, IEEE/ACM Transaction on Net-working, vol. 13, No. 1, p.198-211, February 2005
[23] R. Diestel, “Graph Theory”, 2.ed, vol. 173, GraduateTextbooks in Mathematics, Spring-Verlag, 2000
[24] G. N. Fredericson, J. Jaja, “Approximation Algo-rithms for Several Graph Augmentation Problems”,SIAM Journal on Computing, vol.10(2), p.270–283,1981
[25] S. Khuller, R. Thurimella, “Approximation Algo-rithms for Graph Augmentation”, Journal of Algo-rithms, vol.14(2), p.214–225, 1993
[26] S. Khuller, B. Raghavachari, A. Zhu, “A UniformFramework for Approximating Weighted ConnectivityProblems”, Proc. 10th Annual SODA (ACM-SIAM),p.937–938, Baltimore (short paper), 1991
[27] I.D. Ljubic, J.J. Kratica, “A Genetic Algorithm forthe Biconnectivity Augmentation Problem”, Proceed-ings of the 2000 Parallel Problem Solving from NatureVI Conference, vol.1917, p.641–650, 2000
[28] K.-D. Hackbarth, A. Menendez, C. Diaz, A.J. Por-tilla, “An approximative algorithm for fully biconnec-tivity and its application to network design”, Euro-NGI.–D.JRA 3.1.2, p.95–106, 2004
[29] T. Erlebach, “Ausfallsicherheit von Netzen (reliabilityof networks)”, Lecture manuscript, ETH Zurich, 2003
[30] S. Pracht, D. Hardman, W. Horneff, “Echotest in IP-Netzwerken (echo test in IP-networks)”, vol.1, p.44–46,2001
[31] J. Evans and C. Filsfils, “Deploying Diffserv at theNetwork Edge for Tight SLAs (Part 1)”, IEEE InternetComputing”, vol.Jan, p.61–65, 2004
[32] L. Kleinrock, “Queueing Systems, Volume II: Com-puter Applications”, John Wiley & Sons, Canada, 1976.
[33] R. Zhao, H.J. Liu, R. Lehnert, “Topology Designof Hierarchical Hybrid Fiber-VDSL Access Networkswith ACO”, The Fourth Advanced International Con-ference on Telecommunications (AICT2008), p.232–237, Athens, Greece, June, 2008
[34] R. Zhao, Y. Zhang, R. Lehnert, “Topology Designof Hierarchical Hybrid Fiber-VDSL Access Networkswith Enhanced Discrete Binary PSO”, The Third In-ternational Conference on Access Networks (Access-Nets08), Las Vegas, Nevada, USA, October, 2008
[35] K. Menger, “Zur Allgemeinen Kurventheorie”, Fun-damenta Mathematicae, vol.10, p.96–115, 1927
[36] R. Sedgewick, “Algorithms”, 2.ed, Princeton Univer-sity, Addison-Wesley, 1988
[37] R.K. Ahuja, T.L. Magnanti, J.B. Orlin, “NetworkFlows: Theory, Algorithms, and Applications”, Pren-tice Hall, United States Ed edition, 1993
[38] D. Jungnickel, “Graphenm, Netzwerke undAlgorithmen”, 3.ed, BI-Wissenschaftsverlag,Mannheim/Leipzig/Wien/Zuerich, 1994
[39] G. Chartrand, “Introductory Graph Theory”, p.45-49,New York, Dover, 1985.
[40] R.E. Tarjan, “Depth First Search and Linear Graph Al-gorithms”, SIAM Journal on Computing, vol.1, p.146–160, 1972
[41] M. Weinkopf, D. Reimer, “Entgeldantrag fuer digi-tale Standard- und Carrier-Festverbindungen, fuer denComfort-Service (dSFV) und die Express-Entstoerung(CFV)”, Technical Report, 2004
[42] NetWorks, http://www.networks.detecon.com/en/,2008
14
International Journal On Advances in Telecommunications, vol 2 no 1, year 2009, http://www.iariajournals.org/telecommunications/

[43] R. Baessler, A. Deutsch, “Nachrichtennetze (Telecom-munications Networks)”, VEB Verlag Technik Berlin,Berlin, 1989
[44] Germany National Research and Education Network,http://www.dfn.de/, 2008
[45] A. Gous, A. Afrakhteh, “Traffic Engineering throughautomated optimisation of routing metrics”, CaseStudy, Cariden Technologies, 2002
15
International Journal On Advances in Telecommunications, vol 2 no 1, year 2009, http://www.iariajournals.org/telecommunications/

Finding Inter-domain QoS Enabled Routes Using an Overlay Topology Approach
Şerban Gerogică Obreja, IEEE Member
Communications Department, ETTI
University POLITEHNICA Bucharest
Bucharest, Romania
e-mail: [email protected]
Eugen Borcoci, IEEE Member
Communications Department, ETTI
University POLITEHNICA Bucharest
Bucharest, Romania
e-mail: [email protected]
Abstract— The transport of multimedia flows over the Internet
needs to manage and control end to end Quality of Services
(QoS) at transport level. One problem, which needs to be
solved in this case, is finding inter-domain QoS enabled paths.
This paper deals with the problem of establishing QoS enabled
aggregated multi-domain paths, to be later used for many
individual streams. It is proposed a simple but extendable
procedure, based on overlay approach, to find several potential
inter-domain end to end paths. The problem of QoS path
finding is spilled in two phases. First several paths between the
source and destination domains are found using the overlay
topology. Then, the process of QoS path finding is completed in
a second phase, when QoS enabled aggregated pipes are
established, by negotiation between the domains’ managers,
along one of the paths founded in the first phase. The
subsystem proposed is part of an integrated management
system, multi-domain, dedicated to end to end distribution of
multimedia streams.
Keywords- QoS routing, end to end QoS management, pSLS,
overlay network topology.
I. INTRODUCTION
The real time multimedia services, delivered on Internet networks, raised new challenges for the network regarding the end to end (E2E) quality of services (QoS) control in order to ensure the proper delivery of the services from content provider (source) to content consumer (destination). But traffic processing in real Internet deployments is still mostly best effort. Several approaches have been proposed, focused on provisioning aspects – usually solved in the management plane - and then in the control plane: e.g., well known dynamic techniques have been standardized, like IntServ, Diffserv, or combinations. The routing or - more generally - QoS enabled path finding and then maintaining, are also a part of the scene. Offering multimedia services in multi-domain heterogeneous environments is an additionally challenge at network/ transport level. Service management is important here, for provisioning, offering, handling, and fulfilling variety of services. Appropriate means are needed to enable a large number of providers to co-operate in order to extend their QoS offerings over multiple domains. To this aim, an integrated management system can be a solution, preserving each domain independency but offering
integration at a higher (overlay) layer in order to achieve E2E controllable behavior.
This paper deals with the problem of establishing QoS enabled aggregated multi-domain paths, to be later used for many individual streams. It is proposed a simple but extendable procedure, running at management level, to find (through communication between domain managers) several potential inter-domain end to end paths. Then, using a resource negotiation process performed also in the management plane, QoS enabled aggregated pipes are established. All these function are performed at an overlay level, based on abstract characterization of intra and inter-domain capabilities delivered by an intra-domain resource manager. The subsystem is part of an integrated management multi-domain system, dedicated to end to end distribution of multimedia streams.
The QoS path finding is not a traditional routing process: it is not implemented on routers, and it doesn’t choose a route between network devices, but between two or more nodes of an overlay virtual topology described at inter-domain level. Together with the intra-domain QoS routing available inside each network domain we will obtain an E2E QoS routing solution.
The main advantage of this solution is that, by separating the process of path finding from the QoS negotiation, the path searching process doesn’t need to work real time. So we can find several paths in very complex overlay topologies. Also, by simplifying the overlay topology, by considering only the domain managers as topology nodes, our solution will work for very complex topologies, being no need for a hierarchical approach.
This paper is organized as follows: the Section 2 contains the state of the art in QoS inter-domain routing; the Section 3 shortly describes the general Enthrone architecture focusing on the service management at the network level. The Section 4 introduces the proposed QoS inter-domain path finding solution. Section 5 presents details about the implementation and Section 6 contains conclusions and possibilities of extensions and open issues.
II. STATE OF THE ART
Because our approach deals with QoS path finding and routing, a short overview of the available approaches for QoS
16
International Journal On Advances in Telecommunications, vol 2 no 1, year 2009, http://www.iariajournals.org/telecommunications/

routing is presented below [13][14][15][17][18]. We distinguish between intra- and inter-domain QoS problems.
The intra-domain QoS routing solutions could be divided in two major approaches.
Classically, intra-domain QoS routing protocols run on the routers and find paths with QoS constraints from source to destination.
Other solutions are based on a domain central manager, having knowledge of the total resource allocation inside the domain, and use an algorithm to determine QoS routes between source and destination. In this case the QoS routing process is run by a dedicated module of the domain manager, and the resulted route is installed on the network equipments by a network controller. Usually the QoS routing process is triggered by a new request for a QoS path through the domain.
For inter-domain QoS routing also we can distinguish between two kinds of approaches. The first one proposes enhancements for the BGP protocol in order to support QoS features. The BGP advertises QoS related information between autonomous systems (ASes), and the routing table is build taking into consideration this additional QoS information. The Q-BGP protocol, proposed in MESCAL project [20], is such an example.
Another category of inter-domain QoS routing solutions are based on the overlay network idea [13][14]. An overlay network is built, which abstracts each domain with a node, represented by the domain service manager, or with several nodes represented by the egress routers from that domain. Then protocols are defined between nodes for exchanging QoS information, and based on this information QoS routing algorithms are used to choose the QoS capable path. In [13] a Virtual Topology solution is proposed. The VT is formed by a set of virtual links that map the current link state of the domain without showing internal details of the physical network topology. Then a Push and a Pull model for building the VT at each node are considered and analyzed. In Push model each AS advertise their VT to their neighbor ASes. This model is suited for small topologies. In Push model the VT is requested when needed, and only from the ASes situated along the path between source and destinations, path which is determined using BGP routing information. If BGP kept several routes between source and destination than the VTs for each domain situated along the founded paths are requested. Based on this VTs information the QoS route from source to destination is calculated. After that an end to end QoS negotiation protocol is used to negotiate the QoS resources along the path.
One problem with these solutions is that they are based on the virtual available resource topology information obtained from other ASes. This requirement could be not accepted by the actual network providers, due to their confidentiality policy regarding their resource availability.
Also, these solutions based on an end to end QoS negotiation process. After the QoS path is found, the negotiation process is started. The QoS routing process previously performed is increasing the chance of negotiation success, but it implies two QoS searching processes: building
the QoS topology and secondly negotiation in order to reserve resources.
This paper proposes a simpler approach by separating the process of path searching from the process of QoS negotiation (QoS searching path). By combining these two processes we will obtain a QoS inter-domain routing solution.
This was developed and integrated in an E2E QoS management system [2][8][9][10]. The system was proposed and implemented by an European consortium in the FP6 European project ENTHRONE [2][3][4][5], and continued with ENTHRONE II [6][7][8]. The ENTHRONE project is an integrated management solution based on the end-to-end QoS over heterogeneous networks and terminals. It proposes an integrated management solution that covers the entire audio-visual service distribution chain, including protected content handling, distribution across networks and reception at user terminals.
The overlay QoS path finding solution is based on the overlay network topology abstracting each pair (IP domain + manager) with a node. The overlay network in this case is only a connectivity one, with no information about the resources available intra and inter-domain. Several alternative inter-domain paths are computes, at overlay level, for each destination domain. Then, the end to end QoS negotiation mechanism is used to reserve resources. Together they will act as a QoS inter-domain routing algorithm.
III. ENTHRONE END TO END QOS MANAGEMENT SYSTEM
As mentioned before the ENTHRONE project, IST
507637 (continued with ENTHRONE II, IST 038463)
European project, cover the delivery of real time multimedia
flows with end to end quality of services (QoS) guarantees,
over IP based networks. To achieve this goal, a complex
architecture has been proposed, which cover the entire
audio-visual service distribution chain, including content
generation, protection, distribution across QoS-enabled
heterogeneous networks, and delivery of content at user
terminals [2][3][4][5][6][7]. A complete business model has
been considered, containing actors (entities) such as: Service
Providers (SP), Content Providers (CP), Network Providers
(NP), Customers (Content Consumers – CC), etc.
A. Enthrone features
ENTHRONE has defined an E2E QoS multi-domain
Enthrone Integrated Management Supervisor (EIMS). It
considers all actors mentioned above and their contractual
service related relationships Service Level Agreements (SLA)
and Service Level Specifications (SLS) as defined in
[2][3][4][5][6][7]. One of the main EIMS components is the
service management (SM). It is independent of particular
management systems used by different NPs in their
domains, and it is implemented in a distributed way, each
network domain containing Service Management entities. It
is present in SP, CP, NP CC entities, depending on the entity
role in the E2E chain. The SM located in NPs should
17
International Journal On Advances in Telecommunications, vol 2 no 1, year 2009, http://www.iariajournals.org/telecommunications/

cooperate with each IP domain manager and also with other actors in the E2E chain.
cSLS links in AAN
Content Provider
Service
Provider
Management and control
pSLS-link = IP multi-domain QoS enabled Data pipe
(sTVM) Content server
Core Network
3
EIMS@NP
EIMS@SP
EIMS@CP omer
Customer
RM@AANP
TM
Access Aggregation Network (1)
CC
Core Network
1
EIMS@NP
…
Figure 1. Forwarded cascaded model for pSLS negotiation
Legend:
EIMS@CP, EIMS@SP, EIMS@NP – ENTHRONE Integrated Management Supervisor at – respectively: Content
Provider (CP) , Service Provider (SP) and Network Provider (NP)
sTVM –Source TV and Multimedia Processor ( Content server)
AAN – Access Aggregation Network; AANP – AAN Provider
RM@AANP – Resource Manager of AAN (it is ENTHRONE compliant)
TM Terminal Manager
ENTHRONE supposes a multi-domain network
composed of several IP domains and access networks (AN)
at the edges. The CPs, SP, CCs, etc. are linked to these
networks. The QoS transport concepts of ENTHRONE are
shortly described below.
First, QoS enabled aggregated pipes, based on
forecasted data, are established in the core network, part of
the multi-domain network. They are logical pipes built by
the Service Management entities. The aggregated QoS
enabled pipe, called pSLS pipe, is identified by the
associated pSLS agreement (Provider SLS) established
between the Network Providers, in order to reserve the
requested resources. Each pSLS-link belongs to a given QoS
class, [20].
Then, slices/tracks of pSLS-links are used for individual
flows based on individual cSLA/SLS contracts. An
individual QoS enabled pipe is identified by a cSLS
agreement, which is established between the manager of a
Service Provider (EIMS@SP) and a CC for reserving the
necessary resources for the requested quality of service.
Several cSLSs pipes are aggregated at the core network
level into an aggregated pSLS pipe.
In the data plane of core IP domains, Diffserv or MPLS
can be used to enforce service differentiation corresponding
to the QoS class defined. In the ANs, the traffic streams
addressed to the users (Content Consumers) is treated
similar to the intserv, i.e. individual resource reservations
and invocations are made for each user.
B. Service Management at Network Provider
The EIMS architecture at NP (EIMS@NP) contains four
functional planes: the Service Plane (SPl) establishes
appropriate SLAs/SLSs among the operators/
providers/customers. The Management Plane (MPl)
performs long term actions related to resource and traffic
management. The Control Plane (CPl) performs the short
18
International Journal On Advances in Telecommunications, vol 2 no 1, year 2009, http://www.iariajournals.org/telecommunications/

term actions for resource and traffic engineering and control,
including routing. In a multi-domain environment the MPl
and CPl are logically divided in two sub-planes: inter-
domain and intra-domain. Therefore, each domain may have
its own management and control policies and mechanisms.
The Data Plane (DPl) is responsible to transfer the
multimedia data and to set the DiffServ traffic control
mechanisms to assure the desired level of QoS.
The main task of the EIMS@NP is to find, negotiate and
establish a QoS enabled pipe, from a Content Server (CS),
belonging to a Content Provider, to a region where potential
clients are located. Each pipe is established and identified by
a chain of pSLS agreements, between successive NP
managers. The forwarded cascaded model is used to build
the pSLS pipes [5]. The pipes are unidirectional ones. An
E2E negotiation protocol is used, [5] to negotiate the pSLS
pipe construction across multiple network domains.
The process of establishing a pSLS–link/pipe is triggered
by the SP. It decides, based on market analyses and users
recorded requirements, to build a set of QoS enabled pipes,
with QoS parameters described by a pSLS agreement. It
starts a new negotiation session for each pSLS pipe
establishment. It sends a pSLS Subscribe request to the
EIMS@NP manager of the Content Consumer network
domain. The EIMS@NP manager performs the QoS specific
tasks such as admission control (AC), routing and service
provisioning. To this aim, it splits the pSLS request into
intra-domain respectively inter-domain pSLS request. It
performs intra-domain routing to find the intra-domain route
for the requested pSLS, and then it performs intra-domain
AC. If these actions are successfully accomplished, and if
the pSLS pipe is an inter-domain one, then the manager uses
the routing agent to find the ingress point in the next
domain, and send a pSLS Subscribe request towards the next
domain. This negotiation is continued in chain, up to the
destination domain, i.e., the domain of the CC access
network. If the negotiation ends successfully, the QoS
enabled pipe is considered logically established along the
path from source to destination.
Figure 2. pSLS negotiation for QoS enable path establishment
The actual installation and configuration of routers is
considered in ENTHRONE a separate action, and is done in
invocation phase in a similar signaling way, plus the
“vertical” commands given by EIMS@NP to the intra-domain
resource manager.
After the pSLS pipe is active (i.e. subscribed and invoked)
the Service Provider is ready to offer the new service to the
users from the access network situated at the end of the pipe.
Now the process of cSLS individual agreements
establishment, for this new pSLS pipe, could be started.
EIMS@SP pSLS
provisioning NP1
pSLS split
pslsSubscribeRequest(psls)
pslsSubscribeResponse(psls)
pSLS
adminision
control (AC)
Transit pSLS ?
transit pSLS (EIMS@NP2,
edge_nodes)
pSLS intra/interdomain AC?
pSLS admitted
Install pSLS
Update resources
EIMS@NP2
pslsSubscribeRequest(psls)
pslsSubscribeResponse(psls, accepted)
pSLS intra/interdomain AC?
pSLS admitted
Local
processing
19
International Journal On Advances in Telecommunications, vol 2 no 1, year 2009, http://www.iariajournals.org/telecommunications/

IV. FINDING AN END TO END PATH WITH GUARANTIED QOS
A. General considerations
The main concepts of ENTRONE as stated in [8] are:
• E2E QoS over multiple domains is a main target of EIMS.
• But each AS has complete autonomy, regarding its network resources, including off-line traffic engineering (TE), network dimensioning and dynamic routing.
• Each Network Service Manager (cooperating with Intra-domain network resources manager) is supposed to know about its network resources in terms of QoS capabilities. ENTHRONE assumed that each AS manager has an abstract view of its network and output links towards neighbors, in a form of a set of virtual pipes (called Traffic Trunks in ENTHRONE I, see [5][6]), each such pipe belonging to a given QoS class.
A solution to this problem is to define/use routing
protocols with QoS constraints, called QoS routing
protocols. They can find a path between source and
destination satisfying QoS constraints.
While finding the QoS path is only a first step, then
maintaining the QoS with a given level of guarantees during
the data transfer requires additional actions of resource
management, including AC applied to new calls.
EIMS@NP management system performs these tasks. It
is a centralized manager knowing the topology and
resources of a domain. Being a central management node for
a network domain, a centralized QoS routing solution is
appropriate inside the domain.
On the other side, the multiple domain pSLS-links should
also belong to some QoS classes and, therefore, inter-
domain QoS aware routing information is necessary to
increase the chances of successful pSLS establishment when
negotiating the pSLSes. Several approaches are possible and
they are summarized in [5]:
• NPs advertise their QoS capabilities with their associated scope through different methods (from automated peer-to-peer processes down to conventional techniques). A NP manager can locate and find out the QoS-classes offered by other domains (QoS capabilities, capacities, destination prefixes and costs).
• NPs implement a small number of well-known QoS classes. Inter-domain QoS services are created by constructing paths across those domains that support a particular QoS class. The BGP information is used to find destination prefixes. But QoS capabilities, capacities and costs, can be determined during pSLS negotiations – which may be successful or not.
• NPs advertise their QoS class capability and reachability through a protocol. Inter-domain QoS services are then created by constructing paths (which may not necessarily be the BGP path) across
those domains that support a particular QoS class. This is path advertisement through a protocol.
B. The proposed overlay inter-domain QoS path
finding solution
We proposed a simplified version [1], which takes into
account the following assumption regarding the specific
characteristics of the Enthrone system:
• The number of E2E QoS enabled pipes is not very large because they are long term aggregated pipes.
• The number of NP entities is much lower than the number of routers
• The EIMS@NPs are implemented on powerful and reliable machines, having enough computing and storage capabilities.
• The inter-domain core IP topology is rather stable and fixed; new elements are added at large time intervals.
This solution is also based on the idea of Overlay Virtual
Network (OVN) [13], but in the first approach of our case,
the OVN consists only of network domains (autonomous
systems) abstracted as nodes. Each node will be represented
by an EIMS@NP in this Overlay Virtual Network. This
virtual network contains only information on connectivity
between the domains, represented by the EIMS@NP nodes,
or additionally static information regarding the inter-domain
QoS parameters: links bandwidth, maximum jitter and
delay, mean jitter and delay, etc.
This virtual connectivity topology (VCT) can be learned
statically (offline) or dynamically.
The statically approach considers that the OVCT is built
on a dedicated server – a topology server, like in the Domain
Name Service (DNS). When a Network Provider wants to
enter in the Enthrone system, then its EIMS@NP should
register on this topology server. The topology server will
return the Overlay Virtual Connectivity Topology. So, we
will consider that each EIMS@NP has the knowledge of this
connectivity topology. In the dynamic case each
EIMS@NP, if wanting to build the OVCT, will query its
directly linked (at data plane level) neighbor domains. It is
supposed that it has the knowledge of such neighbors.
Each queried EIMS@NP returns only the list of its
neighbors. At receipt of such information, the queerer
EIMS@NP updates its topology data base (note that this
process is not a flooding one as in OSPF). Then it queries
the new nodes learned and so on. The process continues
until the queerer node EIMS@NP learns the whole graph of
“international” topology.
As we mentioned above the graph contains as nodes the
EIMS@NP, which means that is made from the Network
Service Managers of Enthrone capable domains.
20
International Journal On Advances in Telecommunications, vol 2 no 1, year 2009, http://www.iariajournals.org/telecommunications/

Figure 3. Overlay Virtual Connectivity Network
If the Enthrone system will be implemented at large
scale, the number of nodes in the graph will be large, which
means that the time required calculating the routing table
will be also large. But because the topology changes events
(adding new EIMS domains) are sparse ones (weeks,
months), the topology construction process could run at
large time intervals (once a day for example). In this case
the routes calculation is triggered also at large time intervals,
which means that it is enough time to determine the overlay
paths. Another consequence is that the messages used to
build the OVCT will not overload significantly the network.
Enthrone capable domains can be separated by normal
domains, with no Enthrone capabilities. In this case we
consider that static QoS enabled pipes, are built between
Enthrone capable domains, pipes crossing the Enthrone non
capable domains. These domains (Enthrone non capable)
will be transparent for the Enthrone domains.
On the graph learned, each EIMS@NP can compute
several paths between source-destination pairs, thus being
capable to offer alternative routes to the negotiation
function.
The number of hops is used as a primary metric for the
path choosing process. By the “hop” term we refer to a node
in the Overlay Virtual Topology.
The process of route selection is as follows:
• When a request for a new pSLS arrived at one EIMS@NP, this will select the best path to the destination (the next EIMS@NP node that belong to this path), based on the overlay routing table.
• After the next hop is selected, the EIMS@NP will check if it has an intra-domain QoS enabled path for this route, i.e., between an appropriate ingress router and an egress router to the chosen next hop domain. If there is no such QoS enabled route, the next hope EIMS@NP node is selected from the overlay routing table.
• In case that, in the intra-domain, it is found a QoS enabled route, the EIMS@NP, based on mechanisms defined in Enthrone, trigger a request for a new pSLS negotiation to the chosen EIMS@NP neighbor.
• This process continues until the destination is reached. If the negotiation ends with success, than the pSLS pipe with guaranteed QoS parameters is found. If the process fails, then the EIMS@NP will choose another overlay path to the destination, and will start a new negotiation.
In Figure 4 the messages sequence for pSLS negotiation
process, in the case of multiple paths towards the
destination, is shown. The Service Provider decides to build
a pSLS enable pipe between a source, located in the NP1
domain, and a destination, located in NP5 domain. We
consider for this example that the working overlay topology
is the one given in Figure 3. One can see that there are four
possible routes between NP1 and NP5 domains. The first
two of them, in terms of cost value, are the routs through
NP6 and NP7 respectively. In Figure 4 it is illustrated the
case when the pSLS negotiation along the route NP1-NP6-
NP5 fails, due to admission control rejection by NP6
domain, either on intradomain pipe inside NP6 domain, or
on the interdomain pipe between the NP6 and NP5 domains.
When it receives the rejection response at the pSLS
subscription request the NP1 domain checks for an alternate
route towards the NP5 domain. It finds the route through the
NP7 domain, and starts a new negotiation using this new
route. This negotiation ends successfully, so the QoS enable
pipe between NP1 and NP5 will follow the route NP1-NP7-
NP5.
This solution has the advantage of being simple, and that
it not require at an AS the knowledge of current traffic
trunks for the other network domains as in [13].
A drawback of our solution (proposed above) is a larger
failure probability in negotiating a segment (therefore a
longer mean time for negotiation process), if comparing
with solutions which calculate the QoS path before the
negotiation process. The latter approach increases the
probability that the negotiation finished with success at the
first try.
The path finding process described above is not based on
BGP information at all. BGP is used only for best effort
traffic. The process of QoS routing takes place at service
management level. But it is possible in principle to use such
BGP information.
V. DESIGN DETAILS
A. Routing tables
As mentioned before this solution is based on the
knowledge of the overlay network connectivity topology.
The topology can be kept in a form of a square matrix. The
dimension M is equal to the number of nodes in the overlay
topology network. Each entry rij, has an integer value. A
zero value means that there is no direct connectivity
between the nodes i and j. A value different from zero, value
1 for example, implies that there is a direct connection
EIMS@NP6
EIMS@NP2
EIMS@NP1
EIMS@NP3
EIMS@NP4
EIMS@NP5
EIMS@NP7
21
International Journal On Advances in Telecommunications, vol 2 no 1, year 2009, http://www.iariajournals.org/telecommunications/

between the two nodes:
∃
∃
=
ij
ij
ijLnotif
Lifr
0
1 (1)
Lij represents the link between nodes i and j. Because the
matrix is a sparse one, it can be easily compressed in order
to be stored, in case that the dimension M is large.
Based on this overlay topology each EIMS@NP builds a
routing table which contains, for each destination node in the network, the several possible paths to this destination node, and the costs associated with each of these paths. Because in the routing table several entries will exists for each destination, the QoS negotiation process will be able to be carried successively on multiple paths, increasing the probability that a path fulfilling the QoS requirements to be found.
Figure 4. Overlay Virtual Connectivity Network
Because the number of possible paths from source to a
certain destination could be high, we have limited it to the
first four ones, with the lowest costs. If the neighbors
number are less than four, than the number of possible
routes towards a destination is limited to this number. It is
used the same principle as in the case of distance vector
protocols. In the case when there are several paths to the
same destination EIMS@NP node, using as first next hop
the same node, in the routing table it will be stored the best
cost of all the possible paths going through that node.
This is not a limitation because in our case the routing
decision is taken hop by hop so the source node has no idea
EIMS@SP pSLS prov
NP1
pSLS
split
pslsSubReq (psls)
pslsSubscribeResponse(psls, acc)
pSLS
adminision
control
Transit pSLS?
transit pSLS(EIMS@NP6)
pSLS intra/interdomain AC?
pSLS admitted
Install pSLS
Update resources
EIMS@NP6
pslsSubscribeRequest(psls)
pslsSubscribeResponse(reject)
pSLS intra/interdomain AC?
pSLS admitted
Local
processing
EIMS@NP7
EIMS@NP5
pSLS pipe crosses
NP1, NP7, NP5
Next hop
EIMS@NP6
Next route ?
Next hope (EIMS@NP7)
pslsSubscribeRequest(psls)
pslsSubscribeResponse(psls,acc)
pslsSubscribeRequest(psls)
pslsSubscribeResponse(psls,acc)
Reject
Request
Accept
Request
pSLS processing
pSLS processing
22
International Journal On Advances in Telecommunications, vol 2 no 1, year 2009, http://www.iariajournals.org/telecommunications/

what route to the destination will be chosen at the node
where the paths are splitting. An EIMS@NP does not need
to keep the whole path information (but the total cost only)
because it cannot influence the route chosen decision at the
next hops along the path.
Let’s suppose that the EIMS@NPk node has the
neighbor nodes EIMS@NPm, EIMS@NPn, EIMS@NPp.
The routing table from EIMS@NPk node to EIMS@NPl
node will be:
TABLE I. ROUTING TABLE AT NODE K FOR NODE L DESTINATION
Destination EIMS@NPl EIMS@NPl EIMS@NPl
Nex Hop EIMS@NPm EIMS@NPn EIMS@NPn
Cost
(Nb of hops) 5 0 3
The EIMS@NP at node k builds such a record for each
node in the overlay network. This process, of searching
several possible paths for each possible destination, in this
overlay network topology, is an expensive one in terms of
calculation. But based on the assumptions presented above,
which are realistic ones, if such a management system will
be implemented in the network domains, this routing table
building process will be run only on topology updates,
which means at very long time intervals. Such a process will
put low computing overhead on the Service Manager. Also,
it could be scheduled to run on intervals with low
management activity [5]. Taking this in consideration, it
could be considered that the routing table is a static one, and
the route search process reduces to a simple database search
one. It does not need to run the searching algorithm for each
pSLS subscription request. It is enough to search, in the
routing table, the route with the smallest cost, and forward
the request to the chosen next node. If the negotiation for
QoS parameters along this path failed, then it will chose the
next path, in terms of cost, from the routing table.
B. Possible improvements
It is said that the solution did not take into consideration
any QoS parameters, in the first phase, for path building
process. This task left for the QoS negotiation process.
A possible improvement is to take into account some
general data about the QoS parameters, in the path finding
phase. For example, based on agreements with Service
Managers of some domains, or based on some general QoS
parameters of the domains, the Policy Based Management
module could associate different costs for the links in the
topology matrix. It is supposed that domains agreed to share
these parameters, such as: the min/mean/max delay and
jitter, introduced by the domain. In such a way the Policy
module could influence the routing decision process. In this
case the matrix element rij could be expressed as in (2):
∃
∃
=
ij
ijij
ijLnotif
Lifcr
0 (2)
The value cij is the cost for the link Lij, and could be
established by weighting appropriately the general QoS
parameters mentioned above. These weights could be
established by the domain administrator and transmitted to
the Policy module.
Also the cost of a link could be modified based on
statistics regarding the acceptance or rejection rate of
previous negotiated pSLS pipes. For example, if some
domain with a good link cost rejects several times our
requests we could modify the costs of the links crossing that
domain.
Also, when the path cost is computed, it could be taken
into account the existence of resource price agreements
between some domains. These agreements could be
negotiated using pull model, based on some statistics. For
example, an EIMS@NP node has two different paths
towards a destination with similar path costs. It chose the
path with a better cost, but it also could periodically request
resource price information from both neighbor nodes
crossed by the two paths. If the second node has available
resources and is interested to carry traffic from the source
domain, it will propose a better resource price as a response
to resource price requests. So the EIMS@NP source node
could modify the routing table by improving the path cost
for the second path, and the future pSLS pipe requests will
be routed through the second path. Such a resource price
communication could be easily implemented because the
EIMS@NP managers are built as web-services, which
implies very flexible communication capabilities.
C. Overlay topology building
For our solution we have chosen to build the overlay
topology by means of successive interrogations of all the
available nodes. The node, which decides to build/refresh
the overlay topology, starts to interrogate all the other
overlay nodes about their neighbors. It starts with its direct
connected neighbors, and then continues interrogating the
new found neighbors, and so on.
For the EIMS@NP implementation we have used the
webservice technology. The interfaces between the
EIMS@NP modules are implemented using WSDL
language. The interdomain path finding WSDL interface it
is used by EIMS@NP to interact with other EIMS@NPs, in
order to build the overlay topology.
The inter-domain path finding WSDL interface has
defined the following messages:
• getEimsNeighborsRequest ()
• getEimsNeighborsResponse(EimsNeighborsArray eimsNeighbors)
• getDomainQoSRequest ()
• getDomainQoSResponse(DomainQoS qos)
23
International Journal On Advances in Telecommunications, vol 2 no 1, year 2009, http://www.iariajournals.org/telecommunications/

The first two messages are used by the Overlay Path
Building module from EIMS@NP subsystem to build the
overlay topology. The response message contains an array
with all the neighbors of the interrogated domain, and their
associated data about the webservices addresses,
identification, and IP addresses.
The next two messages are used to get general
information about the QoS parameters of the domain:
min/max/mean delay and jitter, mean transit cost, max
bandwidth. These values refer to the transit parameters for
the domain. We have considered that such information
could be offered by each domain without affecting its
confidentiality policy. These parameters are used to
establish the cost associated with a link between two
neighbor domains. For establishing the cost we have
weighted the normalized values for these parameters. The
weights were chosen arbitrarily, such as their sum to be one.
No studies have been done to find the optimal weights
values.
The format of messages parameters are given in table 2.
TABLE II. DATA TYPE SECTION FOR THE INTERDOMAIN PATH
FINDING WSDL INTERFACE
<wsdl:types>
<xsd:schema xmlns:xsd="http://www.w3.org/2001/XMLSchema"
targetNamespace="http://webservice.enthrone.org/eims/
/InterdomainPath/datatype”>
<xsd:complexType name="EndPoint">
<xsd:sequence>
<xsd:element name="IPAddress" type="xsd:string"/>
<xsd:element name="NetMask" type="xsd:string"/>
</xsd:sequence>
</xsd:complexType>
<xsd:complexType name="Neighbor">
<xsd:sequence>
<xsd:element name="id" type="xsd:string"/>
<xsd:element name="OverlayPathWebserv" type="xsd:string"/>
<xsd:element name="Address" type="tns:EndPoint "/>
</xsd:sequence>
</xsd:complexType>
<xsd:complexType name="DomainQoS">
<xsd:sequence>
<xsd:element name="minDelay" type="xsd:int"/>
<xsd:element name="maxDelay" type="xsd:int"/>
<xsd:element name="meanDelay" type="xsd:int"/>
<xsd:element name="minJitter" type="xsd:int"/>
<xsd:element name="maxJitter" type="xsd:int"/>
<xsd:element name="meanDelay" type="xsd:int"/>
<xsd:element name="meanCost" type="xsd:int"/>
<xsd:element name="maxBandwidth" type="xsd:int"/>
</xsd:sequence>
</xsd:complexType>
</xsd:schema>
</wsdl:types>
In order to be able to perform the pSLS negotiation and to
obtain the overlay topology, we have defined several
database tables used to store the data required by the above
mentioned operations. These tables are shortly described
next:
• Overlay_topology table – it contains data about each EIMS node in the topology, such as the addresses of the web-services available, the IP address, the domain identifier, and the QoS parameters. It is updated by the Inter-domain Overlay Path module at each overlay topology building cycle. It is used by the overlay routing process to build the overlay topology matrix, used in the overlay route searching process.
• Eims_neighbors table – stores information about the neighbors for each EIMS node contained in the overlay_topology table. It is also updated by the Inter-domain Overlay Path module, at each overlay topology building cycle.
• Overlay_interdomain_routes table – is used to store several alternative routes towards a destination overlay node. The number of alternative routes is limited to four. It is managed by the overlay routing process.
• Local_eims table – stores information about the local NetSrvMngr@NP such as: IP address, web services ports, domain Id. It is managed by the system administrator.
• Border_routers table – stores informations about the local domains border routers. It contains the border routers IP address, and neighbor EIMS@NP reached through this border router. It is managed by the system administrator.
• Access_networks table – stores informations about the access networks for the local domain. It contains the access network IP address and the border router IP address. It is managed by the system administrator.
• Local Eims_neighbors table - stores information about the eims neighbors for the local domain. It contains information about the border routers used to connect the local domains and the neighbors, border router IP address, web service port addresses, etc. It is managed by the system administrator.
• Domain_qos_parameters table – it is used to store global QoS parameters about the domain. It is managed also by the system administrator.
D. Functionality tests
This solution was implemented on the test-bed build at
our university in the Enthrone project framework [21] [22].
The test-bed consists of three Autonomous Systems, each
managed by a Network Service Manager (EIMS@NP). The
EIMS@NP managers are implemented using web services
technology. Between domains the BGP protocol is used to
route the best effort traffic. A Network Manager is used to
install the pSLS pipes on network devices. Also the test-bed
has a Service Provider EIMS Manager, and the other
modules required by the Enthrone system. The connectivity
tests involved only the Network Provider managers and
Service Provider manager.
The EIMS@SP was used to trigger pSLS subscribe
requests, between a Content Provider and one of the
available Access Networks, until the resources on the lowest
cost path between the chosen source and destination, were
exhausted. Then, we triggered additional requests between
the same source and destination. These new requests were
admitted but the pSLS pipes were built along the next
cheapest path between the chosen end points.
Because the test bed is a small one, is difficult to evaluate
24
International Journal On Advances in Telecommunications, vol 2 no 1, year 2009, http://www.iariajournals.org/telecommunications/

the performances of the proposed solution for a large
number of domains. We have measured how fast a request
for getting the neighbors EIMSs from a network domain is
served. We have obtained a mean time less than 0.1s per
request. If we take for example a topology consisting of
1000 domains then, because we can consider that the total
processing time is increasing linearly with the number of
domains, the total processing time requires to obtain the
overlay topology is about 100s. We can increase it with 50%
to take into account that at a large number of domains the
local processing time, between two interrogations, could be
higher. So, we could consider that for 1000 domains the
topology building process takes about 150s, which is an
acceptable value. Also, the solution used to build the
overlay topology, implies a large number of messages to be
exchanged in order to build the topology. Each node should
communicate with the other nodes. But the messages
exchanged are small, because each of them contains only a
few data about the neighbors of the interrogated node. If it
have been adopted a link state like protocol to build the
topology, then the messages would have been much bigger,
in case of large number of domains, so the amount of
signaling data in the network would have been bigger too.
Also, in our case we don’t have convergence problems.
It has not been evaluated till now the time needed to
compute several paths towards all the destinations nodes in
the overlay topology.
The test bed used is not appropriate to test the scalability
for the path finding process performed in the first phase. It
was only used to see that the routing table is built correctly,
containing several paths towards each destination domain in
the topology. Then, several requests for QoS enabled pSLS
pipes were triggered. These pipes were built along the first
path specified in the routing table. When the resources on
this path were exhausted, during the negotiation process, the
next route was used for the following pSLS pipe. These tests
proved that the solution is able to find QoS enabled pipes, in
a multi domain environment.
VI. ESTABLISHMENTCONCLUSION AND FUTURE WORK
It has proposed a simple solution for solving the problem
of QoS enabled inter-domain path finding, in the presence
of a Network Service Management system, capable of QoS
enabled pSLS pipes negotiation.
Because it does not require at a domain the knowledge of
other domain resources, it could be accepted by the actual
network providers. Another advantage is, that it does not
burden a given domain manager with the need of knowing
the available traffic trunks of other network domains. Also,
by separating the process of path finding from the QoS
negotiation, the path searching process does not need to
work real time. So we can find several paths in very
complex overlay topologies. By simplifying the overlay
topology, considering only the domain managers as
topology nodes, our solution will work for very complex
topologies, being no need for a hierarchical approach.
The solution has the main disadvantage that it does work
only in the presence of a QoS negotiation system capable. It
is based on this feature to check the QoS constraints along
the paths founded in the overlay topology. Another
disadvantage is that, it may not find the best QoS enabled
path, as could be the case with other solutions.
But it is simple, and is well suited for ENTHRONE
Integrated Management System. The solution is also
naturally extensible for more sophisticated techniques in
QoS capable paths finding.
Further studies and simulations will be done in order to
validate this solution for a real network environment. Also,
it has been suppose that, because the path finding process
could be run offline, and the topology is a simplified one, a
non hierarchical solution could be adopted for Internet.
Simulations should be done to establish the amount of
resources need by such a process.
ACKNOWLEDGMENT
This work was supported by the FP6 project
ENTHRONE.
REFERENCES
[1] S.G. Obreja,, E. Borcoci, “Overlay Topology Based Inter-domain QoS Paths Building”. AICT apos;08. Fourth Advanced International Conference on Telecommunications, Volume , Issue , 8-13 June 2008 Page(s):64 – 70. Greece, Athens.
[2] ENTHRONE I Deliverable 05 “IMS Architecture Definition and Specification”, June 2004.
[3] A. Kourtis, H. Asgari, A. Mehaoua, E. Borcoci, S. Eccles, E. Le Doeuff, P. Bretillon, J. Lauterjung, M. Stiemerling, “Overall Network Architecture”, D21 ENTHRONE Deliverable, May 2004.
[4] T.Ahmed - ed. Et al., “End-to-end QoS Signal-ling & Policy-based Management Architectures”, ENTHRONE IST Project Public Deliverable D23F, Sep-tember 2005, http://www.enthrone.org.
[5] H. Asgari, ed., et.al., “Specification of protocols, algorithm, and components, the architecture, and design of SLS Management”, ENTHRONE IST Project Public Deliverable D24F, July 2005, http://www.enthrone.org
[6] P.Bretillon ed., et. al, ENTHRONE II Deliverable D01: Overall system architecture – version 2, 2007
[7] P.Souto ed., et al, ENTHRONE II Deliverable D03f: EIMS for ENTHRONE 2
[8] E. Borcoci, Ş. Obreja eds., et al, ENTHRONE II Deliverable D18f: Service Management and QoS provisioning.
[9] Project P1008, “Inter-operator interfaces for ensuring end-to-end IP QoS”, Deliverable 2, Selected Scenarios and requirements for end-to-end IP QoS man-agement, January 2001.
[10] P.Trimintzios, I.Andrikopoulos, G.Pavlou, P.Flegkas, D. Griffin, P.Georgatsos, D.Goderis, Y.T’Joens, L.Georgiadis, C.Jacquenet, R.Egan, “A Management and Control Architecture for Providing IP Differentiated Ser-vices in MPLS-Based Networks”, IEEE Comm. Magazine, May 2001, pp. 80-88.
[11] E.Marilly et. al, “SLAs: A Main Challenge for Next Generation Networks”, 2nd European Conference on Universal Multiservice Networks, ECUMN'2002 April 8-10, 2002.
25
International Journal On Advances in Telecommunications, vol 2 no 1, year 2009, http://www.iariajournals.org/telecommunications/

[12] T.Engel, H.Granzer, B.F. Koch, M.Winter, P.Sampatakos I.S. Venieris, H.Hussmann, F.Ricciato, S.Salsano, “AQUILA: Adaptive Resource Control for QoS Using an IP-Based Layered Architecture”, IEEE Communications Magazine, January 2003, pp. 46-53. See also http://www-st.inf.tu-dresden.de/aquila/
[13] Fabio L. Verdi, Maurıcio F. Magalhaes “Using Virtualization to Provide Interdomain QoS-enabled Routing”, Journal of Networks, April 2007.
[14] Z. Li, P. Mohapatra, and C. Chuah, “Virtual Multi-Homing: On the Feasibility of Combining Overlay Routing with BGP Routing,” University of California at Davis Technical Report: CSE-2005-2, 2005.
[15] Z. Wang and J. Crowcroft, “Quality of Service Routing for supporting multimedia applications”, IEEE Journal of Selected Areas in Communication (JSAC), 14 (7) (1996), pp. 1228-1234.
[16] D. Eppstein, “Finding k-shortest paths”, SIAM Journal on Computing, 28 (2) (1998), pp. 652-673.
[17] D. Griffin, J. Spencer, J. Griem, M. Boucadair, P. Morand, M. Howarth, N. Wang, G. Pavlou, A. Asgari, P. Georgatso, “Interdomain
routing through QoS-class planes”, Communications Magazine, IEEE, Feb.2007, Volume: 45, Issue: 2, page(s): 88-95.
[18] S.P. Romano, ed., “Resource Management in SLA Networks”, D2.3 CADENUS Deliverable, May 2003.
[19] T.Ahmed, A.Asgari, A.Mehaoua, E.Borcoci, L.Berti-iquille, G.Kormentzas “End-to-End QoS Provisioning Through an Integrated Management System for Multimedia Content Delivery”, Computer Communication Journal, Volume 30, Issue 3 (February 2007), pages 638-651.
[20] E.Borcoci, A.Asgari, N.Butler, T.Ahmed, A.Mehaoua, G.Kourmentzas, S.Eccles “Service Management for End-to-End QoS Multimedia Content Delivery in Heterogeneous Environment”, AICT Conference, Lisbon, Volume, Issue, 17-20 July 2005 Page(s): 46 - 52. Portugal, Lisbon.
[21] T. Ahmed, ed. et al., ENTHRONE II Deliverable D27 “Pilot and services integration and tests”, March 2008
[22] ENTHRONE II Deliverable D28 “Trials and evaluation”, November 2008
26
International Journal On Advances in Telecommunications, vol 2 no 1, year 2009, http://www.iariajournals.org/telecommunications/

Emulation of Wireless Multi-Hop Topologies withOnline Mobility Simulation
Anders NickelsenDepartment of Electronic Systems
Aalborg University, DenmarkEmail: [email protected]
Hans-Peter SchwefelDepartment of Electronic Systems
Aalborg University, Denmarkand Forschungszentrum Telekommunikation Wien - FTW
Vienna, AustriaEmail: [email protected]
Abstract—Communication in wireless networks is affected byuncontrollable disturbances in the channel. Effects of these dis-turbances are exacerbated in networks with dynamic topologiesand multiple hops. Lack of control of the channel complicatestesting applications in such networks as test conditions are hard,or impossible, to reproduce. This paper describes a test-bed tocreate reproducible test conditions for applications by emulatingthe wireless links. Emulation is performed by a topology emulatorto which end-nodes are connected using wired links. In real-time,the emulator drops or delays packets in traffic between end-nodes. These imposed link properties are based on simulationsof node mobility, loss and delay models. Two versions forperforming the simulations are described; an offline version inwhich the mobility traces and link properties are calculatedbeforehand, and an online version where geographic trajectoriesare depending on the outcome of the communicating applications.Evaluation confirms that both versions of the test-bed arecapable of emulating links in real-time and transparently toupper layer protocols. Additional delays from packet processingand bandwidth limitations introduced by using the emulatorare shown meet the transparency requirements, also when theemulator is heavily loaded with packet flows.
Keywords-topology emulation; real-time; scalability; on-line simulation;
I. INTRODUCTION
Wireless technologies are deployed in increasingly manytypes of mobile devices. The vast popularity of these mo-bile devices, and thus the increased availability of wirelesstechnologies, makes applications for the mobile domain ofgreat interest. Evaluation is an integral part of developingsuch applications. Evaluation can be performed in fully virtualsimulation models or in experimental lab or field prototypes.Emulation provides a hybrid of simulation and experimentalsetups by allowing real applications to operate in environmentswith simulated link properties. The control of the simulationallows for accurate reproductions of the test conditions torepeat test runs. A disadvantage of using emulation is thatreal applications operate in real-time and thus enforce thelink emulation to run in real-time. This paper describes anextension of the work on a topology emulation tool describedin [1].
Simulation tools, such as ns-2 [2], provide a high levelof detail in the networking layers. The application undertest is, however, typically simplified as the real application
cannot easily be used in the simulated environment. Hence,the simulation results represent an application model and notthe real-life implementation of the application itself.
Experimental setups can be used to test the real applicationimplementation. However, disturbances in the environmentmay have a huge impact on the test results. Moreover,the characteristics of these disturbance are not alwayscontrollable, making it very difficult to repeat even simpletest runs [3].
The objective of this work is to develop an emulation test-bed to evaluate applications in wireless multi-hop topologies.In the test-bed the wireless link is replaced by a wired link.The wired link is less exposed to uncontrollable disturbancesand thus more controllable than a wireless link. The propertiesof a wireless link, such as packet drops and delay, are thenimposed on network traffic on the wired link in a controllableand reproducible manner based on simulation models.
Several types of applications benefit from being tested inan emulation test-bed. Performance of implementations ofmulti-hop routing protocol can be verified under realistic, yetreproducible, conditions. Other types of applications such asplatooning [4] or driving assistance [5] to be deployed incar-to-car scenarios can be tested in the risk free environ-ment of the emulator. In the latter case, the network qualityexperienced by the application is mapped into changes ofnode movement or transmission parameters. An example ofthis is a platooning application that reacts to experiencing ahigh packet loss rate by slowing down the speed of the carto avoid cars colliding. The described applications illustratetwo important aspects of the test-bed. In the first case, arouting application optimizes network performance based onthe emulated link properties, i.e., affects parameters in layersabove the emulator. In the other case, a platooning applicationoptimizes geographic trajectories of the nodes based on thelink properties, i.e., directly affects the input parameters of thetest-bed. This paper describes how the test-bed supports bothtypes of applications.
Several additional requirements must be fulfilled by thetest-bed in order to emulate properties of wireless links suc-cessfully. Emulating transparently as seen from the networkapplication is inherent to create results comparable to those
27
International Journal On Advances in Telecommunications, vol 2 no 1, year 2009, http://www.iariajournals.org/telecommunications/

of real experimental setups. Transparency is composed ofseveral requirements. The emulator must operate in real-timeto resemble access and transmission performance of a realwireless link, as seen from the applications. It must alsopresent link-layer interfaces to the network layer (and upperlayers) similar to a real wireless interface. The emulator shouldbe non-intrusive meaning that as little software as possibleshould be added to the end-nodes where the applicationsare deployed. In addition, the test-bed must employ accuratecommunication models in the link simulation to resembleinfluences from a real environment. Lastly, simple and scalabledeployment, use and result processing is required to ensureusability of the emulator. Scalable deployment means that itshould be easy to connect enough nodes to the test-bed tocreate a network of realistic size for the application undertest.
The contributions of this paper are: 1) description of thedesign of the topology emulator, a test-bed capable emulatingdynamic multi-hop topologies by changing time-varying linkproperties in real-time; 2) development of both an offlinesimulation version for complex models to be simulated beforeemulation and an online simulation version for simple modelsof which parameters can be affected during emulation; 3)evaluations of both versions of the topology emulator toillustrate that they are capable of emulating dynamic multi-hoptopologies while accomplishing the specified requirements.
II. RELATED WORK
Many solutions emulate wireless networks by manipulatinglink properties of connections. In general, the solutions canbe put in two categories; with a central architecture or witha distributed architecture. The central architecture eases de-ployment, configuration and control of the emulation process.However, the typical problem with a central approach is perfor-mance limitation. Tools with distributed architectures addressthis limitation by distributing the simulation and emulationtasks onto more nodes in the network. On the other hand, thesetools are typically challenged by having to coordinate eventsbetween the involved nodes and require an additional pieceof software to be installed on every involved node. The latterrequires that there exists a version of the emulation softwarefor all platforms used in the application, which is difficult tosupport.
An extension to ns-2, called ns-2e [6], can emulate simu-lated link properties from a traditional ns-2 simulation ontoreal traffic. Through so-called network objects real-worldtraffic is redirected through the simulation. Incompatibilitiesbetween real and simulated traffic are handled using tap agentsthat effectively tunnel real traffic inside special simulationpackets. In its original form, ns-2e is completely transpar-ent toward end-nodes. However, it cannot guarantee timelydelivery of real traffic. This limitation has been addressedin [7]. ns-2e has the ability to simulate dynamic topologiesthrough traditional scripting. However, the number of end-nodes connected to the emulator is limited by the number of
available network interface cards on the emulating node. Thisis a limiting scalability factor.
Another widely used emulation tool is NIST Net [8]. NISTNet is described as ’network-in-a-box’ capable of emulatingan entire network in a single hop. Similar to ns-2e NIST Netemploys a central architecture with a single node to handleall end-node connections, simulation and emulation. Thismeans that it suffers from the same deployment limitationsas ns-2e (individual network interface per attached node andthe need for context switches in the operating system tohandle interrupts for all packets on these interfaces). Also, asindicated by the term ’network-in-a-box’, NIST Net emulatesentire networks and not links. This means that to use NIST Netto evaluate networking protocols they need to be implementedin the emulator, as is the case when using a simulator. Thus,NIST Net is not transparent to network protocols, as required.
The approach of Seawind [9] is similar to the two describedabove. Seawind has mostly be applied for wide-area wired andwireless networks.
Recently developed tools with centralized architectureinclude WNINE [10] and Qomet [11]. WNINE employsa two-stage emulation process meaning that it completelyseparates simulation of the link properties and the emulation.In the simulation process it offers detailed models, but foremulation it relies on dummynet [12], which is a tool fortraffic shaping on intermediate nodes in a network. Thus,WNINE also suffers from the scalability limitations. Qometfollow the same concept as WNINE, and evaluation of Qometonly been performed using StarBED [13] and not in a generalnetwork scenario.
In contrast to the centralized approach, each attached nodein a distributed emulation calculates its own view on the linkproperties and these views must be synchronized between allnodes. This approach is used in NetEM [14], EMWIN [15],JEmu [16]. Testing real applications with these distributedtools has several challenges. The end-node environment isdeployed as a virtual machine and not a native environment.This means that the possibility of running the real appli-cation in a deployment environment is reduced. Moreover,the communication overhead of synchronization may affectthe performance of the protocols under evaluation. Lastly,and perhaps most importantly, this type of emulator is nottransparent in the sense that in each case a (potentially small)piece of code must be running on the attached node.
The tool presented here, called the ’topology emulator’,employs a central architecture and thus falls in the category ofns-2e and NIST Net. Compared to NIST Net, the tool emulatesindividual layer 2 links between nodes instead of layer 3paths. This is done in order to facilitate testing of networkingprotocols without having to implement them on a softwareplatform in the involved nodes as well as in the NIST Netemulator. Compared to ns-2e, the architecture of the topologyemulator uses one central network switch to aggregate nodetraffic instead of using a number of network interface cards inthe central emulating device. This has the advantage that more
28
International Journal On Advances in Telecommunications, vol 2 no 1, year 2009, http://www.iariajournals.org/telecommunications/

nodes can be added without changing the hardware set-up ofthe emulator. When new nodes are added it is only the internallink models that need to be updated accordingly.
III. TOPOLOGY EMULATOR
The work presented in this paper builds on the scalablecentralized emulator that is transparent to real applications onreal end-nodes and meets real-time requirements. This versionof the emulator is described in detail in [1] and summarizedin the following. The version of the emulator described hereextends the features of the original emulator to support whatwe call online simulation. To distinguish to the two versions,we refer to the original emulator as the offline version and tothe extended emulator as the online version, which is explainedin the following.
In the offline version, all properties of the network areassumed to be known beforehand. By knowing distancesbetween nodes, the specific link properties (packet drop prob-ability and packet delay) for transmitting packets can becalculated. To calculate such link properties, models of thetransmission conditions (propagation conditions, transmissionpower, coding schemes, etc.) must be specified. All simula-tion models can be dynamic models. This way geographictrajectories of nodes can change during simulation, as wellas transmission parameters such as transmission power. Anyparameter can be changed in any model, as long as it is knownbeforehand. Once the emulation is running, the parameterscannot be affected anymore in the offline version.
In the online version, we introduce online simulationwhich means that the parameters of the transmission modelscan be affected during emulation. To facilitate changing theparameters online, a control channel from the applications tothe emulator is introduced in the architecture.
Next, the basic architecture of the scalable topology emula-tor is described. This architecture is designed for both offlineand online simulation. Then, the details of the core parts of theoffline version are described. Finally, the main implementationchoices to realize the online version are described.
Ad-hoc network
Topology emulator withnetwork connectivity emulation and
mobility simulation
Node
Node
Node
Node
Logical networkconnection
Physical Ethernet link
Figure 1. Architecture of topology emulator.
A. Architecture
The network architecture of the topology emulator is illus-trated in Figure 1. It consists of one centralized node calledthe emulator node and a central network switch to which allend-nodes are connected. End-nodes contain the applicationsor networking protocols for evaluation. When applications areevaluated in real setups, the wireless networking interface onthe end-nodes is used. When the topology emulator is usedfor evaluation, the wired networking interface must be used toconnect to the central network switch. This change of networkinterface is the only requirement to use the topology emulatorfor evaluation. The network switch allows for connecting manynodes to the topology emulator and thereby helps ensure thescalability of the test-bed.
The emulator node receives and forwards all frames trans-mitted between end-nodes. No end-node receives frames be-fore they have been forwarded by the emulator node. Thisnode separation and traffic concentration is obtained by useof 802.11q virtual LAN (VLAN) tagging [17] on the switch.This concentrates all frames from one end-node in one uniquevirtual LAN per end-node. The VLAN-tag can thereby be usedby the emulator node to identify the sources of the frames.
The emulator node creates virtual links between the end-nodes by controlling bridges between the VLANs. The virtuallinks allow end-nodes to transmit frames to each other onlyif enabled by the emulator node. By selectively droppingor delaying frames on the virtual links, the emulator nodecontrols the properties of all virtual links between end-nodes.Ultimately, as the emulator node functions as an enhancedswitch and forwards layer 2 frames, its existence is transparentby design to any layer 3 protocols (and higher) used on theend-nodes.
The software architecture of the emulator node consists ofthree processes; a simulation process, an emulation processand a property updating process. The simulation processsimulates link properties (packet drop probabilities and delays)for all virtual links and saves them to a trace. The emulationprocess emulates the links in real-time by deciding if packetsshould be dropped or not while end-nodes communicate. Ifnot dropped, the emulator determines a delay for each packetand transmits it once the delay expires. The property updatingprocess binds the simulation process and the emulation pro-cess together by periodically feeding link properties into therunning emulation process.
In Figure 2 the architecture of the offline version of thetopology emulator is depicted. In contrast to the offlineversion, the online version in Figure 3 also contains themobility simulation and the link simulation as part of thereal-time execution. In the following the different parts of thearchitectures are described in detail.
B. Offline version
In this section, the simulation process, the emulation processand the property updating process are described for the offlineversion. The emulation process is the same for the offline and
29
International Journal On Advances in Telecommunications, vol 2 no 1, year 2009, http://www.iariajournals.org/telecommunications/
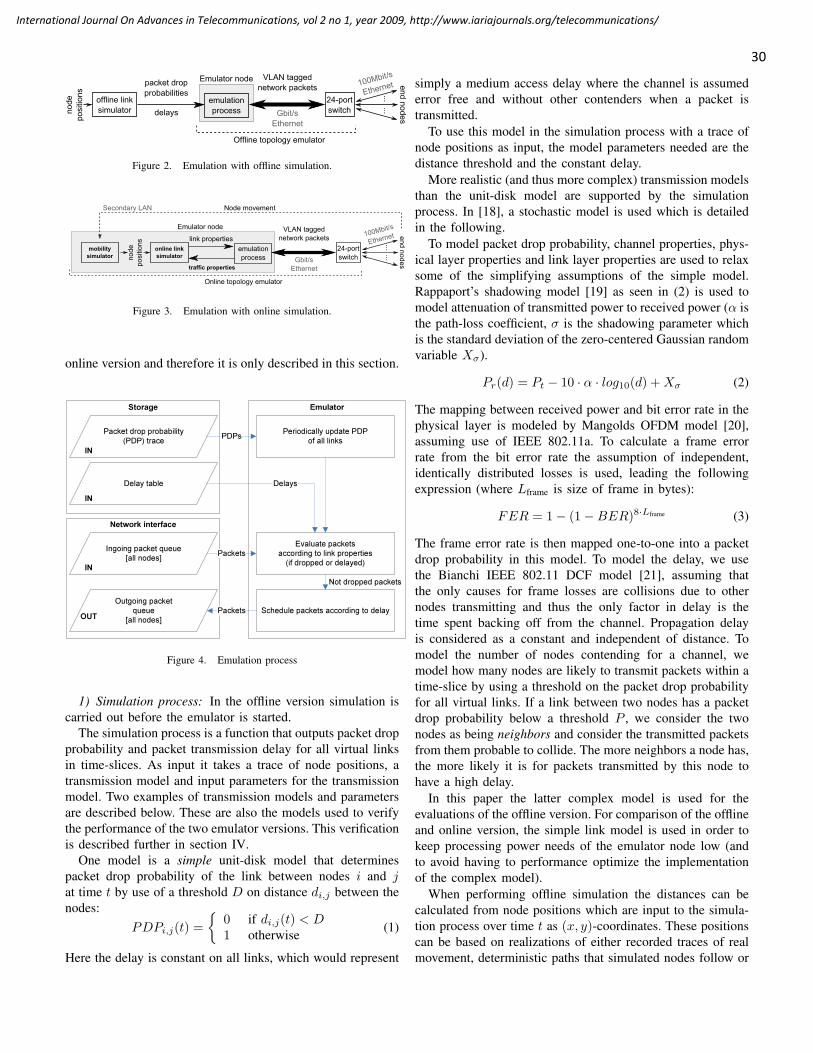
Figure 2. Emulation with offline simulation.
Figure 3. Emulation with online simulation.
online version and therefore it is only described in this section.
Storage
Packet drop probability (PDP) trace
Delay table
IN
IN
Network interface
Ingoing packet queue[all nodes]
Outgoing packet queue
[all nodes]
Emulator
Periodically update PDPof all linksPDPs
Delays
Evaluate packetsaccording to link properties(if dropped or delayed)
Packets
Schedule packets according to delayPackets
IN
OUT
Not dropped packets
Figure 4. Emulation process
1) Simulation process: In the offline version simulation iscarried out before the emulator is started.
The simulation process is a function that outputs packet dropprobability and packet transmission delay for all virtual linksin time-slices. As input it takes a trace of node positions, atransmission model and input parameters for the transmissionmodel. Two examples of transmission models and parametersare described below. These are also the models used to verifythe performance of the two emulator versions. This verificationis described further in section IV.
One model is a simple unit-disk model that determinespacket drop probability of the link between nodes i and jat time t by use of a threshold D on distance di,j between thenodes:
PDPi,j(t) ={
0 if di,j(t) < D1 otherwise (1)
Here the delay is constant on all links, which would represent
simply a medium access delay where the channel is assumederror free and without other contenders when a packet istransmitted.
To use this model in the simulation process with a trace ofnode positions as input, the model parameters needed are thedistance threshold and the constant delay.
More realistic (and thus more complex) transmission modelsthan the unit-disk model are supported by the simulationprocess. In [18], a stochastic model is used which is detailedin the following.
To model packet drop probability, channel properties, phys-ical layer properties and link layer properties are used to relaxsome of the simplifying assumptions of the simple model.Rappaport’s shadowing model [19] as seen in (2) is used tomodel attenuation of transmitted power to received power (α isthe path-loss coefficient, σ is the shadowing parameter whichis the standard deviation of the zero-centered Gaussian randomvariable Xσ).
Pr(d) = Pt − 10 · α · log10(d) + Xσ (2)
The mapping between received power and bit error rate in thephysical layer is modeled by Mangolds OFDM model [20],assuming use of IEEE 802.11a. To calculate a frame errorrate from the bit error rate the assumption of independent,identically distributed losses is used, leading the followingexpression (where Lframe is size of frame in bytes):
FER = 1− (1−BER)8·Lframe (3)
The frame error rate is then mapped one-to-one into a packetdrop probability in this model. To model the delay, we usethe Bianchi IEEE 802.11 DCF model [21], assuming thatthe only causes for frame losses are collisions due to othernodes transmitting and thus the only factor in delay is thetime spent backing off from the channel. Propagation delayis considered as a constant and independent of distance. Tomodel the number of nodes contending for a channel, wemodel how many nodes are likely to transmit packets within atime-slice by using a threshold on the packet drop probabilityfor all virtual links. If a link between two nodes has a packetdrop probability below a threshold P , we consider the twonodes as being neighbors and consider the transmitted packetsfrom them probable to collide. The more neighbors a node has,the more likely it is for packets transmitted by this node tohave a high delay.
In this paper the latter complex model is used for theevaluations of the offline version. For comparison of the offlineand online version, the simple link model is used in order tokeep processing power needs of the emulator node low (andto avoid having to performance optimize the implementationof the complex model).
When performing offline simulation the distances can becalculated from node positions which are input to the simula-tion process over time t as (x, y)-coordinates. These positionscan be based on realizations of either recorded traces of realmovement, deterministic paths that simulated nodes follow or
30
International Journal On Advances in Telecommunications, vol 2 no 1, year 2009, http://www.iariajournals.org/telecommunications/

based on simulations of stochastic models such as randomwalk or random way-point [22].
SimulatorStorage
Node position trace Channel model PHY model
Link layer model
Packet drop probability (PDP) trace
Delay tableDelays
PDP
Bit error rate
RSSIN
OUT
OUT
Figure 5. Offline simulation process
Packet drop probability of a link is calculated based ondistances between nodes and the transmission models of thechannel, the physical layer and link layer as shown in Figure5.
The output of the calculations is a trace of packet dropprobabilities over time pi,j(t) on every link (between nodesi and j) in the topology. Note that the symmetry of theprobabilities on a link depends on the simulation model asthe topology emulator supports asymmetrical links whereupstream and downstream links have unequal properties.
The delays are calculated as a static table of inverse cu-mulative distribution functions. The table is used primarily toenable fast lookup of delays as it need to be determined foreach packet when emulating. As the traffic patterns of thenodes are not known prior to the emulation, a parameterizedfamily of delay distributions for K = 1, 2, ..., n (numberof simultaneously transmitting nodes) is used instead of justsamples of delays. n is the total number of nodes in asimulation and is scenario-specific. The reason several delaydistributions are used is the fact that the distribution of thedelay depends on the number of nodes able to transmit in achannel. Therefore we generate a delay distribution for eachpossible number of next-hop neighbors in a network. Whennodes move around or the transmission conditions change,the number of next-hop neighbors will change and the real-time emulator will access the corresponding distribution in thetable. This also means that the table containing the delaysis generated once during simulation and not continuouslyupdated during emulation.
Using the simple model with constant delay for all numbersof next-hop neighbors the delay table is a column vector ofheight n− 1. In the complex model with stochastic delay thetable is a (n−1)×r matrix, where r is the chosen discretizationof the inverse CDF in the table.
Based on the probability threshold P , the number of next-hop neighbors ni(t) of node i at time t is calculated frompi,j(t) for all t. This is used as index to find the appropriatedelay distribution during emulation.
All simulation models must compensate for the fact that
all calculations are performed before running the emulation.For the delay, this means that the patterns of generatedtraffic by applications connected to the emulator must matchthe traffic models used in the simulation models. As anexample, the Bianchi-model assumes a saturated channel,which may not always be the case for the applications. Also,in the offline version, it is not possible for the applicationsto dynamically change communication parameters, such asmodulation scheme, when emulation is running. If in need ofsuch changes, they must be implemented in the simulationmodels when simulating.
2) Property updating process: In the offline version thetrace of link properties is saved to a file in the simulationprocess. To be able to use the trace-file for emulation, theproperty updating process reads the file and updates arraysaccordingly which are then read by the emulation processwhen determining packet drop probabilities and number ofnext-hop neighbors. The static delay table is only loadedonce. The entries in the trace are time stamped relative tothe beginning of the simulation and ordered ascending. Whenthe real-time clock reaches the next time-stamp, the next entryin the file is loaded into the emulation process. The propertyupdating process supports update frequencies up to 10Hz.
3) Emulation process: All nodes are physically connectedto a Cisco Catalyst 2950T VLAN-aware 24-port switch. Twoof the ports have a capacity of 1Gbit/s traffic whereas theremaining ports support 100Mbit/s. One of the gigabit ports isused in trunking mode, such that all traffic received on otherports is concentrated in this port. The emulator node is thenconnected to the trunk port. This node has an Intel Core 2 Duo1.86GHz processor and has Linux kernel v2.6.18 installed inour setup.
Packets received on the emulator node are filtered twicebefore reaching the emulation process; on layer 2 by ethernetbridging controlled by ebtables and on layer 3 by netfiltercontrolled by iptables. The layer 2 bridging is necessary toprevent transmission of link layer datagrams, e.g from ARP,when there is no virtual link. If emulation was only enforcedusing netfilter, link layer datagrams would not be filtered.Netfilter is used to deliver packets to the emulation process.
The details of the emulation process resemble NIST Net,however, as the packet flow using the VLANs was not easilyintegrated into the existing solution, a new emulation processwas developed.
On layer 2, the packet control uses a binary value li,j(t)indicating if a link exists or not between source and destinationof a packet identified by the VLAN tag. If li,j(t) = 1 thenthere is a link and the packets are forwarded to layer 3. Ifli,j(t) = 0 then there is no link and the packet is dropped.li,j(t) is calculated as
li,j(t) ={
1 if pi,j(t) < P0 otherwise (4)
On layer 3, the packets are forwarded to the emulation process.For each uni-directional link between two nodes, parameters
31
International Journal On Advances in Telecommunications, vol 2 no 1, year 2009, http://www.iariajournals.org/telecommunications/

are stored in tables representing packet drop probability, thenumber of next-hop neighbors, and packet delay distributions.To determine if a packet is dropped the emulation processdraws a uniform random number in [0,1] and compares it topi,j(t). The process also determines the delay by using thenumber of next-hop neighbors of the source node i, ni(t), andthe static delay table. To determine a delay, ni(t) is used tofind the appropriate distribution (row in the table). A uniformlydistributed random number is drawn and used as index inthe tabularized form of the inverse CDF which then indicatesthe delay of that particular packet. Once the delay has beendetermined, the packet is scheduled for delayed transmission.
The packet scheduler checks for and transmits packetsevery 122µs. In order to achieve such a high time reso-lution, the Linux Real-Time Clock chip (RTC) was usedto trigger a scheduler in the emulation process. This clocksupports triggering processes at frequencies up to 8192Hz(1/8921Hz = 122µs), which is much higher than normaltimer resolution of Linux of 10-100Hz. Once triggered, theemulation process advances a ring buffer containing a list ofpackets to be transmitted in the current time slot and transmitsall the packets in the list.
C. Online version
For the online version the simulation is performed in real-time during the emulation. An overview of this process relatedto emulation is given in Figure 3. The main difference to theoffline version is that here parameters of the simulation modelscan be changed online. This means that instead of having allinputs to the simulation process being known and specifiedbeforehand, these properties can be actively updated during theemulation. This directly enables application to affect mobilityparameters, namely to be able to affect the position of a nodeas a consequence of the experienced network quality. With theonline version, this becomes possible as all input parametersto the simulation process can be updated, including the nodemovement.
As illustrated in Figure 3, the online version requires thesimulation process to be deployed on the emulator node.In turn, if applications affect the mobility of the nodes,updated position information must be communicated to thelink simulation process. As the example applications in thevehicular scenarios do not manipulate (x,y)-coordinates butrather node physics (such as speeder or brakes), there mustexist a function capable of transforming application outputto link simulation input. In the car scenario this functionwould transform braking and speeding information intoupdated (x,y)-coordinates which would be loaded into thelink simulator. To handle this transformation, an additionalmobility simulation entity is needed in the network betweenend-nodes and the link emulator.
Online link simulation during emulation can be performedon several levels; an event-based level (where link propertiesare calculated per packet) or periodically (where link prop-erties are calculated per time-slice) as in the offline version.
The event-based level is very precise as the networking envi-ronment is adapted according to each packet. The periodiclevel may be less precise as it only represents an averageof properties over the specific time-interval. On the otherhand, simulating complex models per packet can become veryprocessing-intensive when a large amount of packets is sentthrough the emulator process. Simulating periodically is notinfluenced by the incoming packet rate and may therefore bemore suitable for more complex models as high packet ratescan still be supported. In this work, the online simulationis performed periodically as the event-based level is veryprocessing-intensive and not necessary to illustrate supportof online simulation. As described in section III-B, a simplesimulation model was developed to reduce implementationcomplexity and processing-intensity. The simple model issufficient as main purpose of the model is to evaluate theperformance of the online simulator compared to the offlinesimulator.
The connection between the online simulation process andthe emulation process is quite similar to the offline version. Inthe online version the link properties are transmitted from thesimulation process to the updating process using a socket. Thisstructure has been chosen as it enables the simulation processto be located on a secondary, resourceful computer. To beable to use the properties for emulation, the property updatingprocess for the online version reads the incoming data on thesocket and updates the emulator arrays. The arrays are updatedin an event-driven manner whenever new data is received bythe updating process. As in the offline version, this updatingprocess supports update frequencies up to 10Hz.
IV. EVALUATION
The topology emulator has been evaluated on several lev-els; 1) evaluating that the emulator is capable of emulatingdynamic multi-hop topologies and 2) verifying that the per-formance requirements are met. Results from both evaluationsare presented and discussed in the following. As the emulationprocess is the same for both offline and online simulation, theemulation capability has only been evaluated once by usingthe offline version. Meeting performance requirements is adifferent task depending on simulation version and thereforehas been evaluated for both offline and online version.
A. Functionality evaluation
To evaluate the functionality of the emulator, a scenariois specified where mobile nodes create a dynamic topology inwhich end-to-end communication is supported by ad-hoc rout-ing over multiple hops. This scenario illustrates the intendeduse of the emulator, namely to test prototypes of networkingalgorithms such as routing or addressing schemes or eventransport or service protocols for highly dynamic networks.
The movement of the nodes in the scenario is illustrated inFigure 6. In the scenario, the R2 node moves out of rangeof the destination node and is replaced in the end-to-endpath by R1. Throughout the scenario packets are dropped anddelayed on the links according to the simulated parameters.
32
International Journal On Advances in Telecommunications, vol 2 no 1, year 2009, http://www.iariajournals.org/telecommunications/

The objective of the scenario is to illustrate how the ad-hoc routing algorithm is performing in a dynamic multi-hoptopology. The link properties model an IEEE 802.11a wirelesslink incorporating shadowing and fading in the channel, aspreviously described. The parameters of the physical modelare set to α = 2 and σ = 4. For the IEEE 802.11a link thebackground noise is set to -100 dBm, the modulation schemeto 64-QAM, transmission power to 100 mW, Lframe to 1500bytes and the number of retransmissions in the medium accessto 7. The specified movement is used as input to simulate
Figure 6. Scenario with relay nodes R1 and R2 move periodically back andforth.
PDP and delay. The PDP of the links is illustrated in Figure7 as the probability varying over time on each link in thenetwork topology. A 3-hop path is always present (R2-R1-Destination). Also a 2-hop path is always present, howeverit changes over time. This effectively illustrates the dynamicmulti-hop topology. The trace of simulated PDP and the delaytable are then used as input for the emulation process toimpose the topology information onto real traffic. ping is setto continuously ping from source to destination while OLSR[23] is used as ad-hoc routing algorithm between the nodes.
The resulting traffic recorded by the emulator is illustratedin Figure 8. From the figure, we see that the emulator is capa-ble of emulating a dynamically changing multi-hop topologyas seen from the end-nodes. This is seen as the flow of packetsis redirected to use the available links when the currently usedlink becomes unavailable. Moreover, the packets sent usingthe R1-R2 link clearly demonstrate the multi-hop emulationcapability.
B. Performance evaluation
As previously described, the emulator must appear trans-parent to end-nodes meaning that lower network bandwidthand higher link delay (besides the emulated delay) comparedto a wireless environment is not tolerated. Evaluations ofbandwidth and service time have thus been performed toensure that the topology emulator meets these requirements.
Bandwidth limitations in a network occur at processing orcommunication bottlenecks. In the topology emulator, two
Figure 7. Packet drop probability (PDP) trace on links. The path changesfrom using R2-Destination to Source-R1.
Figure 8. Traffic on links during emulation shows that different availablelinks are used.
such potential bottlenecks exist; in the switch and in theemulator node. As the complexity and processing need inthe emulator node is far greater than that of the switch,the emulator node is considered the significant bandwidthbottleneck in the setup. Hence, only the bandwidth capabilitiesof the emulator node were evaluated.
To evaluate available bandwidth of the emulator node,the traffic generator D-ITG [24] is used. By use of 7 nodesin a fully connected emulated topology, each sending andreceiving streams of 100MBit/s asynchronously to othernodes, the emulator node was heavily loaded. D-ITG is alsocapable of recording the received bandwidth on the nodeswhich should amount to 100Mbit/s per node deducting asmall overhead percentage from transport and network layers.In total this amounts to 700Mbit/s theoretical load on theemulator (experiments showed the real max to be 644Mbit/s).
Considering that the expected maximum throughput ofIEEE 802.11a in a real wireless channel is 54Mbit/s, theemulator node is capable of supporting 12 separate channelswithin the 644Mbit/s limit. This limitation of 12 channelsis equal to 24 connected, fully loading nodes in separatednetworks of only two nodes and is in effect only when thenodes experience a traffic- and noise-free channel.The measured bandwidth capability of the emulator is
33
International Journal On Advances in Telecommunications, vol 2 no 1, year 2009, http://www.iariajournals.org/telecommunications/
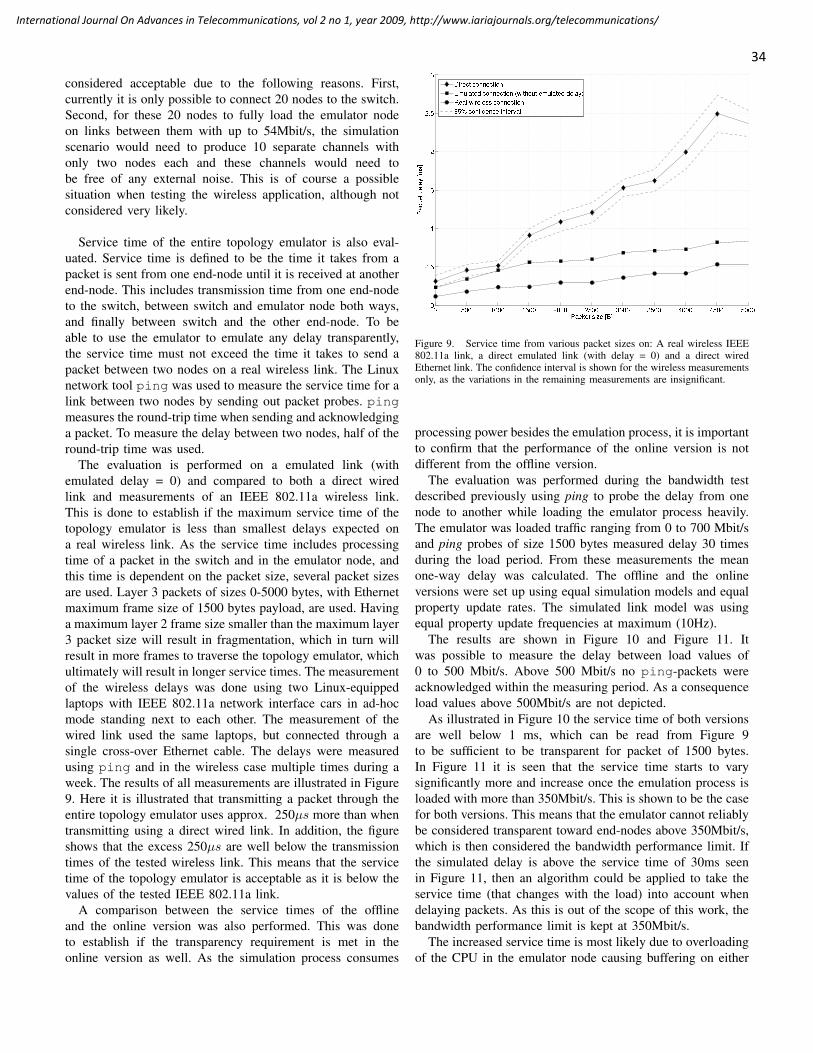
considered acceptable due to the following reasons. First,currently it is only possible to connect 20 nodes to the switch.Second, for these 20 nodes to fully load the emulator nodeon links between them with up to 54Mbit/s, the simulationscenario would need to produce 10 separate channels withonly two nodes each and these channels would need tobe free of any external noise. This is of course a possiblesituation when testing the wireless application, although notconsidered very likely.
Service time of the entire topology emulator is also eval-uated. Service time is defined to be the time it takes from apacket is sent from one end-node until it is received at anotherend-node. This includes transmission time from one end-nodeto the switch, between switch and emulator node both ways,and finally between switch and the other end-node. To beable to use the emulator to emulate any delay transparently,the service time must not exceed the time it takes to send apacket between two nodes on a real wireless link. The Linuxnetwork tool ping was used to measure the service time for alink between two nodes by sending out packet probes. pingmeasures the round-trip time when sending and acknowledginga packet. To measure the delay between two nodes, half of theround-trip time was used.
The evaluation is performed on a emulated link (withemulated delay = 0) and compared to both a direct wiredlink and measurements of an IEEE 802.11a wireless link.This is done to establish if the maximum service time of thetopology emulator is less than smallest delays expected ona real wireless link. As the service time includes processingtime of a packet in the switch and in the emulator node, andthis time is dependent on the packet size, several packet sizesare used. Layer 3 packets of sizes 0-5000 bytes, with Ethernetmaximum frame size of 1500 bytes payload, are used. Havinga maximum layer 2 frame size smaller than the maximum layer3 packet size will result in fragmentation, which in turn willresult in more frames to traverse the topology emulator, whichultimately will result in longer service times. The measurementof the wireless delays was done using two Linux-equippedlaptops with IEEE 802.11a network interface cars in ad-hocmode standing next to each other. The measurement of thewired link used the same laptops, but connected through asingle cross-over Ethernet cable. The delays were measuredusing ping and in the wireless case multiple times during aweek. The results of all measurements are illustrated in Figure9. Here it is illustrated that transmitting a packet through theentire topology emulator uses approx. 250µs more than whentransmitting using a direct wired link. In addition, the figureshows that the excess 250µs are well below the transmissiontimes of the tested wireless link. This means that the servicetime of the topology emulator is acceptable as it is below thevalues of the tested IEEE 802.11a link.
A comparison between the service times of the offlineand the online version was also performed. This was doneto establish if the transparency requirement is met in theonline version as well. As the simulation process consumes
� ��� ���� ���� ���� ���� ���� ���� ���� ���� ���������
����
����
���� ��� ���
� ��� ��� �� ��� ���
�!�� "##���"#$%&'���( "##���"# )*��+"&� �%&'���( (�'�,-.��' *�!�'� "##���"#/�0 "#1�(�#� �#��!2�'
Figure 9. Service time from various packet sizes on: A real wireless IEEE802.11a link, a direct emulated link (with delay = 0) and a direct wiredEthernet link. The confidence interval is shown for the wireless measurementsonly, as the variations in the remaining measurements are insignificant.
processing power besides the emulation process, it is importantto confirm that the performance of the online version is notdifferent from the offline version.
The evaluation was performed during the bandwidth testdescribed previously using ping to probe the delay from onenode to another while loading the emulator process heavily.The emulator was loaded traffic ranging from 0 to 700 Mbit/sand ping probes of size 1500 bytes measured delay 30 timesduring the load period. From these measurements the meanone-way delay was calculated. The offline and the onlineversions were set up using equal simulation models and equalproperty update rates. The simulated link model was usingequal property update frequencies at maximum (10Hz).
The results are shown in Figure 10 and Figure 11. Itwas possible to measure the delay between load values of0 to 500 Mbit/s. Above 500 Mbit/s no ping-packets wereacknowledged within the measuring period. As a consequenceload values above 500Mbit/s are not depicted.
As illustrated in Figure 10 the service time of both versionsare well below 1 ms, which can be read from Figure 9to be sufficient to be transparent for packet of 1500 bytes.In Figure 11 it is seen that the service time starts to varysignificantly more and increase once the emulation process isloaded with more than 350Mbit/s. This is shown to be the casefor both versions. This means that the emulator cannot reliablybe considered transparent toward end-nodes above 350Mbit/s,which is then considered the bandwidth performance limit. Ifthe simulated delay is above the service time of 30ms seenin Figure 11, then an algorithm could be applied to take theservice time (that changes with the load) into account whendelaying packets. As this is out of the scope of this work, thebandwidth performance limit is kept at 350Mbit/s.
The increased service time is most likely due to overloadingof the CPU in the emulator node causing buffering on either
34
International Journal On Advances in Telecommunications, vol 2 no 1, year 2009, http://www.iariajournals.org/telecommunications/

0 100 200 3000
0.5
1
1.5
2
Bandwidth (Mbit/s)
One
−w
ay d
elay
[ms]
OfflineOnline
Figure 10. Service delay at different bandwidth (0-350 Mb/s)
350 400 450 500−10
0
10
20
30
40
Bandwidth (Mbit/s)
One
−w
ay d
elay
[ms]
OfflineOnline
Figure 11. Service delay at different bandwidth (350-500 Mb/s). Continuationof Figure 10 with increased y-scale.
the networking interface card or in the operating system.One immediate solution to this issue would be to distributethe emulation process into two threads working on incomingpackets using both cores of the processor.
V. EXTENSIONS
Information about node positions or link quality is notcommunicated to end-nodes. To distribute this information tothe end-nodes would require an additional control channel.Such a control channel could be deployed using the existingconnections between end-nodes and emulator node. In doingso, the resources consumed by the control traffic on thelinks should be accounted for in the simulation models. Analternative solution to reusing connections is to deploy aseparate network, which would then require additional net-working interfaces in all nodes, but would not interfere with
the application traffic on the emulated links. Moreover, onlypacket drop probability and delay are calculated, meaningthat the upper layers do not have access to traditional linklayer information such as received signal strength indication(RSSI). The setup requires all upper layer technologies to beindependent of the link layer and the physical layer, which isa reasonable assumption to test many distributed applications.Approaches to actively deliver such information through anemulated virtual network interface on the end-node are beinginvestigated. Transporting such information from the emulatorto the end-nodes requires test-bed specific software to run onthe end-nodes during emulation.
VI. CONCLUSION AND FUTURE WORK
In this paper, we presented a new network emulation toolcapable of emulating dynamic multi-hop topologies. This isespecially important when developing wireless applications,as field tests of such applications become cumbersome oreven impossible to reproduce. As an advance to existingtools, the topology emulator features real-time emulation ofdynamically changing multi-hop topologies that are resultingfrom node movement in a pre-specified scenario. Moreover,the architecture of the topology emulator is designed to bescalable and modular to facilitate extensions without anymodification to the deployed version.
The functionality is divided into two parts; a simulationpart and an emulation part. The simulation part simulates acomplex wireless network from node movement resulting inpacket drop probabilities and delays on each link betweennodes. The emulation part imposes these properties in real-time to received packets on a central emulator node. End-nodes, that are usually in the wireless domain, are connectedto the emulator node via wired links through a central switch.All frames sent from end-nodes are forwarded to the emulatornode and based on the link property traces the emulationpart decides if frames should be forwarded further. If so,a delay is determined and the frames are scheduled fortransmission to the receiving end-node. This two-part modelhas been deployed in two different execution environments;offline simulation and online simulation. The offline versionsimulates the link properties prior to any emulation whereasthe online version simulates the properties in real-time duringemulation. In the online version it is thereby possible to changethe parameters of the simulation model to reflect changes in theenvironment and allow end-nodes to affect their own positionsbased on the experienced network properties or on the contentof the communicated messages. By designing the connectingpoint as a switch, the network architecture allows for up to 20real end-nodes to be connected to the emulator. Evaluations ofthe functionality and the performance of the emulator showsthat it is capable of emulating dynamically changing topol-ogy properties toward all connected end-nodes. The resultsalso show that the end-nodes do not experience limitationsin bandwidth or longer transmission delays when using theemulator. This has proved valid for both the offline and theonline emulator. The maximum capacity of the emulator was
35
International Journal On Advances in Telecommunications, vol 2 no 1, year 2009, http://www.iariajournals.org/telecommunications/

determined to be 350 Mbit/s. This limit has shown sufficient tosupport up to 14 nodes in WLAN scenarios using at maximum54 Mbit/s per channel.
Future work includes optimization of the performance ofthe online simulation process. Approaches to deliver simulatedlink information, such as RSSI-values, layer 2 packet lossrates or even position coordinates, to end-nodes are currentlyunder investigation. An interesting investigation is to establishthe maximum possible complexity of the simulation model inthe online version. As highly complex model requires manyresources during simulation, the processing power remainingfrom the emulation process can be used to determine themaximum level of complexity for calculating link properties.
ACKNOWLEDGMENTS
This work was partially supported by the EU IST FP6project ’HIghly DEpendable ip-based NETworks and Services– HIDENETS’, see www.hidenets.aau.dk and the EU ICT FP7project ’Open Pervasive Environments for iNteractive migra-tory services – OPEN’, see www.ict-open.eu. The Telecom-munications Research Center Vienna (ftw.) is supported bythe Austrian Government and by the City of Vienna withinthe competence center program COMET.
REFERENCES
[1] A. Nickelsen, M. Jensen, E. Matthiesen, and H. Schwefel, “Scalableemulation of dynamic multi-hop topologies,” in Proceedings of the4th International Conference on Wireless and Mobile Communications(ICWMC 2008), 2008.
[2] S. McCanne and S. Floyd, “Network simulator ns-2.” The Vint project,available for download at http://www.isi.edu/nsnam/ns, May 6, 2009.
[3] H. Waeselynck, Z. Micskei, M. Nguyen, and N. Riviere, “MobileSystems from a Validation Perspective: a Case Study,” Parallel andDistributed Computing, 2007. ISPDC’07. Sixth International Symposiumon, pp. 14–14, 2007.
[4] T. Tank and J. Linnartz, “Vehicle-to-vehicle communications for AVCSplatooning,” Vehicular Technology, IEEE Transactions on, vol. 46, no. 2,pp. 528–536, 1997.
[5] R. Bishop, R. Consulting, and M. Granite, “A survey of intelligentvehicle applications worldwide,” in Intelligent Vehicles Symposium,2000. IV 2000. Proceedings of the IEEE, pp. 25–30, 2000.
[6] K. Fall, “Network emulation in the VINT/NS simulator,” in Computersand Communications, 1999. Proceedings. IEEE International Sympo-sium on, pp. 244–250, 1999.
[7] D. Mahrenholz and S. Ivanov, “Real-Time Network Emulation with ns-2,” in Proceedings of the The 8-thIEEE International Symposium onDistributed Simulation and Real Time Applications (DS-RT 2004), 2004.
[8] M. Carson and D. Santay, “NIST Net–A Linux-based Network Emula-tion Tool,” Computer Communication Review, vol. 33, no. 3, pp. 111–126, 2003.
[9] M. Kojo, A. Gurtov, J. Manner, P. Sarolahti, T. Alanko, andK. Raatikainen, “Seawind: a Wireless Network Emulator. In proceedingof 11th GI,” ITG Conference on Meaurement, Modelling and Analysis(MMB 2001), pp. 151–166, 2001.
[10] T. Perennou, E. Conchon, L. Dairaine, and M. Diaz, “Two-stage wirelessnetwork emulation,” in Proceedings of the Workshop on Challenges ofMobility held in conjunction with 18th IFIP World Computer Congress(WCC), pp. 57–66, Springer, 2004.
[11] R. Beuran, L. Nguyen, K. Latt, J. Nakata, and Y. Shinoda, “QOMET:A Versatile WLAN Emulator,” in Proceeding of the 21st InternationalConference on Advanced Information Networking and Applications,2007.
[12] L. Rizzo, “Dummynet FreeBSD network emulator.” http://info.iet.unipi.it/~luigi/ip_dummynet, May 6, 2009.
[13] J. Nakata, S. Uda, R. Beuran, K. Masui, T. Miyachi, Y. Tan, K. Chinen,and Y. Shinoda, “StarBED2: Testbed for Networked Sensing Systems,”in Networked Sensing Systems, 2007. INSS’07. Fourth InternationalConference on, pp. 142–145, 2007.
[14] S. Hemminger, “Network Emulation with NetEm,” in Proceedings ofLinux Conf Au 2005, 2005.
[15] P. Zheng and L. Ni, “EMWIN:: emulating a mobile wireless networkusing a wired network,” Proceedings of the 5th ACM internationalworkshop on Wireless mobile multimedia, pp. 64–71, 2002.
[16] J. Flynn, H. Tewari, and D. O’Mahony, “A Real-Time Emulation Systemfor Ad Hoc Networks,” Proceedings of the Communication Networksand Distributed Systems Modeling and Simulation Conference, 2002.
[17] D. McPherson and B. Dykes, “VLAN Aggregation for Efficient IPAddress Allocation.” RFC 3069 (Informational), Feb. 2001.
[18] A. Nickelsen and M. Jensen, “Evaluation of routing dependability inmanets using a topology emulator.” Master Thesis, 2007.
[19] T. Rappaport, Wireless communications. Prentice Hall PTR UpperSaddle River, NJ, 2002.
[20] S. Mangold, S. Choi, and N. Esseling, “An Error Model for RadioTransmissions of Wireless LANs at 5GHz,” in Proc. Aachen Symposium,pp. 209–214, 2001.
[21] G. Bianchi, “Performance analysis of the IEEE 802.11 distributed co-ordination function,” Selected Areas in Communications, IEEE Journalon, vol. 18, no. 3, pp. 535–547, 2000.
[22] C. Bettstetter, H. Hartenstein, and X. Pérez-Costa, “Stochastic Propertiesof the Random Waypoint Mobility Model,” Wireless Networks, vol. 10,no. 5, pp. 555–567, 2004.
[23] T. Clausen and P. Jacquet, “Optimized Link State Routing Protocol(OLSR).” RFC 3626 (Experimental), Oct. 2003.
[24] S. Avallone, A. Pescape, and G. Ventre, “Distributed internet trafficgenerator (D-ITG): analysis and experimentation over heterogeneousnetworks,” ICNP 2003 poster Proceedings, International Conference onNetwork Protocols, Atlanta, Georgia, 2003.
36
International Journal On Advances in Telecommunications, vol 2 no 1, year 2009, http://www.iariajournals.org/telecommunications/

Deducing a User’s State of Mind from Analysis of the Pictographic Characters and Emoticons used in Mobile Phone Emails for Personal Content Delivery Services
Kazumasa TAKAMI† Ryo YAMASHITA† Kenji TANI†
Yoshikazu HONMA† and Shinichiro GOTO‡ †Faculty of Engineering, Soka University
‡NTT Information Sharing Platform Laboratories, NTT Corporation †[email protected] ‡[email protected]
Abstract - As the ubiquitous environment is taking root, there are calls for services that deliver content appropriate for the individual user’s personal interests and preferences. However, it is difficult to deduce the ever-changing preferences of people who live in a complicated society. In this paper, we focus on mobile phones, whose users are growing in number and which offer many sophisticated functions besides the ability to talk. We propose a method of deducing the state of mind of the user by analyzing the pictographic characters and emoticons used in his or her emails. Moreover, we have proposed a method of selecting an appropriate piece of music based on a music type, which is represented by the "number of chords", "sound strength", and "melody pattern" in a piece of music. We have developed the algorithm to deduce the user’s state of mind from an email and applied the algorithm to the selection of music, which is considered to be close related to people’s feelings. Keywords; content delivery service; interests and preferences; deduction of state of mind; mobile phone email; pictographic character; 1. Introduction
As the ubiquitous society develops, the demand for personalized services is growing. For example, there is a Web mail service that analyzes the text of each email received, and delivers advertisements related to the words contained in that email [2]. As terrestrial digital broadcasting and one-segment TV services become widespread and as the memory capacity of mobile phones increases, people expect to see personalized video or music delivery services.
To provide personalized services, it is necessary to capture the preferences and dynamic state (physical/ mental/ emotional) of each user, and to determine the type of service to provide in light of the user’s state so captured. There have been a variety of studies that
address these needs [3][4][5]. As regards capturing the user’s state, methods of determining the user’s current location using GPS [4][5], and of capturing the user’s state of mind by text mining have been proposed [6][7][8]. However, since text mining requires a vast computing time and vast resources, it is unfit for capturing the ever-changing state of mind of the user in real time.
By March 2008, the number of mobile phone users exceeded one hundred million and is still growing in Japan [9]. The mobile phone has evolved into a sophisticated mobile information terminal, capable of email, Web access, credit card transactions, pre-paid card functions, GPS-based navigation, functioning as a digital camera and so on, in addition to voice communication. This means that a mobile phone is a comprehensive treasure trove of the behavior and preference information of its user. In particular, more than 80% of mobile phone users use pictographic characters in order to convey a variety of emotional concepts that are difficult to express in text [10][11]. Recently, a progress has been made to standardize pictographic characters among different mobile phone providers. Mobile phone emails have the following characteristics:
There is a strict restriction on the number of characters that can be included in each email, so most emails are short, making it relatively easy to analyze them. This means that mobile phone emails can be analyzed at low cost. The style of writing is relatively close to spoken language. A wide assortment of means of expression is used, such as symbols, pictographic characters, and emoticons. These make it easy for the user to write an email that directly reflects how he or she feels at the moment. We are studying how to deliver content appropriate
for the user’s current state of mind by analyzing his or her interests and preferences in daily life [1]. In particular, this paper proposes a method of deducing the user’s state of mind by analyzing facial
37
International Journal On Advances in Telecommunications, vol 2 no 1, year 2009, http://www.iariajournals.org/telecommunications/

<User’s state of mind and interests>The user is interested in soccer.He wants to get information about the next game.
<User’s state of mind and interests>He overslept and is pressed for time because.He is encouraging a friend who is going to have an interview.He is interested in noodles.
<User’s state of mind and interests>He is tired because he has had many things to do.He will be busy the next day.
Yesterday’s soccer game was exciting. We cannot miss the next game.When will the next game be played?
I woke up late.Gook luck with your interviewI’m going to eat noodles.
I am tired because I’ve had many things to do since the morning.I will be busy tomorrow, too.
ex1
ex2
ex3
<User’s state of mind and interests>He is sad and very tired.
I want to return home. (´・ω・`)I feel sleepy because I ate too much fried chicken. (;´Д`)
ex4
The Japanese team don’t seemto be able to score.
The Japanese team don’t seem tobe able to score.
(a) Anger (b) Sorrow
pictographic characters and emoticons contained in emails exchanged using a mobile phone. We have chosen to focus on music because user's feeling is the major factor in the selection of music. We have chosen to use the "number of chords", "sound strength", and "melody pattern" as music elements that characterize a piece of music. Based on these elements, we define the relationship between a piece of music and a user’s feeling. We also propose a method of searching for an appropriate piece of music. Section 2 presents the information delivery system assumed, and the service it provides. This system and service information has been used to identify research topics. Section 3 proposes solutions for these topics. Section 4 describes the prototype system developed to evaluate the proposed algorithm, the experiments conducted and the evaluation results. It also describes the evaluation of the algorithm by having a group of students use the system, and the evaluation of the music selection method. Finally, Section 5 presents the conclusions and issues for future study. 2. Content delivery system that involves
the analysis of mobile phone emails
This section describes examples of email that reveal the user’s state of mind and interests, and example of use of the information content delivery service. Then, the research topics are addressed.
2.1. Emails containing pictographic characters
and emoticons to express interests and state of minds
The words and pictographic characters and
emoticons in emails reveal the user’s interests and preferences, and the user’s expressions (choice of words) and types of pictographic characters and emoticons reveal the user’s current state of mind and the extent of the user’s fatigue. An example of an email that reveals the current state of mind and interests is shown in Figure 1. The idea, “The Japanese team don’t seem to be able to score”, can be expressed in different ways, as shown by the two emails in Figure 2. Email (a) shows that the user is irritated while Email (b) shows that the user is discouraged. So, the same sentence can covey a different state of mind depending on the pictographic character used.
Figure 1. Examples of email that reveal the
user’s state of mind and interests
Figure 2. The same sentence can convey a
different state of mind.
2.2. Content delivery system
With this system, we aim to determine the user’s interests, preferences, and the extent of his or her fatigue by consecutively analyzing emails containing pictographic characters that he or she exchanges daily with friends and family members, and to deliver content that is appropriate for his or her interests and current state of mind. An example of potential use of the service to be provided by this system is shown in Figure 3. The service proceeds as follows:
1) The user exchanges emails with friends as usual. 2) An application extracts and analyzes words,
pictographic characters and emoticons contained in these emails.
3) The application determines the user’s interests and current state of mind and saves that data in the mobile phone.
4) When the user wants to receive content appropriate for his or her interests and state of mind,
38
International Journal On Advances in Telecommunications, vol 2 no 1, year 2009, http://www.iariajournals.org/telecommunications/

the analysis result in 3) is sent to his or her TV (which relays the result to the delivery server).
5) The delivery server delivers content appropriate for the user.
2.3. Research topics (1) Classify and characterize pictographic characters and emoticons.
In order to allow the deduction of the users’ interests and state of mind from the pictographic characters and emoticons used in his or her emails, it is necessary to determine the deeper meaning that each pictographic character and emoticon conveys [12]. (2) Establish an algorithm to determine the user’s interests and state of mind.
It is necessary to establish an algorithm to determine the user’s interests and state of mind from the words, pictographic characters and emoticons contained in his or her email. (3) Establish an algorithm to determine the appropriate content to be delivered.
It is necessary to establish an algorithm for selecting the content appropriate for the user, based on his or her interests, preferences and state of mind, which have been deduced from his or her email. 3. Proposed algorithms
This section describes our solutions to topics (1) (2) and (3) identified in Section 2.3.
3.1. Algorithm for determining interests and preferences
Figure 4 shows the algorithm for determining
interests and preferences from words, pictographic characters and emoticons contained in an email, and for deducing the state of mind and extent of fatigue from the expressions, pictographic characters and emoticons used.
The interests and preferences are deduced from words that indicate interests, such as baseball and tennis, and pictographic characters that indicate interests, such as and , and also from past analysis results. Similarly, the state of mind and extent of fatigue are deduced from expressions used (choice of words), the percentage of pictographic characters and emoticons used in email text, and the types of pictographic characters and emoticons used. It can be assumed that a person in a poor state of mind tends to use plain or blunt expressions, that a person in a better mood tends to use pictographic character and emoticons more often, and that a person uses different types of pictographic character and emoticon depending on his or her state of mind. To confirm these assumed tendencies, we conducted a questionnaire survey with nine frequent users of email. More than half of the respondents said that they use more pictographic characters and emoticons when they are in a better mood, and almost all of them said that the pictographic characters and emoticons they choose reflect their state of mind.
We propose the algorithm for deducing the state of mind and extent of fatigue from pictographic characters and emoticons shown in Figure 4.
Figure 3. Example of use of the information content delivery service
Today’s movie was interesting.Let’s see an action movie next time.
My PC seems to be in trouble.What happened?
Extracted wordsFrom 1st email:
・movie・action movie
From 2nd email:・PC
Extracted pictographic characters and emoticonsFrom 1st email:
・From 2nd email:
・From 3rd email:・ (´・ω・`)(;´Д`)
It is determined that the user is “interested in action movies and slightly dejected, sad, tired.”
Save
Send emails
Send info about interest and state of mind
Deliver a movie or a music
I want to return home. (´・ω・`)I feel sleepy because I ate too much fried chicken. (;´Д`)
39
International Journal On Advances in Telecommunications, vol 2 no 1, year 2009, http://www.iariajournals.org/telecommunications/

3.2. Algorithm for deducing the state of mind from pictographic characters and emoticons
In this paper, we focus on the pictographic
characters offered in NTT DoCoMo’s [13] mobile phone service and emoticons, including 2-byte characters. Today, more than 200 pictographic characters and more than 1000 emoticons are used. In order to narrow down the list and select only those pictographic characters and emoticons useful for deducing the state of mind, we classified and characterized them in the following sequence of steps.
3.2.1. Selection and classification of pictographic characters and emoticons. We selected 43 pictographic characters that were found to express facial expressions and feelings. From among frequently used emoticons pre-installed in mobile phones and other emoticons, including 2-byte characters, we selected 64 emoticon that were found to indicate feelings clearly. 3.2.2. Classification of state-of-mind elements and weighting factors. We selected six state-of-mind elements: happy, angry, sad, optimistic, tired and affectionate. The newly selected element, “affectionate”, is usually not relevant to the selection of an item of content, but is used only when its value is extremely high or extremely low. Since one pictographic character or emoticon can convey a variety of feelings, each is defined as a combination of vector values of several state-of-mind elements. The
vector value of each element ranges from 0 to 5. For example, for one pictographic character “”, a vector value 5 may be assigned to “happy”, 0 to “angry”, 0 to “sad”, 3 to “optimistic”, 0 to “tired”, and 2 to “affectionate”.
We conducted a questionnaire survey with 36 students (29 males and 7 females) in our university to validate our selection of the six state-of-mind elements, and to determine the vector values of each pictographic character. We asked the students to select the states of mind that are associated with each pictographic character or emoticon. The distribution of state-of-mind elements for each pictographic character is shown in Figure 5. The value of each state-of-mind vector was normalized by dividing the total votes in the survey by the number of respondents, and multiplying the result by 50. The one decimal place of this value was rounded off. A small number of respondents suggested the inclusion of “surprised” and “worried” as possible state-of-mind elements, but most claimed that the six states-of-mind elements were appropriate and sufficient for mapping the pictographic characters and emoticons. Examples of vector values for some pictographic characters are shown in Table 1.
With some pictographic characters, a few students associated states of mind that are quite different from, or even opposite to, those of other students. The differences were particularly pronounced between male and female students. However, the majority gave consistent associations between pictographic characters and emoticons and states of mind.
Figure 4. Algorithm for determining interests and preferences
Words
Words, such as baseball and tennis, used in email text
The words indicate interests or the current state.
Expressions
Choice of words in email text
Choice of words reflects the current state of mind.
Pictographic characters
“” means golf.“” means soccer, etc.
Some pictographic characters directly indicate interests.
Total of scores of pictographic characters and emoticons
A score is assigned in advance to each pictographic character and emoticon that is likely to indicate state of mind, and the scores of the pictographic characters and emoticons contained in an email are totaled.
The better the state of mind, the higher is the total.
Number of pictographic characters and emoticons
The number and percentage of pictographic characters and emoticons in an email
The user tend to use more pictographic characters and emoticons when he or she is in a good state of mind
Determine interests and preferences
Determine state of mind and extent of fatigue
Weighted total Weighted totalResults of previous analyses
40
International Journal On Advances in Telecommunications, vol 2 no 1, year 2009, http://www.iariajournals.org/telecommunications/

Table 1. Example of state-of-mind vectors of individual value
3.2.3. Use the regular expression for searching. In order to find emoticons efficiently, we chose to use pattern matching of character strings in an email. A new emoticon is often created by adding a character(s) to an existing emoticon. For example, the emoticon (^o^) (smiling face) is expanded to \ (^o^)/ or v(^o^)v. If the regular expression is used, a pattern matching operation can find not only (^o^) but also \(^o^)/ and v(^o^)v. Since the meanings of these derivatives are not so different from the original emoticon, this search method is effective in finding emoticons that have been created by adding parts to an existing emoticon. 3.2.4. Algorithm for determining states of mind from pictographic characters and emoticons. We assume that the state of mind of a person can be expressed by a finite number of state-of-mind elements.
Therefore, we express the state of mind using k-dimensional vectors.
Suppose there are m pictographic characters and emoticons in an email text, M. Then, the state-of-mind vector ε(pi) of an individual pictographic character or emoticon pi can be expressed as:
Where eji indicates the intensity of the specific state-of-mind element. The state-of-mind vector that can be deduced from the pictographic characters used is defined as:
ωp is a weighting factor. It reflects such factors as the ratio of the number of pictographic characters to the number of emoticons or the ratio of the number of males to the number of females.
The algorithm for calculating the state-of-mind vector F(M) is as follows. Note that the state-of-mind vector of each pictographic character or emoticon (such as the one in Table 1) is pre-registered in the database.
Step 1: Extract a pictographic character or emoticon pi by analyzing the mail text.
Step 2: Find the state-of-mind vector values for each of m pictographic characters and emoticons pi in the database.
∑=
=m
iip p
mMF
1
)(1)( εωrr
)1,()()( 1 miMpep ikjjii ≤≤∈= ≤≤ εr
Figure 5. Result of questionnaire survey on the relationship between pictographic characters, emoticons and states of mind
0 % 20% 40 % 60 % 8 0% 100 %
Happy Angry Sad Optim ist ic Tired Affectiona teΣ ( ̄ □  ̄ ;)
(´・ω ・` )
(T _T )
(> _< )
(`・ ω ・´ )
( ̄ ^ ̄ )
(*^-^ )b
(≧ ∇ ≦ )
(*^-^*)
(^ o^ )
State of mindelements
Characters
5 0 0 3 0 2 3 0 0 2 0 5
(^-^) 5 0 0 2 0 3(>_<) 2 0 5 1 3 2
Happy Angry Sad Optimistic Tired Affectionate
41
International Journal On Advances in Telecommunications, vol 2 no 1, year 2009, http://www.iariajournals.org/telecommunications/

Step 3: Obtain F(M) by calculating the average vector value of each state-of-mind element for m pictographic characters and emoticons.
3.3. Composition of the music database and
database search method
In order to determine the music type (number of chords, sound strength, and melody pattern) that the
user is likely to want to hear at present, we analyze the state-of-mind elements. We have developed an algorithm for a music search and delivery system.
We created 12 MIDI (Musical Instrument Digital Interface) files in different music categories with different chord patterns. We investigated the relationship between music types and the states of mind with 24 students. We asked them to write ○ when the music type they heard matched their state of
Table 2. Related data base of rhythm and state of mind
Chord Ratio Volume Melody Happy Angry Sad Optimistic Tired AffectionateMusic 1 Blues B♭major B♭7 6.0
E♭7 3.0Cm7 1.5F7 1.5Edim 1.0
Music 2 Bop E♭major B♭m7 1.0Cm7 1.0
Music 3 Country Cmajor F 1.0G 1.0Em 1.0Am7 1.0
Music 4 Pops Cmajor F Bb 1.0Fmajor G C 1.0
Em Am 1.0Am7 Dm 1.0
Music 5 Classic D♭major D#m 7.0C# 2.0B 5.0D#sus4 4.0G#m 1.0C#sus4 1.0
Music 6 R&B Cmajor7 CM7 1.0C6 1.0Dm7 1.0Dm6 1.0
Music 7 Rock Cmajor7 FM7 1.0G 1.0Em 1.0G9 1.0
Music 8 Latin Cmajor7 CM7 2.0Dm7 1.0D♭M7 1.0
Music 9 Jazz samba Emajor D 1.0E 1.0F#m 0.8G#m(♭5) 0.5A 2.8Bm 1.8A#aug 1.0
Music 10 Ballad Cmajor A7sus4 2.5D9 1.5
Music 11 Techno Aminor DM7 1.0E6 1.0
Music 12 Rock Dmajor D 5.0G 4.0A 2.0Bm 1.0
passing toneLarge
Small passing tone
Small passing tone
passing toneLarge
auxiliary toneLarge
passing toneLarge
auxiliary toneSmall
auxiliary toneSmall
auxiliary toneSmall
auxiliary toneSmall
auxiliary toneLarge
-0.6 -0.6 0.4 0.2 -0.4 -0.6
-0.6 -0.4 2.5 0.4
-0.4 0.2
-1.0 0.6
1.7 -1.7 -1.9 3.3
2.5 1.7
2.9 -1.3 -0.4 1.5
0.6 0.8
2.7 -1.7
0.8 -1.3 1.3 1.0
-0.8 2.3
3.1 0.0 1.3 1.7
-0.2 1.0
1.0 1.7
3.02.0
1.7 -0.4 -1.7
-0.2 -0.4 1.7 1.9 0.61.0
0.8 -1.7 -0.4
Category Key Rhythm
4.4 0.2 1.0
auxiliary toneLarge 0.02.0-1.02.01.0-3.0
4.0-2.00.01.0
State of mind
2.9 -2.3 -1.7
42
International Journal On Advances in Telecommunications, vol 2 no 1, year 2009, http://www.iariajournals.org/telecommunications/

mind, × when they did not match, and nothing (space) when neither of them was true. If ○, 1 is added to the value. If × , 1 is subtracted from it. If nothing, no operation was made. The state-of-mind value was calculated by dividing the total by the number of people, and multiplying it by 5. The results for each music type are shown in Table 2.
We created music metadata that consists of music title, category, key, chord, and state-of-mind elements. Music type data was extracted from each MIDI file. The state-of-mind data was obtained by searching the basic element database. The process of deriving state-of-mind element data from a MIDI file (MUi) is as follows. Step 1: Extract the number of chords, volume, and
melody pattern from the MIDI (MUi) file. Step 2: Compare these with data in the basic element
database (Table 2), and determine the music type that best matches the extracted data.
Step 3: Obtain the state of mind element values from the matched music type, and register them as the state of mind values of MUi.
Step 4: Repeat steps 1 to 3 for MU0 to MUj. Build a music database for each of MU0 to MUj.
Step 5: Compare the user’s actual feeling data with the feeling element data in the music database, and determine that music that best match each other.
4. Development of a prototype system and
evaluation
This section describes our prototype system to evaluate the proposed methods and the experimental results also.
4.1. Prototype evaluation system
We implemented the state-of-mind deducing algorithm and the state-of-mind element database for the proposed pictographic characters and emoticons on a PC. In order to collect sample mails and evaluate the algorithm, we built a website with an input form written in JavaScript. The form enabled the user to input his or her personal information, such as name, gender, age, and the prefecture in which he or she had been brought up, as well as mail sentences and his or her subjective feeling values. We used a set of "i-pictographic characters [14]" for the input of pictographic characters, and a piece of free software called "Emoticon Helper Mini [15]" for the input of emoticons. The prototype software was written in Perl. The state-of-mind database was built using MySQL. We registered the state-of-mind elements and scores of 43 pictographic characters and 64 emoticons in the database. Figure 6 shows the configuration of the prototype system. The system operates as follows.
Step 1: The user inputs an email that contains pictographic characters and emoticons using the input form. The user also inputs his or her subjectivity values.
Step 2: Extract pictographic characters and emoticons that express user's feelings from the email text.
Step 3: Access the MySQL database to extract the score of each state-of-mind element of the pictographic characters and emoticons.
Step 4: Calculate the state-of-mind element score, and deduce the state of mind. Identify the three strongest emotions in each state of mind.
Step 5: Save the email text and the deduction result in text form.
Figure 6. Block diagram of the system and programs developed
Windows
HTML input formin JavaScript
Input tools of pictographic characters
and emoticons
Main programsof algorithm
(Perl)
MySQL database of pictographic characters
and emoticons
Deduction result(Perl)
Input data andstate-of-mind
deduction result
:Developed programs
IE displayInput
Text preservation
Inquiry
ReadReturn
Display
①
②
③④
⑤
⑥
43
International Journal On Advances in Telecommunications, vol 2 no 1, year 2009, http://www.iariajournals.org/telecommunications/

Step 6: Display the extracted pictographic characters and emoticons, the user's subjectivity feeling value, and the state-of-mind deduction result.
4.2. Evaluation
We collected one sample mail from each of 64
students (43 males and 21 females) by using a prototype system. We calculated the state-of-mind value of each person and compared it with each person's subjective feeling value. Using this result, we excluded the item of data with the highest state-of-mind value and the item of data with the lowest value, leaving 62 items of data for evaluation.
Figure 7. Correlation between the subjective value and the evaluation value (Note:◆Male ■Female)
Happy
0
1
2
3
4
5
0 1 2 3 4 5
Subjective value
Eva
luat
ion v
alue
Angry
0
1
2
3
4
5
0 1 2 3 4 5
Subjective value
Eva
luat
ion v
alue
Sad
0
1
2
3
4
5
0 1 2 3 4 5
Subjective value
Eva
luat
ion v
alue
Tired
0
1
2
3
4
5
0 1 2 3 4 5
Subjective value
Eva
luat
ion v
alue
Affectionate
0
1
2
3
4
5
0 1 2 3 4 5
Subjective value
Eva
luat
ion v
alue
Optimistic
0
1
2
3
4
5
0 1 2 3 4 5
Subjective value
Eva
luat
ion v
alue
44
International Journal On Advances in Telecommunications, vol 2 no 1, year 2009, http://www.iariajournals.org/telecommunications/

The correlation between the calculated state-of-mind value and the subjective self-declared feeling value for each state-of-mind element is shown in Figure 7. The correlation for “angry” was the highest (the correlation coefficient = 0.66), and that for “affectionate” the lowest (the correlation coefficient = 0.34). The correlation coefficients for “happy”, “sad”, “optimistic” and “tired” were 0.53, 0.65, 0.35 and 0.49, respectively. The average was 0.5. These results were more or less what we had expected. The definitions of "optimistic" and "affectionate" were vague and differed between genders and between individuals. The definitions of these states of mind made by the students may have been different from what we had in mind, and this fact would explain the low correlation for “anger” and “affectionate”. Overall, the correlation coefficients of the female students were lower than those of male students. This is probably because there were more male students than female students among our subjects.
Figure 8 shows the statistics of the correlation between subjective feeling values and calculated values of all state-of-mind elements. The average
correlation coefficient value for males and females were 0.63 and 0.57, respectively, and the overall average was 0.61, which is sufficiently high.
We evaluated whether an appropriate item of music can be selected from the state-of-mind values by referring to the music database. We selected three students (two males and one female) who recorded a h igh correlation value. Specifically, w e compared the strong state of mind obtained from the deduction result with data in the database shown in Table 2, and selected three pieces of music. We checked whether the pieces of music selected matched their feelings. We asked each student to write ◎ if the first piece matched their feeling, ○ if the second piece matched their feeling, △ if the third piece matched their feeling, and × if none of the three pieces matched their feeling. The results are shown in Table 3.
The piece number in Table 3 correspond to the piece number in Table 2. The piece encircled by ○ is the one that matched the subject’s feeling. The state-of-mind element to which the woman gave the highest value was "affectionate." However, since that value
Table 3. Evaluation of music recommendation method
Items Individual's Selected
Gender First element Second element Third element correlation coefficient piece of music
Male 1 Sad Tired Angry 0.705 3,12, 10 △
Male 2 Sad Tired Happy 0.828 10 ◎
Female Affectionate Happy Optimistic 0.975 4,1, 9 △
Strong state-of-mind element presumedEvaluation
Figure 8. Statistical graph of individual correlation value
-0.3
-0.1
0.1
0.3
0.5
0.7
0.9
1 6 11 16 21 26 31 36 41[Number
of samples]
[Correlationcoefficient]
Male Female
45
International Journal On Advances in Telecommunications, vol 2 no 1, year 2009, http://www.iariajournals.org/telecommunications/

was not pronounced, we selected pieces mostly from "happy" and "optimistic". We found that at least one of the three pieces selected matched the subject’s mood. Some answered that the second or the third piece best suited his or her mood. We find that the evaluation result was relatively good.
5. Conclusion and future work
We have proposed an algorithm for deducing the user’s state of mind from the pictographic characters and emoticons contained in emails, and evaluated its feasibility. We have studied the state-of-mind elements associated with pictographic characters and emoticons, and their weighting factors, and have introduced specific values for the weighting factors. We have studied the algorithms for extracting pictographic characters and emoticons from an email, and for deducing the user’s state of mind from the state-of-mind elements of the extracted pictographic characters and emoticons. We have developed a program that implements this algorithm, and a prototype evaluation system. Using this system, we have verified the effectiveness of the proposed algorithms.
We have also presented an algorithm for extracting the number of chords, volume and melody from a piece of music. We have identified the relationship between the user's state of mind and the music type he or she is likely to want to hear, and evaluated the relationship.
Future issues include the method of sending the obtained state-of-mind information to the delivery server, and the method of sending the appropriate content from the delivery server to the user. It is necessary to study how to automate the processes for determining and providing content appropriate for the user based on the obtained state-of-mind information. To sum up, future issues include the following: • Algorithm for deducing user’s state of mind from
multiple emails that the user has sent in the last few hours in order to take the immediate trend of the user’s state of mind into consideration.
• Algorithm for searching for and analyzing more types of emoticons and detailed parts of emoticons, such has eyes, mouth, cheek and hand.
• How to deduce changes in the user’s state of mind as the exchange of emails progresses.
• How to automate the processes for determining and providing content appropriate for the user, based on the obtained state-of-mind information.
• Algorithm for deducing more detailed state-of-mind data instead of a simply state-of-mind element value calculated by the system, in order to achieve a stronger linkage with the service of content delivery.
References [1] Kazumasa TAKAMI, Yoshikazu HONMA and
Shinichiro GOTO: “A method of deducing a user’s state of mind from an analysis of the pictographic characters used in mobile phone emails”, in proceedings of UBICOMM2007, pp.83-88, 4-9 November 2007.
[2] Gmail, http://mail.google.com/ [3] Ono, C., Motomura, Y. and Asoh, H., “Study of Movie
Recommendation System Considering Both Users' Personality and Situation”, IPSJ SIG Technical Report 2005-DPS-125, pp.79-84, 2005
[4] Kikuchi, T., Sakai, H., Sueda, Y. and Murakami, K., “Context-aware human-activity support based on activity affinity-level measuring method”, FIT 2003, pp.361-362, 2003.
[5] Mase, T. and Nakayama, Y., “Design and Implementation of Information Provision System Based on Position and User's Preference”, FIT 2004, pp.157-158, 2004.
[6] H. Yokono, “Categorizing model expressions of dialogue sentences for emotion presumption,” IPSJ SIG Technical Report 2005-NL-170, pp.1-6, 2005.
[7] T. Kumamoto and K. Tanaka, “Extracting Feelings from Newspaper Accounts on the Web,” IPSJ SIG Technical Report 2005-NL-165, pp.15-20, 2005.
[8] Nakayama, N., Eguchi, K. and Kando, N., A Proposal for Extraction of Emotional Expression, IPSJ SIG Technical Report 2004-NL-164, pp.13-18, 2004.
[9] Telecommunications Carriers Association, Number of contracts according to entrepreneur, http://www.tca.or.jp/japan/database/daisu/yymm/0803matu.html
[10] Workshop on the Fortune-telling with Pictograph, “The Fortune-telling with Pictograph”, JIMOS(2005, in Japanese).
[11] Shimizu, Y. and Akama, H., Various Meanings of Mobile Icons - Their Understandability Depending on Semantic Categories -, Proceedings of the 2005 Spring Conference of JSKE, pp.70-73, 2005.
[12] H. Cho, R. Inaba and T. Ishida, “Semantics in Pictogram Communication,” IPSJ SIG Technical Report 2006-ICS-145, 2006/10/25.
[13] NTT DoCoMo, http://www.nttdocomo.co.jp/service/imode/make/content/pictograph/index.html
[14] i_pictographic characters Ver.1.21, http://www.nttdocomo.co.jp/service/imode/make/content/pictograph/tool.
[15] Emoticon helper mini Ver.2.01, http://www.vector.co.jp/soft/dl/win95/writing/se102620.html
46
International Journal On Advances in Telecommunications, vol 2 no 1, year 2009, http://www.iariajournals.org/telecommunications/

System of Development Patterns in Service-Oriented Software
Jaroslav Kral and Michal ZemlickaCharles University, Faculty of Mathematics and Physics
Department of Software EngineeringMalostranske nam. 25, 118 00 Praha 1, Czech Republic
[email protected], [email protected]
Abstract
Service orientation is the leading paradigm of contem-porary software. Each paradigm has specific practices anda specific set of design and development paradigms. Forservice orientation it holds too. We show that service ori-entation is a quite complex trend: There are several typesof service-oriented architectures (SOA). The various SOAtypes may have different domain of application, differentpatterns and antipatterns, they can use different model-ing and development techniques. Proper selection of SOAtype can be a crucial task significantly influencing likeli-hood of project success. The applicability of individualSOA variants depends on requirements and on general busi-ness circumstances like staff knowledge, planned businessalliances, and the need to reuse existing software. The pro-per selection of a SOA variant is an important pattern oftenmade by the way. It is important that some patterns can de-pend on the effects of the other ones. Patterns should there-fore be orchestrated. We discuss here mainly the patternsfor the variant of SOA called confederation where com-munication partners need not be looked for. Most impor-tant patterns for confederations are user (business) orientedservice interfaces, reuse of legacy systems and third-partyproducts, and the use of so-called architecture services.Architecture services can serve as message transformers,heads of composite services, process managers, and inte-gration constructs for the integration in the large. All ar-chitecture services discussed in this paper can be viewed asinstances of one generalized concept from Petri nets.
keywords SOA types, SOA development patterns, user-oriented service interfaces, generalized Petri place, specifi-cation patterns, easy prototyping, interdependency of pat-terns.
1. Introduction
Service orientation is a paradigm having many aspects.It is manifested by the fact that the notions ”service orien-tation” and ”service-oriented architecture” are overloaded.Different people may assign different meanings to these no-tions. Although there are multitudinous meanings, we willfocus only on a few – probably the ones being most impor-tant in practice. We shall discuss the variant of SOA beinga virtual peer-to-peer network of peers behaving like real-world (human) services. It means that any service can offercapabilities as well as it can require them.
There are several variants of such SOA. They differ inthe degree of autonomy of peers and their ”size”.
Various SOA variants have different structure of the col-lection of patterns they use. The selection of the patternsdepends on the ”importance” of individual patterns. It candepend on the immediate technical effects of the patterns aswell as on the business circumstances and plans like the useof third-party products, legacy systems, etc.
Some patterns can be blocked by business politics andbusiness conditions like market alliances or the level of stafftraining. In this case it is good to know the possible lossescaused by the rejection of a given pattern.
Some patterns are a precondition of the applicability ofsome other patterns. The most important case is the patternbuilding service interfaces so that they are ”usable” or user-oriented. It enables/implies the pattern ”coarse-grained in-terfaces” and prototyping via redirecting the destination ofmessages. Such a pattern is not generally known yet. Thedevelopment of the collection of patterns cannot be any one-step process. This fact is often neglected.
Business needs and practical experiences led to an im-portant change in the use of SOA-related communicationprotocol – SOAP (Simple Object Access Protocol, [34]).The shift is characterized by the increasing use of SOAPdocument-literal (SOAP-D) and decreasing use of SOAP-RPC (Remote Procedure Call) protocols [6]. In other wordsSOAP is now used as a XML-document carrying tool. Note
47
International Journal On Advances in Telecommunications, vol 2 no 1, year 2009, http://www.iariajournals.org/telecommunications/

the documents can be semantically rich and well understoodby users. It is, they can be usable. Usability is no matter ofchoice now. It has substantial consequences for the applica-bility of some powerful development techniques discussedbelow. Such effects are not generally known.
We discuss SOA patterns according their importance forthe project success.
The structure of the paper is the following: A variant ofSOA called Confederation is specified. It is shown that it ispreferable to use in confederations the services of two types:application services having coarse-grained user-oriented in-terfaces and architecture (integration) services facilitatingintegration of other services. Several variants of the archi-tecture services are presented. It is shown that all the vari-ants are instances of one concept called Generalized PetriPlace. It is shown that architecture services can be used toprovide user-oriented interfaces or to support powerful pro-totyping. It is also possible to use architecture services tocompose other services and processes. It is discussed howservice orientation influences the specification patterns.
2. Choice of SOA Type
Crucial service oriented (SO) pattern is the choice of aproper variant of SOA. It should follow just after the deci-sion whether SOA will be applied or not. We must – usingthe system environment – apply the variant of SOA best ful-filling the requirements. The type of SOA implies what fur-ther patterns are applicable, e.g., whether ESB (EnterpriseService Bus [5]) is good for the given system.
The concept of service orientation is in this paper prag-matically understood in the following way (see [23] formore exact definition1): A software system is service-oriented if it is a (virtual) peer-to-peer (p2p) network ofloosely related (autonomous) components called services.The services somewhat behave like the services of realworld. For example they are permanently ready to accept arequest to do something. They can communicate with eachother. Technically they communicate primarily by asyn-chronous message exchanges; synchronous communicationcan be an option. We can then say that such a system has aservice-oriented architecture (SOA).
Service-oriented systems can have different architecturedetails depending on main goals of the systems and contextsin which the systems are used. Typical cases are:
1. e-commerce;
2. e-government, health-care systems, etc.;
1We, however, believe that this definition is too complicated and, maybe, too restricting for applications of service orientation in some areas, e.g.,in small or middle-sized enterprises, or in process control (i.e., real-timesystems).
3. small and middle-sized enterprises;
4. large enterprises, especially global decentralized orga-nizations;
5. process control systems (soft real-time systems, somehard real-time systems);
6. systems logically having some features of SOA:
(a) distributed applications being logical monolithsnot allowing to apply full SOA. Common fea-ture: communicating autonomous software com-ponents.
(b) batch systems – autonomous software systemscommunicating offline or applying bulk datacommunication.
The autonomy of components is strongest in e-commercesystems and typically weakest in process control systems.In the cases 2, 3, and 4 the systems are formed by a core net-work of not too large number of services providing the basiccapabilities of the systems (e.g., the services being wrappedinformation systems of individual offices of a state adminis-tration) and ”peripheral” services providing e.g., portals onweb.
SOA in large enterprises can consume large resources– money, people, and so on. There usually are powerfulsupervising authorities. The developed services formingthe SOA are therefore in fact in large enterprises less au-tonomous than in small or medium firms. Large enterprisescan moreover afford to develop the system from scratch orbuy system like ESB and train people to use the new system.
Service-oriented systems integrate legacy systems, third-party products, and newly developed software artifacts. It isoften required (see below) that the services have interfacesmirroring the languages of user knowledge domains. It isthe main reason why SOAP-message literal is widely used.
In the case of the process control systems the systemneed not be open, the messages can have therefore formatsbased on remote procedure call (RPC) and middleware canbe a proprietary one (e.g., based on system bus and primi-tives provided by operation systems).
2.1. Web Services
This version of service orientation endorsed by W3 Con-sortium focuses on web-oriented standards. These standard-s concern many aspects of service development and use.
The main idea is that the individual services should bestrictly standardized to be able to communicate (or serve)to anyone (any other service) in the web world. The com-puterization should go so far that selection of cooperationpartners can be done by services themselves.
48
International Journal On Advances in Telecommunications, vol 2 no 1, year 2009, http://www.iariajournals.org/telecommunications/

It is very promising. But there is also an opposite side ofthe solution: Implementation of all the standards (that arevery complicated and moreover changing) is very compli-cated and can be reasonably done by quite large teams only.
There are several further issues with SOA based on webservices. Web services must use universally applicable stan-dards and such standards are difficult to be used properly by(human) users unless the use is based on libraries providedby large software vendors. But it leads to a dangerous situ-ation called Vendor Lock-In Antipattern [4]. The standardslike SOAP [34] and SOAP-related solutions tend to supportthe point-to-point communication rather than more compli-cated communication protocols and have a limited power tosupport orchestration of the services.
Web services seem to be the best solution for SOA sys-tems like business-to-customer (B2C) e-commerce wherecommunication partners must be looked for at the start ofthe cooperation. We call such systems alliances [18] forshort.
The standardization of the semantics of communicationmessages is easier if the communication protocol is SOAP-RPC-based. It is a quite common practice that communica-tion partners know each other permanently so the partnersneed not be looked for. In this case it is better to use a com-munication protocol based on exchange of documents as itenables the use of user-oriented interfaces discussed below.It is due to the fact that the documents can have syntax andsemantics close to the language and knowledge domain ofusers. Such messages can be designed to be well understoodby users. We say that they are user oriented or user friend-ly. It has many desirable consequences (compare e.g., [6]).An issue is that the semantics of the messages cannot be atpresent fully standardized and almost proprietary solutionsmust be invented. The above mentioned shift to document-based communication is an indication that confederationsdeserve substantial focus.
2.2. Software Confederations and SoftwareUnions
Software confederation is a peer-to-peer network ofloosely coupled services knowing each other. The commu-nication between the services can be (and practice usuallyis) the high-level (declarative and coarse-grained) one. Itmakes sense to use semi-proprietary communication pro-tocols like SOAP-D similar to inter-human communicationspecific for given problem domain. If the communication isSOAP-D-based, the documents should be in XML dialects.
Many existing service-oriented systems are confedera-tions. Examples are information systems (ERP – Enter-prise Resource Planning) of decentralized enterprises, ad-vanced forms of CRM (Customer Relationship Manage-ment, [7]) and SCM (Supply Chain Management, [22]),
e-government, health-care systems, etc. The principle touse user-oriented messages and user-oriented interfaces isprobably the most important design and development pat-tern in certain SOA types. We call it User-Oriented Inter-faces (UOI).
User-oriented interfaces have the following advantages.They are:
1. stable (rarely modified),
2. declarative (hiding implementation details),
3. good for agile development,
4. enabling easy integration of legacy systems and agilebusiness processes
5. enabling easy implementation of screen prototypes,
6. improving system usability.
The main disadvantage of user-oriented interfaces is thatthey are usually not well standardized.
UOI is therefore a crucial SO pattern (a good practice,see [11] for definition). UOI covers functions like Facade2
[11], but it substantially changes the properties of the sys-tem as a whole. Neglecting the use of UOI is itself anSO antipattern (a practice having usually undesired conse-quences; see [4] for definition). It is especially dangerous aspeople having object-oriented skills usually (according ourlong-time experience) do not see the prospects and opportu-nities of UOI. It is the SO antipattern ”Well, What’s New?”from [3].
The use of UOI is especially easy and desirable in con-federations having a small number of highly autonomouscore services. It is the case when legacy systems or third-party products are used. A good example is e-government,SOA-based information systems of small enterprises andmunicipal offices. We call such systems having such pro-perties unions.
Unions are now frequently used by software vendors in-tegrating large software artifacts being open source, legacysystems, third-party products, web services, and newly de-veloped components.
3. User-Oriented Interfaces
The requirement that systems should have user-oriented(usable) interfaces implies that the interfaces of the servicesforming SOA must have specific property – they must beuser-oriented (usable) as well. It is typical for the imple-mentation of agile business processes (see below).
2Roughly speaking Facade is in object-oriented world an object pro-viding common uniform interface to several other objects.
49
International Journal On Advances in Telecommunications, vol 2 no 1, year 2009, http://www.iariajournals.org/telecommunications/

SOA, if used properly, is the first broadly used softwaredevelopment philosophy allowing a seamless integration ofexisting software system into new aggregates. It allowsexisting systems to be reused and it is not difficult to seethat it is the only way to build information system of e-government [17] as well as the systems supporting globalenterprises, health-care systems, and others. The resultingaggregates are typically confederations.
Let us discuss the case of e-government in details: Thesystem of e-government must be as a rule constructed as anintegration (interconnection) of the information systems ofautonomous offices. The systems must be integrated withtheir local interfaces and without any substantial change oftheir already existing functions. The only feasible way ofachieving it is to connect the systems to a middleware (inthis case usually web – either Internet or a private network)enabling the communication between the systems. Businessprocesses are in e-government called admministrative pro-cesses. Technically the admministrative processes do notdiffer from usual business processes.
The construction of the systems in such way has frommanagerial point of view substantial advantages – it allowssaving of immense investments into existing (legacy) soft-ware. The proposed solution of the integration of the com-ponents (e.g., information systems) can be implemented al-most unnoticeably by their existing local users. It saves in-vestments into training and the expenses and loses causedby errors of end users during their adaptation to a new sys-tem. The resulting system tends to be a confederation, usu-ally a union.
The service-oriented architecture is then a principle al-lowing the integration of software artifacts providing basiccapabilities. They are often wrapped applications. We shallcall them application services. The integration can be sup-ported by architecture services discussed below. This atti-tude is a crucial SOA pattern.
Application services provide basic user domain capabil-ities. Application services integrated into a service-orientedsystem must be usually designed so that they can be easilyused in business processes. The business processes must beagile – they should allow on-line users’ involvement to beable to react to emergency situations. The users should beresponsible for the business consequences of the processes.It is difficult to achieve if the interfaces are not user orien-ted.
User-oriented interface is as a rule coarse-grained andrather declarative, i.e., specifying rather what to do some-thing than how to do it. It brings a pleasant benefit – thereduction of the load of the communication channels. Ap-plication services must and should be integrated as blackboxes (like in e-government).
User-oriented interfaces of application services must beas a rule developed in close cooperation of developers and
users. The system documentation can consist of the inter-faces of application services only. It indicates that duringthe development of such systems many features of agile de-sign and development of software systems can and shouldbe used. At the same time SO enables the use of agile prin-ciples in the development of quite large systems [21]. It istypical for unions.
A very important advantage of user-oriented interfacesis that they mimic the interfaces of real-world services. Theinterfaces of real world services are often successfully usedfor a long time; some of them for decades and some even forcenturies. Such real-world inspired service interfaces havea good chance, if formalized properly, not to be modifiedfrequently. User-oriented interfaces enhance the usability[26] of the application services and also the usability of theentire system. Application services (e.g., legacy systems)are usually integrated together with their already existinglocal user interfaces. THe concept of usability of interfacesshould be applied inside the system. It is not easy for ITexperts to accept it as they must be able to be a bit skilledin user problem domain. Usability is advantageous for re-quirements specifications as well as for the agile softwaredevelopment processes.
4. Service Roles
Crucial property of services in SOA is that they all havetechnically the same properties. It is, they are all peers ofa virtual peer-to-peer network. In confederations, however,using a logical view we need services providing functionssupporting the integration of the application services. Theservices can provide the capabilities of Enterprise ServiceBus or enhance them. They can provide broker services.
It can happen that the current interfaces of an applica-tion service are not user oriented, see the antipattern ChattyServices from [3]. Chatty services require many ”tiny” mes-sages per one meaningful action in the sense of users. Theantipattern Chatty Services can be refactored (avoided) bythe use of specific services called front-end gates (FEG).FEG is a service transforming user-oriented semanticallyrich messages produced by users or other services into se-ries of fine-grained (implementation-oriented) messages re-quired by the interface of a given application service andvice versa.
Front-end gate is one of the so called architecture ser-vices being the units facilitating the construction of service-oriented architectures. The existence of architecture ser-vices is an important feature of service-oriented philosophy.It can be viewed as a development as well as design pattern.Application services are often legacy systems. The pat-tern ”Integration of Legacy Systems” is an important SOApattern. It is, however, similar to the object-oriented an-tipattern Legacy Systems [4]. It is an indication that the
50
International Journal On Advances in Telecommunications, vol 2 no 1, year 2009, http://www.iariajournals.org/telecommunications/

service-oriented philosophy is substantially different fromthe object-oriented one. FEG provides capabilities similarto Facade or Proxy patterns known from [11] but it has sub-stantially different overall properties. FEG3 is more an ar-chitecture pattern than a design pattern. For details see thesection Generalized Petri Places below.
Application service is usually integrated as a black boxwhereas infrastructure services are usually newly developedand therefore integrated as white boxes.
To summarize the services in software confederationscan of two basic types:
1. Application services (typically wrapped legacy sys-tems or third-party products) providing basic capabili-ties (operations) of the system can be legacy systems,third-party products, or newly developed systems.
2. Architecture (or infrastructure) services supportingthe integration of application services into a service-oriented system. (Note that the term ”infrastructureservice” has here the meaning different from the mean-ing used in ITIL methodology [14, 15], so we will notuse it.) Besides the front-end gates we shall discuss thefollowing architecture services: portals, data store ser-vices, process managers, screen prototypes, and gener-alized Petri places. All the services can be developedusing very similar techniques and tools.
The acceptance of the concept of architecture services iscrucial for the applicability of the patterns discussed below.The architecture services should be applied in all contextsexcept alliances and process control systems.
4.1. Architecture Services
Architecture services provide capabilities enabling vari-ous forms of integration of application services. The capa-bilities include enhancement of services interfaces and com-munication protocols, business process control services, orservices acting as routers.
The use of architecture services is a very important de-velopment and design pattern of (confederative) service-oriented systems. It is possible that this principle can besuccessfully used in some alliances too.
Front-End Gates
If we want to reuse legacy systems or simply applicationsin SOA, the first issue to be solved is the reconstruction oftheir interfaces. The original interfaces are usually too fine-grained, disclosing implementation details, and often too
3FEG is a software service working as an interface adapter. It is there-fore similar to the concept ”service adapter” but its philosophy has specificfeatures; see details below.
GAfine-grained
messages FEGcoarse-grained
messages Middleware
Figure 1. Connection of a front-end gate
GLS
GA
FEG
Middleware
PortalHTML2
¢A
g
Portal
XML
HTML
¢A
g
XML2FEG G LS1
¡¡FEG HHH
XML1
¢A
g
localinterface
Figure 2. Multiple front-end gates
developer oriented. A very flexible solution is based on thetechnique of front-end gates (service adapters). The front-end gates provide capabilities provided in object-orientedworld by object adapters (facade), proxies, and so on. Thecapabilities of front-end gates are, however, substantiallymore powerful than the ones offered by the object-orientedtechniques.
The interface of an application A can be provided bynone, one, or more front-end gates (FEG). A is accessibleonly through its FEG(s). FEG is a generalization of the con-cept of connectors in Enterprise Service Bus [30].
It is crucial that FEG is a peer of the virtual peer-to-peernetwork too. It is in fact an adapter service – compare objectadapters in object-oriented world.
The resulting service-oriented system then can have thelogical structure from Figure 2. Different FEG of a servicecan be used for different groups of its communication part-ners.
The development of FEG has a lot of common with thedevelopment of portals of the system as in both cases thetask is to develop an automaton transforming k-tuples of in-put messages into m-tuples of output messages and sendsthem to (distinguished) destination services. The destina-tion service consumes/processes them. We can use XSLT[33] or tools known for compiler construction for it. So wecan conclude that the interface of (application) services canalways be user-oriented, if necessary. The condition is thatthe software component providing services have properlydesigned ”boundaries”.
Data Store Services
Practical experience with SOA indicates that service-oriented systems must integrate batch systems and therefore
51
International Journal On Advances in Telecommunications, vol 2 no 1, year 2009, http://www.iariajournals.org/telecommunications/

services requiring an implementation of data stores on com-munication channels. Some parts of such systems have thenfeatures of functional decomposition. Another applicationof data stores is the support of sophisticated communica-tion protocols, sometimes more complex than the publish-subscribe one.
Data store services enable us to implement a part ofservice-oriented system in the way known from structureddesign – i.e., to apply main principles of functional decom-position. Note that functional decomposition is an object-oriented antipattern [4] but here it is an important patternenabling a seamless integration of batch applications.
Examples when data store services are needed:
• Business process control service (see Process Mana-ger service below) can use a data store to maintain andinterpret business process control data.
• Some algorithms are too complex to be executed on-line. The components implementing such algorithmsmust then work in batch mode and their results mustbe stored in a data store possibly implemented asa specialized data-oriented service. A good exam-ple is scheduling algorithms in manufacturing systems[19]. The manufacturing scheduling algorithms areperformed on enterprise level in batch mode as the al-gorithms are too complex to be started online. Theschedules must be sent to workshop level in bulk modeand then possibly modified by a workshop manager ordispatcher.
• The communication must be supervised and possiblycommitted/blocked by users. It is typical for businessprocesses if we need that they can be used in and agileway. Note that the agility is necessary if it is neededthat the process owner is responsible for process con-sequences. Agile processes in small-to-medium enter-prises must be agile to respond properly on businesscondition changes [20].
• Data store services can be used to implement complexcommunication schemas, e.g., the publish-subscribeone if not provided by the middleware yet. In this casethe data memory component stores a set of messages.It can be used to solve the point-to-point antipattern[3, 16].
• There can be reasons to change dynamically the desti-nation of a message due the facts known to users only(e.g., machine tool failures, incomplete data used byscheduling algorithm, etc.). The changes can be per-formed by a user or by an application/service or byactivities of destination services.
• Data store services can be used to implement functionsnecessary for debugging.
Data stores can therefore be used to enhance middlewarefunctions, they can be used to integrate batch applicationsand can serve as a powerful enhancement of business pro-cesses control, especially in the cases when a given functioncan be provided by several application services that need notprovide the same collection of elementary services or pro-vide the same elementary services but with different quality(see [19] for details).
Process Managers
Business processes must often require on-line involvementand supervision of process owners into their operation. Thisfeature is known as agility. Agility is a very desirable fea-ture of business processes – especially in small and middle-sized enterprises. It is the condition for the requirementthat process owner should be responsible for business loss-es caused by process steps as well as for on-line processchanges performed by the owner. The reasons are (compare[20]):
1. The process model/definition is based on data that neednot be for various reasons timely, accurate, or com-plete. The business conditions may also change.
2. The process owner can be obliged to commit somerisky process steps.
3. The information on the process should be understand-able for experts (not necessarily IT ones), e.g., at acourt judging a business case.
4. The process model M should be stored as a part ofbusiness intelligence and updated by users.
5. It is desirable to be possible to have process modelin different languages, if necessary, e.g., in BPEL [2],Aris, [13], workflow [36], or in a semistructured text.
As it is not desirable to have centralized services in peer-to-peer systems (compare experience with UDDI [32] andwith UDDI-based world-wide repositories) we can use thefollowing solution (see Figure 3):
1. During the process enactment a new service instancecalled Process Manager (PM) is generated on the re-quest of the process owner O. During the generationof PM a process model M (if any) is transformed intoa process control data C using parameters provided byO. O can possibly generate C directly without M . Mcan be copied from a data store. A solution when Mcontains no data or when O is a proper textual docu-ment used by a process owner, is also possible. C canbe stored inside PM.
52
International Journal On Advances in Telecommunications, vol 2 no 1, year 2009, http://www.iariajournals.org/telecommunications/

¢A
g
process owner¢A
g
system user
Systemportal
Management
portal
Repository ofprocess models
Processmanager
¾ model request
-model
¡¡ ££ BB @@services performing
business process operations
QQs
PM generation
-granting access to PM
6
?
process initialization
data/process supervision
Figure 3. The use of Process Manager
2. During the operation of the process PM generates (u-sing C) service calls. The calls can be synchronous(call and wait for answer) or asynchronous (just senda message). C can be modified on-line by process ow-ner, if necessary.
3. It is important for the reasons discussed above that ifthe process owner can supervise the process run andthe process run is understandable by non IT experts,then the services should have interface based on thelanguages of user knowledge domains – it is, the in-terfaces are user oriented. We have seen that user-oriented interfaces have many software engineeringadvantages. Note that Process Managers are from lo-gical point of view portals of subnetworks of servicesproviding the operations of the business process. Thesubnetwork behaves like a portal SOA.
Portals
It is advantageous to design a portal (system user interface)as a service (peer of the network) providing the user inter-face to the some functions of the system to a specific groupof users. Any system can have several portals.
In the case of process managers it is meaningful to gen-erate not only the manager but also a portal (user-interface)for it. Another implementation can be via portlets pluggedinto a portal. According to our experience it is a less flexiblesolution.
Portal SOA A service in SOA can in principle communi-cate with any other service. This possibility can be reducedaccording to service role it plays in the system according
the principles of the design and implementation of a givenvariant of SOA.
The simplest version of SOA has services of only twotypes: application services and (usually) one portal. Theapplication services can communicate with and using theportal only (Figure 4). Such solution is called portal SOA.Note that the application services can be structured, theycan be again (virtual) networks of subservices.
portal -¾¢A
guser(s)
processowner(s)
¡¡ª¡
¡µ ¤¤²¤¤º C
CWCCO @
@R@@I
Services
Figure 4. Portal SOA: logical view
A SOA system can have subnetworks possessing diffe-rent SOA construction principles. An example is inclusionof multiple e-commerce (sub)systems in a large ERP. Ano-ther example is the subnet providing support of a businessprocess. The head of the subnet can be a proper service –for example a process manager service PM discussed above.Often the services can be composite services.
Portal SOA is recommendable in the situation when theapplication services are very autonomous and the agility ofbusiness processes is desirable, the application services canbe equipped by user-oriented interfaces and the system re-sponse times need not be too short. Such conditions arefulfilled quite often. The implementation of portal SOA issimpler than the development of general SOA. It is there-fore important to detect whether the system to be developedcan have the architecture of portal SOA.
53
International Journal On Advances in Telecommunications, vol 2 no 1, year 2009, http://www.iariajournals.org/telecommunications/

Supervisor control messages
?
Source
servicesmessages or data
HHHHj
-
©©©©*
GPP
6?
§ ¦¨§
¥¦
©©©©*
-
HHHHj
Destination
servicesmessages or data
Figure 5. Generalized Petri place (simplified)
Generalized Petri Places
All the above discussed architecture services (with a par-tial exception of portals) can be viewed as specific variantsof the service type called Generalized Petri Place (GPP).GPP transforms tuples of input messages into tuples of out-put messages. It can have its local data store (Figure 5).The functions of GPP, e.g., message routing, can be influ-enced by a (human) supervisor. GPP is a generalization ofthe concept ”place” in colored Petri nets [27]. It is possi-ble to use tools like an XSLT [33] engine to generalize theimplementation of a front-end gate to have m ”inputs” andn ”outputs” (Figure 5). In other words: a front-end gatecan be transformed into a generalized transducer transfor-ming m-tuples of input messages from several sources inton-tuples of messages sent to several destinations.
The functions of GPP are similar to the ones of Fa-cade [11] but GPP is a more general concept as the syn-tax of messages can be substantially changed by GPP andthe messages themselves can be declarative and thereforenot procedure-call oriented. The links from Figure 5 canbe dynamically changeable at runtime. GPP can easily im-plement the functions of many other patterns from [11] likeBuild or Abstract Factory. The functions and behavior pat-terns are easily changeable at run-time as almost no sourcecode changes and recompilations or no relinking is neces-sary to change the behavior. Redirecting of messages isneeded e.g., for screen prototypes discussed below or in e-mergency situations. Redirecting can be set up on a requestof a human supervisor.
On the other hand the power of GPP can be a dangeroustool in hands that are not skilled enough as there is a littlesyntax overhead. It is, however, well known that coding(programming) is no bottleneck of software development.The bottleneck is the requirements specifications [31]. Theroot reason of the problems is the snags in cooperation withusers and it is almost not needed here.
A specific variant of it is the use of GPP as an entry pointof a subnetwork of services (to assemble into a compositeservice). GPP then plays the role of a FEG of this compositeservice. It suffices to require that any message sent to anyservice of the subnetwork must pass the GPP being FEG ofthe composite service. This technique is then a service com-position tool. We call such a GPP the Head of CompositeService.
GPP can be used to integrate several service-orientedsystems. GPP then can serve as a hub enabling the inte-gration. GPP can also connect subnets having properties ofalliances, e.g., if the peers of the subnet are web services.
The systems using GPP can therefore have a very richstructure.
4.2. Operations on Generalized Petri Places
We have noted that all above discussed variants of archi-tecture services can be viewed as modifications or specialcases of generalized Petri places. Let us now systematizethe types of modifications. Variants of communication pro-tocol:
Standard (or public) protocols. The protocols used as abasic variant of communication in given SOA.
Bulk communication. This is a variant of communicationused for the communication with batch systems.
The role of data store. We have discussed the followingcases:
• massive data store filled in bulk mode,
• data store of messages,
• log memory,
• data store (repository) of the models of businessprocesses.
Message paths. We discussed the case when messagesmust go through a Head of Composite Service and thecase of Connector. In fact in Portal SOA the applica-tion services communicate via Portal only.
The roles of human interfaces:
• observing and administration only,
• intelligent human interfaces.
The lifetime of services – generable and destroyablevs. permanent ones.
The transformations can be combined, so we can have abroad set of architecture services. It is a topic of furtherresearch to find out whether it can lead to further variants ofarchitecture services.
54
International Journal On Advances in Telecommunications, vol 2 no 1, year 2009, http://www.iariajournals.org/telecommunications/

P¢A
gSystemuser
A
Outersystem HH
HHC
DSM
A
A
FEG DS
©©©©©©
Batchsystem
HCS
@@
@
¡¡
¡P
¢A
gSystem
user
FEG
FEG
A
A
A
¢A
gLocaluser
PM
½½
½½
½½½
@@
@@
¶¶
¶¶
¶¶
¶¶
¶¶
¢A
gProcessowner
A A
JJ
JJ
HHHHHH
DS – data store, DSM – data store of messages, FEG – service adapter, A – application, P – portal, PM – process manager,C - connector, HCS – head of composite service
Figure 6. Structure of SOA with architecture services
4.3. Architecture Services in Action
The architecture services discussed above enable us todesign flexible service-oriented system having flexible andopen logical structure that can be easily changed. Exampleof such a service-oriented system is in Figure 6.
The virtual p2p network in Figure 6 has two subnetwork-s. One comprises a service providing business operationsfor the architecture service Process Manager (PM). The sec-ond is a composite service headed by a Head of CompositeService (HCS).
Note, however, that the services providing operations forthe business process controlled by PM can provide capabil-ities for other processes if appropriate.
Figure 6 shows how flexible and powerful is the service-oriented paradigm. It can be, however, dangerous if notused with caution.
A very important SOA pattern is a proper use of univer-sal middleware components and the proper use of architec-ture services. ESB is not broadly used in unions. The rea-sons are not clear yet. Note, however, that ESB can implyVendor Lock-In antipattern.
4.4. Fuzzy Tiers in Confederations
If we summarize the above discussion, we can distin-guish the following tiers in a confederation: basic message-transport middleware, partly programmable middleware(typically Enterprise Service Bus – ESB), middleware en-
data store¡
¡¡
¡
@@
@@
user interface
orchestration
composed application
application
extended middleware
inner
user
interface
ESBmiddleware
Figure 7. Tier view of a confederation
hancements (FEG, some Data store types, etc.), applicationservices, composite services, orchestration, and system por-tal(s). Orthogonal to these tiers are local user interfaces. Sothe system has the structure from Figures 7 and 8. Problemis that there are cases where the services provide function-s for more than one layer (tier) – for example data stores.These services can serve as a middleware enhancement aswell as a process manager. It is a service orchestration tool.GPP can serve as a service orchestration tool as well as aservice composition tool.
55
International Journal On Advances in Telecommunications, vol 2 no 1, year 2009, http://www.iariajournals.org/telecommunications/

system user interface UI
application services DS, HCS, PM
middleware extension (FEG, DSM)
ESB (optional)
basic middleware
Local
UI
Figure 8. Tiers in SOA
4.5. Screen and Simulation Prototypes
Native service-oriented development process is the in-cremental one. An issue is how to simulate a service S notimplemented yet. As it suffices to simulate the communica-tion with S, we use the following procedure:
1. The middleware or a GPP can change the destina-tion of (redirect) some messages. The messages beingpreferably in XML format to be sent to S are redirect-ed to user interface UI (portal).
2. UI responses like the S would have responded.
This solution can be generalized to test response times inservice-oriented process control system (real-time controlsystems). In this case the messages are sent to a Simulator.The Simulator can be either a hardware device or a simu-lator program written in a simulation language or in a lan-guage similar to C. The simulation program uses a Calendarof Coming Events (CCE) known from discrete event simu-lation languages. CCE can be programmed in e.g., C++ oreven a discrete simulation language can be used. Detailscan be found e.g., in [19].
The implementation of the screen prototype is substan-tially simplified if the interfaces of the application servicesare user-oriented and uses XML documents (see SOAP-Dabove).
4.6. Crucial Vision and Specification Pat-tern
We understand SOA as a virtual peer-to-peer networkof software components behaving in some sense like real-world services. The peers are called (software) services.If there is no danger of misunderstanding, the term servicewill mean software service. This broad definition cover-s quite different systems, the main goals/visions of whichcan be quite different. Different visions then imply diffe-rent marketing and technical (engineering) properties, thesystem of patterns inclusive.
Every SOA system4 (SOA in the above sense) consistsof (compare [20]):
• application services providing basic ”atomic” businesscapabilities, atomic means a software system provid-ing ”basic” business capabilities viewed as a blackbox. An example of an application system is an (en-capsulated) legacy system. Application services areusually integrated as black boxes. The developmentfrom scratch can be used if necessary or appropriate.
• middleware providing tools for transport of messagesbetween (i.e., supporting the communication of) thepeers
• architecture services enhancing the capabilities of mid-dleware. Examples are service adapters and portal-s. Architecture services are usually developed fromscratch, i.e., they are white boxes.
The properties of all the three tiers substantially dependon the global system goals. It then implies what patterns areapplicable. Let us give some examples.
1. e-commerce systems. The aim is to support world-wide business activities. It follows that a world-widenetwork must be used to implement the middleware.It is feasible only if no proprietary standards are used.The use of architecture services is very limited. Sys-tems are very open. The use of web services is appro-priate.
2. Process control systems. The main aim is very securesoftware developed almost entirely from scratch. Thenumber of services is limited. The details of commu-nication protocols can be agreed, the architecture ser-vices are usually not used. An exception is the use ofportals (client/user tier). The service interfaces can befine-grained and IT developer oriented (e.g., using R-PC philosophy).
3. System supporting large (partly) decentralized orga-nizations (e.g., e-government, municipal authorities,health institutions and networks, etc.) and small tomedium enterprises. The main aim is the reductionof the maintenance of such systems and integrationof autonomous. The system consists of large appli-cation software services. It is preferable to use archi-tecture services enabling a seamless integration of theservices supporting organization units or the integra-tion of third-party products. Some parts of such sys-tems can support e-commerce. These subsystems thenhave the properties specified in the point 1. Such sys-tems are quite frequent and are in fact the engine ofglobal economy.
4SOA system is an abbreviation for ”system having SOA”.
56
International Journal On Advances in Telecommunications, vol 2 no 1, year 2009, http://www.iariajournals.org/telecommunications/

4. Portal SOA. The communication of services must becontrolled or supervised by users. In this case it can begood to generate service requests by portal The capa-bilities of middleware are used not too much. Serviceadapters (front-end gates, FEG) can be useful. Suchan arrangement can be used for the implementation ofagile business processes (see [28] and below). The cru-cial pattern is to start with the decision what variant ofSOA is to be used and what application services andarchitecture services should be used. For the reason-s discussed below the software artifacts implementingapplication services are as a rule large and the serviceinterfaces are coarse-grained.
4.7. Further Notes on the Choice of a Pro-per SOA Type
The crucial decision is the proper selection of optimalSOA type. We often have no choice. We must use differentsolutions for large critical systems than for an informationsystems supporting a small enterprise.
On the other hand the properties of SOA systems sup-porting business in a small enterprise and in a very largeone must be surprisingly similar although due different rea-sons:
SME have limited resources, so it must (re)use legacysystems as much as possible. The functions of servicesmust be user-oriented to be used properly as there are few,if any, available IT experts able to understand user need-s. User-oriented interfaces are necessary for agile businessprocesses. They are welcome if the responsibility of busi-ness process owners for their processes is required.
Large enterprises have more resources but large changescan be too time consuming and implying too high burden onend users. Agility of processes is desirable and responsibili-ty are needed. User-oriented interfaces support informationhiding in the sense of software engineering. It is good forin- and out-sourcing.
We conclude that the proper detection of the SOA type iscrucial architectural and requirement pattern. It is crucial inthe sense that not applying it implies fatal antipattern. Notethat in business the unions are often the only possibility.
5. Conclusion
The most important property of SOA is that it is a vir-tual peer-to-peer architecture. It is a quite broad definition,broader than all the SOA variants defined in standards bye.g., OASIS and W3 Consortium. It includes also quite dy-namic structures not having all the properties required bythe standrads. For example, it allows to integrate batch sys-tems, web services (either complying or not to the W3Cweb services standards), and other systems not satisfying
the requirements of the standards. Too strict definitions ofSOA and software services could be the reasons of partialdissatisfication with SOA observed in the last year.
We have shown that we can adapt useful SOA solutionnot fulfilling the requirements of complex definition typicalfor many SOA-oriented standards. Such solutions can suc-cessfully support the development of information systemssupporting ERP of small or middle-sized enterprises. Wecan even apply solutions not leading to pure peer-to-peernetworks. We can use tools like MQ by IBM or solutionsoffered by operating systems like named pipes. It is a bigpromise and challenge that is often missed.
We require only that all the services (peers) of a SOAhave structurally similar properties. The overall logicalstructure of SOA is an implicit consequence of the innerfunctionality of the particular services and their communi-cation rules in the way discussed in this paper. We believethat the importance of this almost obvious property is sig-nificantly underestimated and often not taken into accountat all.
It is still open what further architecture services shouldbe invented and used.
SOA could be useful in business only if the user involve-ment is taken into account during development and allowedduring use of the system. It implies the use of user-orientedinterfaces of services and application of certain features ofagile development. User involvement and ROI imply thatthe main SOA development and even specification patternsin business should be the integration of legacy systems.
If we look into the history, we see that the problem ofyear 2000 (Y2K – problems with changes in immense num-ber of COBOL programs necessary due to century change)was the consequence of the use of legacy systems written inCOBOL and used for decades with almost no maintenance.It caused the problem that there were no COBOL program-mers able to make the changes. It is desirable to developsystems needing almost no maintenance. The use of legacysystems is the way to the true reusability (substantial thanin the object-oriented environment – compare [10]). It isdifficult to assume that the modern software should not uselegacy services requiring almost no maintenance. SOA en-ables it.
The vendors must, however, adapt their marketing strate-gies to the challenges of SOA revolution. Users must devel-op new skills and develop new business processes able tobenefit from the power of the service-oriented paradigm.
The main contributions of the paper are the following:
1. It is shown that it is good to study SOA variants usedespecially in small firms and called confederations andunions.
2. The criteria for the selection of the variants are speci-fied.
57
International Journal On Advances in Telecommunications, vol 2 no 1, year 2009, http://www.iariajournals.org/telecommunications/

3. The detection of the dependencies among patternsused for the development of confederations and union-s.
4. Analysis of the importance of user-oriented service in-terfaces and proposal how to implement them.
5. Powerful system development prototyping.
6. Concept of services and design of the most importantones.
7. The development of the concept of generalized Petriplace and treatment of the architecture service as in-stances of the generalized Petri places.
Acknowledgement
This research was partially supported by the Program”Information Society” under project 1ET100300517 andby the Grant Agency of Czech Republic under project201/09/0983.
References
[1] J. Kral and M. Zemlicka. Crucial patterns in service-orientedarchitecture. In Proceedings of ICDT 2007 Conference,page 24, Los Alamitos, CA, USA, 2007. IEEE CS Press.
[2] T. Andrews, F. Curbera, H. Dholakia, Y. Goland, J. K-lein, F. Leymann, K. Liu, D. Roller, D. Smith, S. Thatte,I. Trickovic, and S. Weerawarana. Specification: Businessprocess execution language for web services version 1.1,2003. http://www-106.ibm.com/developerworks/library/ws-bpel/ 2009-05-14.
[3] J. Ang, L. Cherbakov, and M. Ibrahim. SOA antipat-terns, Nov. 2005. http://www-128.ibm.com/developerworks/webservices/library/ws-antipatterns/. 2009-05-14.
[4] W. J. Brown, R. C. Malveau, H. W. S. McCormick, III, andT. J. Mowbray. AntiPatterns: Refactoring Software, Archi-tectures, and Projects in Crisis. John Wiley & Sons, NewYork, 1998.
[5] D. A. Chappell. Enterprise Service Bus. O’Reilly, 2004.[6] F. Cohen. Discover SOAP encoding’s impact on web ser-
vice performance. developerWorks, Mar. 2003. http://www-106.ibm.com/developerworks/library/ws-soapenc/ 2009-05-15.
[7] J. Dyche. The CRM Handbook: A Business Guide to Cus-tomer Relationship Management. Addison Wesley Profes-sional, Boston, 2002.
[8] T. Erl. Service-Oriented Architecture – A field Guide to In-tegrating XML and Web Services. Prentice Hall, 2004.
[9] T. Erl. SOA principles of Service Design. Prentice Hall,2008.
[10] L. Finch. So much OO, so little reuse. Dr. Dobb’s Journal,May 1998.
[11] E. Gamma, R. Helm, R. Johnson, and J. Vlissides. DesignPatterns. Elements of Reusable Object-Oriented Software.Addison-Wesley, Boston, MA, 1993.
[12] Gartner Inc. Gartner says the number of organizations plan-ning to adopt SOA for the first time is falling dramatically,Nov. 2008. http://www.gartner.com/it/page.jsp?id=7907172009-05-15.
[13] IDS Scheer. Aris process platform.[14] International Standards Organization. ISO/IEC 20000-
1:2005: Information technology – service management –part 1: Specification, 2005.
[15] International Standards Organization. ISO/IEC 20000-2:2005: Information technology – service management –part 2: Code of practice, 2005.
[16] S. Jones. SOA anti-patterns, 2006. http://www.infoq.com/articles/SOA-anti-patterns 2009-05-14.
[17] J. Kral and M. Zemlicka. Electronic government and soft-ware confederations. In A. M. Tjoa and R. R. Wagner,editors, Twelfth International Workshop on Database andExperts System Application, pages 125–130, Los Alamitos,CA, USA, 2001. IEEE Computer Society.
[18] J. Kral and M. Zemlicka. Software confederations and al-liances. In CAiSE’03 Forum: Information Systems for aConnected Society, Maribor, Slovenia, 2003. University ofMaribor Press.
[19] J. Kral and M. Zemlicka. Service orientation and the qualityindicators for software services. In R. Trappl, editor, Cy-bernetics and Systems, volume 2, pages 434–439, Vienna,Austria, 2004. Austrian Society for Cybernetic Studies.
[20] J. Kral and M. Zemlicka. Implementation of business pro-cesses in service-oriented systems. In Proceedings of 2005IEEE International Conference on Services Computing, vol-ume II, pages 115–122, Los Alamitos, CA, USA, 2005.IEEE Computer Society.
[21] J. Kral, M. Zemlicka, and M. Kopecky. Software confedera-tions – an architecture for agile development in the large. InP. Dini, editor, International Conference on Software Engi-neering Advances (ICSEA’06), page 39, Los Alamitos, CA,USA, 2006. IEEE Computer Society.
[22] B. Lowson, R. King, and A. Hunter. Quick Response: Man-aging the Supply Chain to Meet Consumer Demand. JohnWiley & Sons, New York, 1999.
[23] C. M. MacKenzie, K. Laskey, F. McCabe, P. F.Brown, and R. Metz. Reference model for service-oriented architecture 1.0, committee specification 1, 19July 2006, 2006. http://www.oasis-open.org/committees/download.php/19361/soa-rm-cs.pdf 2009-05-15.
[24] E. A. Marks and M. Bell. Service-Oriented Architecture – APlanning and Implementation Guide for Business and Tech-nology. John Wiley & Sons, Hoboken, New Jersey, USA,2006.
[25] J. McKendrick. Gartner: SOA sinking into trough of dis-illusionment, Nov. 2008. http://blogs.zdnet.com/service-oriented/?p=1211 2009-05-15.
[26] J. Nielsen. Usability Engineering. Academic Press, NewYork, 1993.
[27] C. A. Petri. Kommunikationen mit automaten (Communi-cation with automata, in German). Schriften der IIM, (2),1962.
[28] A. Schatten and J. Schiefer. Agile business process manage-ment with sense and respond. In S. C. Cheung, Y. Li, K.-M.Chao, M. Younas, and J.-Y. Chung, editors, ICEBE, pages319–322. IEEE Computer Society, 2007.
58
International Journal On Advances in Telecommunications, vol 2 no 1, year 2009, http://www.iariajournals.org/telecommunications/

[29] D. Sholler. 2008 SOA user survey: Adop-tion trends and characteristics, Sept. 2008.http://www.gartner.com/DisplayDocument?id=7657202009-05-15.
[30] Sonic Software. Enterprise service bus, 2004.http://www.sonicsoftware.com/products/sonic esb/ 2009-05-15.
[31] Standish Group. Chaos: A recipe for success, 1999.[32] UDDI Initiative. Universal definition, discovery, and
integration, version 3, 2002–2003. An industri-al initiative, http://www.oasis-open.org/committees/uddi-spec/doc/tcspecs.htm#uddiv3 2009-05-15.
[33] W3 Consortium. XSL transformations (XSLT), 2007. W3CRecommendation. http://www.w3c.org/TR/xslt20 2009-05-15.
[34] W3 Consortium. Simple object access protocol, 2000. Aproposal of W3C consortium. http://www.w3.org/TR/SOAP2009-05-15.
[35] W3 Consortium. Web services activity, 2002.http://www.w3.org/2002/ws/ 2009-05-15.
[36] Workflow Management Coalition. Workflow specification,2004.
59
International Journal On Advances in Telecommunications, vol 2 no 1, year 2009, http://www.iariajournals.org/telecommunications/

www.iariajournals.org
International Journal On Advances in Intelligent Systems
ICAS, ACHI, ICCGI, UBICOMM, ADVCOMP, CENTRIC, GEOProcessing, SEMAPRO,BIOSYSCOM, BIOINFO, BIOTECHNO, FUTURE COMPUTING, SERVICE COMPUTATION,COGNITIVE, ADAPTIVE, CONTENT, PATTERNS
issn: 1942-2679
International Journal On Advances in Internet Technology
ICDS, ICIW, CTRQ, UBICOMM, ICSNC, AFIN, INTERNET, AP2PS, EMERGING
issn: 1942-2652
International Journal On Advances in Life Sciences
eTELEMED, eKNOW, eL&mL, BIODIV, BIOENVIRONMENT, BIOGREEN, BIOSYSCOM,BIOINFO, BIOTECHNO
issn: 1942-2660
International Journal On Advances in Networks and Services
ICN, ICNS, ICIW, ICWMC, SENSORCOMM, MESH, CENTRIC, MMEDIA, SERVICECOMPUTATION
issn: 1942-2644
International Journal On Advances in Security
ICQNM, SECURWARE, MESH, DEPEND, INTERNET, CYBERLAWS
issn: 1942-2636
International Journal On Advances in Software
ICSEA, ICCGI, ADVCOMP, GEOProcessing, DBKDA, INTENSIVE, VALID, SIMUL, FUTURECOMPUTING, SERVICE COMPUTATION, COGNITIVE, ADAPTIVE, CONTENT, PATTERNS
issn: 1942-2628
International Journal On Advances in Systems and Measurements
ICQNM, ICONS, ICIMP, SENSORCOMM, CENICS, VALID, SIMUL
issn: 1942-261x
International Journal On Advances in Telecommunications
AICT, ICDT, ICWMC, ICSNC, CTRQ, SPACOMM, MMEDIA
issn: 1942-2601