The Romer Model - Pitt
25
The Romer Model David N. DeJong University of Pittsburgh Econ. 1540, Spring 2010 DND () Romer Model Econ. 1540, Spring 2010 1 / 19
Transcript of The Romer Model - Pitt

The Romer Model
David N. DeJongUniversity of Pittsburgh
Econ. 1540, Spring 2010
DND () Romer Model Econ. 1540, Spring 2010 1 / 19

Overview of the Model
The model extends the Solow model by endogenizing thecharacterization of technological progress.
In Romer�s model, technological progress is represented as the generationof ideas, or blueprints, useful for producing new intermediate goods(goods used to produce �nal goods). The Solow model assumed a singleintermediate good; the Romer model features At intermediate goods,which evolves over time.
In both the Solow and Romer models, we assume a single �nal good (thus,we abstract from the innovation of consumption goods, and focusexclusively on the innovation of new intermediate goods).
DND () Romer Model Econ. 1540, Spring 2010 2 / 19

Overview of the Model, cont.
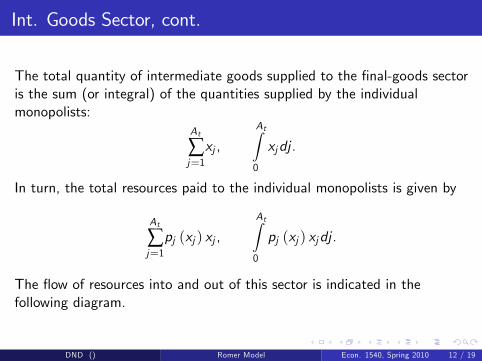
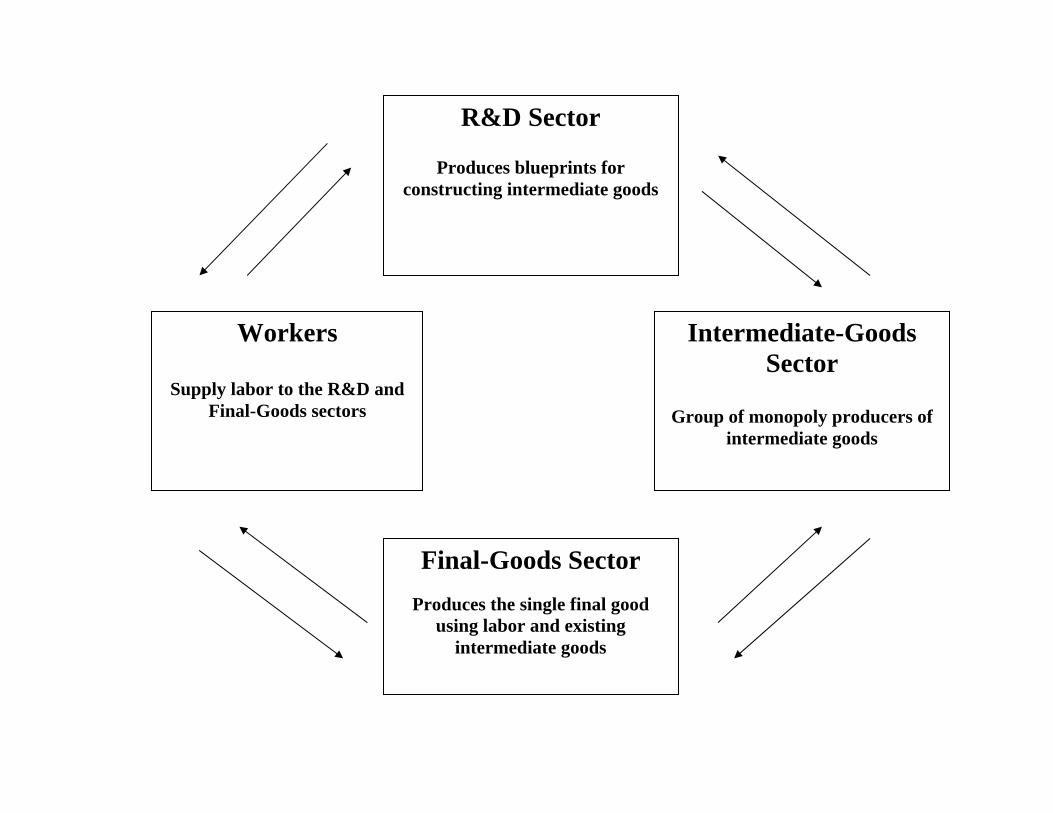
The model features four sectors:
Final-goods sector
Intermediate-goods sector
R&D sector
Labor market
DND () Romer Model Econ. 1540, Spring 2010 3 / 19

Overview of the Model, cont.
The model is represented in diagram form in the following slide. Thearrows represent �ows of resources between the sectors. These will bedescribed in detail below.
DND () Romer Model Econ. 1540, Spring 2010 4 / 19

R&D Sector
Produces blueprints for constructing intermediate goods
Workers
Supply labor to the R&D and Final-Goods sectors
Intermediate-Goods Sector
Group of monopoly producers of
intermediate goods
Final-Goods Sector
Produces the single final good using labor and existing
intermediate goods

The R&D Sector
In this sector, blueprints for producing new intermediate goods aregenerated by workers who spend their time exclusively towards this goal.
Physical capital is not required to produce blueprints; however, existingideas are useful for generating new ideas.
DND () Romer Model Econ. 1540, Spring 2010 5 / 19

The R&D Sector, cont.
Let the stock and �ow of ideas be given by:
Stock: At
Flow:�At
Also, let LA = sRL denote the proportion of the workforce devoted to theR&D sector.
DND () Romer Model Econ. 1540, Spring 2010 6 / 19

The R&D Sector, cont.
With this notation, the law of motion for new ideas is given by
�At = δLA,
whereδ = δAφ, δ > 0, 0 < φ < 1.
Note: individuals take δ as given, but their actions have an impact on δ(i.e., the search for new ideas generates an externality).
DND () Romer Model Econ. 1540, Spring 2010 7 / 19

The R&D Sector, cont.
Combining equations, the law of motion for new ideas is given by
�At = δAφLA, δ > 0, 0 < φ < 1.
DND () Romer Model Econ. 1540, Spring 2010 8 / 19

The R&D Sector, cont.
When a new blueprint is generated, it is sold to a �rm in theintermediate-goods sector at price PA.
Revenue generated by the sales of new blueprints are paid fully to workers.The wage rate in this sector is given by wR .
The �ow of resources into and out of the R&D sector is depticted in thefollowing diagram.
DND () Romer Model Econ. 1540, Spring 2010 9 / 19

R&D Sector
Produces blueprints for constructing intermediate goods
Workers
Supply labor to the R&D and Final-Goods sectors
Intermediate-Goods Sector
Group of monopoly producers of
intermediate goods
Final-Goods Sector
Produces the single final good using labor and existing
intermediate goods
dejong
Stamp
dejong
Stamp
dejong
Stamp
dejong
Stamp
dejong
Stamp

The Intermediate Goods Sector
This consists of a large number of �rms, each of which has obtained themonopoly power to produce a unique intermediate good from the R&Dsector at price PA.
The j th �rm produces the j th unique good xj at the marginal resource costr , which represents the rental rate of physical capital.
The production of xj does not require a labor input, just the sacri�ce of xjunits of the �nal good (foregone consumption, as in the Solow model).
DND () Romer Model Econ. 1540, Spring 2010 10 / 19

Int. Goods Sector, cont.
The demand curve for xj stems from the �nal-goods sector; it is given by
pj = pj (xj ) , p0j (xj ) < 0.
The pro�t function of the j th �rm is given by
πj = pj (xj ) xj � rxj .
DND () Romer Model Econ. 1540, Spring 2010 11 / 19
Int. Goods Sector, cont.
The total quantity of intermediate goods supplied to the �nal-goods sectoris the sum (or integral) of the quantities supplied by the individualmonopolists:
At
∑j=1xj ,
AtZ0
xjdj .
In turn, the total resources paid to the individual monopolists is given by
At
∑j=1pj (xj ) xj ,
AtZ0
pj (xj ) xjdj .
The �ow of resources into and out of this sector is indicated in thefollowing diagram.
DND () Romer Model Econ. 1540, Spring 2010 12 / 19

R&D Sector
Produces blueprints for constructing intermediate goods
Workers
Supply labor to the R&D and Final-Goods sectors
Intermediate-Goods Sector
Group of monopoly producers of
intermediate goods
Final-Goods Sector
Produces the single final good using labor and existing
intermediate goods
dejong
Stamp
dejong
Stamp
dejong
Stamp
dejong
Stamp

Final Goods Sector
A single consumption good is produced in a perfectly competitive industry.(I.E., prices are taken as given.)
Here, labor LY = (1� sR ) L and intermediate goods combine to produceY , according to
Y = L1�αY
At
∑j=1xαj
or
Y = L1�αY
AtZ0
xαj dj .
DND () Romer Model Econ. 1540, Spring 2010 13 / 19

Final Goods Sector, cont.
The objective in this sector is once again to maximize pro�ts:
maxLY ,xj
L1�αY
AtZ0
xαj dj � wY LY �
AtZ0
pj (xj ) xjdj .
The �ow of resources into and out of this sector is indicated in thefollowing diagram.
DND () Romer Model Econ. 1540, Spring 2010 14 / 19

R&D Sector
Produces blueprints for constructing intermediate goods
Workers
Supply labor to the R&D and Final-Goods sectors
Intermediate-Goods Sector
Group of monopoly producers of
intermediate goods
Final-Goods Sector
Produces the single final good using labor and existing
intermediate goods
dejong
Stamp
dejong
Stamp
dejong
Stamp
dejong
Stamp

Labor Market
Workers are equally able and indi¤erent in supplying labor in the R&D andFinal Goods sectors.
Therefore, they choose sR , the fraction of labor devoted to the R&Dsector, such that wages are equated across sectors:
wY = wR = w .
The �ow of resources into and out of this sector is indicated in thefollowing diagram.
DND () Romer Model Econ. 1540, Spring 2010 15 / 19
R&D Sector
Produces blueprints for constructing intermediate goods
Workers
Supply labor to the R&D and Final-Goods sectors
Intermediate-Goods Sector
Group of monopoly producers of
intermediate goods
Final-Goods Sector
Produces the single final good using labor and existing
intermediate goods
dejong
Stamp
dejong
Stamp
dejong
Stamp
dejong
Stamp

Aggregating the Model
Yt = L1�αYt
AtZ0
xαj dj
Kt =
AtZ0
xαj dj
�K t = It � dKtYt = Ct + ItCt = (1� s)Yt�At = δAφ
t LAtLAt = sRLt , LYt = (1� sR )Lt�LtLt
= n
DND () Romer Model Econ. 1540, Spring 2010 16 / 19

Aggregating the Model, cont.
Endogenous prices:
wR ,wY : determined as the marginal product of labor in the R&Dand �nal-goods sectors, constrained to be equal
p(xj ) : determined as the marginal product of xj in the �nal-goodssector
PA : determined by the pro�ts a new blueprint can generate for anintermediate-goods monopolist
r : determined as the marginal product of K in producing Y
Also endogenous:sR
The aggregated �ow of resources is indicated in the following diagram.
DND () Romer Model Econ. 1540, Spring 2010 17 / 19

R&D Sector
Produces blueprints for constructing intermediate goods
Workers
Supply labor to the R&D and Final-Goods sectors
Intermediate-Goods Sector
Group of monopoly producers of
intermediate goods
Final-Goods Sector
Produces the single final good using labor and existing
intermediate goods
dejong
Stamp
dejong
Stamp
dejong
Stamp
dejong
Stamp
dejong
Stamp
dejong
Stamp
dejong
Stamp
dejong
Stamp

Solving and Implementing the Model
To solve the model, we must solve for (wR ,wY , p(xj ),PA, r , sR ) , thenusing these solutions, draw inferences for aggregate behavior.
This approach is tedious and complicated, so we�ll work in reverse: we�lltake as granted these soltuions, and move directly the to study ofaggregate behavior. Time permitting, we�ll then return to the solution of(wR ,wY , p(xj ),PA, r , sR ) .
DND () Romer Model Econ. 1540, Spring 2010 18 / 19

Solving and Implementing the Model, cont.
Further model analysis will be pursued interactively during class.
DND () Romer Model Econ. 1540, Spring 2010 19 / 19