The Role Online Television Viewing has in the Future of...
66
The Role Online Television Viewing has in the Future of Television and Audience Measurement A Thesis Submitted to the Faculty of Drexel University by Kendra Unique Smith in partial fulfillment of the requirements for the degree of Master of Science in Television Management June 2015
Transcript of The Role Online Television Viewing has in the Future of...
The Role Online Television Viewing has in the Future of Television and
Audience Measurement
A Thesis
Submitted to the Faculty
of
Drexel University
by
Kendra Unique Smith
in partial fulfillment of the
requirements for the degree
of
Master of Science in Television Management
June 2015

ii

iii
DEDICATION
I would like to dedicate this to my mother, Sandra Windom, for teaching me how
to be responsible and hardworking and showing me how to be strong no matter
what comes my way. I would also like to dedicate this to my sister, Kenyce, my
Aunt, Deltrese and Jordan Jackson. All of you are my inspiration and each gives
me a unique motivation to continue to thrive.
iv
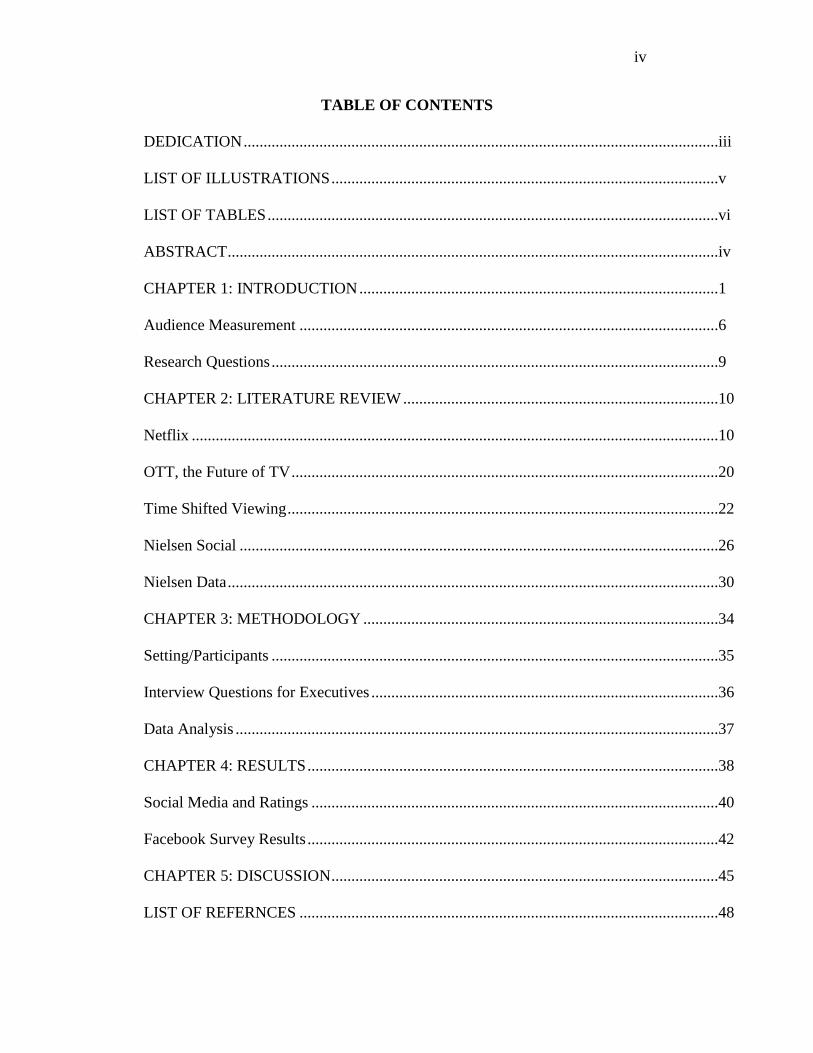
TABLE OF CONTENTS
DEDICATION .......................................................................................................................iii
LIST OF ILLUSTRATIONS .................................................................................................v
LIST OF TABLES .................................................................................................................vi
ABSTRACT ...........................................................................................................................iv
CHAPTER 1: INTRODUCTION ..........................................................................................1
Audience Measurement .........................................................................................................6
Research Questions ................................................................................................................9
CHAPTER 2: LITERATURE REVIEW ...............................................................................10
Netflix ....................................................................................................................................10
OTT, the Future of TV ...........................................................................................................20
Time Shifted Viewing ............................................................................................................22
Nielsen Social ........................................................................................................................26
Nielsen Data ...........................................................................................................................30
CHAPTER 3: METHODOLOGY .........................................................................................34
Setting/Participants ................................................................................................................35
Interview Questions for Executives .......................................................................................36
Data Analysis .........................................................................................................................37
CHAPTER 4: RESULTS .......................................................................................................38
Social Media and Ratings ......................................................................................................40
Facebook Survey Results .......................................................................................................42
CHAPTER 5: DISCUSSION .................................................................................................45
LIST OF REFERNCES .........................................................................................................48
v
LIST OF ILLUSTRATIONS
2.1 Online Television Show Sources ....................................................................................13
2.2 Binge Viewing of TV Shows ..........................................................................................19
2.3 Top Ten Series on Twitter ..............................................................................................27
2.4 This TV Season’s Biggest Moments on Twitter .............................................................28
4.1 Netflix Original Series Viewers Results .........................................................................42
4.2 Netflix Personal Account Usage .....................................................................................43

vi
LIST OF TABLES
2.1 Netflix Original Series Viewer Rating ............................................................................11
4.1 Summary of Facebook Survey Results ...........................................................................43
vii
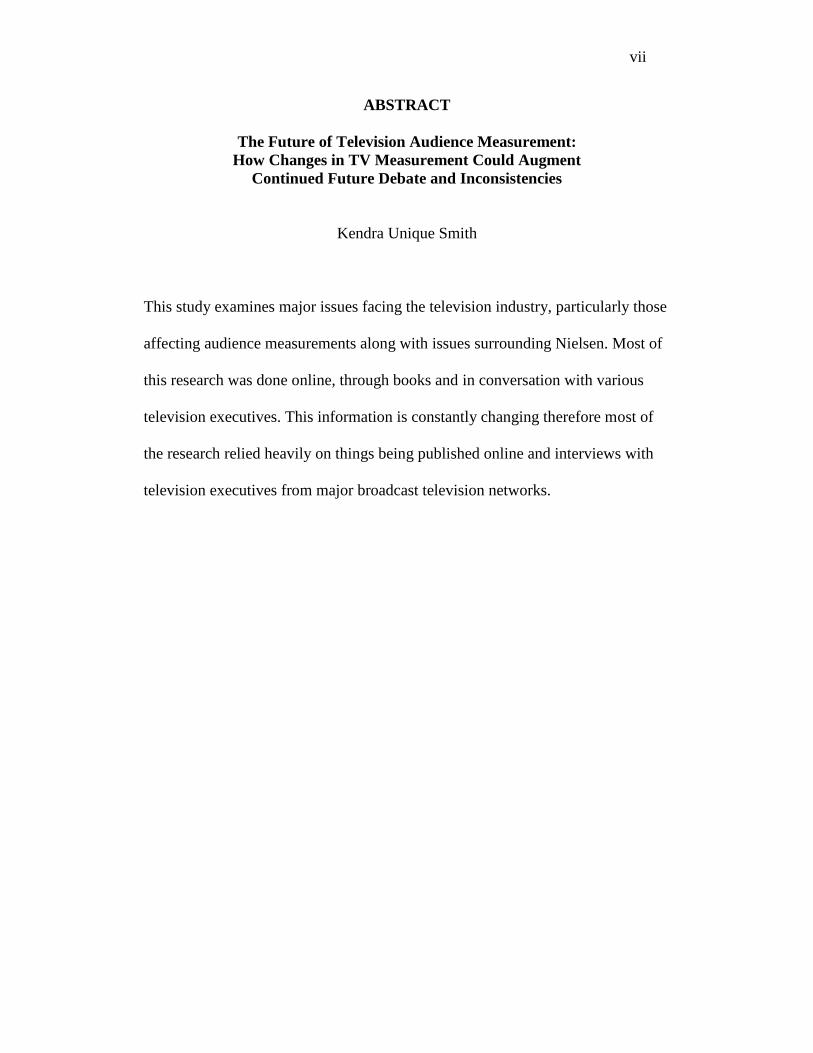
ABSTRACT
The Future of Television Audience Measurement:
How Changes in TV Measurement Could Augment
Continued Future Debate and Inconsistencies
Kendra Unique Smith
This study examines major issues facing the television industry, particularly those
affecting audience measurements along with issues surrounding Nielsen. Most of
this research was done online, through books and in conversation with various
television executives. This information is constantly changing therefore most of
the research relied heavily on things being published online and interviews with
television executives from major broadcast television networks.

viii

1
CHAPTER 1: INTRODUCTION
As television continues to grow and change, it is important to understand
all the factors that affect this evolution. There are now so many entities that affect
the way television is being viewed and there are so many different platforms to
view it. With ratings and the television audience being the important force in
television, there has to be a way to examine all key factors and monetize them.
Research indicates that the audience now controls how, when and where people
watch TV. The consumer is in control. Television executives have to forecast
potential solutions and outcomes in hopes of finding a happy medium where
buyers, sellers and advertisers can all be satisfied with the information being
reported and used to generate income. Over The Top (OTT) viewing and Time
Shifted viewing both play significant roles in why consumers have altered their
viewing habits. These changes have implemented new ways to measure audiences
beyond the traditional television. Julie Park from Comscore wrote in a report “for
content owners to get credit for these audiences and for advertisers to accurately
plan multi-platform campaigns, the ecosystem must transact on consistent and
trusted digital video measurement” (Parke, 2015). Video Reporting must provide
a single, unduplicated view of the way people are actually watching video, on
their own time, across their preferred device (Parke, 2015). Developing a perfect
system that can accurately measure television audiences across multiple platforms
seems to be the hindrance. A system that could accurately measure viewership
across all platforms, specifically for the use of television audiences, will continue

2
to make traditional television viewing the primary source for TV audiences.
Though these things are all issues surrounding the television industry, impacting
the structure of television organizations, they are not things that will hinder the
growth or future of traditional television.
Over The Top Viewing
Over the top viewing (OTT) is one of the newest outlets that give cable
companies and broadcast TV a reason to be concerned. Over the top viewing
provides television viewers the ability to view their television connection over a
broadband connection via the internet or OTA (over the air) with an antenna
without needing a multiple-system operator. Video, audio and other media can
also be delivered over the top. Overall, over the top viewing poses a new
challenge for the television industry. Content providers may have reason to
negotiate and listen to every side if content becomes a la carte as unbundling can
be the biggest downside economically (Martin Medina, 2013). OTT viewing
allows affordable television viewing for everyone (Will OTT, 2015). Subscription
based services Netflix and Hulu Plus are the leading providers in over the top
content. Great Lakes Data System says consumers want three things: the ability to
watch the content they want however they want, without breaking the bank.
(WOTT, 2015). The internet has allowed for television programming to be
viewed on many different devices such as phones, tablets, computers, laptops,
etc… because of this, broadcasters now acknowledge the new technologies into
their business model. At the 2015 National Association of Broadcasters annual
fete in Las Vegas, the NAB President Gordon Smith laid out the case for

3
integrating “next generation” technologies, like OTT video (Bookman, 2015). The
NAB talked about Dynamic Ad Insertion (DAI) which Bookman writes is “the
first and best solution to monetize OTT video for any provider who isn't going to
add a subscription component to their service” (Bookman, 2015). Many theories
surrounding OTT video are in its early stages because the anticipated viewing
audience is unknown but expected to grow moderately in 2015 and years to come.
With online video set to grow from 33% in 2012 to 77% by 2020, there has never
been a better time for companies to embrace video streaming (Visual Unity,
2015).
OTT viewing can definitely be a benefit for broadband providers, allowing
them to up-sell their customers to faster, higher speed internet service. However,
on February 26, 2015, the FCC just ruled in favor of “Net Neutrality” which
allows users to browse and communicate freely without the service providers
blocking or discriminating against certain content or websites. The FCC’s rules
are strong, sustainable rules to protect the open internet and preserve the internet
as a platform for innovation, free expression and economic growth (FCC, 2015).
Broadband providers have economic incentives that harm the openness of the
internet which ultimately could slow down the speed and extent of the internet.
The U.S. Court of Appeals for the District of Columbia upheld the Commission’s
finding that internet openness drives a “virtuous cycle” that enhances consumer
demand, leading to expanded investments in broadband infrastructure that, in
turn, spark new innovations at the edge (FCC, 2015).
4
Without the FCC’s Net Neutrality ruling, broadband companies could
have the ability to control the internet in ways that could allow paid prioritization,
meaning, no one company or affiliate can pay for favor over the next company.
Now, the first three Bright Line Rules, ban practices that are known to harm the
open internet. These three rules are (FCC, 2015):
No Blocking: broadband providers may not block access to legal
content, applications, services, or non-harmful devices.
No Throttling: broadband providers may not impair or degrade lawful
Internet traffic on the basis of content, applications, services, or non-
harmful devices.
No Paid Prioritization: broadband providers may not favor some lawful
Internet traffic over other lawful traffic in exchange for consideration of
any kind—in other words, no “fast lanes.” This rule also bans ISPs from
prioritizing content and services of their affiliates.
These rules are applied to all internet access, whether on a desktop or mobile
device. As the FCC’s 2010 open internet ruling had limited applicability to
mobile broadband (FCC, 2015). Also, new rules allows for the commission to
address questionable practices on a case-by-case basis because the internet is
always growing and changing.
As far as incremental growth is concerned, television programmers will
not be gaining customers from having virtual MSO (multiple system operators) if
the subscribers are simply just moving from cable to internet services. For a
company like Comcast, that offers both internet and cable services, they could
make up for what could be lost in cable subscriptions by charging more for their
internet services. In terms of an actual broadband TV service becoming a reality,
Intel was expecting to launch its OTT broadband TV division in late 2014. Since
then, Verizon bought Intel’s internet TV unit as Intel concluded it would cost too

5
much money to enter the pay-TV business. Prior to this acquisition, there were
reports of Intel having trouble signing final distribution deals. Verizon plans to
use the acquisition to spruce up FIOS and eventually offer OTT TV. Sony on the
other hand has reached preliminary agreements with Viacom for an Internet
Distribution Deal according to Viacom news (Jafar, 2014). The agreement is for
web based TV services and Sony will carry MTV, Nickelodeon and 20 other
Viacom Inc. channels along with the option to stream Viacom programming on
mobile devices (Ramachandran, 2014). This service will be Sony’s Playstation
Vue internet TV service, the companies upcoming live TV service (Roettgers,
2015). Since, Sony has also sealed deals with CBS, NBC and FOX. Janko
Roettgers of gigaom.com says a source reported these channels as part of the
programming to come with the Playstation Vue:
“Spike, CBS, NBC, Fox, My9, Telemundo, American Heroes, Animal
Planet, BET, BET Gospel, Big Ten network, Bravo, CBS Plus, Centric,
Chiller, Cloo, CMT Pure Country, CNBC, CNBC World, Comedy
Central, Cooking Channel, Cozi TV, Destination America, Discovery
Channel, Discovery Family, Discovery Life, DIY, E!, Esquire, Exits, Food
Network, Fox College Sports (3), Fox Sports 1,2,3, FX, FXM, FXX, Golf
Channel, HGTV, Investigation Discovery, LOGO, Movies TV, MSNBC,
MTV (Hits, Jam, 2, U), Nat Geo, all the Nickelodeons, OWN, Oxygen,
Palladia, Science, Sprout, SYFY, Teen Nick, Travel, TV Land, Universal,
USA, Velocity, VH1, Vh1 Classic, Soul, YES Network.
The list has some popular channels and some channels that are not popular. “It
looks like Sony signed really big bundles with all of the programmers, forcing it
to carry numerous channels with very small audiences” (Roettgers, 2015).
6
Audience Measurement
Television audiences are measured through Nielsen, which is a global
information and measurement company who’s “capabilities provide relevant
metrics that are necessary to inform successful marketing and programming and
drive continued growth (Nielsen, 2015). Having the Nielsen’s audience
measurement data provides media companies and brands the ability to know when
to reach prospective consumers. This information also helps media companies
plan their programming in hopes of getting a return on investment and brand
reputation (Nielsen, 2014). They specialize in knowing what consumers watch
and buy. The way the Nielsen’s ratings work is: they get a sample of people that
Nielsen claims fully represents the entire television watching population. These
people are called “Nielsen families” or “Nielsen panelist.” They are approached
randomly by Nielsen and asked to allow them to collect data from their household
regarding their viewing habits. There are about 50,000 people in about 20,000
households (as some families contain more than one person, such as husband,
wife, children and though the families are paid, the amount is not specific. It
seems to vary family to family. One family reported they received a check for
$50.00 several times a year. Another guy listed as Arle on TVline.com
commented on an article entitled Number of 'Nielsen Families' that Fuel TV
Ratings to Grow 'Significantly'. He said that he in fact is a Nielsen Family and
that his family was paid $300 cash upfront, followed by a $300 “thank you gift”
check, plus $20 a month for their first year and $25/month for their last year. He
also went on to say that his family’s 2-year contract ends in August 2014 and he is

7
sad about it. Arle said that Nielsen offered to pay an additional $20 per month if
they did their online tracking as well, but the family declined wanting to keep the
sites they were visiting private.
Nielsen measures data such as viewing behavior, commercial engagement
(fast forwards and when they occur), what is being viewed, when, who and how
many are watching, all the way down to which member is watching and their
demographics. These data are measured by Diaries, (which are to be filled out
daily and are examined during “sweeps”). TV meters and Local People Meters
which capture all of that information. The information is sent back to Nielsen
each night, including the live ratings, same day DVR numbers, until seven days
after its initial air date. The demographics come from each family member having
their own remote control which tells Nielsen who is watching. This information is
important for clients because they are able to give in depth knowledge. This
information can allow clients to alter their campaigns and ads where need are
based on this data.
Cross Platform Measurement
In this day in age, people are watching more television. There are so many
more platforms to get your programming. Nielsen now has Digital Ad Ratings,
which provide next day ratings for ads that are comparable to TV ratings (Nielsen,
2015). Nielsen is also pursuing on-device meter panels that will integrate
audience measurement across multiple platforms with their cross platform home
panels that are said to measure TVs, PCs, mobile phones and tablets providing
extended screen ratings (Nielsen, 2015). Nielsen plans to capitalize on cross

8
platform measurement by attaching meters to peoples PCs, tablets and mobile
phones (Nielsen, 2015). Allowing a company like Nielsen to track your television
viewing is one thing, but tracking their cell phone is quite invasive. There is
suspicion about how flexible and willing people will be to allow Nielsen to track
their personal devices in order to provide substantial data. Will people go that far
for a couple extra bucks a year? Are meters on phones and tablets even necessary?
There may be a simplified way to do this, just by tracking the information that is
already out there and available.
Nielsen and McKinsey & Company acquired SocialGuide back in 2012
which was inspired around the idea that Twitter and social media has changed the
traditional way television was viewed (Nielsen, 2012). SocialGuide identifies,
captures and analyzes data on Twitter surrounding every program aired across
247 channels. Nielsen reports that in the U.S. their online panel measures activity
of more than 200,000 internet users across 30,000 sites and extends to more than
500,000 panelists worldwide.
SocialGuide has evolved into Nielsen Social, which has now made
Nielsen the leading provider for social TV measurement, audience engagement
solutions and analytics and this information is given to TV networks, agencies
and advertisers. Nielsen social also provides Twitter TV ratings and TV related
conversation via Twitter and with these measurements they aim to provide an
understanding of this information so that people within the industry can act on
this data.

9
Research Questions
1. How can this industry accurately measure the television audience when there
are so many more factors involved that now dictate how people watch TV?
2. Can current ratings systems be a solid and accurate enough form to move
forward?
3. Will there need to be new tactics and technology in place to grow and keep up
with this evolving television market?
4. Does Netflix’s business model affect the current television model and is it
foolproof?
10
CHAPTER 2: REVIEW OF LITERATURE
Netflix
Netflix is now a competing entity in the television world as it is now a
network but not competing with traditional television in terms of ratings (Barr,
2015). The Netflix Web site describes the company as “the world’s leading
Internet television network.” Reed Hastings, the CEO of Netflix said in an
interview with Ken Auletta of the New Yorker “We are to cable networks as cable
networks were to broadcast networks,” arguing that the linear television
experience with programs offered at set times is “ripe for replacement” (Auletta,
2014).” In April, 2015, Netflix made a deal with Marvel for its new series
Daredevil, which will air on Netflix. ABC currently airs and produces Marvel’s
Agents of S.H.I.E.L.D but are ultimately okay with the deal as ABC studios is
serving as the producer of all Marvel series despite their home (Barr, 2015). With
Netflix now producing their own content and releasing the entire season of their
shows at once, they have definitely created something innovative that content
providers have never done. Netflix took advantage of the trend they saw in their
users, “binge viewing.” With this knowledge they developed their own content
and it has been a hit. Ted Sarandos, chief content officer for Netflix had the big
idea to expand their content to original programming, which led to the political
drama, House of Cards, Sarandos biggest move yet (Ascharya, n.d.). Within the
first few weeks of its release, House of Cards became Netflix’s most watched title
(Freid, 2013). After investing 100 million into the first two seasons of House of
Cards, Sarandos adds that “the show is paying off not only in advertising, but also

11
increased subscribers and credibility among Hollywood” (Ascharya, n.d.). As of
December 2013 Netflix had four series that have been renewed for season two
and or beyond. These series are:
Lilyhammer, a Comedy-drama
House of Cards, a Political drama
Hemlock Grove, a Horror/thriller
Orange Is the New Black, a Comedy-drama
Below are ratings for each of the four Netflix series from two websites,
metacritic.com and IMDB.com gathered from each website January, 2014. These
ratings are based off of user ratings. For example: IMDb invites users to rate any
film on a scale of 1 to 10 and the totals are converted to a weighted mean which
displays next to each film. They also have filters in place to avoid ballot stuffing.
However, metacritic.com comes up with a score by converting each review into a
percentage that the site decides for itself and that is how they come up with the
percentages listed on the website.
Table 2.1 Netflix Original Series viewer ratings from Metacritic and IMDB
Series Metacritic rating IMDB rating IMDB # of votes
Lilyhammer 62% 7.6/10 6,833
House of Cards 76% 8.8/10 65,540
Hemlock Grove 44% 7.1/10 13,202
Orange Is New Black 79% 8.5/10 38,780

12
Netflix does not provide ratings for any of its content and Forbes considers
it a brilliant marketing tactic. In a Forbes article written by Dorothy Pomerantz
points out how ratings silence is a great tool for Netflix because it leaves room for
people to wonder (Pomerantz, 2014). Because Netflix does not report ratings,
there is never really a concrete number that states how many people did or did not
watch a show. With House of Cards being their flagship show, it is best not to
reveal how well it is doing compared to previous seasons or even other Netflix
original series. It is better to assume many of Netflix’s original series are hits than
to have factual numbers that solidify whether this is or is not the case. Besides,
once they announce viewership for one show, investors will expect them reveal
much more information about how many people are watching in general.
For Netflix to be relatively new to the original series production regime,
they are doing extremely well and winning awards. House of Cards and Orange is
the New Black alone has won numerous awards. Orange is the New Black has
won 31 awards and has 55 nominations and House of Cards has won 14 awards
and has 87 nominations (Hernandez, 2014). Including Golden Globe, Emmy, and
SAG award wins. Furthermore to show how successful Netflix is doing in the
original series world, they currently have over 30 new series scheduled for future
programming
The interesting thing about Netflix and its viewers is some things never
change. A lot of traditional television shows that air during primetime started
being viewed through third party sources online. According to a survey conducted
by Ipsos (MediaCT, 2013), 3 in 4 primetime TV viewers between the ages of 13

13
and 64 have used an online service to stream or download TV (marketingcharts,
2014). This chart shows that 76% of primetime TV viewers between the ages of
18-34 stream majority of their TV shows via YouTube. It also shows that 53% of
them stream them through Netflix and 35% watch through the television networks
website. Though the persons ages 18-34 tend to use more of the online resources
than the 13-64, the difference is still very close, suggesting that this trend is
becoming more and more common than not. Below is a chart by Ipsos MediaCT
that shows some of the sources used by primetime TV viewers:
Source: Ipsos MediaCT
Figure
2.1
Online
TV
Show
Sources
Used
by
Primetime TV Viewers
There are more sites like primewire, Zmovie and Watch32 which allow you to
stream content online but are banned in places like the United Kingdom due to
copyright infringement and considered illegal. Movie25 and Ovguide are also
resources that allow users to watch TV shows and movies for free not requiring

14
membership at a cost and their taglines when entering the site is “watch free
movies online.” Broadcast and pay TV providers then capitalized on this and
started to offer their content online for their viewers. This gave customers and
viewers that did not watch their shows via TV a way to view the shows online
hassle free with few ads and mini commercials which are advertisements that run
anywhere from five seconds to 30 seconds.
There were rumors of Netflix proposing a deal with Comcast in 2012
(Cheredar, 2013) “In 2012, Comcast initially rejected a proposal by Netflix to
bundle service with its cable TV service, opting instead to pursue its own on-
demand video service Streampix. But since Streampix — or any other offer from
a cable provider — has failed to slow momentum or popularity for Netflix, the
negotiations are apparently back on.” (Cheredar, 2013). Now there is talk again
with Netflix and Comcast to join forces, allowing Netflix to stream their content
via Comcast cable boxes (Molina, 2014).
Streampix is Xfinity’s online on-demand service. It launched February 23,
2012 and streams media content online. It was designed to compete with services
like Netflix and Hulu. According to Wikipedia, they have shows from “ABC,
NBC, Scripps, Cookie Jar and Lionsgate as well as movies from Sony Pictures,
Universal, Snag, Lionsgate, Disney and Warner Bros” (Gorman, 2012). At the
time of this writing Streampix costs $4.99 per month, but if the customer has one
of Xfinity’s premiere or plus packages, they have access to the service at no
additional cost. Because of Comcast Xfinity’s Streampix service, they had chosen
to fight Netflix instead of team up.

15
When comparing Netflix to pay TV, it seems as if Netflix is a competitor
to Comcast especially in terms of pricing. Comcast bundles are pretty high when
compared to Netflix low cost of $7.99 per month with access to a plethora of on
demand entertainment. Netflix is very eager to join forces with a major U.S.
MVPD (multichannel video programming distributors) it is just a matter of
determining whether or not Netflix is a complement to their service or a
competitor. MVPD’s are companies that operates multiple cable or direct
broadcast satellite television systems. A cable system in the U.S. is any facility
serving a single community with its own franchise agreement with a cable
company. Today the term is used more to reference companies that own a large
number of cable systems like Comcast, DirecTV, Dish Network, Time Warner,
COX cable, Verizon Communications, AT&T and other major companies like
these. MVPD’s are service providers that deliver video content for a fee or pay
television. Examples of companies like this include AT&T U-verse and Verizon
Fios.
Netflix is not a replacement for linear television. It does not offer service
like live TV, sports, news, all things that are preferred live. Netflix is more similar
to HBO, different from pay TV. It is not competing with pay TV or replacing it,
but simply an extra entity. There are benefits for both Comcast and Netflix.
Comcast may decide that the cost of licensing its library of content may be too
much that it almost makes perfect sense to go into business with Netflix. Joining
forces can boost leverage for cable operators when it comes to bargaining with
programmers. If a distributor were to threaten to pull a signal, the cable operator

16
could hold subscribers over by utilizing its Netflix inventory until a deal is
worked out. Cable TV with Netflix would also give leverage over satellite and
Telco because satellite TV is more limited than cable and this can be a way for
cable to up sell their packages by upgrading customer’s broadband speed to a
more expensive package.
The partnership would grant Netflix another outlet to stream their services,
which is good for both current and future subscribers. Comcast will be able to
offer another attractive service using the same distribution channel as their live
TV viewing (cable box). This may make many customers happy and could be
something that can prevent them from cutting the cord. Ultimately, many pay TV
customers would have Netflix subscriptions. Those who want both can have both
and those who only want one over the other can keep that as well.
Open Connect, Netflix’s content delivery system, may be the only thing
standing in the way of Netflix partnering with major pay TV distributors. Flint
(2013) reported in the LA Times that Netflix wants their Open Connect systems
to be installed within the broadband provider’s networks. This service is offered
by Netflix free of charge but there are costs to the broadband provider. That alone
is one concern and the cable providers have reservations because allowing Open
Connect into their network may be the start of a lot more demands from Netflix.
Netflix’s stance is there is no hidden agenda, Open Connect just allows for better
and smoother transmission of Netflix content to subscribers (Flint, 2013).
Netflix reached an agreement with Virgin Media in the U.K. Virgin Media
is the first service provider to offer all four broadband, mobile phone, home phone

17
and TV in the U.K. They serve over half of U.K. homes. Initially they did a trial
testing the service with only 40,000 subscribers. Now they are offering it to all 1.8
million subscribers who have a TiVo box. This service also launched in Sweden
with Com Hem, the largest cable operator there. Suddenlink has provided TiVo
DVR’s since 2010. Suddenlink had been interested in offering Netflix on TiVo
sets for a while but licensing deals with studios prevented that. Recently Netflix
eliminated those restrictions in new deals, which allowed for Netflix and Virgin
Media to partner and distribute Netflix through TiVo boxes.
Virgin Media (2013) announced “New and existing Virgin Media
customers can enjoy an unprecedented six month gift subscription to Netflix if
they sign-up to Virgin Media’s Premiere or VIP Collections2. Virgin Media TiVo
customers on other packages will be able to make the most of the one-month free
trial offered to all new Netflix members,” which can further grow both Virgin
Media and Netflix members. People seem to enjoy watching Netflix on their
TiVo, Virgin Media (2013) says:
“Following a successful pilot, Netflix is available in the Apps & Games
section of Virgin Media TiVo and coincides with the latest updates to
Virgin Media TiVo for all customers. From greater energy efficiency for
each set-top box, to improved WishLists™ and recommendations, Virgin
Media continues to develop the service, making Virgin Media TiVo the
best way to watch TV, ever.”
Netflix is looking to set the tone for the U.S. with its success in the U.K. Since
Netflix’s success in the U.K., they have reached agreements with three small
cable providers in the U.S., which collectively consist of 820,000 subscribers
across nine states and Washington, D.C. These three companies consist of
Atlantic Broadband, RCN Telecom Services and Grande Communications. By
18
May, 2014 all companies will have Netflix services offered as another channel,
except it relies on high-speed internet to deliver its content.
Over the Top Viewing should be something embraced in the Television
industry specifically sales and marketing. It is an added incentive for all parties
involved, consumers, networks and broadband providers. Television providers
could use the additional viewership information that can be obtained through OTT
providers and capitalize by selling those views in new ways like product
placement, advertisement integrated within television shows. The time has come
when people demand things instantly and all at one time. Binge viewing is at an
all time high, Netflix conducted a survey that examined how people watch TV.
The results were exciting for Netflix as they supported everything they stand for,
which is, people like having the entire season of a show up front, so they can
decide how they want to watch the show. Projectcast (2013) reported that
Netflix’s survey indicated majority (73%) of the people surveyed defined binge
viewing as “watching 2 to 6 episodes of the same TV show in one sitting” (A.,
2013). There were 3,078 adults 18 and older surveyed and 61% of them said they
binge view regularly and 73% of the people surveyed reported having positive
feelings about binge-watching streaming TV content. The survey also said that
79% of the people surveyed feels that binge viewing makes watching the actual
show a better experience. Marketingcharts posted this chart of a poll conducted by
Harris Interactive:

19
Figure 2.2 Binge Viewing of TV Shows
http://www.marketingcharts.com/online/where-do-primetime-tv-viewers-find-tv-
shows-online-39562/
The above chart illustrates the amount of people that have ever watched TV on
their own schedule. One of the interesting things this chart points out is that the
younger adults that were surveyed watched TV on their own the most when
compared to adults over 29 years old. However, there is only an 18% gap between
people who are 54 years old and below and people who are 55 years old and up,
thus indicating that the trend for the future of television viewing habits will be
that most people will watch television on their own schedule. The chart also
illustrates that there is only a 3% difference between how many men and how
many women watch TV on their own time.

20
Netflix, Hulu, Hulu Plus and Amazon Prime Instant Video all have seen
an increase in just one year. Television managers have to embrace the changes
that are happening and join in. It would be a great idea for pay TV distributors
like Comcast and Time Warner to collaborate with companies like Netflix and
Hulu and even Google TV once all of the kinks are worked out, it will all be for
the better and future of television. Netflix’s Open Connect may be one of the only
issues standing in the way.
OTT, The Future of TV
If a company like Verizon or DISH sold TV service the same way Netflix
streams its service, just by signing up online and downloading an app, it would
give many users flexibility and options. They would then have television
everywhere because every device is now a television: cell phones, computers,
laptops, iPads, tablets, iPods. In January, Verizon spent around $500 million to
acquire Intel’s internet TV project OnCue, which is a business division dedicated
to the development of Cloud TV products and services and the possibility of
wireless over-the-top play (Stelter, 2014). Sony and Viacom announced their
distribution deal and virtual pay-TV service which will stream at least 22 Viacom
cable channels at its launch (Baumgartner, 2014) as well as access to Viacom’s
full on-demand package. These stations include BET, CMT, Comedy Central.
Gospel, Centric, Logo, CMT Pure Country, MTV Hits, MTV Jams, MTVU,
MTV, MTV2, Nickelodeon, Nick Jr., Nicktoons, Spike, TV Land, VH1, BET
Palladia, TeenNick, and VH1 Classic.

21
Walt Disney, owner of ABC and ESPN joined DISH Network in a deal
that will allow Dish to stream Disney programming all via internet connected
devices. DirecTV, Dish’s main satellite TV rival, said they are also in talks with
Disney. When these services start to launch, major cable incumbents like Time
Warner and Comcast will soon follow with their own services.
HBO’s CEO Richard Plepler announced that they will launch standalone
over the top services in 2015. They plan to work with current partners and explore
new partners. This decision was inspired by HBO Go success and the company is
ready to remove barriers and allow access to all that want HBO. HBO currently
has 30 million subscribers compared to Netflix’s 37 million. Going Over the top
will open up more options allowing them to make hundreds of millions of dollars
and Plepler feels the international revenue can be just as large if not larger with
OTT (Littleton, 2014). Plepler also noted that HBO seen a 40% growth in 2014
compared to 2013. HBO’s decision to go OTT reinforces Jeff Bewkes, chairman-
CEO of Time Warner, statement that Time Warner’s earnings will more than
double in the next few years by focusing on three of its core businesses HBO,
Turner Broadcasting and Warner Bros. This break through will allow consumers
to pick what they want and have content sold directly to them (Littleton, 2014).
Time Shifted Viewing
Time shifted viewing is the act of recording a program onto a device and
viewing it at a later time more suitable to the consumer. Usually this refers to
22
television, but it can refer to audio or radio via podcast. This is a way to download
audio shows after they have aired.
Today, time shifted viewing comes from a digital video recorder (DVR)
which now come integrated with cable or satellite subscriptions (Buck, 2013).
Dual tuners can exist within one receiver, allowing users to record multiple
programs at once on a regular and reoccurring basis, or watch a program while
recording another. Some even output to multiple televisions on one cable
subscription (Buck, 2013). This made time shifted viewing more popular,
especially because it allows the user to stop, pause, rewind and fast-forward. It
also allows one to watch a program from the beginning while it is being recorded.
Prior to the DVR, time shifted recording took place with a video cassette recorder
(VCR) via a timer function.
According to a study conducted by Kantar Media Futureproof, just over
half the people they surveyed still prefer to watch television at the time of their
broadcast. Audience measurement suggests that 84% of all television watching
occurs at the time of broadcast. Kantar Media surveyed 2,000 people via
telephone and found that “among those with a digital video recorder or access to
on-demand services, the research suggests that there is a hierarchy of viewing
choices for people, with live television remaining the preferred viewing option for
just 51%, followed by recording to watch later by 34% and viewing on demand at
10% ” (Kantar, 2013).
Age is another factor that affects viewing habits and the research being
conducted. Kantar’s study compared results of those who did not own a DVR or

23
watch on demand and it pointed out that 51% of those who were not actively
using DVR or on-demand were of the age 55 or over. Their study also pointed out
those who were under the age 35, were less likely to choose live television. The
break down of the stats for under 35 years old was 40% live TV, 37% DVR and
17% on demand. Age is an important factor in all of this because as the younger
adults and teens get older, their norm will be time shifted viewing and on-
demand. Those who still hold on to live viewing habits are those who may still
hold on to traditional viewing habits, which ties into the above chart from Harris
Interactive that also revealed that younger adults are more prone to watching TV
when they want to verses older adults that were less likely.
Most people who watch on-demand use it for when they want to catch up
on a program in bulk, watching 3 or more episodes of a show. Generally, those
who own a DVR are already less likely to watch a program when it airs live.
Futureproof revealed that DVR’s are viewed as more reliable than on demand. Of
those surveyed “64% of DVR users say they feel more at ease setting their DVR
to record a TV program than relying on on-demand services. 58% use the DVR
rather than on-demand so they can keep access to programs for longer” (Kantar
2013). Though DVR’s and on-demand both play a role in time shifting, they are
used and viewed differently by its users. Consumers utilize them each differently.
To summarize Kantar Media Futureproof qualitative research, Trevor
Vagg, Director, comments that the research indicates “live television is seen as a
convenient way to transition from work to relaxation and the best way to
experience “unmissable” moments. However, the ease of use and convenience of

24
DVRs is leading viewers towards a preference for being in control of when they
watch their favorite programs.” Vagg’s sums up the role of DVR and on-demand.
Overall, consumers will always look to live TV for sports, news, entertainment
and award shows (Kantar, 2013).
The new shift in television viewing habits has also caused network and
cable executives to compete with themselves (Littleton, 2014). DVR playback
during primetime hours has reached the point where DVR ranks as the number
one network. The ratings generated by viewers opting to watch time-shifted
programs, from across the television dial, are equivalent to the averages of the Big
Four networks combined. (Littleton, 2014). In comparison to the 2008-09 season,
“the year after Nielsen introduced DVR ratings measuring the seven-day period
following a program’s premiere, 83% of program viewing was done live, while
8% was done on the same day and 7% within the first three days. Five years later,
live viewing has dropped 27% and live same day viewing spiked 75%. Viewing
within three days has increased 20% Littleton, 2014).
Beyond 7
One thing that is always up for debate is when viewers are actually
watching time-shifted programming and if it matters “Beyond 7,” meaning
beyond live plus 7 days after a program airs. Nielsen conducted a pilot study and
for the first time they measured the 8-29 days (Beyond 7). The data reported that
the vast majority of people watch shows within the first 7 days. The results also
showed that “Respectively, among the top 10 shows in broadcast and cable to
report Beyond 7 figures, just over 5 percent of viewing happens within this time

25
period, affecting ratings” (Nielsen, 2013). Thus implying ratings beyond 7 days
are not really important to measure regularly because they do not affect ratings
enough where it would matter financially by bringing in such growth that it
allows sellers to charge more for advertisements.
Programmers strategically plan and schedule their shows according to how
popular the show is or how well the show did in its time slot the season before.
They also focused heavily on lead in and lead outs, which is used to retain
viewers from the previous show onto the next show and vice versa. With DVR’s
now in the mix, people are left to wonder, how important time slots are and if they
matter? Merrill Barr, a Forbes contributor who writes about the television
business suggested the answer to that question is yes. Time slots are no longer
important because they are competing against other networks and shows. They are
about competing against viewing habits. Knowing that the 10p.m. time slot will
accumulate and make up much of its audience in time shifted viewing is
important.
Nielsen’s numbers have been questioned for years because they did not
always include the numbers after live viewing and because the divide between
live and time shifted viewers were massive. It was necessary for these numbers to
become traceable. Barr (2013) sums up his idea on time slots and why they are
important by saying yes they matter but you have to understand why “It’s not a
yes because DVR doesn’t matter; it’s a yes because it does. Perhaps now, more
than ever.” It is the job of television managers to try and monetize and get credit
for this audience.

26
Nielsen Social
Nielsen Social provides these measurements to over 90 agencies and
advertisers. Now measuring 250+ U.S channels within a three-hour window -/+
capturing 25,000 different TV shows (Nielsen, 2014). Nielsen reports that they
measured over 990 million tweets in 2013. They also found that 84% of smart
phone and tablet owners use their devices as a second screen while watching TV
at the same time and 40% of U.S tablet and smart phone users visit a social
network while watching. This acquisition was definitely a good one in terms of
looking into the future of television and its online presence (as Twitter acquired
Bluefin Labs.) Nielsen Social compiles charts that give information like the
average audience a show had and the average number of tweets a show had. This
information is gathered over a certain period, usually September to May and then
released with a ranking and its average performance. Nielsen measures this
information starting three hours before the show airs, during and three hours after.
Nielsen Social also compiles a chart that highlights TV’s biggest moments
(Nielsen, 2014). For example, if there was a sporting event or award show that
caused a lot of commotion on social media with an outstanding number of tweets,
that will be highlighted as one of TV’s biggest moments for that particular week
or month (Nielsen, 2014). Here are some examples of how Nielsen social
compiles its data:

27
Figure 2.3 Top Ten Series on Twitter

28
Figure 2.4 This Season’s Biggest Moments on Twitter (Nielsen, 2014).
Many people turn to social media to write and chat about their favorite
shows. Majority of this happens while shows are live. This information does not

29
always come with specific demographic information, but it is real, it is free, and it
comes straight from the consumers. Measuring a shows online presence the day it
airs is a great way to measure a programs audience. Nielsen Social offers the
opportunity to gain an idea of how shows that are not measured by Nielsen (pay
TV shows, premium channels, and subscription based channels) are doing.
Above, Nielsen Social put out a chart that listed the top ten shows on Twitter from
September 1, 2013 to May 25, 2014 and Game of Thrones which airs on HBO
came in at number five. Because of this, there is now a way to measure shows that
did not participate in Nielsen ratings process before.
Online viewership has been viewed as not as important because they do
not show ads that are shown during the television broadcast. Until this changes,
online viewers will continue to be seen as a separate, less important entity than
the main shows ratings. Commercial ratings play a major role in the ratings
system. “The numbers that networks and advertisers actually use — to sell ads, to
set prices, and to decide on the fate of a show — are commercial ratings,” says
John Herrman (2011), Splitsider contributor, “In other words, advertisers do not
care how many people are watching a show nearly as much as they care how
many people are watching their ads” (Herrman, 2011). Many people watch live
and social media is a great indicator that supports that. During live television,
viewers are unable to fast forward through commercials which also mean they
almost have to be watching the ads. However, channel surfing still has an affect
during live TV and C3 ratings, which are ratings for average commercial minutes
in live programming plus 3 days. There is a lot of fuss in the industry between

30
programmers/networks who now want to shift to C7 (commercial ratings for 7
days) and agencies who do not want credit and pay for that much delayed
viewing. Each side has their differences, though it’s been said that there is little
increase in the four extra days, research analyst say that live plus 7 days accounts
for 90% of all viewing. Commercial ratings became available May 31st, 2007.
Nielsen, advertisers and networks all acknowledge that Nielsen ratings
reported do not reflect a show’s full audience. Viewers are really not invested in
the process of television ratings. They may be aware of them but the majority of
viewers are not aware of how the system works or of the impact. They only
become aware of ratings when a show they “love” is cancelled due to low ratings.
But on an on-going basis, ratings are not a high concern of the viewing audience.
Nielsen Data
It is widely acknowledged in the industry by buyers and sellers alike that
Nielsen ratings are not 100% accurate. They have allocated a 10% margin of error
and it is the standard used in advertising negotiations. As a matter of statics, there
is at least a 10% margin of error in the numbers. When a seller sells an advertising
schedule, he or she will usually agree and guarantee delivery of a certain number
of ratings points. If the seller does not deliver that number, the buyer will usually
expect to receive make good points to get up to that number. However, if the
seller under delivers by about 10%, they would usually maintain that the deliver
was “close enough”. Most buyers will accept the post coming in within 10% - but
some will still insist on the full guarantee. Of course if the seller over delivers by

31
10%, the buyer does not have to increase their purchase price. It all comes down
to what is guaranteed –and what the buyer and seller negotiate in terms of ratings
point delivery.
Diaries tend to be the most problematic form of measurement because
participants are asked to write down everything they watch everyday and the
times they watch. Then the diaries are mailed in to Nielsen each year during
“sweeps” which are the months of February, May, July and November. Nielsen
receives over two million paper diaries from audiences across the country. Who is
to say that information is 100% accurate? There are also long wait times for the
data. But there are new ways of measurement that could affect the future of
television ratings. Ratings are the metrics by which television watching is
measured primarily as it relates to advertising dollars being negotiated. Social
media allows media buyers a chance to forecast momentum surrounding current
and upcoming shows and it also allows buyers to gauge how more much or less
they should be investing into certain networks and shows. With social media
happening in real time, it allows buyers the option to get data instantly without
having to wait long periods of time and the data can provide deeper insights.
Buyers can even capitalize on this because they now have the opportunity to have
more insight regarding future television shows, which in the end can potentially
help them when negotiating future deals.
Nielsen uses diary measurement in 154 markets. Council for Research
Excellence (CRE), a group of media measurement researched identified the
biggest problem to date affecting diary data. Local TV diaries, on a household

32
basis measures about 30% of all viewing in the U.S. but non-response bias still is
an issue (Li, 2014). There has been improvement in sampling now that they have
switched more people from phone-based sampling to address based sampling.
However, non-response bias still is a major challenge because the issue has not
been completely resolved. Due to more and more households only having mobile
phones and no longer having landlines, Nielsen had to change to address base
sampling.
The Council for Research Excellence (CRE) conducted a two-year study
to answer the question of “among those selected to write in diaries, what are the
differences between people who participate and those who don’t?” The research
conducted by CRE revealed this information below (Li, 2014):
Diary responders tend to:
• Include more whites than non-
responders
• Be over 50 years old
• Be better educated
• Have no children at home
• Own their homes for more than 10
years
• Have a landline and one cell phone
• Watch networks like NBC, FOX,
ABC and CBS
• Have cable TV at home
Non-responders are inclined to:
• Have larger household sizes with
children at home
• Be renters
• Be younger
• Include higher numbers of Blacks
and Hispanics
• Lack a landline phone but have at
least one cell phone at home
• Have several electronic devices like
computers, MP3 players and gaming
consoles
• Watch networks like Univision,
BET, MTV, Cartoon Network and
HBO and less CBS and NBC than
responders
• Have high-speed Internet at home
and watch TV shows on the Internet
• Watch TV in groups, often at a
friend’s house, or in restaurants and
bars
33
According to CRE’s research “all of these factors increase the likelihood of
ratings errors and raise the suspicion that the diaries are resulting in inaccurate
ratings,” which is something that has been suspected all the while. “Concerns
about the diaries’ reliability do not bode well for TV stations dependent on
ratings-based advertising while challenged by Internet competition and aging
audiences,” (Li, 2014) all ongoing issues surrounding television and audience
measurement.
Measuring the television audience on every platform along with ratings
remains the current dilemma and until people can predict the future of television,
this dilemma will always exist. Fortunately, this prediction might be easier to
make than most think. The industry has a crisp idea of the direction television is
headed towards. Now there needs to be a universal consensus between agencies
and networks to decide how each party can successfully utilize cross-platform
television audience measurement.

34
CHAPTER 3: METHODOLOGY
The interesting thing about television is there can be many issues and sides
to everything. Now that there are many new factors that affect the way television
is being consumed, executives and advertisers now have to adapt to these
changes. Executives in the industry all have strong opinions on the way things
should be but depending on who you are speaking to, the opinions tend to change.
Based on the information previously researched and mentioned throughout this
work, three industry executives, each from different functions, were interviewed.
Their job functions are as follows: Program Director for CBS, SVP of Research
and Electronic Measurement for ABC and Research Analyst/Buyer for Harmelin
Media. Each of them answered a set of interview questions and gave their point of
view based upon personal experience and industry knowledge, surrounding issues
within television, specifically regarding audience measurement and things related
such as cross platform viewing, Nielsen, social media, Netflix etc.
The following research questions were addressed in this study:
1. How can the television industry accurately measure the television audience
when there are so many more factors involved that now dictate how people
watch TV?
2. Can current ratings systems be a solid and accurate enough form to move
forward?
3. Will there need to be new tactics and technology in place to grow and keep up
with this evolving television market?
4. Does Netflix’s business model affect the current television model and is it
foolproof?

35
Setting
Each interview took place separately using a set of questions to be answered by
each executive. All interviews were done via telephone during a convenient time
that each participant chose themselves. Two participants interviewed from their
office which were located in Philadelphia, Pennsylvania. The third participant was
interviewed from their office located in New York City, New York. Each
interview was recorded using a voice recorder for transcribing. As each person
answered the questions, the researcher took notes and elaborated on responses
where needed. This research followed the qualitative method to gather in depth
information and perceptions from key parties involved. Race, gender, economic
status, or age did not play a role in choosing participants. None of those
characteristics were a determining factor of how the participant answered the
question. The only requirement was that the participant had to be an executive
involved in the television industry and willing to offer their personal insights and
opinions.

36
Interview Questions for Executives
1. What issues surround audience measurement?
2. What issues surround Nielsen? (buyers/sellers point of view)
3. Do you know of ways Nielsen is looking to improve their systems?
4. Are audiences measured fairly? If yes, why do you say that? If no, why not?
5. Are the measurements accurate? (This question can be answered in your own
opinion.)
6. How important is social media when it comes to measuring audiences? Do
you find it very important? As important as television audience measurement?
7. How is social media currently being used to measure audiences?
8. Will it ever be as important as live television viewing?
9. How important is live + same day, live +3 and live +7?
10. How can we make the online viewing/cross platform audience relevant in
audience measurement?
11. Do you know of any other apps or social websites that have an audience that
also includes their demographics?
12. Should people be allowed to sign up on their own to be a Nielsen family?
13. What role does Netflix/Hulu play in audience measurement? (If any)
14. Do you think Netflix or Hulu should have an impact on audience
measurement data?
15. How will Comcast and Netflix joining forces affect the future of television?
How will it affect the future of audience measurement?
16. Are their any other suggestions you would make that could improve audience
measurement? Or anything else you would like to add in general?
Prior to each interview, the participants engaged in a 5-10 minute phone call that
described the researched being conducted, answered all questions and set up times and
dates to conduct each interview. After the phone call, each participant was emailed the
interviews questions for their review.

37
In order to further answer research question number four (Does Netflix’s business
model affect the current television model and is it foolproof?), the researcher conducted a
survey on Facebook. The following question was posted on the researcher’s Facebook
status RQ1 “If you've ever watched Orange Is the New Black, House of Cards,
Lilyhammer, or Hemlock Grove, please like my status.” Every person that “liked” or
replied to the status was then asked this question RQ2“Which show(s) did you watch and
did you watch it on Netflix or through another website or download etc?” The
respondents that answered saying they watched one of the shows on Netflix were asked
RQ3 “Do you have your own Netflix account or is it shared?”
Every participant’s response was at freewill and not solicited beyond that status
post. Race, gender, economic status, or age did not play a role in choosing participants.
The only requirement was that they had watched one of the four aforementioned Netflix
shows and had to be “friends” on Facebook with the researcher.
Data Analysis
The data collected from the interviews with the executives was first transcribed verbatim
to make it easier for the researcher to visually track and organize information. Then each
response was categorized to match the order of the interview questions. Quotations were
selected from the interviews and then matched with research questions.

38
The data collected via Facebook survey was added up and calculated and put into charts
to help the researcher analyze and interpret the results of the study.

39
CHAPTER 4: RESULTS
This section is a narrative compiled by the researcher of all the information
interpreted and inferred from the interviews conducted with industry executives. A 16
question interview took place with three executives over the phone and the responses
were later transcribed and compiled to reflect the participants’ true meaning.
When it comes to Nielsen, the issues involved are endless. The issues from a
seller’s point of view are sample size being high on the list, precision, diversity and the
rapidly changing way that people consume media. However, there are also problems
within fixing these issues. There is no universal metric that can be applied to all platforms
(which would be ideal). The issue here is there is a different criterion that constitutes a
view for each. In television you have to view for five minutes. Online, it is only one
second, and out of home or outdoor is not actually being measured yet, but for example a
number is assumed based on how many people cross the street at a certain intersection on
a given day. Therefore it can be assumed that that many people viewed a certain ad.
The quality of measurement is another problem area. There is a misperception
that the internet is the most measured, though that may be true, it is not the best
measured. ABC executive pointed out the fact that web metrics were designed by what
engineers saw being done, meaning, it is based off of consumer habits, knowing that a
person scrolled past an ad, does not indicate that the person saw it or they related to it.
ABC executive also referenced the ease of internet surveys and how they have helped the
web gain so much credibility. Web measurement is not as controlled as television and
radio so it allows for a lot of manipulation. Online, there is a code embedded on a page,
40
you can embed the code anywhere on the page, top, middle or bottom. Sometimes an
image is not completely loaded (depending on the speed of the person’s internet) and the
view can be counted even if the person did not see it in full. The publishers place the
codes themselves. So they have the freedom to do anything. The Media Ratings Council
has recently given the okay that now allows for viewable impression currency. A
standard for a viewable display impression is a minimum of 50% pixels in view of 1
second. In browser video viewability counts when a minimum of 50% of pixels are
loaded and it has been viewed a minimum of 2 seconds. After the MRC conducted an
audit examining the variances across viewability measurement, they concluded that the
variances can be narrowed down to a plus or minus 5-10% across vendors (MRC, 2014).
Some of the issues surrounding Nielsen from a buyer/seller point of view consist
of a few things. Currently Nielsen is trying to keep pace with studying product placement
so they can try to implement that. Some people might say the samples are too small
(about 30,000) people. The web says that ratings are not just limited to 30,000 people,
there are millions of people. As web measurement evolved and web samples became
bigger online, it started to focus more attention on Nielsen’s sample size. Also, Nielsen
always has the inclination that they are off by a certain degree and the seller thinks the
ratings are off and really a little higher and the buyer thinks they are a little lower. The
two usually meet in the middle to post a commercial schedule. It now seems like that
variance has grown. Sellers try to sell at a much higher number and the buyer is a lot
farther from that number, which ultimately means that a lot more negotiation has to
happen between the two.

41
In a phone interview conducted with Terry Maher (T. Maher, personal
communication, June 17, 2014), a research analyst/buyer at Harmelin suggests that sellers
want anything that helps them sell, whether it is legitimate or not. He then states “buyers
want to know how much of the target audience actually watched the advertiser’s
commercial. That’s all that matters. The TV networks and stations provide the bulk of
Nielsen’s TV audience revenue so buyers are skeptical that we’ll ever get what we really
need. We won’t get it if the information hurts the stations” (Maher, 2014). Maher openly
admits that as a buyer he is “rather biased as to what sellers want, because majority of
Nielsen’s revenue come from television networks, buyers will never get what they feel is
necessary, which is to have the information included in ratings that tells what
commercials are actually being watched” (Maher, 2014). With the DVR and On-Demand
viewing, advertisers do not know if commercials are being skipped or viewed. Maher
says there needs to be research that will help determine that and to the detriment of TV
vendors, advertisers assume that no one with the option to fast forward will ever watch a
commercial.
One thing that seems to be universal when it comes to executives and Nielsen is
that they all feel that Nielsen measures audiences accurately. No one feels that Nielsen
has a bias or that they are purposely not including people. The reality is, that it is almost
impossible to have an accurate representation, however Nielsen national sample is
perceived in the industry as the best sample available because it is seen to be the best
sample, and Nielsen’s sample is supposed to reflect the demographic and they come very
close. The hope is for Nielsen to be closer to accurate than they currently are.

42
Social Media and Ratings
Social media is viewed differently by each of the executives that were
interviewed. During a phone interview with Program Director Perry Casciato (P.
Casciato, personal communication, May 9, 2014), he feels that social media can be really
interesting in the sense that it can be a sign post of how engaged the audience is. Social
media can tell you what’s buzz worthy and what’s trendy. It is a pop culture item. For
example the ABC series Scandal, it had a lot of buzz then it ultimately became a hit.
Social media brought it a lot of attention and that turned into a bigger audience down the
road. When it was building its audience it did not have as much buzz and its fan base was
not as big. Two years later everyone is now able to see that all the fans via social media
did actually end up watching and now ABC and the advertising community can negotiate
off of the actual number. An advertiser would not have been comfortable negotiating off
the currency of social media buzz because an advertiser would not know that the persons
talking about a show via social media is actually going to watch the show.
An SVP of Research and Electronic Measurement for ABC does not find social
media to be valuable because a person for example, tweeting about a show does not
indicate they actually watched a show. SVP of Research and Electronic Measurement for
ABC say in their words “does having a bazillion likes mean anything?” Maher says it is
a waste of time, saying “why would one use tweets, likes, followers, etc. when you have
ratings to gauge audience measurement?” None of them think that social media is
credible enough to solely buy and sell advertising.

43
Facebook Survey Results
The survey conducted via Facebook examining the behaviors of Netflix users found that
8 of the 20 people that responded to the survey watched an original Netflix series
somewhere other than Netflix.
Netflix Original Series Viewers
Did Not
Watch via
Netflix 40%
Watched via
Netflix 60%
Figure 4.1 Netflix Original Series Viewers Results

44
The 12 respondents that watched a show via Netflix were asked “Do you have your own
Netflix account or is it shared?” Eight of the 12 people said the used someone else’s
Netflix account to watch the content.
Used Personal Netflix Account
Used
Personal
Account,
40%
Did Not Use
Personal
Account,
60%
Figure 4.2 Netflix Personal Account Usage Results

45
This survey was conducted to find out if consumers who watch internet based television
series via Netflix actually pay to watch them or did they find ways around paying in
general. The result was that 40% of them found ways around paying in general (Smith,
2013).
Percentage
# of Respondents 20 100%
# Watched on Netflix 12 60%
# Not Watched on Netflix 8 40%
# Watched on their Personal Account 4 40%
# Not Watched on their Personal Account 8 60%
Table 4.1 Summary of Facebook Survey Results
One user said that she once used to share other peoples Netflix accounts, but as she
started to use it more and more she created her own account. This may be a trend for a lot
of customers. This also shows that some people just do not want to spend money, and it is
not all about cutting the cord but simply getting as many things free as possible. Though
Netflix is much cheaper than the average cable bill which is $64.41 USD as of January
2013 (Brodkin, 2014), users still found ways around not paying for this service. Whether
it was by using someone else’s Netflix account or watching Netflix original series on
another website or download, consumers found ways to not spend money and still watch
what they like.
46
CHAPTER 5: DISCUSSION
Online television viewership has altered the way audiences consume content.
Thus forcing the industry to adapt to this trend and monetize it. Television no longer
means sitting on the couch with a remote in your hand watching a show when it airs live
on TV. One can watch TV anytime, any place and anywhere and industry executives will
have to account for these cross platform audiences. In a perfect world, the best type of
audience measurement would be completely passive. It has to require very little or
nothing at all and be representative of each market place. Nielsen can attempt to make the
data collection process more passive by adopting the PPM (Portable People Meter) and
all stations and networks would have to ‘encode’ their signal – the way radio stations do
now. It would make it much easier for the respondents – because the PPM requires very
little of them.
Set-top box data is the wave of the future. Online ad networks exist because they
can deliver online impressions on any size website. TV should be the same way. Set-top
measurement can do this. But the problem with the set-tops is identifying the individual
viewer rather than just the household. Industry executives have been discussing
impressions, which are defined as the number of people who may have seen an article,
watched something on television, heard something on the radio or read a blog or web
page. They will tell how many people watch live, live plus same day, live plus 3, how
many people bought it on iTunes etc... Then one will add all the numbers and forget the
ratings and start talking about how many impressions a show has. Radio does this already
because there are so many ways to get radio now. Television will have to follow this. The
impressions will provide the total audience that has exposure to the show.
47
Ultimately, the goal would be to get media ratings to a precise passive place,
where one does not have to do anything, or remember to carry something. Maybe
respondents can wear a patch or a microchip with a radio frequency device that picks up
when the respondent comes into the room and picks up audio code similar to PPM’s. Or
the concept of wearing some type of arm/wrist band could be used just as people wear
them to monitor their health habits, the amount of calories burned and the amount of
steps taken each day. The sample size has to get a lot bigger. It will never be 100% but
the closer the size is to 100% the better, because it will provide a lot more solid
information and this can be a combination of what Comcast has, Rentrak and Nielsen has
to offer.
Limitations
One of the hardest limitations with conducting this research was getting in touch
with television industry executives and getting them to commit to being available and
willing to speak and be interviewed. Most of them support the research being conducted
and have great interest in the topic, however their schedules tend to be very busy and
demanding which made things difficult. Another challenge was that all of the executives
that were ultimately interviewed all lived in a different state than the researcher. Having
been in the same city or state and being able to do an in person interview could have
helped spark more information and answers pertaining to the research questions. A
problem that the researcher did not initially take into consideration was the prospective
interviewee not feeling qualified enough to participate. At the beginning of the research,
there was approximately 10-15 executives set up to be interviewed, but majority of them

48
declined as they felt there were other, more knowledgeable executives that could better
answer the questions. In terms of gaining more responses, the researcher would have
reduced to interview questions to less than 10 questions and distribute it via email to
executives, allowing them the freedom and option to type their responses at a time that
was convenient for them. The assumption is that, that way, more people would be
inclined to respond based off the theory of availability being an issue. Though the
number of executives available and willing to be interviewed was lower than the
researcher initially intended to have, it did not affect the validity or substance that was
gathered from those that did participate. In terms of the Netflix survey conducted via
Facebook, the researcher could have also asked each respondent if they were current
cable TV customers, in order to further analyze the correlation between Netflix
subscribers and cable TV subscribers.
Conclusion
This research found that the industry does think there needs to be new ways to
measure television audiences. Impressions seem to be a good start to implementing a
system that gathers consumer information from multiple platforms and combined, come
up with an “impression” that represents the cross platform audience. Nielsen’s ratings are
perceived to be accurate but they can also expand the amount of consumers being
measured as well as create systems that allow measuring to be more passive. Television
and device manufacturers can start putting technology in devices that will facilitate
measurement. If every device had a way to communicate with something, research
companies could get info from 300 million people. Someone would have had to manage

49
the data, and Nielsen has the best experience with managing this type of info. If
considering set-top box data, the industry may shift to a Rentrak-type of measurement,
i.e. the audiences of ‘households with M18-34’ rather than definitely saying that M18-34
is watching a specific program. There will be new tactics and technologies to keep up
with the constantly growing and changing media industry, but Nielsen seems to
understand that and is working towards achieving the solution. Netflix is not a
replacement for traditional television but an alternative. This way of consuming content
supports the behavior of wanting everything instantly and all at once.

50

51
REFERENCES
A., Jonathan. (2013, December 14). Netflix Survey Shows People Like to Binge-Watch
TV Nowadays. Retrieved from
http://www.projectcasting.com/news/netflix- survey-shows-people-like-to- binge-
watch-tv-nowadays/
Ascharya, Kat. (n.d.). This Man Is the Reason Why Netflix Is Going to Be the Next
HBO. Retrieved from http://2machines.com/176788/
Auletta, Ken. (2014, February 3). Outside the Box: Netflix and the future of television.
Retrieved from
http://www.newyorker.com/magazine/2014/02/03/outside-the-box-2
Barr, Merrill. (2015, April 10). Marvel TV Phase II: Daredevil on Netflix Kicks Off Next
Big Thing. Retrieved from
http://www.forbes.com/sites/merrillbarr/2015/04/10/daredevil-netflix/
Barr, Merrill. (2013, November 1). In A World Of DVR Monsters, Do Time Slots Still
Matter? Retrieved from
http://www.forbes.com/sites/merrillbarr/2013/11/01/in-a-world-of-dvr-monsters-
do-time-slots-still-matter/
Baumgartner, Jeff. (2014, September 10). Sony To Take Viacom Over-The-Top.
Retrieved from
http://www.multichannel.com/news/tv-apps/sony-take-viacom-over-top/383701
Bookman, Samantha. (2015, April 15). Broadcasters finally embrace OTT tech, even if
audience is still in the driver's seat. Retrieved from

52
http://www.fierceonlinevideo.com/story/broadcasters-finally-embrace-ott-tech-
even-if-audience-still-drivers-seat/2015-04-15
Brodkin, Jon. (2014, May 16). Shocker: Cable TV prices went up four times the rate of
inflation. Retrieved from http://arstechnica.com/business/2014/05/shocker-cable-
tv-prices-went-up-four-times-the-rate-of-inflation/
Buck, Stephanie. (2013, January 1). Press Pause and Learn How Your DVR Actually
Works. Retrieved from
http://mashable.com/2013/01/01/dvr/
Cheredar, Tom. (2013, October 14). Netflix In Talks With Comcast & Others About
Adding a Netflix App To Your Cable Box. Retrieved from
http://venturebeat.com/2013/10/14/netflix-in-talks-with-comcast-others-about-
adding-a-netflix-app-to-your-cable-box/
Federal Communications Commission. (2015, February 26). FCC Adopts Strong,
Sustainable Rules to Protect the Open Internet. Retrieved from
https://www.fcc.gov/document/fcc-adopts-strong-sustainable-rules-protect-open-
internet
Flint, Joe. (2013, October 18). Netflix's Open Connect Is A Touchy Issue For Big Cable.
Retrieved from
http://articles.latimes.com/2013/oct/18/entertainment/la-et-ct-netflix-open-
connect-20131018
Fried, Ina. (2013, February 12). Netflix Says “House of Cards” Is Its Most-Watched
Program. Retrieved from
http://allthingsd.com/20130212/netflix-house-of-cards-its-most-watched-program/

53
Gorman, Michael (21 February 2012). Comcast to Launch Xfinity Streampix Streaming Video
Service, Challenge Netflix, Hulu, and Amazon. Retrieved from
http://www.engadget.com/2012/02/21/comcast-reveals-xfinity-streampix-s
treaming-video-service-chall/
Great Lakes Data System. (2015, March 5). Will OTT Channel Bundles Result in More
Affordable Entertainment? Retrieved from
https://www.glds.com/2015/03/05/will-ott-channel-bundles-result-in-more-
affordable-entertainment/
Hermann, John. (2011, January 31). Why Nielsen Ratings Are Inaccurate, and Why
They'll Stay That Way. Retrieved from
http://splitsider.com/2011/01/why-nielsen-ratings-are-inaccurate-and-why-theyll-
stay-that-way/
Hernandez, Brian. (2014, July 10). Orange Is the New Black Snags 12 Emmy Noms,
Adding to the Netflix Haul. Retrieved from
http://mashable.com/2014/07/10/emmy-nominations-netflix-orange-is-the-new-
black/
Jafar, Mark. (2014, September 10). Viacom and Sony Reach Landmark Internet
Distribution Agreement. Retrieved from
http://news.viacom.com/press-release/viacom-and-sony-reach-landmark-internet-
distribution-agreement
Kantar Media. (2013, November 15). Time-shifted Viewing Increasingly Becoming the
Norm For TV Viewers. Retrieved from
http://www.wpp.com/wpp/press/2013/nov/15/time-shifted-viewing-increasingly-
becoming-the-norm-for-tv-viewers/
54
Kantar Media. (2013, November 17). Time-shifted Viewing Becoming the Norm.
Retrieved from
http://informitv.com/news/2013/11/17/time-shiftedviewingbecoming/
Li, Anna. (2014, November 24). Nielsen Method For TV Ratings Missing Minorities,
Young People. Retrieved from
http://www.poynter.org/latest-news/measuring-audience/225876/nielsen-method-
for-tv-ratings-missing-minorities-young-people/
Littleton, Cynthia. (2014, July 30). Networks Compete Against Themselves as Time-
Shifted Viewing Spikes. Retrieved from
http://variety.com/2014/tv/awards/time-shifted-viewing-shifts-competitive-
landscape-1201271533/
Littleton, Cynthia. (2014, October 15) HBO to Launch Standalone Over-the-Top Service
in U.S. Next Year. Retrieved from
http://variety.com/2014/tv/news/hbo-to-launch-over-the-top-service-in-u-s-next-
year-1201330592/
MarketingCharts. (2014, February 3). Where Do Primetime TV Viewers Find TV Shows
Online? Retrieved from
http://www.marketingcharts.com/online/where-do-primetime-tv-viewers-find-tv-
shows-online-39562/
Martin Laura and Medina Dan. (2013, July 11). The Future of TV. Needham Insights.
Martin’s Meditations.
Media Ratings Council. (2014, March 31). MRC Lifts Viewable Impression Advisory for
Display Advertising. Retrieved from

55
http://www.mediaratingcouncil.org/033114_MRC%20Viewable%20Impression%
20Advisory%20UpdateFINAL.pdf
Molina, Brett and Barr, Alistair. (2014, August 5). Netflix in Talks to Get Service on
Cable Set Top Boxes. Retrieved from
http://www.jconline.com/story/entertainment/2014/08/05/netflix-cable-
boxes/13641609/
Nielsen. (2013, January 14). The Cross-Platform Report: How Viewers Watch Time-
Shifted Programming. Retrieved from
http://www.nielsen.com/us/en/newswire/2013/the-cross-platform-report-how-
viewers-watch-time-shifted-programming.html
Nielsen. (2015). Television: What We Measure. Retrieved from
http://www.nielsen.com/us/en/solutions/measurement/television.html
Nielsen. (2015). Nielsen Digital Ad Ratings. Retrieved from
http://www.nielsen.com/us/en/solutions/capabilities/digital-ad-ratings.html
Nielsen. (2015). Solutions, Measurement, Audience. Retrieved from
http://www.nielsen.com/us/en/solutions/measurement/audience.html
Nielsen. (2014) Comprehensive, Representative Measurement. Retrieved from
http://www.nielsen.com/us/en/solutions/measurement/television.html
Nielsen. (2014) Nielsen Social By the Numbers. Retrieved from
http://www.nielsensocial.com/about/
Nielsen. (2015) Nielsen Social: Weekly Top Ten. Retrieved from
http://www.nielsensocial.com/nielsentwittertvratings/weekly/
Nielsen. (2012, November 12). Nielsen, NM Incite Acquire Socialguide. Retrieved from

56
http://www.nielsen.com/us/en/press-room/2012/nielsen-nm-incite-acquire
socialguide.html
Ramachandran, Shalini. (2014, September 10). Sony and Viacom Reach Web-TV Deal.
http://www.wsj.com/articles/viacom-reaches-deal-to-provide-sony-online-tv-
service-access-to-its-networks-1410360690
Roettgers, Janko. (2015, January 28). A Sneak Peek at Sony’s Playstation Vue.
https://gigaom.com/2015/01/28/a-sneak-peek-at-sonys-playstation-vue-internet-
tv-service/
Parke, Julie. (2015, March 3). TV & Digital Video Everywhere: Measuring Multi-
Platform, Time-shifted Video Viewing. Retrieved from
http://www.comscore.com/Insights/Data-Mine/Measuring-Multi-Platform-Time-
shifted-Video-Viewing
Pomerantz, Dorothy. (2014, February 19). Netflix's Brilliant Marketing Tool:
Ratings Silence. Retrieved from
http://www.forbes.com/sites/dorothypomerantz/2014/02/19/netflixs-brilliant-
marketing-tool-ratings-silence/
Smith, Kendra. “Do you have your own Netflix account or is it shared?” 7 December,
2013, 1:46 p.m. Facebook status. https://www.facebook.com/iamKS
Smith, Kendra. “If you've ever watched Orange Is the New Black, House of Cards,
Lilyhammer, or Hemlock Grove, PLEASE like my status.” 7 December, 2013,
1:30 p.m. Facebook status. https://www.facebook.com/iamKS
Stelter, Brian. (2014, March 7). Get Ready for OTT TV. Retrieved from:
http://money.cnn.com/2014/03/07/technology/over-the-top-tv/

57
Virgin Media. (2013, November 12). Press Release: Virgin Media Lights Up TV Screens
With Netflix Launch. Retrieved from
http://about.virginmedia.com/press-release/9410/virgin-media-lights-up-tv-
screens-with-netflix-launch
Visual Unity. (2015, April 16). Professional VoD/OTT Just Got Affordable. Retrieved
from
http://visualunity.com/en/about-us/press/professional-vod-ott-just-got-affordable