The Role of Virtual Internet Routing Lab in Network Training · Figure 1 Packet Tracer Incorrect...
186
Research Minor Thesis Submitted for undergraduate honours degree Bachelor of Information Technology (Honours) School of Information Technology and Mathematical Sciences The Role of Virtual Internet Routing Lab in Network Training 2 December 2015 Keywords: Cisco, VIRL, education, practical learning, remote, laboratories Bradley Herbert Grant Wigley Email: herbm001(at)mymail.unisa.edu.au Email: grant.wigley(at)unisa.edu.au Author Supervisor
Transcript of The Role of Virtual Internet Routing Lab in Network Training · Figure 1 Packet Tracer Incorrect...
Research Minor Thesis
Submitted for undergraduate honours degree
Bachelor of Information Technology (Honours)
School of Information Technology and Mathematical Sciences
The Role of Virtual Internet Routing
Lab in Network Training
2 December 2015
Keywords: Cisco, VIRL, education, practical learning, remote, laboratories
Bradley Herbert Grant Wigley
Email: herbm001(at)mymail.unisa.edu.au Email: grant.wigley(at)unisa.edu.au
Author Supervisor

I
Abstract
Learning computer network concepts requires more than theoretical knowledge alone. The
learner also needs to develop a contextual understanding of how real world networks operate.
According to the literature, this is best achieved through a hands-on practical approach using
physical equipment. However, construction of a remote lab is often not feasible due to costs
and maintenance. In this work, we reviewed a number of potential platforms that could be
used for education and we attempt to demonstrate, from the literature, why these platforms
may not be ideal for network education. We investigated Virtual Internet Routing Lab
(VIRL) as a possible education platform for learning advanced network concepts. We did this
by undertaking a user study on a number of people at the University of South Australia by
measuring their perceptions, their performance and their confidence and knowledge both
before and after using Virtual Internet Routing Lab. We conclude that Virtual Internet
Routing Lab is a more suitable platform than software education platforms when learning
troubleshooting, debugging, spanning-tree port fast concepts and the Hot Standby Routing
Protocol (HSRP).

II
Declaration
I declare that this thesis is, to the best of knowledge, original work and has not been
submitted for any other assessment at any education institution, except where clear
acknowledgement of sources is made.
Bradley Mark Herbert
III
Acknowledgements
We acknowledge for the following persons for their assistance in helping to prepare this
thesis. This list is not exhaustive.
Dr. Grant Wigley
University of South Australia
Program Director
Grant was the supervisor for
the project, issuing advice on a
weekly basis
Mr. Michael Head
University of South Australia
Learner Advisor
Provided useful advice on the
structure and formatting of the
thesis.
Dr. Ross Smith
University of South Australia
Researcher
Ross provided useful advice on
how to conduct studies and the
processes to ensure ethics
approval.
Robert J. Mislevy
University of Maryland,
EDMS, Benjamin 1230-C,
College Park, MD 20742
Robert J. Mislevy was a co-
author, who kindly sent me a
copy of his paper, which
otherwise I would not have
been able to access. The
material was useful.
IV
Contents
1. Introduction ............................................................................. 1
1.1 Problem Statement .................................................................................................... 2
1.2 Research Outline ....................................................................................................... 4
1.3 Thesis Structure......................................................................................................... 6
2. Literature Review ..................................................................... 7
2.1 Review of Education Research ................................................................................. 8
2.1.1 Current Network Education Methods ................................................................. 8
2.1.2 The role of Kolb’s Learning Model in network training ..................................... 10
2.1.3 The Impact of network education in industry ................................................... 14
2.1.4 Learning Patterns of Students ........................................................................... 16
2.2 Network Platforms in network education ............................................................. 18
2.2.1 Realism ............................................................................................................... 19
2.2.2 User Interface and Visualisation in network education .................................... 24
2.2.3 Management of Platforms ................................................................................. 32
2.2.4 Perceptions ........................................................................................................ 42
2.2.5 Collaboration...................................................................................................... 47
2.2.6 Design and Complexity of Platforms .................................................................. 50
2.3 Conclusion ................................................................................................................ 53
3. Methodology .......................................................................... 56
3.1 Research Questions and Hypothesis ...................................................................... 56
3.2 Experimental Design ............................................................................................... 57
3.2.1 Experiment Overview ........................................................................................ 57
3.2.2 Detailed Process ................................................................................................. 57
3.2.3 Recruitment of Participants ............................................................................... 59
3.2.4 Justification ........................................................................................................ 60
3.3 Data Analysis ........................................................................................................... 60
3.4 Alternative Approaches .......................................................................................... 61

V
4. The Case for Investigating Cisco VIRL ....................................... 64
4.1 Overview of Virtual Internet Routing Lab ........................................................... 64
4.2 Benefits of this research .......................................................................................... 66
4.1.1 Gaps in the literature ......................................................................................... 67
4.1.2 Uncertain speculation due to lack of research .................................................. 68
4.3 Conclusion ................................................................................................................ 69
5. Experiment and Results .......................................................... 71
5.1 Experiment ............................................................................................................... 71
5.1.1 Design ................................................................................................................. 72
5.1.2 Setup .................................................................................................................. 76
5.1.3 Implementation ................................................................................................. 81
5.2 Results ...................................................................................................................... 82
5.2.1 Knowledge Statistics .......................................................................................... 83
5.2.2 Confidence Data ................................................................................................. 89
5.2.3 Analysis of Perceptions ...................................................................................... 93
5.2.4 Analysis of Performance .................................................................................... 96
5.3 Summary .................................................................................................................. 99
6. Discussion ............................................................................. 100
6.1 User Perceptions and Feedback ........................................................................... 100
6.1.1 System Performance ........................................................................................ 100
6.1.2 User Interface and Topology............................................................................ 102
6.1.3 Comparison to other platforms ....................................................................... 104
6.2 Influencing Factors and Other Considerations .................................................. 105
6.2.1 Human Factors ................................................................................................. 105
6.2.2 Limited Scope ................................................................................................... 106
6.2.3 Less than ideal sample size .............................................................................. 108
6.2.4 Selection Bias ................................................................................................... 109
6.3 Research Question Analysis ................................................................................. 110

VI
6.3.1 Are the visualisation tools, lacking from Cisco VIRL necessary for understanding
of computer networking? ............................................................................................... 110
6.3.2 What are the perceptions of students who use Cisco VIRL? ........................... 111
6.3.4 Does the additional features in Cisco VIRL help with understanding? ............ 112
6.3.5 Leading Research Question ............................................................................. 113
6.4 Key Findings .......................................................................................................... 114
7. Conclusion ............................................................................ 116
References ................................................................................. 118
Appendices ................................................................................ 122
Appendix 1 – Raw Data Results ...................................................................................... 122
Knowledge Questionnaires ........................................................................................... 122
Participant Self-Rated Confidence Data ........................................................................ 126
Participants’ Perceptions of VIRL .................................................................................. 130
Participant’s Self-Rated Learning Patterns ................................................................... 132
Practical Exercise Performance and Perceptions ......................................................... 134
Data Variation and Analysis .......................................................................................... 142
Appendix 2 – Pre-Lab Questionnaire ............................................................................. 145
Appendix 2 – Practical Booklet ....................................................................................... 150
Appendix 3 – Post Lab Questionnaire ............................................................................ 165

VII
List of Figures
Figure 1 Packet Tracer Incorrect Notification ......................................................................... 21
Figure 2 VIRL Correct Notification ........................................................................................ 22
Figure 3 Packet Tracer User Interface 1 .................................................................................. 25
Figure 4 Sample Packet Tracer Topology ............................................................................... 26
Figure 5 Packet Tracer Sample Log ......................................................................................... 26
Figure 6 CORE Sample Topology ........................................................................................... 28
Figure 7 CORE Sidebar ........................................................................................................... 28
Figure 8 CORE full UI ............................................................................................................. 29
Figure 9 VIRL Main Pane........................................................................................................ 30
Figure 10 Sample Link between two nodes ............................................................................. 30
Figure 11 NetLab UI - Example Lab Reservation System ...................................................... 36
Figure 12 Example Booking System for NetLab ..................................................................... 36
Figure 13 NetLab UI - Fixed Lab Topology ............................................................................ 37
Figure 14 NetLab UI - Example Router Console .................................................................... 38
Figure 15 VIRL Topology with External Network .................................................................. 40
Figure 16 NetLab Chat UI ....................................................................................................... 49
Figure 17 Cisco VIRL Pane ..................................................................................................... 65
Figure 18 Architecture Diagram .............................................................................................. 77
Figure 19 Network Topology For Experiment ........................................................................ 79
Figure 20 Experiment Console Setup ...................................................................................... 80
Figure 21 Results - Pre-Knowledge Questionnaire Answers .................................................. 83
Figure 22 Comparison of Knowledge Averages ...................................................................... 84
Figure 23 Results - Post Knowledge Questionnaire Answers ................................................. 86

VIII
Figure 24 STP Scores for Both Questionnaires ....................................................................... 88
Figure 25 Results - Confidence Prior to the Lab Activity ....................................................... 89
Figure 26 Results - Confidence in Networking Averages ....................................................... 90
Figure 27 Results - Confidence After the Lab Activity ........................................................... 91
Figure 28 The Average Confidence For Each Participant ....................................................... 92
Figure 29 Results: VIRL Perceptions By Category ................................................................. 94
Figure 30 Results - Average Perceptions Data ........................................................................ 95
Figure 31 Results: Exercise Data ............................................................................................. 96
Figure 32 Rated Performance Averages .................................................................................. 97
Figure 33 Most Recurring Values for Performance ................................................................. 99
Figure 34 Results - Pre-Knowledge Questionnaire Answers ................................................ 119
Figure 35 Results - Post Knowledge Questionnaire Answers ............................................... 120
Figure 36 Comparison of Knowledge Averages .................................................................... 121
Figure 37 STP Scores for Both Questionnaires ..................................................................... 122
Figure 38 Results - Confidence Prior to the Lab Activity ..................................................... 123
Figure 39 Results - Confidence After the Lab Activity ......................................................... 124
Figure 40 Results - Confidence in Networking Averages ..................................................... 125
Figure 41 The Average Confidence For Each Participant ..................................................... 126
Figure 42 Results: VIRL Perceptions By Category ............................................................... 127
Figure 43 Results - Average Perceptions Data ...................................................................... 128
Figure 44 Results: Learning Patterns ..................................................................................... 129
Figure 45 Self-Rated Learning Patterns of Participants ........................................................ 130
Figure 34 Results: Exercise Data ........................................................................................... 131
Figure 47 Results: Practical Exercise Completion Percentages ............................................ 132
Figure 48 Results: Percentage of Staff ................................................................................... 133
IX
Figure 49 Results: Learners Lab Completion Percentages .................................................... 134
Figure 50 Results: Performance in Debugging Bar Graph .................................................... 135
Figure 51 Rated Performance in various concepts ................................................................ 136
Figure 52 Observed Personality During Lab Bar Graph ....................................................... 137
Figure 53 Rated Performance Averages ................................................................................ 138
Figure 54 Results: Number of Problems Troubleshooted ...................................................... 138
Figure 55 Most Recurring Values for Performance ............................................................... 139
Figure 56 Variation of Performance Bar Graph .................................................................... 140
Figure 57 Most Recurring Knowledge Scores ....................................................................... 141
Figure 26 Left Computer Screen............................................................................................ 151
Figure 27 Right Computer Screen ......................................................................................... 152

X
List of Tables
Table 1 Summary of Learning Styles ...................................................................................... 13
Table 2 Comparison of User Interfaces ................................................................................... 31
Table 3 Comparison of Platforms (Management) ................................................................... 41
Table 4 Comparison of Simulator Features ............................................................................. 52
XI
Acronyms
ACRONYM WORD
ASA Adaptive Security Appliance
BGP Border Gateway Protocol
CORE Common Open Research Emulator
CPU Central Processing Unit
HSRP Hot Standby Routing Protocol
IP Internet Protocol
IT Information Technology
LTS Long Term Support
OSI Open Systems Interconnection (Model)
OSPF Open Shortest Path First
RAM Random Access Memory
SSH Secure Shell Host
STP Spanning Tree Protocol
SVN Apache Subversion
TCP Transmission Control Protocol
UNISA University of South Australia
VIRL Cisco Virtual Internet Routing Lab
VLAN Virtual Local Area Network
VM Virtual Machine
XII
Glossary
WORD MEANING
ABSTRACT CONCEPTS Concepts that cannot be demonstrated in a
practical way. Usually, mathematical
problems, or in the case of networking,
packet movement and understanding.
ABSTRACT CONCEPTUALISATION A stage of Kolb’s learning model that
involves the memorisation and
interpretation of facts.
ACTIVE EXPERIMENTATION A stage of Kolb’s learning model that
generates new knowledge by applying
existing knowledge to new problems;
design, planning, troubleshooting.
CLOUD COMPUTING Virtual computers that are started as
needed, and which may be stored on a
server whose hardware setup is not known.
CONCRETE EXPERIENCE A stage of Kolb’s learning model that
involves stimulating new knowledge
through exposure to a new concept.
EMULATION Software that converts instructions
designed on one type of CPU to that of the
host system, enabling the program to run.
HOT STANDBY ROUTING PROTOCOL An advanced Cisco networking service that
runs on routers and switches that has its
own MAC address. Provides redundant
gateways by allowing a single router to
represent a group of routers. Automated fail
over.
KOLB’S LEARNING MODEL A learning model often used in technical
subjects like networking to ensure sound
learning. Consists of four stages; Concrete
Experience, Reflective Observation, Active
Experimentation and Abstract
Conceptualisation.
NETWORK/NETWORKING The interconnection of hardware (or
virtualised) devices together to facilitate the
sharing of information. The configuration
of such networking and the knowledge
needed to build and maintain such
infrastructure.
XIII
NODE A node is a single unit that represents a
network device, usually a router, switch or
ASA in a topology.
PHYSICAL EQUIPMENT Actual hardware that can be touched and
experienced by the learner, such as real
routers and switches cabled together.
REFLECTIVE OBSERVATION Receiving feedback about the learner’s
progress. Facilitated by teacher providing
feedback and a practical experience where
mistakes are recognised. A stage of Kolb’s
learning model.
ROUTING A router making decisions where to send IP
packets based on source/destination IP
addresses. Rewrites MAC addresses.
SPANNING-TREE PROTOCOL A network protocol that shutdowns links on
a switch intended to be used as backups to
prevent loops from occurring.
SWITCH A device specially designed to forward
frames on a computer network. A smart
hub.
SWITCHING A switch making decisions on where to
send traffic based on source/destination
MAC addresses.
TROUBLESHOOTING A process undertaken by a person to fault-
find problems in the network, identify poor
network configuration, possible security
flaws and may include the steps to mitigate
any problems.
VIRTUALISATION Virtualisation is the allocation of
computing resources to so-called guest
operating systems to allow multiple
operating systems to run on a single
machine.
VISUALISATION Understanding a concept through seeing
different colours and imagining in your
mind how it worked if it was drawn on
paper.
1
1. Introduction
Education institutions aim to deliver high quality technical education to prepare the student
for transition into industry [1] [2] [3] [4]. It is argued that training students in computer
networking requires more than knowledge alone [5] [6] [7]. It also requires a hands-on
experience with managing and configuring numerous network equipment. However, in
remote locations including; prisons, mobile buses or in third-world countries, there is often
no infrastructure available to provide a practical networking environment [4] [7]. Even in
western countries, for instance, Australia, education institutions often cannot justify the costs
of establishing a network-training environment, especially when there are low enrolments [3].
Even when this is possible, the training labs are often small, unrealistic and waste resources,
providing a limited and unrealistic worldview of how real networks operate [4] [8] [9].
Physical networks are often hardwired, so students may not have access to change or modify
the topologies in use, preventing them with experimenting with alternative designs, limiting
their experience and understanding in a negative fashion [6] [8].
The use of software-driven emulators and simulators such as GNS3 and Packet Tracer are
now common in education institutions worldwide due to their low cost, ease of use and
flexibility [3] [10] [11] [12]. User studies and surveys undertaken on students and staff who
use Packet Tracer suggest low exam grades, despite use of the tool [12]. In a study by Ceil
Goldstein [13], Packet Tracer is seldom used to facilitate active learning.

2
1.1 Problem Statement
In this work, we reviewed a number education platforms, both hardware and software driven,
that could potentially be used in a network training environment to facilitate the teaching and
learning of advanced network concepts. We argue that these platforms, including Packet
Tracer, GNS3 and other less common platforms such as Bosten NetSims, iNetSims, ns-3 and
CORE are suboptimal for network education. We argue that realism of the network
environment is an essential aspect to facilitate learning based on experience. We derive this
from several papers [13] [14] [15]. In our view, Packet Tracer is a very good tool for teaching
computer networks but it cannot provide the full realistic experience. For example, Packet
Tracer lacks features to interface with other real-world network diagnostic tools such as
Wireshark and does not generate real traffic, potentially resulting in a distorted view of
networking [3] [9]. Moreover, if visualisation of network concepts is so important to
understand computer networks, it puts students with vision impairments at a disadvantage
[16]. Real equipment, on the other hand, is expensive and not necessarily accessible to
external students [3] [8]. GNS3, a free network emulator is intensive on resources and
emulation of switches is suboptimal, if not, impossible [11]. This limits the realism offered
by GNS3.
As studies found in the literature seem to suggest, existing platforms may not be realistic
enough to provide a realistic experience for students learning computer networking [8] [9].
Moreover, real equipment is costly and, unless explicitly configured, not accessible to
external students [3]. Emulators, such as GN3 greatly depend on being able to emulate full
embedded operating systems, but propriety restrictions may make this infeasible, if not,
illegal [9]. While software tools such as Packet Tracer can help visualise certain network
concepts, this may not help all kinds of learners, especially students with vision-impairments
[10] [16] [17]. Since 2007, cloud computing and virtualisation has been used in education to
3
address some of these issues, in particular, to address the issue of lack of realism in software
solutions [14] [18]. Virtualisation can also reduce maintenance by provisioning resources on
demand, eliminating the requirement to have dedicated training networks setup. In
impoverished nations, training environments can be provisioned in a cloud environment to
accommodate the lack of infrastructure that is available. Now here is the problem,
virtualisation is typically suited to allow one operating system to run on another operating
system. It is typically not designed to allow vendor-specific embedded operating systems, for
instance, the Cisco IOS to run in a virtual machine. A review of the tools in the literature
found that, while GNS3 can emulate some network devices, it is not used in a cloud
environment [11]. Recently, in 2014, Cisco released Virtual Internet Routing Lab that has the
ability to run full network topologies in a virtualised (or real) computing environment.
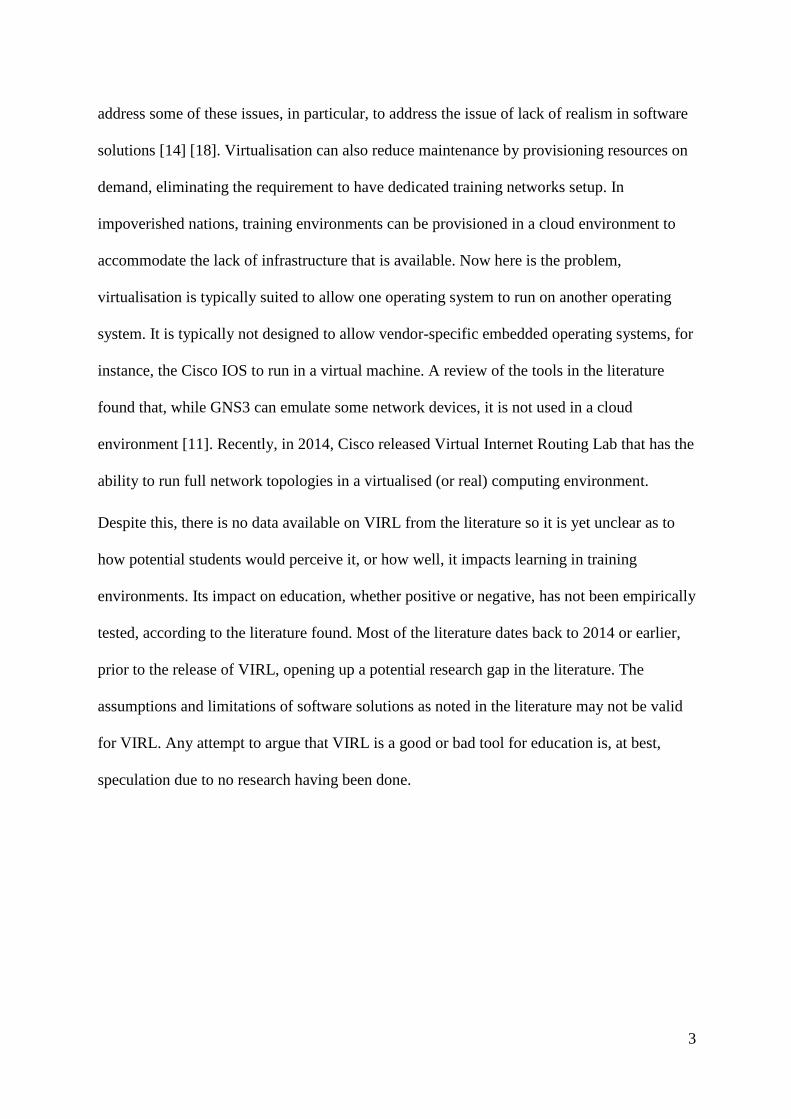
Despite this, there is no data available on VIRL from the literature so it is yet unclear as to
how potential students would perceive it, or how well, it impacts learning in training
environments. Its impact on education, whether positive or negative, has not been empirically
tested, according to the literature found. Most of the literature dates back to 2014 or earlier,
prior to the release of VIRL, opening up a potential research gap in the literature. The
assumptions and limitations of software solutions as noted in the literature may not be valid
for VIRL. Any attempt to argue that VIRL is a good or bad tool for education is, at best,
speculation due to no research having been done.
4
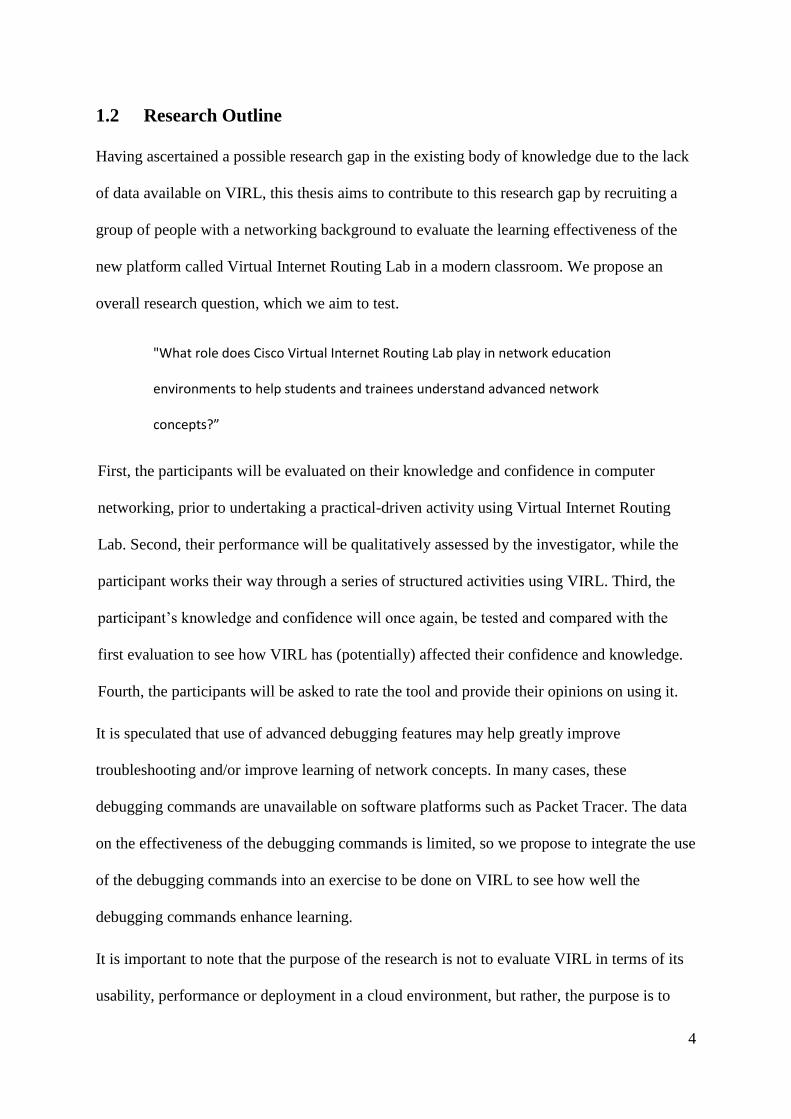
1.2 Research Outline
Having ascertained a possible research gap in the existing body of knowledge due to the lack
of data available on VIRL, this thesis aims to contribute to this research gap by recruiting a
group of people with a networking background to evaluate the learning effectiveness of the
new platform called Virtual Internet Routing Lab in a modern classroom. We propose an
overall research question, which we aim to test.
"What role does Cisco Virtual Internet Routing Lab play in network education
environments to help students and trainees understand advanced network
concepts?”
First, the participants will be evaluated on their knowledge and confidence in computer
networking, prior to undertaking a practical-driven activity using Virtual Internet Routing
Lab. Second, their performance will be qualitatively assessed by the investigator, while the
participant works their way through a series of structured activities using VIRL. Third, the
participant’s knowledge and confidence will once again, be tested and compared with the
first evaluation to see how VIRL has (potentially) affected their confidence and knowledge.
Fourth, the participants will be asked to rate the tool and provide their opinions on using it.
It is speculated that use of advanced debugging features may help greatly improve
troubleshooting and/or improve learning of network concepts. In many cases, these
debugging commands are unavailable on software platforms such as Packet Tracer. The data
on the effectiveness of the debugging commands is limited, so we propose to integrate the use
of the debugging commands into an exercise to be done on VIRL to see how well the
debugging commands enhance learning.
It is important to note that the purpose of the research is not to evaluate VIRL in terms of its
usability, performance or deployment in a cloud environment, but rather, the purpose is to

5
evaluate, whether or not, this tool facilitates active learning of students. Unlike Packet Tracer,
which is designed by Cisco for education purposes, VIRL was not initially designed with
education in mind [4] [19]. It was originally designed as a testing platform for network
designers to test a network design, prior to rolling it out on a production network1.
1 A network that transmits traffic for the operational day-to-day running of a company, government or home.

6
1.3 Thesis Structure
First, we present and review the existing research on the use of various platforms for
education and compare each of the platforms in terms of features we perceive as useful such
as realism, user interfaces, visualisation, management, perceptions, collaborative and design
and complexity, arguing that each platform, negatively impacts education (based on the
literature). A review of the literature found no existing work done on the role of VIRL in
network education. Second, having found no existing work on VIRL for use in education, we
devise a methodology, proposing how we are going to evaluate a group of academic staff and
students using VIRL and how their learning will be measured. Third, we outline why it is
necessary to undertake research on VIRL, notably because unlike other existing tools, it uses
new virtualisation features and in our view, this provides a more realistic network
environment. VIRL does not contain the visualisation features available in Packet Tracer, so
it remains uncertain as to how VIRL will aid visual learners, who depend on visual cues to
understand network concepts [13] [20]. It is also uncertain as to how VIRL will be perceived
by students and instructors alike. The fact that the student does not physically interact with
real equipment might deter students from wanting to use it, or perceive it as being unrealistic.
Fourth, we present the results of our study and the implications it has on network education.
Fifth, we discuss the results and the outcome of the study, in particular, how VIRL might be
used in network training environments. Seventh, we draw conclusions and outline any
research gaps and possibilities for future work.
7
2. Literature Review
This chapter reviews interdisciplinary research of literature from education, behavioural
sciences and Information Technology. First, the literature review will review existing
research on education theory, the impact of network education on industry and the perceived
importance of an integrated practical approach in network education. This will consist of
presenting work on Kolb’s learning model and the learning patterns of students to highlight
the importance of understanding how students learn. Second, various potential network
education platforms including; physical equipment, Packet Tracer, GNS3, Boston NetSims,
iNetSims, Common Open Research Emulator (CORE) and ns-3 will be reviewed, discussed
and compared with each other in terms of the recommended education practices derived from
the first section. The comparison will be broken down into several sections including;
realism, user interface and visualisation, management, perceptions, collaboration and, finally,
design and complexity. Third, we present in the conclusion that no tool can satisfactory
deliver the realism and remote education commonly demanded and that the lack of data on
VIRL necessitates for the research to be carried out.
8
2.1 Review of Education Research
This section reviews research on theoretical and practical education, the learning patterns of
students and the perceived importance of a practical approach to networking education for
the purposes of preparing a student for the workplace. Studies that link a poor understanding
to lack of practical experience is presented, indicating that a practical approach to education
is essential but not exclusive because an understanding of theoretical concepts is also
necessary, according to work by David Kolb [15]. First, we give a brief summary of the
current methods used in networking education and tie this with literature from the education
domain. Second, we briefly outline Kolb’s learning model, relating it to literature from the IT
domain and how it can be used to facilitate learning of computer networking. Third, we
outline industry perceptions of network training using a practical approach. Fourth, we
review studies that outlines how students learn and attempt to tie with in with our review of
networking platforms.
2.1.1 Current Network Education Methods
Currently, students are trained in networking using a combination of software-based network
education tools and hands-on experience in a specially-constructed networking training
environment [8] [20] [21]. More recently, virtualisation and cloud computing technologies
have been used to provide access to real equipment to long-distance students, often used in
conjunction with propriety solutions such as NDG NetLab [14] [16] [22] [23] [24] [25].
There has also been use of decentralised labs to run virtual machines on students’ home
computers to relieve strain on a central server [18]. The Open Source network emulator,
GNS3, has also been used because of (perceived) issues with using software simulators, such
as Packet Tracer [8]. However, it should be noted that none of these approaches are
necessarily better than each other. As argued by Dr. Richard Felder, students have a variety
of different learning styles, which mean they learn differently [17]. Therefore, one student
9
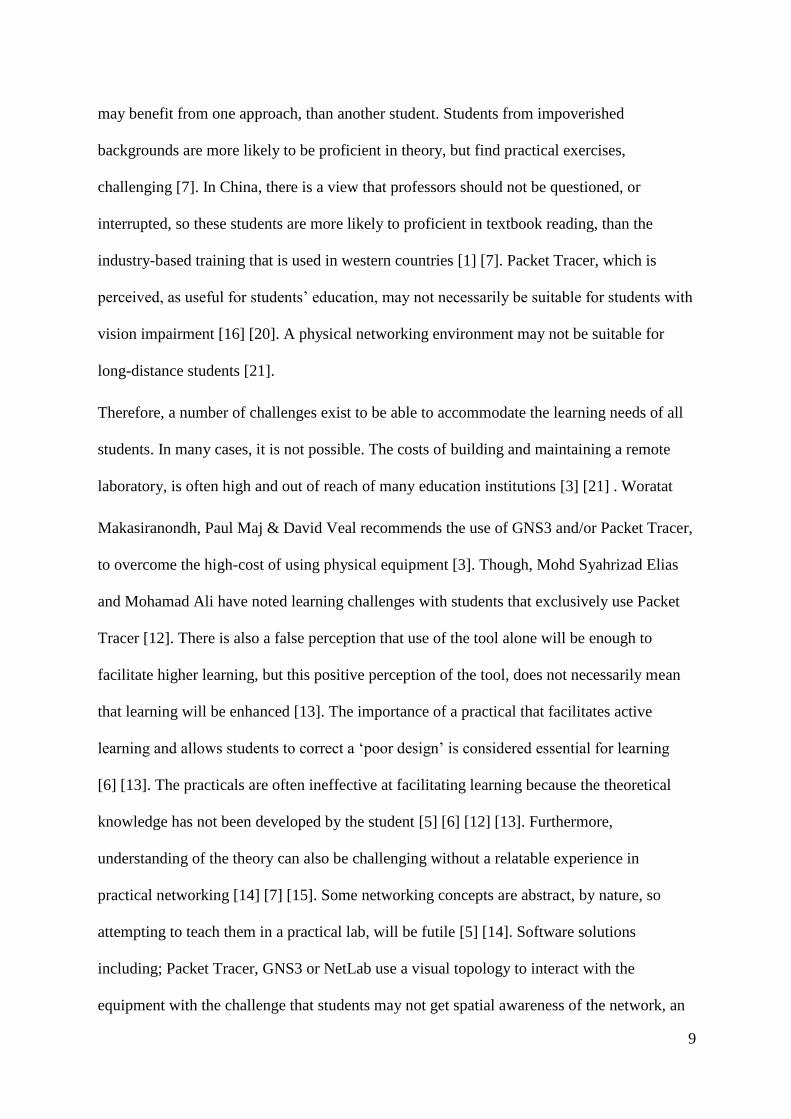
may benefit from one approach, than another student. Students from impoverished
backgrounds are more likely to be proficient in theory, but find practical exercises,
challenging [7]. In China, there is a view that professors should not be questioned, or
interrupted, so these students are more likely to proficient in textbook reading, than the
industry-based training that is used in western countries [1] [7]. Packet Tracer, which is
perceived, as useful for students’ education, may not necessarily be suitable for students with
vision impairment [16] [20]. A physical networking environment may not be suitable for
long-distance students [21].
Therefore, a number of challenges exist to be able to accommodate the learning needs of all
students. In many cases, it is not possible. The costs of building and maintaining a remote
laboratory, is often high and out of reach of many education institutions [3] [21] . Woratat
Makasiranondh, Paul Maj & David Veal recommends the use of GNS3 and/or Packet Tracer,
to overcome the high-cost of using physical equipment [3]. Though, Mohd Syahrizad Elias
and Mohamad Ali have noted learning challenges with students that exclusively use Packet
Tracer [12]. There is also a false perception that use of the tool alone will be enough to
facilitate higher learning, but this positive perception of the tool, does not necessarily mean
that learning will be enhanced [13]. The importance of a practical that facilitates active
learning and allows students to correct a ‘poor design’ is considered essential for learning
[6] [13]. The practicals are often ineffective at facilitating learning because the theoretical
knowledge has not been developed by the student [5] [6] [12] [13]. Furthermore,
understanding of the theory can also be challenging without a relatable experience in
practical networking [14] [7] [15]. Some networking concepts are abstract, by nature, so
attempting to teach them in a practical lab, will be futile [5] [14]. Software solutions
including; Packet Tracer, GNS3 or NetLab use a visual topology to interact with the
equipment with the challenge that students may not get spatial awareness of the network, an
10
understanding of cabling and other physical concepts [4] [11]. Furthermore, many of the
software solutions lack full functionality and do not, by design, simulate the full network [5]
[8] [9]. Some education institutions, due to budget restrictions, have been known to integrate
training networks with production networks, limiting what the student is allowed to configure
[3] [8].
More recently, cloud computing has been used to help make more efficient use of resources
[14]. However, it should be noted that network switches and routers are specialised
equipment and cannot be used with VMWare due to propriety restrictions [9]. GNS3
emulates routers with limited success and reports of it being slow and unusable [8] [11] [26].
2.1.2 The role of Kolb’s Learning Model in network training
Razvan Dinita et. al. argues that (David) Kolb’s adult learning model is the most suited
learning model for teaching computer networking [14]. The importance of a solid theoretical
foundation for practical-based networking courses is emphasised by Cecil Goldstein,
Susanna Leisten, Karen Stark, and Alan Tickle [13]. Dennis Frezzo, John Behrens, Robert
Mislevy also had similar views in their paper [5]. Consequently, the importance of a practical
approach supplemented by a theoretical component, is strongly supported by Kolb’s learning
model. Kolb’s learning model consists of four stages; Concrete Experience, Reflective
Observation, Active Experimentation and Abstract Conceptualisation [15]. The first three
stages, according to Razvan Dinita et. al. is best developed through a practical approach, but
the final stage, abstract conceptualisation, is best developed through text books and lectures
[14]. But it should be noted that use of lecturing is not necessarily exclusive to a practical
approach. The teacher can use practical equipment, as part as a demonstration, to show and
explain the network concepts [6] [20]. For this purpose, a software solution with a visual
topology is more suited than physical equipment [5] [20].

11
Kolb’s learning model is based on the premise that learning cannot be measured in the form
of learning outcomes, but is a continuous experience [15]. Studies on network education
seem to confirm this premise, arguing that positive learning outcomes does not improve
understanding [13] [15]. Essentially, Kolb believed and taught that it is the experience and
process that leads improved understanding and not simply, the outcome at the end [15]. The
first stage of Kolb’s learning model is Concrete Experience. Concrete Experience means that
the learner has to be able to relate the knowledge he has learned to a realistic experience. The
learner is exposed to a new concept by first experiencing it. In the context of network
education, this means that exposure to a new concept in a lab environment, is essential to
start the learning process. The second stage is Reflective Observation. This means that
merely watching a demonstration is not sufficient. The learner improves understanding,
through feedback, such as recognition of mistakes. When a learner configures a network, he
is getting feedback from the system in respect to its operation. One of the noted issues of
network education in many institutions today, is that feedback from a qualified expert is
scarce [6] [13]. It is only if the student experiences problems with the lab that the same
student receives potentially useful feedback from a teacher [12]. If the practical is too simple,
the student receives no useful feedback [6]. The importance of feedback in learning was
tested in a study by Cecil Goldstein and et. al. [13], which found that, without feedback,
learning will only be scarcely improved. The third stage, active experimentation, is the
applying of existing knowledge and understanding to new problems. This is considered very
important by Cecil Goldstein and et. al. [13] to produce effective learning. In the context of
networking, active experimentation is developed through network design, network
troubleshooting and network problem solving. Active experimentation is important because it
generates new experiences and effectively repeats the cycle outlined in Kolb’s learning
model [14]. Finally, the learner has to be able to memorise, interpret and explain what he has
12
learned in a logical fashion [14] [17] [15]. This is known as abstract conceptualisation. The
learner often does this in theoretical examinations, assignments and lectures [14]. Abstract
Conceptualisation, in conjunction, with the other three stages, generates the theoretical
knowledge that is invaluable for successfully understanding networking [5].
There are two notable cases in literature where gaps in the learning of students is observed.
Firstly, Mohd Syahrizad Elias and Mohamad Ali quotes lecturers, criticising the use of
Packet Tracer, but the problem becomes clear that students did not have a solid theoretical
knowledge, so struggled when variations to the practical was done [12]. In impoverished
countries, practical approaches are seldom used because of the high cost of maintaining the
equipment, lack of infrastructure for a networking training lab, or because of political
reasons, such as in China [7]. Often, students did not have the contextual understanding of
networks so struggled with problem solving and troubleshooting. This became evident when
some of these students undertook practical exercises at an American university but could not
complete them without assistance [7].
In both cases, either the theoretical or the practical skills were underdeveloped. This
demonstrably resulted in learning difficulties by the student.
13
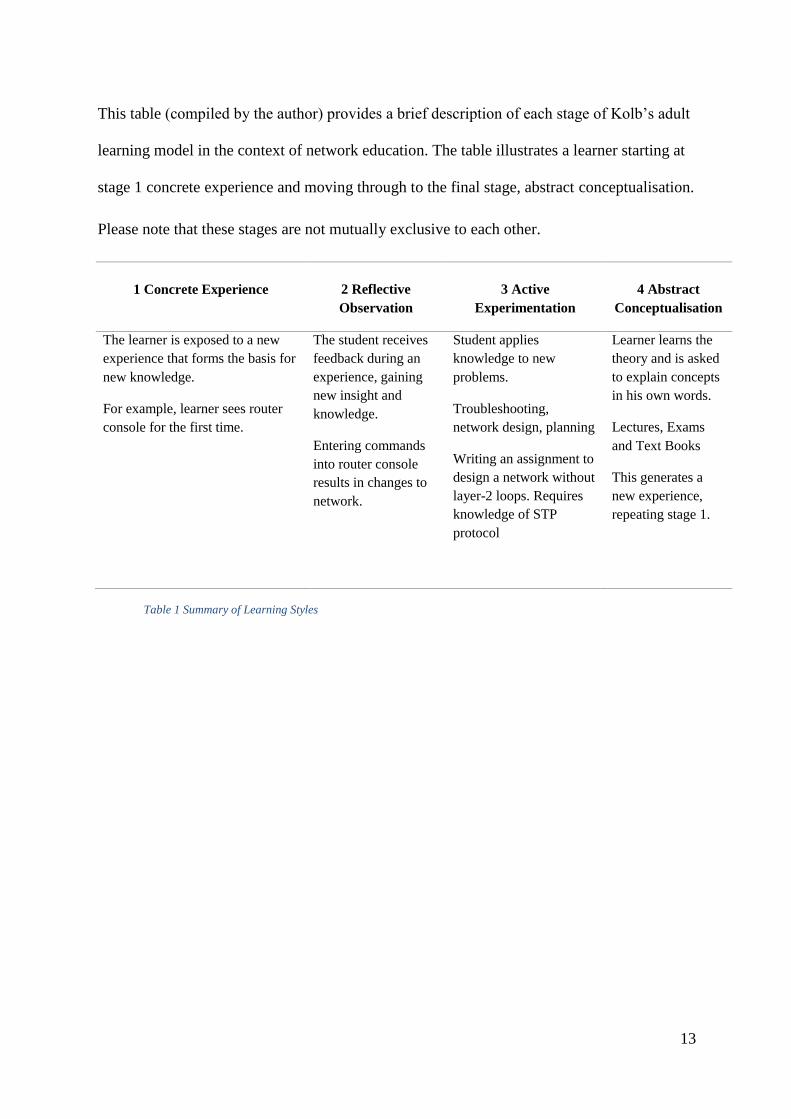
This table (compiled by the author) provides a brief description of each stage of Kolb’s adult
learning model in the context of network education. The table illustrates a learner starting at
stage 1 concrete experience and moving through to the final stage, abstract conceptualisation.
Please note that these stages are not mutually exclusive to each other.
1 Concrete Experience
2 Reflective
Observation
3 Active
Experimentation
4 Abstract
Conceptualisation
The learner is exposed to a new
experience that forms the basis for
new knowledge.
For example, learner sees router
console for the first time.
The student receives
feedback during an
experience, gaining
new insight and
knowledge.
Entering commands
into router console
results in changes to
network.
Student applies
knowledge to new
problems.
Troubleshooting,
network design, planning
Writing an assignment to
design a network without
layer-2 loops. Requires
knowledge of STP
protocol
Learner learns the
theory and is asked
to explain concepts
in his own words.
Lectures, Exams
and Text Books
This generates a
new experience,
repeating stage 1.
Table 1 Summary of Learning Styles
14
2.1.3 The Impact of network education in industry
The information technology (IT) industry perceives embedded network training as an
invaluable skill for a potential employee [1] [2]. Employees in industry perceive that CCNA
training, offered through Cisco, provided them with unrelated soft skills in terms of problem
solving, teamwork and communication [2]. Therefore, the importance of preparing students
for the workplace has been extensively acknowledged by a variety of education institutions.
For instance, an Australian university, The University of South Australia’s official qualities
explicitly aims to prepare the ‘graduate’ for the workplace [27].
GQ1. “(The graduate) Operates effectively with and upon a body of knowledge of
sufficient depth to begin professional practice.” (Graduate Qualities, UniSA) [27]
GQ2. “(The graduate) Is prepared for life-long learning in pursuit of personal
development and excellence in professional practice.” (Graduate Qualities,
UniSA) [27]
Furthermore, academic institutions have acknowledged the importance of developing a
student’s problem solving skills. Both Kirschner & Huisman and Holvikivi, J, based on their
research, emphases that problem solving is a critical skill [6] [7]. Jaan Holvikivi’s work
implied that exposure to technology through a practical approach is the only effective way of
developing this skill [7]. The graduate qualities of the University of South Australia
explicitly aim to make the ‘graduate’ an effective problem solver [27].
GQ3. “(The graduate) is an effective problem solver, capable of applying logical,
critical, and creative thinking to a range of problems.” (Graduate Qualities,
UniSA) [27]
The three key points emphasised in the aforementioned graduate qualities are logical, critical
and creative thinking. Kolb cited by Razvan Dinita et. al states that these qualities are
15
developed at the active experimentation stage of Kolb’s learning model, which according to
Dinita, is best developed through a hands on experience [14].
In a survey undertaken by the Waikato Institute of Technology in New Zealand, the
perceptions of CCNA training was positive and perceivably enhanced the chance of
successful employment [2]. The interviewees stated that CCNA training was effective at
improving organisational and soft skills, such as teamwork and communication [2].
Emphasis was made on the importance of getting hands on experience, in particular, with
VLANS, network design and wireless networking. There was also mention in the study of
using non-Cisco third party equipment, or equipment not in the CCNA framework, such as
the Cisco Adaptive Security Appliance (ASA) [2]. In many cases, third party equipment
cannot be used because topologies are fixed and not easily adaptable to students’ needs [8].
Furthermore, software tools including Packet Tracer lack the functionality to simulate
specialised third party devices, though it was perceived that experience with Cisco
equipment, would provide the ability to more easily transfer to other third party equipment
[2].
Despite troubleshooting skills being viewed as important by employers, this skill is often
underdeveloped because it requires extensive time to develop in a practical training
environment, which is not always available [2] [7] [8]. A practical approach can perceivably
help develop other soft skills such as improved communication with experts in industry due
to better understanding of networking concepts. Employers perceive that CCNA training
requires use of troubleshooting techniques that helps develop soft skills such as;
communication, teamwork and problem solving [2].
16
2.1.4 Learning Patterns of Students
This section will present literature findings on the learning patterns of students, that is, what
students do to learn and what do they do while learning. This is important to discuss because
it is often an overlooked assumption that can impact learning [13]. Goldstein, et al. [13]
provides evidence in their research that suggests that it not merely use of the platform alone
that facilitates learning, but also a number of related learning factors that can affect the
student’s learning, such as lab activities that facilitate troubleshooting.
Nickerson et. al. [28] suggests that when students become confused with a concept, they
attempt to solve the problem by communicating with other classmates, therefore, facilitating
a sharing of knowledge and learning. In fact, Pea cited by Nickerson et. al. suggests that the
bulk of learning in science occurs through conversation with others. Nickerson et. al.
suggests that cooperative learning is more important for achieving learning than the
underlying technology used [28]. A study reviewing the challenges of Packet Tracer, a visual
learning tool provided by Cisco, quoted a lecturer as saying:-
“… They prefer to ask their friends or lecturer, rather than thinking about ways
to resolve the issue at hand. The flaw of the PT Simulation is actually very
scarce... ” (Polytechnic Lecturer 5: CCNA, Senior Lecturer quoted in study in
‘Survey on the Challenges Faced by the Lecturers in Using Packet Tracer
Simulation in Computer Networking Course’, pp. 13, emphasis added)[12]
This quote confirms the claim by Nickerson et. al. [28] that students tend to learn through
communication is also valid for students learning networking.
Lecturers in a survey undertaken by Elias and Ali [12] indicated that many students could not
apply theoretical concepts to practical scenarios. Cisco provides step-by-step lab sheets to
guide students through the process of configuring a key aspect of the network. In the survey,
17
instructors indicated that students would use the lab sheets as a definitive guide, following it,
somewhat blindly, verbatim. As an implication, the steps are effectively rote learned by
students and they do not understand, how or when to apply the concepts. In subsequent
activities, students struggled because it relied on earlier steps not included on the lab sheet
and although students had supposedly learned the concepts, they could not use it in the
practical. Several studies [12] have indicated that students tend to focus on completing the
exercise at hand, but without properly thinking about what they are doing [13]. Furthermore,
often a distinction is made between theoretical content and practical content with an
emphasis on practical hands-on experience over theoretical abstract thinking [6]. This results
often in students being unable to properly apply the content, resulting in learning challenges
because they perceive theory as uneventful and less important [6] [7] [12] . Therefore, any
delivery of practical education must rely on the theoretical framework and any platform must
support this process (cf. 2.2 Network Platforms in network education) [5] [6] [13].
18
2.2 Network Platforms in network education
A practical approach in networking requires the use of one or more platforms to replicate a
functional computer network. Network education platforms, broadly speaking, can be
categorised into three categories; software-based network tools, network emulation tools and
physical hardware. However, it should be noted that use of one platform alone is considered
insufficient to facilitate the level of education that is required. A polytechnic senior lecturer,
who teaches CCNA from the Malaysian Polytechnic Institution, quoted in a study by Mohd
Syahrizad Elias and Mohamad Ali indicated that use of Packet Tracer alone was ‘not enough’
[12].
“I have this view that PT is easy to use if the students use it a lot. If it is only used
in practical training, I think that it is not enough. Switching and Routing requires
students to understand the networking theories beforehand, if they can fully
grasp them only then they will know how to use them in the topology given.
Learning the computer network does not only involve learning theories.
Students will find it hard to use a theory especially in light of routing protocol
because there are a lot of configurations and concepts that need to be
understood first.” (Polytechnic Senior Lecturer, quoted in Elias et. al. 2014,
emphasis added)[12]
Use of physical lab equipment is not ideal in all cases, such as when demonstrating packet
movement through a computer network to students, or when teaching abstract concepts [5]
[20]. Using a variety of tools is likely to result in increased costs, complex management and
ongoing maintenance [3]. Often, simulation tools such as Packet Tracer are used as a
substitute for real equipment [3] [7]. This is problematic because simulation tools are limited
19
in their design, because they do not truly replicate a network and are only designed to
simulate a subset of network functionality [8] [9] .
This chapter reviews the features, strengths and weaknesses of various network education
platforms including physical equipment. First, we compare various platforms in terms of its
level of realism based on numerous studies in the literature. Second, we compare the user
interfaces and visualisation features of each of the reviewed platform (where applicable),
outlining the advantages and disadvantages, from the literature, of visualisation in learning
computer networking. Third, we review a number of managerial issues commonly cited as
being a barrier to implementing many platforms and compare the features of each reviewed
platform that are useful for helping to manage learning in a classroom environment. Fourth,
we present the perceptions based on surveys and interviews that students and academics have
towards the reviewed platforms. Fifth, we review the importance of teamwork and
collaboration and compare each platform in its capability of creating a collaborative
environment. Sixth, we present a number of protocol simulators and why these simulators
are often too complex to be used for teaching purposes.
2.2.1 Realism
According to Kolb’s learning model, the learner needs to develop learning through new
concrete experiences [14] [15]. Therefore, it is essential that the training platform, whether it
be software or hardware, be as realistic as possible. Dr. Teresa Coffman argues that
simulation experiences must be realistic to allow the learner to feel involved in the
experience and to feel like they are acting in a role. The realistic simulation is important to
allow the learner to apply knowledge to a specific problem. Coffman observed that students
should be observed to see how they complete the problem with no ‘right’ answer or outcome.
The teacher should act as a manager, designed to guide the learner [29].
20
In many cases, a local or remote practical network lab consisting of physical equipment
provides this realistic experience, but with the drawbacks of increased costs in terms of
maintenance [3] [21]. In Australia and other western countries, the education institutions can
often afford real equipment, but the equipment often has to be shared with other students and
not everyone can use the equipment at one time [3] [5] [8]. In impoverished countries,
physical equipment is seldom used so other tools are used to facilitate the learning process
[7]. Because Packet Tracer and similar tools are considered less realistic than real
equipment, another approach has been to use GNS3 to provide emulation of specialised
network hardware, such as Cisco 1800 routers [8] [23] [30].
Software tools (i.e. Packet Tracer) is limited to the aspects implemented into it by the
programmer [9]. It should also be noted that the implementation of the network protocols are
only simulations. They may not necessarily be an accurate depiction of how the protocol
operates. According to Frezzo et. al. [5], Packet Tracer does not simulate all OSI layers of the
network, so its classification as a network simulator is a misnomer. Packet Tracer is mainly
focused on Cisco device configuration and is not appropriate for configuring other aspects of
the network. However, even Packet Tracer does not provide all of the commands that would
otherwise be available on real Cisco equipment.

21
As you can see in the figure, the command debug dhcp detail when entered on a Packet
Tracer simulated router, produces an error message, ‘Invalid input detected at ‘^’ marker’.
This ambiguous error message is confusing because it usually indicates that the user has
either mistyped a command, entered an invalid command, or entered a command in the
wrong mode. In this case, none of these scenarios is the cause for the error message in the
figure. The same command, if entered, on real equipment in the same mode would work.
Packet Tracer does not make it clear that the command is not implemented. This creates
confusion for the learner who has to think, ‘Now is that command a real command or not or
is it a Packet Tracer issue?’ The error message in the figure makes it hard to tell.
Furthermore, the learner cannot make use of the aforementioned debugging command on
Packet Tracer for troubleshooting because the software does not implement the command.
Figure 1 Packet Tracer Incorrect Notification
22
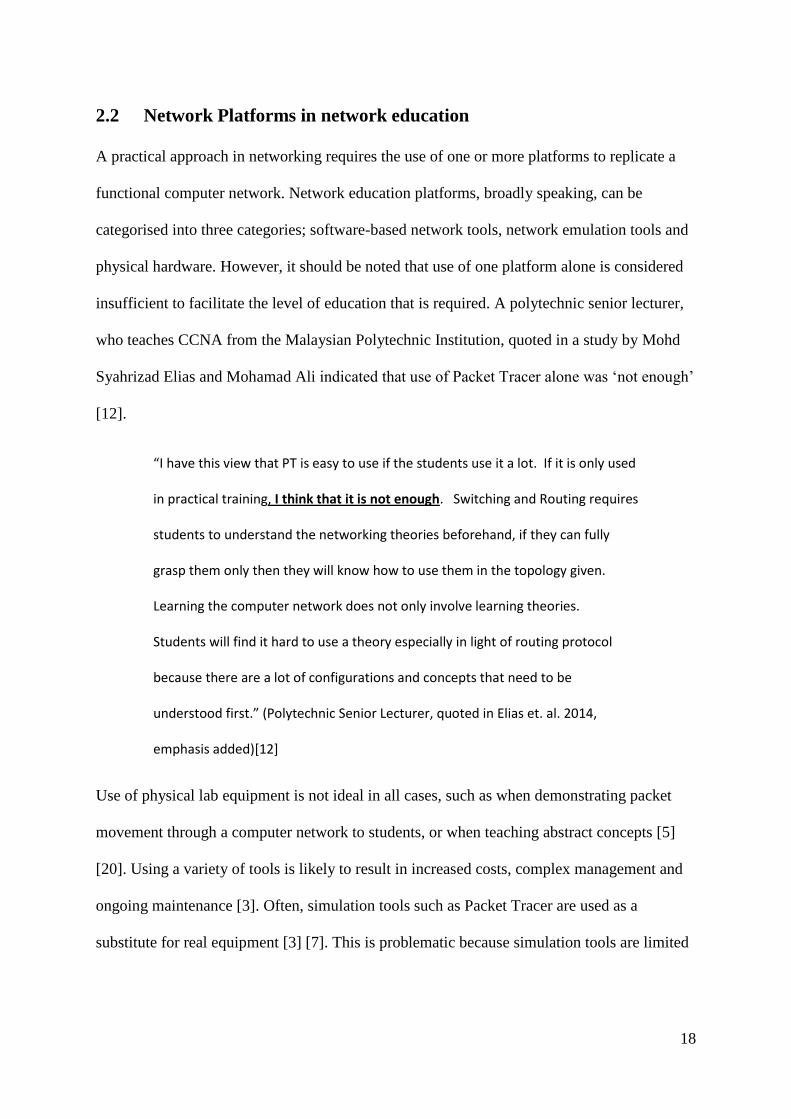
On the contrary, Virtual Internet Routing Lab that uses virtualisation technologies does
support the command. As indicated in the figure, Figure 2 VIRL Correct Configuration,
entering the same command, debug dhcp detail correctly results in DHCP client activity
debugging being enabled, exactly replicating how this command would behave on the real
equipment.
Another alternative to Packet Tracer is a software simulator tool, Boston NetSims. This tool,
purchased at a cost unlike Packet Tracer, runs on Windows platforms [31]. According to K.
Wan Mohd Ghazali and R. Hassan, this tool simulates more functionality than Packet Tracer
and includes a series of labs. However, GNS3 and Packet Tracer are preferred by Wan Mohd
Ghazali and Hassan [31], in part, because they will run on platforms other than Windows2.
Often, troubleshooting networks, a key skill demanded by industry [2] requires the
troubleshooter to analyse individual packets using a third-party packet sniffer, such as
Wireshark [8]. Many software-driven simulation tools, including Packet Tracer does not
connect to any external networks, so it is often not possible to use Wireshark.
It is also necessary to train students using the latest equipment to ensure that the training
remains current and relevant, as per the ‘graduate’ qualities previously discussed in 2.1.3 The
Impact of network education in industry [3]. However, software simulators may not
2 It is unclear if it works with Wine / PlayOnLinux. However, this increases the level of difficulty and time
wasted.
Figure 2 VIRL Correct Notification
23
necessarily have the latest protocols supported on vendor hardware because the software is
out of date, the feature is propriety so it may not be possible to implement it in a simulator, or
simulating the feature may not be possible [3] [8] [9] .
Although, the use of physical equipment is widely perceived as offering a realistic experience
[3] [21], Dennis Frezzo et. al. suggests that, use of physical equipment, is unrealistic because
the topologies are intentionally designed to be small to cut down on costs [4]. As noted by
Chengcheng Li et. al. physical networks utilise less than 5 percent of the total bandwidth [9].
Therefore, the traffic amount is minimal and does not represent a fully functional network
that the learner would work on in industry. Many modern computer networks in production
consist of dozens of routers, but the topologies in a physical training lab have three or four
routers at most.
Software virtualisation and emulation tools such as Virtual Internet Routing Lab (VIRL) and
GNS3 can both replicate a fully functional router in software, providing the full functionality
of real equipment [8] [9] [19]. However, the use of emulation and virtualisation is not always
possible because of performance issues, especially GNS3 which uses emulation as opposed
to virtualisation, degrading performance [11]. GNS3 does not support emulation of Cisco (or
other vendor) switches, reducing the realism of the topology [11]. There is also uncertainty,
as to whether or not, running the Cisco IOS on GNS3 systems is within the intended license
agreement [32]. On the contrary, VIRL supports switches, uses virtualisation and does not
present potential legal dilemmas [33] [19].
Both GNS3 and Virtual Internet Routing Lab have limited, if any, support for wireless
networking. Furthermore, often local or remote physical labs lack wireless equipment that
allows students to practice this kind of networking. According to the documentation, the
Common Open Research Emulator (CORE) has the ability to simulate wireless networks, a
feature that is commonly unavailable on many software platforms [34] [35]. CORE does not
24
have the ability to configure wireless access points (cf. 2.2.6 Design and Complexity of
Platforms).
2.2.2 User Interface and Visualisation in network education
Visualisation of network behaviour using graphics, animations and visual simulations is
perceived as an effective method for enhancing understanding of computer network
operation [10]. As noted by Javid [20], the simulation features in Packet Tracer allow the
learner to monitor the path of network packets, providing them with increased understanding.
According to Jozef Janitor et. al. the visualisation tools help supplement physical equipment
by providing the learner with insight into the packets and other aspects of the network, not
easily visible [10]. The use of visual queues in network education establishes an association
between a concept and a visual queue, enhancing memorisation of the concept. Dr. Richard
Felder presents work that questions this premise, in particular, the assumption that
visualisation aids in learning. He notes a category of certain learners known as ‘abstract,
reflective’, who learn by having information organised in a logical fashion [17]. Therefore,
the premise that visualisation cues results in better understanding is only true for certain
kinds of learners. Other learners will not effectively benefit from this method. More recent
research by Cecil Goldstein et. al. further illustrated how that the network simulation tool
needs to facilitate active learning by applying knowledge [13]. The use of visualisation
queues alone will not enhance learning. Furthermore, students with vision-based disabilities
such as vision impairment will not benefit from the visualisation cues, as they will be unable
to properly see them [16]. In fact, an otherwise completely usable user interface could be
completely unusable for vision-impaired students and, therefore, not facilitate any learning at
all.

25
The user interface of Packet Tracer (cf. Figure 3 Packet Tracer User Interface 1), shows the
general appearance of Packet Tracer. As you can see, the user interface provides detailed
descriptions, colours and visualisation queues to depict the state of the simulated network.
The topology is represented visually and devices are accessed, simply by clicking on them.
Figure 3 Packet Tracer User Interface 1

26
The figure ‘Figure 4 Sample Packet Tracer Topology’ is an example topology created in
Packet Tracer. The red circles indicate that the links are down or malfunctioning. This helps
the student quickly recognise the state of the network [10]. In the second stage of Kolb’s
learning model, the student cognitively receives feedback [15]. The change of colours
invokes a cognitive response to a change in an event, so the learner is instantly getting
feedback from any changes to the network that occurs.
The blue envelope (cf. Figure 4 Sample Packet Tracer Topology), in this example, indicates
where a ping has failed.
Packet Tracer records this in a log in the bottom, right-hand side of the screen (cf. Figure 5
Packet Tracer Sample Log). A different colour is used for each packet, so it is easily
distinguishable by students.
Figure 4 Sample Packet Tracer Topology
Figure 5 Packet Tracer Sample Log
27
Packet Tracer also includes an activity mode that enables instructors (or students) to plan
their own assessments, exams and activities [10]. This is useful to enhance the feedback
component of the student’s learning [14] [20] [15]. In comparison, neither GNS3 nor VIRL
nor Common Open Research Emulator (CORE) has this functionality. Needless to say,
physical equipment does not have any visual cues to it, unless it is integrated with a propriety
solution, such as NDG Netlab. The visualisation tools are especially useful for use by a
teacher during a lecture, because the teacher can demonstrate a concept in real time using a
visual simulation or animation [10]. A visual topology is also useful for this purpose because
the topology can be easily explained by the teacher. For example, the teacher can point to the
simulation to show where the network is failing and then explain why. The activity wizard,
used in Packet Tracer, is designed to enable instructors to create exams that provide the
student with instant feedback, reducing costs associated with marking exams [10]. Packet
Tracer’s graphical user interface is, according to Jozef Janitor et. al, easy to use, giving it an
advantage over other tools [10]. Furthermore, Dennis Frezzo et. al. states that Packet Tracer’s
interface was designed with education in mind [4]. Despite this, students who use Packet
Tracer do not necessarily show advanced understanding [12] [16] [13].
The drag and drop topology features in Packet Tracer are featured in virtually all other
network education tool including; GNS3, Boston NetSims, Common Open Research
Emulator and Virtual Internet Routing Lab [8] [11] [33] [19] [35].

28
The Common Open Research Emulator (CORE) has a similar topology to Packet Tracer (cf.
Figure 6 CORE Sample Topology) Nodes are dragged and dropped onto the main pane as
shown in the figure. When a node initialises successfully, it appears green. Failed nodes
would appear as red.
The sidebar (Figure 7 CORE Sidebar) consists of a router or unmanaged switch that can be
dragged onto the main pane. The green play button starts the simulation. In this respect, it is
the same as Virtual Internet Routing Lab. CORE does not, according to the documentation,
contain an activity or visual packet simulation mode like Packet Tracer by default [34].
Figure 6 CORE Sample Topology Figure 7 CORE Sidebar
29
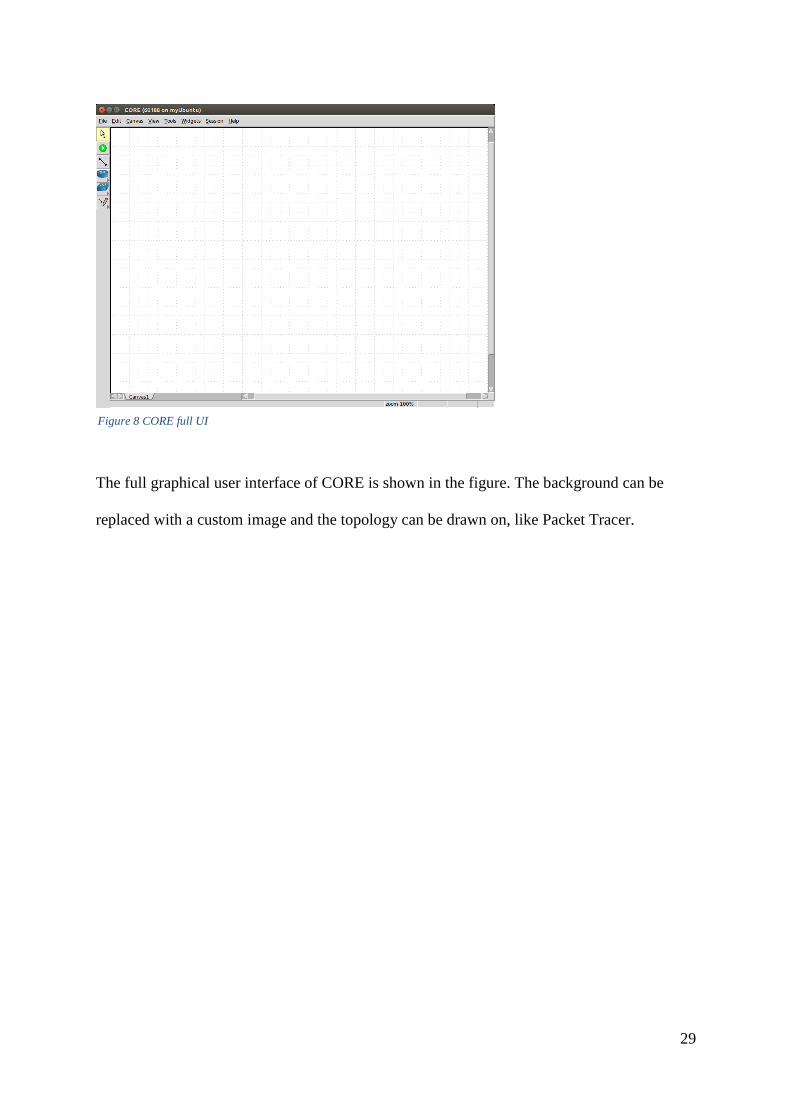
The full graphical user interface of CORE is shown in the figure. The background can be
replaced with a custom image and the topology can be drawn on, like Packet Tracer.
Figure 8 CORE full UI

30
The user interface for Virtual Internet Routing Lab is in some ways, similar to Packet Tracer
because like Packet Tracer nodes can be selected and dragged onto the main pane [33] [19].
But it is worth noting that VIRL’s interface is in many ways different from Packet Tracer.
Like the Common Open Research Emulator, simulations, as they are known, have to be
started manually by clicking on the green play button.
Figure 10 Sample Link between two nodes
The figure, ‘Figure 10 Sample Link between two nodes’ shows a connection between two
nodes on VIRL. Unlike Packet Tracer, the state of the link, whether down or not, cannot be
derived by looking at the colour. The interface numbers (i.e. gi0/1) only becomes visible
when the cable is clicked.
Figure 9 VIRL Main Pane

31
The table below compares the aspects of the various graphical user interfaces:-
Platform Activity
Wizard
Simulation
Mode
Realistic
Command Line
Visual
Topology
Accessible3
Physical
Equipment
No No Yes (through
external program)
No N/A
NDG NetLab Limited No Yes Yes Unknown
Boston NetSims Unknown Unknown Yes Yes No
iNetSims No No Yes Yes Yes
CORE No No No Yes No
Packet Tracer Yes Yes Yes Yes No
VIRL No No Yes Yes No
Table 2 Comparison of User Interfaces
As you can deduce from the table (Table 2 Comparison of User Interfaces), Packet Tracer
tends to provide the most features in its user interface, including a visualisation-simulation
mode and limited accessibility features.
3 Is the user interface tailored for, or supports persons with vision impairments, or colour blindness?
32
2.2.3 Management of Platforms
Significant challenges exist with delivering practical-based, industry focused network
training, often due to underequipped laboratory environments [7]. An array of management
issues need to be overcome to create a productive educational environment, such as cost and
maintenance of the environment [3], security and resource usage [14] [16] [9] [18] [36] and
accessibility [21] [16]. To facilitate the varied learning styles of students [17], the training
platform may need to be made accessible to long-distance students, students working from a
remote location such as home, or students with disabilities [16] [21] [10].
The software solution, Packet Tracer, is freely provided to students enrolled in a Cisco
Academy Program [11]. This makes Packet Tracer an affordable option for students and
education institutions that it is the primary network education platform in developing nations
[7]. The cost of deploying and maintaining Packet Tracer is virtually nil, in comparison, to
physical equipment, which can cost thousands of dollars [3]. Packet Tracer can be easily
installed on a student’s home computer, without modification to the operating system used in
most cases, since Packet Tracer is designed by Cisco to run on a variety of platforms
including; Windows, Mac OS and many flavours of Linux [11] [20]. Since Packet Tracer
does not require a physical network infrastructure, it can be used by external students on their
home computer without any disruption [20]. This also means it can be used in developing
nations where a network infrastructure does not exist [7]. Unlike emulation solutions such as
GNS3, Packet Tracer is beneficial for students who own low-grade computers because Packet
Tracer does not need high-end hardware to emulate the devices [8]. All the simulation is done
in software.
Another issue faced by education institutions is (often) accidental damage to the physical
equipment due to mishandling or misconfiguration [20]. Wear and tear may result quicker
because students are constantly connecting and disconnecting cables each time a practical
33
exercise is ran, resulting in higher failure rates. This imposes a financial burden on the
institution, which has to spend money to replace or repair the damaged equipment that can
further add to downtime and lack of availability while the equipment is being repaired or
replaced [3]. Software solutions including; Packet Tracer, GNS3, CORE and Virtual Internet
Routing Lab alleviate this risk because the student never touches any physical equipment [3]
[11] [20] [35].
According to Woratat Makasiranondh et. al. the costs of building and maintaining a practical-
based laboratory are estimated to be on average around fifty thousand Australian dollars for
20 students, if each student was supplied with only a single Cisco router and switch [3]. As
outlined by Dennis Frezzo et. al. [4], this expensive process is futile because the network
topology is unrealistic due to its small size. To overcome this problem, students are often
required to work in large groups, book in a time to use the equipment, or interconnect the
equipment to a common backbone [8] [21] [18] [10]. Working in groups is useful to enhance
team building skills, but may also limit a student’s experience with using the equipment [10].
In addition to the high costs, maintaining the lab is very time-consuming. On average,
institutions can expect to spend about twenty hours per week, maintaining the environment
including; repairs, updating the embedded software on routers and switches and replacing out
of date equipment [3]. It becomes necessary to replace switches and routers on a regular basis
because, as newer software is released, for instance, by Cisco, the software will not run on
legacy hardware, further adding to downtime and costs incurred by the institution [3]. As
stated by Chengcheng Li et. al, hardware resources are effectively wasted by the otherwise
redundant training environment that is only occasionally used to transmit small amounts of
traffic [9]. For security and stability reasons, it is considered dangerous to use the production
network for training purposes, therefore, necessitating the need for a separate physical
network, wasting power and resources. A solution to this problem is addressed by
34
virtualisation technologies that provision real networks from existing hardware, but which
are, for all intent and purposes, separated [23]. Virtual Internet Routing Lab and GNS3 can
both provision Cisco routers, without modification to the underlying hardware infrastructure
[11] [19]. This reduces maintenance and administrative overhead. GNS3 is completely free
as an open source project, allowing it to be deployed in an academic environment at almost
no cost [8] [11]. Virtual Internet Routing Lab, on the other hand, has to be purchased at a
cost and requires reasonably powerful hardware with hardware virtualisation support to be
deployed [19]. Like Packet Tracer, GNS3 can be installed and ran from a home computer,
reducing strain on the server and allow external students to undertake the practical activities
[8] [18]. But unlike Packet Tracer, configuring GNS3 is more complex and the student
requires a reasonably-powerful computer to run a basic topology [11]. In some cases, GNS3
may not run smoothly due to excessive CPU usage from the running topology, but according
to, Liangxu et. al. performance should be reasonable on most modern computers [11].
Furthermore, GNS3 does not include any Cisco IOS images with it, due to licencing
restrictions [11]. This creates additional administrative overhead because the institution must
facilitate the process of ensuring that students can legally download and load the IOS image
into GNS3. GNS3 was not designed by Cisco, so there is no guarantee that the IOS images
will work successfully. The process is unsupported by Cisco and may constitute a use of the
Cisco IOS image that is not covered by the end user licence agreement [32], making its use
potentially illegal. Many Cisco switch IOS images will not load in GNS3, meaning that in
many cases, switches cannot be deployed by GNS3 [11]. On the contrary, Virtual Internet
Routing Lab is a product supported by Cisco. The IOS images are included with the product
so can be safely used with the virtualised topology. As of April 2015, VIRL supports Cisco
IOS switching, including some layer-3 operations on a Cisco switch, though SPANS and

35
private VLANs are not officially supported4 [37]. Cisco VIRL uses modified images
designed to run in a virtualised environment [37] based on IOS release 15. As noted by
Obstfeld et. al. the personal edition of Virtual Internet Routing Lab currently has a maximum
node limit of 15. This restriction imposes a disadvantage of using Virtual Internet Routing
Lab for education because it effectively disables the use of large topologies, which are
critical to provide realism [4]5. On the contrary, the Cisco Packet Data Sheet suggests that
Packet Tracer is for all intent and purposes, not limited in the number of nodes it can run,
allowing large topologies to be simulated [38].
Management of the education environment is critical to avoid time being unnecessarily
wasted. In many education institutions, the teacher and students have to conform to a set time
schedule. Software solutions such as Packet Tracer, Boston NetSims, iNetSim and others are
relatively straightforward to setup and use. Emulated or virtualised equipment often requires
more configuration, with the added time, needed to boot the embedded software. Setting up
the physical equipment in preparation for the lab and cleaning up after the lab often wastes
critical learning time and this degrades a student’s production [11]. Therefore, the equipment
needs to be effectively managed to ensure that time is not wasted. Modifying the environment
to save time requires automation and reconfiguration, adding to downtime, administrative
overhead and costs [3] [21]. For example, configurations have to be wiped after each session
to provide a fresh configuration for each exercise.
4 Whether or not the features will technically work is not made clear in the reference. As the software is under
continuous development, this statement may not be true for newer (improved) versions. 5 For the purposes of our research, we managed to acquire a ‘teaching license’ that enabled up to 200 nodes. It
may be possible for educational institutions to apply for a similar licence, bypassing the 15 node limit.
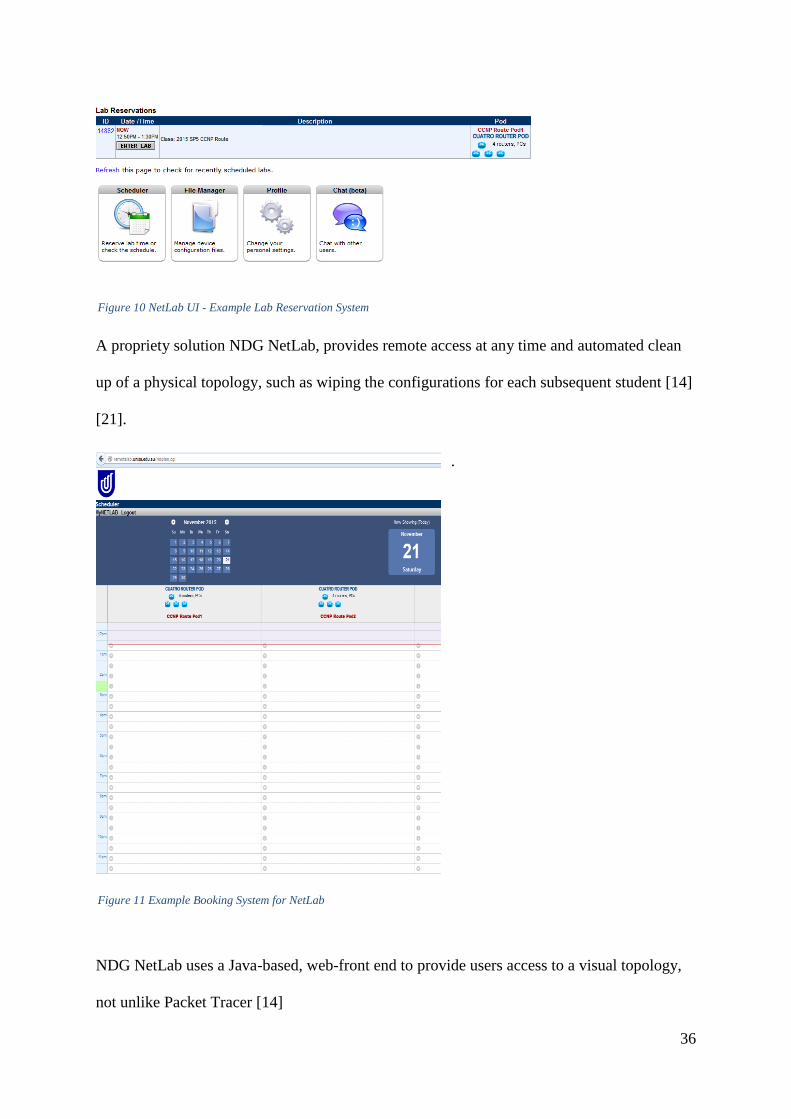
36
A propriety solution NDG NetLab, provides remote access at any time and automated clean
up of a physical topology, such as wiping the configurations for each subsequent student [14]
[21].
.
NDG NetLab uses a Java-based, web-front end to provide users access to a visual topology,
not unlike Packet Tracer [14]
Figure 11 Example Booking System for NetLab
Figure 10 NetLab UI - Example Lab Reservation System
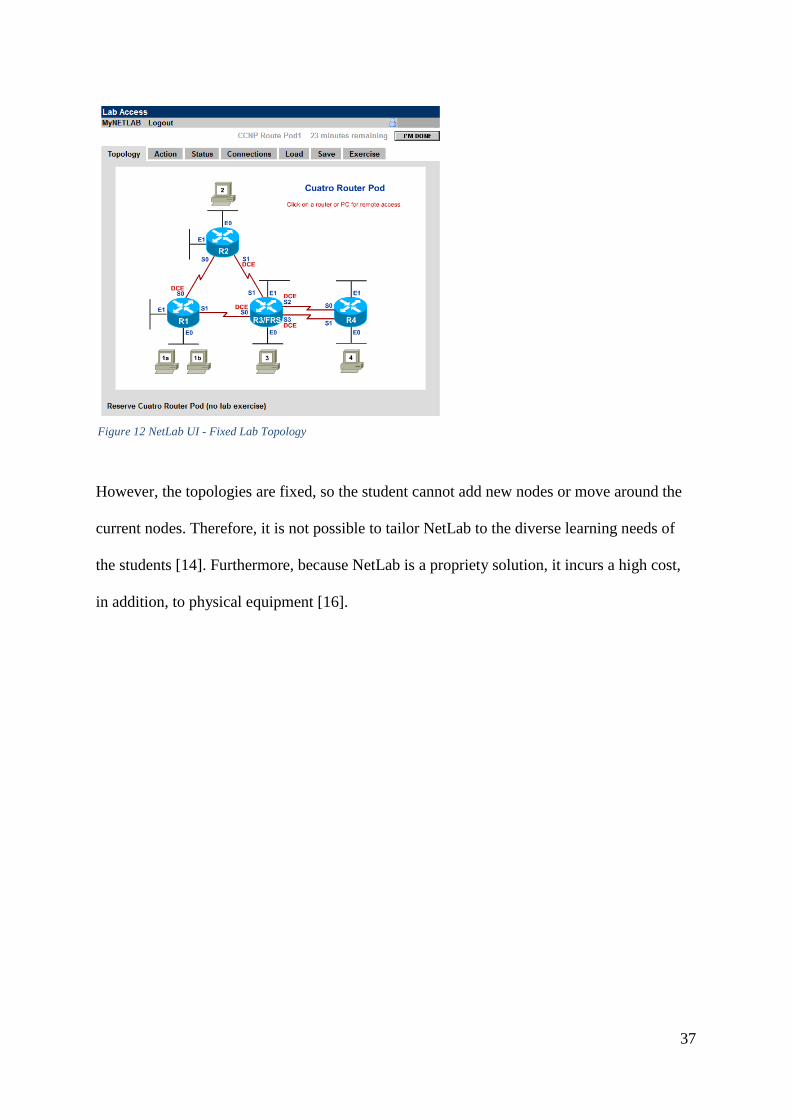
37
However, the topologies are fixed, so the student cannot add new nodes or move around the
current nodes. Therefore, it is not possible to tailor NetLab to the diverse learning needs of
the students [14]. Furthermore, because NetLab is a propriety solution, it incurs a high cost,
in addition, to physical equipment [16].
Figure 12 NetLab UI - Fixed Lab Topology
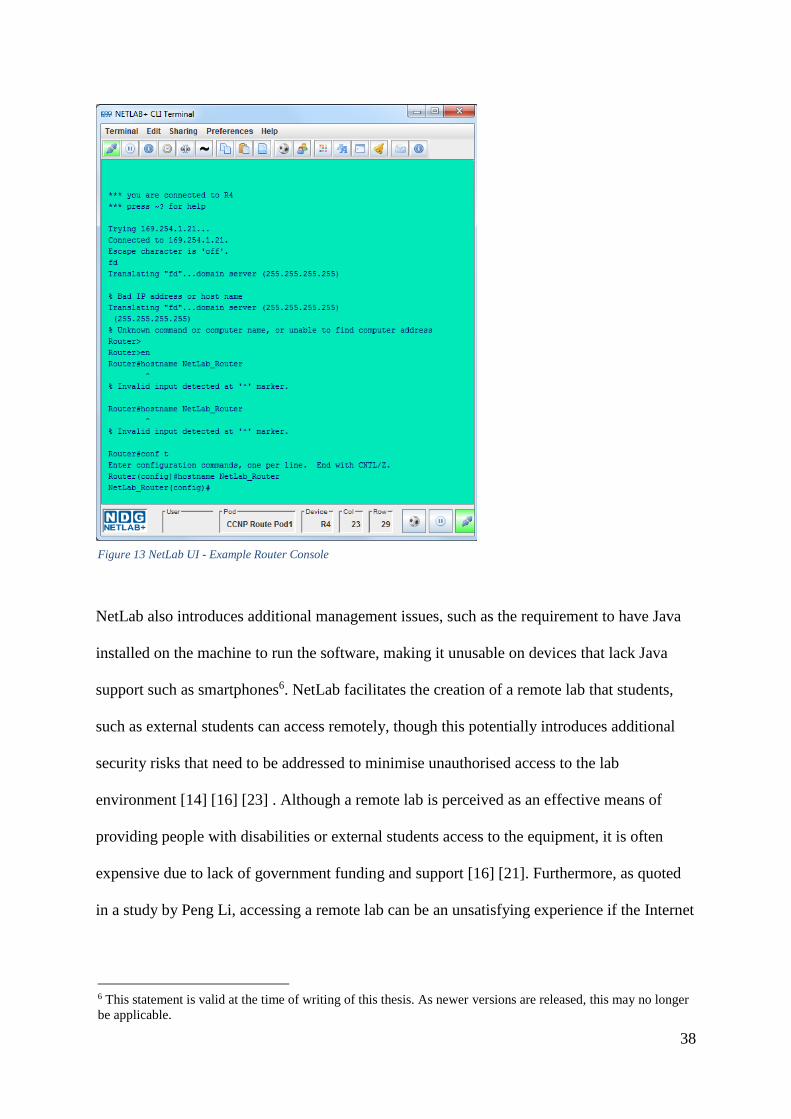
38
NetLab also introduces additional management issues, such as the requirement to have Java
installed on the machine to run the software, making it unusable on devices that lack Java
support such as smartphones6. NetLab facilitates the creation of a remote lab that students,
such as external students can access remotely, though this potentially introduces additional
security risks that need to be addressed to minimise unauthorised access to the lab
environment [14] [16] [23] . Although a remote lab is perceived as an effective means of
providing people with disabilities or external students access to the equipment, it is often
expensive due to lack of government funding and support [16] [21]. Furthermore, as quoted
in a study by Peng Li, accessing a remote lab can be an unsatisfying experience if the Internet
6 This statement is valid at the time of writing of this thesis. As newer versions are released, this may no longer
be applicable.
Figure 13 NetLab UI - Example Router Console
39
connection is slow [18]. Pen Li proposes a solution that involves supplying virtual machines
on a disk and running them on the student’s home computer, known as a ‘decentralised
lab’[18]. A decentralised lab approach can effectively reduce costs and the risk of failure by
using the hardware resources of the students’ computers. Students do not need to rely on a
fast Internet connection or a remote lab to be able to do their work [18]. The setup involves
setting up virtual machines in VMWare or VirtualBox, the open source solution, to create
computers that could be used to experiment with networking tools such as intrusion detection
systems [18]. The paper did not explore virtualisation of specialised networking equipment
(i.e. Cisco 1800 routers), presumably because it was not possible. One of the possible counter
arguments against a decentralised lab approach is that it requires work by students to setup
the environment, or the student’s hardware may not be powerful enough to run the intensive
applications. Pen Li recognised these problems and argued that most modern computers,
unlike previously, generally have enough resources to facilitate the process [18]. This relies
on the assumption that computer education is delivered in well-developed countries, where
high-end computers in homes are common, but as Jaana Holvikivi [7] shows, technology in
third-world countries is almost non-existent. Therefore, the assumption by Li [18] is only true
for western education. Pen Li effectively solved the workload issue by students by proposing
that the software be delivered on a compact disk (CD-ROM) that students could acquire from
the education institution and use [18]. The decentralised lab approach is useful for creating a
decentralised topology, where each student could contribute their own hardware resources to
create one large topology worked on by a group (or one) student(s).
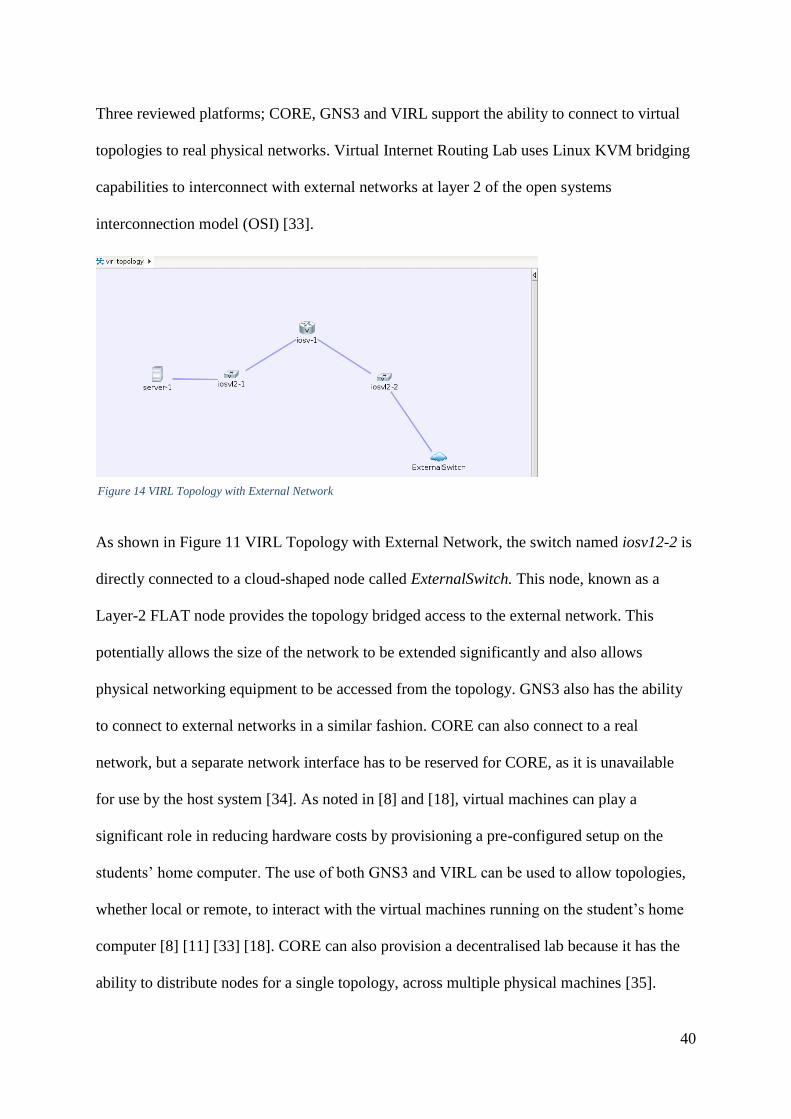
40
Three reviewed platforms; CORE, GNS3 and VIRL support the ability to connect to virtual
topologies to real physical networks. Virtual Internet Routing Lab uses Linux KVM bridging
capabilities to interconnect with external networks at layer 2 of the open systems
interconnection model (OSI) [33].
As shown in Figure 11 VIRL Topology with External Network, the switch named iosv12-2 is
directly connected to a cloud-shaped node called ExternalSwitch. This node, known as a
Layer-2 FLAT node provides the topology bridged access to the external network. This
potentially allows the size of the network to be extended significantly and also allows
physical networking equipment to be accessed from the topology. GNS3 also has the ability
to connect to external networks in a similar fashion. CORE can also connect to a real
network, but a separate network interface has to be reserved for CORE, as it is unavailable
for use by the host system [34]. As noted in [8] and [18], virtual machines can play a
significant role in reducing hardware costs by provisioning a pre-configured setup on the
students’ home computer. The use of both GNS3 and VIRL can be used to allow topologies,
whether local or remote, to interact with the virtual machines running on the student’s home
computer [8] [11] [33] [18]. CORE can also provision a decentralised lab because it has the
ability to distribute nodes for a single topology, across multiple physical machines [35].
Figure 14 VIRL Topology with External Network

41
CORE is designed to only run on Linux or FreeBSD, potentially complicating its setup for
inexperienced users and does not run on Microsoft Windows [34]. It is typically installed on
top of Ubuntu 14 LTS. Connecting software to an external network can be useful for using
advanced networking tools such as Wireshark to troubleshoot network operation and reduces
the strain on a central server [8] [18] .
The table below briefly compares the platforms in terms of management capabilities.
Question mark (?) indicates unknown.
Platform Cost Deployment Hardware Accessible Notes
Physical Equipment $50,000 Cabling and setup Dedicated No Expensive
to build
and run
NetLab Expensive Infrastructure Setup Very High No
iNetSim Free Simple Install None Yes Limited
functional
ity
Packet Tracer Low/Free Simple Install None Limited
GNS3 Free Basic Setup Very High ? No IOS
included
VIRL $15,0007 Complex High ?
CORE Free Advanced Install Low No
Boston NetSims Low Simple Install None ? Limited
features
Table 3 Comparison of Platforms (Management)
7 Estimation when the cost of blade servers to run it are taken into account. Personal version costs $199.99
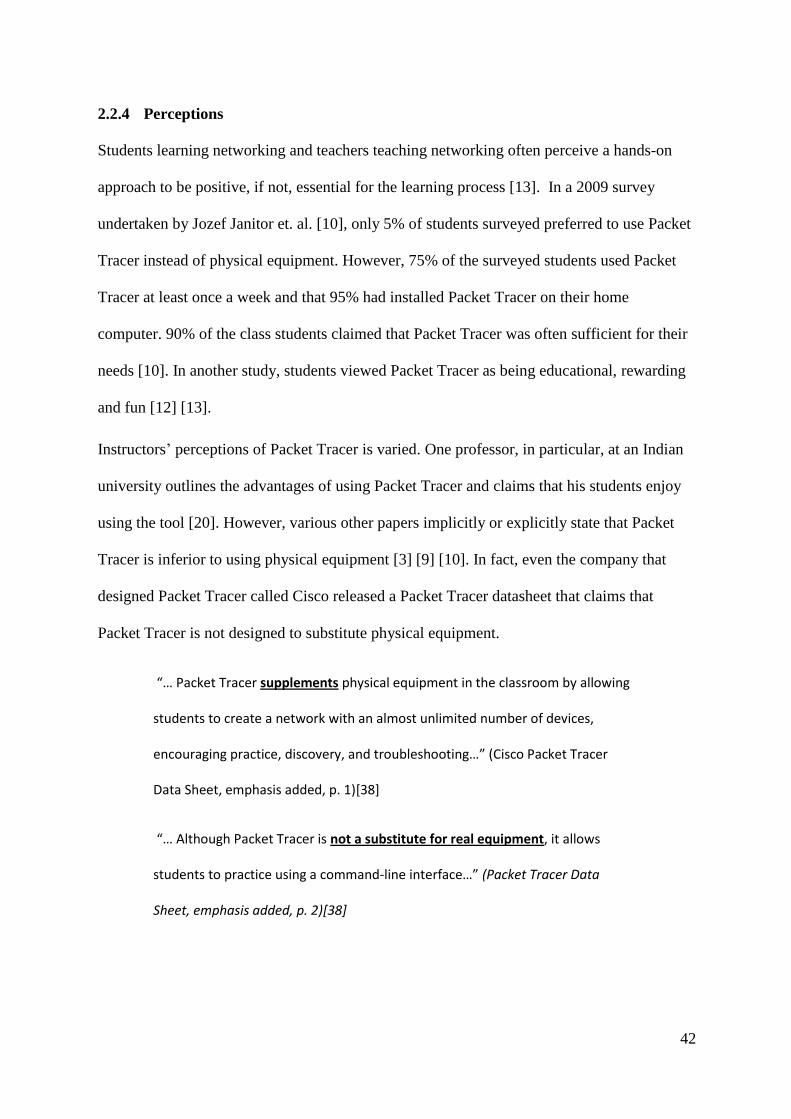
42
2.2.4 Perceptions
Students learning networking and teachers teaching networking often perceive a hands-on
approach to be positive, if not, essential for the learning process [13]. In a 2009 survey
undertaken by Jozef Janitor et. al. [10], only 5% of students surveyed preferred to use Packet
Tracer instead of physical equipment. However, 75% of the surveyed students used Packet
Tracer at least once a week and that 95% had installed Packet Tracer on their home
computer. 90% of the class students claimed that Packet Tracer was often sufficient for their
needs [10]. In another study, students viewed Packet Tracer as being educational, rewarding
and fun [12] [13].
Instructors’ perceptions of Packet Tracer is varied. One professor, in particular, at an Indian
university outlines the advantages of using Packet Tracer and claims that his students enjoy
using the tool [20]. However, various other papers implicitly or explicitly state that Packet
Tracer is inferior to using physical equipment [3] [9] [10]. In fact, even the company that
designed Packet Tracer called Cisco released a Packet Tracer datasheet that claims that
Packet Tracer is not designed to substitute physical equipment.
“… Packet Tracer supplements physical equipment in the classroom by allowing
students to create a network with an almost unlimited number of devices,
encouraging practice, discovery, and troubleshooting…” (Cisco Packet Tracer
Data Sheet, emphasis added, p. 1)[38]
“… Although Packet Tracer is not a substitute for real equipment, it allows
students to practice using a command-line interface…” (Packet Tracer Data
Sheet, emphasis added, p. 2)[38]

43
Some instructors hold to the view that Packet Tracer is inferior to physical equipment. This
problem was investigated in a study by Elias and Ali [12] with many senior lecturers at a
Malaysian University, criticising the use of Packet Tracer. For instance, one senior lecturer
interviewed in the study is quoted as saying:-
“Students have fun doing the PT Simulation as compared to using the actual
equipment. The former helps in terms of starting the configuration, but it gets
more and more difficult when they reach higher concept levels. The actual
equipment has a better reputation in making students understand. If they
follow the lab sheet they should be able to demonstrate the effectiveness of the
PT simulation through a lot of practices, but they are not able to do their own
troubleshooting. They prefer to ask their friends or lecturer, rather than thinking
about ways to resolve the issue at hand. The flaw of the PT Simulation is actually
very scarce. I think this issue is more apparent in certain topics like routing
protocol, where the students find it hard to apply what they have learned. ”
(Polytechnic Lecturer 5: CCNA, Senior Lecturer quoted in study in ‘Survey on the
Challenges Faced by the Lecturers in Using Packet Tracer Simulation in Computer
Networking Course’, pp. 13, emphasis added)[12]
The interviewed instructor perceived that Packet Tracer was inferior to the use of physical
equipment by his claim that the actual equipment has a better reputation than Packet Tracer.
Packet Tracer is widely perceived as being inadequate for network troubleshooting. For
instance, another senior lecturer in the study states:-
“Students are able to use the PT well, based on the steps given. However, should
there be problems or malfunctioning network, students fail to detect any
damage and perform repair work. The lecturer has to check every issue that

44
occurs, although these issues often stem from trivial causes. The PT Simulation
really helps only that the students find it difficult to relate the theory learned
with the laboratory activities that have to be performed. Students also find it
difficult to understand the routing protocol and ACL topics, due to the fact that
both necessitate students to construct some particular statements in order to
execute what is required out of the instructions. “ (Polytechnic Lecturer 3:
CCNA, Senior Lecturer quoted in study in ‘Survey on the Challenges Faced by the
Lecturers in Using Packet Tracer Simulation in Computer Networking Course’,
pp. 13, emphasis added)[12]
Interestingly, one lecturer in the study perceived no major difference between using physical
equipment and using Packet Tracer. His quote is interesting because it highlights weaknesses
in the student’s ability to troubleshoot the network [12].
“There has been no remarkable difference between students’ use of the PT
simulation and the actual equipment. Laboratory activities can be done well by
making reference to the lab sheet provided. Only a number of students have
problems in doing the Skills Test, where they can only do it if they are helped, in
some way. They are able to apply theories and lab activities but stumble when it
comes to perform the troubleshooting; if they have problems, then normally the
problems will be resolved with the lecturer’s assistance.” (Polytechnic Lecturer 4:
CCNA, Senior Lecturer quoted in study in ‘Survey on the Challenges Faced by the
Lecturers in Using Packet Tracer Simulation in Computer Networking Course’,
pp. 13, emphasis added)[12]
The general perception, among the interviewed lecturers in the study [12] is that Packet
Tracer is good for a student beginning to learn about computer networking. However, it is
not suitable for advanced networking concepts, or for troubleshooting [12]. There is also a
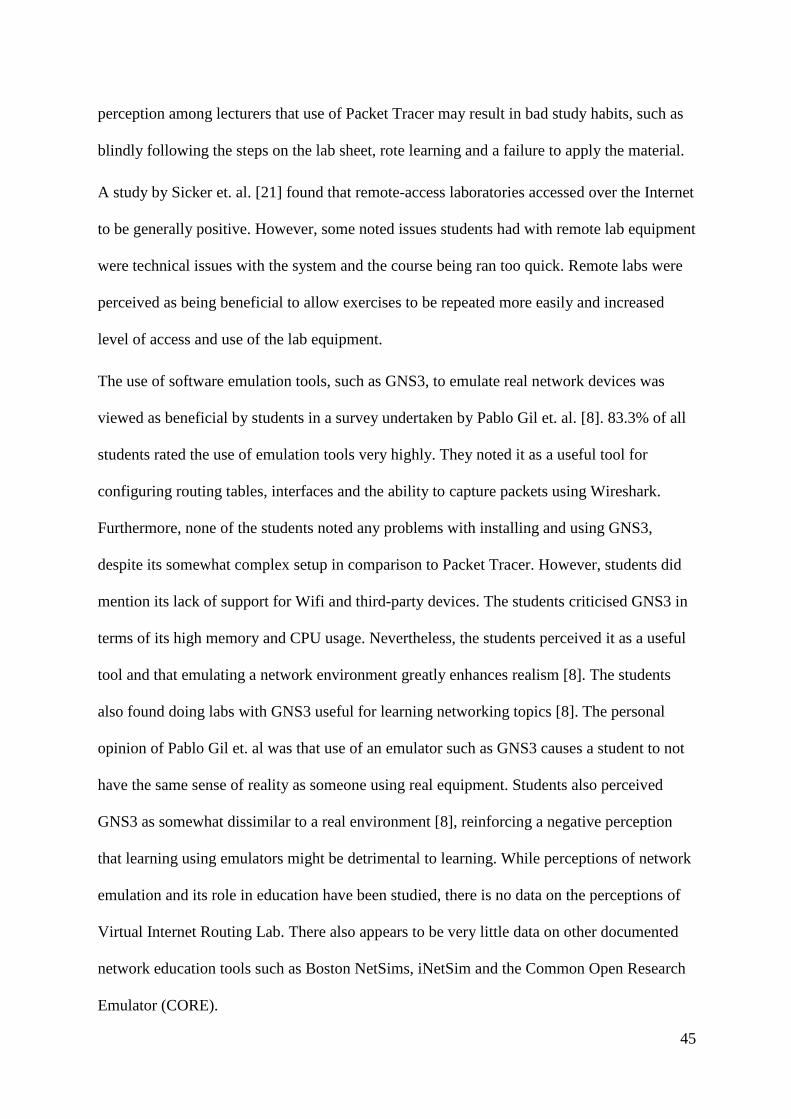
45
perception among lecturers that use of Packet Tracer may result in bad study habits, such as
blindly following the steps on the lab sheet, rote learning and a failure to apply the material.
A study by Sicker et. al. [21] found that remote-access laboratories accessed over the Internet
to be generally positive. However, some noted issues students had with remote lab equipment
were technical issues with the system and the course being ran too quick. Remote labs were
perceived as being beneficial to allow exercises to be repeated more easily and increased
level of access and use of the lab equipment.
The use of software emulation tools, such as GNS3, to emulate real network devices was
viewed as beneficial by students in a survey undertaken by Pablo Gil et. al. [8]. 83.3% of all
students rated the use of emulation tools very highly. They noted it as a useful tool for
configuring routing tables, interfaces and the ability to capture packets using Wireshark.
Furthermore, none of the students noted any problems with installing and using GNS3,
despite its somewhat complex setup in comparison to Packet Tracer. However, students did
mention its lack of support for Wifi and third-party devices. The students criticised GNS3 in
terms of its high memory and CPU usage. Nevertheless, the students perceived it as a useful
tool and that emulating a network environment greatly enhances realism [8]. The students
also found doing labs with GNS3 useful for learning networking topics [8]. The personal
opinion of Pablo Gil et. al was that use of an emulator such as GNS3 causes a student to not
have the same sense of reality as someone using real equipment. Students also perceived
GNS3 as somewhat dissimilar to a real environment [8], reinforcing a negative perception
that learning using emulators might be detrimental to learning. While perceptions of network
emulation and its role in education have been studied, there is no data on the perceptions of
Virtual Internet Routing Lab. There also appears to be very little data on other documented
network education tools such as Boston NetSims, iNetSim and the Common Open Research
Emulator (CORE).
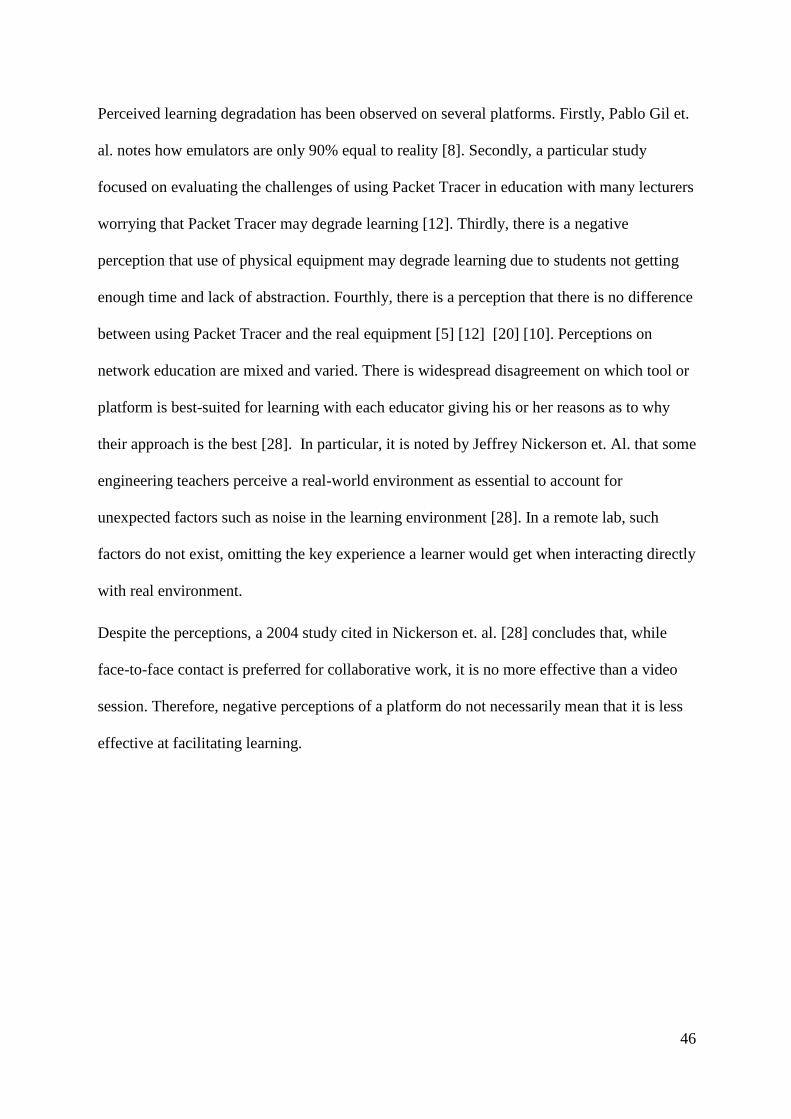
46
Perceived learning degradation has been observed on several platforms. Firstly, Pablo Gil et.
al. notes how emulators are only 90% equal to reality [8]. Secondly, a particular study
focused on evaluating the challenges of using Packet Tracer in education with many lecturers
worrying that Packet Tracer may degrade learning [12]. Thirdly, there is a negative
perception that use of physical equipment may degrade learning due to students not getting
enough time and lack of abstraction. Fourthly, there is a perception that there is no difference
between using Packet Tracer and the real equipment [5] [12] [20] [10]. Perceptions on
network education are mixed and varied. There is widespread disagreement on which tool or
platform is best-suited for learning with each educator giving his or her reasons as to why
their approach is the best [28]. In particular, it is noted by Jeffrey Nickerson et. Al. that some
engineering teachers perceive a real-world environment as essential to account for
unexpected factors such as noise in the learning environment [28]. In a remote lab, such
factors do not exist, omitting the key experience a learner would get when interacting directly
with real environment.
Despite the perceptions, a 2004 study cited in Nickerson et. al. [28] concludes that, while
face-to-face contact is preferred for collaborative work, it is no more effective than a video
session. Therefore, negative perceptions of a platform do not necessarily mean that it is less
effective at facilitating learning.
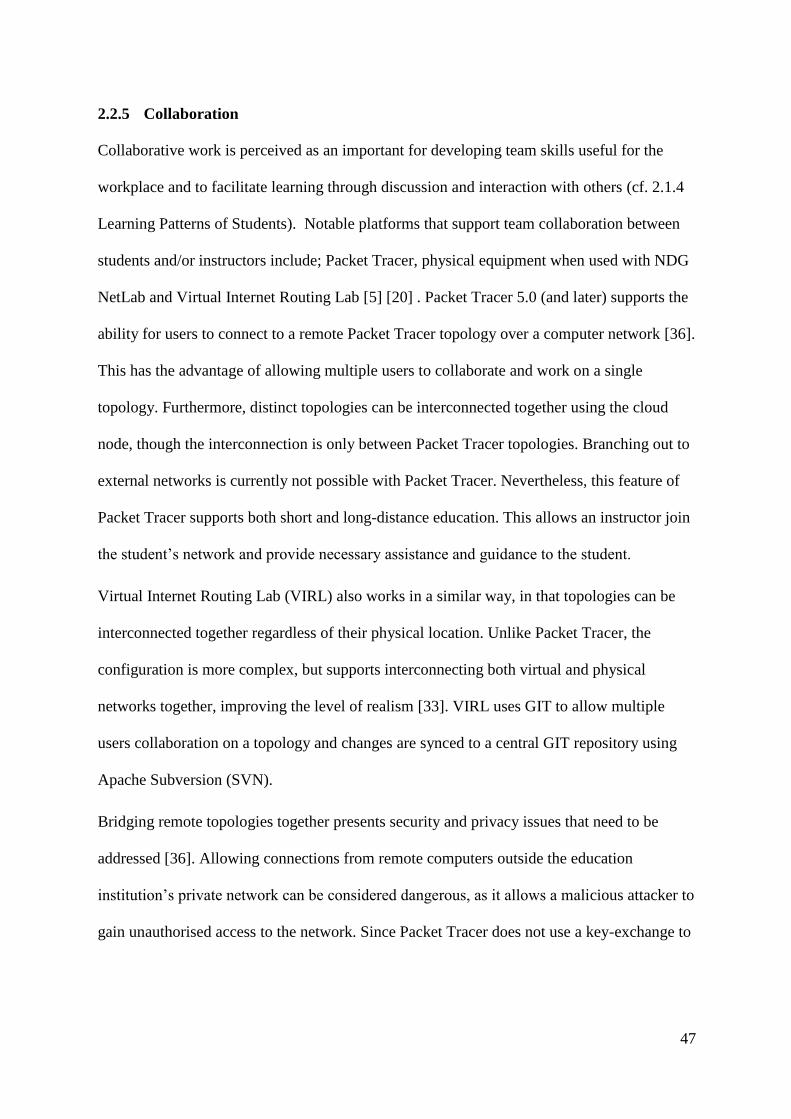
47
2.2.5 Collaboration
Collaborative work is perceived as an important for developing team skills useful for the
workplace and to facilitate learning through discussion and interaction with others (cf. 2.1.4
Learning Patterns of Students). Notable platforms that support team collaboration between
students and/or instructors include; Packet Tracer, physical equipment when used with NDG
NetLab and Virtual Internet Routing Lab [5] [20] . Packet Tracer 5.0 (and later) supports the
ability for users to connect to a remote Packet Tracer topology over a computer network [36].
This has the advantage of allowing multiple users to collaborate and work on a single
topology. Furthermore, distinct topologies can be interconnected together using the cloud
node, though the interconnection is only between Packet Tracer topologies. Branching out to
external networks is currently not possible with Packet Tracer. Nevertheless, this feature of
Packet Tracer supports both short and long-distance education. This allows an instructor join
the student’s network and provide necessary assistance and guidance to the student.
Virtual Internet Routing Lab (VIRL) also works in a similar way, in that topologies can be
interconnected together regardless of their physical location. Unlike Packet Tracer, the
configuration is more complex, but supports interconnecting both virtual and physical
networks together, improving the level of realism [33]. VIRL uses GIT to allow multiple
users collaboration on a topology and changes are synced to a central GIT repository using
Apache Subversion (SVN).
Bridging remote topologies together presents security and privacy issues that need to be
addressed [36]. Allowing connections from remote computers outside the education
institution’s private network can be considered dangerous, as it allows a malicious attacker to
gain unauthorised access to the network. Since Packet Tracer does not use a key-exchange to
48
verify authenticity of the hosting server, a client’s network traffic could be maliciously
intercepted by an attacker posing as the Packet Tracer server.
Collaboration with external students necessitates for personal information, such as IP
addresses, being given to untrustworthy strangers, opening up the risk of stalking and
harassment [36]. However, requiring students to connect to the education institution’s
network eliminates the need to give out private IP address information to other students.
Virtual Private Networks can be used to conceal and encrypt network traffic to prevent
eavesdropping by unauthorised persons.
49
However, to our knowledge, only NDG NetLab supports an integrated chat program (cf.
Figure 16 NetLab Chat UI), which allows other users connected to the same lab session,
topology or device to use text chat to communicate with each other. In the figure (Figure 16
NetLab Chat UI), there are no users listed because no one else was logged into NetLab when
the screenshot was created.
Figure 15 NetLab Chat UI

50
2.2.6 Design and Complexity of Platforms
Software-based networking simulators can be classified as a network-protocol simulator,
which simulates the behaviour of network protocols, or as a vendor-equipment simulator that
simulates a vendor-specific network device and allows the user to configure the device in
some fashion. Examples of a vendor-equipment simulator include; Boston NetSims, Packet
Tracer and iNetSims developed by Curtain University for people with disabilities [11] [16].
Examples of a network-protocol simulator include; J-SIM, Partov, Emulab, PlanetLab, Open
Network Lab, IREEL, opnet, ns2, ns3, glomosim and OMMNet++ [8] [10] [26] [31]. These
simulators are designed for research purposes and often require programming knowledge to
set the parameters of the protocol to be simulated. They generally do not provide a command
line for students to use to practice network configuration. They are also perceived as complex
to setup and use. It is important to note that GNS3 and VIRL are neither a vendor-equipment
simulator nor a network-protocol simulator, but are considered a virtualisation/emulation
solution.
The open source research platform; Common Open Research Emulator (CORE) is
considered both a simulator and emulator, making it unique among platforms [35]. CORE
emulates commonly used routing protocols including; OSPF, OSPFv3 and BGP [35] [34].
Internally, CORE uses an open source routing engine called Quagga to facilitate routing,
providing access to a Cisco-like command line that can be used to configure the routing
protocols. Therefore, CORE can also act as a limited vendor device simulator, in that it
provides access to a command line, though it does not support Cisco devices and the
command line is limited to the configuration of routing protocols and other minor
configurations such as the router’s hostname [34]. The functionality of CORE can be
extended through programmable Python scripts to incorporate other simulators such as ns-3
into the topology. The documentation of CORE seems to imply that CORE is designed to be

51
a simulator, noting that while the routing engine is emulated, the underlying topology is
simulated, allowing an almost unlimited number of nodes, as the hardware resources is only
constrained by the amount of actual traffic being routed [34]. Therefore, CORE could
potentially be used in conjunction with other solutions in a training environment to simulate
large topologies to increase understanding, basic routing configuration and operation and
illustrating TCP/IP stack operation. However, CORE does not support EIGRP, so it is not
possible for it to replace Packet Tracer or real equipment in Cisco routing courses. Switching
is simulated [35], so switching concepts cannot be learned using CORE. Like other protocol
simulators, CORE is designed to be a protocol simulator and, therefore, requires
programming knowledge of Python, beyond the basics, to properly configure and use [3].
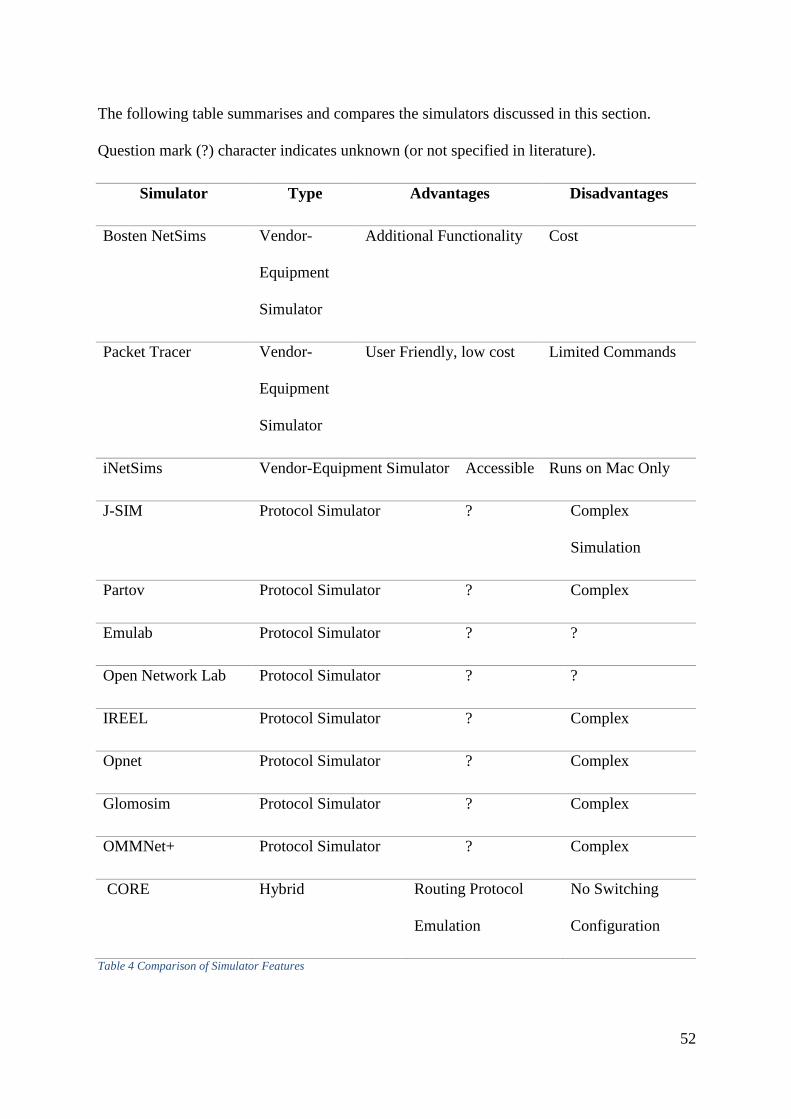
52
The following table summarises and compares the simulators discussed in this section.
Question mark (?) character indicates unknown (or not specified in literature).
Simulator Type Advantages Disadvantages
Bosten NetSims Vendor-
Equipment
Simulator
Additional Functionality Cost
Packet Tracer Vendor-
Equipment
Simulator
User Friendly, low cost Limited Commands
iNetSims Vendor-Equipment Simulator Accessible Runs on Mac Only
J-SIM Protocol Simulator ? Complex
Simulation
Partov Protocol Simulator ? Complex
Emulab Protocol Simulator ? ?
Open Network Lab Protocol Simulator ? ?
IREEL Protocol Simulator ? Complex
Opnet Protocol Simulator ? Complex
Glomosim Protocol Simulator ? Complex
OMMNet+ Protocol Simulator ? Complex
CORE Hybrid Routing Protocol
Emulation
No Switching
Configuration
Table 4 Comparison of Simulator Features
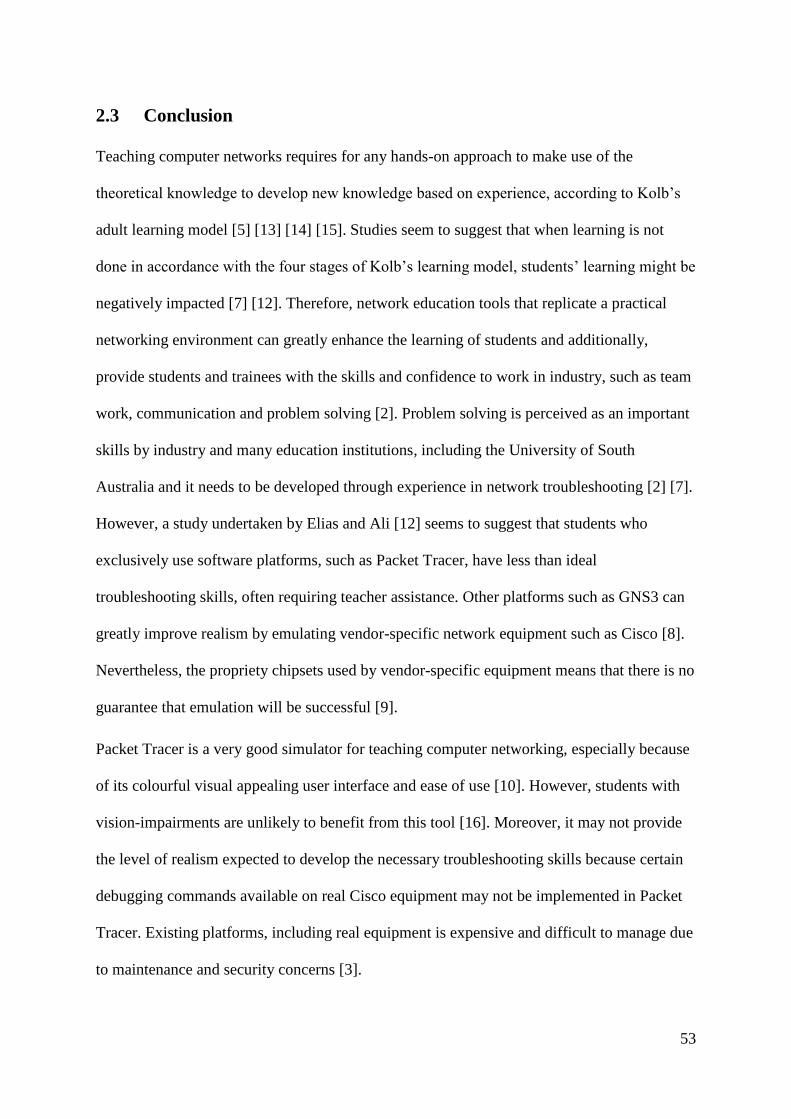
53
2.3 Conclusion
Teaching computer networks requires for any hands-on approach to make use of the
theoretical knowledge to develop new knowledge based on experience, according to Kolb’s
adult learning model [5] [13] [14] [15]. Studies seem to suggest that when learning is not
done in accordance with the four stages of Kolb’s learning model, students’ learning might be
negatively impacted [7] [12]. Therefore, network education tools that replicate a practical
networking environment can greatly enhance the learning of students and additionally,
provide students and trainees with the skills and confidence to work in industry, such as team
work, communication and problem solving [2]. Problem solving is perceived as an important
skills by industry and many education institutions, including the University of South
Australia and it needs to be developed through experience in network troubleshooting [2] [7].
However, a study undertaken by Elias and Ali [12] seems to suggest that students who
exclusively use software platforms, such as Packet Tracer, have less than ideal
troubleshooting skills, often requiring teacher assistance. Other platforms such as GNS3 can
greatly improve realism by emulating vendor-specific network equipment such as Cisco [8].
Nevertheless, the propriety chipsets used by vendor-specific equipment means that there is no
guarantee that emulation will be successful [9].
Packet Tracer is a very good simulator for teaching computer networking, especially because
of its colourful visual appealing user interface and ease of use [10]. However, students with
vision-impairments are unlikely to benefit from this tool [16]. Moreover, it may not provide
the level of realism expected to develop the necessary troubleshooting skills because certain
debugging commands available on real Cisco equipment may not be implemented in Packet
Tracer. Existing platforms, including real equipment is expensive and difficult to manage due
to maintenance and security concerns [3].
54
Virtualisation used in conjunction with cloud computing helps alleviate many of the
managerial issues [14]. However, no platform in the literature supports emulation of vendor-
specific hardware, such as Cisco in a cloud environment.
It would seem from the literature that none of the platforms resolves the learning and
managerial issues of implementing the platforms. Even when physical equipment is
successfully rolled out, it is unlikely to greatly improve learning because of the small
topologies and low traffic density [4]. Software platforms like Packet Tracer do not provide
the level of realism required to facilitate advanced network learning and troubleshooting [9].
Students often prefer real equipment to software platforms. Protocol simulators such as ns-3
are less suited to education than vendor simulators like Packet Tracer because the former is
complex to setup because of Python programming and do not replicate a command line
needed to practice configuration of network devices. CORE, a network simulator and
emulator, is unique in that it can emulate routing protocols and allow limited command line
configuration using the open source Quagga engine, but it does not support switching
configuration, making it less preferred than other solutions.
As a result of these findings, it is clear that a research gap exists in the literature. The role of
Virtual Internet Routing Lab (VIRL) in network education has not been researched, despite
its potential to be used as a cloud solution to overcome managerial issues and as a
virtualisation platform to enhance realism. We believe that the literature categorises network
platforms into three distinct categories; emulation, software and hardware. However, since
GNS3 is the only emulation platform, there is effectively only two categories that were
discussed; hardware or software. We believe that there is another category of network
education tools not mentioned in the literature called virtualisation platforms. VIRL falls into
this new category because it does not emulate network devices, but neither does it run its

55
instructions purely in software. It sends the instructions to the on-board chipset to be
processed.
This approach of replicating a network environment opens up a new perspective at looking at
how networking could potentially be taught. The claims in the literature such as maintenance
and lack of realism may not apply to virtualisation platforms. Therefore, further research
needs to be done to ascertain the role of VIRL in network training. The remainder of this
thesis presents this research.

56
3. Methodology
This section outlines the research methodology that will be used in this research. First, the
research questions will be listed verbatim. Second, the experimental design will be outlined,
including the methods used, why the methods are used, the people involved and what the
people will do. Third, the process of analysing the data collected during the experiment will
be outlined. Fourth, a number of alternate approaches will be recognised and discussed,
arguing why these alternative approaches are not suitable for our research. The research is
necessary because in Chapter 2, we identified a research gap in the literature (see also The
Case for Investigating Cisco VIRL).
3.1 Research Questions and Hypothesis
The following research questions will be answered by our research:-
Leading Research Question - What role does Cisco Virtual Internet Routing Lab play in
network training environments to help students and trainees understand advanced networking
concepts?
a. Are the visualisation tools, lacking from Cisco VIRL necessary for
understanding of computer networking?
b. What are the perceptions of students who use Cisco VIRL?
c. Does the additional features in Cisco VIRL help with understanding?
It is hypothesised that Virtual Internet Routing Lab plays a significant role at enhancing the
realism of the simulated networking environment by increasing learner engagement and
improving their experience, facilitating learning of computer networking.
57
3.2 Experimental Design
The experimental design outlines how the experiment was designed. First, there will be a
summary of the experimental design. Second, there will be a detailed explanation of each
design aspect of the experiment. Third, there will be an explanation of how participants were
recruited. Fourth, the reasons for choosing the methods will be briefly justified.
3.2.1 Experiment Overview
This experiment will require a group of staff and/or students with a networking background,
selected on a voluntary basis, to use a desktop computer to complete a series of networking
activities using Virtual Internet Routing Lab and to fill out questionnaires related to this
activity.
The questionnaires will consist of short answer network knowledge questions, where
participants will be required to explain networking concepts including; passive-interfaces,
NAT, STP portfast, HSRP and troubleshooting, before and after undertaking a 60 minute
practical activity. The aim is to see how the practical activity affects their understanding of
the concepts, both positively and negatively. A related questionnaire will involve the
participants giving feedback on using VIRL for education and they will be asked to agree or
disagree on a scale.
3.2.2 Detailed Process
The experiment is a human study undertaken on a number of human volunteers in the Cisco
lab at the University of South Australia. Each iteration of the experiment takes officially 2
hours, though it is expected to take most people only 90 minutes to complete. Students sign
up to do the experiment at their discretion and may withdraw from it at any time. This is a
mandatory requirement imposed by the university’s ethics guidelines. The UniSA Ethics
58
committee have approved this experiment on the grounds that it complies with the
university’s ethical guidelines and with the laws of Australia.
The experiment is divided into three consecutive sessions. The first session is completing a
two-part questionnaire, asking participants to rate their confidence in networking concepts
and then complete six short answer questions to do with various networking concepts that are
perceived as difficult for students to understand such as STP, HSRP (unfamiliar to most
students), passive interfaces, network address translation (NAT), STP portfast and
troubleshooting.
The second session will be a series of practical exercises, to be completed without assistance
using Virtual Internet Routing Lab. Students will be given 10 minutes to read through the
practical instructions verbatim and make any notes they wish on provided scrap paper. In the
view of the author, this initial reading generates new knowledge that stimulates the learning
process, as per Kolb’s learning model [15]. In addition to the practical booklet, participants
will be provided the IP addressing scheme and the network topology on one double-sided
sheet of A4 paper to be also read during this time. After the reading time, participants will
then be given 60 minutes to complete the three practical activities. The first activity is a
simple configuration task of a new concept, HSRP, designed to increase the student’s
understanding of this concept, but at the conclusion of this task, the participant will need to
use the help features on Cisco routers to complete the final step in this activity i.e. setting the
HSRP priority on one of the routers. The second task is also a simple configuration task, but
this time, the participant will use debugging commands to observe what happens and draw
their own conclusions based on the output. They will not be told what the correct answer is.
They will be required to use and interpret the debugging output to explain how STP port fast
works. The third activity is simply to troubleshoot and fix three network problems. Students
will be provided a list of useful commands including new debugging commands that many
59
probably would not have used previously to help with the process, but will not be told when
or how to use them. This will allow their active learning to be developed by use of problem
solving and analytical thinking. When the participant completes the three activities, or after
sixty minutes (whichever happens first), the practical exercise will be stopped and materials
collected by the investigator.
The third and final session will involve completing a two-part questionnaire. The first part
will require the participant to complete their feedback on using VIRL and their perception of
how well they thought the tool worked, did it help them learn, etc. With most of the
feedback, they were asked to agree or disagree on a scale. The final question will ask for
additional comments that may provide further insight into how VIRL impacts education. The
second part of the questionnaire will require the participants to complete the same six short
answer questions as those done in the first session. This will enable comparisons to be made
between knowledge before the practical and after the practical to see how and if the practical
task has helped enhance understanding. It is important to note that this is only one aspect of
the experiment. Their performance during the practical is also important, as well as their
perceptions and comments.
3.2.3 Recruitment of Participants
The number of participants will vary, since the participants are recruited on a volunteer basis.
However, the aim is to get at least 20 people to be a part of the experiment. Large sample
sizes, though desired, are not feasible with this kind of experiment because the experimental
nature of VIRL means that it is susceptible to failing if the server running it is overloaded. To
reduce the chance of errors, only four people can be doing the experiment at one time,
reducing the time allocated to do the experiment and the number of people that can be
involved.
60
Networking students, former networking students and staff who teach networking will be
recruited via an email sent out to those that fulfil the criteria. It is necessary for the staff and
students to have some networking background because this will provide more useful data as
they will be familiar with networking education tools, such as Packet Tracer and have a basic
knowledge in networking, allowing them to be somewhat confident in networking. Those
that consent to the experiment will compose of the total sample size for this experiment.
3.2.4 Justification
These methods are necessary to get an accurate view, since mere increase in knowledge is not
sufficient to substantiate that learning has occurred. The students need to be observed as
being able to apply knowledge to develop new concepts, as per the literature. Observation is
important because the investigator needs to know how the participant learns through mistakes
and corrective thinking and not just based on their abstract understanding of the knowledge,
but also how they apply and troubleshoot the concepts in order to learn new approaches and
develop new ways of thinking.
3.3 Data Analysis
The participants will complete questionnaires. The six short answer questions will be given a
numerical score between 0 and 5 inclusive. Participants that show understanding beyond that
of the question will be given a score of 5. Participants that get the question (almost)
completely correct will be given a score of 4. Participants that get a question somewhat
wrong or omit a lot of detail will be given a score of 3. An incorrect answer, which is
somewhat relevant will be given a score of 2. An incorrect answer will be given a score of 1.
A score of 0 is for any question not answered. Many of the questions will require the
participant to select one of many options such as strongly disagree, disagree, neutral, agree,
or strongly agree. Strongly agree will be given a value of 5. Agree will be given a value of 4.

61
Neutral will be given a value of 3. Disagree will be given a value of 2. Strongly disagree a
value of 1 and 0 for no answer.
This raw data will then be tabulated into a series of spreadsheets prepared using Microsoft
Office Excel 2013. Each spreadsheet will be named according to the type of data it is, so for
example, scores for the short answer questions before the lab might be called
KnowledgeBefore. The mean, mode, median, range, min and max will then be calculated for
each of the data using the functions available in the aforementioned software. A series of
graphs depicting relevant trends will then be generated and included as evidence in the thesis.
The average of the before lab scores and after lab scores will be plotted onto a single line
graph so the differences can be easily interpreted. A column graph will be generated to show
the types of questions and where knowledge gaps were identified. Records that contain
numerous unanswered questions will be filtered out of the calculations as to avoid distorting
the averages.
3.4 Alternative Approaches
An alternative approach would be to compare Virtual Internet Routing Lab with another
existing tool such as Packet Tracer. The participants would use Packet Tracer to do an
activity, and then use VIRL to do an activity. If when using VIRL participants show higher
knowledge, then it can be concluded that students have learned. This methodology is fatally
flawed because if participants use one tool first, such as Packet Tracer, students would have
gained knowledge during the course of the activity. Therefore, it would be difficult to
ascertain whether the participants learning was due to VIRL or due to Packet Tracer. A
solution would be to setup a control group, where group A uses VIRL and group B uses
Packet Tracer, eliminating the learning affect. This is not also without challenges. Firstly, it
could happen that Group A who uses VIRL simply knows more about networking and,
therefore, shows a higher understanding than those who use Packet Tracer (or vice versa).

62
Secondly, the purpose of the experiment is not to compare VIRL with Packet Tracer. It could
be true that Packet Tracer is equal to, or even better than VIRL but being ‘better’ does not
imply that it useful for learning. It could also be true that both the tools are equally
ineffective at enhancing learning. Therefore, the aim of the experiment is to evaluate how
well VIRL facilitates learning, not whether or not, it is better than another tool. Any attempt
to evaluate learning on platform A and platform B does not answer the research question of
whether or not, VIRL is useful for network education.
Another approach is to incorporate VIRL into the mainstream curriculum at UniSA and have
half the students use VIRL as an education tool during their studies and the other half use
their usual platform. Ethics approval could be obtained to get access to student’s academic
records and then compare the records with the students, who did not use VIRL and draw
conclusions based on their grades. This approach, however, has flaws. Firstly, there are too
many variables that can impact a grade, including illness. A high or low grade may have been
due to factors, other than the tool itself. Students who scored high grades while using VIRL
does not necessarily indicate that the use of the tool itself resulted in that grade. In fact, the
literature seems to refute this premise [13]. Secondly, an argument could be put forward that
a high grade does not indicate learning. The student may have already had a great deal of
knowledge, experience and motivation that lead to the high grade.
Another approach is to collect knowledge alone and convert it to a numerical score based on
how well they explained the concept. This is problematic because knowledge alone is not
sufficient for learning. A practical approach is necessary and so learning can be demonstrated
in a qualitative fashion that needs to be observed. The participant may have challenges while
using the platform that may impact their quality of learning and this needs to be observed.
Recording how quick they undertake a task, or the number of mistakes they make while

63
using the platform is also not effective because some students tend to work slower than
others, yet this does not show deficiency in their learning.

64
4. The Case for Investigating Cisco VIRL
This chapter reflects on the literature findings and argues why research on the role of VIRL
in network training environments is beneficial and how this research contributes to the field
of Information Technology. First, we review Virtual Internet Routing Lab, based on the
limited documentation and developer statements, since we did not manage to find any
academic papers on the platform. Second, we expand on why research into Virtual Internet
Routing Lab (VIRL) is necessary, referring back to the limitations of platforms presented in
the literature. This section includes a summary of the research gaps in the literature and an
outline of some possible negative perceptions of using VIRL. We argue in this section that
we need to determine the validity of these perceptions through research. Third, we present a
conclusion that summarises this chapter.
4.1 Overview of Virtual Internet Routing Lab
Cisco Virtual Internet Routing Lab (VIRL), a software tool, designed by Cisco Systems is
designed to use virtualisation to ‘simulate’ a fully functional networking environment.
Topologies can be designed and changed by students at will. When the student has finished
designing the topology, they run it by starting a ‘simulation’. The backend of VIRL
provisions a virtual machine for each node8 in the topology. As a result, hardware resources
are only used when required and can be used for other purposes when not in use by Cisco
VIRL, such as provisioning the hardware resources for other courses. Since Cisco VIRL
virtualises a complete operating system, the software instructions for the Cisco router mirror
exactly how the router or switch behaves in reality, not only providing access to the full
command set, but also accurately replicating networking protocols such as the spanning-tree
protocol. Software solutions, for instance, Packet Tracer can only simulate protocols, such as
8 A node is a single unit that represents a network device, usually a router, switch or ASA in a topology.
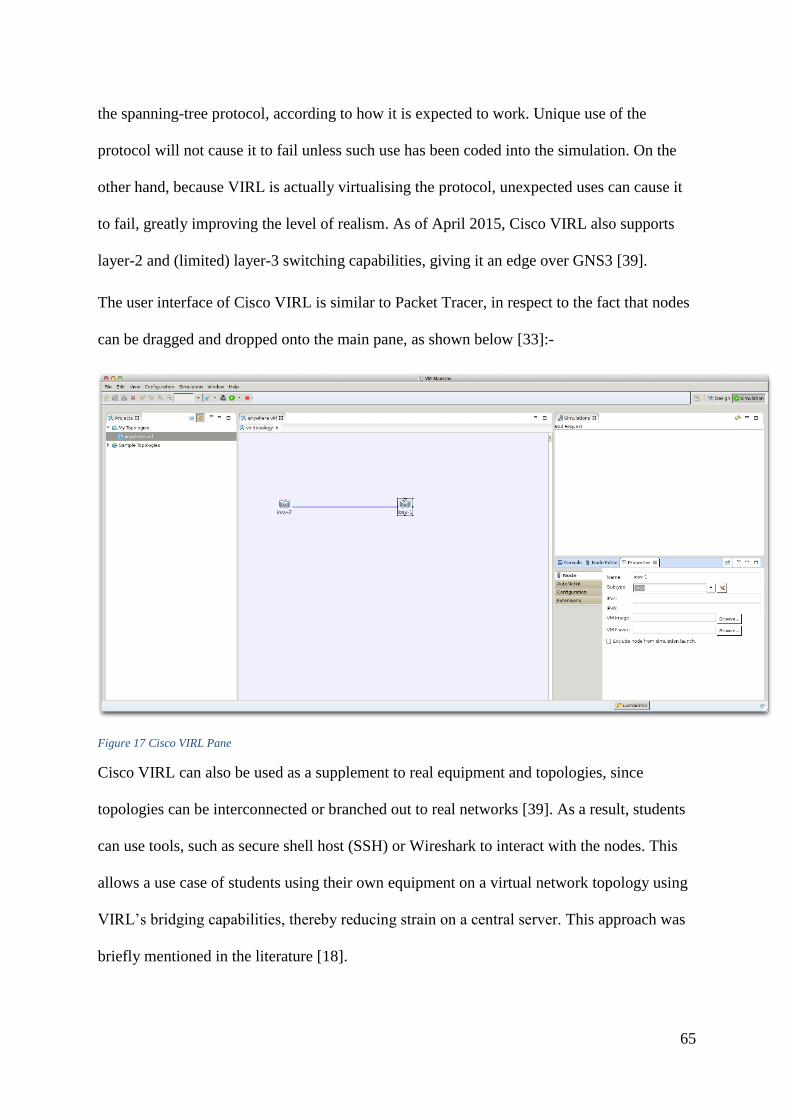
65
the spanning-tree protocol, according to how it is expected to work. Unique use of the
protocol will not cause it to fail unless such use has been coded into the simulation. On the
other hand, because VIRL is actually virtualising the protocol, unexpected uses can cause it
to fail, greatly improving the level of realism. As of April 2015, Cisco VIRL also supports
layer-2 and (limited) layer-3 switching capabilities, giving it an edge over GNS3 [39].
The user interface of Cisco VIRL is similar to Packet Tracer, in respect to the fact that nodes
can be dragged and dropped onto the main pane, as shown below [33]:-
Figure 17 Cisco VIRL Pane
Cisco VIRL can also be used as a supplement to real equipment and topologies, since
topologies can be interconnected or branched out to real networks [39]. As a result, students
can use tools, such as secure shell host (SSH) or Wireshark to interact with the nodes. This
allows a use case of students using their own equipment on a virtual network topology using
VIRL’s bridging capabilities, thereby reducing strain on a central server. This approach was
briefly mentioned in the literature [18].

66
Cisco VIRL is designed to be integrated into a virtualisation infrastructure powered using
VMWare vSphere, though this requires additional configuration [33]. Subsequently, this
allows VIRL to be used to set up a laboratory-as-a-service [33] [14]. As it is running in a
cloud environment, this means that VIRL can potentially be used as a software-cloud service
and hosted externally, eliminating the need to maintain physical servers. Cisco VIRL is
powered by OpenStack, the Linux KVM hypervisor and Ubuntu 14.04 LTS, allowing further
customisation of the server to support the learning needs of students.
4.2 Benefits of this research
There are two major benefits for carrying out this research. First, there are gaps with the
current research. Research has focused on hardware and software-emulation driven
platforms. VIRL is not simply another tool like those discussed in the literature. It is a full-
blown virtualisation platform designed to run in a cloud, abstracting the hardware, which by
design aims to reduce costs, but maintain realism with its virtualisation features. No similar
tool has been studied in the literature, providing us with a research gap. Second, all of the
reviewed tools lack the capabilities to replicate a network environment. For instance,
hardware is realistic but too costly to manage. Software solutions lack functionality and
realism. Emulation software (GNS3) is limited in performance and the kinds of devices it can
emulate. In this section, we review the literature and present the research gaps. From this, we
deduce some possible concerns with VIRL and argue that, without research, these concerns
are really speculation. We conclude by arguing that the research is necessary to either refute
or strengthen the speculations mentioned in 4.1.2 Uncertain speculation due to lack of
research.
67
4.1.1 Gaps in the literature
Research continues to explore possible new approaches to improve the delivery of network
education, so it becomes necessary to explore how new platforms and tools may help to
improve this process. Many software tools are in many ways similar, in that they cannot
replicate a realistic networking environment. The ability to actively experiment with, or
troubleshoot various networking failures is demonstrably not possible using any of the
reviewed software-based tools because of limited functionality, lack of realism and cost.
However, setting up physical equipment is also likely to scarcely improve the
troubleshooting skills because the size and configuration of physical networks are often too
small and are unrealistic. Due to Packet Tracer’s limited features, students are taught
troubleshooting, without relying on troubleshooting tools available on real equipment, further
affecting their understanding in a negative fashion. Packet Tracer is not alone in this
problem. GNS3 also results in similar issues because loading an IOS image is not always
possible due to incompatible chipsets.
The design of Virtual Internet Routing Lab means that it uses a new approach called
virtualisation, potentially allowing it to replicate real-world problems such as issues with the
flash images. VIRL’s design extends on the existing literature by providing a new way of
looking at network education. There is no data available that shows VIRL impact on network
education. Therefore, without this data being available, any conclusions about VIRL’s
effectiveness on education remains speculation. In our research, we aim to provide some
useful data that shows the effectiveness of VIRL in education.

68
4.1.2 Uncertain speculation due to lack of research
Virtual Internet Routing Lab, by design, may present some concerns in education. First,
students may not find the tool itself rewarding and challenging, distracting from the learning
process. Second, VIRL was not originally designed with education in mind, so unlike Packet
Tracer, it may not provide key visualisation elements, perceived as necessary to convey
understanding [4] [5]. For instance, red and green lights do not appear to show the status of
links (cf. Figure 17 Cisco VIRL Pane). Third, there is no assessment-based features, such as
setting exams or activities in VIRL and, according to the literature, these features are useful
(cf. 2.2.2 User Interface and Visualisation in network education). Fourth, VIRL may present
concerns in terms of cost and maintenance. According to the system requirements, VIRL
requires eight gigabytes of system memory and at least fifty gigabytes of disk space. In
reality, additional memory and CPU are required to facilitate the running of various network
topologies [19]. A rough calculation suggests if one simulated topology required eight
gigabytes of system memory, then a class of 25 students, each running one simulation, would
require a server with 200GB of system memory. Fifth, there are concerns that VIRL itself
could be slow. In preliminary tests, VIRL itself would seem to degrade at seemingly-random
times. This was manifested in the form of slow typing and characters not loading on the
screen. In engine version 0.10.17.8, the problem seemed to have been corrected. An
investigation found that the cause was nodes would frequently suspend to save resources, but
this produced the unwanted side effect of sluggish performance. Sixth, installation of VIRL
is non-trivial, according to the vendor documentation [39]. Hardware may need to be updated
to meet the system requirements of five network adapters and the chipset and CPU must be
able to support hardware-assisted virtualisation extensions. If the server is ran in a virtualised
environment, such as an ESXI server, the underlying hardware and vCenter must support and
be setup to allowed nested virtualisation, as VIRL runs the KVM hypervisor on its server.
69
In addition to these concerns, there are also some potential positive features in VIRL. First,
as already discussed in this thesis, VIRL has the capability of enhancing realism, including a
range of commands not available in software solutions like Packet Tracer. Second, VIRL
does not require specialised network hardware, destined to be out of date in a few years,
allowing VIRL to be seemingly integrated onto standard computer hardware that meets the
system requirements. This feature also potentially allows network training topologies to be
established in third-world countries that lack an infrastructure. Third, unlike GNS3, VIRL
supports a number of other devices including Cisco switches and the Cisco ASA Security
appliance.
These concerns and positive features are speculation because no studies have been done to
determine if these possible concerns are actually valid. The research aims to address some of
these concerns and positive features. For example, are the visualisation features of Packet
Tracer necessary? Can Cisco VIRL facilitate advanced network configuration and
troubleshooting? Cisco VIRL has useful features, but this alone does not mean that it will
positively improve student’s learning. Therefore, the research is necessary to investigate the
student’s active learning i.e. the application of existing knowledge to new problems.
4.3 Conclusion
It is clear from the literature that current tools do not facilitate the level of learning that is
required, according to reviewed literature on education. It is also further evident that VIRL is
unlike other platforms reviewed due to the way it replicates a computer network. Its
advantages and disadvantages are speculation because no actual studies have been done at
this stage. Its true effectiveness in an academic training environment is unclear. Both
uncertainty as to the true implications of VIRL and the gaps in the literature necessitate for
this research to be carried out.

70
With universities looking at ways to cut costs, it is expected that physical equipment in
networking classes may become less common. As a result, the importance of understanding
how this platform is used in an academic setting is very important. The effectiveness of how
it generates knowledge and the perceptions of how it enhances education are two major
points to be explored in this research.

71
5. Experiment and Results
In this chapter, we discuss the experiment we undertook as part of our research into the role
of VIRL in a network training environment and then present and describe the results of our
studies. First, we extensively outline the experimental design and implementation, so that the
experiment can be repeated at a later stage as part of future work. Second, we present and
describe the raw data and graphs of our studies.
5.1 Experiment
In this section, we extensively discuss every detail and aspect of our research throughout the
academic year. The estimated time to plan and execute the experiment took approximately 6
months full time. The experiment was setup to answer the research questions proposed in
Chapter 3 Methodology and to provide some data on VIRL as a result of the literature gaps
outlined in Chapter 4 The Case for Investigating Cisco VIRL.
First, we detail the experimental design and justify every aspect of how the experiment was
designed. Second, we detail the setup of the experiment in accordance with the design. Third,
we effectively tell a story of how the experiment was implemented, including any problems
we had, or any observations we had. No results are presented in this section.

72
5.1.1 Design
We designed our experiment to answer a select few research questions (cf. 3.1 Research
Questions and Hypothesis). Measuring learning is, by no means, a simple methodology. A
review of the literature identified the issues with measuring learning. For instance, often
learning is defined as a set of outcomes, but since Kolb’s learning model seems to suggest
that learning is a process, we wanted to avoid measuring learning outcomes [15]. Therefore,
we designed an experiment that would require the student to obtain some new knowledge and
then use that knowledge (as well as other existing knowledge) to troubleshoot network
problems. We used triangulation i.e. a variety of research methods to answer the research
questions. First, we measured their knowledge quantitatively, like in a traditional paper-based
examination. Second, we quantitatively measured their confidence of various network
concepts. Third, we quantitatively asked their perceptions of how they learn networking and
qualitatively asked their opinions of using VIRL. Qualitative observations were made by the
investigator of how he perceived the student was performing, for instance, did the participant
seem confused during the activity? Participants were also required to rate the activity itself,
because it is not simply the tool that is important but the activity as well [13].

73
The experiment was designed to require participants to complete a four-part practical activity
and two questionnaires. The first one issued before the activity and the second one issued
after the activity. The questionnaires assessed the participant’s knowledge of networking,
required them to rate their confidence and to give opinions on the use of VIRL.
To exclusively relate the participants’ learning experience to VIRL itself, the experiment was
designed to be ran under exam-like conditions where students were not permitted to
communicate, ask for help or use the Internet to get answers. Participants were permitted to
use the help features in VIRL itself, including the use of the help commands on Cisco routers.
Additionally, it was recognised that the tool alone is insufficient to enhance learning, so the
lab instructions contained short descriptions of STP port fast and HSRP, as well a list of
useful commands for troubleshooting, but were not instructed when or how to use the
provided commands for the troubleshooting section. They were observed to see how they
could apply critical thinking to the problems.
The practical activity was divided into four parts including:-
1. Theoretical Component: The theoretical component provided participants with 10
minutes to read through the lab booklet in its entirety before being permitted to
undertake the practical lab itself. In the view of the investigator, this helped provide
the participant with a conceptual background and to give him knowledge of network
concepts. The intent of this was to simulate the knowledge received during a lecture
or by reading a text book.
2. Learning New Configuration: The participant was required to use step by step
instructions to configure a new concept, HSRP, but were required to use the
debugging commands and to explain what they had configured. Additionally,
participants were required to make changes to HSRP using the help commands.
Participants were recommended to spend 20 minutes on this part, but were free to

74
allocate as much time as they wanted. They were given 60 minutes to complete parts
2 through to 4.
3. Using debugging commands to observe network behaviour: Participants were
observed on their ability to interpret and understand the debugging commands, and to
use the debugging commands to explain how STP port fast operates when a port is
shutdown and activated on a network switch. This was done because it was
hypothesised that the debugging commands would provide a clear understanding of
what this does, better than human explanation or illustrations.
4. Troubleshooting: The main part of the practical was to use knowledge learned in the
first three steps, including the readings, to troubleshoot three problems. One problem
was an easy misconfiguration of a passive-interface. The third second problem related
to network address translation (NAT), a concept most students tend to have problems
with. We wanted to see if by using the debugging commands would help ease the
troubleshooting time and better facilitate understanding. The third problem was a
simple access control list being applied in the wrong direction on the interface. All
these problems prevented NAT operation. The participants were required to get NAT
working fully and use ping to verify full connectivity.
We wanted to demonstrate that VIRL can facilitate troubleshooting exercises by use its
debugging features that may not be available on other software-driven platforms. As such,
the experiment was designed so that participants had to make use of the debugging
commands to observe and troubleshoot network operation. In fact, it was hypothesised that
the debugging commands would enhance learning, so the experiment was designed to require
participants to use the debugging commands after typing in certain commands and then try
and work out what the commands do, rather than be given step-by-step instructions. We
acknowledged that some step-by-step instructions were necessary to provide students with a
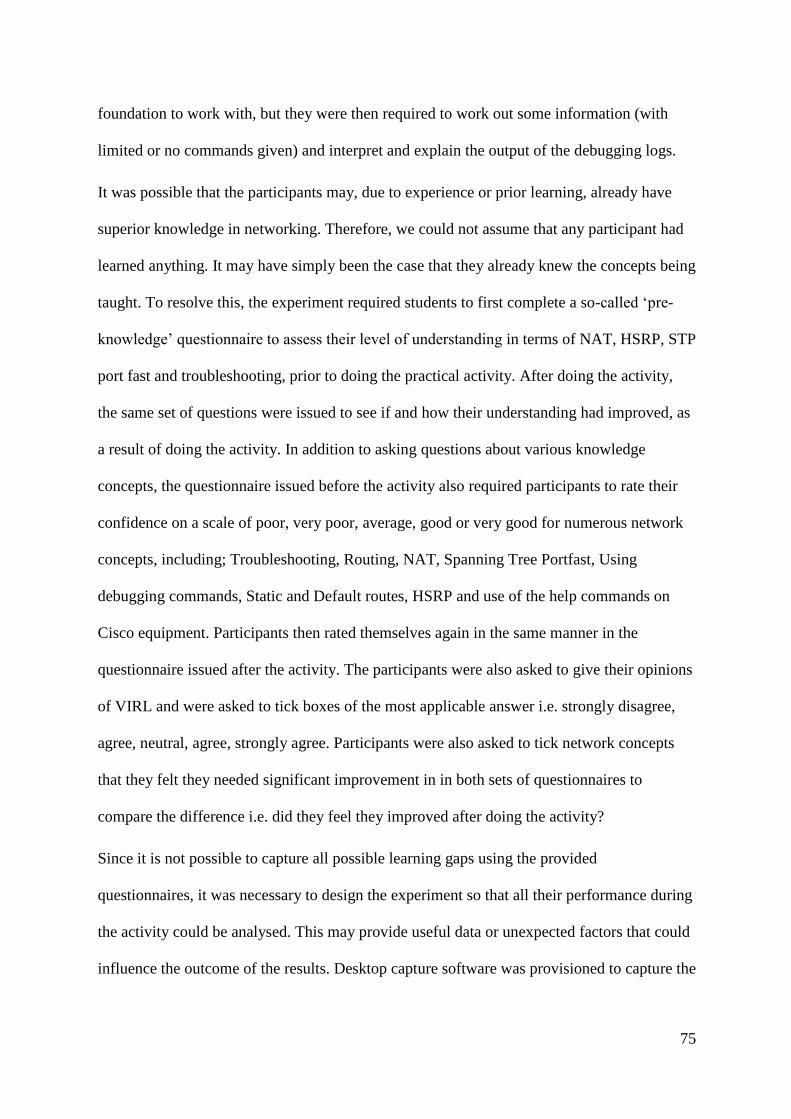
75
foundation to work with, but they were then required to work out some information (with
limited or no commands given) and interpret and explain the output of the debugging logs.
It was possible that the participants may, due to experience or prior learning, already have
superior knowledge in networking. Therefore, we could not assume that any participant had
learned anything. It may have simply been the case that they already knew the concepts being
taught. To resolve this, the experiment required students to first complete a so-called ‘pre-
knowledge’ questionnaire to assess their level of understanding in terms of NAT, HSRP, STP
port fast and troubleshooting, prior to doing the practical activity. After doing the activity,
the same set of questions were issued to see if and how their understanding had improved, as
a result of doing the activity. In addition to asking questions about various knowledge
concepts, the questionnaire issued before the activity also required participants to rate their
confidence on a scale of poor, very poor, average, good or very good for numerous network
concepts, including; Troubleshooting, Routing, NAT, Spanning Tree Portfast, Using
debugging commands, Static and Default routes, HSRP and use of the help commands on
Cisco equipment. Participants then rated themselves again in the same manner in the
questionnaire issued after the activity. The participants were also asked to give their opinions
of VIRL and were asked to tick boxes of the most applicable answer i.e. strongly disagree,
agree, neutral, agree, strongly agree. Participants were also asked to tick network concepts
that they felt they needed significant improvement in in both sets of questionnaires to
compare the difference i.e. did they feel they improved after doing the activity?
Since it is not possible to capture all possible learning gaps using the provided
questionnaires, it was necessary to design the experiment so that all their performance during
the activity could be analysed. This may provide useful data or unexpected factors that could
influence the outcome of the results. Desktop capture software was provisioned to capture the
76
desktop of the participants’, so their activities could be later analysed, if required.
Additionally, the investigator would take notes in real time of key observations.
5.1.2 Setup
Four desktop computers in the Cisco lab at the University of South Australia, running
Microsoft Windows 7 were allocated to the participants. These machines, usually used by
networking students during their usual classes required only minimal configuration.
The University of South Australia runs VMWare vSphere 5.5 to power its teaching
infrastructure. The ESXI host is a Dell PowerEdge blade server that has the capability of
running many virtual machines provisioned from vCenter. A new virtual machine, allocated
16 gigabytes of memory and 60GB of disk space was created on the aforementioned ESXI
host named VIRL. Virtual Internet Routing Lab was then installed on this virtual machine, as
per the vendor’s instructions for installing it in a virtualised environment, including enabling
the necessary pass-through features on the ESXI host to allow a virtual machine to provision
virtual machines itself, a necessary step for VIRL to run.

77
The diagram below helps illustrate the setup:-
After installing VIRL, it was tested for stability, but was extremely slow and lagging, so was
unusable at this time. Further investigations seemed to confirm that the virtual machine with
VIRL installed had enough resources to run VIRL. However, to be on the safe side, the
memory allocated to the VIRL virtual machine server was increased from 16 gigabytes to 32
gigabytes. The performance was only scarcely improved.
Consoles were too slow to use, so it became almost impossible to create a topology for
participants to use. In the view of the investigator, the VIRL implementation’s performance
was suboptimal and could not be considered stable enough to roll out for participants to try
because the slowness would distort the results in a negative fashion and would not give an
accurate view of VIRL. Rebooting the VIRL server sometimes improved performance, but
the longer, the system was left running, the greater the degradation of performance. In some
instances, VIRL remained slow even after a reboot. The consoles would pause for about 5
seconds in between typing each character into the console. It was not a smooth experience.
The client itself seemed to respond fine and ping times to the server were within acceptable
ranges, indicating the server was not overloaded. However, pings between nodes in the
topology were extremely high. The show processes command issued on the nodes in the
Dell Blade Server – ESXI Host in UniSA vCenter
VIRL Server (VM) Other Server
VIRL
Node
VIRL
Node
VIRL
Node
OS Processes
External
Network
Figure 16 Architecture Diagram
78
topology indicated abnormally high CPU usage, at least this was the view of a CCNA
instructor, who was sent a verbatim output of the show processes command.
During this phase, the university approved the proposed experiment on the grounds of
complying with the applicable ethics guidelines. Despite the perceived suboptimal
performance of VIRL, it was nevertheless, necessary to proceed with the experiment. In
September 2015, Cisco released an update to the core system of VIRL and updates to the
various IOS images. After applying this update to the VIRL server, subsequent testing
revealed a substantial improvement to the VIRL system. Console windows responded at an
acceptable level and, at times, even perceivably exceeded the performance of NetLab (which
is also used at UniSA).
The VM Maestro client used to connect to the VIRL server from a networked computer was
installed onto four desktop machines in the Cisco lab at UniSA. Despite the applying of the
update, the investigator remained unsure of how VIRL would cope under intense workloads.
This experiment was not setup to evaluate performance, but to evaluate VIRL in an education
environment and we felt that if the performance was very suboptimal, it would distract from
the research questions we were trying to test. This was mitigated by restricting VIRL to only
four simulations at a time to ease CPU load.

79
Next, the investigator designed a topology for the purposes of this experiment using the
VIRL VM Maestro client. The configurations of each node were done in the topology. The
topology file was saved to the investigator’s computer. Like Packet Tracer, configurations
are contained within the same topology file. The topology file was copied to a secure
network share and subsequently copied onto each of the lab workstations into the user’s
profile directory, which is our case, was named unisa. To avoid having to copy the topology
onto many profiles, each participant used the same generic logon account that was specially
created for this experiment. The investigator logged onto the four desktop using the account
unisa and setup the environment, including starting the VM Maestro client, so that it was
ready when the participants arrived. This step was taken to reduce time wasted getting
(potentially confused) participants setting up VIRL themselves.
Figure 17 Network Topology For Experiment

80
Each lab machine had two monitors. The first monitor contained the graphical user interface
of the VIRL client, which showed the topology (cf. Figure 14 Network Topology For
Experiment).
The second monitor (cf. Figure 15 Experiment Console Setup) contained all of the consoles
for the routers and switches in the topology. Users switch between each node’s console by
clicking on the tabs.
The consoles were already open and setup at the commencement of the experiment, to reduce
the amount of confusion encountered by students, since in our experiment, we wanted to
focus on using the command line aspect of VIRL to see how it would enhance education.
Figure 18 Experiment Console Setup
81
5.1.3 Implementation
Multiple sessions for the experiment were scheduled over a period of two weeks. Each
session was scheduled to take two hours to complete and consisted of between two and four
participants, depending on demand.
Overall, performance of VIRL was perceivably satisfactory and the experiment in most cases
ran smoothly without issues. Only in one case did VIRL performance degrade, preventing
smooth completion of the experiment. An investigation found that another virtual machine
was running on the same underlying ESXI host also used by the VIRL virtual machine,
preventing VIRL from making full use of the CPU (cf. Figure 13 Architecture Diagram).
This unexpectedly hampered performance so badly that nodes stopped responding. This
unintended key finding suggests that if CPU or memory is depleted, nodes can stop without
warning and the client is not informed that resources have reached their limits. The nodes
continue running, but fail to respond to user input, creating frustration. The user is not
informed that memory or CPU resources are the cause. In our case, this was an unintended
resource management issue unrelated to VIRL but it does highlight the lack of feedback the
user receives, for instance, an error message on the client would help make the problem
clearer.
82
5.2 Results
This section describes and analyses the quantitative data for the experiment. For readability,
the raw data has been converted into a series of graphs using Microsoft Excel 2013. Only key
graphs are presented in this section. For a comprehensive list of the graphs, please refer to
Appendix 1 – Raw Data Results. The source of the data comes from the research
questionnaires (cf. Appendix 2 – Pre-Lab Questionnaire, cf. Appendix 2 – Practical Booklet,
cf. Appendix 3 – Post Lab Questionnaire) and from observations made by the investigator
that can be represented in a quantitative fashion. This section discusses the outcomes of the
graphs. It does not analyse the feedback of the participants or other qualitative findings (cf.
Chapter 6 Discussion).
First, we present the graphs relating to the network knowledge questions. Second, we present
the graphs relating to the participant’s confidence, including the calculated averages. Third,
we present graphs relating to the participants’ perceptions of the activity, networking and of
Virtual Internet Routing Lab. Fourth, we present graphs relating to how often participants
tend to use debugging commands, based solely upon their given answer. Fifth, we present
graphs, which analysed their performance during the activity. Unlike the previous graphs,
these are based on the observations of the researcher. Sixth, we present graphs that could
indicate variability between the data.
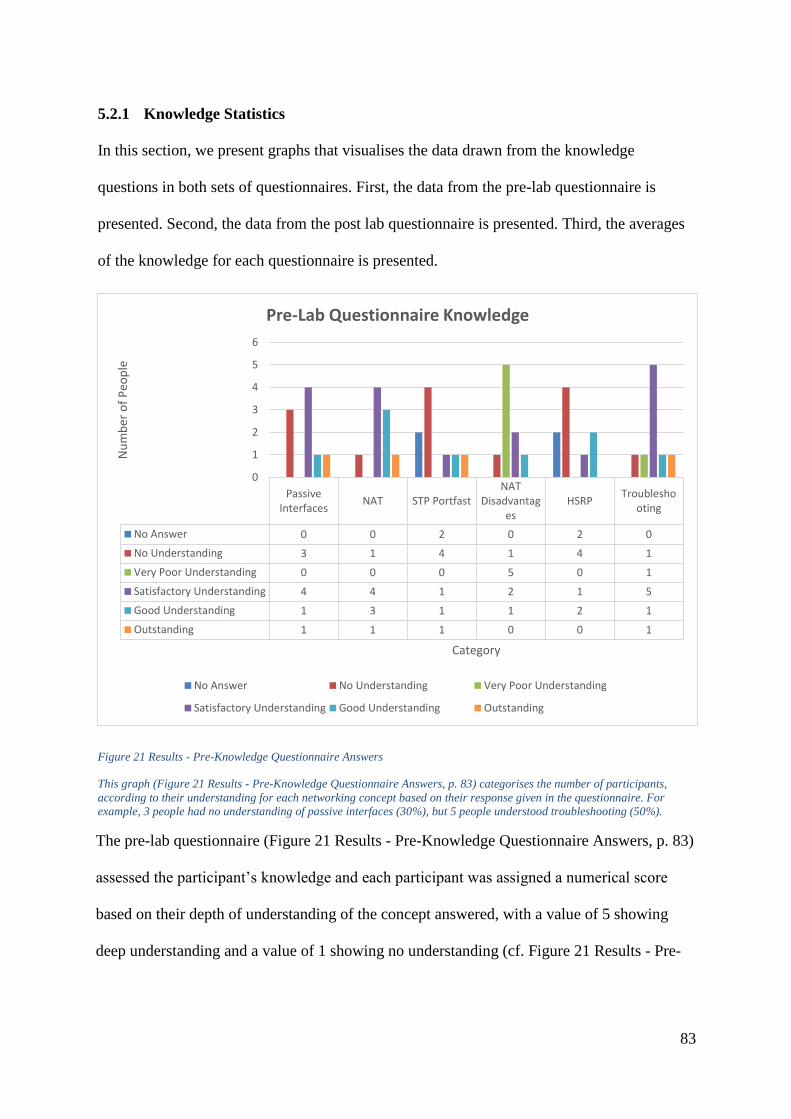
83
5.2.1 Knowledge Statistics
In this section, we present graphs that visualises the data drawn from the knowledge
questions in both sets of questionnaires. First, the data from the pre-lab questionnaire is
presented. Second, the data from the post lab questionnaire is presented. Third, the averages
of the knowledge for each questionnaire is presented.
Figure 21 Results - Pre-Knowledge Questionnaire Answers
This graph (Figure 21 Results - Pre-Knowledge Questionnaire Answers, p. 83) categorises the number of participants,
according to their understanding for each networking concept based on their response given in the questionnaire. For
example, 3 people had no understanding of passive interfaces (30%), but 5 people understood troubleshooting (50%).
The pre-lab questionnaire (Figure 21 Results - Pre-Knowledge Questionnaire Answers, p. 83)
assessed the participant’s knowledge and each participant was assigned a numerical score
based on their depth of understanding of the concept answered, with a value of 5 showing
deep understanding and a value of 1 showing no understanding (cf. Figure 21 Results - Pre-
PassiveInterfaces
NAT STP PortfastNAT
Disadvantages
HSRPTroublesho
oting
No Answer 0 0 2 0 2 0
No Understanding 3 1 4 1 4 1
Very Poor Understanding 0 0 0 5 0 1
Satisfactory Understanding 4 4 1 2 1 5
Good Understanding 1 3 1 1 2 1
Outstanding 1 1 1 0 0 1
0
1
2
3
4
5
6
Nu
mb
er o
f P
eop
le
Category
Pre-Lab Questionnaire Knowledge
No Answer No Understanding Very Poor Understanding
Satisfactory Understanding Good Understanding Outstanding
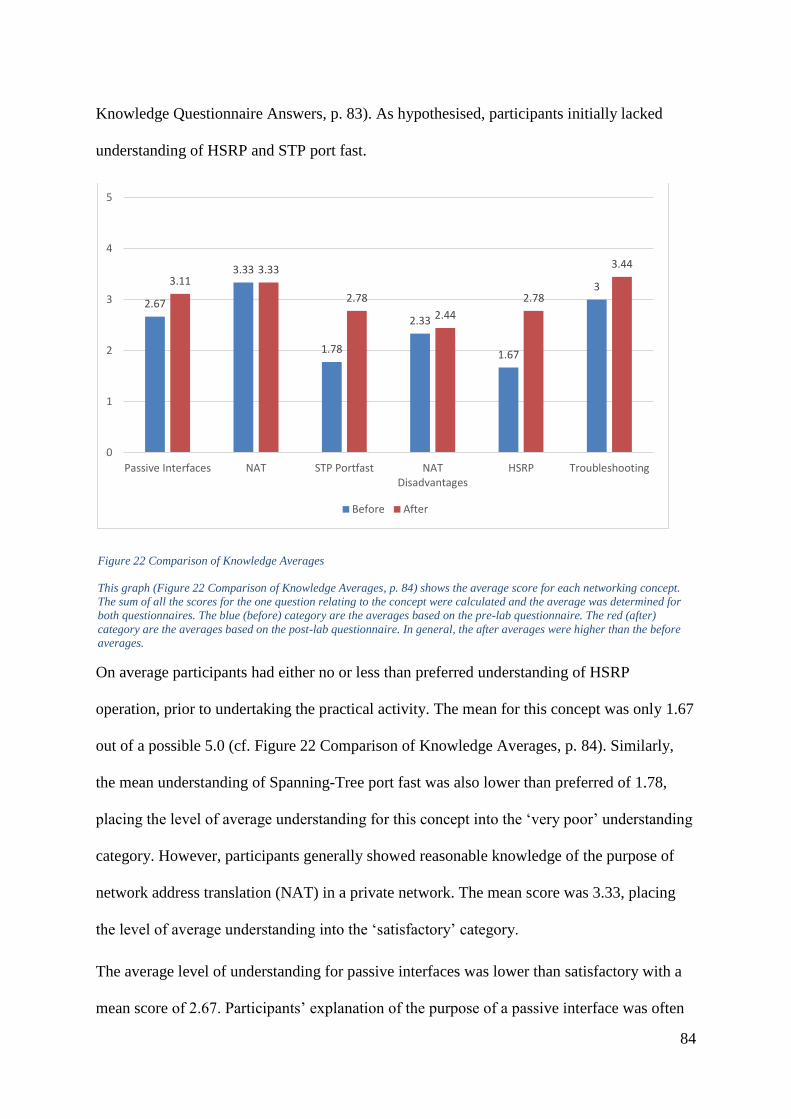
84
Knowledge Questionnaire Answers, p. 83). As hypothesised, participants initially lacked
understanding of HSRP and STP port fast.
Figure 22 Comparison of Knowledge Averages
This graph (Figure 22 Comparison of Knowledge Averages, p. 84) shows the average score for each networking concept.
The sum of all the scores for the one question relating to the concept were calculated and the average was determined for
both questionnaires. The blue (before) category are the averages based on the pre-lab questionnaire. The red (after)
category are the averages based on the post-lab questionnaire. In general, the after averages were higher than the before
averages.
On average participants had either no or less than preferred understanding of HSRP
operation, prior to undertaking the practical activity. The mean for this concept was only 1.67
out of a possible 5.0 (cf. Figure 22 Comparison of Knowledge Averages, p. 84). Similarly,
the mean understanding of Spanning-Tree port fast was also lower than preferred of 1.78,
placing the level of average understanding for this concept into the ‘very poor’ understanding
category. However, participants generally showed reasonable knowledge of the purpose of
network address translation (NAT) in a private network. The mean score was 3.33, placing
the level of average understanding into the ‘satisfactory’ category.
The average level of understanding for passive interfaces was lower than satisfactory with a
mean score of 2.67. Participants’ explanation of the purpose of a passive interface was often
2.67
3.33
1.78
2.33
1.67
33.113.33
2.78
2.44
2.78
3.44
0
1
2
3
4
5
Passive Interfaces NAT STP Portfast NATDisadvantages
HSRP Troubleshooting
Before After
85
vague and did not provide a lot of detail on this concept, demonstrating only limited
understanding.
The highest knowledge averages were in relation to network address translation with a mean
score of 3.33, troubleshooting with a mean score of 3.0 and passive-interfaces with a mean
score of 2.67 (though passive interfaces average was lower than expected since many
participants had experience in routing protocols) (cf. Figure 22 Comparison of Knowledge
Averages, p. 84). On the lower end of the scale, the least amount of understanding was
displayed in complex concepts such as STP port fast (mean 1.78) and HSRP (mean 1.67) (cf.
Figure 22 Comparison of Knowledge Averages, p. 84). This was expected because none of
the learning participants had officially been taught HSRP and STP in their usual networking
classes. It is speculated that their higher than expected understanding in NAT might be, in
part, due to some of the class students having learned network address translation as a
coincidence in the week leading up to the experiment. It is also speculated that STP port fast
may be low because the question assessing it was not straightforward, but required them to
apply knowledge, substantiating the claims of the literature that students cannot apply the
material, despite having the knowledge [12]. A question assessing the disadvantages of NAT
had a mean score of 2.33, placing the average level of knowledge into the ‘very poor’
category (cf. Figure 22 Comparison of Knowledge Averages, p. 84). This question also
required the participant to have some experience with the protocols that NAT does not work
(very well) with and to apply knowledge. This also seems to strengthen the claims of the
literature that application of knowledge is suboptimal in many cases [12]. According to
Figure 16 Results - Pre-Knowledge Questionnaire Answers (p. 83), 5 people (50%) had a
very poor understanding of NAT disadvantages, despite the fact only 10% (1 person)
struggled with a similar question asking when NAT would be used. 3 persons (30%) had a
good understanding of NAT.

86
Figure 23 Results - Post Knowledge Questionnaire Answers
This graph (Figure 23 Results - Post Knowledge Questionnaire Answers) categorises the number of participants, according
to their understanding for each networking concept based on their response given in the questionnaire. For example, only 1
person had no understanding of passive interfaces (10%), but 4 people had satisfactory understanding of HSRP (40%).
The post lab data shows only a fractional improvement to the disadvantages of NAT (cf.
Figure 21, p. 83 & Figure 23 Results - Post Knowledge Questionnaire Answers, p. 84).
Although the disadvantages of network address translation were mentioned in the practical
booklet to be read by participants, it became evident that, on average, many participants did
not use this knowledge when answering the question in the post lab questionnaire, possibly
indicating that reading the material alone is not sufficient to solidify the understanding. On
the contrary, STP port fast and HSRP, the lowest concepts according to Figure 21 Results -
Pre-Knowledge Questionnaire Answers (p. 83) were among the most improved in the post
lab questionnaire (cf. Figure 23 Results - Post Knowledge Questionnaire Answers, p. 84 &
Figure 22 Comparison of Knowledge Averages, p. 84). Troubleshooting was among the least
PassiveInterfaces
NAT STP PortfastNAT
DisadvantagesHSRP
Troubleshooting
No Answer 0 0 2 0 0 0
No Understanding 1 1 1 1 1 0
Very Poor Understanding 1 0 1 4 2 1
Satisfactory Understanding 4 4 1 3 4 5
Good Understanding 2 3 1 1 2 1
Outstanding 1 1 3 0 0 2
0
1
2
3
4
5
6
Nu
mb
er o
f P
eop
le
Category
Post-Lab Questionnaire Knowledge
No Answer No Understanding Very Poor Understanding
Satisfactory Understanding Good Understanding Outstanding

87
improved in the post-lab questionnaire, but on average, was still satisfactory to good. It is
evident that the troubleshooting process undertaken during the practical enhanced
understanding of other concepts. For example, passive-interfaces had to be troubleshooted
during the troubleshooting phase of the practical, and on average, showed a substantial
improvement over the pre-lab data (cf. Figure 22 Comparison of Knowledge Averages, p.
84).
In addition to the average data, individual results also have be analysed (cf. Figure 21 Results
- Pre-Knowledge Questionnaire Answers, p. 83 & Figure 23 Results - Post Knowledge
Questionnaire Answers, p. 86). For instance, only 1 person (10%) had outstanding
knowledge in STP port fast, prior to the lab. After the lab, 3 persons had outstanding
knowledge in the same concept.
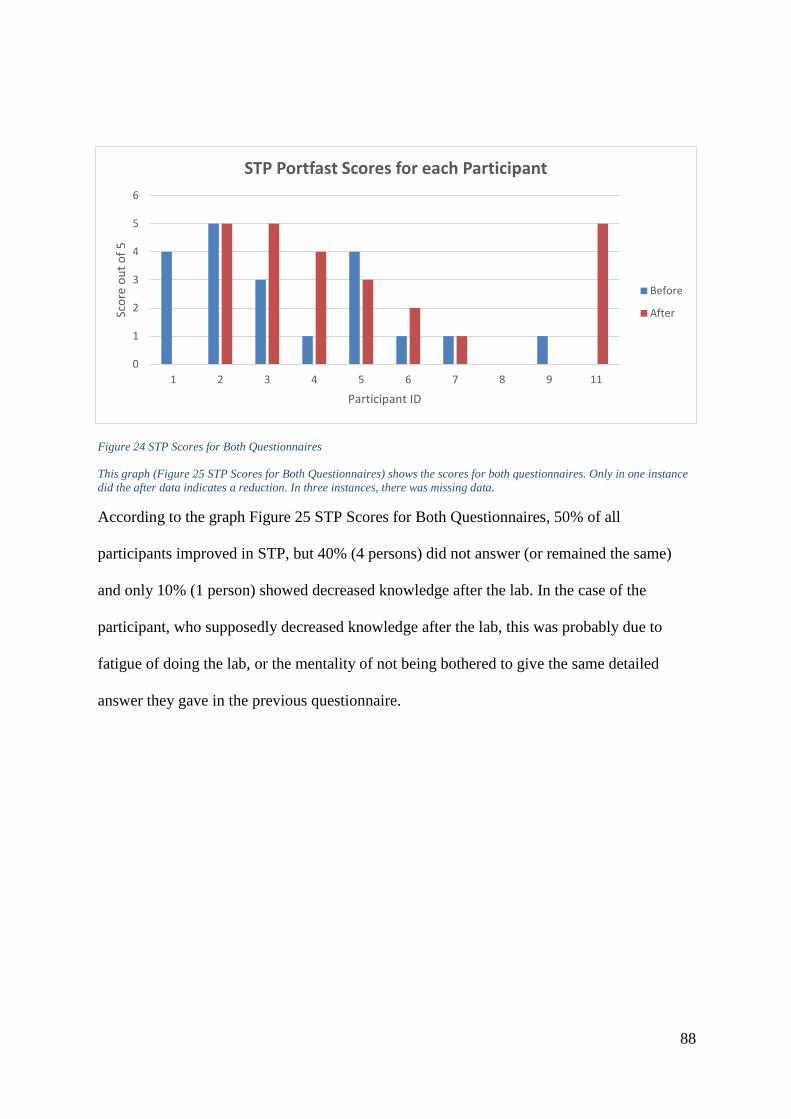
88
Figure 24 STP Scores for Both Questionnaires
This graph (Figure 25 STP Scores for Both Questionnaires) shows the scores for both questionnaires. Only in one instance
did the after data indicates a reduction. In three instances, there was missing data.
According to the graph Figure 25 STP Scores for Both Questionnaires, 50% of all
participants improved in STP, but 40% (4 persons) did not answer (or remained the same)
and only 10% (1 person) showed decreased knowledge after the lab. In the case of the
participant, who supposedly decreased knowledge after the lab, this was probably due to
fatigue of doing the lab, or the mentality of not being bothered to give the same detailed
answer they gave in the previous questionnaire.
0
1
2
3
4
5
6
1 2 3 4 5 6 7 8 9 11
Sco
re o
ut
of
5
Participant ID
STP Portfast Scores for each Participant
Before
After

89
5.2.2 Confidence Data
Figure 25 Results - Confidence Prior to the Lab Activity
This graph (Figure 25 Results - Confidence Prior to the Lab Activity, p. 89) categorises each participant into a category of
either very good, good, average, poor, very poor, or no answer, according to their response to the question in the
questionnaire. The graph indicates the number of people in each category. For example, seven people indicated they were
good at troubleshooting, prior to doing the lab activity. Four people indicated that they were very good at using show
commands prior to undertaking the activity.
In general, participants rate themselves very highly in most of the network concepts, prior to
undertaking the lab (cf. Figure 25 Results - Confidence Prior to the Lab Activity, p. 89). The
mean confidence for HSRP is slightly higher for the post lab questionnaire, than prior to the
activity (cf. Figure 26 Results - Confidence in Networking Averages, p. 90).
PerceivedTroublesh
ooting
PerceivedRouting
PerceivedNAT
PerceivedSTP
Portfast
PerceivedDebugging
CMDs
PerceivedStatic/Defa
ult
PerceivedHSRP
Perceived? CMDs
Perceiveduse ofshow
commands
No Answer 0 0 0 0 0 0 0 0 0
Very Poor 0 0 0 0 0 0 1 0 0
Poor 0 0 0 2 1 0 4 0 0
Average 0 2 4 3 5 1 3 2 1
Good 7 5 5 4 3 5 2 4 5
Very Good 3 3 1 1 1 4 0 4 4
0
1
2
3
4
5
6
7
8
Nu
mb
er o
f P
eop
le
Category
Confidence Prior to the Lab Activity
No Answer Very Poor Poor Average Good Very Good

90
Figure 26 Results - Confidence in Networking Averages
In the graph above (Figure 26 Results - Confidence in Networking Averages), the results of the average confidence in
various areas of networking is presented. The data is extrapolated from the pre-lab questionnaire that asked for their
confidence in the specified area on a scale between 1 and 5. A value of 0 indicates no answer was given. For each
networking concept, an average was calculated and presented on the graph.
The ‘after’ data is extrapolated from the post-lab questionnaire for the confidence rating for each discrete value
and then an average for each value was calculated and presented. As a result, the averages before the practical
activity and the averages after the lab activity can be easily compared.
The average confidence for STP port fast and routing was the same for both questionnaires.
This may have been influenced by many factors. For instance, one student may have
increased significantly, while another decreased significantly, helping to balance out the
averages. It may have indicated that participants were genuinely less confident these
concepts and accurately rated themselves in the pre-lab questionnaire and in their view, the
lab may have simply confirmed their level of confidence.
Confidence in using show commands, network address translation and general
troubleshooting decreased after doing the practical, but confidence in using help commands
was slightly increased, showing a potentially positive trend towards using VIRL (cf. Figure
Perceived
Troubleshooting
Perceived
Routing
Perceived NAT
Perceived STP
Portfast
Perceived
Debugging CMDs
Perceived
Static/Default
Perceived HSRP
Perceived ?
CMDs
Perceived use of
showcomman
ds
Before 4.3 4.1 3.7 3.4 3.4 4.3 2.6 4.2 4.3
After 3.7 4.1 3.5 3.4 3.4 4.1 3.2 4.3 4.1
0
1
2
3
4
5
Ave
rage
Sco
re
Category
Confidence in Networking Averages
Before
After

91
26 Results - Confidence in Networking Averages, p. 90). Since the exercise required the use
of the help commands, this may have contributed to the slight increase in the mean
confidence.
Figure 27 Results - Confidence After the Lab Activity
This graph (Figure 27 Results - Confidence After the Lab Activity) is identical to Figure 25 Results - Confidence Prior to the
Lab Activity (p. 89), except that it is data derived from the questionnaire given after the lab. According to the data, eight
people rated themselves as ‘good’ at troubleshooting.
In general, participants rated themselves as ‘satisfactory’ at using the debugging commands
in both questionnaires (cf. Figure 25 Results - Confidence Prior to the Lab Activity, p. 89,
Figure 27 Results - Confidence After the Lab Activity, p. 91 and Figure 26 Results -
Confidence in Networking Averages, p. 90). Although, debugging commands were used
extensively in the practical, the data suggests average confidence levels in using debugging
commands did not improve. Aside from HSRP, it was clear that use of debugging commands
was one of the lowest rated items, with participants generally rated themselves as only
PerceivedTroublesh
ooting
PerceivedRouting
PerceivedNAT
PerceivedSTP
Portfast
PerceivedDebugging
CMDs
PerceivedStatic/Defa
ult
PerceivedHSRP
Perceived? CMDs
Perceiveduse ofshow
commands
No Answer 0 0 0 0 0 0 0 0 0
Very Poor 0 0 0 0 0 0 0 0 0
Poor 1 1 1 1 0 0 1 0 0
Average 1 0 3 4 6 2 7 1 3
Good 8 6 6 5 4 5 1 5 3
Very Good 0 3 0 0 0 3 1 4 4
0
1
2
3
4
5
6
7
8
9
Nu
mb
er o
f P
eop
le
Category
Confidence After the Lab Activity
No Answer Very Poor Poor Average Good Very Good
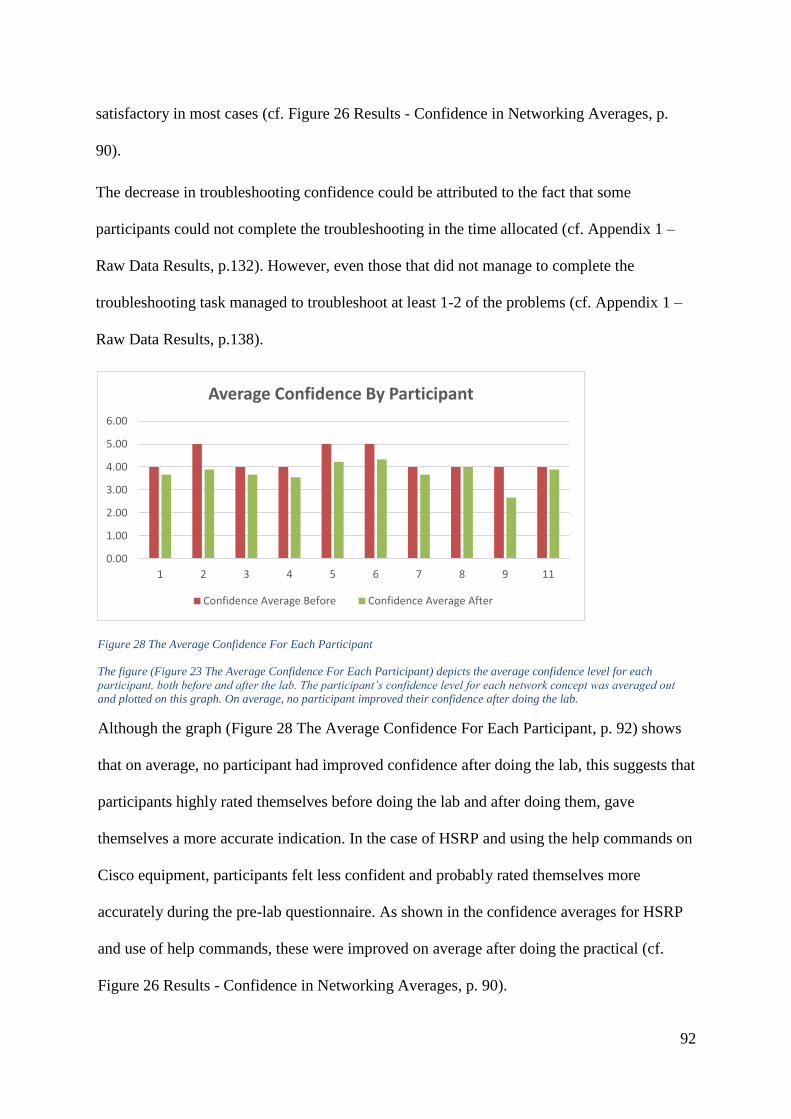
92
satisfactory in most cases (cf. Figure 26 Results - Confidence in Networking Averages, p.
90).
The decrease in troubleshooting confidence could be attributed to the fact that some
participants could not complete the troubleshooting in the time allocated (cf. Appendix 1 –
Raw Data Results, p.132). However, even those that did not manage to complete the
troubleshooting task managed to troubleshoot at least 1-2 of the problems (cf. Appendix 1 –
Raw Data Results, p.138).
Figure 28 The Average Confidence For Each Participant
The figure (Figure 23 The Average Confidence For Each Participant) depicts the average confidence level for each
participant, both before and after the lab. The participant’s confidence level for each network concept was averaged out
and plotted on this graph. On average, no participant improved their confidence after doing the lab.
Although the graph (Figure 28 The Average Confidence For Each Participant, p. 92) shows
that on average, no participant had improved confidence after doing the lab, this suggests that
participants highly rated themselves before doing the lab and after doing them, gave
themselves a more accurate indication. In the case of HSRP and using the help commands on
Cisco equipment, participants felt less confident and probably rated themselves more
accurately during the pre-lab questionnaire. As shown in the confidence averages for HSRP
and use of help commands, these were improved on average after doing the practical (cf.
Figure 26 Results - Confidence in Networking Averages, p. 90).
0.00
1.00
2.00
3.00
4.00
5.00
6.00
1 2 3 4 5 6 7 8 9 11
Average Confidence By Participant
Confidence Average Before Confidence Average After
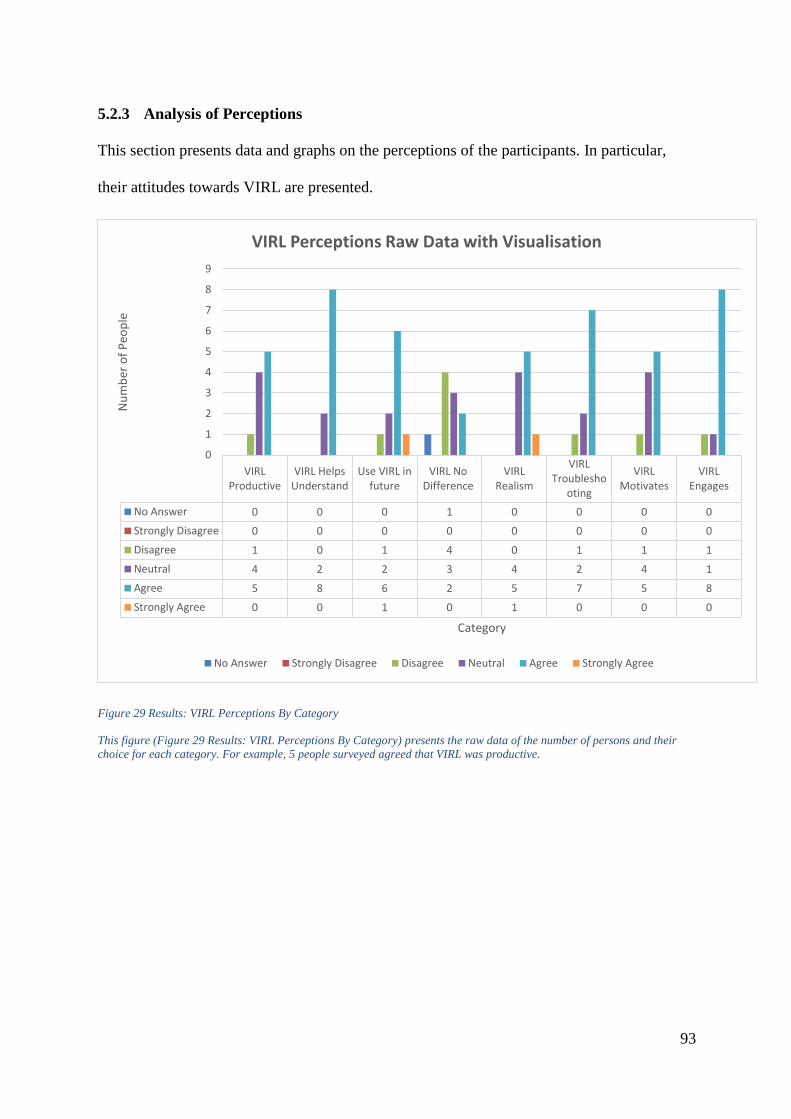
93
5.2.3 Analysis of Perceptions
This section presents data and graphs on the perceptions of the participants. In particular,
their attitudes towards VIRL are presented.
Figure 29 Results: VIRL Perceptions By Category
This figure (Figure 29 Results: VIRL Perceptions By Category) presents the raw data of the number of persons and their
choice for each category. For example, 5 people surveyed agreed that VIRL was productive.
VIRLProductive
VIRL HelpsUnderstand
Use VIRL infuture
VIRL NoDifference
VIRLRealism
VIRLTroublesho
oting
VIRLMotivates
VIRLEngages
No Answer 0 0 0 1 0 0 0 0
Strongly Disagree 0 0 0 0 0 0 0 0
Disagree 1 0 1 4 0 1 1 1
Neutral 4 2 2 3 4 2 4 1
Agree 5 8 6 2 5 7 5 8
Strongly Agree 0 0 1 0 1 0 0 0
0
1
2
3
4
5
6
7
8
9
Nu
mb
er o
f P
eop
le
Category
VIRL Perceptions Raw Data with Visualisation
No Answer Strongly Disagree Disagree Neutral Agree Strongly Agree
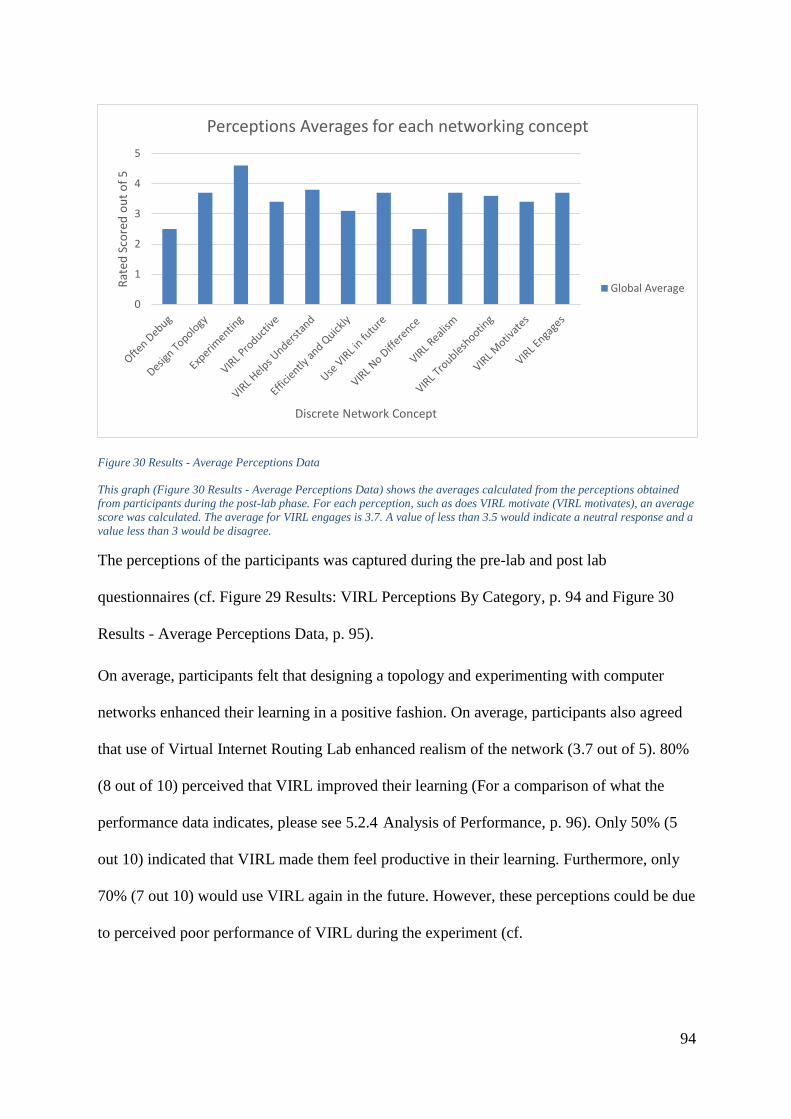
94
Figure 30 Results - Average Perceptions Data
This graph (Figure 30 Results - Average Perceptions Data) shows the averages calculated from the perceptions obtained
from participants during the post-lab phase. For each perception, such as does VIRL motivate (VIRL motivates), an average
score was calculated. The average for VIRL engages is 3.7. A value of less than 3.5 would indicate a neutral response and a
value less than 3 would be disagree.
The perceptions of the participants was captured during the pre-lab and post lab
questionnaires (cf. Figure 29 Results: VIRL Perceptions By Category, p. 94 and Figure 30
Results - Average Perceptions Data, p. 95).
On average, participants felt that designing a topology and experimenting with computer
networks enhanced their learning in a positive fashion. On average, participants also agreed
that use of Virtual Internet Routing Lab enhanced realism of the network (3.7 out of 5). 80%
(8 out of 10) perceived that VIRL improved their learning (For a comparison of what the
performance data indicates, please see 5.2.4 Analysis of Performance, p. 96). Only 50% (5
out 10) indicated that VIRL made them feel productive in their learning. Furthermore, only
70% (7 out 10) would use VIRL again in the future. However, these perceptions could be due
to perceived poor performance of VIRL during the experiment (cf.
0
1
2
3
4
5
Rat
ed S
core
d o
ut
of
5
Discrete Network Concept
Perceptions Averages for each networking concept
Global Average

95
5.1.3 Implementation, p. 81). It is important to note that performance of VIRL can change
drastically and without warning, if CPU resources are scarcely available. This could make
VIRL unusable and degrade learning. This also negatively influences how VIRL is
perceived, as indicated by the data. In one instance, two people (20%) claimed VIRL made
no difference to their learning and one person (10%) claimed he would prefer not to use
VIRL again because VIRL kept not responding during the activity. Other participants, while
using VIRL smoothly, positively rated the tool. 70% (7 out of 10) perceived VIRL as
improving their troubleshooting skills and 80% indicated that VIRL motivated them to learn.
In general, the perceptions of VIRL were positive with only a minimum number of
participants giving negative feedback.
Figure 31 Results: Exercise Data
In the figure (Figure 31 Results: Exercise Data), the attitudes towards how the exercise undertaken in phase 2 of the
experiment were evaluated during the post-lab questionnaire. In general, eight out of ten participants agreed that the
exercise helped with their understanding. One participant was unsure and one participant strongly agreed.
Perceived ExerciseHelped
Understanding
Exercise did nothelp
Exercise ImprovedTS
Exercise did notimprove TS
No Answer 0 1 0 1
Strongly Disagree 0 2 0 1
Disagree 0 6 0 4
Neutral 1 1 2 4
Agree 8 0 7 0
Strongly Agree 1 0 1 0
0123456789
Nu
mb
er o
f P
eop
le
Category
Exercise Perceptions with visualisation
No Answer Strongly Disagree Disagree Neutral Agree Strongly Agree

96
In addition to VIRL itself, participants also perceived the practical exercise to enhance
learning (cf. Figure 31 Results: Exercise Data, p. 96). 80% rated the exercise as improving
learning and 70% indicated that it improved their troubleshooting skills. Everyone agreed
that experimenting with networks helped them learn. 50% perceived that designing their own
topology was helpful for learning. The remaining 50% did not necessarily disagree with this,
but gave a neutral answer, suggesting that maybe the question was confusing or ambiguous
and, therefore, the figure could, in reality, be much higher (cf. Appendix 1 – Raw Data
Results, p. 130).
5.2.4 Analysis of Performance
Participants performed surprisingly well during the lab and every participant9 managed to
troubleshoot at least one of the problems (cf. Appendix 1 – Raw Data Results, p. 138).
Figure 32 Rated Performance Averages
The figure (Figure 32 Rated Performance Averages) shows the calculated averages for each of the observed concepts
derived from the performance data. On average, troubleshooting skills were satisfactory, though spatial awareness was
below satisfactory.
9 One participant did not attempt the troubleshooting due to system failure.
0
1
2
3
4
5
Average Performance Ratings

97
The qualitative observations made during the experiment were given an arbitrary score by the
researcher, so they can be analysed in a numerical fashion. The average performance was
plotted on a graph in Figure 32 Rated Performance Averages (p. 97). The data suggests
below satisfactory results in use of debugging commands and poor spatial awareness of the
network topology. On observation, many participants constantly referred to the included
topology sheet for help. The data suggests lower than satisfactory spatial awareness of the
network topology (cf. Figure 32 Rated Performance Averages, p. 97). For example, some
participants were confused on the direction of access control lists (ACLs).
Debugging commands were only used occasionally by many participants during the practical.
Two participants in particular, despite being well-knowledgeable in networking (cf. Figure
21 Results - Pre-Knowledge Questionnaire Answers, p. 83) did not troubleshoot all problems
in the allocated time. A possible explanation for this was their lack of use of the debugging
commands provided. Other (less knowledgeable) participants were able to troubleshoot the
network and these participants frequently used the debugging commands, suggesting that use
of the debugging commands improves the efficiency of the network troubleshooting process.

98
Figure 33 Most Recurring Values for Performance
The figure (Figure 33 Most Recurring Values for Performance) shows the most recurring value (i.e. the mode) for each of
the concepts observed. In general, most participants troubleshooted three problems. Most people had low anxiety and most
people had below satisfactory spatial awareness of the topology.
According to the graph (Figure 33 Most Recurring Values for Performance, p. 99), the
recurring score for troubleshooting and spatial awareness was only two. Because of the
limited possible values, a mode of 2 could possibly indicate that a majority of participants
received below satisfactory in these particular areas. However, there was also a great deal of
variation between the performance areas (cf. Appendix 1, p. 140). For instance, spatial
awareness, use of show commands and troubleshooting had the highest variation. Therefore,
even though, troubleshooting and spatial awareness was below satisfactory on average, the
data seems to suggest that one or more participants did well in these areas. This seems to
confirm the premise in the literature that students have diverse backgrounds and learning
styles that can greatly influence their performance [7] [17].
0
1
2
3
4
5
Mode of Performance for each concept
99
5.3 Summary
In this chapter, we outlined our experimental design for our experiment, incorporating a
number of techniques designed to answer the leading research question of the role of VIRL
in a networking training environment to enhance understanding. The experiment was setup in
a classroom environment where participants had to use a client to connect to Virtual Internet
Routing Lab, configuring a pre-setup network topology and troubleshooting a series of
problems. They were then required to answer a series of questionnaires, which were used for
both qualitative and quantitative analysis. In addition, notes were taken down by the
investigator for account for missing questions in the questionnaire. Furthermore, the
participants’ desktop session was captured using VLC screen capture functions to help
review the note taking process. Having undertaken the experiment, we then presented a series
of graphs to help demonstrate our findings, which are discussed in Chapters 6 and 7.
100
6. Discussion
In this section, we discuss the results of our study presented in Chapter 5 in extensive detail.
First, we discuss the participants’ feedback, their comments and their perceptions that could
not presented in chapter 5 due to being qualitative in nature. Second, we discuss some
potential factors that may have influenced the result and suggest some possible things for
improvement. Third, we present the research questions and analyse them. Finally, we briefly
list the key findings.
6.1 User Perceptions and Feedback
This section discusses the quantitative aspects of the participants i.e. the comments they
wrote, their observed performance during the experiment and other qualitative aspects.
6.1.1 System Performance
In a study by Sicker et. al. [21], students were very tolerant with technical difficulties and
glitches in their remote lab setup. In our study, the participants did not appear to be tolerant
of slow performance or technical glitches. In general, VIRL performed slowly due to the
nature of the setup. VIRL was installed onto an ESXI virtualisation host (which was sharing
resources with another virtual machine at the time). This meant that VIRL did not have
exclusive access to the CPU, resulting in degraded performance. Observations of participants
found that when VIRL performed slowly, students became confused because the console did
not respond immediately. Some believed the system had frozen or was broken. One
participant noted extreme slowness when the show run command was issued and perceived
this as a constraint to education. On one occasion, the CPU usage was abnormally high,
resulting in major complications. Routers and switches powered by VIRL refused to respond
as the system was effectively competing for CPU resources. This slowness was clearly
mentioned by at least two participants in the post-evaluation questionnaire, who noted, that

101
they would not want to use VIRL in future due its “lagging performance”. Comments
throughout the experiments also indicated slight annoyance at the slow operation of the
system.
In the Reflection Questionnaire, participants were asked to provide further comments on the
use of Virtual Internet Routing Lab for education. Several participants noted that VIRL was
slow in some fashion, as indicated by the quotes below:-
“The command line can be slow at times.” (Learner, Unique ID #8)
“It was easy to understand and use but I (found) that (when) completing the
commands it was very slow and lagged a lot when trying to configure basic
interfaces” (Learner, Unique ID #7)
“Was slow needs more resources behind it everything else was good” (Learner,
Unique ID #4)
“The ‘show run’ command was really slow, as the router built the configuration.
(It’s faster than this on a real machine.)” (Teacher, Unique ID #2)
Several participants ran out of time due to the slow use of the ‘show run’ command. On
another occasion, one participant could not complete the lab at all because the system
completely failed due to excess CPU usage. Participants frequently commented through the
experiment that the system was slower than preferred. In the personal view of the researcher,
the slow performance can distract from, and even confuse students, as users hitting enter to
access the router console perceive that nothing is happening, due to the system performing
slower than expected. This may suggest a phenomenon that occurs in training environments
where networks tend to respond fast due to low bandwidth utilisation and limited processes.
102
As a result, this can create a perception that routers should respond almost instantly and that
even a small delay could indicate a problem.
6.1.2 User Interface and Topology
The study focused on evaluating the realism of VIRL and for demonstrating it for use in
learning advanced network concepts. To limit the level of training that was required,
participants were not required to extensively interact with the user interface (cf. 6.3.2 Limited
Scope). This could be considered an experimental design flaw because it limits VIRL to the
command line and consoles, potentially limiting the amount of learning that can occur
through the software.
One participant, in particular, briefly commented about this problem.
“Unfortunately my experience in the experiment was limited to the console
windows. I did not have any interaction with the LHS screen. I can only assume
that the platform offers more (challenging) opportunities, however, these were
not presented in this session.” (Learner, Unique ID #11)
Another participant commented that they found switching between the console windows easy
and that being able to visualise the network topology was useful. This would suggest that
being able to refer to a visual depiction of the topology is essential. During the study,
frequent reference was made to the print out of the topology sheet given, reinforcing a
common conception that learners depend on being able to look at a visual topology.
Therefore, without a topology, learners would quickly get confused and lost. In fact,
observations made during the experiment suggest that participants easily become confused
when information is not made clear in the topology. Several participants became confused
with the direction of ACLs, the position of routing protocols and the position of HSRP.
Others perceived a mistake with the HSRP configuration because they spatially could not
103
determine the direction of where HSRP was operating, even though this was made clear in
the overview of the network. It is evident that such information needs to be conveyed to the
learner, through the topology diagram given. This was also the case with some of the staff
members involved in the study. At least two participants made notes on the provided
topology sheet, suggesting that it helped them understand the functionality of the network.
In relation to the user interface itself, one participant was confused about how to switch from
the design mode to the simulation mode by the two similar green-play buttons. Another
participant found it difficult to correspond the console windows to the devices in the
topology, suggesting a spatial awareness issue.
A participant commented that the Linux command line might be counterproductive for
students who have not used a Linux system before.
“Using a Linux interface would be counter-productive for beginning students as
most would have (only) dealt with a Windows environment. It would be OK for
networking students who know Linux.” (Teacher, Unique ID #2)
“The use of Linux on the PC (user) interfaces could throw a lot of beginning
students off (many find the easier Windows environment challenging enough at
the beginner’s level.)” (Teacher, Unique ID #2)
The participant is likely referring to the Ubuntu command line that is running on the server
nodes in the VIRL topology. Since Windows is a commercial product, there might be legal
constraints that prevents Cisco from distributing a Windows image with VIRL for use on the
workstations in the virtual topology. These comments could suggest a possible research gap
because those in the sample size were beyond the beginner’s level and, therefore, may not
find Linux interfaces confusing.
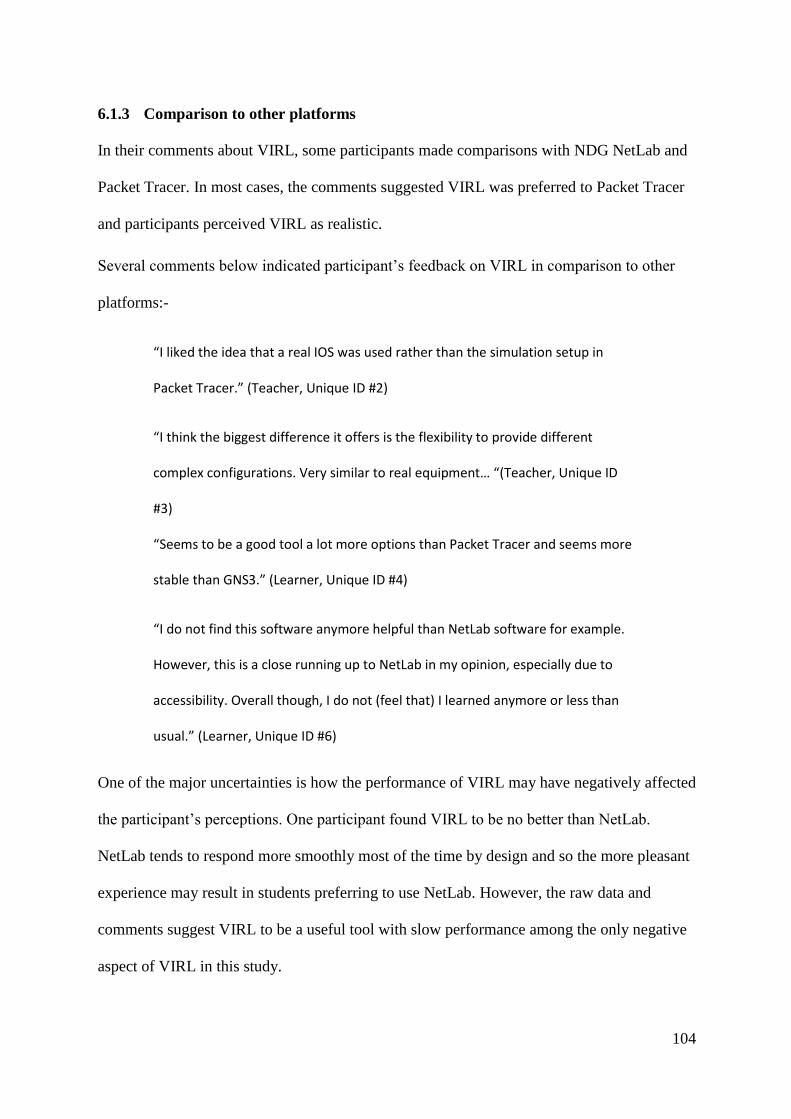
104
6.1.3 Comparison to other platforms
In their comments about VIRL, some participants made comparisons with NDG NetLab and
Packet Tracer. In most cases, the comments suggested VIRL was preferred to Packet Tracer
and participants perceived VIRL as realistic.
Several comments below indicated participant’s feedback on VIRL in comparison to other
platforms:-
“I liked the idea that a real IOS was used rather than the simulation setup in
Packet Tracer.” (Teacher, Unique ID #2)
“I think the biggest difference it offers is the flexibility to provide different
complex configurations. Very similar to real equipment… “(Teacher, Unique ID
#3)
“Seems to be a good tool a lot more options than Packet Tracer and seems more
stable than GNS3.” (Learner, Unique ID #4)
“I do not find this software anymore helpful than NetLab software for example.
However, this is a close running up to NetLab in my opinion, especially due to
accessibility. Overall though, I do not (feel that) I learned anymore or less than
usual.” (Learner, Unique ID #6)
One of the major uncertainties is how the performance of VIRL may have negatively affected
the participant’s perceptions. One participant found VIRL to be no better than NetLab.
NetLab tends to respond more smoothly most of the time by design and so the more pleasant
experience may result in students preferring to use NetLab. However, the raw data and
comments suggest VIRL to be a useful tool with slow performance among the only negative
aspect of VIRL in this study.

105
6.2 Influencing Factors and Other Considerations
This section outlines some key influencing factors and other considerations that need to be
taken into account. The limitations of the research will be presented in this section. First,
human factors could have influenced the outcome of the results, for instance, boredom,
perceived irrelevance, perceived obligation (i.e. I will write how good VIRL is because I do
not want to upset the researcher), excitement, newness of the tool, stress or fatigue. Second,
the experiment was limited in scope and application. It did not cover all the problems
associated with rolling VIRL out in an academic environment and it did not make use of all
the features. Third, the sample size was less than preferred, largely because of factors beyond
the control of the researcher and limited time.
This section discusses possible factors that may have lead to certain results that may not be
accurate due to errors or other factors such as participants performance being impacted by
emotional factors such stress, excitement, fatigue, boredom or lack of sleep.
6.2.1 Human Factors
One of the most notable influences in user studies are the human factors. Researchers try to
limit the human factors by implementing controls, however, it is not always possible to
completely eliminate all human factors. Standford University lists some of the kind of biases
that can occur during conducting of surveys [40]. One of the most important is the social
acceptability bias, which is, people do not tell you the facts, but what they think you want to
hear. In at least one instance, participants commented to know nothing about HSRP, but still
indicated that they were reasonably confident in it. It would seem that participants tend to
avoid claiming to be unconfident in a networking concept. In general, participants seemed to
overrate themselves during the pre-lab questionnaire (cf. Figure 25 Results - Confidence
Prior to the Lab Activity). It is also possible, but unknown, as to, whether or not, the
participants’ perceptions of VIRL are sound, because students may feel compelled to rate

106
VIRL as being good. This problem was partially controlled by separating the questionnaires
and suppressing the opinions and beliefs of the researcher. Participants did not see many of
the questions until after doing the activity, helping to avoid preconceived ideas being
developed. There is also a risk of interviewer bias, which can influence how the participants
answer questions. Since the researcher was not anonymous, there is a risk of interviewer bias.
Fortunately, many of the participants did not personally know the researcher, helping to
alleviate this problem.
One participant was observed missing out commands, frequently forgetting interface
shutdown commands and failing to comprehend basic instruction. In the pre-lab
questionnaire, the participant scored zero for out of a possible 30 for the knowledge
questions. During the experiment, the participant commented verbally that he had virtually
no sleep the night prior. Studies on the role of sleep in humans and sleep deprivation suggest
that cognitive performance, concentration and decision making are regulated by proper
sleeping routine [41] [42]. If this sleep routine is disrupted, usual body functions such as
thinking may not function properly. This means that the participants performance may not be
realistic and could have been negatively influenced by an improper sleeping pattern. This is a
factor that has to be considered in the analysis of the data because if any participant is tired,
they may not perform as they usually would, giving a false impression that they cannot or did
not learn.
6.2.2 Limited Scope
The study was limited in scope and application. One participant suggested that the
experiment lacked challenging opportunities to use VIRL’s more advanced features.
Participant was given seldom interaction with the user interface. This design step was done to
reduce confusion arising from using the complex UI, since the aim of the experiment was to
enhance and apply knowledge through configuration and troubleshooting.

107
Many other issues of using VIRL in academic environment were not tested in this study. For
instance, the managerial issues and deployment were not directly tested. The sample required
participants to already have a networking background. Therefore, this experiment did not aim
to test the learning effectiveness of someone without a networking background i.e. a beginner
even though this is a critical aspect of VIRL that would need to be considered. However, in
the view of the researcher based on the literature seems to suggest that Packet Tracer is
suitable for beginners to use and so, it may not be necessary for beginners to use VIRL. Also,
the aim of the experiment was to evaluate VIRL for teaching of advanced networking
concepts i.e. NAT, HSRP and STP. As such, beginners would not have enough background
knowledge to understand these concepts in sufficient detail due to previous underlying
knowledge not yet being learned.
The study was also limited to networking students and staff, most of which, had used real
equipment, often in conjunction with NetLab. Therefore, the study did not assess networking
students who use only Packet Tracer. As an implication, participants may have had sufficient
experience to troubleshoot successfully and easily pick up on using VIRL. Those who use
only Packet Tracer may find that VIRL does not help them as much due to lack of contextual
background.
The study also assessed only a limited subset of concepts and could not, due to limited
resources, test the entire CCNP curriculum. Consequently, there is a possibility that VIRL
may only be suitable for learning some advanced networking concepts. Other concepts not
tested in the study may not suitable to teach and learn using VIRL.
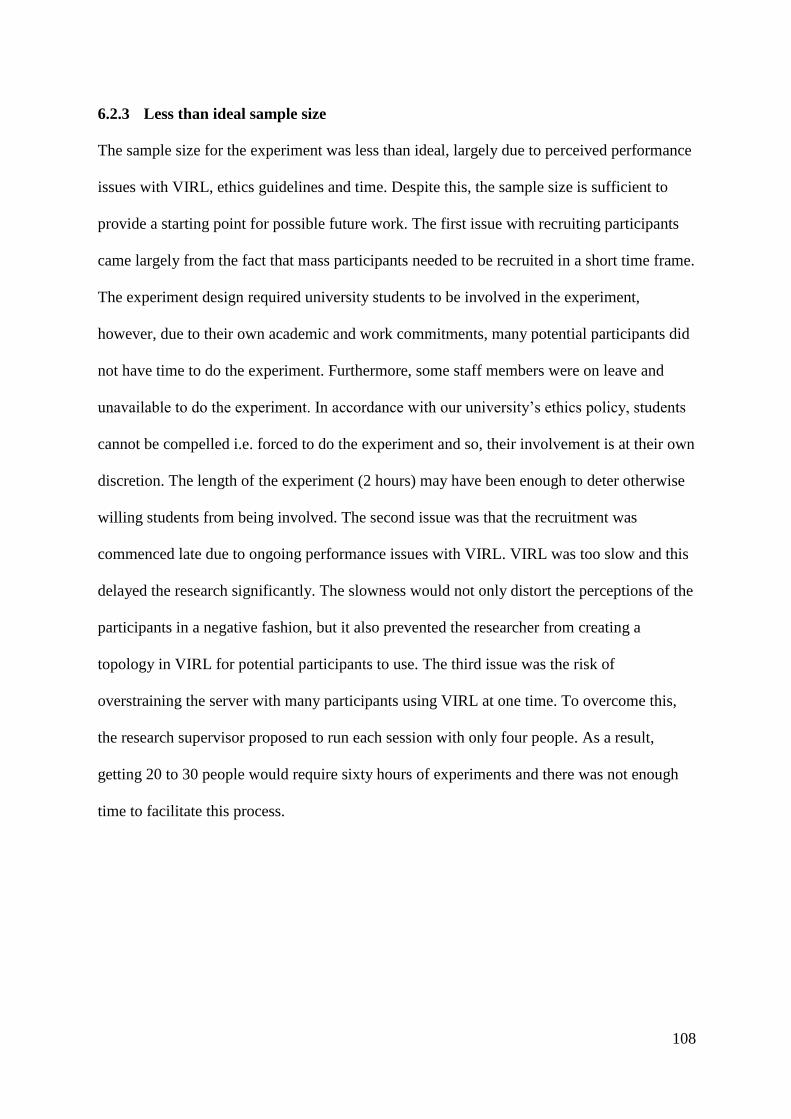
108
6.2.3 Less than ideal sample size
The sample size for the experiment was less than ideal, largely due to perceived performance
issues with VIRL, ethics guidelines and time. Despite this, the sample size is sufficient to
provide a starting point for possible future work. The first issue with recruiting participants
came largely from the fact that mass participants needed to be recruited in a short time frame.
The experiment design required university students to be involved in the experiment,
however, due to their own academic and work commitments, many potential participants did
not have time to do the experiment. Furthermore, some staff members were on leave and
unavailable to do the experiment. In accordance with our university’s ethics policy, students
cannot be compelled i.e. forced to do the experiment and so, their involvement is at their own
discretion. The length of the experiment (2 hours) may have been enough to deter otherwise
willing students from being involved. The second issue was that the recruitment was
commenced late due to ongoing performance issues with VIRL. VIRL was too slow and this
delayed the research significantly. The slowness would not only distort the perceptions of the
participants in a negative fashion, but it also prevented the researcher from creating a
topology in VIRL for potential participants to use. The third issue was the risk of
overstraining the server with many participants using VIRL at one time. To overcome this,
the research supervisor proposed to run each session with only four people. As a result,
getting 20 to 30 people would require sixty hours of experiments and there was not enough
time to facilitate this process.

109
6.2.4 Selection Bias
The fact that potential participants were recruited on a volunteer basis has the tendency to
create selection bias. This is because only motivated students would generally consent to the
experiment. As a result, the learning of less motivated students is not assessed. Students from
impoverished backgrounds or reading problems may not sign up due to perceived difficulties
with the sign up process. This results in their learning methodologies not being studied and
may distort the result. In general, the researcher is not free to pick participants of many
backgrounds because this form of recruitment is not allowed by policy.
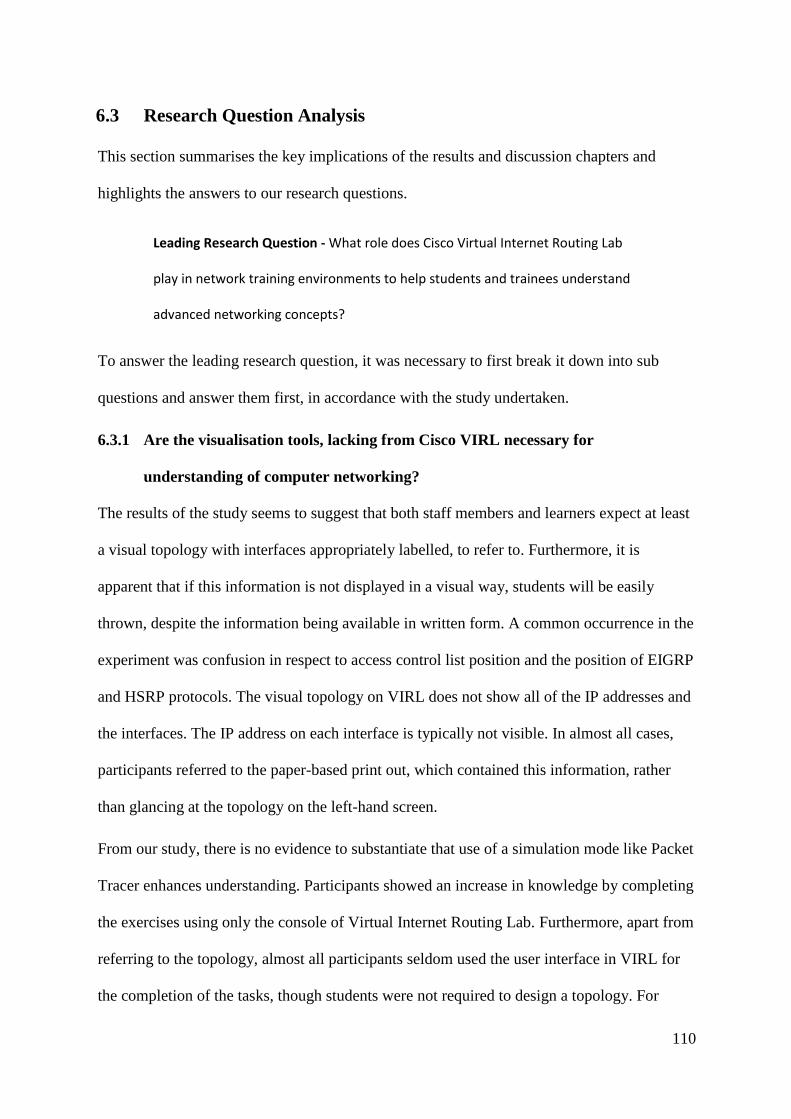
110
6.3 Research Question Analysis
This section summarises the key implications of the results and discussion chapters and
highlights the answers to our research questions.
Leading Research Question - What role does Cisco Virtual Internet Routing Lab
play in network training environments to help students and trainees understand
advanced networking concepts?
To answer the leading research question, it was necessary to first break it down into sub
questions and answer them first, in accordance with the study undertaken.
6.3.1 Are the visualisation tools, lacking from Cisco VIRL necessary for
understanding of computer networking?
The results of the study seems to suggest that both staff members and learners expect at least
a visual topology with interfaces appropriately labelled, to refer to. Furthermore, it is
apparent that if this information is not displayed in a visual way, students will be easily
thrown, despite the information being available in written form. A common occurrence in the
experiment was confusion in respect to access control list position and the position of EIGRP
and HSRP protocols. The visual topology on VIRL does not show all of the IP addresses and
the interfaces. The IP address on each interface is typically not visible. In almost all cases,
participants referred to the paper-based print out, which contained this information, rather
than glancing at the topology on the left-hand screen.
From our study, there is no evidence to substantiate that use of a simulation mode like Packet
Tracer enhances understanding. Participants showed an increase in knowledge by completing
the exercises using only the console of Virtual Internet Routing Lab. Furthermore, apart from
referring to the topology, almost all participants seldom used the user interface in VIRL for
the completion of the tasks, though students were not required to design a topology. For
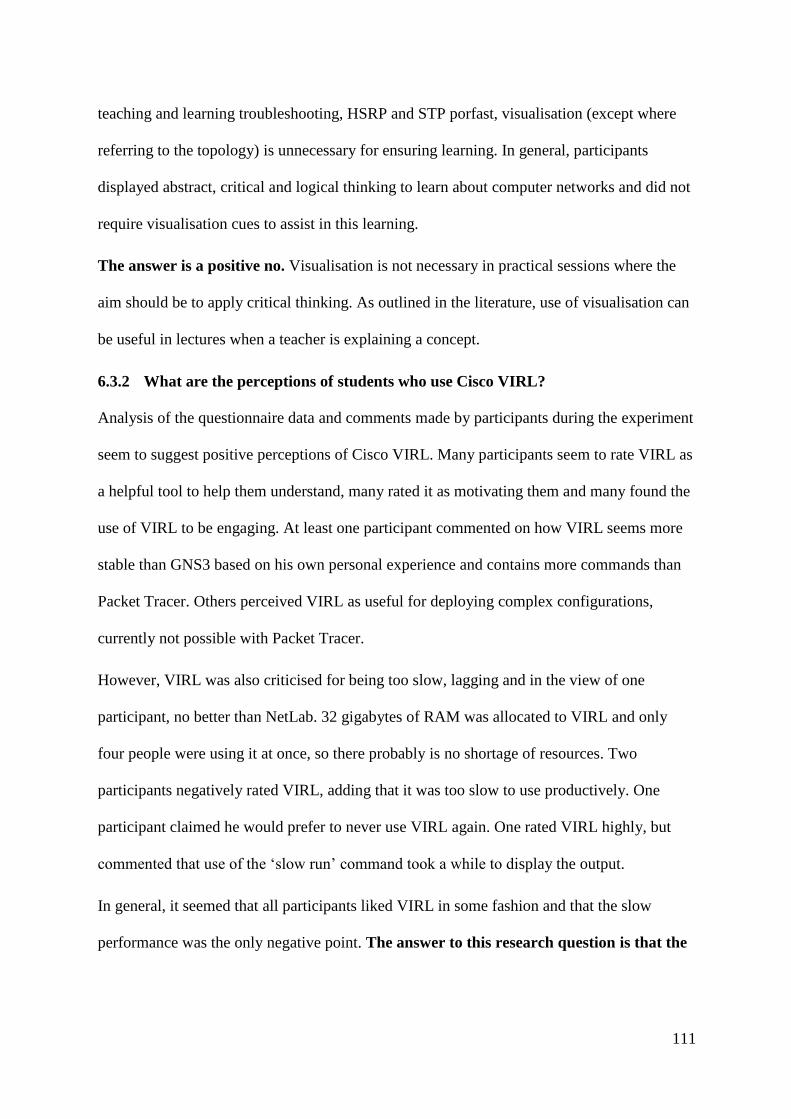
111
teaching and learning troubleshooting, HSRP and STP porfast, visualisation (except where
referring to the topology) is unnecessary for ensuring learning. In general, participants
displayed abstract, critical and logical thinking to learn about computer networks and did not
require visualisation cues to assist in this learning.
The answer is a positive no. Visualisation is not necessary in practical sessions where the
aim should be to apply critical thinking. As outlined in the literature, use of visualisation can
be useful in lectures when a teacher is explaining a concept.
6.3.2 What are the perceptions of students who use Cisco VIRL?
Analysis of the questionnaire data and comments made by participants during the experiment
seem to suggest positive perceptions of Cisco VIRL. Many participants seem to rate VIRL as
a helpful tool to help them understand, many rated it as motivating them and many found the
use of VIRL to be engaging. At least one participant commented on how VIRL seems more
stable than GNS3 based on his own personal experience and contains more commands than
Packet Tracer. Others perceived VIRL as useful for deploying complex configurations,
currently not possible with Packet Tracer.
However, VIRL was also criticised for being too slow, lagging and in the view of one
participant, no better than NetLab. 32 gigabytes of RAM was allocated to VIRL and only
four people were using it at once, so there probably is no shortage of resources. Two
participants negatively rated VIRL, adding that it was too slow to use productively. One
participant claimed he would prefer to never use VIRL again. One rated VIRL highly, but
commented that use of the ‘slow run’ command took a while to display the output.
In general, it seemed that all participants liked VIRL in some fashion and that the slow
performance was the only negative point. The answer to this research question is that the

112
perceptions are positive, but they may change abruptly, if performance degrades or the
console does not run smoothly.
6.3.4 Does the additional features in Cisco VIRL help with understanding?
Many participants quickly identified related NAT or ACL problems when advanced
debugging commands were used. In the post lab questionnaire, participants who had no idea
about STP port fast or HSRP in the pre-lab questionnaire, were able to satisfactorily explain
these concepts. Participants were asked to explain what they had configured and in many
cases, were able to do this by looking at the output of the debugging commands. However,
the realistic command line of the Linux PCs in the topology arguably confused some
participants, with one participant noting that Linux may confuse beginners. Many of the
design features in VIRL were not tested in this experiment, though it is clear from the
comments of participants and their level of knowledge in the post lab questionnaire in HSRP
and STP port fast, that VIRL by use of the debugging commands resulted in increased
understanding. The answer to this research question is a positive yes. The additional
features of VIRL helped with understanding.
113
6.3.5 Leading Research Question
Our leading research question reads, “What role does Cisco Virtual Internet Routing Lab
play in network training environments to help students and trainees understand advanced
networking concepts?”
According to our research, Virtual Internet Routing Lab plays a major role in advanced
networking courses where complex configurations, redundancy and troubleshooting are
the main focus. This is because VIRL, by design, provides a strong sense of realism and
engagement. Larger topologies can be designed than on physical equipment and students are
able to understand the network by referring to a detailed visual topology.
VIRL is not the ideal solution for demonstrating network concepts, where visualisation needs
to be used. Access Control lists and network address translation are complex concepts that,
according to our study, are only scarcely improved by Virtual Internet Routing Lab. The
studies showed that, despite the use of VIRL, spatial understanding of the network was a
major challenge and that using physical equipment might be necessary to develop this skill.

114
6.4 Key Findings
From this study, we deduce the following outcomes:-
1) VIRL facilitates troubleshooting, HSRP and STP education: VIRL is an ideal
platform for teaching and learning the Hot Standby Routing Protocol, Spanning-Tree
Protocol and for troubleshooting. In general, participants showed better understanding in
these areas after using Virtual Internet Routing Lab and many participants were able to
explain these concepts by referring to the debugging output of various debugging
commands.
2) Visual Topology is essential: A key finding is that the visual topology is an essential
aspect to ensure sound learning. Even when information is available in text form, if it is
not made clear on the topology, participants tend to more easily get confused.
Participants tend to refer to a detailed topology and make notes, rather than a less detailed
topology. Participants in the survey also indicated the importance of a visual topology in
learning
3) Participants suboptimal spatial awareness of the network: The spatial awareness of
participants and their understanding of where select protocols such as EIGRP and HSRP
operate seem to be less than ideal. Confusion in respect to where protocols operated
complicated the troubleshooting process and lead to widespread confusion. Participants
seemed to have had trouble visualising the layout of the network and failed to properly
understand ACL directions.
4) VIRL not ideal for NAT or ACL education: The study showed a scarce increase in
network address translation (NAT), despite it being the main focus of the troubleshooting
component. Participants generally did not increase their understanding of NAT, despite
the theoretical material provided and many had difficulty troubleshooting NAT problems.
Likewise, ACLs were also hard to be understood, despite material provided on this
115
concept. Most participants had trouble understanding the direction, the device and the
interface on which the ACL was placed. Even staff members chose to remove the ACL
completely to ratify the problem instead of modifying the appropriate syntax. In one
instance, the debugging commands showed the problem but were not acted upon.
Therefore, despite use of the debugging commands, VIRL may not be the ideal platform
for NAT and ACL education.
5) Performance of VIRL may degrade unexpectedly: The performance of Virtual Internet
Routing Lab has the potential to suddenly degrade unexpectedly, often without warning.
This is not necessarily a resource allocation issue, but may occur due to a bug in VIRL.
Positive perceptions of VIRL will quickly change, if students are unable to use the
software smoothly and may find the sluggish performance, to be distracting from
learning.
6) VIRL perceived as a good tool: Aside from the criticisms with slow performance,
participants generally perceived VIRL as a good tool, often comparing it to Packet
Tracer. VIRL was perceived as better than Packet Tracer, because of increased realism
and additional commands, which participants felt, were missing from Packet Tracer.

116
7. Conclusion
Virtual Internet Routing Lab is a useful platform, especially for troubleshooting and
illustrating concepts such as STP porfast and HSRP using the debugging commands. Use of
the debugging commands has a positive impact on network education and should be used
more often. It is essential that a visual topology with detailed information be provided to
students. Otherwise, they will likely get confused. Spatial awareness of the topology
remained a major concern, despite the use of VIRL. Both learners and staff had issues with
visualising the network in their brain, misunderstanding where routing protocols and HSRP
was operating. Problems like NAT and ACLs are complex concepts and our research
suggests that VIRL alone provides only little improvement in these areas, suggesting that it
may not be the best tool for learning these concepts. Overall, participants rated VIRL highly
and perceived that it improved their learning and helped them understand. However, our
research found that performance of VIRL may degrade suddenly and without warning,
resulting in mass confusion and distraction from learning. If the performance is too slow,
students’ perceptions of VIRL will abruptly change and they will prefer to not use it. When
performance degrades, the user may not be aware of this fact. Therefore, development of
VIRL is recommended to alleviate the slow performance and lack of warnings when system
resources are running low.
The implications of VIRL on beginners was not tested in this research and remains a point of
future work. There is also research gaps in how VIRL impacts students who have never used
physical equipment. The impact of suboptimal spatial awareness also needs further work. It
is apparent that VIRL and a visual topology alone are not enough to provide satisfactory
spatial awareness. Furthermore, the managerial issues need to be researched and a project
established to roll VIRL out into a classroom and provide remote access to external students.
These issues were not explored in our research.
117
As newer versions of VIRL are released, new features may be released which could enhance
or diminish learning. Additional research may be required to evaluate any new features of
Virtual Internet Routing Lab not covered in this thesis.
The research was limited in many ways. First, the sample size was smaller than preferred due
to a number of reasons, including; limited resources, time and other commitments by
potential participants. Second, the research only evaluated the configuration aspect of VIRL
of a narrow subset of concepts i.e. HSRP, NAT and STP port fast. Third, managerial issues
were not considered in this experiment.
This research could have been improved by providing the resources to achieve a higher
sample size and to further screen participants to avoid selection bias. Overall, however, this
research provides a starting point of investigating new virtualisation platforms in network
education and this provides the groundwork for further research.
118
References
[1] T. McGill and M. Dixon, "Information technology certification: A student
perspective," Proceedings of International Resource Management Association, pp.
302-306, 2004.
[2] D. Rajendran, "Does embedding an ICT certification help align tertiary programs with
industry?: A study of CCNA workplace perceptions," Journal of Applied Computing
and Information Technology, vol. 15, 2011.
[3] W. Makasiranondh, S. P. Maj, and D. Veal, "Pedagogical evaluation of simulation
tools usage in network technology education," Engineering and Technology, vol. 8,
pp. 321-326, 2010.
[4] D. C. Frezzo, J. T. Behrens, and R. J. Mislevy, "Activity Theory and Assessment
Theory in the Design and Understanding of the Packet Tracer Ecosystem,"
International Journal of Learning and Media, vol. 1, 2009/05/01 2009.
[5] D. Frezzo, J. Behrens, and R. Mislevy, "Design Patterns for Learning and
Assessment: Facilitating the Introduction of a Complex Simulation-Based Learning
Environment into a Community of Instructors," Journal of Science Education and
Technology, vol. 19, pp. 105-114, 2010.
[6] P. Kirschner and W. Huisman, "‘Dry laboratories’ in science education;
computer‐based practical work," International Journal of Science Education, vol.
20, pp. 665-682, 1998/07/01 1998.
[7] J. Holvikivi, "From theory to practice: adapting the engineering approach," in The
International Conference on Engineering Education 2012, 2012, p. 78.
[8] P. Gil, G. J. Garcia, A. Delgado, R. M. Medina, A. Calderon, and P. Marti, "Computer
networks virtualization with GNS3: Evaluating a solution to optimize resources and
achieve a distance learning," in Frontiers in Education Conference (FIE), 2014 IEEE,
2014, pp. 1-4.
[9] C. Li, J. Pickard, P. Li, T. Mohammed, B. Yang, and K. Augustus, "A practical study
on networking equipment emulation," Journal of Computing Sciences in Colleges,
vol. 24, pp. 137-143, 2008.
[10] J. Janitor, F. Jakab, and K. Kniewald, "Visual Learning Tools for Teaching/Learning
Computer Networks: Cisco Networking Academy and Packet Tracer," 2010.

119
[11] S. Liangxu, W. liansheng, Z. Yujun, and Y. Hang, "Comparison between physical
devices and simulator software for Cisco network technology teaching," in Computer
Science & Education (ICCSE), 2013 8th International Conference on, 2013, pp.
1357-1360.
[12] M. S. Elias and A. Z. M. Ali, "Survey on the Challenges Faced by the Lecturers in
Using Packet Tracer Simulation in Computer Networking Course," Procedia - Social
and Behavioral Sciences, vol. 131, pp. 11-15, 2014.
[13] C. Goldstein, S. Leisten, K. Stark, and A. Tickle, "Using a network simulation tool to
engage students in active learning enhances their understanding of complex data
communications concepts," presented at the Proceedings of the 7th Australasian
conference on Computing education - Volume 42, Newcastle, New South Wales,
Australia, 2005.
[14] R. I. Dinita, G. Wilson, A. Winckles, M. Cirstea, and A. Jones, "A cloud-based virtual
computing laboratory for teaching computer networks," in Optimization of Electrical
and Electronic Equipment (OPTIM), 2012 13th International Conference on, 2012,
pp. 1314-1318.
[15] D. A. Kolb, Experiential learning : experience as the source of learning and
development. Englewood Cliffs, N.J.: P T R Prentice-Hall, 1984.
[16] H. Armstrong and I. Murray, "Remote and local delivery of cisco education for the
vision-impaired," presented at the Proceedings of the 12th annual SIGCSE conference
on Innovation and technology in computer science education, Dundee, Scotland,
2007.
[17] R. M. Felder, "Matters of style," ASEE prism, vol. 6, pp. 18-23, 1996.
[18] P. Li, "Exploring virtual environments in a decentralized lab," SIGITERes. IT, vol. 6,
pp. 4-10, 2009.
[19] Cisco. (2015). Get VIRL. Available:
http://web.archive.org/web/20150419155924/http://virl.cisco.com/about-virl-2/
[20] S. R. Javid, "Role of Packet Tracer in learning Computer Networks," International
Journal of Advanced Research in Computer and Communication Engineering, vol. 3,
5 May 2014 2014.
120
[21] D. C. Sicker, T. Lookabaugh, J. Santos, and F. Barnes, "Assessing the Effectiveness
of Remote Networking Laboratories," in Frontiers in Education, 2005. FIE '05.
Proceedings 35th Annual Conference, 2005, pp. S3F-S3F.
[22] D. Dobrilovic, V. Jevtic, and B. Odadzic, "Virtualization Technology in Higher
Education IT Courses," Correction of the Journal ITRO 2011, p. 66, 2012.
[23] Q. Ou Zhi and Y. Zhou, "Research on application of virtualization in network
technology course," in Computer Science & Education (ICCSE), 2012 7th
International Conference on, 2012, pp. 357-359.
[24] W. Wolny and M. Szołtysik, "Overview of Existing Computer Network Environments
Virtualization for Computer Network Learning," Studia Ekonomiczne/Uniwersytet
Ekonomiczny w Katowicach, pp. 250-264, 2014.
[25] D. Yuan and B. Cross, "Evaluating and using cloud computing for online hands-on
learning," J. Comput. Sci. Coll., vol. 29, pp. 191-198, 2014.
[26] C. R. M.R, N. M. Chacko, J. Major, and S. D, "A Comprehensive Overview on
Different Network Simulators," International Journal of Engineering and
Technology, Vol 5, Iss 1, Pp 325-332 (2013), 2013.
[27] U. o. S. Australia, "Graduate qualities," University of South Australia Website, n.d.
[28] J. V. Nickerson, J. E. Corter, S. K. Esche, and C. Chassapis, "A model for evaluating
the effectiveness of remote engineering laboratories and simulations in education,"
Computers & Education, vol. 49, pp. 708-725, 11// 2007.
[29] T. Coffman, "Using Simulations to Enhance Teaching and Learning: Encouraging the
Creative Process," The VSTE Journal, vol. 21, pp. 1-7, 2006.
[30] A. M. Sllame and M. Jafaray, "Using Simulation and Modeling Tools in Teaching
Computer Network Courses," in IT Convergence and Security (ICITCS), 2013
International Conference on, 2013, pp. 1-4.
[31] K. Wan Mohd Ghazali and R. Hassan, "Simulation tool for active learning of
introductory computer network subjects," 2011.
[32] Cisco. SOFTWARE LICENSE AGREEMENT. Available:
http://www.cisco.com/public/sw-license-agreement.html
121
[33] Cisco. (2015). VIRL Learning Lab Tutorial. Available: http://virl-dev-
innovate.cisco.com/tutorial.php
[34] "Core Documentation," vol. Release 4.8, pp. 1-43, 5 June 2015 2015.
[35] J. Ahrenholz, "Comparison of CORE network emulation platforms," in Proceedings
of IEEE MILCOM Conference, 2010, pp. 864-869.
[36] A. Smith and C. Bluck, "Multiuser Collaborative Practical Learning Using Packet
Tracer," in Networking and Services (ICNS), 2010 Sixth International Conference on,
2010, pp. 356-362.
[37] J. Obstfeld, R. Schmieder, B. Daugherty, P. Jhingran, and S. Mital, "VIRL Personal
Edition March 2015 Webinar," Cisco Systems Inc., 2015.
[38] Cisco. (2015). Cisco Packet Tracer Data Sheet. Available:
https://www.cisco.com/web/learning/netacad/course_catalog/docs/Cisco_PacketTrace
r_DS.pdf
[39] Cisco. (2015). Welcome to VIRL. Available: http://virl-dev-innovate.cisco.com/
[40] M. J. Rosenfeld, "Notes on terminology for evaluation of research," 2009.
[41] P. Alhola and P. Polo-Kantola, "Sleep deprivation: Impact on cognitive performance,"
Neuropsychiatric disease and treatment, vol. 3, p. 553, 2007.
[42] L. C. Lack and H. R. Wright, "Chronobiology of sleep in humans," Cellular and
Molecular Life Sciences, vol. 64, pp. 1205-1215, 2007/05/01 2007.
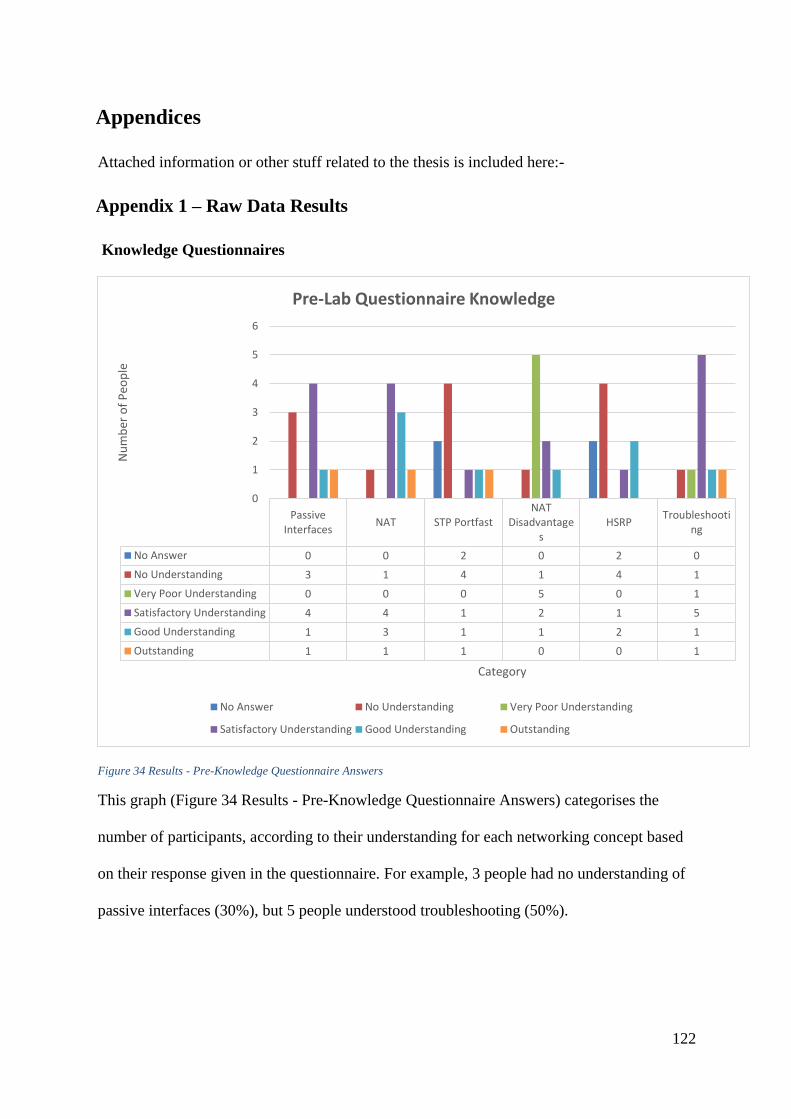
122
Appendices
Attached information or other stuff related to the thesis is included here:-
Appendix 1 – Raw Data Results
Knowledge Questionnaires
Figure 34 Results - Pre-Knowledge Questionnaire Answers
This graph (Figure 34 Results - Pre-Knowledge Questionnaire Answers) categorises the
number of participants, according to their understanding for each networking concept based
on their response given in the questionnaire. For example, 3 people had no understanding of
passive interfaces (30%), but 5 people understood troubleshooting (50%).
PassiveInterfaces
NAT STP PortfastNAT
Disadvantages
HSRPTroubleshooti
ng
No Answer 0 0 2 0 2 0
No Understanding 3 1 4 1 4 1
Very Poor Understanding 0 0 0 5 0 1
Satisfactory Understanding 4 4 1 2 1 5
Good Understanding 1 3 1 1 2 1
Outstanding 1 1 1 0 0 1
0
1
2
3
4
5
6
Nu
mb
er o
f P
eop
le
Category
Pre-Lab Questionnaire Knowledge
No Answer No Understanding Very Poor Understanding
Satisfactory Understanding Good Understanding Outstanding

123
The graph below is a visualisation of the raw data of the answers given for the post lab
questionnaire.
Figure 35 Results - Post Knowledge Questionnaire Answers
This graph (Figure 35 Results - Post Knowledge Questionnaire Answers) categorises the
number of participants, according to their understanding for each networking concept based
on their response given in the questionnaire. For example, only 1 person had no
understanding of passive interfaces (10%), but 4 people had satisfactory understanding of
HSRP (40%).
PassiveInterfaces
NAT STP PortfastNAT
DisadvantagesHSRP
Troubleshooting
No Answer 0 0 2 0 0 0
No Understanding 1 1 1 1 1 0
Very Poor Understanding 1 0 1 4 2 1
Satisfactory Understanding 4 4 1 3 4 5
Good Understanding 2 3 1 1 2 1
Outstanding 1 1 3 0 0 2
0
1
2
3
4
5
6
Nu
mb
er o
f P
eop
le
Category
Post-Lab Questionnaire Knowledge
No Answer No Understanding Very Poor Understanding
Satisfactory Understanding Good Understanding Outstanding
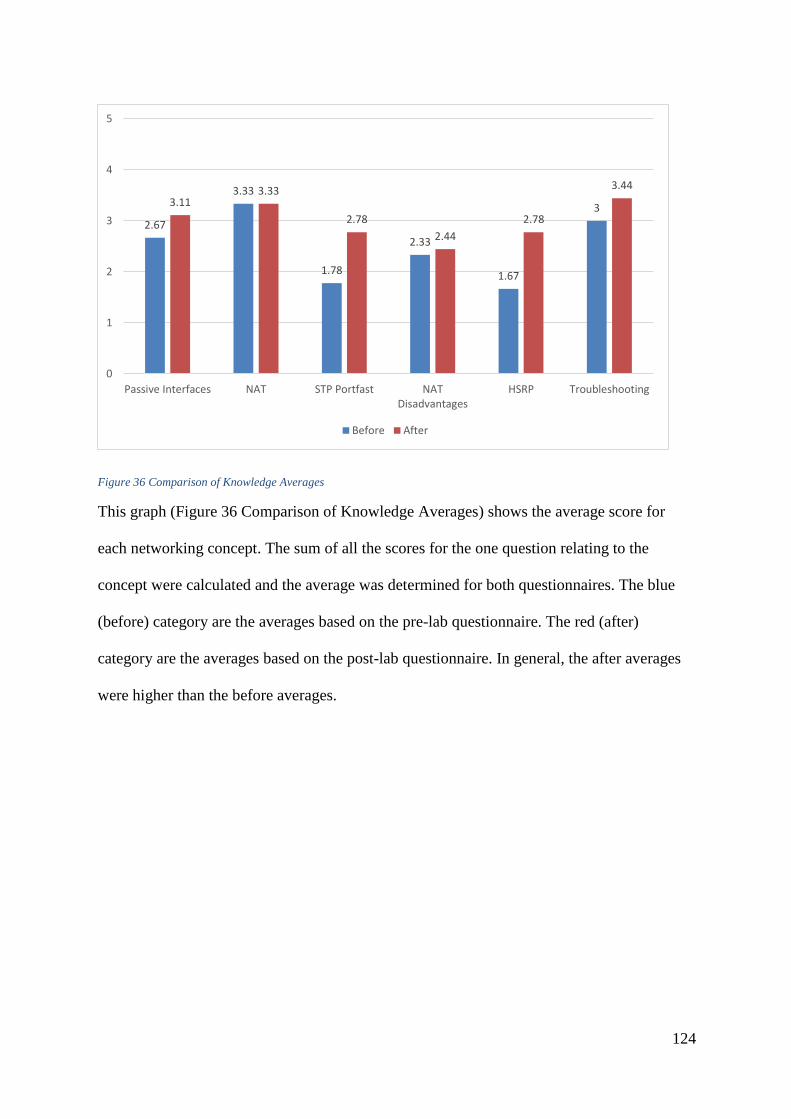
124
Figure 36 Comparison of Knowledge Averages
This graph (Figure 36 Comparison of Knowledge Averages) shows the average score for
each networking concept. The sum of all the scores for the one question relating to the
concept were calculated and the average was determined for both questionnaires. The blue
(before) category are the averages based on the pre-lab questionnaire. The red (after)
category are the averages based on the post-lab questionnaire. In general, the after averages
were higher than the before averages.
2.67
3.33
1.78
2.33
1.67
33.113.33
2.78
2.44
2.78
3.44
0
1
2
3
4
5
Passive Interfaces NAT STP Portfast NATDisadvantages
HSRP Troubleshooting
Before After
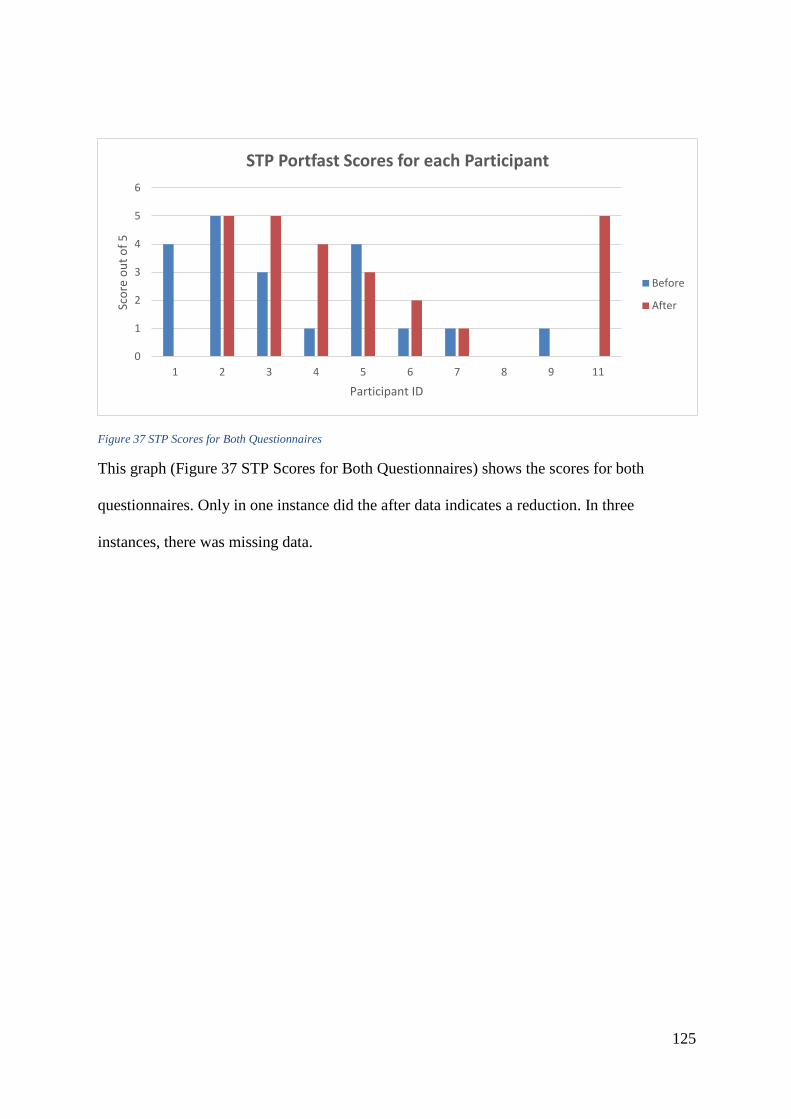
125
Figure 37 STP Scores for Both Questionnaires
This graph (Figure 37 STP Scores for Both Questionnaires) shows the scores for both
questionnaires. Only in one instance did the after data indicates a reduction. In three
instances, there was missing data.
0
1
2
3
4
5
6
1 2 3 4 5 6 7 8 9 11
Sco
re o
ut
of
5
Participant ID
STP Portfast Scores for each Participant
Before
After
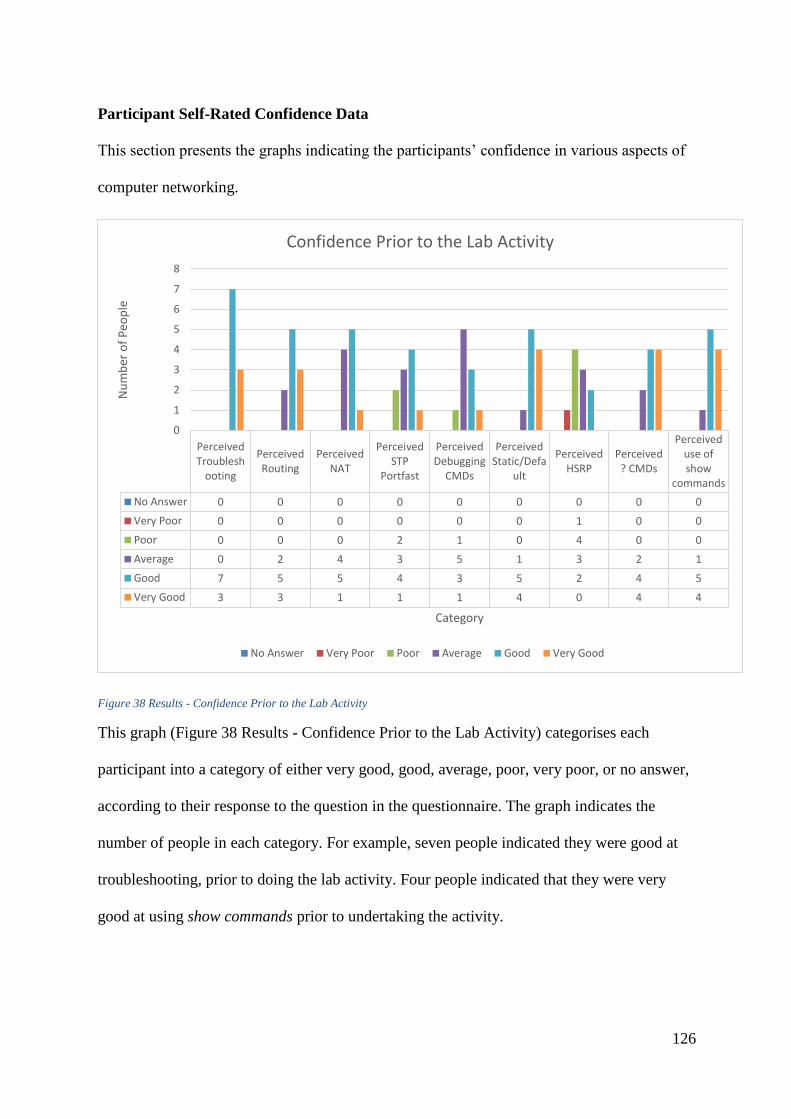
126
Participant Self-Rated Confidence Data
This section presents the graphs indicating the participants’ confidence in various aspects of
computer networking.
Figure 38 Results - Confidence Prior to the Lab Activity
This graph (Figure 38 Results - Confidence Prior to the Lab Activity) categorises each
participant into a category of either very good, good, average, poor, very poor, or no answer,
according to their response to the question in the questionnaire. The graph indicates the
number of people in each category. For example, seven people indicated they were good at
troubleshooting, prior to doing the lab activity. Four people indicated that they were very
good at using show commands prior to undertaking the activity.
PerceivedTroublesh
ooting
PerceivedRouting
PerceivedNAT
PerceivedSTP
Portfast
PerceivedDebugging
CMDs
PerceivedStatic/Defa
ult
PerceivedHSRP
Perceived? CMDs
Perceiveduse ofshow
commands
No Answer 0 0 0 0 0 0 0 0 0
Very Poor 0 0 0 0 0 0 1 0 0
Poor 0 0 0 2 1 0 4 0 0
Average 0 2 4 3 5 1 3 2 1
Good 7 5 5 4 3 5 2 4 5
Very Good 3 3 1 1 1 4 0 4 4
0
1
2
3
4
5
6
7
8
Nu
mb
er o
f P
eop
le
Category
Confidence Prior to the Lab Activity
No Answer Very Poor Poor Average Good Very Good

127
Figure 39 Results - Confidence After the Lab Activity
This graph (Figure 39 Results - Confidence After the Lab Activity) is identical to Figure 38
Results - Confidence Prior to the Lab Activity, except that it is data derived from the
questionnaire given after the lab. According to the data, eight people rated themselves as
‘good’ at troubleshooting.
PerceivedTroublesh
ooting
PerceivedRouting
PerceivedNAT
PerceivedSTP
Portfast
PerceivedDebugging
CMDs
PerceivedStatic/Defa
ult
PerceivedHSRP
Perceived? CMDs
Perceiveduse ofshow
commands
No Answer 0 0 0 0 0 0 0 0 0
Very Poor 0 0 0 0 0 0 0 0 0
Poor 1 1 1 1 0 0 1 0 0
Average 1 0 3 4 6 2 7 1 3
Good 8 6 6 5 4 5 1 5 3
Very Good 0 3 0 0 0 3 1 4 4
0
1
2
3
4
5
6
7
8
9
Nu
mb
er o
f P
eop
le
Category
Confidence After the Lab Activity
No Answer Very Poor Poor Average Good Very Good
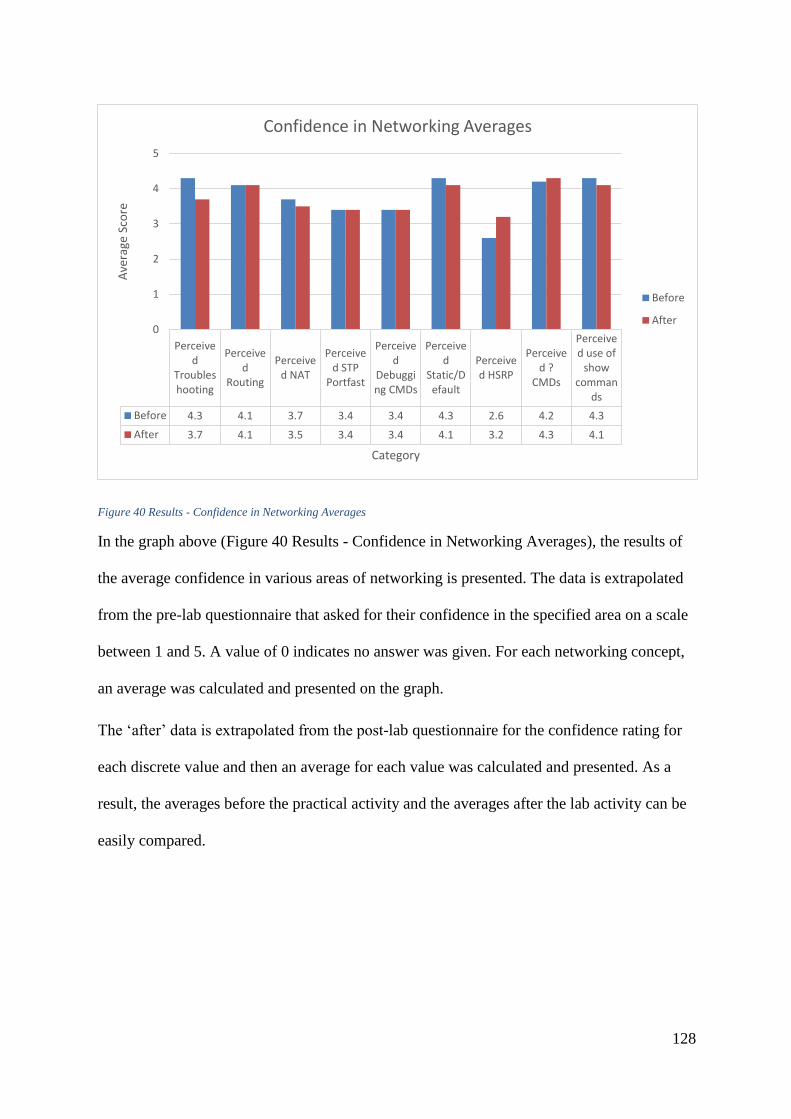
128
Figure 40 Results - Confidence in Networking Averages
In the graph above (Figure 40 Results - Confidence in Networking Averages), the results of
the average confidence in various areas of networking is presented. The data is extrapolated
from the pre-lab questionnaire that asked for their confidence in the specified area on a scale
between 1 and 5. A value of 0 indicates no answer was given. For each networking concept,
an average was calculated and presented on the graph.
The ‘after’ data is extrapolated from the post-lab questionnaire for the confidence rating for
each discrete value and then an average for each value was calculated and presented. As a
result, the averages before the practical activity and the averages after the lab activity can be
easily compared.
Perceived
Troubleshooting
Perceived
Routing
Perceived NAT
Perceived STP
Portfast
Perceived
Debugging CMDs
Perceived
Static/Default
Perceived HSRP
Perceived ?
CMDs
Perceived use of
showcomman
ds
Before 4.3 4.1 3.7 3.4 3.4 4.3 2.6 4.2 4.3
After 3.7 4.1 3.5 3.4 3.4 4.1 3.2 4.3 4.1
0
1
2
3
4
5
Ave
rage
Sco
re
Category
Confidence in Networking Averages
Before
After

129
Figure 41 The Average Confidence For Each Participant
The figure (Figure 41 The Average Confidence For Each Participant) depicts the average
confidence level for each participant, both before and after the lab. The participant’s
confidence level for each network concept was averaged out and plotted on this graph. On
average, no participant improved their confidence after doing the lab.
0.00
1.00
2.00
3.00
4.00
5.00
6.00
1 2 3 4 5 6 7 8 9 11
Average Confidence By Participant
Confidence Average Before Confidence Average After
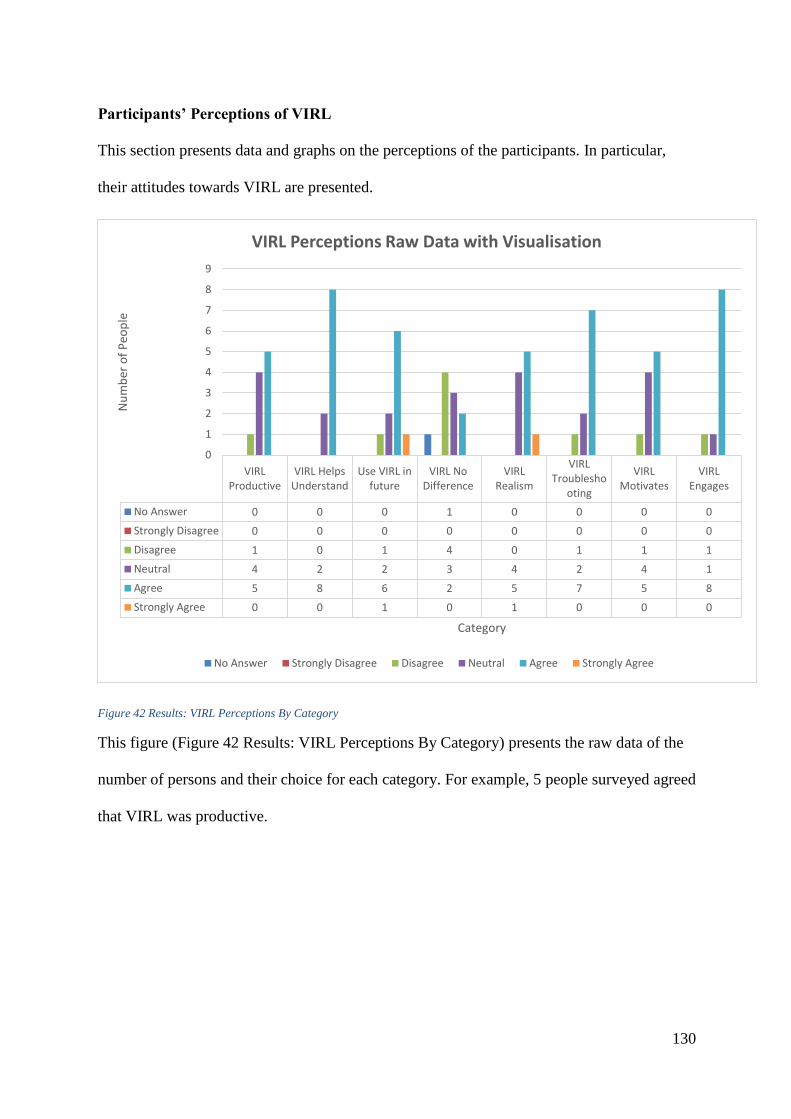
130
Participants’ Perceptions of VIRL
This section presents data and graphs on the perceptions of the participants. In particular,
their attitudes towards VIRL are presented.
Figure 42 Results: VIRL Perceptions By Category
This figure (Figure 42 Results: VIRL Perceptions By Category) presents the raw data of the
number of persons and their choice for each category. For example, 5 people surveyed agreed
that VIRL was productive.
VIRLProductive
VIRL HelpsUnderstand
Use VIRL infuture
VIRL NoDifference
VIRLRealism
VIRLTroublesho
oting
VIRLMotivates
VIRLEngages
No Answer 0 0 0 1 0 0 0 0
Strongly Disagree 0 0 0 0 0 0 0 0
Disagree 1 0 1 4 0 1 1 1
Neutral 4 2 2 3 4 2 4 1
Agree 5 8 6 2 5 7 5 8
Strongly Agree 0 0 1 0 1 0 0 0
0
1
2
3
4
5
6
7
8
9
Nu
mb
er o
f P
eop
le
Category
VIRL Perceptions Raw Data with Visualisation
No Answer Strongly Disagree Disagree Neutral Agree Strongly Agree

131
Figure 43 Results - Average Perceptions Data
This graph (Figure 43 Results - Average Perceptions Data) shows the averages calculated
from the perceptions obtained from participants during the post-lab phase. For each
perception, such as does VIRL motivate (VIRL motivates), an average score was calculated.
The average for VIRL engages is 3.7. A value of less than 3.5 would indicate a neutral
response and a value less than 3 would be disagree.
0
1
2
3
4
5
Rat
ed S
core
d o
ut
of
5
Discrete Network Concept
Perceptions Averages for each networking concept
Global Average

132
Participant’s Self-Rated Learning Patterns
The data drawn from the pre-lab questionnaire asked participants various questions in respect
to how often they use or do something. For example, how often do you use debugging
commands. This data is presented in this section.
Figure 44 Results: Learning Patterns
The data presented in this figure (Figure 44 Results: Learning Patterns) shows how often the
participants tend to use the debugging commands. Six out of ten people claimed they only
sometimes use debugging commands. Three out of nine people claimed to rarely use the
debugging commands.
Often Debug
No Answer 0
Never 1
Rarely 3
Sometimes 6
Often 0
Always 0
0
1
2
3
4
5
6
7
Nu
mb
er o
f P
eop
le
Category
Learning Patterns Raw Data with Visualisation
No Answer Never Rarely Sometimes Often Always

133
Figure 45 Self-Rated Learning Patterns of Participants
The figure (Figure 45 Self-Rated Learning Patterns of Participants) shows the level of
agreeability with a particular question. A value of 5 is completely agree and a value of 1 is
completely disagree. A value of 0 indicates no answer. For example, three out of ten people
agreed that agreed that designing the topology helped them learn, however, two out of ten
people strongly agreed. In combination, five of ten people agreed. The remaining 50% were
neutral.
Design Topology Experimenting
No Answer 0 0
Strongly Disagree 0 0
Disagree 0 0
Neutral 5 0
Agree 3 4
Strongly Agree 2 6
0
1
2
3
4
5
6
7
Nu
mb
er o
f P
eop
le
Category
Learning Patterns Raw Data with Visualisation
No Answer Strongly Disagree Disagree Neutral Agree Strongly Agree
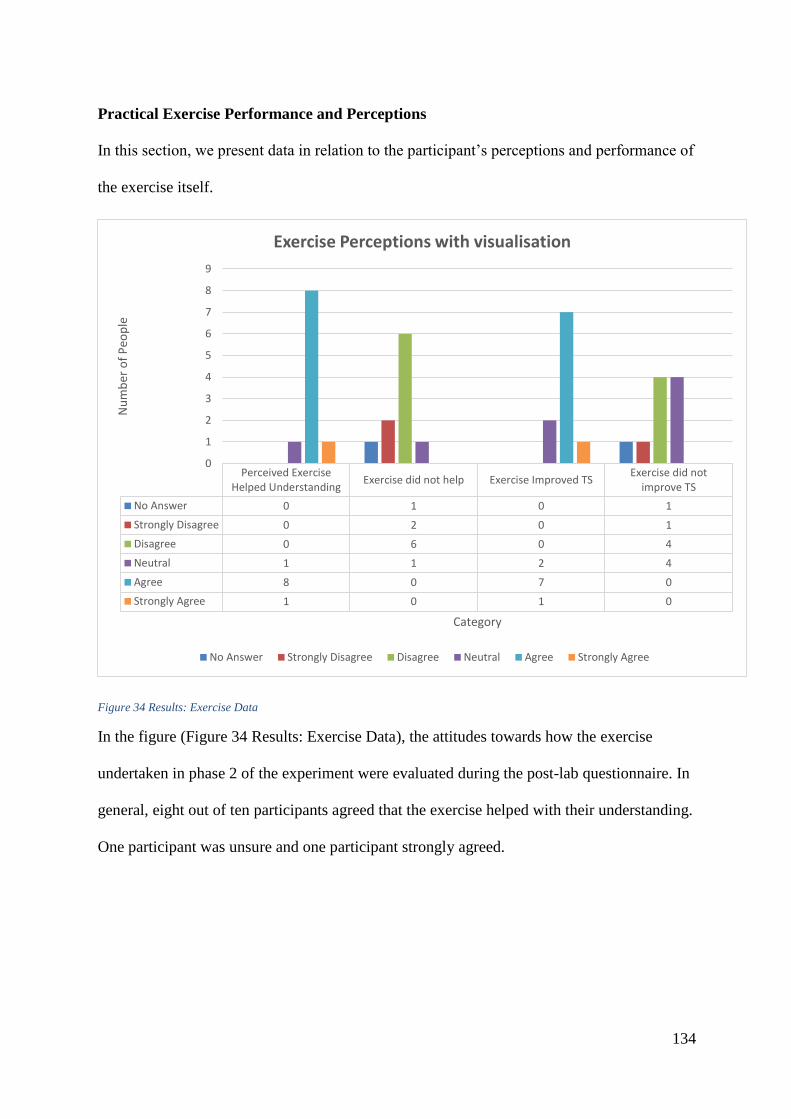
134
Practical Exercise Performance and Perceptions
In this section, we present data in relation to the participant’s perceptions and performance of
the exercise itself.
Figure 34 Results: Exercise Data
In the figure (Figure 34 Results: Exercise Data), the attitudes towards how the exercise
undertaken in phase 2 of the experiment were evaluated during the post-lab questionnaire. In
general, eight out of ten participants agreed that the exercise helped with their understanding.
One participant was unsure and one participant strongly agreed.
Perceived ExerciseHelped Understanding
Exercise did not help Exercise Improved TSExercise did not
improve TS
No Answer 0 1 0 1
Strongly Disagree 0 2 0 1
Disagree 0 6 0 4
Neutral 1 1 2 4
Agree 8 0 7 0
Strongly Agree 1 0 1 0
0
1
2
3
4
5
6
7
8
9
Nu
mb
er o
f P
eop
le
Category
Exercise Perceptions with visualisation
No Answer Strongly Disagree Disagree Neutral Agree Strongly Agree

135
Figure 47 Results: Practical Exercise Completion Percentages
The figure (Figure 47 Results: Practical Exercise Completion Percentages) shows the
percentages of the total number of participants that successfully completed the lab exercises
and troubleshooted all the problems within the time allocated. In one case (10%), the lab
could not be completed due to technical issues with VIRL. 40% of all participants did not
successfully complete the lab, some of which were staff members who teach networking.
50% on the other hand successfully completed the lab.
Total Completed50%Total Incomplete
40%
Total Failures10%
% Number of Lab Completion
Total Completed Total Incomplete Total Failures
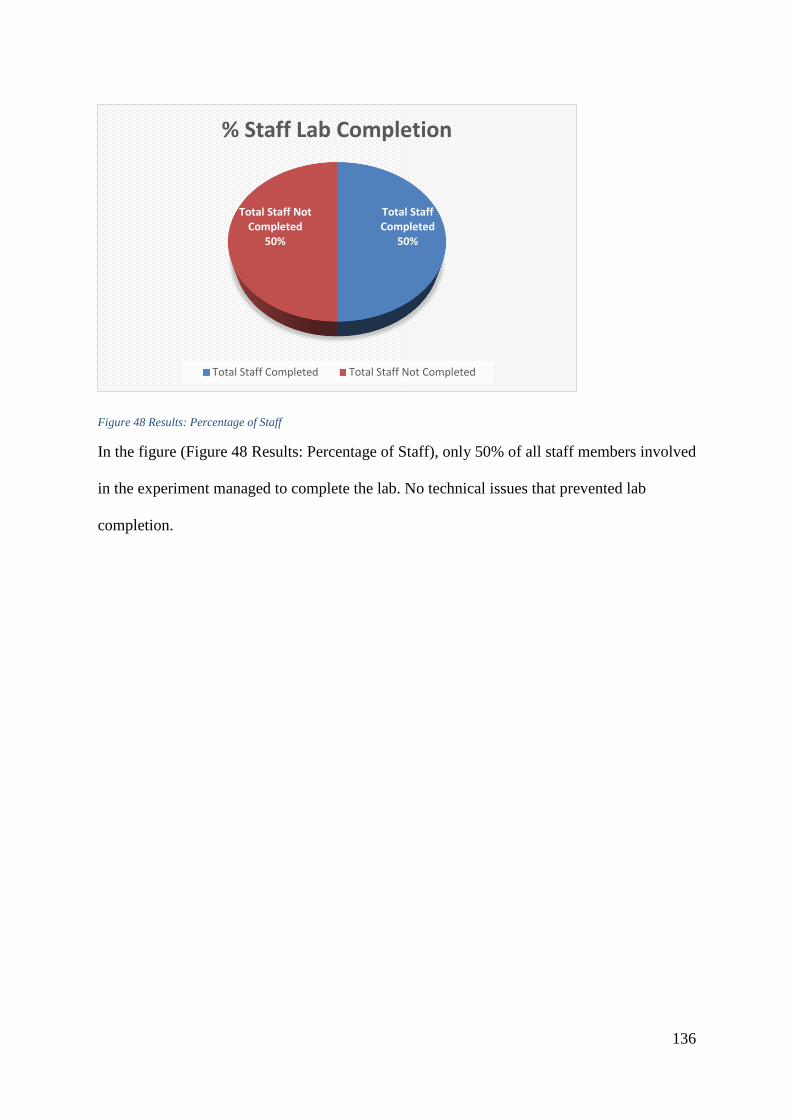
136
Figure 48 Results: Percentage of Staff
In the figure (Figure 48 Results: Percentage of Staff), only 50% of all staff members involved
in the experiment managed to complete the lab. No technical issues that prevented lab
completion.
Total Staff Completed
50%
Total Staff Not Completed
50%
% Staff Lab Completion
Total Staff Completed Total Staff Not Completed

137
Figure 49 Results: Learners Lab Completion Percentages
The figure (Figure 49 Results: Learners Lab Completion Percentages) shows the total
percentages of the learners that finished the lab. Only 33% of them finished successfully,
17% (1 person) could not due to technical issues and 50% did not finish the lab successfully.
Learners do not include qualified staff members who undertook the experiment.
Total Learners Completed
33%
Total Learners Incompleted
50%
System Failures17%
% Learners Lab Completion
Total Learners Completed Total Learners Incompleted System Failures

138
Figure 50 Results: Performance in Debugging Bar Graph
The figure (Figure 50 Results: Performance in Debugging Bar Graph) shows how each
participant performed during phase 2 of the experiment in terms of being able to use various
show commands, being able to use various debugging commands and being able to
troubleshoot NAT operation. Participants who used a variety of show commands in a correct
fashion were considered very good by the investigator and allocated an arbitrary numerical
score of 5. A score of 4 implies good use of a command or concept, but the participant
struggled slightly, or misapplied it. A score of 3 indicates they use occasionally used the
command but did not make effective use of it. 2 means the command was used, but often in
the wrong fashion. A value of 1 implies no or very poor use of the command.
0
1
2
3
4
5
1 2 3 4 5 6 7 8 9 11
Sco
re B
ased
on
Ob
serv
atio
n
Participant Unique ID
Observed Performance in Numerous Areas
Use of Show Commands Debugging CMDs NAT
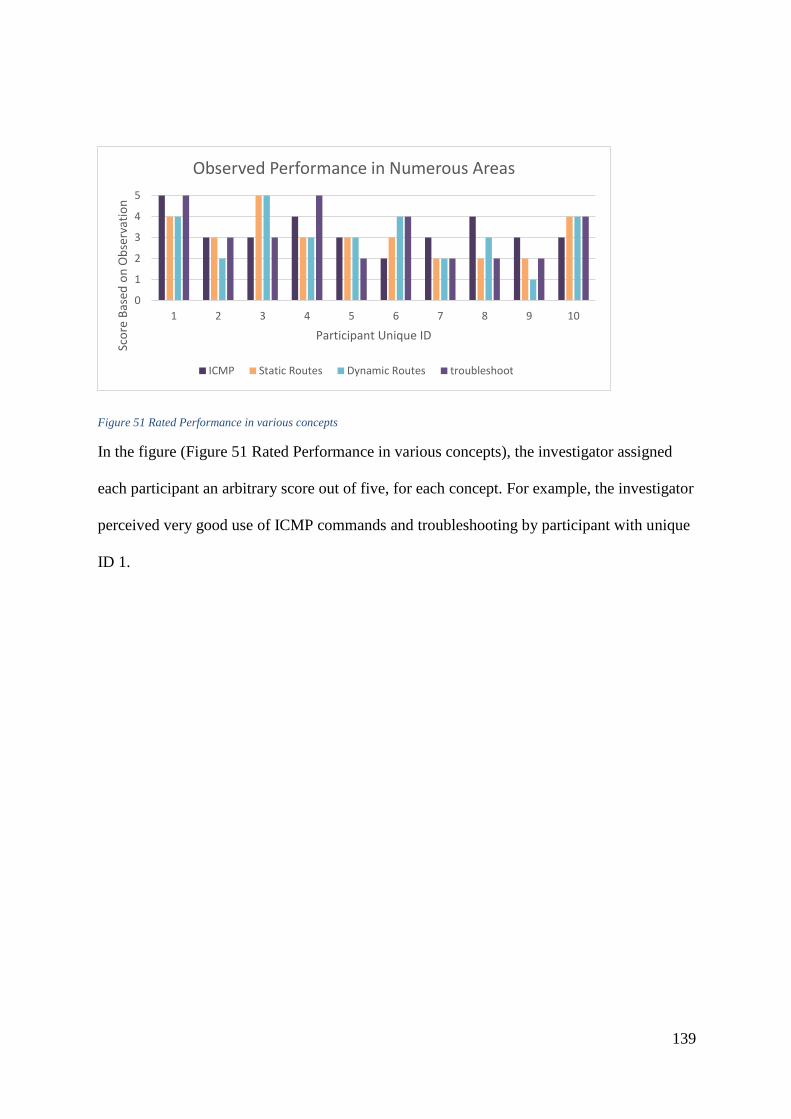
139
Figure 51 Rated Performance in various concepts
In the figure (Figure 51 Rated Performance in various concepts), the investigator assigned
each participant an arbitrary score out of five, for each concept. For example, the investigator
perceived very good use of ICMP commands and troubleshooting by participant with unique
ID 1.
0
1
2
3
4
5
1 2 3 4 5 6 7 8 9 10
Sco
re B
ased
on
Ob
serv
atio
n
Participant Unique ID
Observed Performance in Numerous Areas
ICMP Static Routes Dynamic Routes troubleshoot
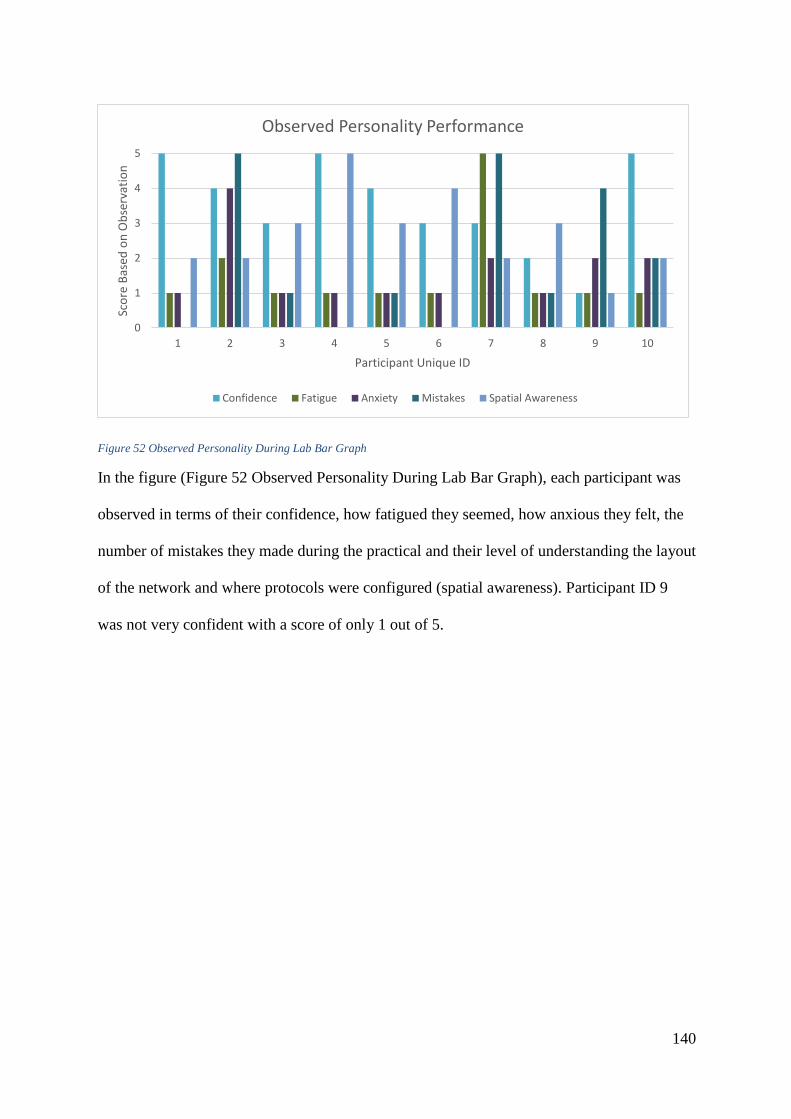
140
Figure 52 Observed Personality During Lab Bar Graph
In the figure (Figure 52 Observed Personality During Lab Bar Graph), each participant was
observed in terms of their confidence, how fatigued they seemed, how anxious they felt, the
number of mistakes they made during the practical and their level of understanding the layout
of the network and where protocols were configured (spatial awareness). Participant ID 9
was not very confident with a score of only 1 out of 5.
0
1
2
3
4
5
1 2 3 4 5 6 7 8 9 10
Sco
re B
ased
on
Ob
serv
atio
n
Participant Unique ID
Observed Personality Performance
Confidence Fatigue Anxiety Mistakes Spatial Awareness

141
Figure 53 Rated Performance Averages
The figure (Figure 53 Rated Performance Averages) shows the calculated averages for each
of the observed concepts derived from Figure 30 Results: Performance in Debugging Bar
Graph, Figure 31 Rated Performance in various concepts and Figure 32 Observed Personality
During Lab Bar Graph. On average, troubleshooting skills were satisfactory, though spatial
awareness was below satisfactory.
Figure 54 Results: Number of Problems Troubleshooted
This graph (Figure 54 Results: Number of Problems Troubleshooted) simply shows the
number of problems each participant correctly troubleshooted and fixed.
0
1
2
3
4
5
Average Performance Ratings
0
1
2
3
1 2 3 4 5 6 7 8 9 10
TOTA
L N
UIM
BER
OF
PR
OB
LEM
S FI
XED
PARTICIPANT UNIQUE ID
Number of Problems Successfully Troubleshooted
Problems Troubleshooted
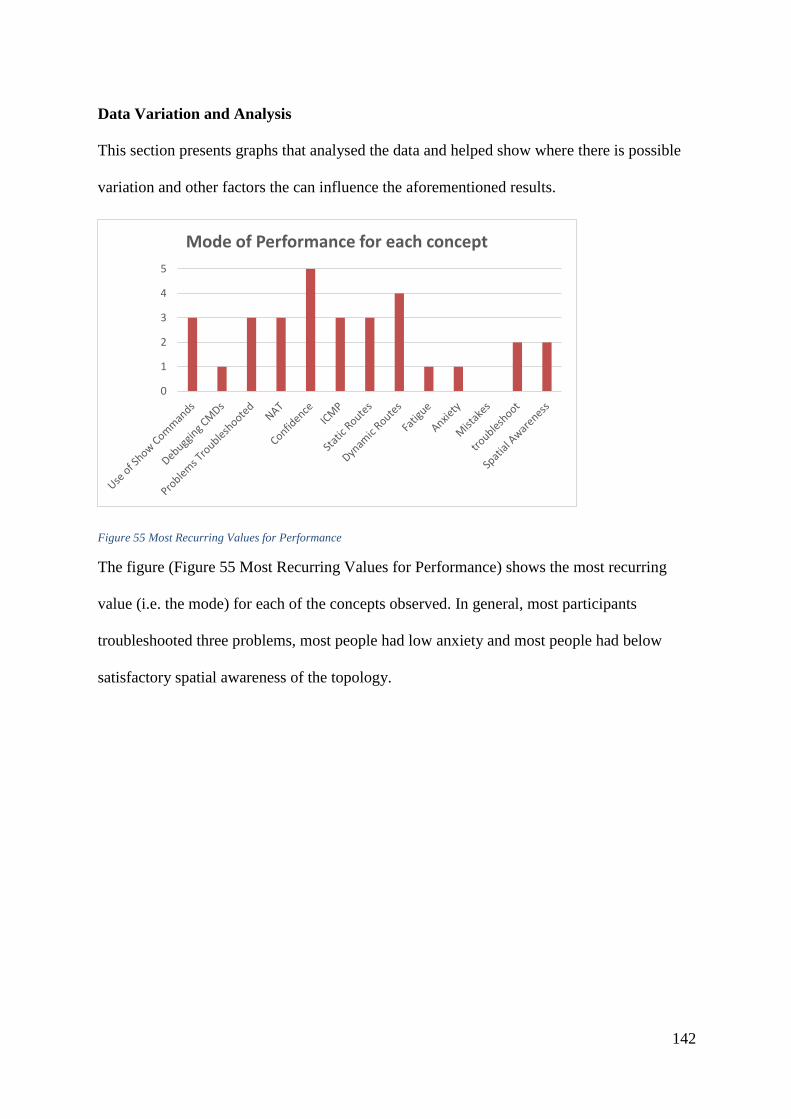
142
Data Variation and Analysis
This section presents graphs that analysed the data and helped show where there is possible
variation and other factors the can influence the aforementioned results.
Figure 55 Most Recurring Values for Performance
The figure (Figure 55 Most Recurring Values for Performance) shows the most recurring
value (i.e. the mode) for each of the concepts observed. In general, most participants
troubleshooted three problems, most people had low anxiety and most people had below
satisfactory spatial awareness of the topology.
0
1
2
3
4
5
Mode of Performance for each concept
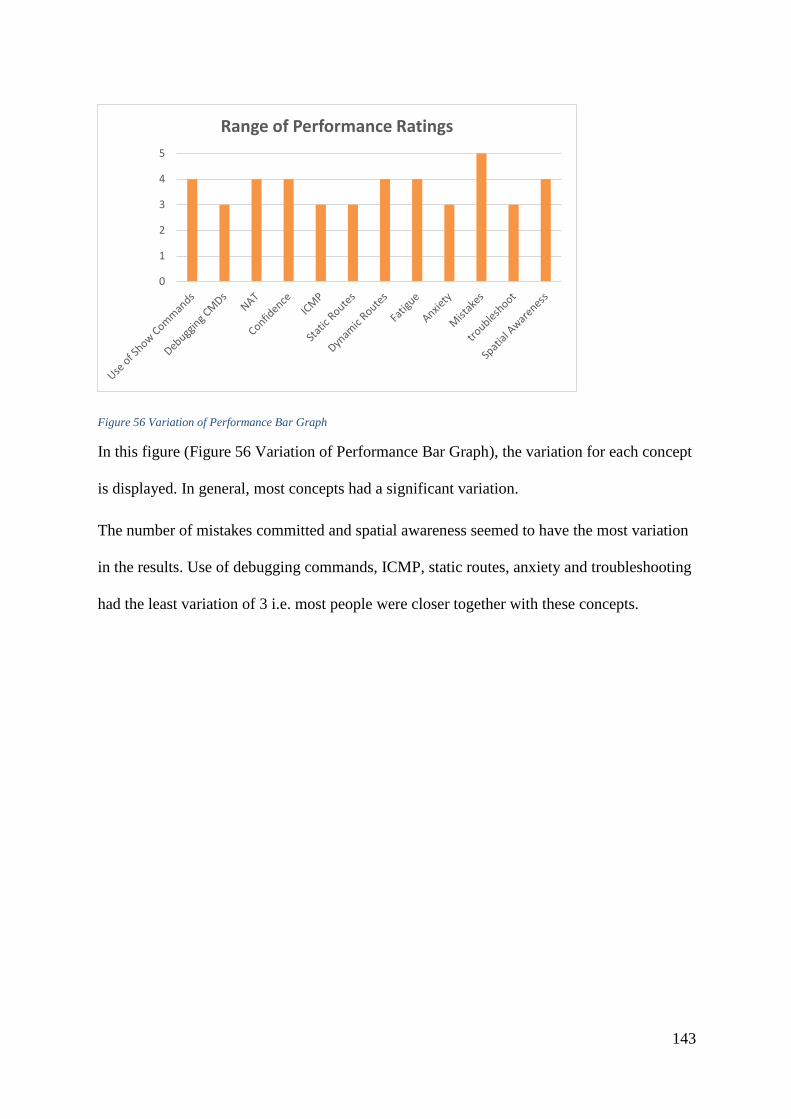
143
Figure 56 Variation of Performance Bar Graph
In this figure (Figure 56 Variation of Performance Bar Graph), the variation for each concept
is displayed. In general, most concepts had a significant variation.
The number of mistakes committed and spatial awareness seemed to have the most variation
in the results. Use of debugging commands, ICMP, static routes, anxiety and troubleshooting
had the least variation of 3 i.e. most people were closer together with these concepts.
0
1
2
3
4
5
Range of Performance Ratings

144
Figure 57 Most Recurring Knowledge Scores
This figure (Figure 57 Most Recurring Knowledge Scores) shows the most recurring score
for each discrete networking concept. Before the lab activity, a score of 1 (very poor) for STP
port fast was the most recurring value. However, after the practical activity, a score of 5 was
the most recurring value for STP port fast.
PassiveInterfaces
NATSTP
Portfast
NATDisadvanta
gesHSRP
Troubleshooting
Mode Before 3 3 1 2 1 3
Mode After 3 3 5 2 3 3
0
1
2
3
4
5
Mode of Knowledge Scores
Mode Before
Mode After

145
Appendix 2 – Pre-Lab Questionnaire
The following was the pre-lab questionnaire used in this experiment.
You are not required to submit any personal details including your name.
Questions marked with a * must be answered. A maximum of 20 minutes for
this questionnaire is allocated.
1.2 Classification
1. Which of the following best describes you? *
I am a student studying and/or a staff member (who doesn’t teach networking)
I am a staff member who teaches computer networking
1.3 Learning Perceptions
2. How would you rate yourself in terms of your confidence in the following
areas of networking?
Skill Very
Poor
Poor Average Good Very
Good
Troubleshooting
Routing
NAT
Spanning Tree
Portfast
Using debugging
commands
Static and Default
routes
HSRP

146
Using ? to get help
Using ‘show’
commands to verify
network operation
3. How often do you use ‘debug’ commands to troubleshoot networking
problems?
Never Rarely Sometimes Often Always
4. I tend to learn more when I design my own topology.
5. Experimenting with networks helps me learn
about networking.
Strongly
Disagree
Disagree Neutral Agree Strongly
Agree
Strongly
Disagree
Disagree Neutral Agree Strongly
Agree
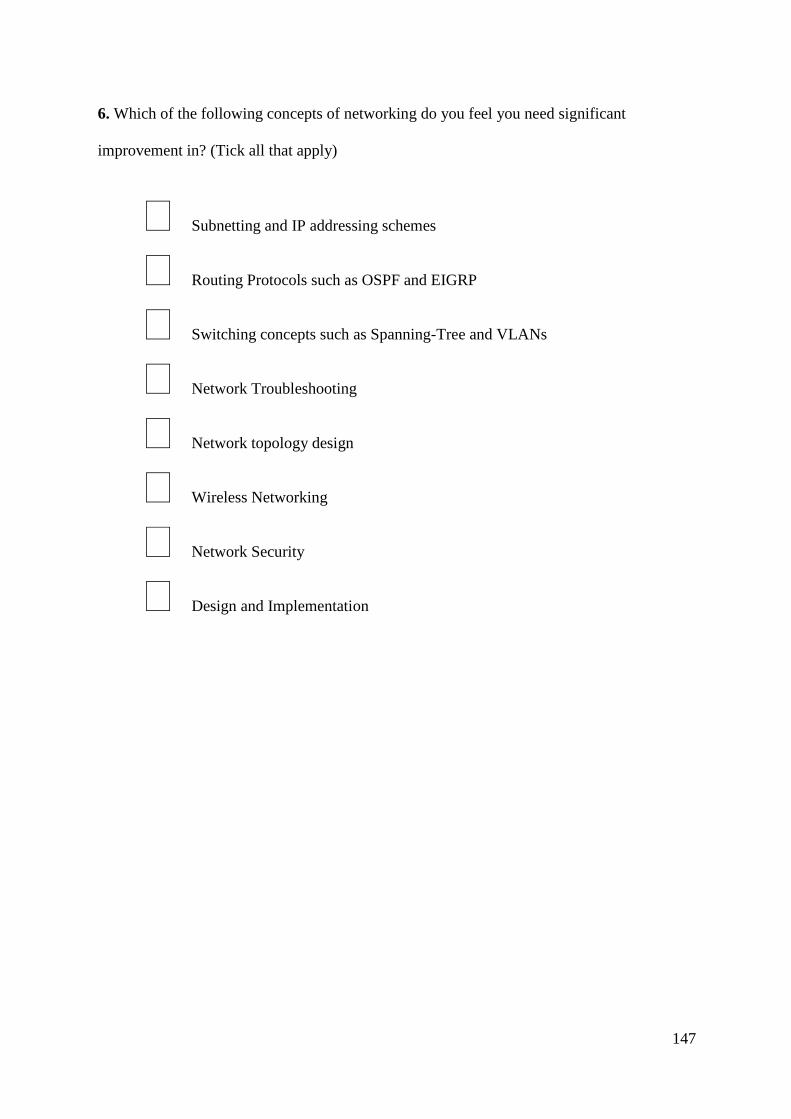
147
6. Which of the following concepts of networking do you feel you need significant
improvement in? (Tick all that apply)
Subnetting and IP addressing schemes
Routing Protocols such as OSPF and EIGRP
Switching concepts such as Spanning-Tree and VLANs
Network Troubleshooting
Network topology design
Wireless Networking
Network Security
Design and Implementation

148
1.4 Networking Knowledge
Below are six short answer questions dealing with various areas of networking. You should
provide a short answer of 1-3 sentences in your own words to demonstrate understanding.
Please do not write one word answers or IOS commands.
Use of external resources such as the Internet any time during this experiment is strictly
prohibited. The only materials allowed are those given to you by the investigator.
1. What does an interface in ‘passive’ mode do?
2. You have been allocated a single public IP address for your corporate Internet.
However, you have hundreds of machines, which need to have internet access. How
can this be achieved?
3. A computer booting over the network fails because the computer shows an error
message, indicating that the network link is down. However, after about 30 seconds,
the link comes up and the network starts working, confirming that the cable is
connected. This is far too late for any remote boot to occur. What feature on the
access switch needs to be enabled to fix the problem?
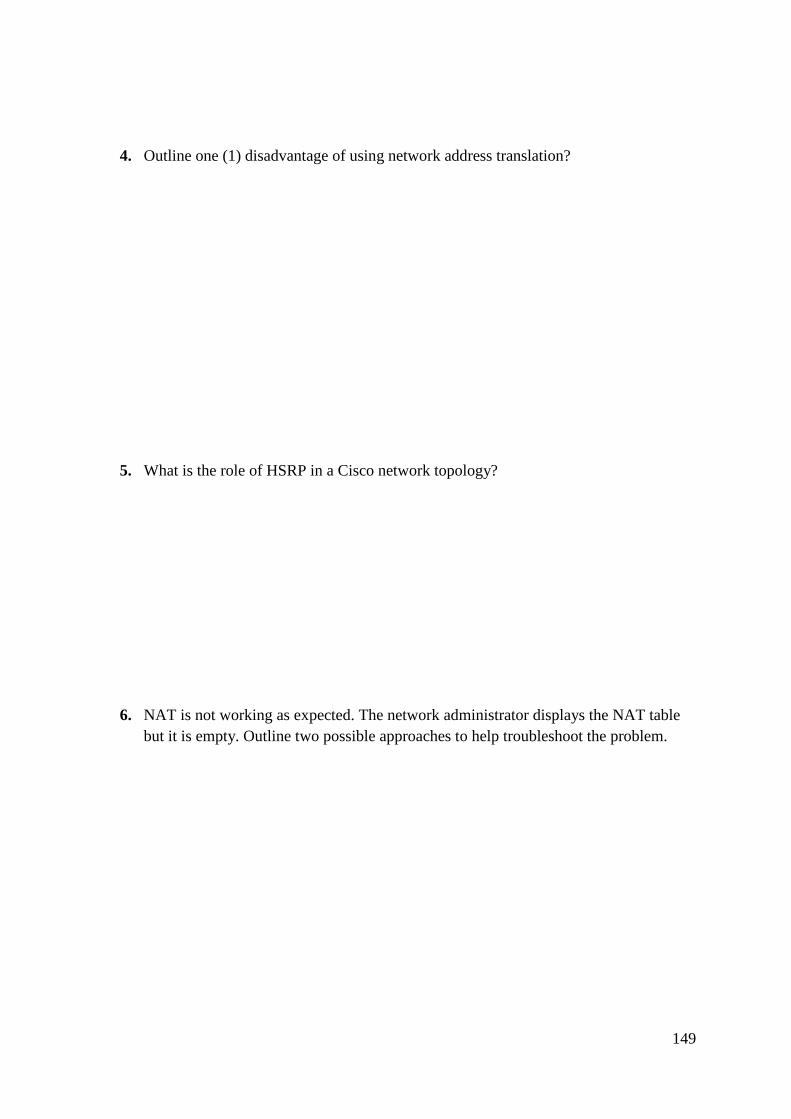
149
4. Outline one (1) disadvantage of using network address translation?
5. What is the role of HSRP in a Cisco network topology?
6. NAT is not working as expected. The network administrator displays the NAT table
but it is empty. Outline two possible approaches to help troubleshoot the problem.
150
Appendix 2 – Practical Booklet
You will spend up to 60 minutes undertaking a practical activity using Cisco
Virtual Internet Routing Lab (VIRL). In this activity you will spend the first 20
minutes configuring Hot Standby Routing Protocol and Spanning-Tree port fast
and learn about both of these features. You will then be asked to troubleshoot
issues with the network.
2.1 Restrictions
The investigator will not assist you with networking-related questions or
configuration.
Use of external resources such as the Internet any time during this experiment is
strictly prohibited. The only materials allowed are those given to you by the
investigator. You may use the help features in Cisco VIRL.
2.2 Passwords
The username, all passwords and all secrets is cisco

151
2.3 Topology
A topology of the network is below:-

152
2.4 Network Design
A small office network interconnects with a remote server called RemoteServer
over an Ethernet WAN connection provided by the Internet Service Provider.
There are a total of 4 subnets in the topology. The office subnet on 10.0.0.0/24
interconnects with the ISP subnet on 172.16.1.0/24. Traffic from the office
subnet is routed to 172.16.1.0/24 using EIGRP via either the ISP router on
172.16.2.0/24 or the ISP_Backup router on 172.16.3.0/24 depending on which
link is preferred by EIGRP.
The internal office subnet reaches the remote server by routing all traffic out of
the network via R1 on 10.0.0.1. Due to ISP regulations, the private address
range 10.0.0.0/24 cannot appear on the ISP’s network. Therefore, to facilitate
communication between the internal network and remote ISP services, network
address translation on R1 translates the private addresses to 172.16.2.4.
The office subnet adheres to a hierarchical design model in that the workstations
are connected to ALS1, which in turn connects to ALS2 and ALS3 to provide
layer 2 redundancy. The IEEE Spanning-Tree protocol is running on all ALS
switches.
The ISP and ISP_Backup routers are running HSRP to ensure that when the
default gateway of the remote server is down, traffic can be forwarded via the
ISP_Backup router.
R1 should form an EIGRP neighbour relationship with both ISP and
ISP_Backup routers.
An access list has been configured on R1 to allow all traffic from 10.0.0.0/24 to
172.16.1.0/24 for testing purposes.
The goal of this lab is to ensure that the above design is implemented and works
correctly. The above design is only partially configured. You will configure the
missing components in this lab and perform network troubleshooting to ensure
the network works as designed.
2.5 IP Addressing Scheme
The following is the IP addressing scheme and interface configuration for each
important device.
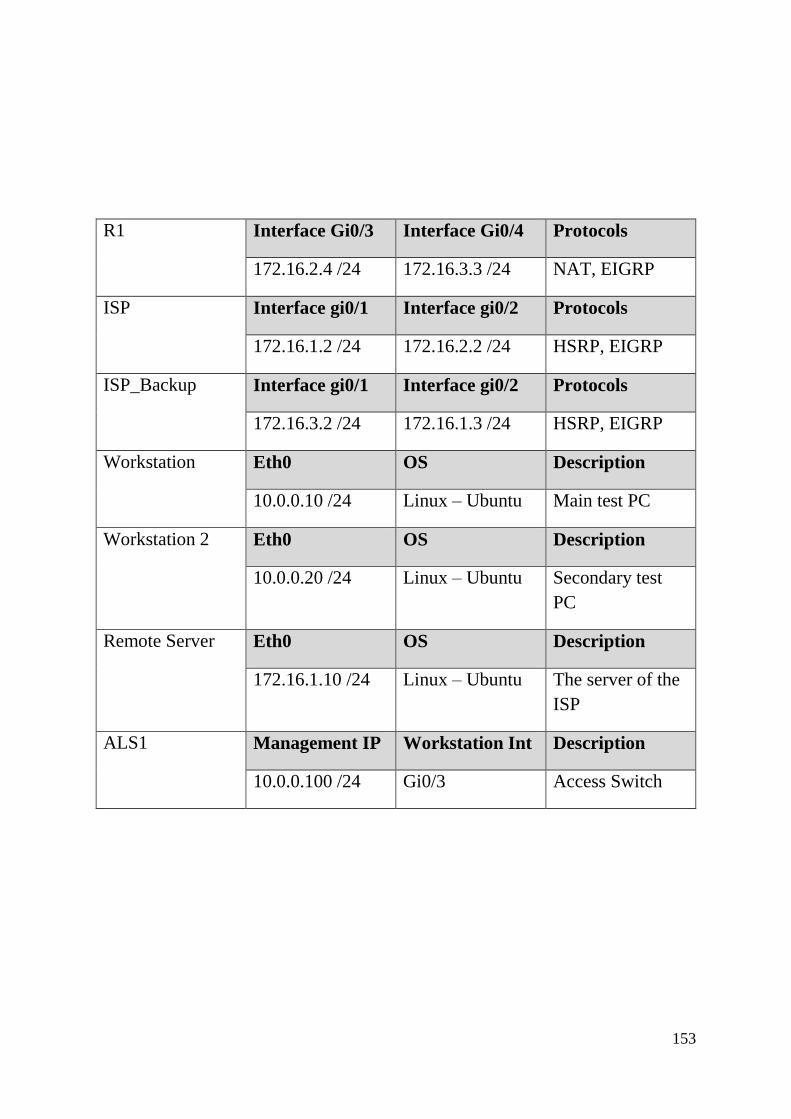
153
R1 Interface Gi0/3 Interface Gi0/4 Protocols
172.16.2.4 /24 172.16.3.3 /24 NAT, EIGRP
ISP Interface gi0/1 Interface gi0/2 Protocols
172.16.1.2 /24 172.16.2.2 /24 HSRP, EIGRP
ISP_Backup
Interface gi0/1 Interface gi0/2 Protocols
172.16.3.2 /24 172.16.1.3 /24 HSRP, EIGRP
Workstation
Eth0 OS Description
10.0.0.10 /24 Linux – Ubuntu Main test PC
Workstation 2 Eth0 OS Description
10.0.0.20 /24 Linux – Ubuntu Secondary test
PC
Remote Server Eth0 OS Description
172.16.1.10 /24 Linux – Ubuntu The server of the
ISP
ALS1 Management IP Workstation Int Description
10.0.0.100 /24 Gi0/3 Access Switch

154
2.6 Using Cisco VIRL and initial set up
The investigator will setup your VIRL environment to save time. At your
workstation, you should see two computer screens. The left screen should show
the VIRL pane. It should look similar to this:-
Figure 26 Left Computer Screen
Please Make Sure: That the on the top right hand side of the
screen (shown above) is selected.
The right screen should display a series of tabs. The screen will look similar to
below:-
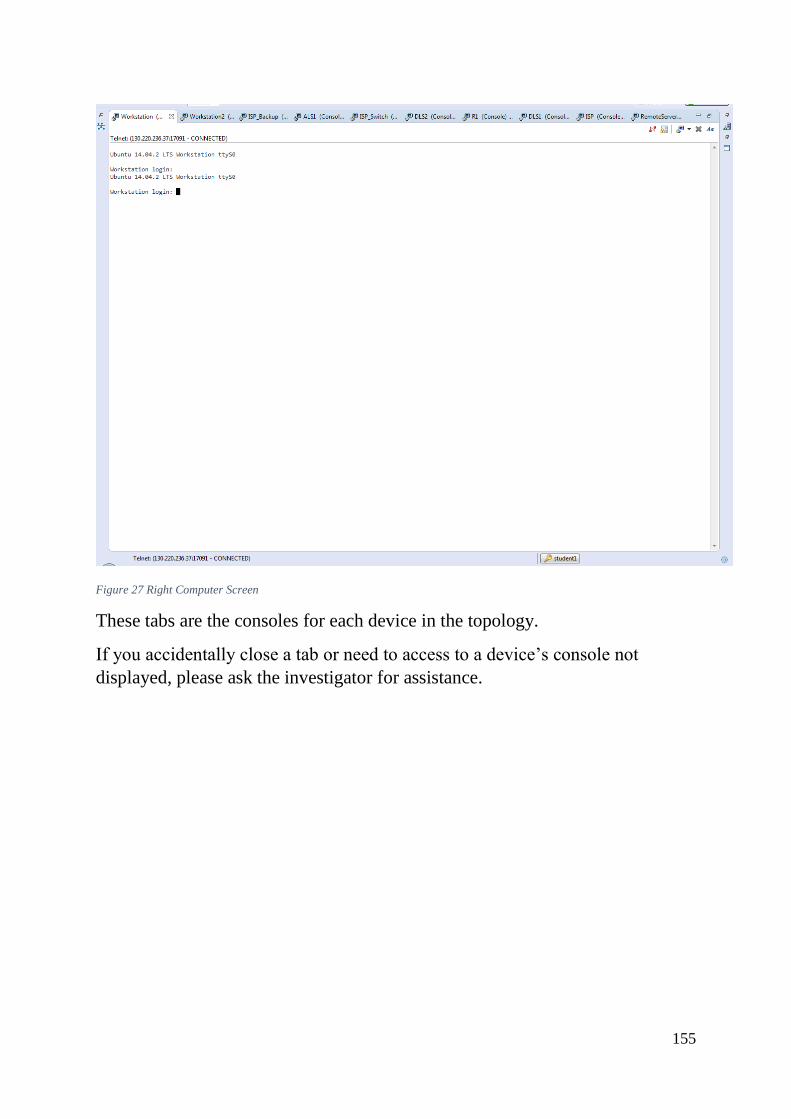
155
Figure 27 Right Computer Screen
These tabs are the consoles for each device in the topology.
If you accidentally close a tab or need to access to a device’s console not
displayed, please ask the investigator for assistance.

156
Please complete these steps before commencing the practical
1. Click on the Workstation tab.
2. Login to the Workstation PC’s virtual console using the username cisco
and password cisco
3. Type ping –c 4 172.16.1.10 to verify connectivity with RemoteServer.
Note: A ‘destination unreachable’ message will display because
the configuration is incomplete.
4. If you need help using VIRL, please ask now. The investigator will help
guide you through these steps.
You have now logged onto the machine and have started using VIRL, possibly
for the first time. You have identified a (possible) problem with the network. In
the following practical, you will configure the network, troubleshoot any
problems and aim to get the network to adhere to the design specified above.

157
2.7 Exercise 1: Hot Standby Routing Protocol (HSRP)
HSRP is not running on either ISP or the ISP_Backup routers, but it is critical
on a computer network to maintain availability of services. Without it, the
failure of a single router would cause loss of connectivity between the
workstations and the remote server.
It is not advisable to set multiple default gateways on a workstation because it
complicates management of the network. Instead, you should use Hot Standby
Routing Protocol (HSRP) to provide redundancy. HSRP allows multiple routers
to participate in a HSRP group. One router in the group is elected as the active
router, usually based on the highest HSRP priority for the group. The active
router is designated as the router that physically routes traffic. If this router fails
for any reason, another router in the same group takes over.
To configure a computer to use the HSRP group instead of just one router, you
need to assign the same virtual IP address to all routers in the group. This virtual
IP address is then set as the default gateway on the computer. HSRP will
allocate the virtual IP address to the active router.
2.7.1 Configure HSRP
In this activity you will learn to configure HSRP in this network to provide fault
tolerance.
1. Logon to the ISP_backup router using the username cisco and password
cisco
2. Configure the interface on the router to participate in a HSRP group on
the 172.16.1.0 /24 subnet.
ISPB(config)# int gi0/2
ISPB(config-if)# standby version 2
ISPB(config-if)# standby 1 ip 172.16.1.1
ISPB(config-if)# standby 1 preempt
ISPB(config-if)# end
Note: Please wait at least 30 seconds for changes to take
effect. A message will appear on the console indicating that
ISP_backup has changed from standby to active. If you
have problems, ask the investigator for help.
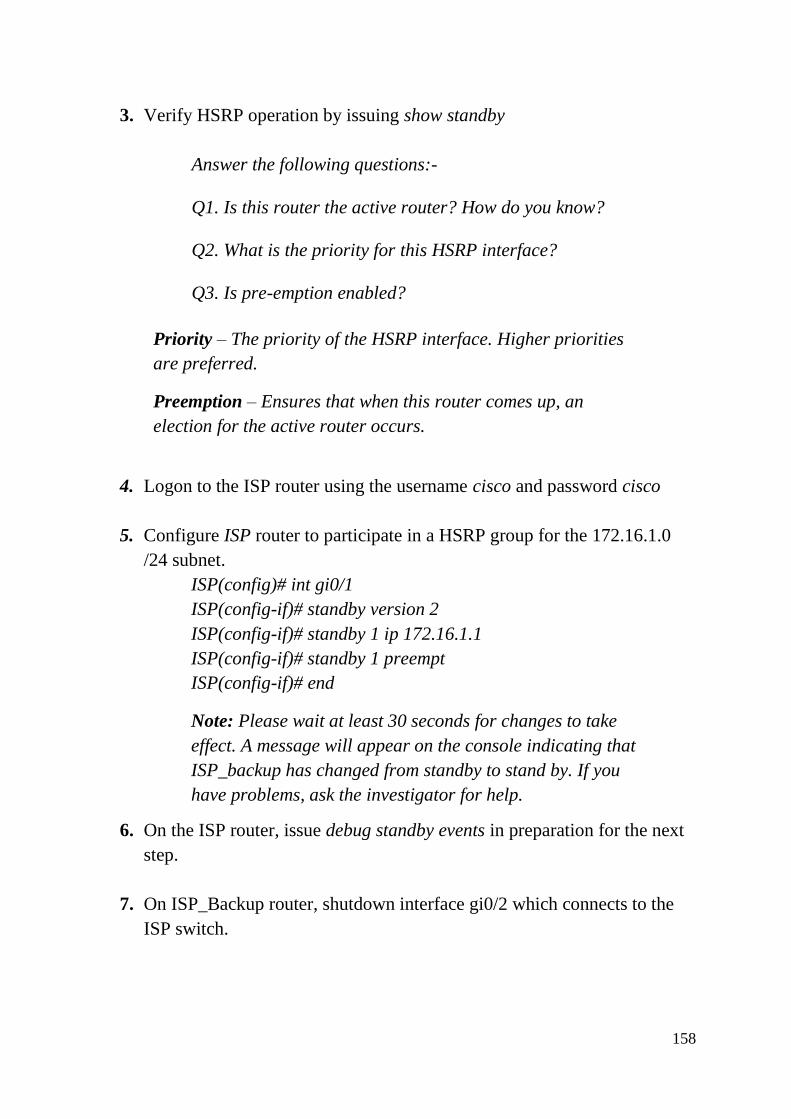
158
3. Verify HSRP operation by issuing show standby
Answer the following questions:-
Q1. Is this router the active router? How do you know?
Q2. What is the priority for this HSRP interface?
Q3. Is pre-emption enabled?
Priority – The priority of the HSRP interface. Higher priorities
are preferred.
Preemption – Ensures that when this router comes up, an
election for the active router occurs.
4. Logon to the ISP router using the username cisco and password cisco
5. Configure ISP router to participate in a HSRP group for the 172.16.1.0
/24 subnet.
ISP(config)# int gi0/1
ISP(config-if)# standby version 2
ISP(config-if)# standby 1 ip 172.16.1.1
ISP(config-if)# standby 1 preempt
ISP(config-if)# end
Note: Please wait at least 30 seconds for changes to take
effect. A message will appear on the console indicating that
ISP_backup has changed from standby to stand by. If you
have problems, ask the investigator for help.
6. On the ISP router, issue debug standby events in preparation for the next
step.
7. On ISP_Backup router, shutdown interface gi0/2 which connects to the
ISP switch.
159
8. On ISP router, observe the logging messages and describe what has
occurred. (It may take 30 seconds for messages to display. If there are no
messages, check the configuration and wait 30 more seconds).
9. On ISP router, turn off all debugging using no debug all command in
privileged exec mode.
10. On ISP_Backup, issue no shut on interface gi0/2.
On ISP router, modify the configuration of gi0/1 to ensure that ISP router is
always elected as the active router. Type standby 1 ? for a list of commands.
160
2.8 Exercise 2: Observe Network Changes
In this activity you will learn how Spanning Tree can negatively impact
connectivity on a network. The Spanning-Tree Protocol (STP) requires for all
ports on a switch to transition through various STP states before the port is
considered ready to forward traffic. This is essential to prevent layer 2 loops in
the topology. But it can also stop a link connected to an end workstation from
coming up on power on, preventing network booting.
2.8.1 Monitor STP changes
In this activity, you will use the debugging commands to monitor STP
operation.
1. Login to the ALS1 switch using the username cisco and password cisco
2. In privileged exec mode, issue debug spanning-tree events
3. Issue ping 10.0.0.10 in privileged exec mode. Please advise the
investigator if this ping fails.
4. Enter global config mode and shutdown the interface gi0/3. Do not exit
from sub-interface mode.
5. Verify that the interface is down by issuing do ping 10.0.0.10
6. Issue no shut to re-enable the interface previously shut down in step 4.
7. Issue do ping 10.0.0.10 from sub-interface configuration mode.
Note: The ping may fail, despite the interface being up. Please wait 30
seconds and try pinging again. The ping should succeed on the second
attempt. The delay was caused by the STP learning process.
Because the interface is not connected to a switch, but rather to an end
workstation that is not running STP, it is unnecessary for the learning process to
occur at all. You will now observe what happens when changes are made.
8. In gi0/3 sub-interface configuration mode, enter the following commands.
161
ALS1(config-if)# spanning-tree portfast
ALS1(config-if)# shut
ALS1(config-if)# no shut
9. From sub-interface configuration mode on ALS1, issue do ping 10.0.0.10
10. On ALS1, observe the debugging messages and summarise the
debugging output in your own words. What key difference did you notice
after port fast was enabled?
11. On ALS1, disable all debugging by issuing no debug all in privileged
exec mode.
162
2.9 Exercise 3: Debug Network Issues
You will now debug issues with the network. You will not be given the
commands to use. However, some helpful commands and tips to guide you is
provided on the back page. The source of the problems is R1.
Note: You should make use of the provided debugging commands for this
exercise.
1. There are issues with no EIGRP routes displaying in the routing table on
R1, even though EIGRP appears to be configured.
2. There are no entries displayed when show ip nat translations is issued on
the console of R1.
3. As a result of problems with R1, neither the Workstation PC nor
Workstation 2 PC can ping the remote server at 172.l6.1.10
Please troubleshoot and fix issues on R1 so that EIGRP routes are displayed,
NAT translations are displayed and both workstations can ping the remote
server at 172.16.1.10
2.10 Completion
When you have fixed the problems and tested connectivity, inform the
investigator. The investigator will check your configuration and advise you if all
the problems are fixed. If not, you will be told there is still a problem and will
be permitted to continue the troubleshooting process.
Once the time has elapsed, you will be told to stop working and will be
prohibited from making further changes. If time permits, the investigator will
come round and check the configuration
Can you suggest why a ping from 10.0.0.10 to the remote server at 172.16.1.10
succeeds but when done in reverse, the ping fails? Assume no ACLs or routing
issues. Write your short answer below:-
163
Troubleshooting Help
This section will help you troubleshoot the problems mentioned above.
Network Address Translation (NAT) is typically used on edge routers to allow
an internal network to communicate with an external network without being on
the same subnet. In general, NAT maps one or more IP addresses from one IP
address space into another.
The primary use of NAT is NAT overload, which allows many internal hosts to
use a single IP address to communicate on the Internet. Each application,
requiring Internet access is assigned a port by the edge router running NAT and
the entries are stored in a NAT table.
NAT rewrites the source and destination IP addresses in the header of the IP
packet. Consequently, protocols that rely on exact IP addresses such as a VPN
can fail. Other applications also require port forwarding to allow them to be
accessed over the Internet.
NAT Troubleshooting Debugging Commands
You can debug NAT using some of the following debugging commands:-
1) debug ip nat – This will give indication if any translation is occurring.
2) debug ip nat detailed – Gives detailed info on NAT operation.
3) clear ip nat translation * - Clears the NAT table. Maybe necessary if
you need to reconfigure NAT.
4) debug ip access-list data-plane – Debug IP access list actions. Is
traffic being dropped?
5) Show ip EIGRP interfaces – Is EIGRP running on the interfaces?
ip nat <inside or outside> source list <number or name> pool <name of NAT
pool> <additional options> - Use this command to reconfigure NAT in global
configuration mode.
Things to check with NAT connectivity issues

164
Troubleshooting NAT often requires you to troubleshoot more than NAT itself.
Routing or ACL issues are examples of unrelated problems that can prevent
NAT from working. Below are some things you can check if NAT is not
performing as expected.
1. Is the internal address being translated to the correct public address?
2. Is the internal address assigned in a valid ACL with the correct
wildcard mask?
3. Is the gateway router translating anything? To check this, issue show
ip nat translations in privileged exec mode.
4. Is there intended connectivity?
5. Is appropriate routing used? The gateway needs a dynamic, static or
default route to the destination subnet.
6. Does the destination subnet have a return route to the source subnet
i.e. the subnet of the public address of the gateway router?
7. Are firewalls or ACLs on the router or anywhere else blocking traffic?
Internal traffic could be getting discarded at the router prior to being
translated.
8. Remember that access lists have an implied deny ip any any statement.
Are key interfaces incorrectly set to passive mode? Setting an interface to
passive blocks routing updates on that interface, preventing an adjacency from
being established

165
Appendix 3 – Post Lab Questionnaire
You are not required to submit any personal details including your name.
Questions marked with a * must be answered. A maximum of 20 minutes is
allocated for this questionnaire.
This questionnaire is to reflect on your experience and knowledge after
undertaking the practical.
3.1 Evaluation
1. Please mark each statement that best describes your opinion.
Statement Strongly
Disagree
Disagree Neutral Agree Strongly
Agree
This platform makes me
feel more productive in
my learning
This platform helps me
understand networking
This platform allows me
to complete labs
efficiently and quickly
I would like to use this
platform in the future
The platform makes no
difference to my
learning.

166
2. Please tick the box most applicable to your opinion in respect to the
following statements.
Statement Strongly
Disagree
Disagree Neutral Agree Strongly
Agree
Using this platform
creates a sense of
realism when
configuring the
network
This platform helps me
troubleshoot
networking problems
Using this platform
motivates me to learn
networking
The platform engaged
me in the task
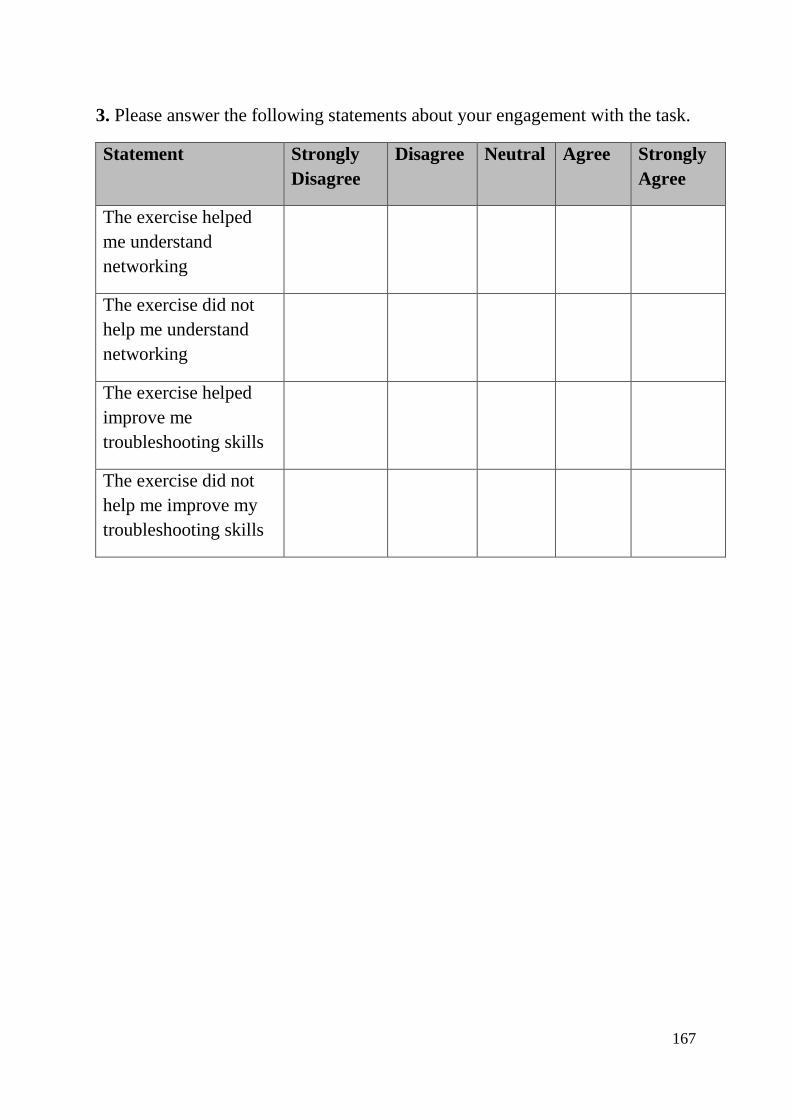
167
3. Please answer the following statements about your engagement with the task.
Statement Strongly
Disagree
Disagree Neutral Agree Strongly
Agree
The exercise helped
me understand
networking
The exercise did not
help me understand
networking
The exercise helped
improve me
troubleshooting skills
The exercise did not
help me improve my
troubleshooting skills
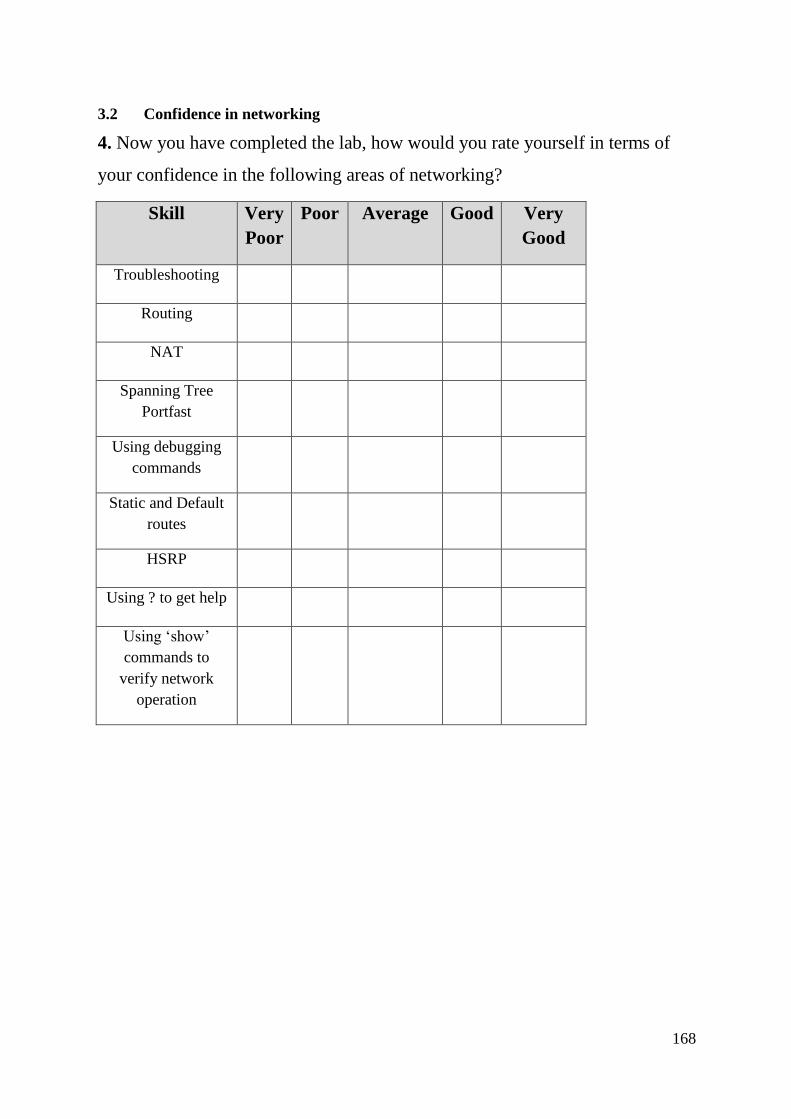
168
3.2 Confidence in networking
4. Now you have completed the lab, how would you rate yourself in terms of
your confidence in the following areas of networking?
Skill Very
Poor
Poor Average Good Very
Good
Troubleshooting
Routing
NAT
Spanning Tree
Portfast
Using debugging
commands
Static and Default
routes
HSRP
Using ? to get help
Using ‘show’
commands to
verify network
operation

169
5. Which of the following concepts of networking do you feel you need
significant improvement in? (Tick all that apply)
Subnetting and IP addressing schemes
Routing Protocols such as OSPF and EIGRP
Switching concepts such as Spanning-Tree and VLANs
Network Troubleshooting
Network topology design
Wireless Networking
Network Security
Design and Implementation
3.3 Any Additional Comments
6. Do you have any comments regarding use of Cisco VIRL for education?
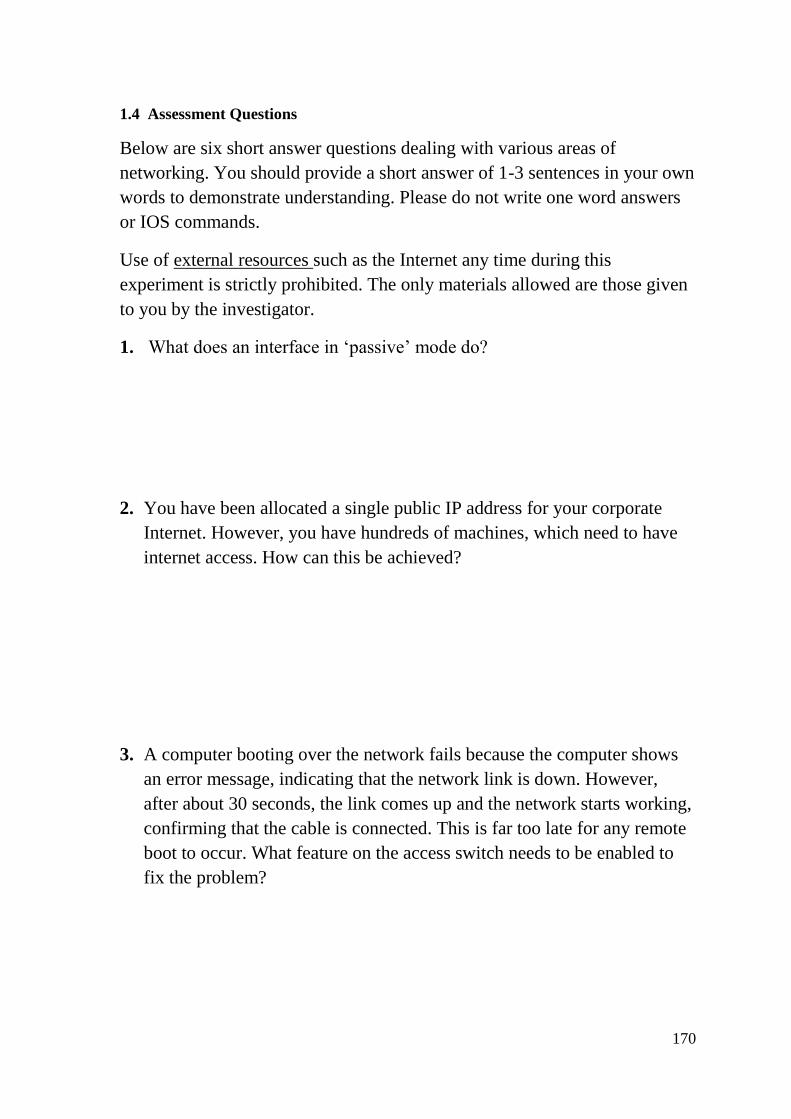
170
1.4 Assessment Questions
Below are six short answer questions dealing with various areas of
networking. You should provide a short answer of 1-3 sentences in your own
words to demonstrate understanding. Please do not write one word answers
or IOS commands.
Use of external resources such as the Internet any time during this
experiment is strictly prohibited. The only materials allowed are those given
to you by the investigator.
1. What does an interface in ‘passive’ mode do?
2. You have been allocated a single public IP address for your corporate
Internet. However, you have hundreds of machines, which need to have
internet access. How can this be achieved?
3. A computer booting over the network fails because the computer shows
an error message, indicating that the network link is down. However,
after about 30 seconds, the link comes up and the network starts working,
confirming that the cable is connected. This is far too late for any remote
boot to occur. What feature on the access switch needs to be enabled to
fix the problem?

171
4. Outline one (1) disadvantage of using network address translation?
5. What is the role of HSRP in a Cisco network topology?
6. NAT is not working as expected. The network administrator displays the
NAT table but it is empty. Outline two possible approaches to help
troubleshoot the problem.

172