The role of the uncoupling protein2 -866G/A polymorphism ...
127
The role of the uncoupling protein2 -866G/A polymorphism in oxidative stress markers associated with air pollution exposure during pregnancy By SAVANIA NAGIAH B.Sc. B. Med. Sc. (Hons) (UKZN) Submitted in fulfilment of the requirements for the degree of M. Med. Sci in the Discipline of Medical Biochemistry and Chemical Pathology School of Laboratory Medicine and Medical Sciences College of Health Sciences University of KwaZulu-Natal Durban 2012
Transcript of The role of the uncoupling protein2 -866G/A polymorphism ...

The role of the uncoupling protein2 -866G/A
polymorphism in oxidative stress markers associated with
air pollution exposure during pregnancy
By
SAVANIA NAGIAH
B.Sc. B. Med. Sc. (Hons) (UKZN)
Submitted in fulfilment of the requirements for the degree of M. Med. Sci
in the
Discipline of Medical Biochemistry and Chemical Pathology
School of Laboratory Medicine and Medical Sciences
College of Health Sciences
University of KwaZulu-Natal
Durban
2012

i
ABSTRACT
Consistently high levels of air pollutants such as sulphur dioxide, particle matter and nitric
oxides have been observed in the Durban South (DS) industrial basin. The adverse health
outcomes associated with ambient air pollution (AAP) exposure have underlying molecular
mechanisms. Oxidative stress is a known outcome of AAP exposure and contributes to the
exacerbation of adverse AAP related outcomes such as chronic obstructive pulmonary
disorder (COPD) and asthma. Pregnant women are at increased risk of developing oxidative
stress due to increased energy expenditure. Oxidative stress during pregnancy is linked to
adverse birth outcomes such as intrauterine growth retardation and low birth weight. The
mitochondria are the most abundant source of endogenous reactive oxygen species (ROS),
making these organelles extremely susceptible to oxidative damage. Alterations in
mitochondrial function by air pollutants can contribute to oxidative stress. Uncoupling
protein2 (UCP2) is an anion carrier located on the inner mitochondrial membrane that
regulates mitochondrial ROS production by reducing mitochondrial membrane potential
(Δψm) through mild uncoupling. Genetic variation in genes that play a role in oxidative stress
response is likely to influence susceptibility to oxidative stress related health outcomes. The
aim of this study was to evaluate air pollution associated oxidative stress response in women
from the DS industrial basin and determine the functional relevance of a common -866G/A
promoter polymorphism in the UCP2 gene. Fifty pregnant women from DS and 50 from
north Durban (DN; control) were recruited. The thiobarbituric acid assay (TBARS) and
comet assay were performed to measure oxidative stress and DNA fragmentation.
Mitochondrial function was evaluated by JC-1 Mitoscreen and ATP luminometry.
Quantitative PCR (qPCR) was performed to measure mitochondrial DNA (mtDNA) damage.
Antioxidant response was determined by qPCR to measure mRNA expression of superoxide
ii
dismutase 2 (SOD2), nuclear factor erythroid 2-related factor 2 (Nrf2) and UCP2 mRNA
expression. Western blots were performed to quantify UCP2 and Nrf2 protein expression.
The samples were genotyped using PCR - restriction fragment length polymorphism. Results
from the TBARS assay showed women from DS displayed elevated levels of MDA, a marker
for oxidative stress (0.07±0.06µM; p = 0.56). ATP (1.89 fold) and Δψm (45.3±17.2%; p =
0.8) were also elevated in women from DS, favouring free radical production. DNA
fragmentation, as indicated by comet tail length was also higher in DS when compared to the
control group (0.57±0.16µm; p = 0.037). Analysis of mtDNA viability showed a 0.49 fold
change in mtDNA amplification in women from the industrialized DS. All antioxidant genes,
i.e. Nrf2 (0.73 fold), UCP2 (1.58 fold), SOD2 (1.23 fold), were up regulated in women from
DS. Analysis of protein expression showed a significant increase in UCP2 expression
(0.08±0.03RBI; p = 0.049) and a significant decline in Nrf2 levels (1.68±0.84RBI; p = 0.03).
The homozygous G genotype was significantly more frequent in DS (37.5%) than in DN
(18.6%; p = 0.047; OR: 2.57; 95% CI: 1.353 to 4.885). This genotype exhibited higher MDA
levels, comet tail length, Δψm, SOD2, Nrf2, and UCP2 expression than the AA/GA in
genotype in women from DS (p > 0.05). This study found that pregnant women from a more
industrialized area exhibit higher markers for oxidative stress and conditions that favour
mitochondrial free radical production.

iii
DECLARATION
This study represents the original work by the author and has not been submitted in
any form to another university. The use of work by others has been duly acknowledged
in the text.
The research described in this study was carried out in the Discipline of Medical
Biochemistry, Faculty of Health Sciences, University of KwaZulu-Natal, Durban, under
the supervision of Prof. A.A. Chuturgoon and Miss Alisa Phulukdaree.
……………………………………………
S. Nagiah

iv
ACKNOWLEDGEMENTS
Prof A. A. Chuturgoon
Thank you for your guidance, support and motivation throughout the past two years. Most of
all thank you for instilling in me a love for science and research.
Ms Alisa Phulukdaree
Thank you for being an exceptional mentor and friend to me. Your passion for your work has
become an inspiration to me as a researcher.
Medical Science Masters Class 2012
Thank you for your assistance and making it a pleasure to work in the lab every day.
Senior PhD students
Thank you for your assistance and advice throughout the course of the year.
Patients in the EPoCH study
Thank you for willingly participating in this study and providing blood samples.
My family
Thank you for your patience and support.
The National Research Foundation and College of Health Science, UKZN
Scholarships and funding.

v
PRESENTATIONS
The role of mitochondria in air pollution associated oxidative stress response in
pregnant women
S. Nagiah, A. Phulukdaree, D. Naidoo, K.
Ramcharan, R. Naidoo, and A. Chuturgoon
College of Health Science Research Symposium, UKZN (September 2012)
Durban, South Africa

vi
ABBREVIATIONS
Δψm Mitochondrial depolarisation
15d-PGJ2 15-deoxy-D12, 14
-prostaglandin J2
AAP Ambient air pollution
ADP Adenosine diphosphate
ARE Antioxidant response element
ATP Adenosine-5’-triphosphate
BCA Bicinchonic acid
BHT Butylated hydroxytoulene solution
BLAST Basic local alignment search tool
BSA Bovine serum albumin
CAT Catalase
cDNA Complementary DNA
CI Confidence interval
CO Carbon monoxide
CO2 Carbon dioxide
COPD Chronic obstructive pulmonary disorder

vii
CSIR Council for Scientific and Industrial Research
Ct Comparative threshold
Cul3 Cullin3
DJ-1 Parkinson disease 7 (also known as PARK7)
DMSO Dimethyl sulfoxide
DN Durban North
DNA Deoxyribose nucleic acid
dNTPs Deoxyribonucleotide
DS Durban South
dsDNA Double stranded DNA
EDTA Ethylenediaminetetraacetic acid
ELISA Enzyme linked immune-sorbent assay
EtBr Ethidium bromide
ETC Electron transport chain
FADH Flavin adenine dinucleotide
g Gravitational force
GDP Guanosine diphosphate
GPx Glutathione peroxidase
viii
GSH Reduced glutathione
GST Glutathione-S-transferase
HO-1 Heme oxygenase 1
HRP Horse radish peroxidase
HWE Hardy Weinberg equilibrium
IUGR Intrauterine growth retardation
Keap1 Kelch like ECH-associated protein 1
LMPA Low melting point agarose
MDA Malondialdehyde
MgCl2 Magnesium chloride
MPP Multi Point Plan
MRA Merebank Residents Association
mRNA messenger RNA
mtDNA Mitochondrial DNA
NADH Nicotinamide adenine dinucleotide
NADPH Nicotinamide adenine dinucleotide phosphate
NCBI National Centre for Biotechnology Information
NO Nitrogen oxide
ix
NO2 Nitrogen dioxide
NOx Nitric oxide; nitrogen dioxide
NQO1 NADPH:quinone oxidoreductase
Nrf2 Nuclear factor erythroid 2-related factor 2
O2-• Superoxide anion radical
O3 Ozone
OR Odds ratio
qPCR Quantitative PCR
PAH Polycyclic aromatic hydrocarbons
PBMCs Peripheral blood mononuclear cells
PBS Phosphate saline buffer
PCR Polymerase chain reaction
PM10 Particulate matter (diameter 10µm)
PPARγ Peroxisome proliferator activated receptor γ
RBI Relative band intensity
RLU Relative light units
RNA Ribose nucleic acid
RNS Reactive nitrogen species
x
ROS Reactive oxygen species
SD Standard deviation
SDCEA South Durban Community Environmental Alliance
SDS Sodium dodecyl sulfate
SDS-PAGE SDS-Polyacrylamide gel electrophoresis
SNP Single nucleotide polymorphism
SO2 Sulphur dioxide
SOD Superoxide dismutase
ssDNA Single stranded DNA
TBA Thiobarbituric acid
TBARS Thiobarbituric acid reactive substances
TEMED Tetramethylethylenediamine
Tris-HCl Tris(hydroxymethyl)aminomethane hydrochloric acid
TRS Total reduced sulphur
TTBS Tween 20 Tris-buffered saline
UCP Uncoupling protein
UV Ultra violet

xi
LIST OF FIGURES
CHAPTER 1
Figure 1.1. Map of Durban South industrial basin located on the east coast of
South Africa (Kistnasamy 2005).
1
Figure 1.2 Close proximity of Mondi paper mill in Merewent (A) and
ENGEN petrol refinery (B) in Austerville (Guastella, 2007).
3
Figure 1.3 Sulphur dioxide distribution at the three monitoring stations with
the highest SO2 readings from 1997-2006 (Guastella, 2007)
5
Figure 1.4 Schematic representation of oxidative stress mechanism of
toxicity (Kelly, 2003)
12
Figure 1.5 The Keap1-Nrf2 pathway (Taguchi 2011)
15
Figure 1.6 Gene targets of PPARγ (Polvani 2012)
17
Figure 1.7 The electron transport chain (Matsuzaki et al. 2009)
18
Figure 1.8 Diagramatic representation of the mechanism by which UCPs
reduce mitochondrial membrane potential (Space 2012)
20
CHAPTER 2
Figure 2.1 Overview of methods and experimental design (Prepared by
author)
26
Figure 2.2 PCR reaction (Prepared by author)
31
Figure 2.3 Restriction fragments of MluI fast digest (Prepared by author) 33

xii
Figure 2.4 Initiation and propagation of lipid peroxidation (Prepared by
author)
35
Figure 2.5 Malondialdehyde and thiobarbituric acid reaction (Prepared by
author)
36
Figure 2.6 ATP luciferase reaction (Prepared by author)
37
Figure 2.7 Hydrodynamic focussing (Rahman 2006)
39
Figure 2.8 The central dogma of molecular biology (Prepared by author)
43
Figure 2.9 Arrangement for transfer of proteins from gel to nitrocellulose
(Prepared by author)
47
Figure 2.10 Detection of target protein with antibodies (Prepared by author) 49
CHAPTER 3
Figure 3.1 Restriction fragment length polymorphism for the UCP2 -
866G/A polymorphism
51
Figure 3.2 Extracellular MDA levels for women from Durban North and
Durban South (p > 0.05)
53
Figure 3.3 Stratified results of TBARS assay according to UCP2 genotypes
(p > 0.05)
54
Figure 3.4 Luminescence measured for CellTiter Glo® Assay in relative
light units (RLU; **p < 0.005)
55
Figure 3.5 ATP fold change in PBMCs for pregnant women from Durban 55

xiii
North and Durban South
Figure 3.6 Results from ATP luminometry stratified according to UCP2
genotypes in PBMCs from pregnant women living in Durban
North and Durban South. ATP levels in the AA/GA genotype in
the Durban South group were significantly higher than the
same genotype in Durban North (*p < 0.05 when compared to
AA/GA in Durban North)
56
Figure 3.7 Fold change of ATP levels compared between UCP2 genotypes
57
Figure 3.8 Percentage mitochondrial depolarisation for PBMCs from
pregnant women in Durban North and Durban South (p > 0.05)
58
Figure 3.9 Percentage mitochondrial depolarisation for PBMCs from
pregnant women in Durban North and Durban South stratified
according to UCP2 genotype (p > 0.05)
59
Figure 3.10 Comet tails for PBMCs in women from Durban North (A) and
Durban South (B)
60
Figure 3.11 Comet tail length was significantly higher in PBMCs from
women in Durban South than women from Durban North (*p <
0.05)
60
Figure 3.12 Comet assay results stratified to UCP2 genotypes. The GG
genotype was associated with longer comet tail length in both
Durban North and Durban South (p > 0.05)
61
Figure 3.13 Pregnant women from Durban South displayed a 0.49 fold
decrease in mtDNA amplification when compared to women
from Durban North
62

xiv
Figure 3.14 Fold change in mtDNA amplification in Durban North and
Durban South stratified according to UCP2 genotypes
63
Figure 3.15 Uncoupling protein mRNA expression was 1.58 fold higher in
PBMCs from women in Durban South than women from
Durban North
64
Figure 3.16 Uncoupling protein mRNA expression stratified according to
UCP2 genotype. The AA/GA genotype exhibited lower mRNA
expression in both Durban North and Durban South
65
Figure 3.17 Women from Durban South displayed a 1.23 fold increase in
SOD2 mRNA expression when compared to Durban North
66
Figure 3.18 Fold change of SOD2 mRNA expression between genotypes in
Durban North and Durban South
67
Figure 3.19 Pregnant women from Durban South displayed a 0.73 fold
decrease in Nrf2 mRNA expression compared to women from
Durban North
68
Figure 3.20 Fold change of Nrf2 mRNA expression between genotypes in
Durban North and Durban South
69
Figure 3.21 Western blot images for UCP2 expression and house-keeping
protein
70
Figure 3.22 Protein expression of UCP2 in PBMCs from pregnant women in
Durban North and Durban South (p < 0.05)
70
Figure 3.23 Protein expression of UCP2 in PBMCs from pregnant women in
Durban North and Durban South stratified according to UCP2
genotype (p > 0.05)
71

xv
Figure 3.24 Western blot images for Nrf2 expression and house-keeping
protein
71
Figure 3.25 Protein expression of Nrf2 in PBMCs from pregnant women in
Durban North and Durban South
72
Figure 3.26 Protein expression of Nrf2 in PBMCs from pregnant women in
Durban North and Durban South stratified according to UCP2
genotype
73
Figure 4.1 Oxidative stress response in pregnant women from DS (By
author)
78
LIST OF TABLES
CHAPTER 2
Table 2.1 Primer sequences for qPCR 45
CHAPTER 3
Table 3.1 Genotype and allelic frequencies of UCP2 -866G/A promoter
SNP in pregnant women from Durban North and Durban South 52
TABLE OF CONTENTS
ABSTRACT i
DECLARATION iii
ACKNOWLEDGEMENTS iv
PRESENTATIONS v
ABBREVIATIONS vi

xvi
LIST OF FIGURES xi
LIST OF TABLES xv
TABLE OF CONTENTS xv
INTRODUCTION xx
CHAPTER 1: Literature Review 1
1.1 Durban South Basin 1
1.2 Health Implications of Ambient Air Pollution Exposure 5
1.2 .1 Particulate matter (PM10) 6
1.2.2 Sulphur dioxide (SO2) 7
1.2.3 Nitric oxide and nitrous oxide (NOx) 8
1.2.4 Carbon monoxide 8
1.2.5 Ozone 8
1.3 Air Pollution and Pregnancy Outcomes 9
1.4 Oxidative Stress 10
1.5 Transcriptional regulation of antioxidant response 12
1.6 Mitochondrial production of ROS 16
1.7 Uncoupling Proteins 18
1.8 Uncoupling Protein 2 20

xvii
CHAPTER 2: MATERIALS AND METHOD 26
2.1. Patient recruitment 26
2.2. Sample preparation 26
2.2.1. Peripheral blood mononuclear cell (PBMC) and serum isolation 27
2.2.2. DNA isolation 27
2.2.3. RNA isolation 28
2.2.4. Protein isolation 29
2.3. Detection of UCP2 -866G/A polymorphism 30
2.3.1. Polymerase chain reaction (PCR) 30
2.3.2 Restriction fragment length polymorphism (RFLP) 32
2.4. Thiobarbituric acid reactive substances assay 34
2.5. ATP luminometry 36
2.6. JC-1 Mitoscreen 38
2.7. Comet assay 40
2.8. Quantitative PCR 42
2.8.1. Mitochondrial DNA damage 42
2.8.2. mRNA expression 43

xviii
2.9. Western Blots 45
2.9.1. Sample preparation 45
2.9.2. SDS-Polyacrylamide gel electrophoresis (SDS-PAGE) 46
2.9.3. Transfer 46
2.9.4. Probing/Detection 48
2.10. Statistical analysis 50
CHAPTER 3 51
3.1. Uncoupling protein2 -866G/A promoter polymorphism 51
3.2. Thiobarbituric acid reactive substances assay 52
3.3. ATP luminometry 54
3.4. Mitochondrial Depolarisation 57
3.5. Comet Assay 59
3.6. Mitochondrial DNA damage 61
3.7. Uncoupling protein2 mRNA expression 63
3.8. Superoxide dismutase 2 mRNA expression 65
3.9. Nuclear erythroid related factor 2 (Nrf2) mRNA 67
3.10. Uncoupling protein2 protein expression 69

xix
3.11. Nuclear erythroid related factor 2 protein (Nrf2) expression 71
CHAPTER 4: DISCUSSION 74
CHAPTER 5: CONCLUSION 81
REFERENCES 83
APPENDIX 1 99
APPENDIX 2 100
xx
INTRODUCTION
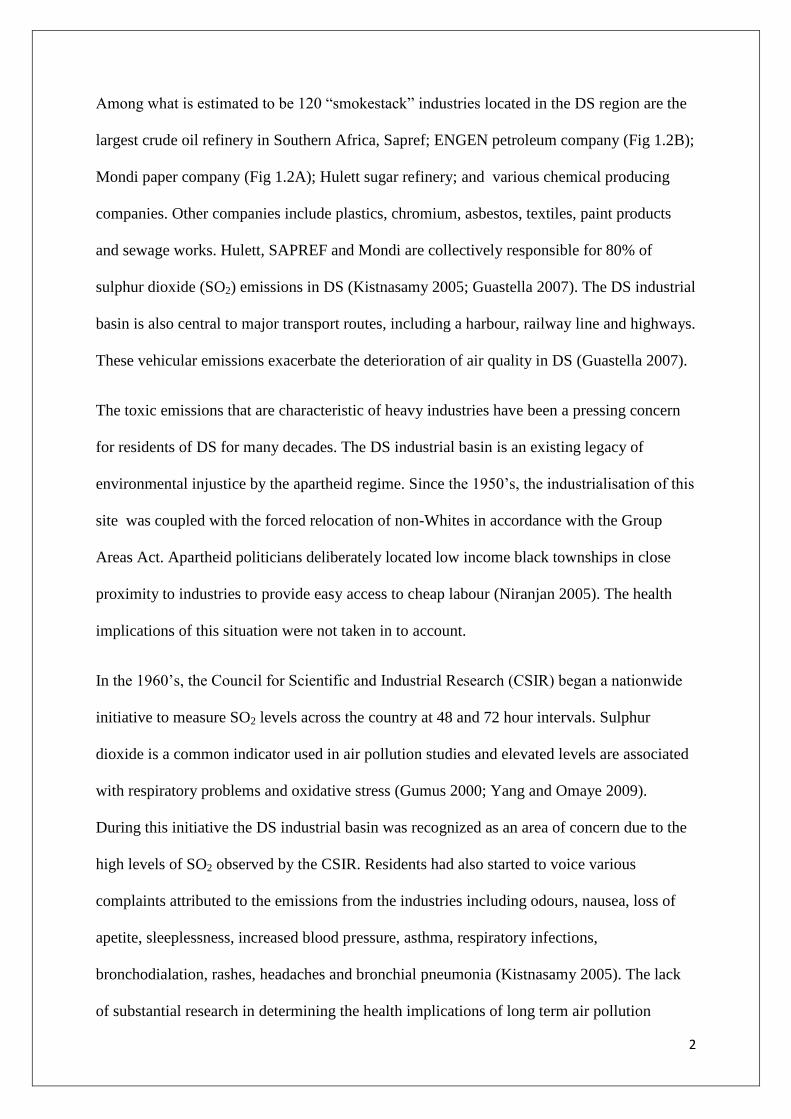
The Durban South (DS) industrial basin in the province of KwaZulu Natal, South Africa
(SA), comprises of a mix of closely situated heavy industrial and residential areas. Studies
have evaluated the association of high air pollutant levels and the incidence of adverse
respiratory health outcomes in the DS basin (Kistnasamy 2005; Niranjan 2005; Guastella
2007). Although air pollutant levels fell below international and national guidelines, high
sulphur dioxide (SO2) and particulate matter (PM10) in DS was associated with acute changes
in health status and moderate to severe asthma in children of school going age (Kistnasamy
2005). An estimate of 600 “smokestack” industries are situated in the DS basin including the
largest oil refinery in SA, petroleum, paper, refined sugar, and asbestos product industries.
The health concerns raised due to the toxic emissions from these industries has led to the
monitoring of air pollutant levels in the DS area. Sulphur dioxide levels have been a concern
in the DS area due to consistently high levels (Kistnasamy 2005; Guastella 2007). Recently,
other air pollutants such as nitrogen dioxide and nitrogen oxide (collectively known as NOx),
carbon monoxide (CO), PM10, ozone (O3) and lead have been detected at high levels in the
DSB (Guastella 2007).
The health risk that long term exposure to AAP poses to humans increased due to the rapid
expansion of industries. Adverse health effects include asthma, chronic obstructive
pulmonary disorders, decreased lung function, cardiovascular disease, cystic fibrosis,
inflammation, cancer, mitochondrial dysfunction and oxidative stress (Künzli, Kaiser et al.
2000; Kelly 2003; Bobak 2005; Liu, Poon et al. 2008; Yang and Omaye 2009; Shrey, Suchit
et al. 2011). Exposure to AAP during pregnancy has been associated with birth outcomes
such as low birth weight, premature birth, pre eclampsia and intra-uterine growth retardation
(IUGR) (Wang, Ding et al. 1997; Bobak 2000; Maroziene and Grazuleviciene 2002;

xxi
Maisonet, Correa et al. 2004). The mechanism by which AAP results in adverse health
outcomes is still not clearly understood. Several adverse birth and health outcomes associated
with AAP exposure have been attributed to oxidative stress (Chahine 2007; Kamdar, Le et al.
2008; Liu, Poon et al. 2008; Castro-Giner 2009; Xu, Xu et al. 2011). Pregnant women have
increased susceptibility to oxidative stress due to altered physiological processes and
increased energy expenditure (Kelly 2003; Sastre-Serra 2010). The DS industrial basin
presents the opportunity to investigate the health implications of long term AAP exposure,
especially in pregnant mothers.
Common air pollutants such as PM10, SO2, CO, O3 and NOx have all been implicated in free
radical production (Kelly 2003; Risom, Møller et al. 2005; Campen 2009; Yang and Omaye
2009). These pollutants generate free radicals by being oxidants themselves, altering
mitochondrial and NADPH oxidase function or initiating an inflammatory response (Kelly
2003).
Reactive oxygen species (ROS) are a natural by product of mitochondrial respiration. The
electron transport chain (ETC), on the inner mitochondrial membrane, drives ATP synthesis
via a proton gradient created by electron flow across the mitochondrial membrane. Oxidative
phosphorylation is the process that drives electron flow through each complex of the ETC.
However, electron “leakage” occurs, mainly at complex I and III, resulting in the production
of superoxide (O2•-) anion radical. When electron transfer at complex I and III is slow or
when mitochondrial membrane potential (Δψm) is elevated, O2•- anion radical production is
increased (Giardina, Steer et al. 2008; Emre and Nubel 2010).
Endogenous antioxidant systems exist to prevent cellular damage by ROS. The major
antioxidant enzymes such as superoxide dismutase (SOD), glutathione peroxidase (GPx),
glutathione reductase (GR), and catalase (CAT) are regulated at the transcriptional level by
xxii
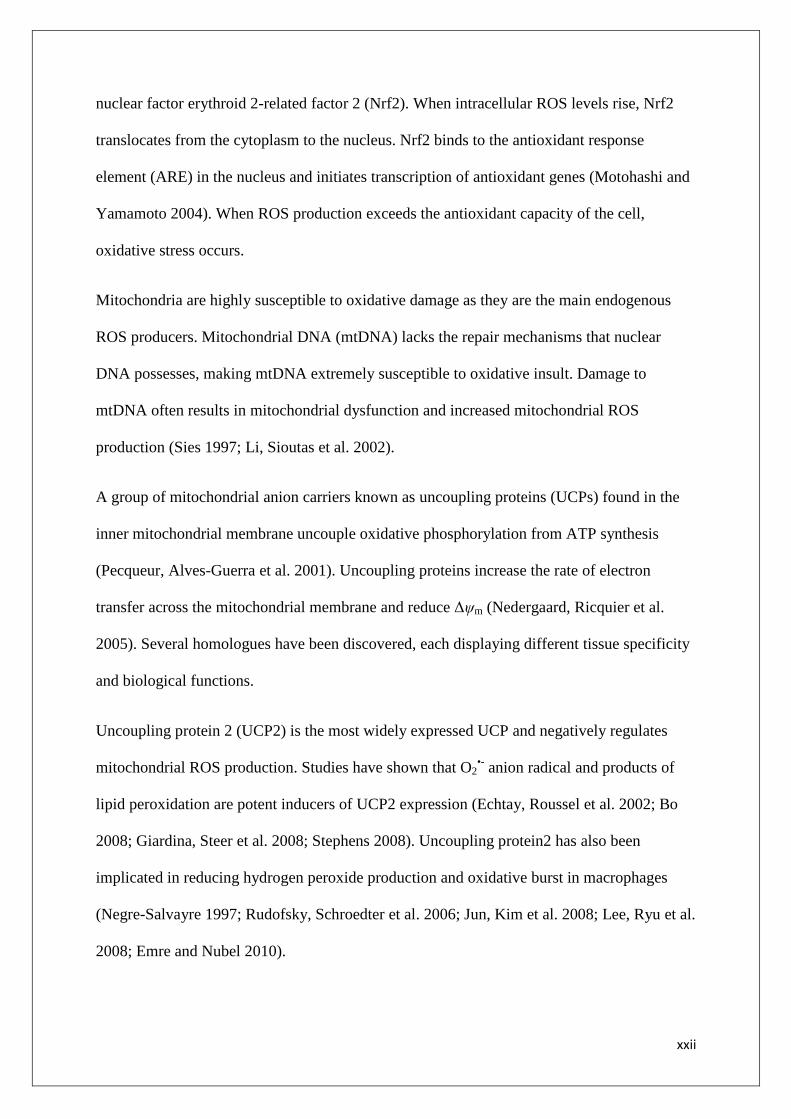
nuclear factor erythroid 2-related factor 2 (Nrf2). When intracellular ROS levels rise, Nrf2
translocates from the cytoplasm to the nucleus. Nrf2 binds to the antioxidant response
element (ARE) in the nucleus and initiates transcription of antioxidant genes (Motohashi and
Yamamoto 2004). When ROS production exceeds the antioxidant capacity of the cell,
oxidative stress occurs.
Mitochondria are highly susceptible to oxidative damage as they are the main endogenous
ROS producers. Mitochondrial DNA (mtDNA) lacks the repair mechanisms that nuclear
DNA possesses, making mtDNA extremely susceptible to oxidative insult. Damage to
mtDNA often results in mitochondrial dysfunction and increased mitochondrial ROS
production (Sies 1997; Li, Sioutas et al. 2002).
A group of mitochondrial anion carriers known as uncoupling proteins (UCPs) found in the
inner mitochondrial membrane uncouple oxidative phosphorylation from ATP synthesis
(Pecqueur, Alves-Guerra et al. 2001). Uncoupling proteins increase the rate of electron
transfer across the mitochondrial membrane and reduce Δψm (Nedergaard, Ricquier et al.
2005). Several homologues have been discovered, each displaying different tissue specificity
and biological functions.
Uncoupling protein 2 (UCP2) is the most widely expressed UCP and negatively regulates
mitochondrial ROS production. Studies have shown that O2•- anion radical and products of
lipid peroxidation are potent inducers of UCP2 expression (Echtay, Roussel et al. 2002; Bo
2008; Giardina, Steer et al. 2008; Stephens 2008). Uncoupling protein2 has also been
implicated in reducing hydrogen peroxide production and oxidative burst in macrophages
(Negre-Salvayre 1997; Rudofsky, Schroedter et al. 2006; Jun, Kim et al. 2008; Lee, Ryu et al.
2008; Emre and Nubel 2010).

xxiii
A common G/A polymorphic variant in the -866 region of the promoter of the UCP2 gene
has been implicated in the expression and function of this protein (Stephens, Dhamrait et al.
2008; Emre and Nubel 2010). Variation in genes involved in oxidative stress response can
possibly influence susceptibility to adverse health outcomes associated with AAP (Kim and
Hong 2012). Despite the rapid pace of industrialisation in Africa, very few studies have been
conducted investigating gene-environment interactions regarding AAP.
This pilot study sought to firstly evaluate oxidative stress markers in women from the DS
industrial basin and compare these to women from the less industrialized Durban North (DN).
Secondly, the functional relevance of the UCP2 -866G/A promoter polymorphism in the
oxidative stress response of women from DS was investigated. The objective of this study
was to determine whether women exposed to higher levels of air pollutants displayed higher
markers for oxidative stress and whether genetic variability in the UCP2 gene affected
susceptibility of these women to oxidative stress. The antioxidant response of women in the
DS basin was also investigated. This is the first study investigating the involvement of UCP2
in air pollution associated oxidative stress, and will give insight into mitochondrial response
to oxidative stress. By identifying genetic and environmental risk factors, more targeted
therapeutic interventions can be put in to place, such as antioxidant administration.

1
CHAPTER 1
LITERATURE REVIEW
1.1 Durban South Industrial Basin
The Durban South (DS) basin is the largest industrial hub of KwaZulu-Natal, contributing 8%
of the gross domestic profit. It is located on the east coast of the SA, extending from the
Durban Central Business District to Umbogintwini. The DS basin is home to some 200 000
inhabitants (Guastella 2007). It consists of the residential areas of Merebank, Wentworth,
Bluff, Clairwood, Isipingo, and Lamontville and the industrial areas of Prospecton and Jacobs
(Fig 1.1). The residential areas are located adjacent to the industrial areas.
Figure 1.1: Map of Durban South industrial basin located on the east coast of South
Africa (Kistnasamy 2005).
2
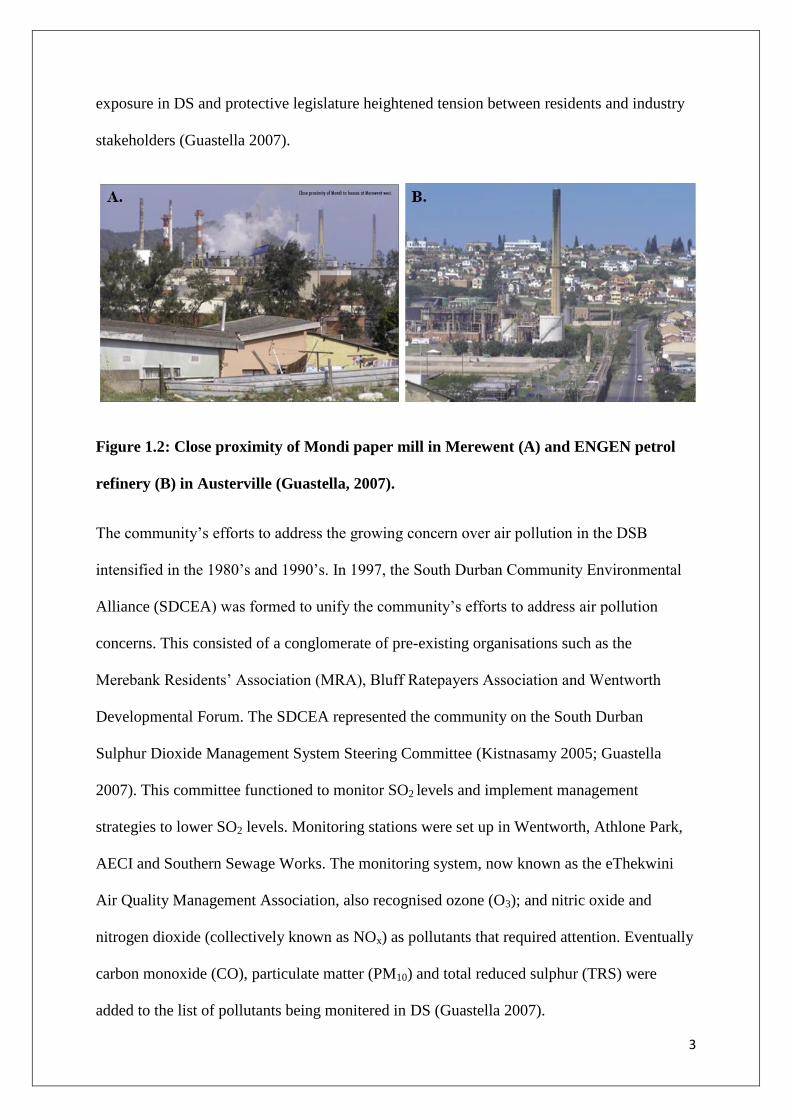
Among what is estimated to be 120 “smokestack” industries located in the DS region are the
largest crude oil refinery in Southern Africa, Sapref; ENGEN petroleum company (Fig 1.2B);
Mondi paper company (Fig 1.2A); Hulett sugar refinery; and various chemical producing
companies. Other companies include plastics, chromium, asbestos, textiles, paint products
and sewage works. Hulett, SAPREF and Mondi are collectively responsible for 80% of
sulphur dioxide (SO2) emissions in DS (Kistnasamy 2005; Guastella 2007). The DS industrial
basin is also central to major transport routes, including a harbour, railway line and highways.
These vehicular emissions exacerbate the deterioration of air quality in DS (Guastella 2007).
The toxic emissions that are characteristic of heavy industries have been a pressing concern
for residents of DS for many decades. The DS industrial basin is an existing legacy of
environmental injustice by the apartheid regime. Since the 1950’s, the industrialisation of this
site was coupled with the forced relocation of non-Whites in accordance with the Group
Areas Act. Apartheid politicians deliberately located low income black townships in close
proximity to industries to provide easy access to cheap labour (Niranjan 2005). The health
implications of this situation were not taken in to account.
In the 1960’s, the Council for Scientific and Industrial Research (CSIR) began a nationwide
initiative to measure SO2 levels across the country at 48 and 72 hour intervals. Sulphur
dioxide is a common indicator used in air pollution studies and elevated levels are associated
with respiratory problems and oxidative stress (Gumus 2000; Yang and Omaye 2009).
During this initiative the DS industrial basin was recognized as an area of concern due to the
high levels of SO2 observed by the CSIR. Residents had also started to voice various
complaints attributed to the emissions from the industries including odours, nausea, loss of
apetite, sleeplessness, increased blood pressure, asthma, respiratory infections,
bronchodialation, rashes, headaches and bronchial pneumonia (Kistnasamy 2005). The lack
of substantial research in determining the health implications of long term air pollution
3
exposure in DS and protective legislature heightened tension between residents and industry
stakeholders (Guastella 2007).
Figure 1.2: Close proximity of Mondi paper mill in Merewent (A) and ENGEN petrol
refinery (B) in Austerville (Guastella, 2007).
The community’s efforts to address the growing concern over air pollution in the DSB
intensified in the 1980’s and 1990’s. In 1997, the South Durban Community Environmental
Alliance (SDCEA) was formed to unify the community’s efforts to address air pollution
concerns. This consisted of a conglomerate of pre-existing organisations such as the
Merebank Residents’ Association (MRA), Bluff Ratepayers Association and Wentworth
Developmental Forum. The SDCEA represented the community on the South Durban
Sulphur Dioxide Management System Steering Committee (Kistnasamy 2005; Guastella
2007). This committee functioned to monitor SO2 levels and implement management
strategies to lower SO2 levels. Monitoring stations were set up in Wentworth, Athlone Park,
AECI and Southern Sewage Works. The monitoring system, now known as the eThekwini
Air Quality Management Association, also recognised ozone (O3); and nitric oxide and
nitrogen dioxide (collectively known as NOx) as pollutants that required attention. Eventually
carbon monoxide (CO), particulate matter (PM10) and total reduced sulphur (TRS) were
added to the list of pollutants being monitered in DS (Guastella 2007).

4
In 2003, the eThekwini Air Quality Management Association was replaced by the South
Durban Basin Multi-Point Plan. The Multi-Point Plan (MPP), which extended efforts to
implement change in the regulation of emissions by industries in the DS basin. The DS
industrial basin was recognised as having one of the highest SO2 levels in the country and
media coverage was given on heightened incidences of cancer and respiratory disease in the
region. This was substantiated by a study in 1991 by Dr B Kistnasamy, who showed a higher
incidence of respiratory illnesses in a school in Merebank when compared to a school in
Chatsworth (Kistnasamy 1991). In 2004 a study was undertaken to investigate the incidence
of asthma in the Settlers’ School in Merebank. It was found that elevated levels of SO2 and
PM10 increased the risk of asthma in the school when compared to a control school in
Chatsworth (Kistnasamy 2005). Since the implementation of the MPP, the Wentworth,
Southern Works and Settler’s monitering stations were recognized as ‘hotspots” regarding
SO2 levels (Fig 1.3). The MPP is still in place, continuing efforts to reduce pollutant
emissions from industries without compromising economic development. Currently, four
pollutants are being monitored on a daily basis in DS i.e. SO2, PM10, nitrous oxide and ozone.

5
Figure 1.3: Sulphur dioxide distribution at the three monitoring stations with the
highest SO2 readings from 1997-2006 (Guastella, 2007).
The DS industrial basin provides an opportunity to investigate health implications of long
term exposure to ambient air pollution. Studies have already been done regarding the social
effects (Jaggernath 2010) and health outcomes (Kistnasamy 2005; Niranjan 2005). However,
no studies have been performed investigating genetic and biological risk factors.
1.2 Health Implications of Ambient Air Pollution Exposure
Air pollution caused by industrialisation is not a problem isolated to DS. It is a globally
recognized concern, with interest peaking in recent years due to the rapid expansion of
industries (Brunekreef 2002). The health outcomes of ambient air pollution (AAP) exposure
have been well discussed in literature. A correlation between AAP exposure and increased
morbidity and mortality has been observed in epidemiological studies (Künzli, Kaiser et al.
2000). Exposure to AAP has been associated with asthma (Li 2003; Li, Hao et al. 2003;
Kistnasamy 2005; Castro-Giner 2009), COPD (Li 1996; Yang and Omaye 2009), decreased

6
lung function (Li 1996; Pope 2002; Liu, Poon et al. 2008), cardiovascular disease (Stephens
2008; Shrey, Suchit et al. 2011), cystic fibrosis (Kamdar, Le et al. 2008), inflammation (Li
1996; Liu, Poon et al. 2008), cancer (Pope 2002), mitochondrial dysfunction (Xu, Xu et al.
2011) and oxidative stress (Kelly 2003; Risom, Møller et al. 2005; Castro-Giner 2009; Yang
and Omaye 2009; Bigagli 2011).
The most commonly studied air pollutants are SO2, NOx, PM10, CO and recently O3. The
exact mechanism by which air pollution exposure exerts toxicity is difficult to determine as
pollutant levels vary among microenvironments, and possible interactions between pollutants
need to be taken in to account.
1.2 .1 Particulate matter (PM10)
Particulate matter can be solid or liquid, or a mixture of solid and liquid particles suspended
in the air (Brunekreef 2002). It is a by product of fossil fuel combustion and commonly used
as an indicator of air pollution (Künzli, Kaiser et al. 2000). Particulate matter is usually
defined by its size in diameter, e. g. PM10 =10µm in diameter. Particulate matter equal to or
less than 10µm in diameter have been associated with increased morbidity and mortality (Li
2003). Exposure to PM10 has been implicated in life-shortening, non-malignant respiratory
and cardiopulmonary deaths, lung cancer and asthma (Brunekreef 2002). One proposed
mechanism by which PM10 exerts toxicity is via the induction of oxidative stress (Li 1996).
These particulates can contain soluble metals, including transition metals that are capable of
redox reactions. Polycylclic aromatic hydrocarbons (PAHs) that are adsorbed in PM10 are
capable of forming DNA adducts, and of being biotransformed by cytochrome P450 enzymes
to free radicals (Kelly 2003). Particulate matter is also capable of generating ROS by altering
mitocondrial function or NADPH oxidase activity, initiating an inflammatory response or
direct generation from the particles surface. Oxidative stress induced by PM10 has been found

7
to result in DNA damage (Risom, Møller et al. 2005). Particulates have also been found to
induce proinflammatory (Li 1996) and allergic response that can contribute to acute asthma
attacks (Li 2003) and increased blood viscosity (Maisonet, Correa et al. 2004).
1.2.2 Sulphur dioxide (SO2)
Sulphur dioxide occurs ubiquitously in the air and is a characteristic emission of industrial
processes (Gumus 2000; Pope 2002; Yang and Omaye 2009). This gas has been linked with
cardiopulmonary disease and various respiratory disorders including bronchoconstriction in
asthmatics, allergic reactions and lung cancer (Ziqiang Meng 2003). It is inhaled through the
respiratory tract and enters the blood stream, allowing distribution through out the body. In an
aqueous environment, SO2 is converted to its free radical form, SO2-• (Gumus 2000). Health
implications of SO2 exposure include allergic reactions, bronchoconstriction in asthmatics;
ischeamic cardiac events and lung cancer (Meng 2007). Although the exact mechanism by
which SO2 exerts its toxicity is unclear, oxidative stress plays a role in SO2 toxicity. Meng et
al. found that SO2 (112mg/m3) decreased antioxidants superoxide dismutase (SOD) and
glutathione peroxidase (GPx) expression in mice. At lower concentrations SO2 was found to
increase antioxidant response as well as ROS generation (Meng, Qin et al. 2003). Other
studies have shown that SO2 caused elevated lipid peroxidation in mice brains, liver (Meng,
Qin et al. 2003), lungs, heart (Meng, Qin et al. 2003), and testicles (Meng and Bai 2004). It
has also been found to be genotoxic to humans (Ziemann, Hansen et al. 2010) and decrease
serum vitamin C and ceruloplasmin (Gumus 2000). Sulphur dioxide has gene altering
capabilities, particularly with regard to genes involved in the electron transport chain. It has
been found to upregulate the expression of ATPase inhibitor genes and decrease the
expression of the cytochrome c oxidase gene. Inhibition of the electron transport chain
promotes formation of mitochondrial-derived ROS (Meng 2007).
8
1.2.3 Nitric oxide and nitrous oxide (NOx)
The major source of NOx emmissions are vehicles. Concentrations of NOx peak during high
traffic hours in the morning and in the afternoon. Unlike PM10 and SO2, NOx is not a spatially
distributed pollutant. Nitric oxide (NO) exists endogenously, and plays a vasodilatory
function in endothelial cells and smooth muscle (Loh, Stamler et al. 1994). Nitric oxide itself
is not toxic, however secondary reactive nitrogen species (RNS) can be derived when NO
interacts with other free radicals. Nitric oxide can react with O3 to form NO2 or it can be
converted to peroxynitrite by O2•- (Campen 2009). Exposure to NO has been associated with
lung disease and atherosclerosis (Barnes 1993; Quyyumi 1995). Nitrogen dioxide is soluble
in aqueous solutions and forms a nitrogen centred free radical when dissolved in lung lining
fluid (Kelly 2003). Nitrogen dioxide activates oxidant pathways, resulting in T lymphocyte
and macrophage recruitment. It increases the risk of infection by impairing the function of
alveolar macrophages (Brunekreef 2002).
1.2.4 Carbon monoxide
Carbon monoxide is a common pollutant produced from vehicle emissions, industrial
processes and burning of fossil fuels. This gas exerts its toxicity by competitive inhibition of
oxygen transport. Carbon monoxide has a higher affinity for haemoglobin than oxygen.
Carbon monoxide binds to haemoglobin, forming carboxyhaemoglobin, and thus reduces
oxygen transport by haemoglobin. Health manifestations of CO exposure include headaches,
fatigue and cardiovascular disorders (Shrey, Suchit et al. 2011).
1.2.5 Ozone

9
In recent years, concerted efforts have been made to reduce air pollutants released from
burning of fossil fuels. However, concern has been raised over photochemical pollutants,
such as O3.
Ozone is the product of a sunlight reacting with NO2 or hydrocarbons. Nitric oxide, a
common pollutant from vehicles, is converted to NO2 by O3. The uptake of O3 is directly
related to the amount of substrate available. In the lung lining fluid, O3 forms ozonation free
radical products (Kelly 2003). Being a potent oxidizing agent, O3 activates stress signalling
pathways, causing a proinflammatory response in lung epithelial cells and alveolar
macrophages. The inflammatory response can result in bronchoconstriction, which is
characteristic of asthma. Ozone also increases IgE production, causing hypersensitivity
(Brunekreef 2002). Other symptoms of O3 include decreased lung function, pulmonary
inflammation and exacerbation of symptoms in asthmatics (Kelly 2003).
1.3 Air Pollution and Pregnancy Outcomes
Exposure to AAP during pregnancy has been associated with adverse birth outcomes such as
low birth weight, pre-term delivery (< 37 weeks gestation) and intra-uterine growth
retardation (IUGR) (Wang, Ding et al. 1997; Dejmek 2000; Maroziene and Grazuleviciene
2002; Maisonet, Correa et al. 2004; Bobak 2005). The mechanisms by which AAP exposure
affects pregnancy outcomes is still not clearly understood. Carbon monoxide can retard foetal
growth due to reduced oxygen transport to the foetus. Particle matter has been found to
increase blood viscosity thus compromising placental function (Maisonet, Correa et al. 2004).
Exposure to PAHs that are adsorbed in PM10 results in the formation of DNA adducts. It was
found that PAHs can pass through the placenta, exposing the foetus to PAHs. Babies with
higher PAH-DNA adducts had impaired growth when compared to those with lower adduct

10
levels (Maisonet, Correa et al. 2004). Taking these factors in to account could explain
impaired foetal growth. Furthermore, exposure to air pollution during childhood also has
adverse health outcomes. The first 6 years of childhood are critical for lung and immune
development. Childhood exposure to air pollution has been found to result in decreased lung
development, cardiovascular and pulmonar disorders and asthma (Schwartz 2004).
Oxidative stress during pregnancy has been observed to have similar birth outcomes to those
associated with AAP exposure (Al-Gubory 2010). Pregnant women are at an increased risk of
developing oxidative stress due to the offset of physiological processes, hormonal changes
and increased energy expenditure (Masaki 1999; Kelly 2003). Increases in oestrogen levels
during pregnancy have been found to increase ROS production by mitochondria (Sastre-Serra
2010). Oxidative stress during pregnancy has been implicated in birth outcomes such as
preeclampsia, embryonic resorption, spontaneous pregnancy loss, IUGR and foetal death (Al-
Gubory 2010). Considering exposure to common air pollutants such as SO2, PM10, CO, NOx,
O3 all induce oxidative stress, this could be a possible mechanism by which air pollutants
cause adverse birth outcomes.
1.4 Oxidative Stress
Gaining an understanding of the biological mechanisms by which specific pollutants exert
adverse health outcomes will allow a targeted approach (e.g. antioxidant administration) to
prevention and treatment of AAP induced health problems. Many of the discussed pollutants
are either free radicals in nature or have the ability to drive free radical production. This
implicates oxidative stress as a possible mechanism of AAP exposure toxicity.

11
Oxidative stress is a term first used by Sies in 1991(Sies 1991). This term refers to a
condition whereby the balance between circulating free radicals and antioxidants are
disrupted, favouring the former (Fig 1.4). Free radicals, which include reactive oxygen
species (ROS) and reactive nitrogen species (RNS), have an unpaired valence electron,
making them extremely reactive. The free electron is capable of oxidising neighbouring
molecules by “stealing” electrons (Kelly 2003; Ježek and Hlavatá 2005). The oxidizing
potential of free radicals pose as a potential threat as they could alter the structure, and thus
function, of cellular components such as lipids, proteins and DNA. Free radical damage is
associated with elevated intracellular calcium levels, DNA strand breaks and base
modification (Poston and Raijmakers 2004).
Reactive oxygen species are natural by products of cellular respiration, hence mitochondria
are the most abundant endogenous source (Turrens 2003; Ježek and Hlavatá 2005). They play
a role in normal physiological functions of the cell such as cell signalling, apoptosis and
immunity (Hensley, Robinson et al. 2000; Thannickal and Fanburg 2000; Turrens 2003;
Ježek and Hlavatá 2005; Sanjuán-Pla, Cervera et al. 2005). To counteract the potentially
dangerous effects of ROS, an antioxidant defence mechanism is in place to scavenge free
radicals. Antioxidants can occur intracellularly or be administered by dietary means (Seifried,
Anderson et al. 2007; Al-Gubory 2010). Oxidative stress occurs when there is an
overproduction of ROS, owed to increased endogenous production, exposure to a toxin, or a
depletion of antioxidants.

12
Figure 1.4: Schematic representation of oxidative stress mechanism of toxicity. When
free radical content exceeds antioxidant capacity, more free radicals are free to oxidize
neighbouring molecules, resulting in oxidative damage (Kelly, 2003).
Oxidative stress has been implicated in various pathological conditions such as
atherosclerosis, hypertension, ischemia reperfusion injury, cystic fibrosis, cancer, type 2
diabetes, inflammation, neurodegenerative diseases and aging (Nordberg and Arnér 2001;
Kelly 2003; Ježek and Hlavatá 2005; Bo 2008; Stephens 2008; Salpea, Talmud et al. 2010).
The mechanism by which free radicals exert toxicity is due to the oxidizing of DNA, proteins
and lipids.
Attack of lipid membranes by free radicals results in lipid peroxidation. Oxidation of fatty
acids leads to the production of fatty acid free radicals that are capable of oxidizing
neighbouring fatty acids. This results in a chain reaction in lipid membranes, with
neighbouring fatty acid radicals generating more free radicals (Poston and Raijmakers 2004).
The cell membrane becomes compromised and this leads to increased apoptosis or necrosis.
Mitochondrial swelling and the release of hydrolytic enzymes from lysosomes have also been
observed as events following lipid peroxidation (Meng 2007).
Reactive oxygen species are capable of iniating caspase activity thus increasing cell death.
Free radical interaction with DNA causes mutations and strand breaks (Poston and

13
Raijmakers 2004). This is a possible mechanism for oncogenesis. Oxidative stress also results
in mitochondrial damage by attack of mtDNA which has implications for metabolism, cell
death and further generation of ROS. (Turrens 2003; Ježek and Hlavatá 2005).
1.5 Transcriptional regulation of antioxidant response
Since most cells have had to evolve in an oxygen environment, intricate and tightly regulated
antioxidant defence systems have developed to minimize ROS toxicity. Antioxidant systems
include phenolic compounds, vitamins A, E and C, and various enzymatic antioxidants (Sies
1997; Nordberg and Arnér 2001; Ziqiang Meng 2003; Sanjuán-Pla, Cervera et al. 2005;
Seifried, Anderson et al. 2007; Al-Gubory 2010).
Recent studies have recognised a transcription factor, nuclear factor erythroid 2-related factor
2 (Nrf2), as an indespensible regulator in the inducible expression of numerous important
detoxifying and antioxidant enzymes. This transcription factor belongs to the Cap ‘n’ Collar
family of bZIP transcription factors. The transcription of various phase II detoxifying
enzymes and various antioxidant enzymes such as glutathione-S-transferase (GST), GPx,
heme oxygenase 1 (HO-1), SOD, thioredoxin reductase and peroxidase, catalase (CAT) and
NADPH:quinone oxidoreductase (NQO1) are all induced by activation by Nrf2 (Motohashi
and Yamamoto 2004; Jung 2010; Taguchi 2011).
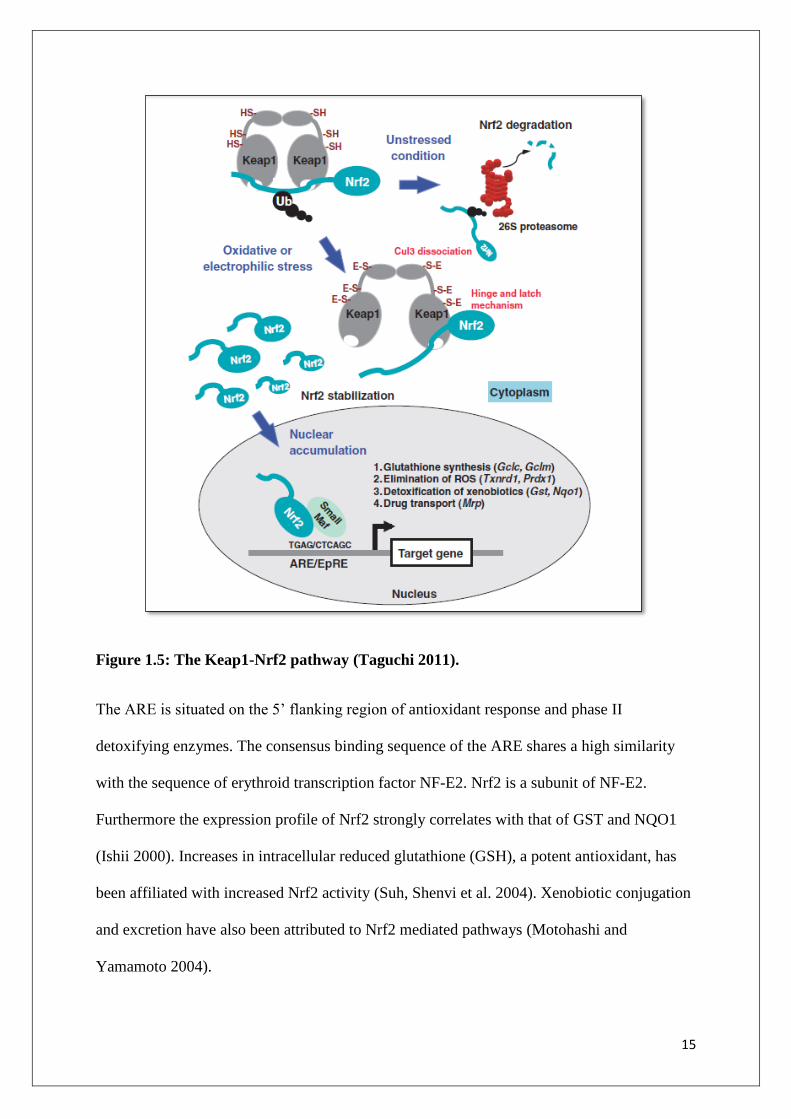
The mechanism by which Nrf2 induces the transcription of stress response genes is shown in
Figure 1.5. This process is tightly regulated. Under normal conditions, Nrf2 remains bound to
Kelch like ECH-associated protein 1 (Keap1) in the cytoplasm. Kelch like ECH-associated
protein 1 is an actin binding protein that binds to the N terminal of the Neh2 domain of Nrf2,
tethering it in the cytoplasm (Ishii 2000). This represses translational activity of Nrf2. Kelch

14
like ECH-associated protein 1 acts as an adaptor for a Cullin 3 (Cul3)-dependant ubiquitin
ligase complex. The ubiquitin ligase marks Nrf2 for degradation by cytoplasmic proteasomes
(Motohashi and Yamamoto 2004).
The cysteine residues on Keap1 act as a sensor for electrophiles. When ROS levels rise,
Keap1 interacts with Cul3 so that the sulfhydryl group of Keap1 is degraded, compromising
the bond between Nrf2 and Keap1 and the degradation process of Nrf2 ceases. 15-deoxy-D12,
14-prostaglandin J2 (15d-PGJ2) covalently binds to Keap1, facilitating the translocation of
Nrf2 in to the nucleus. Like all Cap ‘n’ Collar transcription factors, Nrf2 needs to form a
heterodimer with a partner protein to function. In the nucleus, Nrf2 forms a heterodimer with
small Maf proteins and binds to the antioxidant response element (ARE), initiating the
transcription of Nrf2 target genes (Motohashi and Yamamoto 2004; Taguchi 2011).
15
Figure 1.5: The Keap1-Nrf2 pathway (Taguchi 2011).
The ARE is situated on the 5’ flanking region of antioxidant response and phase II
detoxifying enzymes. The consensus binding sequence of the ARE shares a high similarity
with the sequence of erythroid transcription factor NF-E2. Nrf2 is a subunit of NF-E2.
Furthermore the expression profile of Nrf2 strongly correlates with that of GST and NQO1
(Ishii 2000). Increases in intracellular reduced glutathione (GSH), a potent antioxidant, has
been affiliated with increased Nrf2 activity (Suh, Shenvi et al. 2004). Xenobiotic conjugation
and excretion have also been attributed to Nrf2 mediated pathways (Motohashi and
Yamamoto 2004).

16
Considering the major role Nrf2 plays in antioxidant response, the Keap1-Nrf2 mechanism
has become a target for therapies for oxidative stress related diseases. The role of Nrf2 in the
pathogenesis of COPD has been evaluated. It was found that the stabilizer protein, DJ-1, was
expressed at extremely low levels in patients with COPD. This resulted impaired Nrf2
mediated antioxidant response, contributing to the pathogenesis of COPD (Malhotra,
Thimmulappa et al. 2008). Long term exposure to oxidative stress can also deplete DJ-1
levels and could have possible implications for Nrf2 function (Giaime 2012). Disruption or
impairment of Nrf2 function was also found to increase sensitivity to allergen induced asthma
(Li 2004; Rangasamy 2005) and diesel exhaust induced DNA damage (Aoki 2001).
Decreased sensitivity to apoptosis has also been observed as an outcome of Nrf2 activity,
possibly implicating Nrf2 in cell survival (Ishii 2000). One of the Nrf2 target genes, Pparg,
encodes for peroxisome proliferator activated receptors (PPARs) which plays a role in cell
cycle regulation. Peroxisome proliferator activated receptors are a super family of ligand-
activated nuclear hormone receptor transcription factors. They are divided into 3 isomers (α;
β; γ). Peroxisome proliferator activated receptor γ (PPARγ) regulates several genes involved
in plays inflammatory and oxidative stress response (Fig 1.6). Major antioxidants such as
CAT and HO-1 are transcriptionally regulated by PPARγ. Increased activity of PPARγ also
induces expression of the mitochondrial ROS regulator uncoupling protein 2 (Polvani 2012).
The effects of this protein will be discussed later. Peroxisome proliferator activated receptor γ
is also an agonist against 15d-PGJ2, suggesting a synergistic relationship between Nrf2 and
PPARγ. Lower expression or absence of Nrf2 and PPARγ has been found to result in
oxidative stress (Polvani 2012)

17
Figure 1.6: Gene targets of PPARγ (Polvani 2012).
1.6 Mitochondrial production of ROS
The mitochondrion is the energy generating organelle of the cell. Its main function is ATP
synthesis. ATP synthesis is driven by an electrochemical potential gradient across the inner
mitochondrial membrane, thus allowing the re-entry of protons into the mitochondrial matrix
(Cadenas 2004). This gradient is created by the transfer of electrons from a reduced substrate,
mainly NADH and FADH, through a consecutive series of complexes located on the inner
mitochondrial membrane (Fig 1.7). As electrons are passed from one complex to the next, the
electrochemical potential gradient increases. The final acceptor of the electron is oxygen
(O2), with water being the end product. The enzymatic transfer of electrons is known as
oxidative phosphorylation. This process of oxidative phosphorylation is not water tight,
hence not all of the electrons derived from NADH or FADH go towards ATP production. A
small percentage of electrons escape. These electrons can react with O2 to form superoxide
(O2•-) anion radical (Brand 2004).

18
Figure 1.7: The electron transport chain. Complex I and III have been identified as the
main source of superoxide production due to electron leakage at these points. Complex I
releases superoxide into the mitochondrial matrix. Complex III releases superoxide into
both the matrix and intermembrane space (Matsuzaki et al. 2009).
The production of O2•- anion radical by mitochondria is a naturally occurring process and
plays a physiological role, particularly with regard to cell signalling (Cadenas 2004;
Matsuzaki, Szweda et al. 2009). However, when there is an influx of oxygen, or a blockage
or defect in the functioning of the complexes, the number of electrons that escape increases
(Giardina, Steer et al. 2008). This leads to more O2•- anion radical production. Complex I and
III are the points in the electron transport chain (ETC) with the highest escape of electrons
(Echtay, Roussel et al. 2002; Brand 2004; Cadenas 2004). Many toxins exert their toxicity by
altering the functioning of the complexes and enzymes involved in the ETC (Giardina, Steer
et al. 2008). Impaired functioning of ATPase and cytochrome c oxidase favour ROS
production (Meng 2007).
Superoxide is the most common mitocondrially derived free radical. The antioxidant enzyme
Mn-SOD is responsible for converting O2•- anion radicals to hydrogen peroxide (H2O2) in the
mitochondrial matrix (Cadenas 2004). Hydrogen peroxide is then converted to water and

19
oxygen by either CAT or GPx. Although H2O2 is not highly reactive, in the presence of
ferrous ions it can form hydroxyl radicals via the Fenton reaction (Nègre-Salvayre 1997;
Brand 2004; Giardina, Steer et al. 2008). Overproduction of O2•- by mitochondria can also
lead to mitochondrial DNA damage and mutations. Implications of mitochondrial DNA
damage include impaired respiration, apoptosis via the intrinsic pathway and increased
mitochondrial derived ROS (Meng 2007). Since mitochondria are the main source of
endogenous ROS, many diseases and pathological conditions associated with oxidative
damage have been linked to defective mitochondria (Matsuzaki, Szweda et al. 2009).
1.7 Uncoupling Proteins
Mitochondria are the main endogenous source of ROS (Giardina, Steer et al. 2008).
Naturally, a regulatory system needs to be in place to control ROS production by
mitochondria. A family of anion carriers, known as uncoupling proteins (UCPs) are located
on the inner mitochondrial membrane. These proteins function to uncouple oxidative
phosphorylation from ATP synthesis by increasing proton conductance across the
mitochondrial membrane, resulting in energy being dissipated as heat as shown in Figure 1.8
(Kovacs 2005; Rudofsky, Schroedter et al. 2006; Emre and Nubel 2010). Various
homologues of this protein have been identified. The most commonly studied mammalian
UCPs are UCP1, UCP2, UCP3, and to a lesser extent UCP4 and UCP5. Expression and
function of the different UCPs vary among different tissues. Mild uncoupling by UCPs plays
a role in various physiological processes including thermogenesis (Boss 1998), metabolism
(Masaki, Yoshimatsu et al. 1999; de Souza 2012), the regulation of mitochondrial ROS
production (Echtay, Roussel et al. 2002; Krauss, Zhang et al. 2002; Bo 2008) and ATP
synthesis (Krauss, Zhang et al. 2002).

20
Figure 1.8: Diagramatic representation of the mechanism by which UCPs reduce
mitochondrial membrane potential. The electron transport chain creates an
electrochemical potential gradient across the inner mitochondrial membran by
releasing protons into the inter mitochondrial space. This gradient favours the passing
of protons through the ATP synthase complex, facilitating ATP production. Uncoupling
proteins increase conductance of protons into the mitochondrial matrix, lowering
mitochondrial membrane potential and ATP synthesis (Space 2012).
Uncoupling protein 1 is the most well characterised of the UCPs. This protein is exclusively
expressed in brown adipose tissue. This protein is regulated at the transcriptional level and it
is regulated by the sympathetic nervous system. The main function of UCP1 is in
thermogenesis by uncoupling substrate oxidation from ATP synthesis (Nedergaard, Ricquier
et al. 2005). Purine nucleotides (e. g. GDP, ATP and ADP) inhibit UCP1 and regulate activity
of this protein. Under cold conditions, intracellular triacylglycerides release fatty acids. These
fatty acids overcome purine nucleotide inhibition of UCP1, allowing heat production (Brand
2004; Nedergaard, Ricquier et al. 2005).
Up until 1997, UCP1 was the only identified UCP (Boss 1998). Thereafter, 4 more
homologues were discovered (UCP2, UCP3, UCP4, UCP5). The homologues of UCP1 share

21
similar nucleotide sequences, but evidence for similar function in thermogenesis is weak
(Nedergaard, Ricquier et al. 2005). Both UCP2 and UCP3 are expressed in different tissues
than UCP1. Uncoupling protein 3 is mainly expressed in skeletal muscle (Bo 2008) while
UCP2 is ubiquitously expressed. The role of UCPs in processes other than thermogenesis
became evident.
Expression of both UCP2 and UCP3 were found to be induced in the presence of O2•- anion
radicals (Nedergaard, Ricquier et al. 2005). This lead to the hypothesis that they play a role in
the negative regulation of ROS production by mitochondria and energy expenditure (Brand
2004). Mild uncoupling by UCP2 and UCP3 increases proton conductance, thus lowering
mitochondrial membrane potential while increasing O2 utilization, leading to reduced
mitochondrial ROS production. Uncoupling protein4 and UCP5 play a similarly protective
role in neuronal cells. They have also been found to have cytoprotective properties in these
cells (Nedergaard, Ricquier et al. 2005).
1.8 Uncoupling Protein 2
Uncoupling protein 2 is ubiquitously expressed throughout the body in tissues such as lung,
spleen, brain, kidney, intestine and cells such as macrophages, lymphocytes, and pancreatic
islet cells (Reis, Dubois-Laforgue et al. 2004; Nedergaard, Ricquier et al. 2005; De Souza,
Araújo et al. 2007; Emre and Nubel 2010). It has a much shorter half life than UCP1
(Rousset, Mozo et al. 2007) and is tightly regulated at a translational level (Pecqueur, Alves-
Guerra et al. 2001; Hurtaud, Gelly et al. 2006; Giardina, Steer et al. 2008; Emre and Nubel
2010). Peroxisome proliferator-activator receptorγ (PPARγ) , sterol regulatory element-
binding protein 1 (SREBP-1c), O2•- anion radicals, and free fatty acids are all potent
stimulators of UCP2 expression (Nedergaard, Ricquier et al. 2005; Baffy 2010). Thyroid
22
hormones, TNF-α, plasma glucose, corticosteroids, prostaglandins and leptin have also been
found to influnce UCP2 expression (Masaki 1999).
Although UCP2 is regulated at a translational level, most studies investigated UCP2 mRNA
expression, rather than protein expression of UCP2 as no reliable anti-UCP2 antibody had
been developed until recently (Fleury and Sanchis 1999; Pecqueur, Alves-Guerra et al. 2001).
No correlation in UCP2 gene, mRNA and protein expression has been identified (Pecqueur,
Alves-Guerra et al. 2001; Giardina, Steer et al. 2008).
Uncoupling protein 2 has gained attention in recent years due to its role in energy
metabolism. Expression of UCP2 has been found to favour oxidation of fatty acids and
glutamine over glucose-derived pyruvate (De Souza, Araújo et al. 2007; Emre and Nubel
2010) and inhibit lipogenesis (Reis, Dubois-Laforgue et al. 2004). This led to interest in the
role of UCP2 in obesity (De Souza, Araújo et al. 2007; Jun, Kim et al. 2008). It has been
found to negatively regulate insulin secretion and has been linked to beta cell dysfunction,
thus making it a target for diabetes studies (Kovacs 2005). The role of UCP2 in energy
expenditure is also identified in late pregnancy, due to upregulation of UCP2 in the uterus
during pregnancy (Masaki 1999).
Uncoupling protein 2 has been identified as the major UCP expressed in immune cells and
has thus been implicated in immune and inflammatory response. It is down regulated during
oxidative burst in macrophages (Emre and Nubel 2010). Macrophages from UCP2-null mice
were found to produce excessive amounts of O2•- anion radicals (Nedergaard, Ricquier et al.
2005). Expression of UCP2 reduces ATP production, thus affecting ATP-dependant
inflammatory processes such as exocytosis of lysozymes and cytokine production are reduced
(Emre and Nubel 2010). Uncoupling protein 2 also regulates NO production by macrophages
in response to lipopolysaccharides (Vogler 2005). This has led to interest in the involvement

23
of UCP2 in inflammatory diseases such as rheumatoid atherosclerosis, systemic lupus
erythematosus, and Crohn’s disease (Emre and Nubel 2010; Salpea, Talmud et al. 2010).
Evidence that UCP2 functions to regulate ROS production has been growing in recent years.
Superoxide production causes the accumulation of UCP2 in the mitochondria (Giardina, Steer
et al. 2008), while UCP2 up regulation reduces H2O2 production by mitochondria (Nègre-
Salvayre 1997). The over expression of UCP2 in cardiomyocytes was found to protect against
ROS-induced apoptosis (Bo 2008). The proposed mechanism is that O2•- anion radicals and
products of lipid peroxidation stimulate UCP2 expression, which increases the proton
conductance of the inner mitochondrial membrane, thus reducing membrane potential and
lowering ROS production. The increased consumption of O2 due to uncoupling results in less
O2 being available for one electron reduction to a O2•- anion radical (Boss 1998).
Many studies have investigated the protective role of UCP2 against diseases and disorders
associated with oxidative damage such as retinopathy and neuropathy in diabetics (Rudofsky,
Schroedter et al. 2006; de Souza 2012), coronary heart disease (Stephens 2008),
neurodegenerative disorders like Alzheimer’s and multiple sclerosis (Vogler 2005; Emre and
Nubel 2010; Salpea, Talmud et al. 2010), and recently cancer (Baffy 2010; Sastre-Serra
2010).
Four single nucleotide polymorphisms (SNPs) have been identified in the UCP2 gene (Lee,
Ryu et al. 2008). The most common SNP is the UCP2-866G/A SNP in the promoter of the
UCP2 gene has been studied in relation to its potential role in diseases such as diabetes,
obesity and metabolic syndrome (Lim 2012). This genetic variant has been implicated in the
expression, functioning and stability of UCP2 (Reis, Dubois-Laforgue et al. 2004; Vogler
2005; Rudofsky, Schroedter et al. 2006). Results from studies on this polymorphism have
been controversial. The homozygous A genotype is the least frequent SNP and is associated

24
with increased mRNA expression in adipose tissue (Reis, Dubois-Laforgue et al. 2004) but
lower expression in pancreatic β cells (Stephens, Dhamrait et al. 2008). The same genotype
was found to have lower expression than the homozygous G genotype in human retina (De
Souza 2012). This genotype was found to decrease insulin secretion in Caucasians in an
Italian study, but increased insulin secretion in Caucasians in Northern Europe (Kovacs
2005). This genotype was also associated with higher markers for oxidative stress in smokers
when compared to the wild type GG genotype (Stephens, Dhamrait et al. 2008).
The homozygous G genotype has been associated with reduced risk of developing type 2
diabetes in middle-aged obese humans (Kovacs 2005), increased insulin response to glucose,
and decreased circulating triacylglycerides and LDL cholesterol in diabetics (Reis, Dubois-
Laforgue et al. 2004). This genotype has also been implicated in inflammatory disorders, as
this SNP is linked to decreased UCP2 expression in macrophages and lymphocytes (Vogler
2005; Emre and Nubel 2010). Lower UCP2 expression leads to excessive production of O2•-
anion radicals by immune cells, thus contributing to increased susceptibility to inflammatory
diseases like carotid atherosclerosis, multiple sclerosis, rheumatoid arthritis, and lupus. The
GG genotype has also been found to favour neuropathy in type 1 diabetes (Emre and Nubel
2010).
The GA polymorphism is a commonly observed SNP. There are conflicting results regarding
the role of this SNP on UCP2 expression. Some authors suggest this genotype is associated
with lower mRNA expression in adipose cells (Salpea, Talmud et al. 2010) while others have
observed increased mRNA expression of UCP2 (Kovacs 2005; Rudofsky, Schroedter et al.
2006). This genotype has been associated with inflammatory markers (Emre and Nubel
2010), increased markers for oxidative stress in diabetic smokers (Salpea, Talmud et al. 2010)
and increased susceptibility marker for type 2 diabetes (Lee, Ryu et al. 2008).

25
The function of this protein in energy expenditure and regulation of mitochondrial ROS has
lead to intense research into its potential as a therapeutic target. However, it appears that its
function and expression is tissue specific as results differ between different tissue types. To
date, no studies have been done investigating the expression of UCP2 over long term AAP
exposure or the role of the UCP2-866G/A polymorphism in the susceptibility of air pollution
associated with oxidative stress.
The aim of this study was to measure markers for oxidative stress and damage in pregnant
women from the industrialised DS basin and compare and compare the results to women
from the less industrialised Durban North (DN). Furthermore, the functional relevance of the
-866G/A promoter polymorphism in the UCP2 gene in the oxidative stress response of these
women was evaluated. The objective of the study was determine if pregnant women exposed
to higher air pollutant levels displayed higher markers for oxidative stress and to determine
the antioxidant response of these women. Variation in the expression and regulatory function
between the 2 UCP2 genotypes were also investigated as a possible genetic risk factor for
oxidative stress.
26
CHAPTER 2
MATERIALS AND METHOD
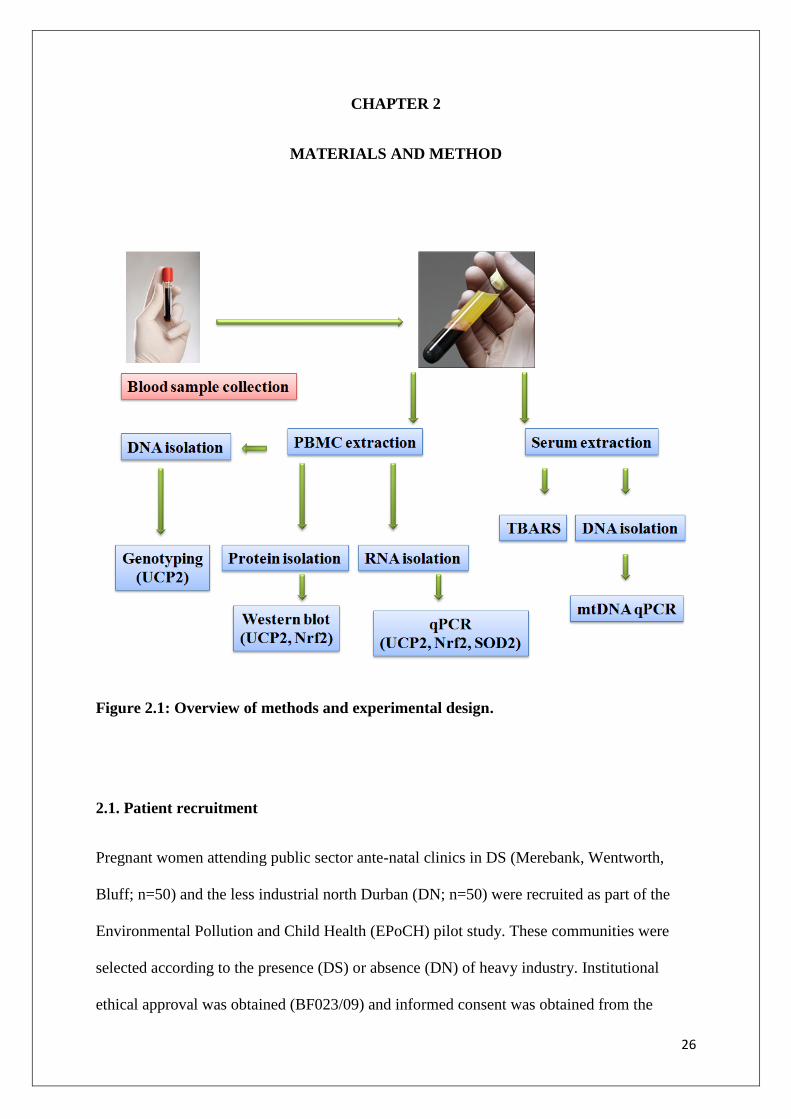
Figure 2.1: Overview of methods and experimental design.
2.1. Patient recruitment
Pregnant women attending public sector ante-natal clinics in DS (Merebank, Wentworth,
Bluff; n=50) and the less industrial north Durban (DN; n=50) were recruited as part of the
Environmental Pollution and Child Health (EPoCH) pilot study. These communities were
selected according to the presence (DS) or absence (DN) of heavy industry. Institutional
ethical approval was obtained (BF023/09) and informed consent was obtained from the

27
participants of the study. The pregnant women selected for the study would have to reside in
the given geographical location for the full duration of the pregnancy. Preference was given
to women at less than 20 weeks of the gestational period. Women with hypertension,
diabetes, placenta pervia, genital tract infections and multiple pregnancies were excluded.
2.2. Sample preparation
2.2.1. Peripheral blood mononuclear cell (PBMC) and serum isolation
Peripheral blood mononuclear cells (PBMCs) and serum were isolated from blood by density
gradient centrifugation. Equal volumes of blood and Histopaque 1077 (Sigma, Germany)
were aliquoted into 15ml sterilin tubes and centrifuged (400 g; 30 min). Sample serum was
aspirated and stored -80°C. The buffy layer containing the PBMCs was aspirated and washed
twice in 0.1M phosphate saline buffer (PBS). The cells were then transferred to cryovials and
stored at -80°C.
2.2.2. DNA isolation
Genomic DNA was isolated from sample serum and whole blood using a commercially
available kit (Quick-g-DNA MiniPrep Kit, Catalogue no. D3007, Zymo research, USA).
Briefly, 800µl of Genomic Lysis Buffer was added to 200µl of whole blood/serum and
vortexed vigorously. The samples were allowed to stand for 10 min and then transferred to a
Zymo-SpinTM
Column in a Collection Tube. The samples were centrifuged (10, 000 g, 1 min)
and the flow in the Collection Tube was discarded. 200µl of DNA Pre-Wash Buffer was
added to the Zymo-SpinTM
Column and centrifuged (10, 000 g, 1 min). The DNA was
washed once more with 500µl of g-DNA Wash buffer (10, 000 g, 1 min). The spin column
28
was then transferred to a fresh eppendorf tube and 50µl of DNA Elution Buffer was added.
The tubes were then centrifuged for 30 sec at 10, 000 g.
The DNA was quantified (ng/µl) using the Nanodrop 2000 spectrophotometer (λ=260nm).
DNA from serum was standardised to 5ng/µl for mtDNA quantitative PCR (qPCR). DNA
from whole blood was standardised to 15ng/µl for conventional PCR. Samples were stored at
-80°C.
2.2.3. RNA isolation
Sample RNA was extracted from PBMCs using the TRIzol method. TRIzol lyses the cells
and disrupts cellular components, while maintaining the integrity of RNA. Equal volumes of
TRIzol and cell suspension were mixed in 1.5ml eppendorf tubes and incubated overnight at -
80°C. Samples were allowed to thaw and 100µl of chloroform was added. Samples were
centrifuged (12, 000 g; 15 min; 4°C) and the solution split into an organic phase and aqueous
phase. The aqueous phase, containing the RNA was transferred to fresh eppendorf tubes
containing 250µl of isopropanol. Isopropanol is added to precipitate the sample RNA.
Samples were incubated in isopropanol overnight at -80°C to increase RNA yields
(Chomczynski 1987). Following incubation, samples were thawed and then centrifuged (12,
000 g; 20 min; 4°C) to pellet the RNA in the tube. The supernatant was decanted and RNA
was washed with 75% ethanol (7, 400 g, 15 min; 4°C). The ethanol was then decanted and
samples were allowed to air dry. Sample RNA was then reconstituted in 12.5µl of nuclease
free water.
RNA concentrations (ng/µl) were determined by using the Nanodrop 2000 spectrophotometer
and standardised to 25ng/µl for conversion to cDNA. Samples were stored at -80°C.

29
2.2.4. Protein isolation
Protein was isolated from PBMCs. Stored cell suspension was reconstituted in RPMI and
rinsed twice in 0.1M PBS. 200µl of Cytobuster (Novagen), supplemented with phosphotase
and protease inhibitors (Roche), was added to the cell pellet and kept on ice for 30 min.
Cytobuster disrupts cells and cellular components without disrupting the integrity of the
proteins. Disruption of cellular components results in the release of the cells natural
phosphotases and proteases. Inhibitors are required to conserve the integrity of the proteins
and phosphate groups. The samples were centrifuged (13, 000 g; 10 min) and the supernatant
containing the crude protein extract was aspirated and stored at -80°C.
Sample protein was quantified by performing the bicinchoninic (BCA) assay. The BCA assay
is a colometric assay that measures protein content by a colour change from green to purple.
A working solution of 198µl of BCA (containing sodium carbonate, sodium bicarbonate and
sodium tartrate) and 4µl of cupric sulphate pentahydrate (Cu2SO4) was made up per sample.
200µl of the working solution were added to 25µl of protein sample in a 96-well microtitre
ELISA plate. Protein standards (0; 0.2; 0.4; 0.6; 0.8, 1mg/ml) were made up using bovine
serum albumin (BSA).The plate was then incubated for 1 hr at 37°C. Absorbance was read on
the µQuant BioTek ELISA plate reader (λ = 562nm). The absorbance from the standards was
used to construct a standard curve to calculate protein concentrations of the samples
(Appendix 1).
The BCA assay relies on the reduction of Cu2+
in Cu2SO4 to Cu+ by peptide bonds found in
protein. Under alkaline conditions, in a temperature dependant reaction, BCA forms a purple
complex with Cu+. Therefore, samples with higher protein concentrations would reduce more
Cu2+
to Cu+, thus increasing the formation of the purple complex with BCA (Smith, Krohn et
al. 1985).

30
Following protein quantification, proteins were standardised to 5mg/ml in Cytobuster.
2.3. Detection of UCP2 -866G/A polymorphism
2.3.1. Polymerase chain reaction (PCR)
Polymerase chain reaction (PCR) is the technique used to exponentially amplify a target gene
for further analysis. Concentrations of the various components of the PCR reaction mix have
to be optimized for specific gene targets. The components of a PCR reaction include a
2 primers (forward and reverse) - complementary to the 3’ ends of the sense and
antisense strands of the target gene, bind to the flanking regions of the target gene
allowing specificity of DNA amplification
Deoxynucleoside triphosphates (dNTPs) – the building blocks required for the
synthesis of a new DNA strand (A, T, C, G)
Taq polymerase – enzyme responsible for addition of complementary dNTPs to the
DNA template
MgCl2 – polymerase requires a divalent cation to function optimally, also stabilizes
the DNA strand
Buffer solution – maintains optimal conditions (e.g. pH) during PCR reaction
The method relies on 3 temperature dependant stages (Fig 2.2);
i) Denaturation (94-96°C) – melting of dsDNA into single stranded DNA (ssDNA)
ii) Annealing (55-60°C) – optimum temperature for binding of specific primers
iii) Extension (72-75°C) – addition of complementary dNTPs to ssDNA template,
resulting in the formation of new dsDNA

31
Figure 2.2: Three steps of PCR reaction.
The UCP2 gene in the pregnant women from DS and DN was amplified by using PCR. A 360
base pair product was amplified by using a PCR reaction volume of 25µl consisting of the
following optimised conditions: 5µl of 5x Green GoTaq ® Flexi Buffer, 200µM of each
dNTP, 1.5mM MgCl2, 0.75 units of Taq Polymerase, 10pmol of forward (5'-
CACGCTGCTTCTGCCAGGAC-3’) and reverse primer (5'-AGGCGTCAGGATGGACCG-
3’) and 45ng of genomic DNA template. Primer specificity and efficiency was evaluated
32
using the National Centre for Biotechnology Information (NCBI) basic local alignment
search tool (BLAST; www.ncbi.nlm.nih.gov/BLAST/.)
Samples were held at 96°C for 5 min before undergoing 35 cycles of denaturation (96°C; 30
sec), annealing (68°C; 30 sec) and extension (72⁰C; 30 sec). This was followed by a final
extension step at (72⁰C; 7 min).
DNA verification was performed by electrophoresing the PCR product (15µl) on a 1.8%
agarose gel (30 min; 150V) stained with ethidium bromide (EtBr). Ethidium bromide
intercalates between the DNA base pairs of dsDNA and emits a fluorescent signal when
exposed to UV light. Gels were viewed using the Alliance 2.7 apparatus (Uvitech).
2.3.2 Restriction fragment length polymorphism (RFLP)
Polymerase chain reaction-Restriction fragment length polymorphism (PCR-RFLP) was used
to detect the UCP2 -866G/A polymorphism in the birth cohort. A restriction endonuclease is
an enzyme that is used to detect specific DNA sequences. Once it recognises a consensus
sequence (restriction site) it cleaves the dsDNA, resulting in DNA fragments. If the
consensus sequence is not present, the restriction enzyme will not cleave the DNA, and the
DNA will remain undigested.
The PCR product was subject to a fast digest with restriction endonuclease MluI (Fermentas).
The fast digestion was conducted (37°C; 30 min) in a 30µl reaction volume containing 10µl
of PCR product, 2µl 10X Green Flexi Buffer, 1µl fast digest MluI enzyme and 17µl nuclease
free deionised water. The consensus sequence and cleave sites were:
5 ’- G ↓ G A T C C - 3’
3’ – C C A T G ↑ G – 5’

33
The amplicons that were homozygous for the G allele underwent complete digestion by the
restriction enzyme and produced 2 restriction fragments (290bp and 70bp). Amplicons that
were heterozygous (GA) were not completely digested and produced 3 fragments (360bp,
290bp and 70bp). Amplicons that were homozygous for the A allele remained undigested
(Fig 2.3). The smaller fragments will travel further along the gel as it is easier for them to
move through the gel matrix. The larger fragments will be positioned closer to the loading
well.
Figure 2.3: Restriction fragments of MluI fast digest.
The digested product was electrophoresed on a 3% agarose gel containing 0.5mg/ml EtBr for
(30 min; 120V). The Uvitech Alliance 2.7 gel documentation system was used to visualise
the digested product.

34
2.4. Thiobarbituric acid reactive substances assay
Endogenous ROS levels are difficult to measure directly as they have extremely short half-
lives. Products of ROS interaction with cellular components are often used as indicators of
oxidative stress. Lipid peroxidation involves the degradation of lipid components of the cell
due to oxidative damage by free radicals (Fig 2.4). Polyunsaturated fatty acids are the most
susceptible to free radical attack. The methylene bonds found between the double bonds in
polyunsaturated fatty acids are highly reactive with free radicals. The first step in lipid
peroxidation is the oxidation of an unsaturated lipid by ROS resulting in the formation of a
fatty acid radical and water. The fatty acid radical is extremely reactive and reacts with O2
creating a peroxyl-fatty acid radical. This creates a chain reaction of free radical production
as the peroxyl-fatty acid radical then oxidizes another lipid, producing a fatty acid radical and
lipid peroxide (Södergren 2000). Malondialdehyde (MDA) is one of the end products of lipid
peroxidation.
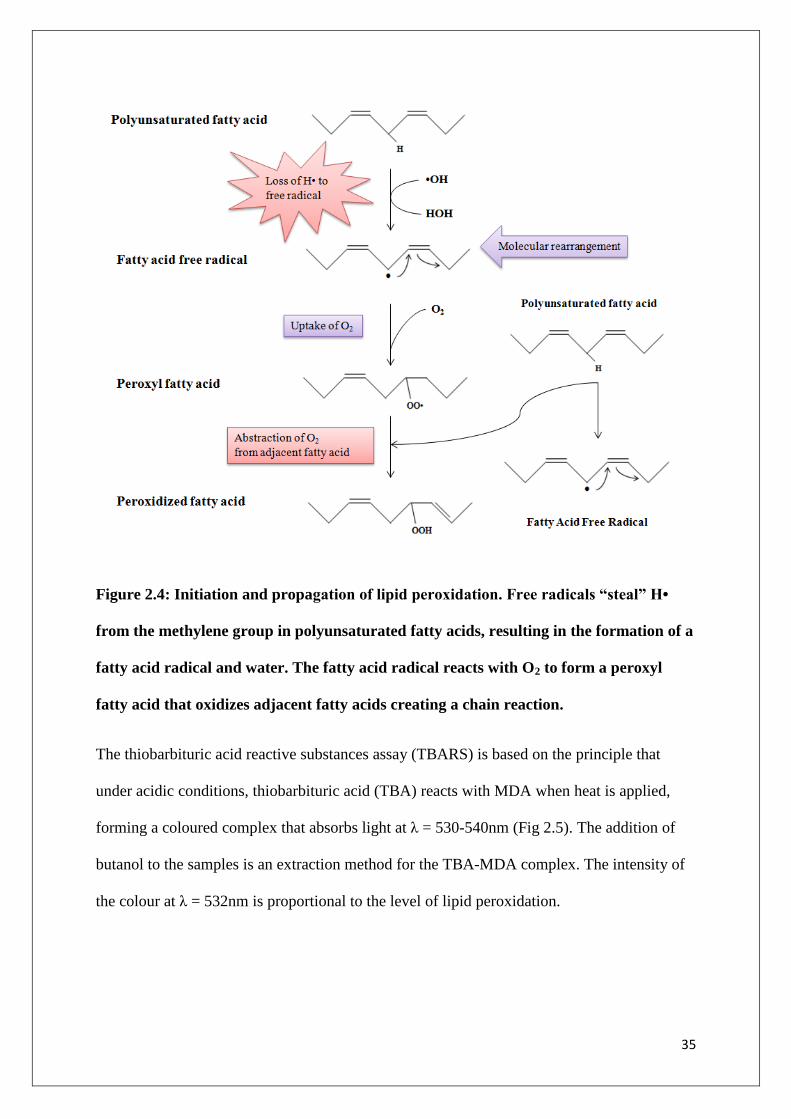
35
Figure 2.4: Initiation and propagation of lipid peroxidation. Free radicals “steal” H•
from the methylene group in polyunsaturated fatty acids, resulting in the formation of a
fatty acid radical and water. The fatty acid radical reacts with O2 to form a peroxyl
fatty acid that oxidizes adjacent fatty acids creating a chain reaction.
The thiobarbituric acid reactive substances assay (TBARS) is based on the principle that
under acidic conditions, thiobarbituric acid (TBA) reacts with MDA when heat is applied,
forming a coloured complex that absorbs light at λ = 530-540nm (Fig 2.5). The addition of
butanol to the samples is an extraction method for the TBA-MDA complex. The intensity of
the colour at λ = 532nm is proportional to the level of lipid peroxidation.
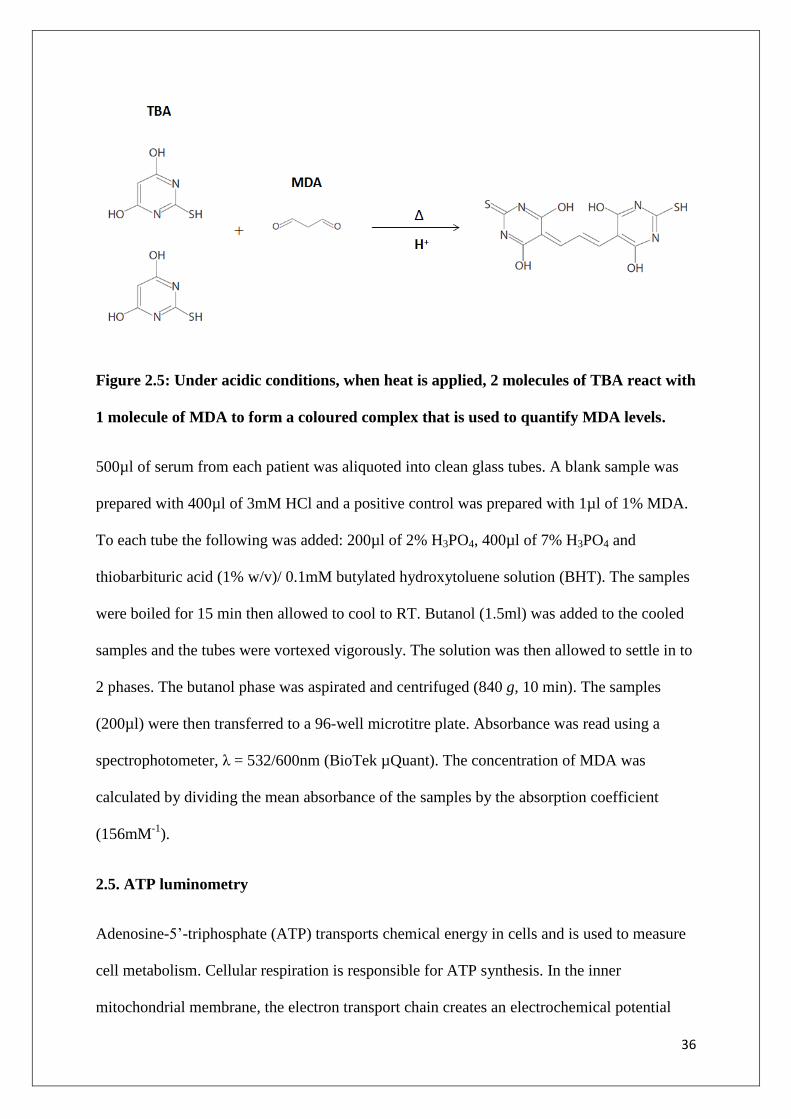
36
Figure 2.5: Under acidic conditions, when heat is applied, 2 molecules of TBA react with
1 molecule of MDA to form a coloured complex that is used to quantify MDA levels.
500µl of serum from each patient was aliquoted into clean glass tubes. A blank sample was
prepared with 400µl of 3mM HCl and a positive control was prepared with 1µl of 1% MDA.
To each tube the following was added: 200µl of 2% H3PO4, 400µl of 7% H3PO4 and
thiobarbituric acid (1% w/v)/ 0.1mM butylated hydroxytoluene solution (BHT). The samples
were boiled for 15 min then allowed to cool to RT. Butanol (1.5ml) was added to the cooled
samples and the tubes were vortexed vigorously. The solution was then allowed to settle in to
2 phases. The butanol phase was aspirated and centrifuged (840 g, 10 min). The samples
(200µl) were then transferred to a 96-well microtitre plate. Absorbance was read using a
spectrophotometer, λ = 532/600nm (BioTek µQuant). The concentration of MDA was
calculated by dividing the mean absorbance of the samples by the absorption coefficient
(156mM-1
).
2.5. ATP luminometry
Adenosine-5’-triphosphate (ATP) transports chemical energy in cells and is used to measure
cell metabolism. Cellular respiration is responsible for ATP synthesis. In the inner
mitochondrial membrane, the electron transport chain creates an electrochemical potential

37
gradient that drives ATP synthesis. ATP levels can be used as an indication of cellular or
pathological processes and mitochondrial function.
ATP can be quantified by bioluminescence. The ATP levels of PBMCs from the pregnant
women in the birth cohort were measured using the CellTiter-Glo® Luminescent Cell
Viability Assay (Promega, Madison, USA). This assay is based on the properties of the
UltraGloTM
Recombinant Luciferase that emits a luminescent signal. The luciferase reaction
is depicted in the Figure 2.6.
ATPBeetle Luciferin
O2
UltraGloTM Recombinant
Luciferin
Mg2+
oxyluciferin
AMP + PPi +
CO2
Light
Figure 2.6: The luciferase reaction is catalyzed by ATP, O2 and Mg2+
. The luminescent
signal is proportional to the amount of ATP present.
Briefly, 20 000 cells were aliquot into each well in a white microtiter plate. The ATP Cell
Titer-Glo® Reagent (Promega), consisting of Cell Titer-Glo® Buffer and Cell Titer-Glo®
Reagent, was added to the cells in a 1:2 ratio. The plate was incubated in the dark for 30 min
38
at RT. Luminescence was measured on a ModulusTM
microplate luminometer (Turner
Biosystems, Sunnyvale, USA). Luminescence was proportional to ATP content and
expressed as relative light units (RLU). The RLU values were used to calculate fold change.
2.6. JC-1 Mitoscreen
Mitochondrial membrane potential (ΔΨm) is useful as an indicator of apoptosis and
mitochondrial function. A spike in ΔΨm is associated with elevated mitochondrial ROS
production and a decline in ΔΨm is associated with apoptosis. A sensitive way to detect
polarized mitochondria in cells is by the JC-1 Mitoscreen. The JC-1 Mitoscreen relies on
flow cytometry.
Flow cytometry allows the analysis of individual cells by ordering the cells into a stream of
single cells to be evaluated by the machine’s detection system. The flow cytometer achieves
this by a fluidics system that uses hydrodynamic focussing to arrange cells into a stream of
single cells (Fig 2.7).

39
Figure 2.7: Hydrodynamic focussing (Rahman 2006).
The sample containing the cells is injected into the central core. The sheath fluid outside of
the central core is flowing at a faster rate than the fluid in the central core. A drag effect is
created on the narrow central core, so that fluid at the centre of the core has the fastest
velocity and fluid near the wall of the core have a velocity of zero. This results in a single
flow of cells and is known as hydrodynamic focussing.
Each cell/particle that passes through the core is interrogated by one or more beams of light.
If the cell has been labelled with a fluorochrome, it emits a fluorescent signal that is picked
up by the machine’s detection system. Flow cytometers have fluorescence (FL-) channels that
detect fluorescence and will measure the signal at different wavelengths to gain qualitative
and quantitative data.
JC-1 is a fluorescent labelled dye (fluorochrome). Fluorochromes are able to absorb light
energy and emit light at a longer wavelength. The JC-1 dye is a lipophilic fluorochrome that
penetrates the cell membrane. The dye forms JC-1 aggregates when it is at high
concentrations and monomers at lower concentrations. The mitochondria of healthy cells are

40
polarized, and therefore take up the JC-1 dye, resulting in JC-1 aggregate formation. The
aggregates undergo a red spectral shift and emit red fluorescence that is detected in FL-2. The
monomers, which occur when the dye is unable to enter depolarized mitochondria, exhibit
green fluorescence that is detected in FL-1.
Briefly, JC-1 stock solution was diluted in pre-warmed 1X Assay Buffer (37°C) to make up a
working solution. Approximately 10 000 cells from each sample were transferred to
polystyrene cytometry tubes. JC-1 dye (150μl) was added to each tube and the cells were
incubated for 10 minutes at 37°C, 5% CO2. Cells were washed in JC-1 Mitoscreen wash
buffer (400 g, 5 min). Cells were then resuspended in 300μl of flow cytometry sheath fluid. A
FACSCalibur (BD Biosciences) flow cytometer and CellQuest PRO v4.02 software (BD
Biosciences) were used to capture data of the stained cells. Cells were gated using FlowJo
v7.1 software (Tree Star Inc., Ashland, USA).
2.7. Comet assay
The comet assay was used to determine DNA fragmentation. The 3 steps of the comet assay
are encapsulation of the cells, cell lysis and finally electrophoresis of the lysed cells. The
comet assay works on the principle that undamaged DNA remains in a highly intact structure
and will be too large to migrate through the gel. Damaged DNA loses its intact organisation
and individual strands start to break free and are tiny enough to migrate from the cavity that
encapsulated the cell.
Partially frosted glass slides were prepared by spreading 700µl of 1% low melting point
agarose (LMPA) dissolved in 1M PBS. This was allowed to solidify at 4⁰C for 10 min. A
second layer consisting of 25µl of cell suspension (~20 000 cells) mixed with 525µl of 0.5%
41
LMPA was then applied on to the first layer. The molten agarose was covered with a glass
cover slip and allowed to set for 10 min at 4⁰C.
The cover slips were then removed and the slides were submerged in cold cell lysis buffer
[2.5M NaCl, 100mM EDTA, 1% Triton X-100, 10mM Tris (pH10), 10% DMSO] for 1 hr at
4°C. The lysis buffer contains detergent and a high salt content. This allows degradation of
the cell membrane as well as all protein, RNA, and nucloesomal components of the cell,
leaving only the DNA in a cavity that was occupied by the cell.
Slides were removed from the cell lysis solution and placed in an electrophoresis tank. The
tank was filled with electrophoresis buffer [300mM NaOH, 1mM Na2EDTA (pH13)] so that
all the slides were submerged. The slides were allowed to equilibrate in the electrophoresis
buffer for 20 min. Thereafter a current of 300mA was applied for 35 min. DNA, which is
negatively charged, will migrate towards the positively charged cathode. Uncompromised
DNA would remain in its highly organised structure and be too large to migrate from the
cavity. DNA with strand breaks would break away from their organized structure and slowly
migrate, with smaller strands migrating further.
The slides were then removed from the tank and gently washed 3 times for 5 min each with
neutralisation buffer (0.4M Tris; pH 7.4). This was followed by a staining step with EtBR
(20µg/ml). Ethidium bromide intercalates between base pairs in dsDNA and allows for
visualisation of the comets. Undamaged DNA would remain double stranded and would emit
a stronger signal. The gels were covered with glass cover slips and left to incubate overnight
at 4⁰C. Images were captured using a fluorescent microscope (filter 4) [Olympus IXSI
inverted microscope] with 510-560 excitation and 590 emission filters. Images had to include
at least 50 cells per sample. The Soft Imaging System [Life Science – Olympus Soft Imaging
Solutions version 5] was used to measure comet tail length in µm.

42
2.8. Quantitative PCR
Quantitative PCR (qPCR) contains all the basic elements of conventional PCR, but differs in
that it not only facilitates amplification, but also quantification of a target gene. The use of a
fluorescent reporter dye, SYBR green, allows amplified DNA to be detected as the reaction
progresses over time. SYBR green binds to dsDNA and emits a fluorescent signal. The
intensity of the signal is proportional to the amount of dsDNA amplified. The fluorescence
emitted is plotted on a graph after each cycle and allows quantification of the initial amount
of dsDNA present. The graph provides a comparative threshold (Ct) value for each sample.
The Ct values from where the curve becomes exponential are compared to a simultaneously
run housekeeping gene are used to calculate the amount of DNA present.
The Livak method is used to calculate fold change of samples compared to a control group.
The Ct value of the housekeeping gene is subtracted from the Ct value of the target gene to
standardise the results (∆Ct). Next, ∆Ct of the control group is subtracted from ∆Ct of the
experimental group (∆∆Ct). Fold change is calculated as 2-∆∆Ct
(Appendix 2).
2.8.1. Mitochondrial DNA damage
Mitochondrial DNA (mtDNA) damage was measured by performing qPCR. DNA was
isolated from serum using a commercially available kit (Quick-g-DNA MiniPrep Kit, Zymo
Research, USA). Sample DNA was quantified using the Nanodrop 2000 spectrophotometer
and standardized to 5ng/µl.
A reaction volume of 25µl consisting of 12.5µl SYBR Green Supermix (BioRad), 10pmol of
forward and reverse primer (Table 2.1), and ~10ng genomic DNA template made up in
nuclease free water. A reference gene, β-Globin (Table 2.1) was amplified under the same
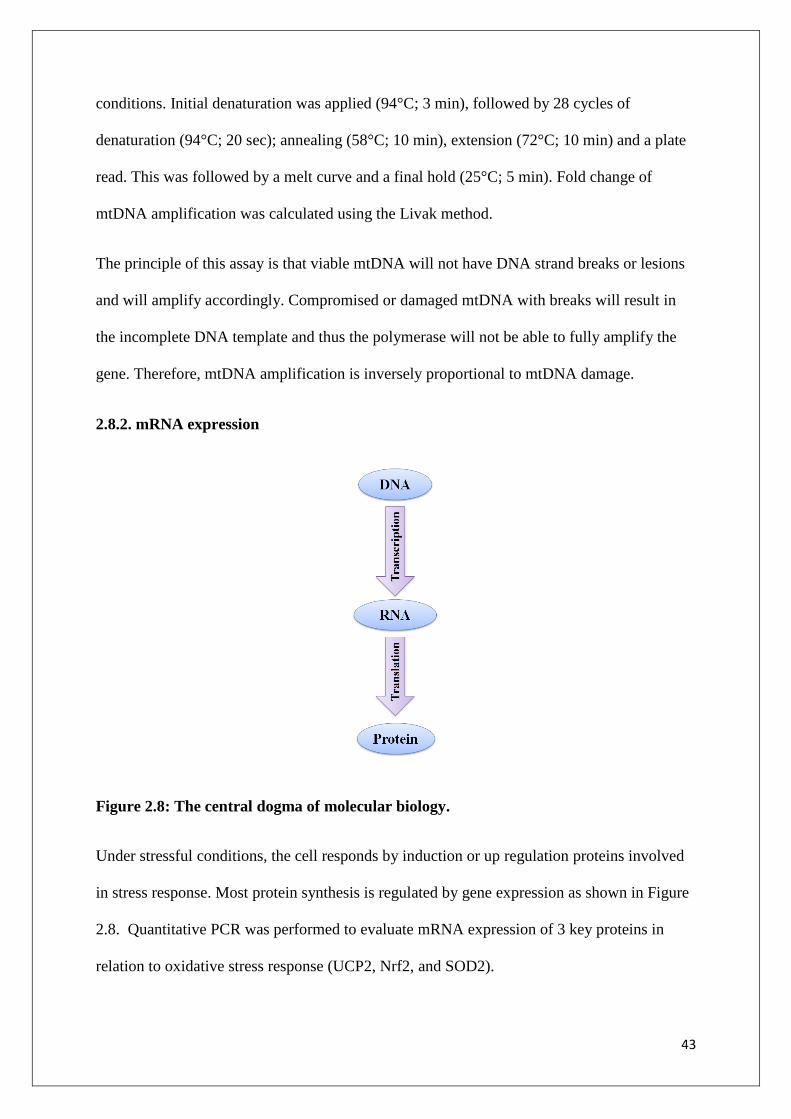
43
conditions. Initial denaturation was applied (94°C; 3 min), followed by 28 cycles of
denaturation (94°C; 20 sec); annealing (58°C; 10 min), extension (72°C; 10 min) and a plate
read. This was followed by a melt curve and a final hold (25°C; 5 min). Fold change of
mtDNA amplification was calculated using the Livak method.
The principle of this assay is that viable mtDNA will not have DNA strand breaks or lesions
and will amplify accordingly. Compromised or damaged mtDNA with breaks will result in
the incomplete DNA template and thus the polymerase will not be able to fully amplify the
gene. Therefore, mtDNA amplification is inversely proportional to mtDNA damage.
2.8.2. mRNA expression
Figure 2.8: The central dogma of molecular biology.
Under stressful conditions, the cell responds by induction or up regulation proteins involved
in stress response. Most protein synthesis is regulated by gene expression as shown in Figure
2.8. Quantitative PCR was performed to evaluate mRNA expression of 3 key proteins in
relation to oxidative stress response (UCP2, Nrf2, and SOD2).

44
To perform qPCR, the isolated RNA had to be converted to cDNA. The iScriptTM
cDNA
Synthesis kit (BioRad; catalog no. 107-8890) was used to synthesize cDNA from the RNA
isolated from the PBMCs. A reaction volume of 20µl containing 4µl of 5X iScript reaction
mix, 1µl of iScript reverse transcriptase and ~250ng of RNA template were made up in
nuclease free water. Thermocycler conditions for cDNA synthesis were 25°C for 5 min, 42°C
for 30 min, 85°C for 5 min and a final hold at 4°C.
The synthesis of cDNA from an mRNA template is catalyzed by the enzymes reverse
transcriptase and DNA polymerase. The cDNA strands synthesized will be complementary to
the RNA base pairs of the mRNA template strand.
The iScriptTM
One-Step RT-PCR kit with SYBR® Green (BioRad, 170-8892) was used to
perform qPCR to measure mRNA expression of UCP2, Nrf2 and SOD2. Briefly 4µl of
cDNA sample was added to 30nM of sense primer, 30nM antisense primer (Table 2.1), 5X
iScript reaction mix and nuclease free water in a final reaction volume of 25µl. GAPDH was
used as a reference gene. The primers were tested for specificity and efficiency by using the
NCBI’s BLAST on their website. Initial denaturation was conducted at 95°C for 4 min,
followed by 37 cycles of denaturation (95°C; 15 sec), annealing (57°C; 40 sec), extension
(72°C; 30 sec) and a plate read for 37 cycles.
All qPCR was conducted in the BioRad Chromo4 thermocycler and Ct values were read
using MJ Opticon Moniter Version 3.1 analysis software.
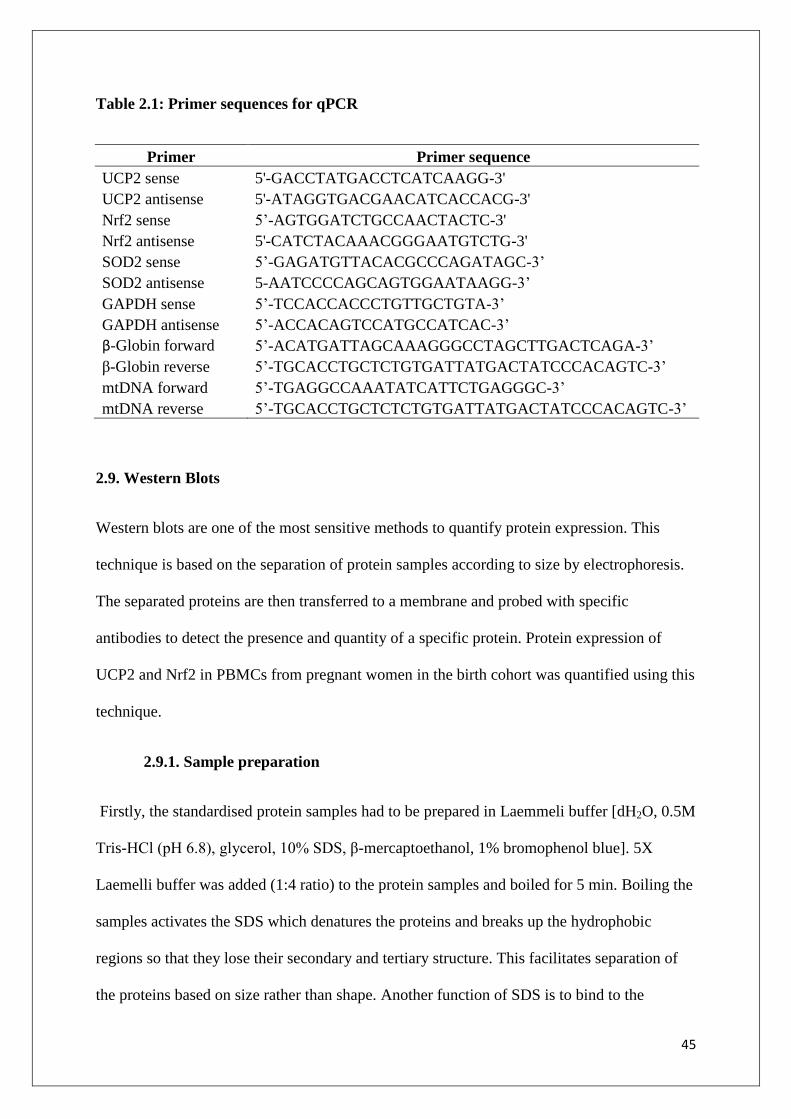
45
Table 2.1: Primer sequences for qPCR
Primer Primer sequence
UCP2 sense 5'-GACCTATGACCTCATCAAGG-3'
UCP2 antisense 5'-ATAGGTGACGAACATCACCACG-3'
Nrf2 sense 5’-AGTGGATCTGCCAACTACTC-3'
Nrf2 antisense 5'-CATCTACAAACGGGAATGTCTG-3'
SOD2 sense 5’-GAGATGTTACACGCCCAGATAGC-3’
SOD2 antisense 5-AATCCCCAGCAGTGGAATAAGG-3’
GAPDH sense 5’-TCCACCACCCTGTTGCTGTA-3’
GAPDH antisense 5’-ACCACAGTCCATGCCATCAC-3’
β-Globin forward 5’-ACATGATTAGCAAAGGGCCTAGCTTGACTCAGA-3’
β-Globin reverse 5’-TGCACCTGCTCTGTGATTATGACTATCCCACAGTC-3’
mtDNA forward 5’-TGAGGCCAAATATCATTCTGAGGGC-3’
mtDNA reverse 5’-TGCACCTGCTCTCTGTGATTATGACTATCCCACAGTC-3’
2.9. Western Blots
Western blots are one of the most sensitive methods to quantify protein expression. This
technique is based on the separation of protein samples according to size by electrophoresis.
The separated proteins are then transferred to a membrane and probed with specific
antibodies to detect the presence and quantity of a specific protein. Protein expression of
UCP2 and Nrf2 in PBMCs from pregnant women in the birth cohort was quantified using this
technique.
2.9.1. Sample preparation
Firstly, the standardised protein samples had to be prepared in Laemmeli buffer [dH2O, 0.5M
Tris-HCl (pH 6.8), glycerol, 10% SDS, β-mercaptoethanol, 1% bromophenol blue]. 5X
Laemelli buffer was added (1:4 ratio) to the protein samples and boiled for 5 min. Boiling the
samples activates the SDS which denatures the proteins and breaks up the hydrophobic
regions so that they lose their secondary and tertiary structure. This facilitates separation of
the proteins based on size rather than shape. Another function of SDS is to bind to the
46
positive charges, creating an overall negative charge on the protein, so that charge of the
protein does not affect its migration through the gel. β-mercaptoethanol breaks inter and
intra-molecular disulfide bonds to accommodate proper separation of the bands according to
size. The function of glycerol in the buffer is to add density to the sample, so that when
loading into the gel, the sample sinks to the bottom of the well. This reduces sample loss in
the running buffer during loading. Bromophenol blue is used as a tracking dye to monitor the
migration of the proteins during electrophoresis.
2.9.2. SDS-Polyacrylamide gel electrophoresis (SDS-PAGE)
Once the samples have been prepared, they are cooled to room temperature and ready to be
loaded. A 10% SDS-polyacrylamide resolving gel and a 4% stacking gel was prepared
(dH2O, Tris, SDS, Bis/Acrylamide, 10% Ammonium phosphate sulphide, TEMED). N,N’-
methylene-bis-acrylamide acts as a cross linking agent, facilitating polymerization of the
acrylamide gel. This reaction is initiated by TEMED. The cross-linked matrix formed by the
polymerized acrylamide creates a porous structure through which the proteins will migrate.
The smaller proteins will migrate faster through the matrix, and thus travel further down the
gel. The larger proteins will have difficulty moving through the porous structure and will
remain higher up on the gel.
The samples were loaded into the gel and electrophoresed for 1 hr; 120V. The negative
charge of the proteins would cause the protein to migrate to the positive node.
2.9.3. Transfer
The gels were then equilibrated in transfer buffer (dH2O, Tris, glycine, methanol) and the
separated proteins were transferred to a nitrocellulose membrane using the BioRad TransBlot
Turbo Transfer System (400mA, 45 min). The equilibrated gels and membranes were

47
sandwiched between fibre pads soaked in transfer buffer (Fig 2.9). Application of an electric
current allows the proteins to migrate from the gel to the membrane, while still maintaining
the structural organisation they had in the gel.
Figure 2.9: Arrangement for transfer of proteins from gel to nitrocellulose. The fibre
pads, membrane and gels were equilibrated in transfer buffer for 10 min before the
transfer.
Once the transfer was complete, the membranes were incubated in a blocking solution of 3%
BSA made up in Tris Buffer Saline with Tween-20 (TTBS) for 1 hr at RT on a shaker. The
protein in the BSA solution binds to all parts of the membrane where the target protein has
not bound, thus preventing non-specific binding.
48
2.9.4. Probing/Detection
Probing for specific proteins is achieved via 2 steps as shown in Figure 2.10. The first step is
incubation with a primary antibody. This antibody is specific to the target protein that is
being detected and binds accordingly, forming an antibody-antigen complex. Goat anti-UCP2
(ab77363) and rabbit anti-Nrf2 (ab31163) were used to detect UCP2 and Nrf2 protein
expression respectively (1: 5 000 dilution in 1% BSA). The membranes were incubated in
primary antibody for 1 hr on a shaker at RT and then overnight at 4°C. The membranes were
then subject to 5 X 10 min washes in TTBS before incubation with secondary antibody. The
secondary antibody is conjugated to horse radish peroxidase (HRP) and is specific to the
primary antibody. The secondary antibody binds to the bound primary antibody. The HRP-
conjugated secondary antibody emits a chemiluminescent signal that can be used for
detection and quantification of a target protein. Rabbit anti-goat (ab6742) and goat anti-rabbit
(ab6112) were used for UCP2 and Nrf2 respectively (1: 10 000 dilution in 1% BSA). The
membranes were incubated with secondary antibody for 1 hr at RT on a shaker. The
membranes were then rinsed subject to 5X 10 min washes.

49
Figure 2.10: Detection of target protein with antibodies. The primary antibody (blue) is
specific to the target protein. The primary antibody binds to the target protein forming
the antigen-antibody complex (2). The HRP-conjugated secondary antibody binds to the
primary antibody and emits a luminescent signal (3).
LumiGLO® chemiluminescent substrate system (KPL) was used to detect protein bands.
Membranes were visualised by measuring chemiluminescence using the Alliance 2.7
apparatus (UviTech). Analysis of relative band density (RBI) of the bands was done using
Uvitech Alliance Acquisition software.
Membranes were stripped with 5% hydrogen peroxide, incubated in blocking solution (3%
BSA; 1 hr; RT), rinsed twice in TTBS and probed with HRP-conjugated anti-β-actin (house-
keeping protein). Relative band density was reflected as a ratio of the relative band density of
the proteins divided by the relative band density of β-actin.

50
2.10. Statistical analysis
Statistical analyses were performed using the GraphPad Prism software package (GraphPad
Software Inc.) The Hardy-Weinberg equilibrium model was used to test the UCP2 genotype
frequencies. Statistical significance was relative to p value < 0.05

51
CHAPTER THREE
RESULTS
3.1. Uncoupling protein2 -866G/A promoter polymorphism
The UCP2 -866G/A promoter polymorphism was detected using PCR-RFLP (Fig 3.1).
Figure 3.1 Restriction fragment length polymorphism for the UCP2 -866G/A
polymorphism. Fast digest of the amplicons resulted in a 360bp undigested product in
the homozygous A genotype, a completely digested 290bp product for the homozygous
G genotype and the heterozygous genotype produced two fragments.
Since the AA genotype is rare, the results from this genotype were grouped with the GA
genotype. Frequencies of the genotypes and alleles are displayed in Table 3.1. The G allele
was more frequent in pregnant women from DS (48.7%) than women from DN (44.3%; p =
0.26; OR: 1.44; 95% CI: 0.82 to 2.51). Fishers exact test results showed a significantly higher
frequency of the GG genotype in the pregnant women from DS (37.5%) than those from DN
(20.9%; p value < 0.05; OR: 2.57; 95% CI: 1.353 10 4.885). The genotype frequency was
tested against the Hardy Weinberg equation (HWE) as quality control. The genotype
frequencies were found to be consistent with the HWE (DN: p = 0.17, X2 = 1.9; DS: p = 0.32,
X2 = 0.98; Chi square test).

52
Table 3.1: Genotype and allelic frequencies of UCP2 -866G/A promoter SNP in
pregnant women from Durban North and Durban South
Frequency
North (n = 43) South (n = 48)
Allelotype G 35 (44.3%) 38 (48.7%)
A 44 (55.7%) 40 (51.3%)
Genotype AA/GA 34 (79.1%) **30 (62.5%)
GG 9 (20.9%) **18 (37.5%)
X2 value 1.9 0.98
p value 0.17 0.32
**p < 0.005 compared to DN
3.2. Thiobarbituric acid reactive substances assay
The TBARS assay was done to quantify MDA as an indicator of oxidative stress. Pregnant
women from DS displayed elevated levels of MDA when compared to women from DN (DN:
0.05±0.03 vs DS: 0.07±0.06µM; p = 0.56; Mann-Whitney test). The difference was not
statistically significant (p>0.05; Figure 3.2).

53
North South0.00
0.02
0.04
0.06
0.08
0.10 Mean =0.050.03 Mean =0.070.06
MD
A (
uM
)
Figure 3.2: Extracellular MDA levels for women from Durban North and Durban South
(p > 0.05).
The results from the TBARS assay were then stratified according to the UCP2 genotypes of
the pregnant women. No significant differences were observed between the genotypes (p >
0.05; ANOVA). The GG genotype in women from DS exhibited higher MDA levels than the
AA/GA genotype in the same group as shown in Figure 3.3 (GG: 0.07±0.06 vs AA/GA:
0.05±0.03µM; p = 0.59).

54
AA
/GA
Nor
th
GG
Nor
th
AA
/GA
Sou
th
GG
Sou
th
0.00
0.02
0.04
0.06
0.08
0.10Mean =
0.060.03
Mean =
0.040.02
Mean =
0.0710.1
Mean =
0.720.1
MD
A (
uM
)
Figure 3.3: Stratified results of TBARS assay according to UCP2 genotypes (p > 0.05).
3.3. ATP luminometry
ATP levels of the PBMCs isolated from women in the DN and DS were measured using the
CellTiter Glo® Assay. Luminescence was used as a measure of ATP content of PBMCs.
Luminescence was measured as relative light units (RLU) and converted to fold change
compared to the control group. Statistics done on the RLU values, as shown in Figure 3.4,
showed that ATP levels were significantly higher in DS (3.7±3.02x10³RLU) compared to DN
(7.01±1.97RLUx103; p = 0.001; Mann Whitney). The mean ATP level in PBMCs from
pregnant women from DS was 1.89 fold higher than the mean ATP level of women from DN
(Fig 3.5).
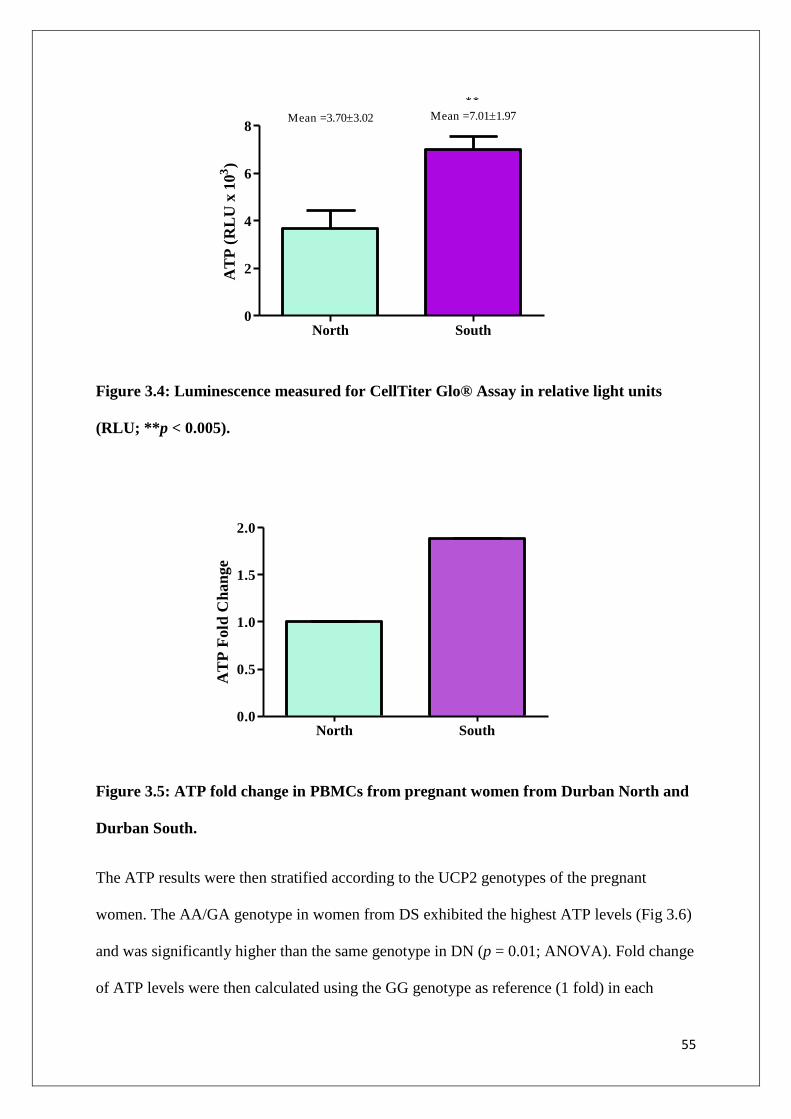
55
North South0
2
4
6
8Mean =3.703.02 Mean =7.011.97
AT
P (
RL
U x
10
3)
Figure 3.4: Luminescence measured for CellTiter Glo® Assay in relative light units
(RLU; **p < 0.005).
North South0.0
0.5
1.0
1.5
2.0
AT
P F
old
Ch
an
ge
Figure 3.5: ATP fold change in PBMCs from pregnant women from Durban North and
Durban South.
The ATP results were then stratified according to the UCP2 genotypes of the pregnant
women. The AA/GA genotype in women from DS exhibited the highest ATP levels (Fig 3.6)
and was significantly higher than the same genotype in DN (p = 0.01; ANOVA). Fold change
of ATP levels were then calculated using the GG genotype as reference (1 fold) in each
**

56
geographical group. The AA/GA genotype displayed higher ATP levels in DS (1.28 fold)
than the GG genotype (Fig 3.7). The AA/GA genotype in the control group had slightly lower
ATP levels (0.88 fold) when compared to the GG genotype in the same group.
AA
/GA
Nor
th
GG
Nor
th
AA
/GA
Sou
th
GG
Sou
th
0
2
4
6
8
10Mean =
3.583.33
Mean =
4.062.21
Mean =
8.172.41
Mean =
6.371.45
AT
P (
RL
U x
10
3)
Figure 3.6: Results from ATP luminometry stratified according to UCP2 genotypes in
PBMCs from pregnant women living in Durban North and Durban South. ATP levels
in the AA/GA genotype in the Durban South group were significantly higher than the
same genotype in Durban North (*p < 0.05 when compared to AA/GA in Durban
North).
*
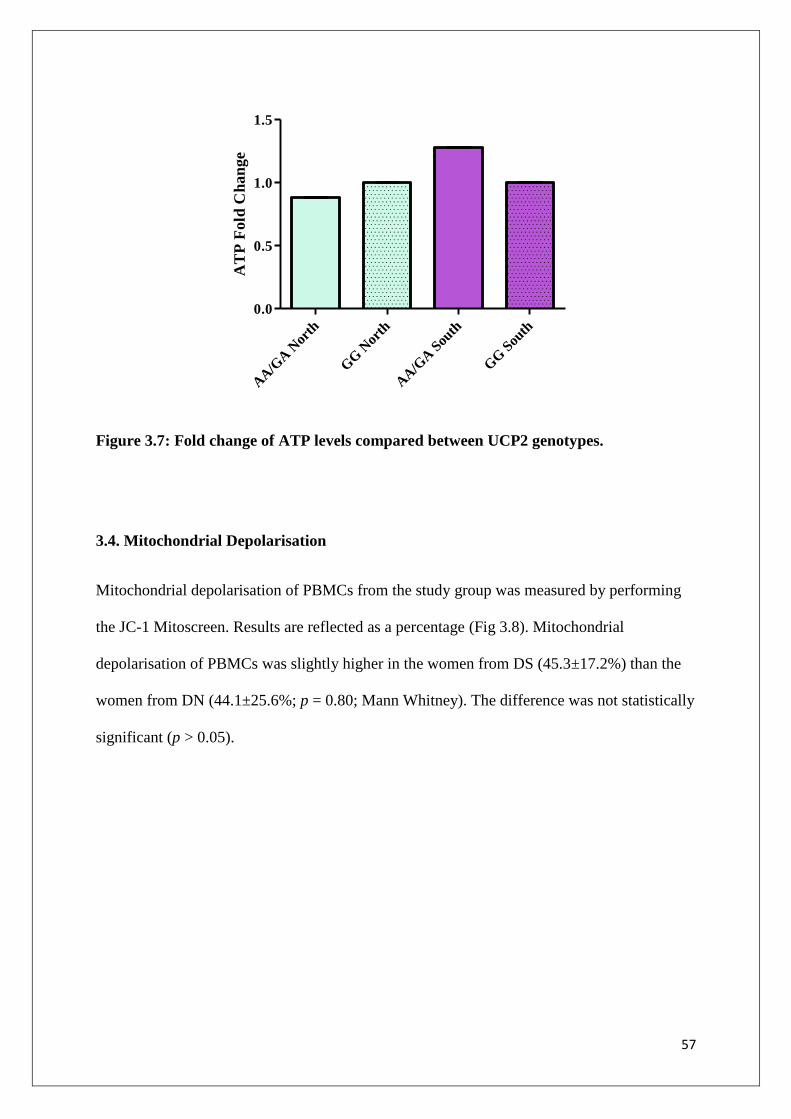
57
AA
/GA
Nor
th
GG
Nor
th
AA
/GA
Sou
th
GG
Sou
th
0.0
0.5
1.0
1.5
AT
P F
old
Ch
an
ge
Figure 3.7: Fold change of ATP levels compared between UCP2 genotypes.
3.4. Mitochondrial Depolarisation
Mitochondrial depolarisation of PBMCs from the study group was measured by performing
the JC-1 Mitoscreen. Results are reflected as a percentage (Fig 3.8). Mitochondrial
depolarisation of PBMCs was slightly higher in the women from DS (45.3±17.2%) than the
women from DN (44.1±25.6%; p = 0.80; Mann Whitney). The difference was not statistically
significant (p > 0.05).
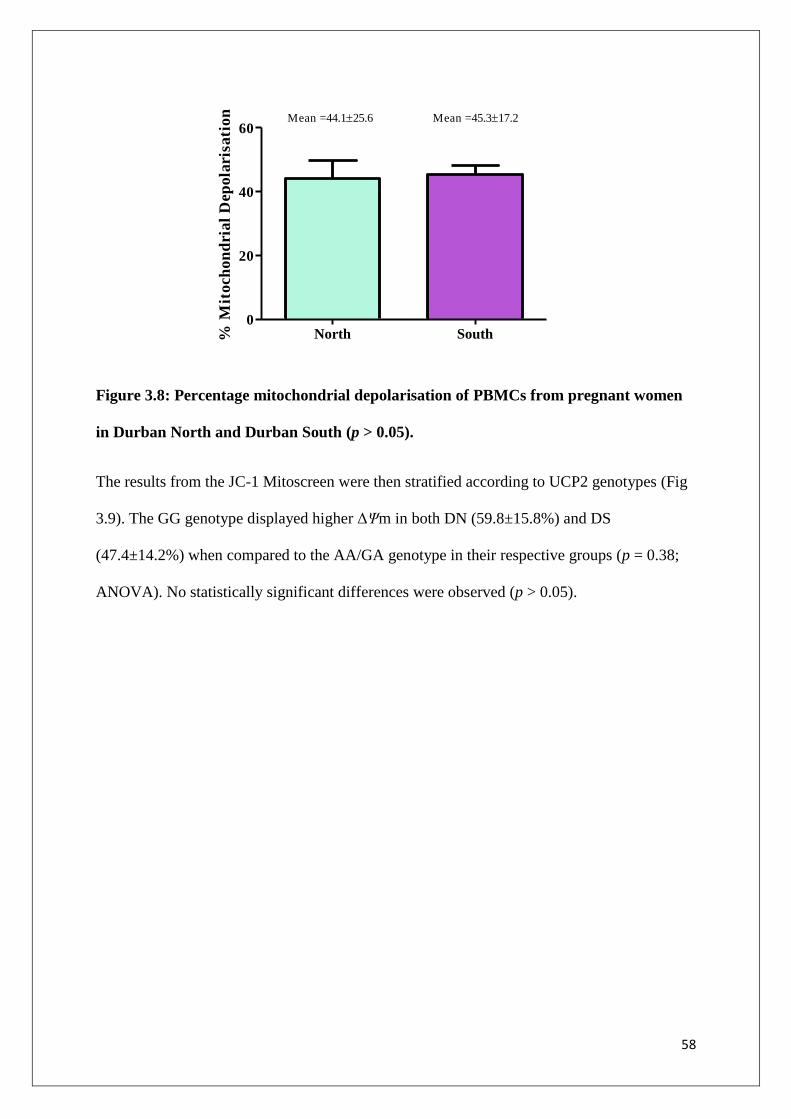
58
North South0
20
40
60 Mean =44.125.6 Mean =45.317.2
% M
ito
ch
on
dri
al
Dep
ola
ris
ati
on
Figure 3.8: Percentage mitochondrial depolarisation of PBMCs from pregnant women
in Durban North and Durban South (p > 0.05).
The results from the JC-1 Mitoscreen were then stratified according to UCP2 genotypes (Fig
3.9). The GG genotype displayed higher ΔΨm in both DN (59.8±15.8%) and DS
(47.4±14.2%) when compared to the AA/GA genotype in their respective groups (p = 0.38;
ANOVA). No statistically significant differences were observed (p > 0.05).
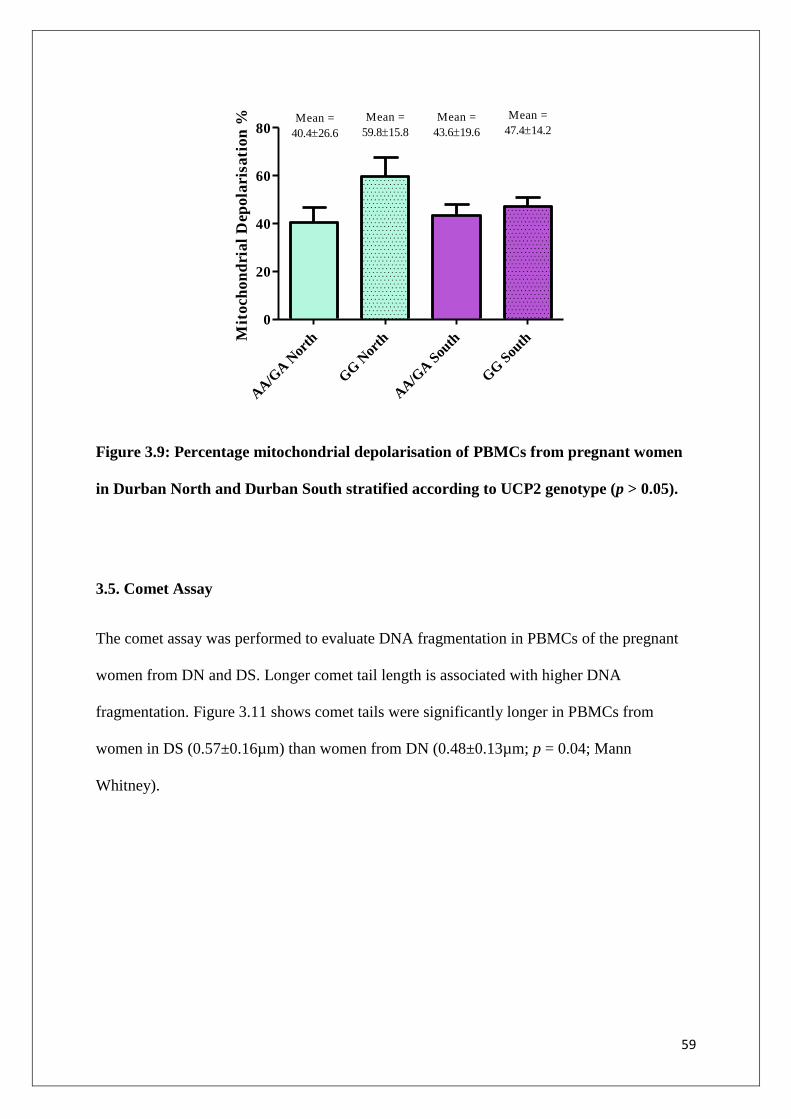
59
AA
/GA
Nor
th
GG
Nor
th
AA
/GA
Sou
th
GG
Sou
th
0
20
40
60
80Mean =
40.426.6
Mean =
59.815.8
Mean =
43.619.6
Mean =
47.414.2
Mit
och
on
dri
al
Dep
ola
ris
ati
on
%
Figure 3.9: Percentage mitochondrial depolarisation of PBMCs from pregnant women
in Durban North and Durban South stratified according to UCP2 genotype (p > 0.05).
3.5. Comet Assay
The comet assay was performed to evaluate DNA fragmentation in PBMCs of the pregnant
women from DN and DS. Longer comet tail length is associated with higher DNA
fragmentation. Figure 3.11 shows comet tails were significantly longer in PBMCs from
women in DS (0.57±0.16µm) than women from DN (0.48±0.13µm; p = 0.04; Mann
Whitney).

60
Figure 3.10 Comet tails of PBMCs in women from Durban North (A) and Durban South
(B).
Figure 3.11: Comet tail length was significantly higher in PBMCs from women in
Durban South than women from Durban North (*p < 0.05).
The comet assay results were then stratified according to the UCP2 genotypes in pregnant
women from DN and DS (Fig 3.12). The GG genotype was found to have longer comet tails
in DN (0.50±0.07µm) and DS (0.62±0.20µm) than the AA/GA genotype in their respective
groups (p = 0.07; ANOVA).
North South0.0
0.2
0.4
0.6
0.8 Mean = 0.48 0.13 Mean =0.570.16
*
Com
et T
ail
Len
gth
(u
m)
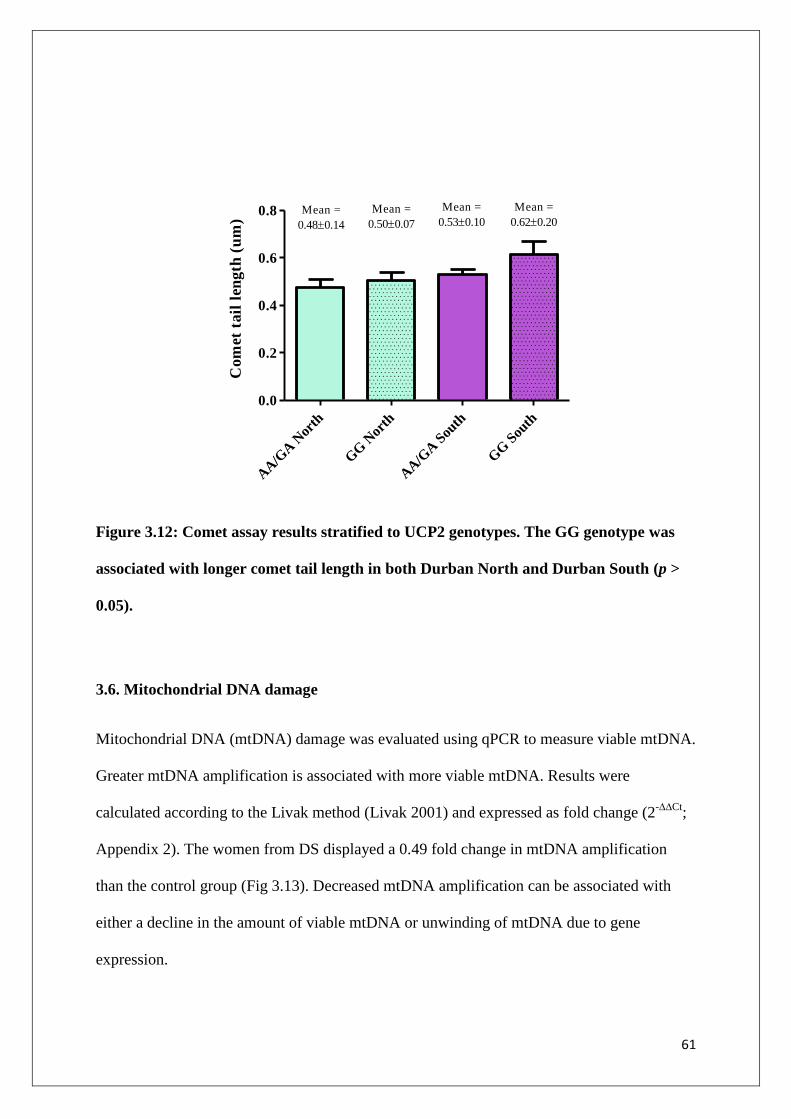
61
AA
/GA
Nor
th
GG
Nor
th
AA
/GA
Sou
th
GG
Sou
th
0.0
0.2
0.4
0.6
0.8
Com
et t
ail
len
gth
(u
m)
Mean =
0.480.14
Mean =
0.530.10Mean =
0.500.07
Mean =
0.620.20
Figure 3.12: Comet assay results stratified to UCP2 genotypes. The GG genotype was
associated with longer comet tail length in both Durban North and Durban South (p >
0.05).
3.6. Mitochondrial DNA damage
Mitochondrial DNA (mtDNA) damage was evaluated using qPCR to measure viable mtDNA.
Greater mtDNA amplification is associated with more viable mtDNA. Results were
calculated according to the Livak method (Livak 2001) and expressed as fold change (2-∆∆Ct
;
Appendix 2). The women from DS displayed a 0.49 fold change in mtDNA amplification
than the control group (Fig 3.13). Decreased mtDNA amplification can be associated with
either a decline in the amount of viable mtDNA or unwinding of mtDNA due to gene
expression.

62
North South0.0
0.5
1.0
1.5
mtD
NA
am
pli
fica
tio
n (
Fo
ld c
ha
ng
e)
Figure 3.13: Pregnant women from Durban South displayed a 0.49 fold change in
mtDNA amplification when compared to women from Durban North.
The Ct values from the mtDNA qPCR were then stratified according to the UCP2 genotypes.
Fold change was calculated according to the Livak method (2-∆∆Ct
; Appendix 2) with the GG
genotype being used as the control in each geographical group. The AA/GA genotype in DN
showed a 0.69 decrease in mtDNA amplification. The same genotype had a 0.81 fold
decrease in mtDNA amplification in DS when compared to the GG genotype (Fig 3.14).

63
AA
/GA
Nor
th
GG
Nor
th
AA
/GA
Sou
th
GG
Sou
th
0.0
0.5
1.0
1.5
mtD
NA
am
pli
fica
tio
n (
Fo
ld c
ha
ng
e)
Figure 3.14: Fold change in mtDNA amplification in Durban North and Durban South
stratified according to UCP2 genotypes
3.7. Uncoupling protein2 mRNA expression
Fold change in UCP2 mRNA expression was calculated using the Livak method (2-∆∆Ct
;
Appendix 2). Then women from DS showed 1.58 fold higher UCP2 mRNA expression in
their PBMCs when compared to the women from DN (Fig 3.15).

64
North South0.0
0.5
1.0
1.5
2.0
UC
P2 m
RN
A (
Fold
ch
an
ge)
Figure 3.15: Uncoupling protein mRNA expression was 1.58 fold higher in PBMCs from
women in Durban South than women from Durban North
The Ct values from the UCP2 qPCR were then stratified according to the UCP2 genotypes.
The fold change was calculated according to the Livak method (2-∆∆Ct
; Appendix 2) with the
GG genotype being used as the control in each geographical group. The AA/GA genotype
exhibited lower UCP2 mRNA expression in both DN (0.72 fold) and DS (0.89 fold) when
compared to the GG genotype in their respective groups (Fig 3.16).

65
AA
/GA
Nor
th
GG
Nor
th
AA
/GA
Sou
th
GG
Sou
th
0.0
0.5
1.0
1.5
UC
P2
mR
NA
(F
old
ch
an
ge)
Figure 3.16: Uncoupling protein mRNA expression stratified according to UCP2
genotype. The AA/GA genotype exhibited lower mRNA expression in both Durban
North and Durban South
3.8. Superoxide dismutase 2 mRNA expression
Fold change in SOD2 mRNA expression was calculated as 2-∆∆Ct
(Appendix 2). Pregnant
women from DS showed 1.23 fold higher expression of SOD2 mRNA in their PBMCs than
the women from the control group (Fig 3.17).

66
North South0.0
0.5
1.0
1.5
SO
D2 m
RN
A (
Fold
ch
an
ge)
Figure 3.17: Women from Durban South displayed a 1.23 fold increase in SOD2 mRNA
expression
The Ct values the SOD2 qPCR were then stratified according to the UCP2 genotypes. The
fold change was calculated according to the Livak method (2-∆∆Ct
) with the GG genotype
being used as the control in each geographical group (Appendix 2). Expression of SOD2
mRNA was up regulated in the AA/GA in DN (5.46 fold), but the same genotype was down
regulated in DS (0.83 fold) in comparison to the GG genotypes in their respective groups (Fig
3.18).

67
AA
/GA
Nor
th
GG
Nor
th
AA
/GA
Sou
th
GG
Sou
th
0
2
4
6
SO
D2 m
RN
A (
Fold
ch
an
ge)
Figure 3.18: Fold change of SOD2 mRNA expression between genotypes in Durban
North and Durban South
3.9. Nuclear erythroid related factor 2 (Nrf2) mRNA
The Ct values from the Nrf2 qPCR were used to calculate fold change. Fold change was
calculated as 2-∆∆Ct
(Appendix 2). Pregnant women from DS had a 0.73 fold lower Nrf2
mRNA than women from DN (Fig 3.19).

68
North South0.0
0.5
1.0
1.5
Nrf
2 m
RN
A(F
old
Ch
an
ge)
Figure 3.19: Pregnant women from Durban South displayed a 0.73 fold decrease in Nrf2
mRNA expression compared to women from Durban North
The Ct values the Nrf2 qPCR were then stratified according to the UCP2 genotypes. The fold
change was calculated according to the Livak method (2-∆∆Ct
) with the GG genotype being
used as the control in each geographical group. The AA/GA genotype showed a 3.38 fold
increase in Nrf2 mRNA expression compared to the GG genotype in DN. In the DS group,
the AA/GA genotype displayed 0.6 fold lower Nrf2 mRNA expression than the GG genotype
(Figure 3.20)

69
AA
/GA
Nor
th
GG
Nor
th
AA
/GA
Sou
th
GG
Sou
th
0
1
2
3
4
Nrf
2 m
RN
A(F
old
Ch
an
ge)
Figure 3.20: Fold change of Nrf2 mRNA expression between genotypes in Durban
North and Durban South
3.10 Uncoupling protein2 protein expression
Protein expression of UCP2 was quantified by performing western blots. The results are
reflected as RBI of the UCP2 probe divided by the RBI of the β-Actin probe (Figure 3.22).
The PBMCs from pregnant women from DS had significantly higher UCP2 protein
expression than women from the control group (DS: 0.08±0.03RBI vs DN: 0.05±0.01RBI; p
= 0.049; Mann Whitney).

70
Figure 3.21: Western blot images for UCP2 expression and house-keeping protein
North South0.00
0.05
0.10
0.15
Mean = 0.050.01 Mean = 0.080.03
*
UC
P2 P
rote
in (
RB
I)
Figure 3.22 Protein expression of UCP2 in PBMCs from pregnant women in Durban
South was significantly higher than women from Durban North; *p < 0.05.
The results from the UCP2 western blot were stratified according to the UCP2 genotypes of
the women from DN and DS (Fig 3.23). No statistically significant differences were observed
(p > 0.05). The GG genotype displayed higher UCP2 protein expression than the AA/GA
genotype in DS (GG: 0.12±0.08 vs GG/GA: 0.10±0.08; p = 0.53; ANOVA).

71
AA
/GA
Nor
th
GG
Nor
th
AA
/GA
Sou
th
GG
Sou
th
0.00
0.05
0.10
0.15
Mean =
0.080.06
Mean =
0.070.04
Mean =
0.10.08
Mean =
0.120.08
Rel
ati
ve
Ban
d I
nte
nsi
ty
Figure 3.23: Protein expression of UCP2 in PBMCs from pregnant women in Durban
North and Durban South stratified according to UCP2 genotype (p > 0.05)
3.11 Nuclear erythroid related factor 2 protein expression
The results of the Nrf2 western blot are reflected as Nrf2 RBI/ β-Actin RBI (Fig 3.25).
Protein expression of Nrf2 in PBMCs from pregnant women from DS was significantly lower
than women from DN (DS: 1.68±0.84RBI vs DN: 2.09±0.84RBI; p = 0.03; Mann Whitney).
Figure 3.24: Western blot images for Nrf2 expression and house-keeping protein

72
North South0
1
2
3
4Mean = 2.09±0.84 Mean = 1.68±0.84
*
Nrf
2 P
rote
in (
RB
I)
Figure 3.25: Protein expression of Nrf2 in PBMCs from pregnant women in Durban
North and Durban South. Nrf2 protein expression was significantly lower in women
from Durban South compared to Durban North (*p < 0.05)
The results from the Nrf2 western blot were stratified according to the UCP2 genotypes of
the women from DN and DS (Fig 3.26). The GG genotype exhibited higher Nrf2 protein
expression in both DN (2.41±0.72RBI) and DS (1.81±0.86RBI) when compared to the
AA/GA genotype in within their respective groups (p = 0.71; ANOVA).
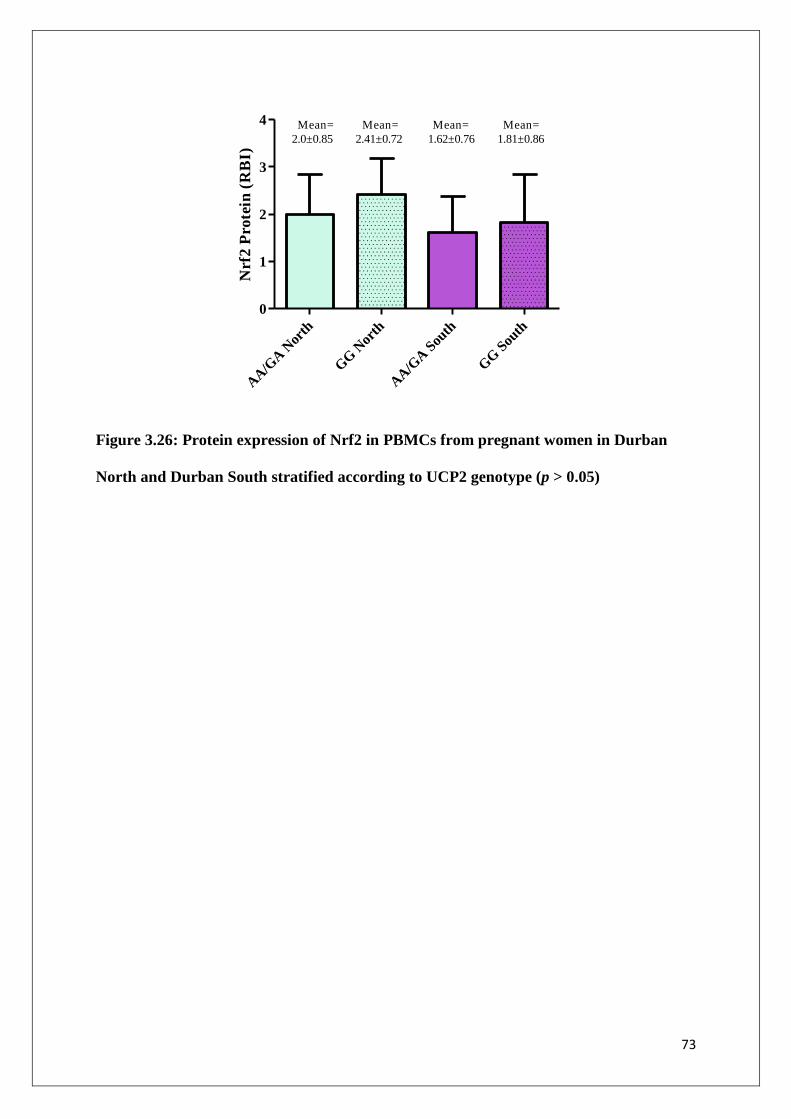
73
AA
/GA
Nor
th
GG
Nor
th
AA
/GA
Sou
th
GG
Sou
th
0
1
2
3
4 Mean= Mean= Mean= Mean=
2.0±0.85 2.41±0.72 1.62±0.76 1.81±0.86
Nrf
2 P
rote
in (
RB
I)
Figure 3.26: Protein expression of Nrf2 in PBMCs from pregnant women in Durban
North and Durban South stratified according to UCP2 genotype (p > 0.05)

74
CHAPTER 4
DISCUSSION
The industrial basin in the south of Durban has been recognised as an area of concern since
the 1960’s. The petrol company and oil refinery situated in the DS industrial basin are the
major contributors to AAP levels, emitting high levels of SO2, NOx and PM10. SO2 levels
have exceeded limits set out by the World Health Organization until 2006 (Guastella 2007).
Studies have found associations between these pollutants and the incidence of asthma in
children attending the school situated between the two industries (Kistnasamy 2005; Niranjan
2005). The association of AAP exposure with adverse birth outcomes has not been
investigated in DS.
The exact mechanism by which AAP causes adverse health outcomes is difficult to determine
as interactions between pollutants and variations in pollutant levels between different
environments need to be taken in to account. Oxidative stress has been identified as a
molecular mechanism in AAP associated adverse health and birth outcomes (Wang, Ding et
al. 1997; Maroziene and Grazuleviciene 2002; Maisonet, Correa et al. 2004; Sram 2005). If
oxidative stress plays a role in AAP toxicity, genes involved in oxidative stress response
could influence susceptibility to AAP associated health outcomes.
Women from DS are exposed to high levels of pollutants that are associated with inducing
free radical production (Guastella 2007). Particulate matter has been recognised as a potent
stimulus for mitochondrial ROS production via disruption of the mitochondrial ETC
(Kamdar, Le et al. 2008). Sulphur dioxide was found to elevate MDA levels (Gokirmak,
Yildirim et al. 2003) and deplete an important antioxidant, vitamin C, in plasma (Gumuslu,
Korgun et al. 2000). Upon inhalation, NOx dissolves in lung lining fluid and is converted to a
free radical in solution (Kelly 2003). We set out to establish whether pregnant women from

75
DS displayed elevated markers for oxidative stress and damage than pregnant women from
the less industrialized DN.
Pregnant women tend to display higher markers for lipid peroxidation products than non-
pregnant women (Arikana 2001). Increased energy expenditure and changes in metabolic
processes during pregnancy promote ROS production. TBARS results showed that women
from DS had elevated levels of extracellular MDA when compared to women from DN (Fig
3.2). Malondialdehyde is a by-product of lipid peroxidation, a process initiated by oxidative
damage to lipid membranes (Marnett 1999). Therefore elevated MDA levels are associated
with increased levels of circulating free radicals. The elevated ATP levels (Fig 3.5) and
higher ΔΨm (Fig 3.8) observed in women from DS favour mitochondrial free radical
production. Increased ATP production by mitochondria promotes O2•- anion radical
production via the electron transport chain (Brand 2004). The higher ATP levels in women
from the industrialized DS could be due to increased apoptosis or gene expression.
The longer PBMC comet tail lengths in women from DS (Fig 3.11) indicates increased DNA
fragmentation or increased unwinding of DNA due to increased gene expression. Increased
DNA fragmentation could be due to elevated circulating MDA, which has a high affinity for
deoxyguanine and deoxyadenine in DNA. Pollutants such as SO2 and PM10 can also increase
DNA fragmentation due to their genotoxic effects (Kamdar, Le et al. 2008; Ziemann, Hansen
et al. 2010). This could lead to DNA lesions and breaks, increasing DNA fragmentation.
Furthermore, damage by oxidants can induce apoptosis, resulting in DNA fragmentation.
Particle matter has been found to induce pro-apoptotic members of the BCl2 family (Kamdar,
Le et al. 2008). Apoptosis is an active process requires ATP, hence the increase in ATP
production in women from DS.

76
The qPCR results showed women from DS only had half as much mtDNA amplification
when compared to pregnant women from DN (Fig 3.13). Reduced mtDNA amplification
could be due to mtDNA damage, as only viable mtDNA strands are amplified. Since
mitochondria are the main site of ROS production, mtDNA is extremely susceptible to
oxidative damage (de Souza 2012). Elevated ATP production in the women from DS will
cause an increase in mitochondrial ROS production, possibly contributing to increased
oxidative damage to mtDNA.
Aside from DNA damage, the longer comet tails and decreased mtDNA amplification in
women from DS could be due to increased gene expression. Elevated ROS levels in these
women would stimulate the expression of antioxidant response genes. In order for
transcription to take place, dsDNA must unwind into ssDNA (Strachan 1999). Single
stranded DNA would migrate from the nucleosome embedded in the LMPA gel, resulting in
longer comet tails. These strands would also not be quantified during qPCR as the tracking
dye, SYBR Green, only intercalates in dsDNA. Increased gene expression is supported by the
higher levels of UCP2 (Fig 3.15), Nrf2 (Fig 3.19) and SOD2 (Fig 3.15) expression observed
in women from DS.
The elevated ATP levels in this group favours O2•-
anion radical production (Krauss, Zhang et
al. 2002). Superoxide is a potent stimulator of UCP2 expression. When O2•- anion radical
levels rise, UCP2 alters mitochondrial membrane proton conductance, to limit ATP
production and reduce O2•-
anion radical production (Echtay, Roussel et al. 2002). The major
antioxidant enzyme involved in the detoxification of mitochondrial O2•- is SOD2, which is
responsible for the conversion of O2•- anion radical to hydrogen peroxide (Limón-Pacheco
and Gonsebatt 2009). Women in DS showed increased SOD2 mRNA expression (Fig 3.17),
indicating these women were responding to higher levels of O2•- anion radicals than women
in DN. Furthermore, decreased mtDNA viability in the women from DS can attenuate O2•-
77
production and PM10 in particular has been found to cause blocks in the mitochondrial
electron transport chain, resulting in elevated O2•- anion radical production (Kamdar, Le et al.
2008). This would explain the significantly higher expression of UCP2 mRNA (Fig 3.15) and
protein (Fig 3.22) observed in women from DS.
The antioxidant response of women from DS was then evaluated. The transcription factor
Nrf2 is regarded as the master regulator of antioxidant response genes. In its inactive form,
Nrf2 remains in the cytoplasm bound to its inhibitor, Keap1. In the presence of ROS, the
sulphydryl groups of Keap1 are disrupted and Nrf2 breaks free of Keap1 and enters the
nucleus. Nrf2 heterodimerizes with small Maf proteins, binds to the ARE, and initiates the
transcription of antioxidant genes such as GST, GPx, CAT and SOD (Fig 1.5). Pregnant
women from DS showed reduced levels of Nrf2 mRNA expression (Fig 3.19) and a
significant decline in Nrf2 protein expression (Fig 3.25). The binding of Nrf2 to the ARE is
an early response to oxidative stress (Lodovici 2011). The women from DS have been
exposed to pro-oxidant air pollutants over a long period of time. Previous studies have found
that long term exposure to oxidative agents causes reduced expression of an Nrf2 stabilizing
protein ,DJ-1 (Malhotra, Thimmulappa et al. 2008). This protein also acts as a scavenger for
free radicals; hence a possible reason for the decline in Nrf2 expression in women from DS
could be due to depleted DJ-1.

78
Figure 14.1. Oxidative stress response in pregnant women from DS. The red arrows
show pro-oxidant events, while the blue arrows indicate antioxidant defence. Air
pollutants induce free radical production directly, via the induction of inflammatory
response aor by altering mitochondrial function. Women in DS had elevated ATP and
ΔΨm, favouring the production of superoxide anion radical production. Superoxide and
free radicals will then cause DNA lesions, as indicated by the increased comet tail
length, and higher MDA levels through oxidation of lipids. Increased superoxide anion
radical production by the mitochondrion will increase the risk of mtDNA damage. An
increase in superoxide levels will stimulate antioxidant response (SOD2) and UCP2
expression. Increased UCP2 expression will act as a regulatory mechanism by
increasing the proton conductance across the inner mitochondrial membrane, reducing
ATP and ΔΨm, in turn reducing superoxide anion radical production.
79
The functional relevance of a common UCP2-866G/A polymorphism in the promoter of the
gene in the oxidative stress response of pregnant women living in DS was then evaluated.
The GG genotype was almost twice as frequent in women from DS, than women from DN
(Table 3.1). Previous studies have found that this genotype is associated with higher mRNA
and protein expression of UCP2 (Emre and Nubel 2010). However, it is not understood if
higher protein expression is associated with protein function.
The GG genotype was found to have higher UCP2 protein (Fig 3.23) and mRNA (Fig 3.16)
than the AA/GA genotype in women from DS. However, MDA levels (Fig 3.3), DNA
fragmentation (Fig 3.12) and ΔΨm (Fig 3.9) were all higher in the GG genotype when
compared to the AA/GA genotype in women from DS. This indicates that this genotype
could be less effective at reducing ΔΨm, and thus attenuate mitochondrial free radical
production. The AA/GA genotype in women from DS displayed elevated ATP levels (Fig
3.7) and decreased mtDNA amplification (Fig 3.14) than the GG genotype. This could
indicate an increase in gene expression. All antioxidant response genes evaluated were up
regulated in the GG genotype in women in DS when compared to the AA/GA genotype.
SOD2 is one of the many antioxidant genes regulated by Nrf2, thus an increase in Nrf2
expression (Fig 3.20) is coupled with an increase in SOD2 expression (Fig 3.18) as seen in
the GG genotype in DS and the AA/GA genotype in DN (Motohashi and Yamamoto 2004).
The elevated SOD2 levels in the GG genotype in DS indicate that these women were possibly
producing higher levels of O2•- anion radicals than women with the AA/GA genotype. This
would explain the higher UCP2 expression and antioxidant response. Furthermore, elevated
Nrf2 protein expression in the GG genotype in women from DS could be indirectly affecting
UCP2 levels via PPARγ. Nrf2 expression will increase the transcription of ARE genes,
including PPARγ, which further stimulates UCP2 expression (Malhotra, Thimmulappa et al.
2008; Polvani 2012).

80
Although the GG genotype is associated with higher UCP2 expression than the AA/GA
genotype in women from DS, this genotype displayed higher markers for oxidative stress.
Elevated ΔΨm is characteristic of increased ROS production and the mechanism by which
UCP2 reduces mitochondrial ROS production is by reducing ΔΨm (Krauss, Zhang et al.
2002; Rousset, Mozo et al. 2007). We observed that the GG genotype, although being
associated with higher UCP2 expression, is less functional and reducing ΔΨm and
mitochondrial free radical production than the AA/GA genotype.
81
CHAPTER 5
CONCLUSION
No studies have been done in Africa investigating gene-environment interactions associated
with AAP exposure. The rapid expansion of industries in developing countries changes
environmental conditions which can have an impact on health outcomes. Genetic variation in
the proteins involved in stress response is likely to influence susceptibility to environment
associated diseases and disorders.
Oxidative stress is a likely mechanism of toxicity in many adverse health outcomes
associated with AAP exposure. Air pollution exposure resulting in oxidative stress during
pregnancy has health implications for both the mother and foetus. Mitochondria play a
pivotal role in ROS production and regulatory mechanisms can give insight into oxidative
stress response. Genetic variability in genes involved in mitochondrial response to oxidative
stress can provide genetic risk factors for oxidative stress associated health outcomes.
We found that women from the DS industrial basin did exhibit higher markers for oxidative
stress, indicating an association with air pollution exposure and increased free radical
production. Hence, we can say that women exposed to higher levels of air pollution are at
increased risk for oxidative stress. The up-regulation of UCP2 in conditions that favour
oxidative stress indicated a role in the oxidative response of pregnant mothers exposed to
AAP. By identifying these women as having increased risk for oxidative stress, targeted
therapies such as antioxidant administration, or the induction of the expression of UCP2 can
be taken into account.
The GG genotype was found to be almost twice as frequent in women from DS as women
from DN. This genotype is associated with higher expression of UCP2 at both the protein and
82
translational level. However, this genotype was less efficient at reducing mitochondrial
membrane potential and free radical production. The functional relevance of the UCP2
polymorphism cannot be evaluated in isolation, as other antioxidant proteins, such as Nrf2
and SOD2 can compensate in response to compromised UCP2 function.
Genetic variability in the UCP2 gene could potentially play a role in oxidative susceptibility
in pregnant women; however, other antioxidant and regulatory mechanisms need to be taken
into account. Further studies regarding AAP associated oxidative stress can include
epigenetic mechanisms such as microRNAs and histone modification in pregnant women
exposed to air pollution. This would give a better understanding of molecular pathways
involved in the pathogenesis of various AAP associated health outcomes.
83
REFERENCES
Al-Gubory, K. H., Fowler, P. A., Garrel, C. (2010). "The roles of cellular reactive oxygen
species, oxidative stress and antioxidants in pregnancy outcomes." The International
Journal of Biochemistry & Cell Biology 42(10): 1634-1650.
Aoki, Y., Sato H., Nishimura, N., Takahashi, S., Itoh, K., Yamamoto, M. (2001).
"Accelerated DNA adduct formation in the lung of the Nrf2 knockout mouse exposed
to diesel exhaust." Toxicol Appl Pharmacol 173: 154–160.
Arikana, S., Konukoğlua, D., Arıkanb, C.,Akçaya, T., Davas, I. (2001). "Lipid Peroxidation
and Antioxidant Status in Maternal and Cord Blood." Gynecological and Obstetric
Investigation 51(3): 145-149.
Baffy, G. (2010). "Uncoupling protein-2 and cancer." Mitochondrion 10: 243–252.
Barnes, P. J., Belvisi, M. G. (1993). "Nitric oxide and lung disease." Thorax 48: 1034-1043.
Bigagli, M. L. a. E. (2011). "Oxidative Stress and Air Pollution Exposure." Journal of
Toxicology 2011.
Bo, H., Jiang, N., Ma, G., Qu, J., Zhang, G., Cao, D., Wen, L., Liu, S., Ji, L., Zhang, Y.
(2008). "Regulation of mitochondrial uncoupling respiration during exercise in rat
heart: Role of reactive oxygen species (ROS) and uncoupling protein 2." Free Radical
Biology and Medicine 44(7): 1373-1381.

84
Bobak, M. (2000). "Outdoor air pollution, low birth weight, and prematurity." Environ Health
Perspect 108(2): 173-176.
Bobak, R. J. S. B. B. J. D. M. (2005). "Ambient Air Pollution and Pregnancy Outcomes: A
Review of the Literature." Environmental Health Perspectives 113(4): 378-382.
Boss, O., Muzzin, P., Giacobino, J. (1998). "The uncoupling proteins, a review." European
Journal of Endocrinology 139: 1-9.
Brand, M. D., Affourtit, C., Esteves, T. C., Green, K., Lambert, A. J.,Miwa, S., Pakay, J.
L.,Parker, N. (2004). "Mitochondrial superoxide: production, biological effects, and
activation of uncoupling proteins." Free Radical Biology and Medicine 37(6): 755-
767.
Brunekreef, B., Holgate, S. T. (2002). "Air pollution and health." The Lancet 360(9341):
1233-1242.
Cadenas, E. (2004). "Mitochondrial free radical production and cell signaling." Molecular
Aspects of Medicine 25(1–2): 17-26.
Campen, M. J. (2009). "Nitric Oxide Synthase: “Enzyme Zero” in Air Pollution–Induced
Vascular Toxicity." Toxicological Sciences 110(1): 1-3.
Castro-Giner, F., Künzli, N., Jacquemin, B., Forsberg, B., de Cid, R., Sunyer, J., Jarvis, D.,
Briggs, D., Vienneau, D., Norback, D., González, J. R.., Guerra, S., Janson, Christer.,

85
Antó, J., Wjst, M., Heinrich, J., Estivill, X., Kogevinas, M. (2009). "Traffic-Related
Air Pollution, Oxidative Stress Genes, and Asthma (ECHRS)." Environ Health
Perspect 117(12).
Chahine, T., Baccarelli, A., Litonjua, A., Wright, R. O., Suh, H., Gold, D. R., Sparrow, D.,
Vokonas, P., Schwartz, J. (2007). "Particulate Air Pollution, Oxidative Stress Genes,
and Heart Rate Variability in an Elderly Cohort." Environ Health Perspect 115(11).
Chomczynski, P., Sacchi, N. (1987). "Single-step method of RNA isolation by acid
guanidinium thiocyanate-phenol-chloroform extraction." Analytical Biochemistry
162(1): 156-159.
De Souza, B. M., Assmann, T. S., Kliemann, L. M., Marcon, A. S., Gross, J. L., Canani, L.
H., Crispim, D. (2012). "The presence of the -866A/55Val/Ins haplotype in the
uncoupling protein 2 (UCP2) gene is associated with decreased UCP2 gene
expression in human retina." Experimental Eye Research 94: 49-55.
de Souza, B. M., Assmann, T. S., Kliemann, L. M., Marcon, A. S., Gross, J. L., Canani, L.
H., Crispim, D. (2012). "The presence of the -866A/55Val/Ins haplotype in the
uncoupling protein 2 (UCP2) gene is associated with decreased UCP2 gene
expression in human retina." Exp Eye Res 94(1): 49-55.
De Souza, C. T., E. P. Araújo, et al. (2007). "Inhibition of UCP2 expression reverses diet-
induced diabetes mellitus by effects on both insulin secretion and action." The
FASEB Journal 21(4): 1153-1163.
86
Dejmek, J., Solanský, I., Benes, I., Lenícek, J., Srám, R. J. (2000). "The impact of polycyclic
aromatic hydrocarbons and fine particles on pregnancy outcome." Environ Health
Perspect. 108(12): 1159-1164.
Echtay, K. S., D. Roussel, et al. (2002). "Superoxide activates mitochondrial uncoupling
proteins." Nature 415(6867): 96-99.
Emre, Y. and T. Nubel (2010). "Uncoupling protein UCP2: when mitochondrial activity
meets immunity." FEBS Lett 584(8): 1437-1442.
Fleury, C. and D. Sanchis (1999). "The mitochondrial uncoupling protein-2: current status."
The International Journal of Biochemistry & Cell Biology 31(11): 1261-1278.
Giaime, E., Yamaguchi, H., Gautier, C. A., Kitada, T., Shen, J. (2012) "Loss of DJ-1 Does
Not Affect Mitochondrial Respiration but Increases ROS Production and
Mitochondrial Permeability Transition Pore Opening." 7 DOI:
10.1371/journal.pone.0040501.
Giardina, T. M., J. H. Steer, et al. (2008). "Uncoupling protein-2 accumulates rapidly in the
inner mitochondrial membrane during mitochondrial reactive oxygen stress in
macrophages." Biochim Biophys Acta 1777(2): 118-129.
Gokirmak, M., Z. Yildirim, et al. (2003). "The role of oxidative stress in bronchoconstriction
due to occupational sulfur dioxide exposure." Clinica Chimica Acta 331(1–2): 119-
126.

87
Guastella, L., Knudsen, S. (2007). South Durban Basin Multi-Point Plan: Case Study Report.
Output A2: DEAT AQA Implementation: Air Quality Management Planning. E. A. a.
Tourism. Republic of South Africa, Governance Information. C.
Gumus, S., Kipmen Korgun, D., Bilmen, S., Yargicog, P., Ag, A. (2000). "Effects of Sulfur
Dioxide Inhalation on Plasma Vitamin C and Ceruloplasmin in Ageing Rats."
Industrial Health 38: 319–322.
Gumuslu, S., D. K. Korgun, et al. (2000). "Effects of sulfur dioxide inhalation on plasma
vitamin C and ceruloplasmin in ageing rats." Industrial Health 38(3): 319-322.
Hensley, K., K. A. Robinson, et al. (2000). "Reactive oxygen species, cell signaling, and cell
injury." Free Radical Biology and Medicine 28(10): 1456-1462.
Hurtaud, C., C. Gelly, et al. (2006). "Translation control of UCP2 synthesis by the upstream
open reading frame." Cellular and Molecular Life Sciences 63(15): 1780-1789.
Ishii, T., Itoh, K.,Takahashi, S., Sato, H., Yanagawa, T., Katoh, Y., Bannai, S., Yamamoto,
M. (2000). "Transcription Factor Nrf2 Coordinately Regulates a Group of Oxidative
Stress-inducible Genes in Macrophages." The Journal of Biological Chemistry
275(May 26): 16023–16029.
Jaggernath, J. (2010). "Durban Basin: Integrating residents’ perceptions and concerns
resulting from air pollution." AJCR 10(2).

88
Ježek, P. and L. Hlavatá (2005). "Mitochondria in homeostasis of reactive oxygen species in
cell, tissues, and organism." The International Journal of Biochemistry & Cell
Biology 37(12): 2478-2503.
Jun, H. S., I. K. Kim, et al. (2008). "Effects of UCP2 and UCP3 Variants on the
Manifestation of Overweight in Korean Children." Obesity 17(2): 355-362.
Jung, K. A., Kwak, M. (2010). "The Nrf2 System as a Potential Target for the Development
of Indirect Antioxidants." Molecules 15: 7266-7291.
Kamdar, O., W. Le, et al. (2008). "Air pollution induces enhanced mitochondrial oxidative
stress in cystic fibrosis airway epithelium." FEBS Letters 582(25–26): 3601-3606.
Kelly, F. J. (2003). "Oxidative stress: its role in air pollution and adverse health effects."
Occupational and Environmental Medicine 60(8): 612-616.
Kim, J. H. and Y. C. Hong (2012). "GSTM1, GSTT1, and GSTP1 Polymorphisms and
Associations between Air Pollutants and Markers of Insulin Resistance in Elderly
Koreans." Environ Health Perspect 120(10): 1378-1384.
Kistnasamy, E. J. (2005). The relationship between asthma and outdoor air pollutant
concentrations of sulphur dioxide (SO2), oxides of nitrogen (NOx), ozone (O3) total
reduced sulphates (TRS), carbon monoxide (CO) and respirable particulate matter less
than 10 microns (PM10) in learners and teachers at Settlers Primary School in

89
Merebank, south Durban. Masters in Technology: Environmental Health, Durban
University of Technology.
Kistnasamy, M. B., Knapp, M. (1991). "The relationship between location of residency and
respiratory symptoms of primary school pupils." [Unpublished].
Kovacs, P., Ma, L., Hanson, R. L., Franks, P., Stumvoll, M., Bogardus, C., Baier, L. J.
(2005). "Genetic variation in UCP2 (uncoupling protein-2) is associated with energy
metabolism in Pima Indians." Diabetologia 48: 2292-2295.
Krauss, S., C. Zhang, et al. (2002). "A significant portion of mitochondrial proton leak in
intact thymocytes depends on expression of UCP2." Proceedings of the National
Academy of Sciences 99(1): 118-122.
Künzli, N., R. Kaiser, et al. (2000). "Public-health impact of outdoor and traffic-related air
pollution: a European assessment." The Lancet 356(9232): 795-801.
Lee, H., H. Ryu, et al. (2008). "Associations between polymorphisms in the mitochondrial
uncoupling proteins (UCPs) with T2DM." Clinica Chimica Acta 398(1–2): 27-33.
Li, N., Alam, J., Venkatesan, M. I., Eiguren-Fernandez, A., Schmitz, D., Di Stefano, E.,
Slaughter, N., Killeen, E., Wang, X., Huang, A., et al. (2004). "Nrf2 is a key
transcription factor that regulates antioxidant defense in macrophages and epithelial
cells: protecting against the proinflammatory and oxidizing effects of diesel exhaust
chemicals." J Immunol 173(3467–3481).

90
Li, N., M. Hao, et al. (2003). "Particulate air pollutants and asthma. A paradigm for the role
of oxidative stress in PM-induced adverse health effects." Clin Immunol 109(3): 250-
265.
Li, N., Hao, M., Phalen, R. F., Hinds, W. C., Nel, A. E. (2003). "Particulate air pollutants and
asthma: A paradigm for the role of oxidative stress in PM-induced adverse health
effects." Clinical Immunology 109: 250-265.
Li, N., C. Sioutas, et al. (2002). "Ultrafine Particulate Pollutants Induce Oxidative Stress and
Mitochondrial Damage." Environ Health Perspect 111(4).
Li, X. Y., Gilmour, P. S., Donaldson, K., MacNee, W. (1996). "Free radical activity and pro-
inflammatory effects of particulate air pollution (PM10) in vivo and in vitro." Thorax
51(12): 1216-1222.
Lim, J. H., Ko, M. M., Lee, H., Go, H. Y., Moon, T., Cha, M. H., Lee, M. S. (2012).
"Differential Association of Uncoupling Protein 2 Polymorphisms with Pattern
Identification among Korean Stroke Patients: A Diagnostic System in Traditional
Korean Medicine." Evidence-Based Complementary and Alternative Medicine 2012:
9.
Limón-Pacheco, J. and M. E. Gonsebatt (2009). "The role of antioxidants and antioxidant-
related enzymes in protective responses to environmentally induced oxidative stress."
Mutation Research/Genetic Toxicology and Environmental Mutagenesis 674(1–2):
137-147.

91
Liu, L., R. Poon, et al. (2008). "Acute Effects of Air Pollution on Pulmonary Function,
Airway Inflammation, and Oxidative Stress in Asthmatic Children." Environ Health
Perspect 117(4).
Livak, K. J., Schmittgen, T. D. (2001). "Analysis of Relative Gene Expression Data Using
Real-Time Quantitative PCR and the 2−ΔΔCT Method." Methods 25(4): 402-408.
Lodovici, M., Bigagli, E. (2011). "Oxidative Stress and Air Pollution Exposure." Journal of
Toxicology 2011.
Loh, E., J. S. Stamler, et al. (1994). "Cardiovascular effects of inhaled nitric oxide in patients
with left ventricular dysfunction." Circulation 90(6): 2780-2785.
Maisonet, M., A. Correa, et al. (2004). "A review of the literature on the effects of ambient
air pollution on fetal growth." Environmental Research 95(1): 106-115.
Malhotra, D., R. Thimmulappa, et al. (2008). "Decline in NRF2-regulated antioxidants in
chronic obstructive pulmonary disease lungs due to loss of its positive regulator, DJ-
1." Am J Respir Crit Care Med 178(6): 592-604.
Marnett, L. J. (1999). "Lipid peroxidation-DNA damage by malondialdehyde." Mutat Res
424(1-2): 83-95.
Maroziene, L. and R. Grazuleviciene (2002). "Maternal exposure to low-level air pollution
and pregnancy outcomes: a population-based study." Environmental Health: A Global
Access Science Source 1(1): 6.

92
Masaki, T., H. Yoshimatsu, et al. (1999). "Up-regulation of uterine UCP2 and UCP3 in
pregnant rats." Biochim Biophys Acta 1440(1): 81-88.
Masaki, T., Yoshimatsu, H., Chiba, S., Kurokawa, M., Sakata, T. (1999). "Up-regulation of
uterine UCP2 and UCP3 in pregnant rats." Biochimica et Biophysica Acta (BBA) -
Bioenergetics 1440(81-88).
Matsuzaki, S., P. A. Szweda, et al. (2009). "Regulated production of free radicals by the
mitochondrial electron transport chain: Cardiac ischemic preconditioning." Advanced
Drug Delivery Reviews 61(14): 1324-1331.
Meng, Z. and W. Bai (2004). "Oxidation damage of sulfur dioxide on testicles of mice."
Environmental Research 96(3): 298-304.
Meng, Z., G. Qin, et al. (2003). "Oxidative damage of sulfur dioxide inhalation on lungs and
hearts of mice." Environmental Research 93(3): 285-292.
Meng, Z., Qin G., Bai J., Zhang J., Zhang X., Yang Z. (2007). "Alterations of gene
expression profiles induced by sulfur." Front. Biol. China 2(4): 369–378.
Motohashi, H. and M. Yamamoto (2004). "Nrf2–Keap1 defines a physiologically important
stress response mechanism." Trends in Molecular Medicine 10(11): 549-557.
Nedergaard, J., D. Ricquier, et al. (2005). "Uncoupling proteins: current status and
therapeutic prospects." EMBO Rep 6(10): 917-921.

93
Negre-Salvayre, A., Hirtz, C., Carrera, G., Cazenave, R., Troly, M., Salvayre, R., Penicaud,
L., Casteilla, L. (1997). "A role for uncoupling protein-2 as a regulator of hydrogen
peroxide generation." FASEB J. 11: 809-815.
Niranjan, I. (2005). A case of environmental health in the South Durban Basin. Masters in
Public Administration, University of KwaZulu Natal.
Nordberg, J. and E. S. J. Arnér (2001). "Reactive oxygen species, antioxidants, and the
mammalian thioredoxin system." Free Radical Biology and Medicine 31(11): 1287-
1312.
Pecqueur, C., M. Alves-Guerra, et al. (2001). "Uncoupling Protein 2, in Vivo Distribution,
Induction upon Oxidative Stress, and Evidence for Translational Regulation." Journal
of Biological Chemistry 276(12): 8705-8712.
Polvani, S., Tarocchi, M., Galli, A. (2012). "PPARγ and Oxidative Stress: Con(β) Catenating
NRF2 and FOXO." PPAR Research 2012: 15.
Pope, C., Burnett R. T., Thun M. J., et al. (2002). "Lung cancer, cardiopulmonary mortality,
and long-term exposure to fine particulate air pollution." JAMA: The Journal of the
American Medical Association 287(9): 1132-1141.
Poston, L. and M. T. M. Raijmakers (2004). "Trophoblast Oxidative Stress, Antioxidants and
Pregnancy Outcome—A Review." Placenta 25: S72-S78.

94
Quyyumi, A. A., Dakak, N., Andrews, N. P., Husain, S., Arora, S., Gilligan, D. M., Panza, J.
A., Cannon, R. O. (1995). "Nitric oxide activity in the human coronary circulation.
Impact of risk factors for coronary atherosclerosis." J Clin Invest. 95(4): 1747–1755.
Rahman, M., Lane, A., Swindle, A., Bartram, S. (2006). Introduction to Flow Cytometry.
Serotec Ld. Endevour House. A. Serotec. Langford Lane, Kidlington, Oxford, Seotec
Ltd.
Rangasamy, T., Guo, J., Mitzner, W. A,. Roman, J., Singh, A., Fryer, A. D., Yamamoto, M.,
Kensler, T. W., Tuder, R. M., Georas, S. N., et al. (2005). "Disruption of Nrf2
enhances susceptibility to severe airway inflammation and asthma in mice." J Exp
Med 202: 47-59.
Reis, A. F., D. Dubois-Laforgue, et al. (2004). "A polymorphism in the promoter of UCP2
gene modulates lipid levels in patients with type 2 diabetes." Molecular Genetics and
Metabolism 82(4): 339-344.
Risom, L., P. Møller, et al. (2005). "Oxidative stress-induced DNA damage by particulate air
pollution." Mutation Research/Fundamental and Molecular Mechanisms of
Mutagenesis 592(1–2): 119-137.
Rousset, S., J. Mozo, et al. (2007). "UCP2 is a mitochondrial transporter with an unusual very
short half-life." FEBS Letters 581(3): 479-482.

95
Rudofsky, G., Jr., A. Schroedter, et al. (2006). "Functional polymorphisms of UCP2 and
UCP3 are associated with a reduced prevalence of diabetic neuropathy in patients
with type 1 diabetes." Diabetes Care 29(1): 89-94.
Salpea, K. D., P. J. Talmud, et al. (2010). "Association of telomere length with type 2
diabetes, oxidative stress and UCP2 gene variation." Atherosclerosis 209(1): 42-50.
Sanjuán-Pla, A., A. M. Cervera, et al. (2005). "A targeted antioxidant reveals the importance
of mitochondrial reactive oxygen species in the hypoxic signaling of HIF-1α." FEBS
Letters 579(12): 2669-2674.
Sastre-Serra, J., Company, M. M., Garau, I., Oliver, J., Roca, P. (2010). "Estrogen down-
regulates uncoupling proteins and increases oxidative stress in breast cancer." Free
Radical Biology & Medicine 48: 506–512.
Schwartz, J. (2004). "Air Pollution and Children’s Health." Pediatrics 113(Supplement 3):
1037-1043.
Seifried, H. E., D. E. Anderson, et al. (2007). "A review of the interaction among dietary
antioxidants and reactive oxygen species." The Journal of Nutritional Biochemistry
18(9): 567-579.
Shrey, K., A. Suchit, et al. (2011). "Air pollutants: The key stages in the pathway towards the
development of cardiovascular disorders." Environmental Toxicology and
Pharmacology 31(1): 1-9.

96
Sies, H. (1991). "Role of reactive oxygen species in biological processes." Journal of
Molecular Medicine 69(21): 965-968.
Sies, H. (1997). "Oxidative stress: oxidants and antioxidants." Experimental Physiology
82(2): 291-295.
Smith, P. K., R. I. Krohn, et al. (1985). "Measurement of protein using bicinchoninic acid."
Analytical Biochemistry 150(1): 76-85.
Södergren, E. (2000). Lipid peroxidation in vivo. Evaluation and application of methods for
measurement. . Doctor of Medical Science in Geriatrics - Clinical Nutrition, Acta
Universitatis Upsaliensis.
Space, L. (2012). "Animals at the extremes: Hibernation and torpor." The Open University,
2012, from
http://openlearn.open.ac.uk/mod/oucontent/view.php?id=398616§ion=3.6.
Sram, R. J., Binkova, B., Dejmek, J., Bobak, M. (2005). "Ambient air pollution and
pregnancy outcomes: a review of the literature." Environmental Health Perspectives
113(4): 375-382.
Stephens, J. W., Bain, S. C., Humphries, S. E. (2008). "Gene–environment interaction and
oxidative stress in cardiovascular disease." Atherosclerosis 200(2): 229-238.
97
Stephens, J. W., S. S. Dhamrait, et al. (2008). "Interaction between the uncoupling protein 2
−866G/A gene variant and cigarette smoking to increase oxidative stress in subjects
with diabetes." Nutrition, Metabolism and Cardiovascular Diseases 18(1): 7-14.
Strachan, T., Read A. P. (1999). Human Molecular Genetics. Chapter 1: DNA structure and
gene expression. Wiley-Liss. New York, Garland Science.
Suh, J. H., S. V. Shenvi, et al. (2004). "Decline in transcriptional activity of Nrf2 causes age-
related loss of glutathione synthesis, which is reversible with lipoic acid." Proceedings
of the National Academy of Sciences of the United States of America 101(10): 3381-
3386.
Taguchi, K., Motohashi, H., Yamamoto, M. (2011). "Molecular mechanisms of the Keap1–
Nrf2 pathway in stress response and cancer evolution." Genes to Cells 16(123-140).
Thannickal, V. J. and B. L. Fanburg (2000). "Reactive oxygen species in cell signaling."
American Journal of Physiology - Lung Cellular and Molecular Physiology 279(6):
L1005-L1028.
Turrens, J. F. (2003). "Mitochondrial formation of reactive oxygen species." The Journal of
Physiology 552(2): 335-344.
Vogler, S., Goedde, R., Miterski, B., Gold, R., Kroner, A., Koczan, D., Zettl, U., Rieckmann,
P., Epplen, J. T., Ibrahim, S. M. (2005). "Association of a common polymorphism in

98
the promoter of UCP2 with susceptibility to multiple sclerosis." J Mol Med 83: 806-
811.
Wang, X., H. Ding, et al. (1997). "Association between air pollution and low birth weight: a
community-based study." Environ Health Perspect 105(5): 514-520.
Xu, Z., X. Xu, et al. (2011). "Ambient particulate air pollution induces oxidative stress and
alterations of mitochondria and gene expression in brown and white adipose tissues."
Particle and Fibre Toxicology 8(1): 20.
Yang, W. and S. T. Omaye (2009). "Air pollutants, oxidative stress and human health."
Mutation Research/Genetic Toxicology and Environmental Mutagenesis 674(1–2):
45-54.
Ziemann, C., T. Hansen, et al. (2010). "Genotoxicity testing of sulfur dioxide (SO2) in a
mouse bone marrow micronucleus test complemented with hematological endpoints."
Mutat Res 697(1-2): 38-46.
Ziqiang Meng, G. Q., Bo Zhang, Hong Geng, Quli Bai, Wei Bai, Chengyun Liu (2003).
"Oxidative damage of sulfur dioxide inhalation on lungs and hearts of mice."
Environmental Research 93: 285–292.
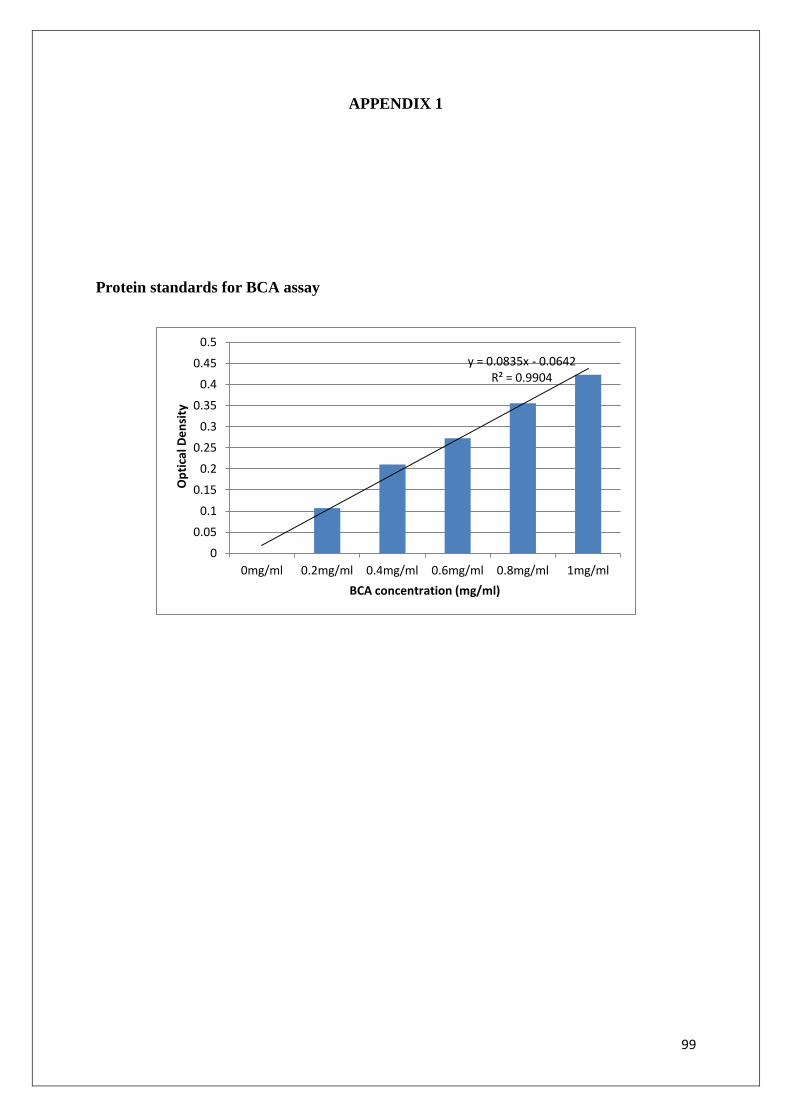
99
APPENDIX 1
Protein standards for BCA assay
y = 0.0835x - 0.0642 R² = 0.9904
0
0.05
0.1
0.15
0.2
0.25
0.3
0.35
0.4
0.45
0.5
0mg/ml 0.2mg/ml 0.4mg/ml 0.6mg/ml 0.8mg/ml 1mg/ml
Op
tica
l De
nsi
ty
BCA concentration (mg/ml)
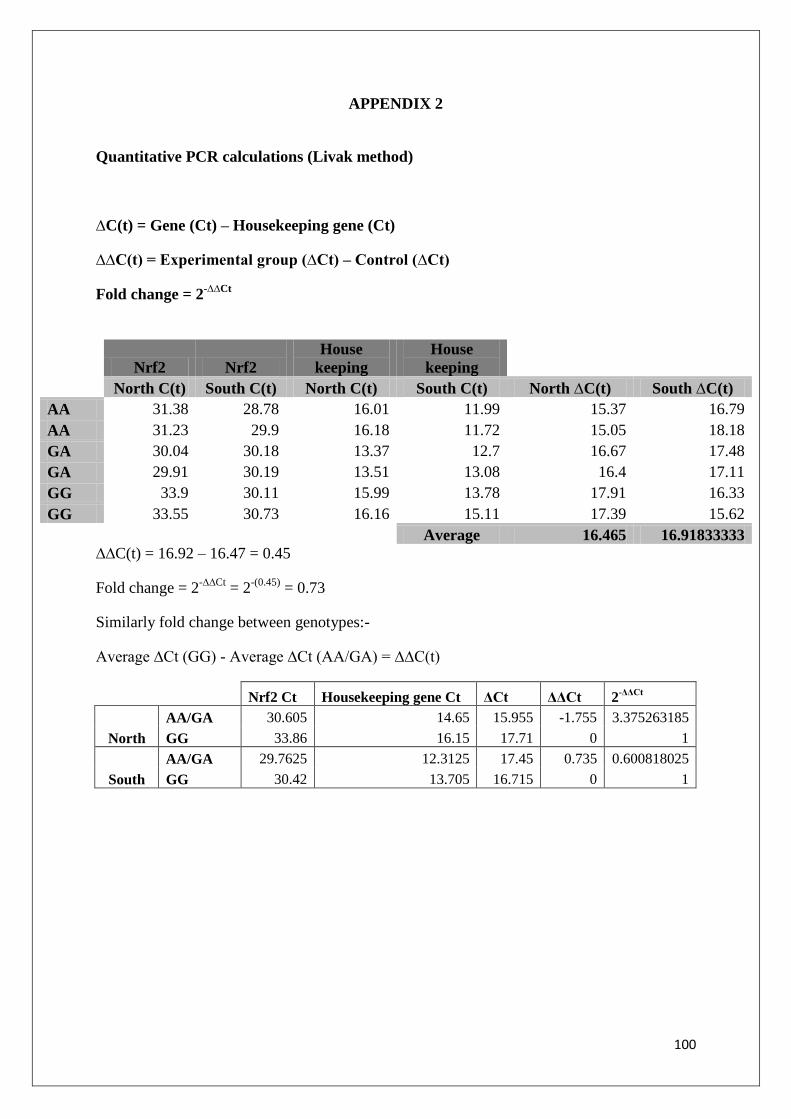
100
APPENDIX 2
Quantitative PCR calculations (Livak method)
∆C(t) = Gene (Ct) – Housekeeping gene (Ct)
∆∆C(t) = Experimental group (∆Ct) – Control (∆Ct)
Fold change = 2-∆∆Ct
∆∆C(t) = 16.92 – 16.47 = 0.45
Fold change = 2-∆∆Ct
= 2-(0.45)
= 0.73
Similarly fold change between genotypes:-
Average ∆Ct (GG) - Average ∆Ct (AA/GA) = ∆∆C(t)
Nrf2 Ct Housekeeping gene Ct ΔCt ΔΔCt 2-ΔΔCt
North
AA/GA 30.605 14.65 15.955 -1.755 3.375263185
GG 33.86 16.15 17.71 0 1
South
AA/GA 29.7625 12.3125 17.45 0.735 0.600818025
GG 30.42 13.705 16.715 0 1
Nrf2 Nrf2
House
keeping
House
keeping
North C(t) South C(t) North C(t) South C(t) North ∆C(t) South ∆C(t)
AA 31.38 28.78 16.01 11.99 15.37 16.79
AA 31.23 29.9 16.18 11.72 15.05 18.18
GA 30.04 30.18 13.37 12.7 16.67 17.48
GA 29.91 30.19 13.51 13.08 16.4 17.11
GG 33.9 30.11 15.99 13.78 17.91 16.33
GG 33.55 30.73 16.16 15.11 17.39 15.62
Average 16.465 16.91833333

101
SOD2 SOD2
House
keeping
House
keeping
North C(t) South C(t) North C(t) South C(t) North ∆C(t) South ∆C(t)
AA 29.65 26.52 16.01 11.99 13.64 14.53
AA 29.68 26.61 16.18 11.72 13.5 14.89
GA 28.93 28.95 13.51 13.08 15.42 15.87
GA 29.13 28.93 13.26 12.66 15.87 16.27
GG 33.48 28.83 15.99 13.78 17.49 15.05
GG 32.34 28.84 16.16 15.11 16.18 13.73
Average 15.35 15.05666667
North vs South
∆∆C(t) = 15.05 – 15.35 = -0.29
Fold change = 2-∆∆Ct
= 2-(-0.29)
= 1.23
Genotypes
Average ∆Ct (GG) - Average ∆Ct (AA/GA) = ∆∆C(t)
SOD2 Ct Housekeeping gene Ct ΔCt ΔΔCt 2-ΔΔCt
North
AA/GA 29.38 14.65 14.73 -2.45 5.464161027
GG 33.33 16.15 17.18 0 1
South
AA/GA 27.7525 12.34166667
15.4108
3
0.28083
3 0.82311543
GG 28.835 13.705 15.13 0 1
UCP2 Average Ct Housekeeping gene
Average
Ct
AA North 27.58 27.94 27.88 27.8 20.13 20.44 20.3 20.3
GA North 26.01 26.03 26.1 26.0 19.67 19.69
19.7
GG North 31.06 31.1 32.26 31.5 24.91 25.18 24.95 25.0
AA South 24.63 24.48 24.76 24.6 18.59 18.32 18.46 18.5
GA South 26.04 26.21 26.23 26.2 20.15 19.91 19.86 20.0
GG South 27.15 26.96 27.33 27.1 21.44 20.37 21.61 21.1

102
UCP2 House keeping gene
Average Ct
North
Average Ct
South
Average Ct
North
Average Ct
South
ΔCt
North
ΔCt
South ΔΔCt 2-ΔΔCt
28.4 26.0 21.7 19.9 6.8 6.1 -0.7 1.57886617
UCP2
Housekeeping
gene
Average Ct Average Ct ΔCt ΔΔCt
2-ΔΔCt (FOLD
CHANGE)
North
AA/GA 26.9 20.0 6.9 0.5 0.717806388
GG 31.5 25.0 6.5 0.0 1
South
AA/GA 25.4 19.2 6.2 0.2 0.888842681
GG 27.1 21.1 6.0 0.0 1
mtDNA Ct House keeping gene
Average Ct
North
Average Ct
South
Average Ct
North
Average Ct
South
ΔCt
North
ΔCt
South ΔΔCt 2-ΔΔCt
25.61428571 26.13516129 24.15714286 23.65580645 1.5 2.5 1.0 0.492361
mtDNA Ct
Housekeeping
gene
Average Ct Average Ct ΔCt ΔΔCt
2-ΔΔCt (FOLD
CHANGE)
North
AA/GA 25.42083333 23.88666667 1.534166667 0.5 0.688168296
GG 26.775 25.78 0.995 0.0 1
South
AA/GA 26.04428571 23.46761905 2.576666667 0.3 0.811314587
GG 26.326 24.051 2.3 0.0 1

103