The role of the metalloproteases ADAM8, 9, 10 and 17 in...
146
The role of the metalloproteases ADAM8, 9, 10 and 17 in leukocyte migration in vitro Von der Fakultät für Mathematik, Informatik und Naturwissenschaften der RWTH Aachen University zur Erlangung des akademischen Grades eines Doktors der Naturwissenschaften genehmigte Dissertation vorgelegt von Diplom-Humanbiologen Franz Martin Heß aus Darmstadt Berichter: Universitätsprofessor Dr. rer. nat. Andreas Ludwig Universitätsprofessor Dr. rer. nat. Martin Zenke Tag der mündlichen Prüfung: 26.06.2012 Diese Dissertation ist auf den Internetseiten der Hochschulbibliothek online verfügbar.
Transcript of The role of the metalloproteases ADAM8, 9, 10 and 17 in...

The role of the metalloproteases ADAM8, 9, 10 and 17
in leukocyte migration in vitro
Von der Fakultät für Mathematik, Informatik und Naturwissenschaften
der RWTH Aachen University zur Erlangung des akademischen Grades
eines Doktors der Naturwissenschaften genehmigte Dissertation
vorgelegt von
Diplom-Humanbiologen
Franz Martin Heß
aus Darmstadt
Berichter: Universitätsprofessor Dr. rer. nat. Andreas Ludwig
Universitätsprofessor Dr. rer. nat. Martin Zenke
Tag der mündlichen Prüfung: 26.06.2012
Diese Dissertation ist auf den Internetseiten der Hochschulbibliothek online verfügbar.


I
Index
1. Introduction............................................................................................................1
1.1. Aim of this study............................................................................................18
2. Materials and Methods...........................................................................................20
2.1. Materials, Chemicals and Equipment ................................................................20
2.2. Cell culture methods.......................................................................................33
2.3. Protein biochemistry methods .........................................................................35
2.4. Molecular biology methods..............................................................................37
2.5. Functional assays...........................................................................................40
2.6. Statistics .......................................................................................................42
3. Results .................................................................................................................43
3.1. Comparison of ADAM8, 9, 10 and 17 expression in different leukocytic, endothelial
and epithelial cell culture lines....................................................................................43
3.2. The effect of ADAM-inhibitors on leukocyte migration........................................44
3.3. Lentiviral shRNA-based knock-down of ADAM 8, 9, 10 and 17............................48
3.4. Effect of ADAM10 and 17 silencing on shedding activity.....................................55
3.5. Role of ADAM 10 and ADAM 8, 9, 17 for transmigration and chemotaxis of THP1
cells 58
3.6. Role of ADAMs for the sensitivity of LV-THP1 cells towards different MCP-1
concentrations ..........................................................................................................70
3.7. The effect of ADAM8, 9, 10 and 17 knock-down on the Ca2+ response of THP1 cells
to MCP-1 ..................................................................................................................72
3.8. Influence of ADAM8, 9, 10 and 17 knock-down on adhesion of THP1 cells to
VCAM-1 and fibronectin under static conditions ...........................................................76
3.9. Role of ADAM8, 9, 10 and 17 gene silencing on epithelial cell migration..............79
3.10. Remarks........................................................................................................82
4. Discussion ............................................................................................................83
4.1. Conclusion.....................................................................................................97

II
5. Summary............................................................................................................ 104
6. Literature ........................................................................................................... 106
7. List of abbreviations ............................................................................................ 122
8. List of figures...................................................................................................... 128
9. List of tables ....................................................................................................... 131
10. Appendix ........................................................................................................ 132
10.1. Plasmid maps .............................................................................................. 132
10.2. Complementary figure: Comparison of ADAM8, 9, 10 and 17 expression in different
leukocytic, endothelial and epithelial cell culture lines................................................. 136
10.3. Complementary figures: Relative number of migrated ADAM8, ADAM9 or ADAM17-
KD LV-THP1 in transmigration and chemotaxis assay. ................................................ 137
11. Publications..................................................................................................... 139
12. Curriculum Vitae.............................................................................................. 140
13. Declaration ..................................................................................................... 141
14. Acknowledgements .......................................................................................... 142

1
1. Introduction
Inflammation is the organism’s defence response to invading pathogens such as bacteria,
virus or parasites as well as to traumas caused by tissue damage, wound injury or tumours.
Without inflammation the organism would be unable to fend off infections or induce tissue
repair after a trauma. However, the coin has two faces: excessive inflammatory responses
are responsible for a variety of disorders including septic shock, autoimmune diseases or
chronic inflammatory diseases such as asthma, atherosclerosis, fibrosis, rheumatoid arthritis
and even cancer. Given its importance and the consequences for the organism, inflammation
is as tightly controlled as embryogenesis, metabolism, cell proliferation and other crucial
complex biological processes.
Metaphorically speaking, the vasculature constitutes the front line in the war of
inflammation. It provides a barrier for the circulatory system, which transports the troops –
the leukocytes – to the battle being waged by the inflammatory response. One of the first
responses in the inflammation process is the dilatation of the vasculature near the site of
inflammation. This results in a reduction of the blood flow rate. The permeability of the
endothelium in the microvessels increases and leukocytes are recruited to the site of
inflammation. Later stages of inflammation include neovascularisation and the repair of the
affected tissue. Different cell vascular cells take part in these processes: endothelial cells,
smooth muscle cells, resident macrophages, platelets and the leukocytes of the blood flow.
The process of leukocyte recruitment itself is subdivided into several steps: the inflammatory
activation of the tissue at the inflammation site, the rolling of the leukocytes on the activated
endothelium, their tight adhesion and finally the transmigration or diapedesis of the
leukocytes through the endothelium. Having overcome the endothelial barrier the leukocytes
migrate, guided by the gradient of chemotactic stimuli, to the inflammation site, where they
do their duty fighting in the cause of inflammation.
Since leukocyte recruitment to the site of inflammation is one of the critical hallmarks in
inflammation, it is tightly controlled and finely tuned. Proteins that are involved in the
modulation of these events belong to the families of cytokines, chemokines, growth factors
and adhesion molecules. To coordinate this critical process most of the mediators of
inflammation are tightly regulated on the transcriptional level. Several of the mentioned
molecules undergo posttranslational modifications as well.

2
Many of the effector proteins of inflammation are initially expressed as transmembrane
proteins on cells of the vasculature or leukocytes. During the process of limited proteolysis or
shedding, soluble variants of these molecules are released into the surrounding tissue.
Several proteins of the A Disintegin And Metalloproteinase (ADAM) family are involved in the
shedding of proteins that regulate inflammation responses and leukocyte recruitment1–4. The
most prominent member of the ADAM family, ADAM17 actually received its common name
TACE (tumour necrosis factor-α-converting enzyme) because it activates one of the most
important mediators of inflammation – the cytokine TNF-α – by proteolytic cleavage5.
Figure 1: The process of leukocyte recruitment.
In the early inflammatory activation cytokines and chemokines are released by resident macrophages and smooth muscle cells of the affected tissue. Cytokines like TNFα and IL-1 lead to the activation of the adjacent endothelial cells which shed cell-cell adhesion molecules and express adhesion molecules on their surface. The endothelial permeability increases, chemokines diffuse easier into the vascular space and are presented on the activated endothelium. Leucocytes of the vasculture interact via their adhesion molecules with the adhesion molecules of the activated endothelial cells. This initiates the leukocytes’ process of slow rolling on the endothelium. The interaction of leukocytic integrins with endothelial adhesion molecules VCAM-1, ICAM-1 and membrane bound chemokines leads to the firm adhesion of the leukocytes. The increased permeability of the endothelium facilitates the subsequent transendothelial migration or diapedesis of the leukocytes.
Cytokines
The first and most crucial step in almost all inflammatory responses is the release of
cytokines by cells in the affected tissue. Cytokines are small signalling proteins which are
3
responsible for intercellular communication and the coordination of the inflammatory
responses. The released cytokines bind specific receptors on neighbouring cells (paracrine
signalling) or even on the cells which initially produced them (autocrine signalling). Often the
released cytokines have systemic effects on the whole organism as well (endocrine
signalling). The activated cytokine receptors initiate intracellular signalling cascades which
result in changes in the function of the affected cells.
Cytokines are released by all nucleated cells of the body. Among the most prominent
cytokines are TNFα, TGFβ (transforming growthfactor-β), the Interferons and numerous
members of the Interleukin family. Resident macrophages are the main producers of
cytokines in the early stage of inflammation. Endothelial and epithelial cells together with
smooth muscle cells are other key contributors in the inflammatory cytokine release.
Early on in the inflammation process, Interleukin-1 (IL-1) and TNFα lead to the activation of
the endothelium. In response, the activated endothelial cells express adhesion molecules
such as P- and E-Selectin, VCAM-1 and ICAM-1. The released TNFα leads to increased
endothelial permeability, which allows for the perfusion into the vasculature of chemokines
produced by the inflamed tissue cells.
Chemokines
Chemokines are a subclass of cytokines that mediate the directed chemotaxis of leukocytes
and other responsive cells, hence their name, which is an abbreviation for chemotactic
cytokines. Chemokines have a distinct tertiary protein structure which is generally formed
by two disulfide bonds between four cysteins in their protein sequence. At their N-terminus,
the spacing between the two neighbouring cysteins which form the two disulfide bonds is
used for their scientific nomenclature. In the case of CC-chemokines there is no amino acid
residue between those cysteins, while in CXC-chemokines there is one additional amino acid.
In CX3CL1 – the only member of the CX3C-familiy – there are three amino acid residues
between the two cysteins.
Chemokines are recognized by their corresponding chemokine receptors on cells which are
recruited to the site of chemokine release6. The attracted cells migrate along the
concentration gradient of the released chemokines7. Chemokine receptors possess seven
transmembrane spanning regions and signal via coupled G-proteins. After binding their
corresponding chemokines the chemokine receptors activate their G-proteins. This leads to
the release of the second messengers diacylglycerol (DAG) and inositol triphosphate (IP3).

4
IP3 initiates the release of calcium from the intracellular stores of the endoplasmatic
reticulum. The released calcium is part of the triggered signal cascade that finally leads to
events such as chemotaxis and the activation of adhesion molecules such as the integrins
expressed on leukocytes.
A well studied example of chemokine induced recruitment of leukocytes is the recruitment of
neutrophil granulocytes induced by IL-8 (CXCL8)8. CCL2 or monocyte chemotactic protein-1
(MCP-1) is another chemokine whose function is well known9. MCP-1 binds the receptor
CCR2 on monocytes which are then guided to the inflammation site10. The monocytes which
migrate out of bloodstream can differentiate into resident macrophages. In the inflamed
tissue, it is their task to take on bacterial pathogens via phagocytosis and therefore they are
crucial for the first line of defence. They are also capable of releasing important cytokines
and to present foreign antigens. They thereby initiate and modulate later stages of immune
response. One prominent example for the role of the MCP-1-CCR2-axis in disease is the
recruitment of monocytes in the formation of plaques in arthrosclerosis11.
There are only two chemokines known which are expressed as transmembrane protein:
CX3CL1 and CXCL16. Both chemokines are shedding substrates for members of the ADAM
family. After the shedding process their chemokine domain is released from the endothelial
cell surface where both are predominantly expressed. Soluble CX3CL1 is a potent
chemoattractant for T-cells and monocytes whereas the membrane-bound form induces
strong leukocyte adhesion12,13.
Adhesion molecules
Adhesion molecules are the other major class of molecules (besides the above-described
cytokines and chemokines) that is needed for leukocyte recruitment.
Shortly after the activation by cytokines, the endothelial cells express P-selectin and, with a
short delay, E-selectin. Leukocytes bind the endothelial selectins with surface molecules,
such as PSGL-1 (P-selectin glycoprotein ligand-1), carrying a Sialyl-LewisX sugar motif that is
recognized by the lectin domain of selectins. This interaction results in the so-called “slow
rolling” of the leukocytes on the endothelium which slows their movement in the bloodflow.
Endothelial proteins of the immunoglobulin superfamily such as ICAM-1 (intercellular
adhesion molecule 1) and VCAM-1 (vascular cell adhesion molecule 1) are bound by integrins
expressed on the rolling leukocytes. This leads to the next step in leukocyte recruitment, the

5
tight adhesion to the activated endothelium. Integrins are heterodimers which are composed
of specific pairs of alpha (α) and beta (β) subunits.
In addition to the adhesion molecules facilitating the adhesion of leukocytes to the
endothelium, the adhesion molecules connecting the endothelial cells to each other are of
great importance for leukocyte recruitment. Endothelial and epithelial cells are connected by
tight junctions which are impermeable to fluid and inhibit the free diffusion of molecules.
Proteins that form homodimers between neighbouring endothelial cells like VE-Cadherin and
JAM-A are essential for the integrity of the endothelial adherens and tight junctions,
respectively. Both mentioned molecules are shedding substrates for members of the ADAM-
family and undergo proteolytic cleavage on the surface of inflamed endothelial cells14–16. This
leads to increased endothelium permeability and the easier diffusion of small molecules
through the endothelium layer.
Heperansulfat-proteoglycans (HPSG) are not considered to be classical adhesion molecules,
as are the selectins, the immunoglobins or the integrins. However this class of proteins
possesses a modulating function in inflammation and influences leukocyte recruitment17,18.
The protein family of the syndecans is the most prominent class of HPSGs. There are four
known syndecans in humans; these are predominantly expressed on endothelial and
epithelial cells. Syndecans bind and present secreted cytokines, chemokines and growth
factors on the surface of endothelial cells. Thereby, they act as co-receptors for the
receptors of the mentioned molecules19,20. The surface expression of syndecans is regulated
by limited proteolysis. For instance, stimulation of lung epithelial cells by TNF-α and INF-γ
leads to an increased shedding of Syndecan-1 and -4 by ADAM1721.
Leukocyte diapedesis
The last step in the process of leukocyte recruitment to the site of inflammation is the
leukocyte transmigration or diapedesis through the activated endothelium. Once they have
left the blood vessel the leukocytes are guided by the chemotactic gradient of chemokines
such as IL8 (neutrophiles) or MCP-1 (monocytes) to the inflammation site. There they take
on and destroy pathogens by phagocytosis, by producing reactive oxygen species and by
releasing effector proteins. The step of endothelial transmigration constitutes the point of no
return for the recruited cells since all previous steps in the recruitment process are
reversible: the cells cannot leave the inflamed tissue without further differentiation into
another celltype22.

6
Although most leukocytes take the paracellular route between two adjacent endothelial cells,
transcelluar migration has been observed as well22,23. To migrate through the endothelium
the leukocytes undergo drastic changes in their shape. The signalling of the chemokine
receptors (see above) lead to the activation of several signalling kinases, such as members
of the src-kinase family. This results in the activation of small GTPases of the Rho family and
subsequently to actin polymerization and leukocyte polarization. The migrating cells form
protrusions such as podosomes or lamellipodia in which the actin filaments accumulate. With
these protrusions at their leading edge the cells squeeze themselves through the junctions
between the endothelial cells24.
Leukocytic integrins serve as anchors for the filamentous actin on the plasma membrane. To
perform the process of diapedesis, the leukocytic integrins interact with clustered ICAM-1
and VCAM-1 on the surface of the endothelial cells25,26. While ICAM-1 is bound by LFA-1
(lymphocyte function-associated antigen-1, αLβ2 integrin) VCAM-1 is recognized by VLA-4
(very late antigen-4, α4β1 integrin). Additionally, junctional adhesion molecules (JAM) are
needed for the interaction of leukocytic adhesion molecules in diapedesis, as was
demonstrated both in vitro and in vivo14,27. Leukocytic integrins, during further migration
within the tissue to the inflammation site, interact with components of the ECM such as
collagen and fibronectin.
Cell migration is a ubiquitous process necessary for many biological events beyond leukocyte
recruitment. Other crucial events include embryonic development and endothelial or
epithelial cell migration in the process of wound healing. Tumour cell migration and
metastasis are examples of the pathologic consequences of cell migration.
The function of metalloproteinases from the ADAM family has been extensively studied in the
last two decades and their crucial role in inflammation is evident1–3. However there is little
known about the direct role of leukocytic-expressed ADAMs in the process of transendothelial
migration.
Classification of Metalloproteinases
Limited regulated proteolysis, also known as shedding, is an important posttranslational
modification in higher organisms. Enzymes of the metalloprotease superfamily are the most
important sheddases. There are about 30 different families of metalloprotease which are
defined by their structural characteristics, the sequence homologies of the proteins and
similarities in their three-dimensional structure28. Metalloproteases which share the minimal

7
consensus sequence HEXXH in their catalytic domain are members of the zincins. In the
consensus sequence, the two zinc-binding histidines (H) flank the catalytic glutamate residue
(E). The group of zincins is divided into three superfamilies: the gluzincins, the aspzincins
and the metzincins (Figure 2)29.
The metzincins are mostly multidomain proteins which possess globular catalytic domains
with a size of 130-260 amino acid-residues30. These domains contain a HEXXHXXXXH…M
zinc-binding consensus motif where three histidines bind the zinc ion and a conserved
methionine-turn at the active site31. There are several families in the metzincins – these
include the astacins, pappalysins, serralysins, matrix metalloproteinases and
adamalysins/repro-lysins32.
Figure 2: Family tree of the metzincins.
The drawing shows the three dimensional structure of the catalytic site of metzincins with the common HEXXHXXXXH…M zinc-binding consensus motif and the methionine-turn. Figure taken from32
The family of the adamalysins can be further divided into the sub-families of the A Disintegin
And Metalloproteases (ADAMs) and the Snake Venom MetalloProteaes (SVMPs). While
proteins of the ADAM-family are transmembrane proteins, the members of the SVMP family
are soluble proteins. ADAMs are unique among other metalloproteases because they possess
a potential adhesion domain (the disintegrin domain) as well as a potential protease domain.

8
The members of the ADAM-TS-family (ADAM with thrombospondin domains) lack the
transmembrane domain of ADAMs and function as secreted proteins33. The thrombospondin
domain enables the ADAM-TS to bind to components of the ECM34.
The ADAM family of metalloproteinases and their structure
Twenty years ago ADAM1 and 2, the first members of the ADAM family, and their role in the
fertilization process were identified35,36. Since then more than 40 ADAM genes have been
discovered in various species37. The human genome contains 23 known ADAM genes33.
However, only seventeen of the 29 known mammalian ADAMs are active proteases: most
probably because many members lost critical catalytic residues over the course of
evolution38.
ADAMs are composed of an N-terminal pro-domain, a catalytic domain, a disintegrin domain,
a cystein-rich region, an EGF-like (epidermal growth factor) region followed by a single-span
transmembrane region and a cytoplasmic tail (Figure 3). The other ADAM domains besides
the catalytic domains can critically influence the proteolytic function.
Figure 3: Drawing showing the distinct domain of ADAM protease.
The prodomain (PRO), metalloproteinase domain (MP), disintegin domain (DIS), cystein-rich region (CR), epidermal growth factor like repeat (EGF), transmembrane region (TM) and the cytoplasmic domain (CD). Modified from32

9
The prodomain of ADAM proteins facilitates correct protein folding during biosynthesis by
holding the zinc ion and the protease domain in a latent state33. It also suppresses the
activity of the proteases during maturation and intracellular transport. The prodomain of
most ADMAs is cleaved from the catalytic-domain by furin proteases during the maturation of
ADAMs in the secretory pathway39. It seems, however, that in cases of some ADAM
proteases it remains bound within the catalytic cleft where it could fulfil regulatory
functions40,41.
It has been shown that the cystein rich domain of some ADAMs can interact with heparin
sulfate proteoglycans such as syndecan and with ECM proteins such as fibronetin42–44. It is
thought hat this adhesive interaction is important for the substrate specificity of the
protease45–47. However, the ADAM domain that mediates most of the adhesive functions of
ADAMs is the disintegrin domain38.
The term disintregrin originates from the closely related SVMPs (snake venom
metalloproteases, see above) where the disintegrin domain binds to the platelet integrin
receptors. This inhibits platelet integrins from interacting with their natural ligands such as
fibrinogen, which eventually causes the inhibition of platelet aggregation. This, together with
the cleavage of basement membrane proteins by the proteoltic domain of the SVMPs, leads
to the typical haemorrhaging caused by those snake venoms containing SVMPs48,49.
In ADAMs the disintegrin domain is about 90 amino acids long37. With the exception of
ADAM15, the disintegrin-like domains of ADAM-proteases do not contain the classical RGD
(Arg-Lys-Asp)-integrin binding motif of SVMP50. For several ADAMs it has been reported that
they can bind to integrins through a conserved RX6DLPEF motif in their disintegrin
domain51,52. However, ADAM10 and 17 do not posses this motif and the structural basis of
their interaction with integrins remains to be further investigated. The interaction of ADAMs
with integrins shows some redundancies since a single integrin can bind to several members
of the ADAM family while one ADAM can interact with multiple integrins53. It has been shown
that the inaction of ADAMs with integrins via their disintegrin domain can in some cases
block54 and in other cases promote55,56 cell migration independent of their proteolytic activity.
The cytoplasmic domains of ADAM proteases vary in length and sequence. It is speculated
that this domain is involved in the inside-out regulation of their proteolytic activity as well as
in outside-in signalling. Many ADAMs contain a binding site for proteins containing a Src
homology 3 (SH3)-domain37. ADAM8, 9, 10 and 17, whose role in the migration of leukocytes
were analysed in this study, contain such SH3-binding sites. Furthermore, the cytoplasmic
tails of several ADAMs contain potential phosphorylation sites. It is speculated that

10
phosphorylation of residues from the cytoplasmic tail affects ADAM proteolytic activity and
intracellular trafficking57. The phosphorylated cytoplasmic tail of ADAMs could also act as
adaptor in the assembly of protein complexes at the critical site of functional activity48.
The most prominent function of ADAMs is their shedding activity which is performed by their
catalytic domain. The proteolytic function is best studied for ADAM10 and ADAM17. As
outlined below these proteases shed numerous substrates on the cell surface and seem to
be vital for various events during development, immune regulation and regeneration. In
contrast, significantly less substrates exist for ADAM8 and ADAM9 and only little is known
about the role of these proteases under physiological and pathophysiological conditions.
A
B
C
Figure 4: The implication of ADAM-shedding on various substrate molecules.
A: Shedding of membrane-bound proforms of cytokines or growth factors which results in the release of their soluble form. The mature factors are then able to act either as agonist or antagonist of their respective receptors. B: Shedding of adhesion molecules. ADAMs are known to shed adhesion molecules from endothelial and leukocytic cells and thereby facilitate cell detachment. C: Regulated intramembrane proteolysis: ADAMs can cleave the extracellular domain of membrane proteins which are then further processed by the γ-secretase complex. In case of Notch, cleavage by ADAM10 enables the γ-secretase to further process the truncated molecule within the cell membrane. This results in the release of the intracellular fragment that then acts as transcription factor.

11
Shedding refers to the ectodomain release of a transmembrane protein by limited
proteolysis. Several cytokines and growth factors are initially expressed as membrane-bound
proforms. Shedding of these proforms results in their release as soluble factors which
enables the molecules to function as auto- or parakrine stimulus (Figure 4A). Prominent
examples of such factors are TNFα, the chemokine CX3CL1 and all members of the EGF-like
family. Several adhesion molecules are also subject to shedding (Figure 4B). Their proteolytic
cleavage results in the loosening of intercellular adhesion. For example, the shedding of the
endothelial adhesion molecules JAM-A and VE-Cadherin results in increased vascular
permeability due to the loosening of the intercellular tight and adhesion junctions. Regulated
intramembrane proteolysis by the γ-secretase-complex – which results in the release of an
intracellular fragment – generally requires the preceding shedding of the extracellular
domain of the cleaved protein (Figure 4C). Notch and the amyloid precursor protein (APP)
are well-studied proteins that undergo a so-called α-cleavage by ADAM proteases before
being further processed by the γ-secretase-complex.
ADAM17
ADAM17 was the first member of ADAM family of metalloproteases which was identified as a
sheddase58. Due to its proteolytic processing of TNFα and its release as a soluble protein, it
was initially named TACE (TNF-alpha Converting Enzyme)5. As mentioned above, TNFα is
one of the key cytokines in inflammatory responses. In the following years it was shown that
multiple proteins involved in inflammation, neurodegenerative diseases, such as Alzheimer’s
disease and cancer, are shedding substrates of ADAM1759. Until now 76 shedding substrates
of ADAM7 have been identified1.
The importance of ADAM17 (particularly in development) is underlined by the fact that gene-
targeted mice with the functional disruption of the ADAM17 metalloproteinase domain die
between embryonic day 17.5 or on the day after birth. Foetuses from these mice show
abnormalities such as open eyelids and a lack of a conjunctival sac. These mice display the
same phenotype as mice deficient for transforming growth factor alpha (TGFα) 60. TGFα is
synthesized as a transmembrane precursor and has to be released from the cell surface by
ADAM17 cleavage to be functional.
The critical role of ADAM17 in inflammation was recently shown by studies of transgenic
mice with tissue-specific deletion of ADAM17. Conditional ADAM17-/- mice whose leukocytes
lack ADAM17 are protected from endotoxin-induced septic shock61, have better survival rates
12
than wild-type control mice in e. coli-mediated periotinitis62 and show reduced inflammation
symptoms in LPS-induced pulmonary inflammation63. In all three studies ADAM17-/- mice
showed markedly decreased TNFα levels after pathogen stimulation. The reduced TNFα
levels resulted in lower levels of the early responding cytokines IL1β and IL-662,63. Neutrophil
accumulation in the inflamed peritoneal cavity and lung was significantly reduced even
though it occurred significant earlier in the ADAM17-/-. This was attributed to the higher L-
selectin expression on the ADAM17-/--leukocytes since ADAM17 is the major sheddase of the
leukocytic adhesion molecule62–65.
A recent study by our group showed that the deletion of endothelial ADAM17 in mice or its
pharmaceutical inhibition reduced vascular permeability, edema formation and reduced
leukocyte recruitment in LPS-induced lung inflammation. Applying TNFα did not restore
leukocyte recruitment and edema formation. This indicates that the shedding of further
endothelial molecules by ADAM17 is necessary for the establishment of pulmonary
inflammation66.
Other examples of inflammatory cyto- and chemokines that are shed by ADAM17 are
CX3CL167,68, FLT3 ligand69 and HB-EGF70. However, cytokine receptors are also subject to
shedding by ADAM17. Prominent examples include the TNFα receptor p55 (TNF-R-I)71 and
p75 (TNF-R-II)60, the IL6-receptor72 and the IL1-receptor-II71. ADAM17 sheds as well
adhesion molecules which play crucial roles in leukocyte recruitment and inflammation such
as the above-mentioned L-selectin60, JAM-A14, ICAM-173, VCAM-174, CD4475 and syndecan-1
and -421.
The regulation of ADAM17 activity is of critical importance to the inflammation process1,3. Its
shedding activity can be enhanced by stimulation with the phorbolester PMA67,68,74 and as
well with TNFα and IFNγ14. It has been shown that isoforms of Phosphokinase C, as well as
MAP/ERK kinases, Src kinase and p38, are all involved in the regulation of ADAM17 activity76–
79. TIMP-3 (tissue inhibitor of metalloproteases-3) is an endogenous inhibitor that regulates
ADAM17 activity80.
ADAM10
ADAM10 is another, better characterized member of the ADAM-family of metalloproteases. It
is known for its prominent roles in neurodevelopment81,82 and neuroprotection 2,83 and
inflammation3. ADAM10 and ADAM17 share several shedding substrates. For instance, they
both function as so-called α-secretases by cleaving the amyloid precoursor protein (APP).

13
The α-cleavage of APP by ADAMs protect it from being processed by β-secretases and from
subsequent processing by the γ-secretase, which results in the release of an intracellular
fragment and the formation of amyloid plaques. Therefore, the α-secretases activity of
ADAMs prevents amyloid plaque formation in the development of Alzheimer’s disease82,84.
Other common substrates of ADAM10 and 17 are the transmembrane chemokine
CX3CL113,68, the receptor of IL-685 and TNFα86, among many other substrates.
Mice carrying a targeted disruption of the ADAM10 gene have a severe phenotype with
development defects in the central nervous and cardiovascular system which causes their
death at embryonic day 9.587. The ADAM10-deficient mice display a similar phenotype just as
mice deficient for Notch87,88. The Notch-signalling pathway is highly evolutionary conserved
as it important in the fruit-fly Drosophilia, the nematode c. elegans and mammals. It is
essential for the establishment of intercellular contacts and regulates cell fate at all
developmental stages of the nervous system. It is thought that the ADAM10 knockout in
mice has similar effects like the deletion of the ADAM10-homolog Kuzbian in Drosophila89. In
Kuzbian deficient fruit-flies the transmembrane protein Notch cannot be shed and signalling
via its ligands Delta and Serrate is aborted, which leads to severe developmental
abnormalities90.
Other molecules which have crucial roles in neurodevelopment and which are subject to
ADAM10-shedding are members of the ephrin-ligand family91,92. Ephrin guides migrating
neurons which bind ephrins through their Eph receptors. The receptor-ligand interaction
induces bidirectional signalling between the cells and a cell-cell repellent reaction. The study
describing the shedding of Ephrin-A5 by ADAM10 also indicated that trans-shedding-events
by ADAMs can occur92.
The important role of ADAM10 in cancer has been summarised in several reviews 2,37,83,93,94.
ADAM10 releases the epidermal growth factor receptor (ErbB) HER2/ErbB2 from the cell
membrane of tumour cells. This results in the ligand independent signalling of the receptor
which leads to the proliferation of the cells95. Together with ADAM17, ADAM10 is the major
sheddase for many ErbB ligands96 such as EGF (epidermal growth factor) and betacullin97–99.
The shedding of adhesion molecules such L1-CAM100, CD44101, C4.4A102, N- and E-
Cadherin103,104 by ADAM10 contributes to tumour cell migration and metastasis.
In inflammatory events, the ADAM10 mediated shedding of CD44, IL-6-receptor and TNFα
contributes to inflammatory responses. Compared to ADAM17, ADAM10 seems to be less
important for TNFα shedding and therefore is not made responsible for the generation of
proinflammatory TNFα. ADAM10 also sheds the transmembrane chemokines CX3CL1105 and

14
CXCL16106. Both transmembrane molecules mediate leukocyte adhesion by tightly binding
their chemokine domain to the chemokine receptors CX3CR1 and CXCR6, respectively.
Shedding of the transmembrane chemokines resolves this interaction and leads to the
release of bound leukocytes12,107. ADAM10 shedding of the endothelial adhesion molecule VE-
Cadherin contributes to increased vascular permeability and leukocyte migration15.
Fas ligand (FasL) is an important regulatory lymphoid surface protein which is shed by
ADAM10108. Binding of FasL, which is expressed by activated T Cells and natural killer (NK)
cells, to its receptor Fas on adjacent cells triggers the apoptosis of the cells expressing the
Fas receptor. It is thought that cleveage of FasL is an important regulator of apoptosis109.
The low affinity IgE receptor CD23 – which is expressed on B-cells and is involved in allergic
Figure 5: Involvement of ADAMs in inflammatory activation and leukocyte recruitment.
This figure complements Figure 1 by showing the role of different of shedding events of ADAM proteases in leukocyte recruitment. The most prominent shedding substrates of ADAM8, 10 and 17 which are involved in activation of the inflamed tissue and leukocyte rolling, adhesion, transmigration and chemotaxis are shown. The influence of the shedding of these substrates is discussed in detail in the text. Modified from3.

15
responses by its regulation of IgE production110 – is shed by ADAM10 as well111. Transgenic
mice with a B-cell specific ADAM10 knockout show defects in B-cell development112 and in
their antibody response to T-cell dependent antigen immunization113.
Like other ADAMs, ADAM10 is expressed as an inactive protease since its prodomain holds
the catalytic domain in an inactive state. It is activated by proteolytic cleavage of the furin
protease during its maturation in the secretory pathway. ADAM10 proteolytic activity can be
suppressed by the addition of its own soluble prodomain114. ADAM10 activity is potently
blocked by the endogenous inhibitory proteins TIMP1 and to a lesser degree by TIMP3115. In
cell culture, ADAM10 activity can be induced by stimulation with the calcium-ionophore
ionomycin12. It has also been shown that ADAM10 shedding activity is affected by changes in
membrane fluidity116.
ADAM8
ADAM8 and its function is less studied and understood than the more prominent members of
the ADAM family ADAM10 and ADAM1789. However, it has been shown that ADAM8 is
capable of cleaving such ADAM10 and ADAM17 substrates as APP117, TNFα-RI118, L-seletin119
and VCAM-1120. A screen with peptides containing cleavage sites of substrates from other
ADAM proteases revealed that CD16, CD23, TGFα and TNFα are potential ADAM8
substrates117. Experiments with ADAM8-deficient mice revealed that ADAM8 is a non-
essential protein in healthy animals since ADAM8-deficient mice show no pathological
abnormalities121. One explanation of this finding may be the redundancy of substrates that
ADAM8 shares with other ADAM proteases.
Similar to most metalloproteases of the metzincin family, ADAM8 has been associated with
processes of cancer development and progression. Many tumours show high expression and
protein level of ADAM8 which is a indicator of increased tumour invasiveness and a reduced
survival rate for the tumour patients. This has been demonstrated for pancreatic duct
carcinoma122, primary brain tumours123, primary lung cancer124, prostate cancer125 and renal
cell carcinoma126.
It has been shown that ADAM8 is involved in the inflammatory process of rheumatoid
arthritis. In human patients with this disease an increased number of ADAM8-expressing
cells was found at the edge between the eroded cartilage and bone127. These findings were
corroborated by a study showing that mice expressing an catalytic inactive variant of ADAM8
did not develop such severe arthritis as wild-type control mice128.

16
ADAM8 has been associated with the establishment of asthma in ovalbumin-induced murine
asthma models. Its expression was upregulated in airway epithelia, airway smooth muscle
cells and leukocytic cells that infiltrated the lung parenchyma after challenging the animals
with the allergen129,130. ADAM8-/--mice as well as chimeras of wt mice which had been
transplanted with bone marrow from ADAM8-/--mice were found to be less responsive to
allergen exposure in experimental asthma. In mice with ADAM8-/- leukocytes, less infiltrating
cells were found in the lung tissue and the bronchio-alveolar lavage. This indicates that
ADAM8 influences leukocyte recruitment and migration in experimental asthma131.
A study of the same group found that ADAM8 influences T-cell maturation in the thymic
medulla which coincided with changes in general morphology of the thymus132. A recent
study showed that ADAM8 influences the rolling of leukocytes via the shedding of P-selectin
glycoprotein ligand-1 (PSGL-1) and thereby affects leukocyte migration133.
ADAM8 does not need a second protease for the removal of its inhibitory prodomain like
ADAM10 since this happens by autoproteolysis134. ADAM8 is not inhibited by any of the
known TIMP members135.
ADAM9
ADAM9 or meltrin-γ is a member of the ADAM-family whose function still remains unclear.
Knock-out mice lacking ADAM9 expression show no deficits in development and adult life and
are fertile and viable136. It was found though that ADAM9-/- mice develop retinal
degeneration later in life137.
ADAM9 may act as α-secretase of APP138 but does not seem to be as relevant as ADAM10
and ADAM17. ADAM9 has also been shown to be a sheddase of HB-EGF (heparin-binding
EGF-like growth factor)139. The shedding of both APP and HB-EGF was not affected in
ADAM9-/- animals, thus indicating that the shedding activity of other ADAMs may compensate
for ADAM9 loss. Interestingly, ADAM10 is a shedding substrate of ADAM9, as was shown by
two working groups140,141. Other shedding substrates of ADAM9 include cKit-ligand142, the
Notch ligand Delta-like-1143, VCAM-1144 and VE-Cadherin144.
It has been shown for ADAM9 that it can function as an adhesion molecule by binding to
α6β156, α9β1
52, αvβ5145 integrins via its disintegrin domain. Studies of ADAM9 expression in rat
kidneys showed that is located on the basolateral surface of tubular cells. It mediates the
adhesion to the basal membrane via the binding of the disintegrin domain to β1-integrin and
is essential for the maintenance of cell morphology146,147.

17
ADAM9 overexpression is a poor marker for the prognosis in prostate cancer148 and renal
cancer149. It is overexpressed in breast150, pancreas151, skin152, liver153 and lung154 carcinoma
as well.
ADAM9-/- mice show accelerated wound healing compared to wild-type control mice. The
faster closure of skin wounds occurred without changes in the numbers of infiltrating
leukocytes in the wound. The authors of this study attributed the faster recovery to
increased keratinocytes migration, since re-epithelialization was significantly faster in
ADAM9-/- than in wild-type animals155. To date no endogenous inhibitory proteins for ADAM9
have been reported135.
Table 1: Shedding substrates of ADAM8, 9, 10 and 17 which are involved in inflammatory
responses and leukocyte migration.
The substrates and their shedding by the ADAM proteases are discussed in detail in the text.
cytokines or growth
factors
cytokine or growth
factor
receptors
leukocytic adhesion
molecules
endothelial adhesion
molecules
cleavage of regulators of
leukocyte
development
ADAM8 cKit-ligand
TGFα
TNFα
TNF-RI
L-selectin
PSGL-1
VCAM-1
ADAM9 cKit-ligand
HB-EGF
VCAM-1
VE-Cadherin
Delta-like-1
ADAM10 beta-cellulin
CX3CL1
CXCL16
EGF
TNFα
IL6-R
VEGF-RII
CD44 VE-Cadherin CD23
FasL
Notch
ADAM17 CX3CL1
FLT3 ligand
HB-EGF
TNFα
TGFα
IL1-RII
IL6-R
TNF-RI
TNF-RII
CD44
L-selectin
JAM-A
ICAM-1
VCAM-1
Syndecan1
Syndecan4

18
1.1. Aim of this study
The transendothelial migration or diapedesis of leukocytes is a very critical step in
inflammatory responses to infections or trauma. Several studies were able to show that
endothelial-expressed ADAM17 and ADAM10 are important regulators of inflammation and
leukocyte recruitment14–16,156. In vivo studies revealed that mice lacking functional ADAM17 in
leukocytes show strongly reduced recruitment of neutrophils to inflammatory sites62,63,157.
Relatively recently, ADAM8 emerged as another member of the ADAM family to influence
leukocyte recruitment. ADAM8-KO mice are protected from developing experimental
asthma131 and it was shown that ADAM8 cleaves the leukocytic adhesion molecule PSGL-1
and thereby influences the leukocyte rolling133. Two studies indicate the potential role of
leukocytic ADAM10 in transendothelial migration15,158. However, both studies focused on the
role of endothelial ADAM10 in this process and did not investigate the role of leukocytic-
expressed ADAM10 in detail. To date there is no published study directly comparing the
influence of leukocytic expressed ADAM8, 9, 10 and 17 on transendothelial leukocyte
migration in the same experimental setup.
The aim of this study was to analyse the role of leukocytic-expressed ADAM8, 9, 10 and 17
in the process of transendothelial migration and chemotaxis. Therefore, the mRNA
expression levels of these metalloproteases were assessed in cell culture lines which are
commonly used in cell culture migration assays. The effect generated by specific
pharmacological inhibitors against ADAM10 and ADAM17 in the migration of monocytic cells
was tested in an in vitro migration assay.
To analyse the effect of ADAM8, 9, 10 or 17 on the migratory abilities of leukocytes, a
lentiviral-mediated shRNA system for transcriptional gene silencing was established. The
gene silencing of each target protease in stably transduced monocytic cells was analysed and
confirmed. The migratory behaviour of the ADAM8, 9, 10 or 17 deficient monocytic cell lines
was examined in transendothelial migration and chemotaxis experiments using the
chemokine MCP-1 as stimulant for directed cell migration.
The effect of the gene silencing of the targeted proteases on the dose-dependent
responsiveness of the monocytic ADAM knock-down cell lines to MCP-1 was analysed.
Further investigations looked at whether the lack of ADAM8, 9, 10 or 17 influenced the
intracellular calcium-transients of the stable monocytic cell lines in response to MCP-1
stimulation. The influence of the gene silencing of the four proteases on monocytic cell

19
adhesion was assayed. This was performed by testing the adhesion of the cell lines to
immobilized integrin ligands (VCAM-1, ICAM-1 and fibronectin) under static conditions.
Wound healing is another process aside from leukocyte recruitment that involves cell
migration. To asses the question whether ADAMs also contribute to the movement of
adherent cells, in vitro wound healing assays were performed with epithelial cells treated
with sHRNA for knock down of ADAM8, 9, 10 or 17.
20
2. Materials and Methods
2.1. Materials, Chemicals and Equipment
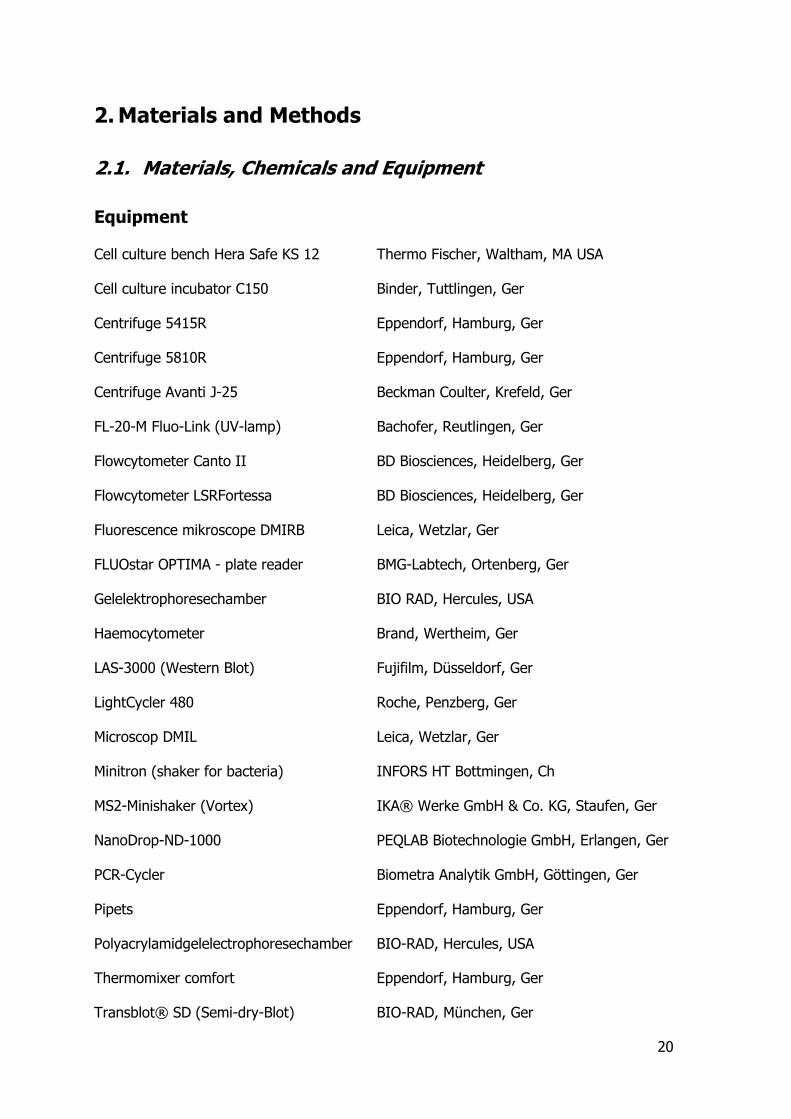
Equipment
Cell culture bench Hera Safe KS 12 Thermo Fischer, Waltham, MA USA
Cell culture incubator C150 Binder, Tuttlingen, Ger
Centrifuge 5415R Eppendorf, Hamburg, Ger
Centrifuge 5810R Eppendorf, Hamburg, Ger
Centrifuge Avanti J-25 Beckman Coulter, Krefeld, Ger
FL-20-M Fluo-Link (UV-lamp) Bachofer, Reutlingen, Ger
Flowcytometer Canto II BD Biosciences, Heidelberg, Ger
Flowcytometer LSRFortessa BD Biosciences, Heidelberg, Ger
Fluorescence mikroscope DMIRB Leica, Wetzlar, Ger
FLUOstar OPTIMA - plate reader BMG-Labtech, Ortenberg, Ger
Gelelektrophoresechamber BIO RAD, Hercules, USA
Haemocytometer Brand, Wertheim, Ger
LAS-3000 (Western Blot) Fujifilm, Düsseldorf, Ger
LightCycler 480 Roche, Penzberg, Ger
Microscop DMIL Leica, Wetzlar, Ger
Minitron (shaker for bacteria) INFORS HT Bottmingen, Ch
MS2-Minishaker (Vortex) IKA® Werke GmbH & Co. KG, Staufen, Ger
NanoDrop-ND-1000 PEQLAB Biotechnologie GmbH, Erlangen, Ger
PCR-Cycler Biometra Analytik GmbH, Göttingen, Ger
Pipets Eppendorf, Hamburg, Ger
Polyacrylamidgelelectrophoresechamber BIO-RAD, Hercules, USA
Thermomixer comfort Eppendorf, Hamburg, Ger
Transblot® SD (Semi-dry-Blot) BIO-RAD, München, Ger

21
Ultracentrifuge L7-65 Beckman Coulter, Krefeld, Ger
Consumables
All cell culture consumables (cell culture dishes, cell culture flaks, multi-well plates) were
purchased from Sarstedt (Nürnberg, Ger).
Cryovials Starlab, Merenschwand, Schweiz
Falcon-Tubes Greiner Bio-One GmbH, Frickenhausen, Ger
Filter pipet tips Tip One Starlab, Merenschwand, CH
Glas-pipets Brand GmbH & Co KG, Wertheim, Ger
Hybond-P (PVDF-Membran) Amersham, Freiburg, Ger
Nunc-Immuno™ Plate (ELISA) Nunc A/S, Roskilde, Denmark
Pipet tips (1000µL) Heinz Herenz Medizinalbedarf, Hamburg, Ger
Pipet tips (100/10µL) Sarstedt, Nürnberg, Ger
Polycarbonate ultra-centrifugation tubes Nalgene, Rochester, NY USA
Polystyrene tube, 5mL (FACS-tubes) BD biosciences, Heidelberg, Ger
qPCR-plates (96 wells) BIO Plastics, Landgraaf, NL
Transwellfilter polycarbonat
membran 8 µm Corning Inc. Costar, Schiphol-Rijk, NL
Vivaspin 500 (Proteinfilter) Satorius AG, Göttingen, Ger
Whatman paper (gel-blotting-paper) Carl Roth GmbH & Co KG, Karlsruhe, Ger
Chemicals
All chemicals used (if not mentioned below) were purchased from Merck (Darmstadt, Ger),
Sigma-Aldrich (St. Louis, USA) and Roth (Karlsruhe, Ger)

22
BM Blue POD Substrate soluble (ELISA) Roche, Prenzberg, Ger
BSA PAA Laboratories GmbH, Linz, Austria
Collagen-G Biochrome, Berlin, Ger
Complete Protease Inhibitor Roche, Prenzberg, Ger
Fibronectin Biochrome, Berlin, Ger
Fluo-3-AM Biotium, Hayward, CA USA
GelRed (gel-electrophorese of DNA) Biotium, Hayward, CA USA
GI254023X GlaxoSmithKline, Stevenage, UK
GW280264X GlaxoSmithKline, Stevenage, UK
jetPEI Poly Plus Transfections, Illkirch, F
Lipofectamine Invitrogen, Karlsruhe, Ger
Loading Dye for gel-electrophorese (DNA)
6x Orange Fermentas GmbH, St. Leon-Rot, Ger
Pluronic-F127 Biotium, Hayward, CA USA
Kits
Unless specifically noted all kits were used according to the kit manuals provided by the
manufactures.
Detection System
ECL Plus/Advanced Western Blotting Amersham, Little Chalfont, UK
LightCycler480 DNA SYBR Green I Master Roche, Penzberg, Ger
Lumigen TMA-6 (Western Blot) GE Healthcare, München, Ger
NucleoBond Finalizer (DNA-precipitation) Macherey-Nagel, Düren, Ger
NucleoBond PC 500 (maxiprep) Macherey-Nagel, Düren, Ger
NucleoSpin Extract II (DNA-gelextraktion) Macherey-Nagel, Düren, Ger
NucleoSpin Plasmid (miniprep) Macherey-Nagel, Düren, Ger

23
Protein-Assay (Bradford) BIO-RAD, München, Ger
RNeasy Mini Kit (RNA-Isolation) Qiagen, Hilden, Ger
RevertAid™ H Minus First
Strand (cDNA-synthesis) Fermentas GmbH, St. Leon-Rot, Ger
Z-CompetentTM E. Coli Transformation Buffer Set Zymo Research, Irvine, CA USA
Buffer and Solutions
Annealing-buffer for shRNA-Oligos (x2) 200nm potassium-acetate
60nM HEPES
4mM magnesium-acetate
pH 7.4
Ca2+-assay buffer HBSS (PAA)
10mM HEPES
720mg/l Probenicid
Ca2+-staining buffer Ca2+-assay buffer
2.65mM Fluo-3-AM
32nM Pluronic F-127
1% FCS
FACS-buffer Dulbecco’s PBS (PAA)
1% FCS
5mM EDTA

24
Glucoronidase substrate buffer 100mM sodium-acetate
10mM p-nitrophenyl-β-D-glucoronide
pH 4
Glucoronidase stopping buffer 400mM glycin
pH 10.3
LB-Medium 10g bakto-trypton
5g yeast extract
10g NaCl
ad 1l H2O bidest.
pH 7.0
LB-Agar 10g bakto-trypton
5g yeast-extract
10g NaCl
15g bakto-agar
ad 1l H2O bidest.
pH 7.0
Extractionbuffer for CX3CL1 PBS
1% Triton X-100
1x Complete Protease Inhibitor

25
Lysisbuffer for ADAM extraction 5 mM Tris
1 mM EGTA
250 mM Saccharose
1% Triton X-100
0.5% SDS
1x Complete Protease Inhibitor
PBS 150mM NaCl
120mM KCl
10nM Na2HPO4/KH2PO4
pH 7.4
PBST PBS
0.1% Tween 20
Running-buffer (SDS-PAGE) 25mM Tris/HCl
200mM Glycin
3.5mM SDS
pH 7.5
SDS-samplepuffer (SDS-PAGE) 20% Glycin
4.5% SDS
125mM Tris/HCl
a spatula tip of bromphenol blue
pH 6.8
for reducing conditions: 5% mercapto-ethanol
26
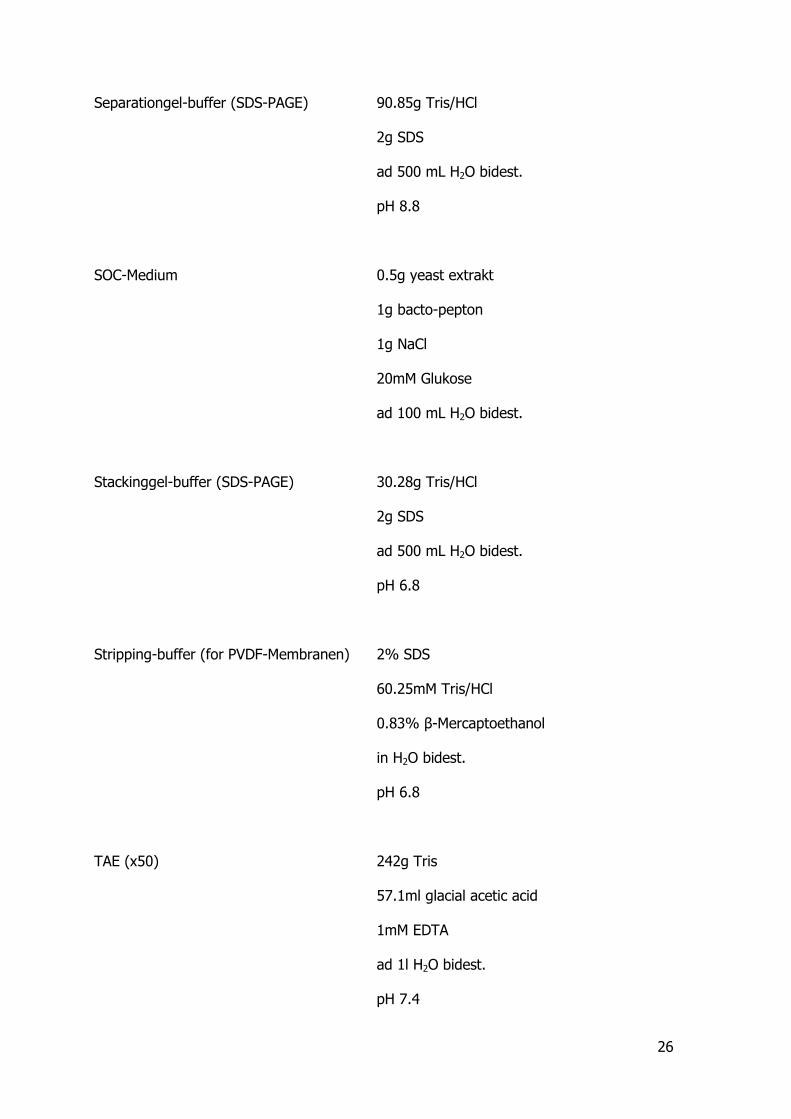
Separationgel-buffer (SDS-PAGE) 90.85g Tris/HCl
2g SDS
ad 500 mL H2O bidest.
pH 8.8
SOC-Medium 0.5g yeast extrakt
1g bacto-pepton
1g NaCl
20mM Glukose
ad 100 mL H2O bidest.
Stackinggel-buffer (SDS-PAGE) 30.28g Tris/HCl
2g SDS
ad 500 mL H2O bidest.
pH 6.8
Stripping-buffer (for PVDF-Membranen) 2% SDS
60.25mM Tris/HCl
0.83% β-Mercaptoethanol
in H2O bidest.
pH 6.8
TAE (x50) 242g Tris
57.1ml glacial acetic acid
1mM EDTA
ad 1l H2O bidest.
pH 7.4

27
Transferbuffer (western blot) 192mM Glycin
25mM Tris/HCl
10% Methanol
Cellculture-media
The following cell culture media, buffers and supplements were purchased from PAA
Laboratories GmbH, Linz, Austria:
Dulbecco’s modified Eagle Medium (DMEM) High Glucose (4,5g/mL)
Medium 199 with Earl’s Salts (M199)
Roswell Park Memorial Institute (RPMI)
Dulbecco’s PBS without Ca and Mg (PBS)
Hanks Balanced Salt Solution containing Ca and Mg (HBSS)
Fetal Calf Serum (FCS)
Penicilin-Stryptomycin (PS)
Trypsin-EDTA (TE)
The basic endothelial cell medium and growth factor kit EGM-2MV single quots for the
culture of the endothelial cell line HMVEC was purchased form Lonza, Walkersville, MD USA.
Endothelial Cell Growth Medium including the supplements for the culture of the endothelial
HUVEC cells was purchased from Promocell, Heidelberg, Ger.
Enzymes and recombinant proteins
All enzymes and reaction buffer used in the molecular cloning experiments were purchased
from Fermentas GmbH, St. Leon-Rot, Ger. For the selection of the different buffers for the
restriction enzymes the suggestion of the supplier were followed.
All recombinant cytokines, chemokines and the adhesion molecules VCAM-1 and I-CAM-1
were purchased from Peprotech, London, UK.

28
Streptavidin conjugated with peroxidase for the detection of biotin conjugated proteins in the
ELISA was purchased from Roche, Prenzberg, Ger.
Antibodies
All primary antibodies used in this study and their working dilutions are listed in Table 2.
Table 2: List of primary antibodies and their working dilutions.
Name Company Isotype Specifity Dilution Blot
Dilution FACS
ELISA
ADAM8
(MAB10311)
R&D
Systems
Mouse IgG1
Human
(AS 498 – 653)
1:500 1-5µg/ml -
ADAM9
(MAB939)
R&D
Systems
Mouse IgG1
Human
(Ectodomain)
1:500 - -
ADAM10 (MAB1427)
R&D
Systems
Mouse IgG2B
Human
(N-terminal)
1:500 1µg/ml -
ADAM17
(MAB9301)
R&D
Systems
Mouse IgG1
Human
(N-terminal)
- 4µg/ml -
CX3CL1-Biotin
(BAM365)
R&D
Systems
Mouse IgG1
Human, mouse - - 300ng/ml
CX3CL1 (MAB3652)
R&D
Systems
Mouse IgG1
Human
(chemokine domain)
- - 4µg/ml
Isotypecontrol A10
(MAB0042)
R&D
Systems
Mouse IgG2B
Isotype control
IgG2B
- 1µg/ml -
Isotypecontrol
A17 (MAB002)
R&D
Systems
Mouse IgG1
Isotype control
IgG1
- 4µg/lm -
β-Actin Abcam Mouse IgG1
Human, hamster, rat, dog, pig, rabbit, mouse
1:500 - -
The secondary antibodies used in this study are listed in Table 3.

29
Table 3: List of secondary antibodies and their working dilutions.
Name Conjugate Company Dilution blot Dilution FACS
Goat anti-mouse PE Jackson Immuno Research - 1:100
Goat anti-mouse APC Jackson Immuno Research - 1:100
Goat anti-mouse HRP Jackson Immuno Research 1:25,000 -
shRNA sequences and oligonucleotides
All shRNA sequences that were cloned into the pLVTHM plasmid were designed after the
scheme depicted in Figure 6. The 19 nucleotide long sense siRNA sequence and the reverse
complementary anti-sense siRNA sequence were separated by the 7 nucleotide spanning
loop. At the 5’-end of the sequence tandem was the transcription initiation site for the RNA
PolIII, while the multiple thymidins at the 3’-end of the oligo encode the stop signal for the
polymerase. After the transcription of the siRNA sequence tandem, both, the sense and the
anti-sense, siRNA sequence anneal and form, together with the loop region, the small hairpin
RNA (shRNA) which is then further processed to siRNA. The forward oligo (upper sequence
Figure 6) and reverse oligo (lower sequence Figure 6) are complementary. Both oligos were
designed to form overlapping “sticky” ends at the 5’ and 3’ end. This enabled the directed
ligation of the annealed oligos into the opened pLVTHM plasmid which had been digested
with the corresponding restriction enzymes MluI and ClaI.
Figure 6: General design of oligonucleotides containing the shRNA target sequences.
The sequence above represents the forward strand and the sequence below the reverse stand of the oligonucleotide pair. The sense and the anti-sense siRNA are separated by the loop region. There are overhanging “sticky” ends at either end of the oligo-dimer. The annealed oligos were ligated into the opened pLVTHM plasmid which had been digested with the restriction enzymes MluI and ClaI.
After http://lentiweb.com/cloning_strategies.php, design by Maciej Wiznerowicz.
The sequences of the oligonucleotides containing the shRNA sequences against the ADAM
proteinases are listed in Table 4 (only the sequences of the forward oligos are shown). All
oligonucleotides were ordered from Eurofins MWG Operon (Ebersberg, Ger). The oligos
containing the shRNA sequences against ADAM8 and 9 have a slightly different design since

30
they were first inserted into the pSuper plasmid (opened with BglII and HindIII) and
subsequently subcloned into the lentiviral pLVTHM vector using the restriction enzymes
EcoRI and ClaI.
The pLVTHM-scramble plasmid was a generous gift of Dr Antonio Sechi of the working group
of Prof Martin Zenke, Department for Cell Biology, University Hospital Aachen.
Table 4: List of oligonucleotides for the generation of pLVTHM plasmids for the down regulation of our target ADAM proteinases.
Name Oligonucleotide sequence (target sequence are shown in bold)
scramble CGC GTC CCC CCG TCA CAT CAA TTG CCG TTT CAA GAG AAC GGC AAT TGA TGT GAC GGT TTT TGG AAA T
shADAM8-903 GAT CCC CGC ATG ACA ACG TAC AGC TCT TCA AGA GAG AGC TGT ACG
TTG TCA TGC TTT TTA
shADAM8-1831 GAT CCC CAG AGA AGG TTT GCT GGA AAT TCA AGA GAT TTC CAG CAA
ACC TTC TCT TTT TTA
shADAM8-2645 GAT CCC CGC TGC TGT TCT AAC CTC AGT TCA AGA GAC TGA GGT TAG AAC AGC AGC TTT TTA
shADAM9-1967 GAT CCC CGA AAC TTC CAG TGT GTA GAT TCA AGA GAT CTA CAC ACT
GGA AGT TTC TTT TTA
shADAM9-2260 GAT CCC CCC AGA GAA GTT CCT ATA TAT TCA AGA GAT ATA TAG GAA
CTT CTC TGG TTT TTA
shADAM10-650 CGC GTC CCC GAC ATT TCA ACC TAC GAA TTT CAA GAG AAT TCG TAG GTT GAA ATG TCT TTT TGG AAA T
shADAM10-1947 CGC GTC CCC ACA GTG CAG TCC AAG TCA ATT CAA GAG ATT GAC TTG
GAC TGC ACT GTT TTT TGG AAA T
shADAM17-2061 CGC GTC CCC AGG AAA GCC CTG TAC AGT ATT CAA GAG ATA CTG TAC
AGG GCT TTC CTT TTT TGG AAA T
shADAM17-2642 CGC GTC CCC GAA ACA GAG TGC TAA TTT ATT CAA GAG ATA AAT TAG CAC TCT GTT TCT TTT TGG AAA T
The sequences of the oligonucleotides, which were used as primers in the quantitative PCR
(qPCR), to determine the transcript level of the respective target mRNA, are listed in Table 5.
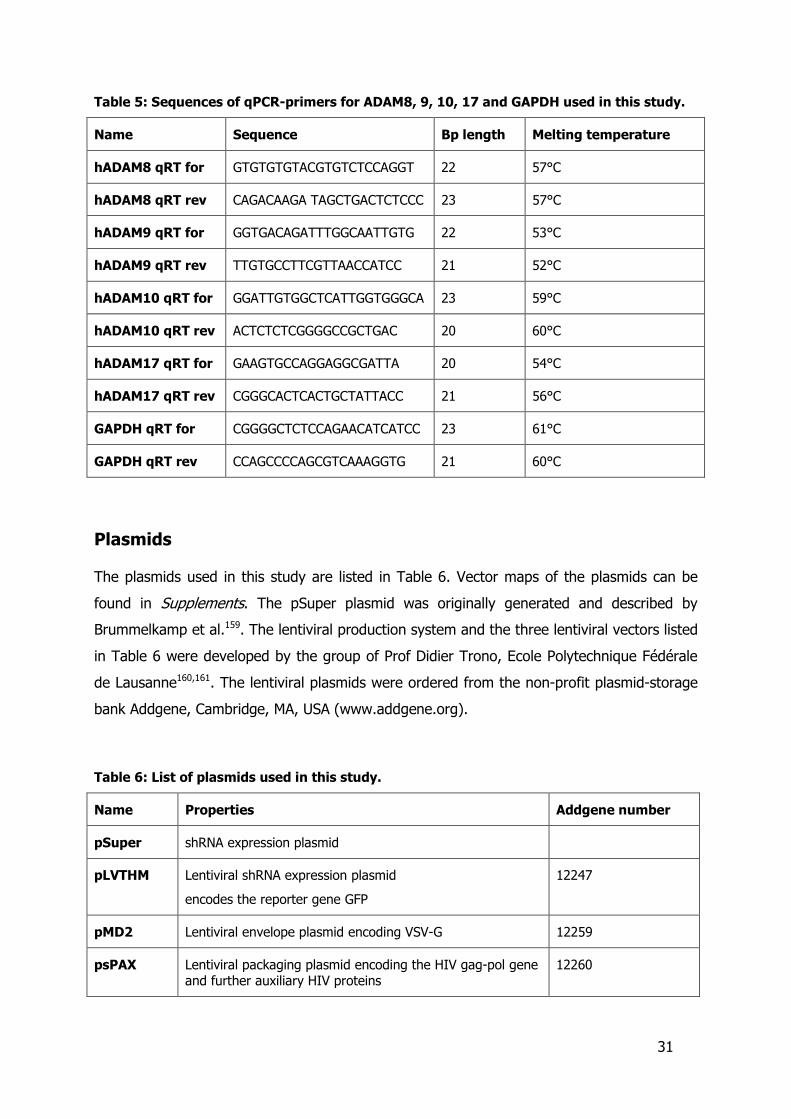
31
Table 5: Sequences of qPCR-primers for ADAM8, 9, 10, 17 and GAPDH used in this study.
Name Sequence Bp length Melting temperature
hADAM8 qRT for GTGTGTGTACGTGTCTCCAGGT 22 57°C
hADAM8 qRT rev CAGACAAGA TAGCTGACTCTCCC 23 57°C
hADAM9 qRT for GGTGACAGATTTGGCAATTGTG 22 53°C
hADAM9 qRT rev TTGTGCCTTCGTTAACCATCC 21 52°C
hADAM10 qRT for GGATTGTGGCTCATTGGTGGGCA 23 59°C
hADAM10 qRT rev ACTCTCTCGGGGCCGCTGAC 20 60°C
hADAM17 qRT for GAAGTGCCAGGAGGCGATTA 20 54°C
hADAM17 qRT rev CGGGCACTCACTGCTATTACC 21 56°C
GAPDH qRT for CGGGGCTCTCCAGAACATCATCC 23 61°C
GAPDH qRT rev CCAGCCCCAGCGTCAAAGGTG 21 60°C
Plasmids
The plasmids used in this study are listed in Table 6. Vector maps of the plasmids can be
found in Supplements. The pSuper plasmid was originally generated and described by
Brummelkamp et al.159. The lentiviral production system and the three lentiviral vectors listed
in Table 6 were developed by the group of Prof Didier Trono, Ecole Polytechnique Fédérale
de Lausanne160,161. The lentiviral plasmids were ordered from the non-profit plasmid-storage
bank Addgene, Cambridge, MA, USA (www.addgene.org).
Table 6: List of plasmids used in this study.
Name Properties Addgene number
pSuper shRNA expression plasmid
pLVTHM Lentiviral shRNA expression plasmid
encodes the reporter gene GFP
12247
pMD2 Lentiviral envelope plasmid encoding VSV-G 12259
psPAX Lentiviral packaging plasmid encoding the HIV gag-pol gene and further auxiliary HIV proteins
12260

32
Bacteria strains
For the cloning and propagation of the plasmids the following E. coli-strain was used: DH5α -
Genotype DH5α: supE44 ∆lacU 169(φ80lacZ ∆M15) hsd R17 recA1 end A1 gyr196 thi-1
relA1.
Cell lines
All cell lines which were used in this study are listed in Table 7 . In general the culture media
contained 10% FCS and penicllin (100U/ml) and streptomycin (100µg/ml). The media for the
endothelial cells HMVEC and HUVEC contained the supplements which were provided by the
supplier. All cells were cultured at 37°C and 5% CO2 in a humid atmosphere.
Table 7: List of cell lines used in this study and their respective culture media.
Name Description Culture Medium
A549 human alveolar basal epithelial adenocarcinoma DMEM
ECV304 human bladder carcinoma M199
ECV-CX3CL1 ECV304 stably expressing CX3CL1 M199 with G418 (1:100)
HEK293 human embryonic kidney cell line 293 DMEM
HEK293T Variant of HEK293-cells, stably expressing the large T-antigen
DMEM
Collagen-coat
HMVEC human microvascular endothelial cells EGM-2MV single quots
HUVEC human umbilical vein endothelial cells Endothelial Cell Growth Medium
Collagen-coat
Jurkat human T cell leukemia cells RPMI 1640
THP1 human acute monocytic leukemia cells RPMI 1640

33
2.2. Cell culture methods
Propagation of cells
All cells were kept in culture dishes (10cm diameter). When the adherent cell lines reached
full confluency, they were washed with PBS and trypsin/EDTA was added to the cells. The
cells were incubated at 37°C until they had completely detached from the dish. Then
medium containing FCS was added to the cells and they were singled out by up pipetting.
Subsequently, the cells were seeded out at the desired dilution into dishes containing fresh
medium.
The suspension cells (THP1 and Jurkat) were kept at densities of 2-10 x105cells/ml. After
generating a homogenous cell suspension by pipetting, the cells were split at ratios ranging
from 2-5 into dishes containing fresh medium. Every second split, their cell density was
determined by counting the cells with a haemocytometer (see below). The cells were then
centrifuged and resuspended in 10ml fresh medium seeded out at a density of 2x10⁵cells/ml.
Freezing and thawing of cells
To preserve the cell lines for a longer period, aliquots of each cell lines were stored in liquid
nitrogen (-196°C). To prepare the cells for the cryo-conservation, the cells were harvested at
an early passage as described above and centrifuged at 300g for 5min. They were then
resuspended in 1ml of cryo-medium (70% medium with supplements, 20% FCS, 10%
DMSO) and filled into screw-top cryo-vials. To freeze the cells, the vials were placed in a
Styrofoam-box and frozen step-wise (2h at -20°C; 48h at -80°C) before storing them in
liquid nitrogen.
To take a fresh batch of cells into culture the cryo-vials were taken out of the liquid nitrogen
and thawed in the waterbath at 37°C. Subsequently the cells were washed with 10ml of
fresh medium and centrifuged at 300g for 5min before being resuspended in 10ml of fresh
cell culture medium and being seeded out on cell culture dishes. After 24h, the medium of
the cells was changed to remove dead cells and debris.

34
Cell counting
Before cell-counting, the cells were harvested as described above and 10µl of the cell
suspension were mixed with 10µl of a 0.4% Trypan blue solution. 10µl of this mixture were
added to the haemocytometer and the cells were counted. Dead cells incorporate Trypanblue
due to their damaged cell membrane and appear blue in the haemocytometer. Blue stained
cells were excluded from the cell count.
Production and concentration of lentiviral particles
The 293T cells were used as producer cell line for production of lentiviral particles. To
produce lentivirus, the 293T cells were transfected with the lentiviral plasmids pLVTHM,
pMD2 and psPAX2. 48h before the transfection, 2x10⁶ 293T cells were seeded on a collagen-
coated 10cm culture dish. 2-3h before the transfection, the culture medium was changed.
Per dish 5µg pLVTHM, 3.25µg psPAX2 and 1.75µg pMD2 were added to 250µ NaCl-solution
(150mM). In a separate tube, 20µl JetPEI was mixed with 250µl NaCl-solution. Subsequently,
the JetPEI containing solution was added to the DNA and the solution was briefly vortex.
After an incubation of 15-30min, the DNA/JetPEI solution was added dropwise to the cells.
24h after the transfection the medium was replaced with 10ml of fresh medium. After a
further incubation of 48h, the supernatant containing the lentiviral particles was harvested. It
was centrifuged at 500g to remove debris and sterile filtered, using a 0.2µm filter. To
produce larger amounts of lentiviral containing supernatant, 15cm dishes were used and the
amount of cells, DNA, NaCl, JetPEI and medium was scaled up by the factor 2.5.
Concentration of the lentiviral containing supernatant was performed via ultracentrifugation.
25-30ml of supernatant was centrifuged in screw-top ultracentrifuge tubes in the
ultracentrifuge L7-65 at 50,000g for 2h. After the centrifugation the medium was discarded
and the pellet containing the lentiviral particles was dissolved in 50µl PBS. The concentrated
lentivirus was aliquoted and stored at -80°C.
Transduction of target cells
Adherent cells were generally transduced with unconcentrated lentivirus containing
supernatant. Just before the transduction, the target cells were harvested as described
above and seeded out on six-well plates. The wells of the six-well-plates contained 2ml of
fresh medium and 1ml of lentiviral supernatant. Polybrene was added to the medium at a

35
final concentration of 4µg/ml to increase the transduction efficiency. To transduce
suspension cells such as THP1 cells, the cells were counted and seeded out in 24-well plates
in a volume of 500µl at a density of 4x10⁵ cells/ml. Polybrene was added at a concentration
of 4µg/ml and subsequently 2µl concentrated lentivirus was added to the cell suspension.
After 24h of incubation the medium was changed. To determine the efficiency of the
transfection the GFP-expression of the cells was analysed 72h after the transduction using
either a fluorescent microscope (488nm excitation) or a flowcytometer (FITC channel).
2.3. Protein biochemistry methods
Westernblotting
Sample-preparation, preparation of SDS-PAGES, electrophoreses of the samples and semi-
dry blotting of the proteins on the PVDF-Membran was performed according to the protocols
of Molecular Cloning162.
After the prepared samples had been run of the SDS-PAGE and the proteins blotted onto the
PVDF-membrane via semi-dryblotting, the blotted membranes were blocked overnight with
PBS-T containing 5% milk powder under constant shaking at 4°C. The primary antibodies
against the protein of interest were added to the membranes in blocking buffer at the
concentrations listed in Table 2 and incubated for 1h at RT. Unbound primary antibody was
removed by washing the membrane three times in PBS-T for 10min. The corresponding
secondary antibodies were diluted in PBS-T at the concentration listed in Table 3, added to
the membrane and incubated for 1h. After three washes, the signal of horse-radish-
peroxidase (HRP) coupled to the secondary antibody was analysed in the LAS-3000-scanner.
The ECL Plus (Amersham, Little Chalfont, UK) was used as substrate solution for the
detection of the HRP.
CX3CL1-ELISA
A CX3CL1-ELISA (Enzyme-linked Immuno-sorbant Assay) was used to determine the amount
of CX3CL1 released by stable cell line ECV-CX3CL1. All samples and standards (312 to
4,875ng recombinant CX3CL1) were diluted in PBS-T containing 2% BSA. 96-well plates
(Nunc-Immuno™, Nunc A/S, Roskilde, Denmark) were coated with 4µg/ml CX3CL1 catching
antibody (MAB3652, R&D Sytems) overnight at RT. Subsequently, the wells were blocked for

36
2h with PBS-T containing 2% BSA. After washing the wells three times with PBS-T, the
samples and the CX3CL-1 standard were added and incubated for 1h at RT. After three
washes, the anti-CX3CL1 biotin-conjugated antibody was added at a concentration of
300ng/ml diluted in PBS-T and incubated for 1h. After washing three times with PBS-T,
Strepavidin-POD was added at a dilution of 1:5000 (in blocking buffer) and incubated for 1h.
After 4 washes with PBS-T, the substrate solution was added and incubated for 10-20min
until the reaction was stopped by the addition of 100µl 5% H2SO4. The absorption of the
wells was measured at 450nm in a plate reader, subtracting the readout of 550nm to correct
the value.
Glucoronidase-assay
In general, the glucoronidase assay was used to determine the number of cells which had
migrated in a transmigration or chemotaxis assay or that had adhered to the different
substrates in the adhesion assay. In the glucoronidase assay, the cell number of a given
sample was determined by measuring the β-glucoronidase-activity of the sample via the
synthetic substrate p-nitrophenyl-β-D-glucoronide.
For the glucoronidase assay, the cells were lysed using a final concentration of 0.1% Triton.
Then 100µl of the lysed cells were transferred to a 96-well and 100µl of the substrate buffer
was added. After an overnight incubation at 37°C, 100µl of the stopping buffer was added
and the absorption at 405nm was determined in the plate reader. By comparing the readout
values of the samples to the readout of a standard dilution of cells (starting number of cells
used in particular assay stepwise diluted 1:2), it was possible to determine the cell number
of the sample.
Surface staining for flowcytometry
To stain cellular surface proteins for the flowcytometry experiments, the cells were harvested
as described above and added into FACS-tubes containing 1.5ml of ice-cold PBS. After
centrifuging for 5min at 300g (this centrifugation speed and duration applied to all further
steps), the cells were resuspended in 50µl of FACS-buffer containing the respective
antibodies at the concentrations listed in Table 2. After an incubation of 30-45min on ice,
1ml of FACS-buffer was added, the cells were briefly vortexed and then centrifuged. The
cells were then resuspended in FACS-buffer containing the secondary antibodies (diluted

37
1:100). After an incubation of 30-45min on ice, 1.5ml ice-cold PBS was added to the cells
and the tube was briefly vortexed before being centrifuged. After the last wash the cells
were resuspended in 100µl ice-cold PBS and 100µl of 4% PFA was added to fix the cells and
to deactivate any remaining lentiviral particles. The stained cells were stored at 4°C. Before
the flowcytometry experiments 300µl of PBS was added to the cells to dilute the PFA.
2.4. Molecular biology methods
Cloning of pLVTHM plasmids
To insert the oligonucleotides containing the target shRNA sequences into the pLVTHM
plasmid, the lyophilised oligos were first dissolved in H20 at a concentration 300pmol/µl. 2µl
of each oligo were added to 21µl of H20 and 25µl of the annealing buffer (x2) were added.
The oligos were annealed in the PCR-cycler by heating them to 95°C for 4min and a stepwise
cooling process 4min each at 85°C, 82°C, 80°C, 78°C, 75°C, 72°C, 70°C). After pausing at
70°C for 10min, the oligos were taken out of the PCR-cycler and cooled to RT on the bench.
Subsequently the oligos were phosphorylated using PNK-kinase with the following protocol:
5µl annealed oligos
12µl H20
2µl T4 ligase buffer (x10)
1µl PNK kinase
Incubation at 37°C for 30min
Heat-deaktivation of PNK at 70°C for 10min
In the meantime, 1µg of the empty pLVTHM vector had been digested with the restriction
enzymes ClaI and MluI. The linearized plasmid-backbone was separated from the 6bp-
residue by agarose gel electrophoreses on 0.8% agarose-gel. After cutting the plasmid out of
the agarose-gel, a gel-purification (NucleoSpin Extract II-kit) was performed and the plasmid
was eluted with 20µl H20 which was warmed to 70°C. The ligation of the phosphorylated
oligos and the opened plasmid was performed using the following protocol:

38
5µl phosphorylated oligos
1µl pLVTHM (20-50ng DNA)
11µl H20
2µl T4 ligase buffer (x10)
1µl T4 ligase (1U)
After an incubation of 60-120min at RT, 4µl of the ligation-solution were used for the
transformation (see below) of 100µl competent bacteria. The transformed bacteria were
plated out on LB-agar plates containing the carbenicillin. After incubating the agar plates
overnight at 37°C, the colonies that had grown on the agar plate were picked with sterile
pipette-tips and inoculated 3ml of LB containing carbenicillin (50µg/ml). After growing the
bacteria cultures overnight (37°C, constant shaking), miniprep (NucleoSpin Plasmid, eluting
with 50µl TE) were performed to extract the plasmid DNA. The screening for positive clones
was performed by analytic restriction diges,t using the restriction enzymes ClaI and EcoRI
(2µg MiniPrep DNA, 0.2µl of each enzyme) and a subsequent agarose gel electrophoreses.
The successful insertion of the oligos was confirmed when the digested plasmid showed a
band of 286bp together with the 10.8kb band of backbone instead of a 236bp fragment
which appears when digesting the empty pLVTHM plasmid.
Transformation of bacteria
Chemical competent bacteria (Z-CompetentTM E. Coli Transformation Buffer Set) were
transformed by heat shock. After thawing the frozen bacteria on ice, 4µl of ligation reaction
or 0.1µg of purified plasmid were added to the bacteria suspension. After an incubation of
20-30min on ice, the bacteria were plated out on prewarmed (37°C) LB-agar plates and
incubated for 18h at 37°.
Propagation of plasmids (Maxiprep)
Plasmids were propagated by inoculated 200ml LB containing carbenicillin (50µg/ml) with
either 100µl of a transformed bacteria culture or a bacteria colony picked from an agar plate.
After an overnight incubation at 37°C under constant shaking maxiprep (NucleoBond PC
500) was performed according to the manual of the kit.

39
Measuring DNA and RNA concentration
The NanoDrop-ND-1000 (PEQLAB Biotechnologie GmbH, Erlangen, Ger) was used to
determine the the concentration of DNA preparations and RNA samples.
RNA isolation and cDNA synthesis
For the RNA-isolation of our cells of interest, cells were harvested as described above. The
cells were counted and 1x10⁶ cells were then washed with PBS. If the RNA-isolation was not
performed directly after the cell harvesting, the pellets of the cells were temporarily stored at
-80°C. The RNA was isolated with the RNeasy Mini Kit (Qiagen, Hilden, Ger), according to
the manual of the kit. To avoid contamination by genomic DNA, DNase-treatment was
performed during the isolation. The RNA was eluted with 20µl RNase free water. The RNA
content of the samples was determined using the NanoDrop-ND-100 and the samples were
stored at -80°C. cDNA sythesis was performed with the RevertAid™ H Minus First Strand-Kit
using 1µg of the isolated RNA per reaction.
Quantitative PCR
The quantitative PCR (qPCR) was performed in the LightCycler 480 (Roche, Penzberg, Ger)
using 96-well plates. The mastermix for the qPCR-reaction was made using the following
recipe (volumes were multiplied by number of total samples):
5,5µL Sybr Green I Master-Mix (Roche, Prenzberg, D)
3,3µL H20
0,55µL forward primer (6,25pmol/µL)
0,55µL reverse primer (6,25pmol/µL)
9µl of the qPCR master and 1µl of sample-cDNA were added to each wells. Generally,
measured triplets of 1:2 and 1:16 dilutions of the sample cDNA were measured. The
annealing temperatures and number of cycles which were used for each target gene are
listed in Table 8. The housekeeping gene GAPDH was used as reference genes for the
transcription levels of our target genes.

40
Table 8: Annealing temperatures and number of cycles for the qPCR for each target gene.
Template Annealing-
Temperatur
Number of cycles
hADAM8 62 °C 42
hADAM9 58 °C 40
hADAM10 61 °C 45
hADAM17 55 °C 45
GAPDH 66 °C 33
2.5. Functional assays
Transmigration and chemotaxis assays
For the transmigration assay, 5,000 HMVEC were seeded out on transwell inserts with a pore
size of 8µm. The transwell insert contained 100µl of medium in the insert and 600µl of
medium in lower chamber (a well of a 24-well plate). The cells were grown to full confluency
for 4d while the medium was changed daily. To not disturb the cell layer during the medium
change, only half of the medium of the insert and the lower compartment was changed.
On the day of the assay, the migrating THP1 cells were harvested and counted. After a
centrifugation at 300g for 5min, the cells were resuspended at 2x10⁶ cells per ml in RPMI
without FCS and PS containing 0.05% BSA (transmigration medium). In case of a chemotaxis
experiment, the transwell filter without the endothelial layer were preincubated with
600+100µl of transmigration medium in the incubator in the meantime. Just before the
assay, the medium of the transwell insert with (transmigration) or without endothelial layer
(chemotaxis) were put in the free spot beside the well containing the prewarmed 600µl
transmigration medium with the desired MCP-1 concentration. The medium of the transwell
insert was taken off and 100µl of the cell suspension (containing 2x10⁵ cells) were added to
the insert. The insert was then placed in the well, containing the transmigration medium with
the desired MCP-1 concentration. After an incubation of 2h in the cell culture incubator the
inserts were taken out of their wells and the transmigrated cells were analysed with either
flowcytometry and/or by the glucoronidase assay (see Results).

41
Ca2+-influx assay
For the Ca2+-influx assay, the THP1 cells were harvested as described above, counted and
centrifuged at 300g for 5 min. The cells were resuspended in Ca2+-staining buffer at a
density of 2x10⁶cells/ml. After an incubation of 30min at 37°C, the cells were washed twice
(centrifugation at 300g for 5 min) with 5ml of prewarmed Ca2+-assay buffer. During the
second wash, an aliquot of the cell suspension was counted and the cells were resuspended
at a density of 4x10⁶cells/ml. 100µl of the cell suspension (4x10⁵ cells) were added to a black
96-well-plate with a clear bottom. The Ca2+-influx upon the stimulation with MCP-1 was then
measured at a constant temperature of 37°C in the FLUOstar OPTIMA plate-reader. After
establishing the fluorescent baseline of the cells for 10s, either 5µl (1nM MCP-1 final) or 17µl
(3nM MCP-1 final) of a 21nM MCP-1 solution (diluted in Ca2+-assay buffer containing 0.5%
BSA) was injected to the labelled cells. As buffer control, the same volume of Ca2+-assay
buffer containing 0.5% BSA but no MCP-1 was injected. The fluorescence was constantly
measured at an excitation wavelength of 488nm and an emission wavelength of 526nm.
After the stimulation of the cells, the labelling of the THP1 with Fluo-3-AM was verified by
injecting the detergent digitonin (125µg/ml final). This lead to a maximum increase of the
signal since because of the permeabillisation of the cell membranes the Fluo-3-AM stored
inside the cells could bind to the free Ca2+ of the assay buffer. To determine the background
fluorescence, EGTA (15mM final) was injected to disrupt the complex and capture all free
Ca2+.
Adhesion assay
For the adhesion assay 96-well-plates (Nunc-Immuno™ Plate) were coated with 40µl soluble
VCAM-1 (1.5µg/ml), ICAM-1 (1.5µg/ml) and fibronectin (6µg/ml) for 1h at RT. After the
incubation, the wells with the adhesion molecules and the control wells were blocked with
200µl of 1% BSA (all diluted PBS (PAA)). The wells were washed twice with PBS and once
with RPMI with 0.05% BSA. In the meantime, the THP1 were harvested, counted and
centrifuged (300g for 5min). The THP1 were resuspended in RPMI with 0.05% BSA at a
density of 1x10⁶cells/ml. 100 µl of the cell suspension was added to the coated wells. The
THP1 were incubated for 10min in the presence or absence of 3nM MCP-1 at 37°C. After the
incubation, the wells were twice washed with 200µl prewarmed RPMI containing 0.05% BSA.
Then 100µl of RPMI with 0.05% BSA containing 0.1% Triton X-100 were added to the wells

42
to lyse the adherent cells. The cell number of adherent cells was determined with
glucoronidase assay (see above).
Scratch assay
The wound-healing properties of the ADAM-KD LV-ECV-304 were analysed with the scratch
assay. The cells were cultured in six-wells to full confluency. On the day of the assay, a
scratch was made on the cell layer using a 100µl pipette tip. Microscopic pictures of the
scratch were taken 0h, 2h, 4h, 6h, 8h and 24h after the injury. The migration behaviour of
LV-ECV 304 was evaluated by counting the cells that had invaded a defined area of the
scratch.
2.6. Statistics
All data sets were analysed with the statistic software GraphPad Prism 5 (GraphPad Inc., San
Diego, CA USA) using one-way analysis of variance (ANOVA) and the Dunnet-test as post-
hoc test. If not indicated otherwise, it was always tested against either the solvent control or
the scramble control cell lines. The data were considered significantly different at probability
values smaller 0.05 (0.01, 0.001), marked with * (**, ***). All figures of this work show the
mean ±SD (standard devariation) if not indicated otherwise.

43
3. Results
3.1. Comparison of ADAM8, 9, 10 and 17 expression in different
leukocytic, endothelial and epithelial cell culture lines
To get an overview about the relative expression of ADAM proteases in different cell types,
mRNA expressions profiles of ADAM 8, 9, 10 and 17 were determined by quantative real-
time PCR (qPCR) in cultured cell lines and primary cells of different origin: ECV304 (human
bladder carcinoma cell line), A549 (human alveolar basal epithelial adenocarcinoma cell line),
HEK293 (human embryonic kidney cell line), HMVEC (human microvascular endothelial cell
line), HUVEC (primary human umbilical vein endothelial cells), THP1 (primary human acute
monocytic leukemia cells) and Jurkat (primary human T cell leukemia cells). While ECV304
and A549 are epithelial cells, HEK293 cells may represent fibroblasts or epithelial cells,
HMVEC and HUVEC are both primary endothelial cells and THP1 and Jurkat are both
leukocytic cell lines.
Figure 7 shows a heat map which summarises the results of several qPCRs (n=4) of the
mRNA level of the four ADAM proteinases in the mentioned cell lines. The heat map shows
that each cell line displays a distinct ADAM profile.
Among the tested cell lines, ECV304 cells had the highest level of ADAM8. Their ADAM9 and
10 expression levels were about average while their ADAM17 expression level was among
the lowest. By contrast, A549 cells - the other examined epithelial cell line - had a low level
of ADAM8, a comparatively high level of ADAM9 and relative low levels of ADAM10 and 17.
In comparison to the former cell lines, HEK293 cells showed high levels of both ADAM9 and
17 and average levels of ADAM8 and 9.
The two endothelial cell lines HMVEC and HUVEC had distinct expression levels of ADAM10
and 17. HMVEC, which were derived from the microvasculature, had high levels of ADAM10
and 17. HUVEC, which were isolated from the umbilical vein, expressed both proteinases
only at a basal level. Both cell lines had a low level of ADAM8 and a rather high level of
ADAM9.
The two leukocytic cell lines THP1 and Jurkat both expressed ADAM8 slightly above average
and ADAM9 at a very low level. Their expression profiles of ADAM10 and 17 differed though.
While Jurkat cells expressed both ADAM10 and 17 at a basal level, THP1 cells showed high
ADAM10 mRNA expression and an above average expression level of ADAM17.

44
These findings demonstrate that all the tested proteases are abundantly expressed in
different cell types but with varying expression levels.
The high expression of ADAM8, 10 and 17 in THP1 cells make them a good model cell line
for the study of these proteases in leukocyte migration.
Figure 7: Heat map of mRNA levels of ADAM8, 9, 10 and 17 in several cell culture lines.
The amount of each ADAM-mRNA was determined using qPCR (n=4). The expression rate of the ADAM genes was normalised to the housekeeping gene GAPDH. The colour of each square represents at which level a gene is expressed compared to the average of the examined cell lines. Light green indicates that a gene is expressed at a very high rate while light red shows that a gene is very weakly expressed in the corresponding cell line. Average expression levels are show in brown. (For exact quantitative data see Appendix)
3.2. The effect of ADAM-inhibitors on leukocyte migration
To study the importance of ADAM proteases for leukocyte migration an in vitro migration
assay was used. In vitro migration experiments can be performed with primary leukocytes
isolated from different blood donors or leukocytic cell lines. Since primary leukocytes often
show donor specific behaviour in migration assays and are not easily accessible for genetic
manipulation it was decided to use THP1163 cells in the migration assays. THP1 cells have
been widely used to study a variety of functions and mechanisms of monocytic cells in vitro
assays over the last decades. Like native monocytes THP1 cells are chemotactically attracted
by the chemokine CCL2, commonly known as MCP-1 (monocyte chemotactic protein-1)164–166.

45
MCP-1-induced transendothelial migration of THP1 cells
THP1 cell migration was investigated in an endothelial transmigration assay using transwell
inserts. To mimic the physiological endothelium of a microvessel, the site where recruitment
and transmigration of leukocytes occurs in vivo, human microvascular endothelial cells
(HMVEC) were cultured on transwell filter inserts. The confluent HMVEC monolayer, that had
grown on the filter inserts, was then used as migration barrier in the transmigration assay.
HMVEC cells were used since their microvascular endothelial phenotype resembles the in vivo
situation much better than that of human umbilical vein endothelial cells (HUVEC) which are
commonly used in these assays. MCP-1 served as chemoattractant in the migration studies.
MCP-1 was added to the cell culture wells before the transwells were inserted and THP1 cells
were added to the inserts. To establish and optimize the transmigration assay the optimal
MCP-1 concentration at which THP1 cells are attracted by MCP-1 was determined. As shown
in Figure 8 the highest THP1 cell migration rate through the layer of HMVEC was observed at
a concentration of 3nM MCP-1.
0nM
1nM
3nM
10nM
30nM
0
20
40
60
80
100
MCP-1 conc.
% m
igra
ted
cells
Figure 8: Concentration kinetic of MCP-1-induced THP1 cell transmigration through
HMVEC.
The transmigration assay was performed using a transwell set up with detachable filter insert with defined pores of 8µm. On the filter bottom of the insert, a HMVEC monolayer had been grown to complete confluence. MCP-1 was added at the indicated concentration to the lower chamber of the transwell setup. 200 000 THP1 cells were then added to the upper chamber of the transwell and incubated for 2h. After the incubation period, the number of migrated cells in the lower chamber was determined using the glucoronidase assay. Data is shown as mean in % of total applied cells ± SD, n=2.

46
Influence of endothelial cell in the in vitro transmigration assay
The influence of the HMVEC layer in the in vitro transmigration assay of THP1 was analysed
by comparing the migration rates of THP1 in the transmigration assay in presence of HMVEC
to the number of migrated cells in the chemotaxis assay. For the chemotaxis assays, the
same transwell inserts with 8µm pores were used as in the transmigration assay but without
the confluent endothelial cell layer.
Comparing the number of cells that migrated in the transendothelial migration to the
percentage of the initial cell number that migrated in the chemotaxis assays (Figure 9) it is
apparent that the cells migrate towards the chemotactic stimulus of MCP-1 at a threefold
higher rate through the transendothelial barrier than through the filter membrane alone. In
the absence of chemotactic stimulus, the random migration in presence of endothelial cells is
even 10-fold higher. Instead of being just another additional barrier which the migrating cells
have to overcome, the migration of the THP1 is supported by the presence of the HMVEC
layer.
Filter n
o sti
m.
Filter +
MCP-1
HMVEC n
o sti
m
HMVEC +
MCP-1
0
5
10
30
40
50
60
migration conditions
% m
igra
ted
cells
Figure 9: Comparison of THP1 cells migration in in vitro chemotaxis and transdendothelial migration assays.
THP1 cells migrated in absence (filter) and presence (HMVEC) of a confluent HMVEC layer. Random migration in absence of a chemotactic stimulus (open columns, no stim) was compared to directed migration towards 3nM MCP-1 (striated columns, + MCP-1). 200 000 THP1 cells were added to the upper chamber of the transwell and incubated for 2h. After the incubation period, the number of migrated cells in the lower chamber was determined by counting, using flow cytometry. Data is shown as mean in % of total applied cells ± SD, n=4.

47
Effect of the ADAM inhibitors GI254023 and GW282406 on the
chemotaxis and transmigration of THP1 cells
Having found the optimal MCP-1 stimulus concentration for the induction of THP1 cell
transmigration, inhibition studies were performed to obtain first insight in the potential
involvement of ADAM proteases in THP1 cell migration.
For these experiments the inhibitors GI254023 and GW282406 were used that had been
characterized previously for inhibition of ADAM10 and 17 activity 15,21,108,167. While the
inhibitor GI254023 preferentially blocks ADAM10 but not ADAM17, GW282406 inhibits both
ADAM10 and 17 with high potency. The effect of GI254023 and GW282406 on the migration
response of THP1 was analysed both in chemotaxis and transmigration assays.
In first experiments the effect of both inhibitors on MCP-1 induced transmigration of THP1
cells through cultured endothelial cells was analysed. For the transmigration assay THP1 cells
were pretreated with the inhibitors GI254023 or GW282406 at a concentration of 10µM
inhibitor for 1h. DMSO which was used as solvent for both inhibitors served as negative
control and was used in parallel. The migration assay itself was performed in absence of the
inhibitors or DMSO to exclude inhibition of ADAMs on endothelial cells and to specifically
examine the role of leukocytic ADAMs for migration. For this purpose, THP1 cells were
washed prior to the assay to remove free inhibitors. Pretreatment with GI254023 resulted in
a slight but significant THP1 transmigration reduction through the HMVEC monolayer (Figure
10A) whereas the slight reduction by GW282406 did not reach significance. This can be
explained by the fact that both GI254023 and GW282406 are reversible antagonists of
ADAM10 and ADAM10 and ADAM17 respectively. It is likely that the inhibitors diffused of the
ADAM proteases within the incubation period of 2h and that the proteases thereby regained
their full proteolytic activity during the assay.
In the next experiments cell migration was performed without endothelial cells and it was
analysed whether the ADAM inhibitors are more effective when present throughout the
assay. For the chemotaxis assays, the same transwell inserts were used as in the
transmigration assay but without the endothelial cell layer. THP1 cells were preincubated for
1h with the inhibitors GI254023 or GW282406 at a concentration of 10µM. Following
pretreatment, the inhibitors were not removed and the chemotaxis assay was performed in
the presence of the inhibitors in both compartments of the transwell setup. The results
depicted in Figure 10A showed that both inhibitors GI254023 and GW282406 had a profound
impact on the THP1 cell migration when present during the chemotaxis assay. Since both
inhibitors inhibited ADAM10, this result indicated that ADAM10 could play a crucial role
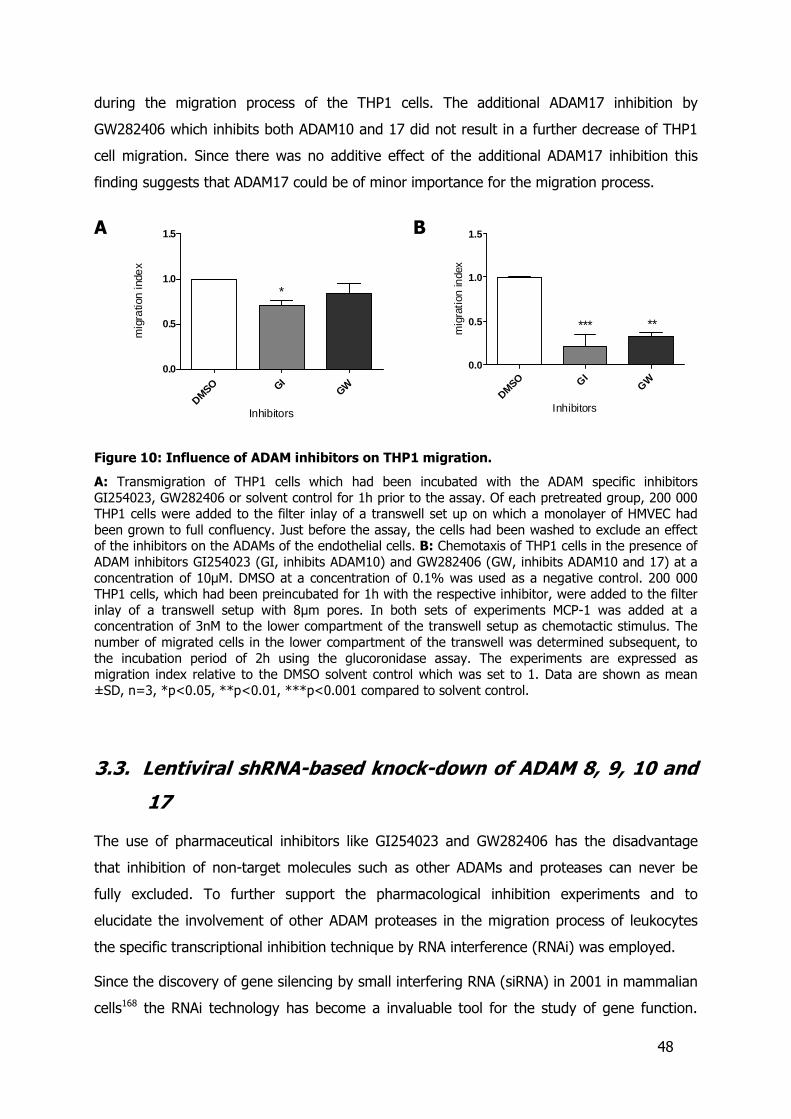
48
during the migration process of the THP1 cells. The additional ADAM17 inhibition by
GW282406 which inhibits both ADAM10 and 17 did not result in a further decrease of THP1
cell migration. Since there was no additive effect of the additional ADAM17 inhibition this
finding suggests that ADAM17 could be of minor importance for the migration process.
A
DMSO GIGW
0.0
0.5
1.0
1.5
*
Inhibitors
mig
ratio
n in
dex
B
DMSO GIGW
0.0
0.5
1.0
1.5
*** **
Inhibitors
mig
ratio
n in
dex
Figure 10: Influence of ADAM inhibitors on THP1 migration.
A: Transmigration of THP1 cells which had been incubated with the ADAM specific inhibitors GI254023, GW282406 or solvent control for 1h prior to the assay. Of each pretreated group, 200 000 THP1 cells were added to the filter inlay of a transwell set up on which a monolayer of HMVEC had been grown to full confluency. Just before the assay, the cells had been washed to exclude an effect of the inhibitors on the ADAMs of the endothelial cells. B: Chemotaxis of THP1 cells in the presence of ADAM inhibitors GI254023 (GI, inhibits ADAM10) and GW282406 (GW, inhibits ADAM10 and 17) at a concentration of 10µM. DMSO at a concentration of 0.1% was used as a negative control. 200 000 THP1 cells, which had been preincubated for 1h with the respective inhibitor, were added to the filter inlay of a transwell setup with 8µm pores. In both sets of experiments MCP-1 was added at a concentration of 3nM to the lower compartment of the transwell setup as chemotactic stimulus. The number of migrated cells in the lower compartment of the transwell was determined subsequent, to the incubation period of 2h using the glucoronidase assay. The experiments are expressed as migration index relative to the DMSO solvent control which was set to 1. Data are shown as mean ±SD, n=3, *p<0.05, **p<0.01, ***p<0.001 compared to solvent control.
3.3. Lentiviral shRNA-based knock-down of ADAM 8, 9, 10 and
17
The use of pharmaceutical inhibitors like GI254023 and GW282406 has the disadvantage
that inhibition of non-target molecules such as other ADAMs and proteases can never be
fully excluded. To further support the pharmacological inhibition experiments and to
elucidate the involvement of other ADAM proteases in the migration process of leukocytes
the specific transcriptional inhibition technique by RNA interference (RNAi) was employed.
Since the discovery of gene silencing by small interfering RNA (siRNA) in 2001 in mammalian
cells168 the RNAi technology has become a invaluable tool for the study of gene function.

49
There are two general methods to apply siRNAs to the target cells. One is the direct
transfection of synthetic short RNA duplexes. In the second method, vectors containing a
RNA polymerase III promoter and the sequence for a short hairpin RNA (shRNA) are
transfected into the target cells. The transcription machinery of the transfected cells
subsequently produces the shRNA which then gets further processed to siRNA.
However, one of the major obstacles of gene knock down (KD) via siRNA remains the gene
delivery of recombinant siRNA or shRNA encoding plasmids to the cells of interest. Very few
cultured cell lines are easily transfected at high rates by conventional transfection methods.
Leukocytic cell lines like THP1 and primary cell lines such as HUVEC are even more difficult
to transfect than most standard cell lines. Since those were the cell lines of interest of this
study, it was decided to make use of the advanced and powerful gene delivery by lentiviral
vectors.
Lentiviral transduction efficiency test
Over the last few years, lentiviral transduction has become a widely established gene
delivery method for in vitro experiments as well as for several in vivo setups. Lentiviral
transduction has two key advantages over the adenoviral and retroviral transduction system.
The lentivirus can transduce dividing, as well as non-dividing, cells and it integrates its
genetic message stably into the hostgenome. It can also be equipped with a great variance
of surface proteins a process termed pseudotyping. The pseudotyping of lentivirus alters its
target cell specifity and its biochemical and mechanical properties. The most common, used
surface protein is the vesicular stomatitis virus glykoprotein (VSV-G) which provides the
lentivirus with a broad tropism and great biochemical and mechanical robustness.
In the initial lentiviral experiment it was tested whether the difficult to transfect cell lines
were transducable by lentivirus. Cell culture supernatant from 293T producer cells containing
lentiviral particles was added to cultured HUVEC. Those lentiviral particles were generated by
the 293T cells after they had been transfected the with the lentiviral shRNA plasmid
pLVTHM160, the gag-pol plasmid psPax2 and the envelope plasmid pMD.2. The pLVTHM
plasmid encodes a shRNA cassette and the gene for the green fluorescent protein (GFP) as a
reporter gene. Therefore, successful transduction of target cells can be easily monitored via
fluorescent microscopy or flow cytometry. Three days after the lentivirus application the
transduced HUVEC cells were analysed in a fluorescent microscope. In the initial experiment
transduction rates of virtually 100% was achieved (Figure 11). Encouraged by this positive

50
outcome, cloning and screening of potential shRNA sequences against the targets ADAM10
and 17 was started.
A
B
Figure 11: Analysis of lentiviral transduced HUVEC.
HUVEC were incubated with cell culture supernatant containing GFP-encoding lentivus for 24h. After medium change, cells were further incubated for 48h and then analysed by bright field microscopy (A) and fluorescence microscopy (B).
Non-viral shRNA-KD of ADAM10
In a previous study, gene knock down of ADAM10 via shRNA was achieved with a shRNA
sequence expressed by the non-viral pSuper plasmid103,159. Since the pSuper plasmid utilizes
the same shRNA cassette as the lentiviral pLVTHM plasmid, it was the aim to insert the
pSUPER shRNA cassette into the lentiviral setup. First, it was necessary to confirm that the
shRNA sequences mediate effective downregulation of ADAM10. HEK293 cells were
transfected with the ADAM10-pSuper vector using a liposomal transfection reagent and after
3 days ADAM10 surface expression was analysed to determine the gene KD efficiency. As
expected when using liposomal transfection, only a part of the cells were successfully
transfected. Those cells that were apparently successfully transfected with the pSuper-
ADAM10 plasmid showed a markedly reduced ADAM10 surface staining (Figure 12). On the
one hand this result confirms that the shRNA sequence works effectively and on the other
hand it demonstrates that liposomal transfection is not sufficient to target the majority of
cells. This underlines that the importance to combine effective shRNA sequences with
effective transduction methods to yield a pronounced gene knock-down.
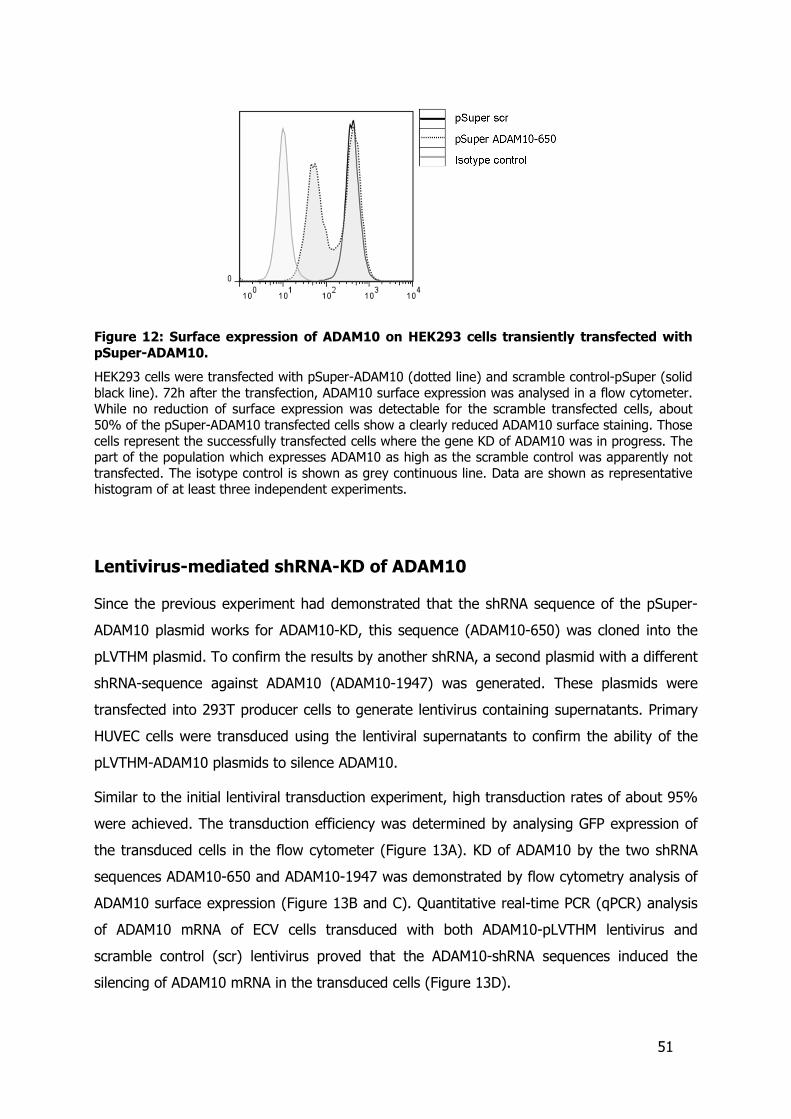
51
Figure 12: Surface expression of ADAM10 on HEK293 cells transiently transfected with
pSuper-ADAM10.
HEK293 cells were transfected with pSuper-ADAM10 (dotted line) and scramble control-pSuper (solid black line). 72h after the transfection, ADAM10 surface expression was analysed in a flow cytometer. While no reduction of surface expression was detectable for the scramble transfected cells, about 50% of the pSuper-ADAM10 transfected cells show a clearly reduced ADAM10 surface staining. Those cells represent the successfully transfected cells where the gene KD of ADAM10 was in progress. The part of the population which expresses ADAM10 as high as the scramble control was apparently not transfected. The isotype control is shown as grey continuous line. Data are shown as representative histogram of at least three independent experiments.
Lentivirus-mediated shRNA-KD of ADAM10
Since the previous experiment had demonstrated that the shRNA sequence of the pSuper-
ADAM10 plasmid works for ADAM10-KD, this sequence (ADAM10-650) was cloned into the
pLVTHM plasmid. To confirm the results by another shRNA, a second plasmid with a different
shRNA-sequence against ADAM10 (ADAM10-1947) was generated. These plasmids were
transfected into 293T producer cells to generate lentivirus containing supernatants. Primary
HUVEC cells were transduced using the lentiviral supernatants to confirm the ability of the
pLVTHM-ADAM10 plasmids to silence ADAM10.
Similar to the initial lentiviral transduction experiment, high transduction rates of about 95%
were achieved. The transduction efficiency was determined by analysing GFP expression of
the transduced cells in the flow cytometer (Figure 13A). KD of ADAM10 by the two shRNA
sequences ADAM10-650 and ADAM10-1947 was demonstrated by flow cytometry analysis of
ADAM10 surface expression (Figure 13B and C). Quantitative real-time PCR (qPCR) analysis
of ADAM10 mRNA of ECV cells transduced with both ADAM10-pLVTHM lentivirus and
scramble control (scr) lentivirus proved that the ADAM10-shRNA sequences induced the
silencing of ADAM10 mRNA in the transduced cells (Figure 13D).

52
A
B
C D
scr
A10-65
0
A10-19
47
0.0
0.5
1.0
1.5
LV-ECV-KD-lines
AD
AM
10 t
rans
krip
t. le
vel
(rel
. to
GA
PD
H)
Figure 13: Analysis of ADAM10 gene KD by pLVTHM-vectors ADAM10-650 and ADAM10-
1947.
A: Histogram showing distribution of GFP-expression by lentiviral transduced HUVEC. All lentiviral transduced HUVEC show the same level of GFP fluorescence which indicates similar transduction rates. B: Histogram showing distribution of ADAM10 surface expression by GFP positive transduced cells. Cells were stained with a mouse monoclonal primary antibody against ADAM10 and a secondary PE-conjugated anti-mouse antibody. ADAM10-650 transduced HUVEC (dashed line) showed a drastically reduced ADAM10 expression compared to the scramble control (solid black line). The solid grey line represents the isotype control. C: Histogram of pLVTHM-ADAM10-1947 (dashed line) transduced HUVEC. The sequence ADAM10-1947 is also able to silence ADAM10 expression. D: Analysis of ADAM10 mRNA in pLVTHM transduced ECV level by quantitative PCR. Cells transduced with lentivirus carrying shRNA against ADAM10 have a lower copy number of ADAM10 mRNA compared to the scramble control. The mRNA of the housekeeping gene GAPDH was used to normalise for variations in the amount of RNA between the different samples. All diagrams of this figure are representative experiments of several experiments performed.
Lentiviral KD of ADAM17
Based on the success of the ADAM10 KD by lentiviral transduction, pLVTHM plasmids with
shRNA sequences against ADAM17 were generated. Transcriptional silencing via synthetic
siRNA or vector based shRNA rely on the same cellular mechanisms. Therefore, one
successful siRNA, sequence which was used in a previous study of our group, was cloned
into the pLVTHM vector generating the pLVTHM-ADAM17-2061 construct14. To confirm the

53
results by another shRNA against ADAM17 several other pLVTHM-ADAM17 vectors were
designed and constructed. Theses sequences were designed with the help of algorisms that
predict potential shRNA sequences169 (pLVTHM-ADAM17-1631 and others).
After production of lentiviral supernatants with the pLVTHM-ADAM17 plasmids, transduced
HUVEC were analysed to determine the efficiency of the ADAM17-shRNA sequences. Cells
were analysed by flow cytometry and qPCR. As shown in Figure 14A all transduced HUVEC
had comparable levels of GFP expression which indicates a high and uniform transduction
A
B
C
D
scr
A17-2
0610.0
0.5
1.0
1.5
LV-ECV-KD- lines
ADA
M17
tran
skrip
t. le
vel
(rel
. to
GAP
DH
)
Figure 14: Gene silencing of ADAM17 with pLVTHM-lentiviral vectors.
A: Histogram for GFP-expression of lentiviral transduced HUVEC. The lentiviral transduced HUVEC exhibit similar levels of GFP fluorescence. B: ADAM17-surface staining of HUVEC transduced with pLVTHM-ADAM17-2061 (dashed line). The shRNA sequence ADAM17-2061 induces strong reduction of ADAM17 surface expression compared to the HUVEC transduced with the scramble-control (solid black line). C: ADAM17 surface expression on HUVEC transduced with pLVTHM-ADAM17-1631 (dashed line). This shRNA sequence was non-functional as the ADAM17 expression of the HUVEC transduced with ADAM17-1631 is as high as the cells transduced with the scramble-control (black solid line). D: ADAM17-mRNA level of ECV304 transduced with ADAM17-2061 (filled bar) compared to scramble control (open chart). The analysis of ADAM17 mRNA level in qPCR proved that the KD of ADAM17 surface expression is caused by the transcriptional silencing. All diagrams of this figure are representative experiments of more than three experiments performed.

54
rate. The shRNA-sequence ADAM17-2061 clearly reduced ADAM17 surface expression on
HUVEC (Figure 14B) and the number of ADAM17 mRNA transcripts of transduced ECV304
cells (Figure 14D).
By contrast, the sequence ADAM17-1631 did not effect the ADAM17 surface expression
(Figure 14C) even though the cells were successfully transduced (Figure 14A long dashed
dark line). The same results were obtained with two other shRNA sequences against
ADAM17 (data not shown). This outcome underlines that not every shRNA sequence that
aligns to its target mRNA can be used to silence gene transcription. The ability of a shRNA-
sequence to silence its target gene can be predicted to a certain degree via complex
algorisms169 but its efficiency to silence a gene in vitro still has to be determined
experimentally in each target cell type.
Specificity of ADAM10 or ADAM17 gene silencing by shRNA
The overexpression of short RNAs in the cell and the lentiviral transduction can have general
effects on the transcription machinery of cells transduced with lentiviral shRNA vectors. To
address this problem, the effects of shRNA treatment against a target molecule must always
be compared to a non specific shRNA sequences (scramble control) that does not interact
with any known mRNA.
One further major obstacle of the RNAi technique are unwanted off target effects caused by
unspecific binding of the siRNA sequences to none target mRNAs. Therefore, it is mandatory
to study at least two different shRNA sequences against a given target molecule. Possible off
target effects of shRNA sequences against closely related molecules should as well always be
excluded. The proteases ADAM10 and ADAM17 are a classical example of two closely related
proteins. They share not only sequence homologies in their mRNA sequence and their
protein motifs, but as well exhibit similar biological functions. Furthermore, deficiency of
either ADAM10 or 17 may lead to compensation by increasing the expression of the related
protease as it has been reported for fibroblast generated from ADAM10 or ADAM17 deficient
mice97. Therefore, the influence of shRNA sequences against ADAM10 on the ADAM17
expression and vice versa was analysed on all transduced cell lines.
A typical analysis of the side effects of shRNA sequences against ADAM10 or ADAM17 on the
protein expression of respective other ADAM protease is shown in Figure 15. The ADAM10
surface expression of HUVEC transduced with lentivirus containing shRNA against ADAM17
(A17-2061) was as high as the ADAM10 surface expression of cells transduced with the

55
scramble control virus (scr) (Figure 15A). Cells with the gene silencing of ADAM10 (A10-650)
showed a strongly reduced ADAM10 surface expression as seen before. In comparison, the
ADAM17 surface expression of HUVEC transduced with lentivirus containing shRNA
sequences against ADAM10 was comparable to that of scramble transduced HUVEC while the
effect of the ADAM17-shRNA was clearly noticeable (Figure 15B).
D
B
Figure 15: Effects of shRNA against ADAM10 or ADAM17 on the surface expression of the respective other ADAM protease.
Surface expression of ADAM10 (A) and ADAM17 (B) on HUVEC transduced with lentivirus expressing the scramble control, ADAM10-650 (dashed line) or ADAM10-2061 shRNA (dotted line). Cells transduced with other successful shRNA sequences against ADAM10 or ADAM17 (ADAM10-1947, ADAM17-2642) showed also no influence on surface expression of the respective other protease. The diagrams of this figure are representative experiments of several experiments performed.
3.4. Effect of ADAM10 and 17 silencing on shedding activity
To confirm that gene silencing of ADAM10 and 17 leads to reduced cleavage of their
substrates on the cell surface, the shedding activity of cells transduced with pLVTHM vectors
against ADAM10 or ADAM17 was analysed. One of the common shedding substrates of both
ADAM10 and 17, is the chemokine CX3CL1 (Fraktalcine). CX3CL1 is one of only two
chemokines (the other being CXCL16) which are expressed as transmembrane protein. Upon
cleavage by ADAM10 and 17, its chemokine domain gets released from the cell surface of
endothelial cells, where it is predominantly expressed.
Soluble CX3CL1 is a potent chemoattractant for T-Cells and monocytes whereas the
membrane-bound form induces strong adhesion of leukocytes. It has been shown that
ADAM10 contributes mainly to the constitutive CX3CL1 shedding. In contrast, increased
shedding of CX3CL1 by ADAM17 is observed after stimulation with the phorbolester PMA
(phorbol 12-myristate 13-acetate) or inflammatory stimuli such as Tumour Necrosis Factor-
alpha (TNF-α) and Interferon-gamma (INF-γ).

56
ECV304 cells that stably expressed CX3CL1 (ECV-CX3CL1) were transduced with lentivirus
containing the shRNA sequences against ADAM10 and 17. The influence of the gene
silencing of ADAM10 or ADAM17 on the CX3CL1 shedding activity was analysed by
measuring the amount of released CX3CL1 with ELISA.
As depicted in the left panel of Figure 16, unstimulated scramble transduced CX3CL1-ECV304
released about 60% of their total CX3CL1 into their supernatant. In comparison,
unstimulated cells with lentiviral induced ADAM10-KD released significantly less (only 30%)
of their CX3CL1. Unstimulated ADAM17-deficient ECV-CX3CL1 cells shed about 45% of their
CX3CL1. This was less than the scramble control transduced cells, but still more than the
CX3Cl1 shedding observed for ADAM10-deficient ECV-CX3CL1 cells.
scr
A10-6
50
A10-1
947
A17-2
061
scr
A10-6
50
A10-1
947
A17-20
610
20
40
60
80
100constitutivePMA induced
***
* *
LV-ECV-CX3CL1-KD-lines
% r
elea
sed
CX
3CL1
Figure 16: Effect of ADAM10 and 17 KD on the shedding of CX3CL1.
ECV-304, which stably expressed CX3CL1, were transduced with lentiviral particles containing the control shRNA sequence (scr) and sequences against ADAM10 (A10-650 and 1947) and ADAM17 (A17-2061). The cells were cultured on 6-well dishes until they reached complete confluency. Before the CX3CL1 shedding assay, the cells were washed with PBS and received 1ml fresh serum-free medium. Cell were left unstimulated (open columns) or treated with 200ng/ml PMA (hatched columns on the right panel of the diagram). After incubating the cells for 2h the supernatant was taken off and the remaining cells were lysed with PBS containing 1% Triton. The amount of CX3CL1 of lysate and supernatant was determined by ELISA. The columns represent the percentage of CX3CL1 in the supernatant of the total amount of CX3CL1 (amount of cell-bound CX3CL1 in lysate plus amount CX3CL1 of the supernatant). Data are shown as mean ±SD, n=4, *p<0.05, ***p<0.001 compared to scramble control.

57
The stimulation of the ECV-CX3CL1 cells with PMA led to an increased release of CX3CL1 as
expected (left panel Figure 16). In these PMA-stimulated cells, an effect of the ADAM17-KD
was clearly visible whereas ADAM10 KD was ineffective. After stimulation with PMA, ADAM17
shRNA transduced ECV-CX3CL1 cells released only 55% of their total CX3CL1 into their cell
culture medium. ADAM10-shRNA transduced ECV304-CX3CL1 as well as cells transduced
with the scramble control virus released 75% of their total CX3CL1.
This experiment was the prove of principle for the lentiviral shRNA approach to
downregulate ADAM10 and 17 since it is coherent to previous studies in which ADAM10 and
17 activity was inhibited with the inhibitors GI254023 and GW28240613,67.
Lentiviral silencing of ADAM8 and 9
While the function of ADAM10 and 17 has been studied extensively in the last decade, other
proteins of the ADAM family received less attention. Proteolytic activity and shedding of
surface molecules has as well been demonstrated for ADAM8 and ADAM9. Therefore, both
proteases were included in the lentiviral knock down experiments with the aim to study their
role in leukocyte recruitment. For this purpose, pLVTHM-plasmids with shRNA sequences
against both ADAM8 and ADAM9 were generated.
Figure 17A shows the ADAM8 mRNA level of ECV-304 cells that had been transduced with
pLVTHM-lentivirus containing shRNA sequences against ADAM8. All three sequences against
ADAM8 induce the silencing of its mRNA significantly as shown by qPCR. Unfortunately, the
KD of ADAM8 could not be shown on protein basis, since none of the tested antibodies
against ADAM8 could detect the protease by either western blotting or surface staining for
flow cytometry.
Successful gene silencing of ADAM9 was achieved as well, as can be seen in the results of
the qPCR against ADAM9 (Figure 17B). The western blot for ADAM9 in the lysates of EVC
transduced with shRNA sequences against ADAM8 and 9 (Figure 17C) showed that the cells
transduced with ADAM9-pLVTHM vectors have almost no detectable ADAM9. In contrast, the
cells transduced with ADAM8-pLVTHM vectors expressed ADAM9 at the same level as
scramble transduced cells confirming specificity of the shRNA sequences.

58
A
scr
A8-903
A8-1831
A8-2645
0.0
0.5
1.0
1.5
*
**
*
LV-ECV-KD-lines
AD
AM
8 m
RN
A le
vel
(rel
. to
GA
PD
H)
B
scr
A9-196
7
A9-226
00.0
0.5
1.0
1.5
2.0
*** ***
LV-ECV-KD-lines
AD
AM
9 m
RN
A le
vel
(rel
. to
GA
PDH
)
C
Figure 17: Gene silencing of ADAM8 and 9.
A: Quantitative real-time PCR analysis of ADAM8 transcripts of ECV cells transduced with pLVTHM lentivirus containing shRNA sequences against ADAM8 or scramble control (n=5). B: Expression of ADAM9 mRNA by ECV transduced with shRNA sequences against ADAM9 or scramble control. Levels of transcripts were analysed with qPCR and normalised to the housekeeping gene GAPDH (n=4). C: Western blot of ADAM9 in lysates of ECV cells transduced with the indicated pLVTHM lentivirus (representative of several experiments). The data presented in the bar charts are shown as mean ±SD, *p<0.05, **p<0.01, ***p<0.001 compared to scramble control.
3.5. Role of ADAM 10 and ADAM 8, 9, 17 for transmigration and
chemotaxis of THP1 cells
To further investigate the involvement of ADAM10 and that of ADAM8, 9 and 17 in the
process of leukocytic transmigration, stably transduced LV-THP1 cell lines with a gene KD for
either of these ADAM-proteinases were generated. The analysis of the mRNA expression

59
profiles of the four ADAMs (Figure 7) had shown that THP1 cells fitted this purpose since
they expressed ADAM10 and 17 at higher levels than Jurkat cells, the other leukocytic cell
lines which had been analysed. To generate the gene KD of the target molecules, those of
the previous described lentiviral shRNA vectors which had been shown to successfully silence
these genes in HUVEC and ECV304 cells, were used.
Stable gene silencing of ADAM8, 9, 10 and 17 in lentiviral transduced
THP1 cells
THP1 are suspension cells which are generally more difficult to transduce with lentiviral
particles than adherent cells. To transduce the THP1 cells lentiviral particles, which had been
concentrated via ultracentrifugation, were used. The unconcentrated lentiviral supernatant,
A
B
C
D
Figure 18: Flow cytometry analysis of ADAM10 and 17 surface expression on lentiviral transduced THP1.
A: ADAM10 surface staining of the stable cell line LV-THP1-ADAM10-650 (dashed line) compared to that of LV-THP1-scr (solid black line) which served as the nonspecific shRNA control. B: ADAM10 surface expression of the cell line ADAM10-1947. C: ADAM17 surface expression of LV-THP1-ADAM17-2061. D: ADAM17 surface expression of LV-THP1-2642. The cells were stained with a primary mouse monoclonal antibody against ADAM10 or ADAM17 and a secondary anti-mouse antibody which was conjugated with APC. The data are shown as representative histograms of at least three experiments.

60
which had been used in the previous experiment to transduce adherent cells like HUVEC and
ECV304, did not contain enough viral particles per ml to achieve a sufficient transduction
rate.
The GFP, encoded by the pLVTHM-plasmids, proved to be very helpful to determine the
successful transduction of the THP1 cells since it can be easily detected in the flow
cytometer. In general, the THP1 cells were transduced once or twice with the concentrated
lentivirus until a transduction rate of almost 100% was achieved. After the transduction, the
newly stable LV-THP1 cell lines were kept in culture to determine the KD efficiency and to
use them in the transmigration experiments.
A
scr G
FP
A8-90
3
A8-183
1
A8-264
50.0
0.5
1.0
1.5
*
***
LV-THP1-KD-lines
AD
AM
8 tr
ansk
ript
. le
vel
(rel
. to
GA
PD
H)
B
scr G
FP
A9-1967
A9-22
600.0
0.5
1.0
1.5
**
LV-THP1-KD-lines
AD
AM
9 t
rans
krip
t. le
vel
(rel
. to
GA
PD
H)
C
scr
A10-6
50
A10-1
947
0.0
0.5
1.0
1.5
LV-THP1-KD-lines
ADA
M10
tra
nskr
ipt.
leve
l(r
el.
to G
AP
DH
)
D
scr
A17-2
061
A17-26
420.0
0.5
1.0
1.5
**
LV-THP1-KD-lines
ADA
M17
tra
nskr
ipt.
leve
l(r
el. t
o G
AP
DH
)
Figure 19: qPCR analysis of ADAM8, 9, 10 and 17 mRNA transcript levels in stable LV-THP1 cell lines.
A: Downregulation of ADAM8 mRNA in the stable cell lines LV-THP1 ADAM8-903, 1831 and 2645 (n=3). B: ADAM9 mRNA levels of the cell lines LV-THP1-ADAM9-1967 and 2210 (n=3). C: Example of the ADAM10-mRNA silencing in the cell lines LV-THP1 ADAM10-650 and 1947. D: Expression level of ADAM17 mRNA in the cell lines LV-THP1-ADAM17-2061 and 2642 (n=3). The data presented are shown as mean ±SD, *p<0.05, **p<0.01 compared to scramble control.

61
The successful gene silencing of ADAM10 and 17 on protein level is depicted in Figure 18.
The gene KD was confirmed in the flow cytometer analysing the surface expression of either
protein. Figure 18A and B show the reduction of surface ADAM10 induced by the lentiviral
vectors pLVTHM-ADAM10-650 and 1947. The reduction of surface ADAM17 by the vectors
pLVTHM-ADAM17-2061 and 2642 is shown by Figure 18C and D.
Successful gene silencing of ADAM8, ADAM9, ADAM10 or ADAM17 in THP1 cells, stably
transduced with the respective lentivirus, was demonstrated by qPCR analysis of the
proteases mRNA levels (Figure 19A to D). Together with the protein expression data, these
results indicate that all shown shRNA sequences can be used to silence expression of the
respective ADAM protease in THP1 cells.
Refinement of the transmigration assay read out
In preliminary transmigration experiments, THP1 cell lines with gene silencing of ADAM10 or
ADAM17 were used in parallel with the scramble control cells. The glucoronidase assay was
used as read out to determine the number of transmigrated cells. Unfortunately, the
variations between each set of experiments had been high and the data generated in those
experiments did not meet the initial expectations. Therefore, the read out of the original
transmigration assay was refined. The aim was to establish a transmigration set up with an
internal control. This set up should include the scramble control cells in the same sample
with the cells with the gene KD for the ADAM proteinase.
To distinguish scramble control cells and ADAM-KD LV-THP1, the sequence of the GFP in the
pLVTHM scramble plasmid was exchanged for the sequence of cyan fluorescent protein
(CFP). CFP can be excitated with the 405nm laser of the flow cytometer while GFP is
excitated by the 488nm laser. This made it possible to detect cells expressing either
fluorescent protein in different channels of the flow cytometer. Using the newly generated
plasmid, the scramble LV-THP1 control cells (expressing CFP) could be mixed with ADAM-KD
LV-THP1 (expressing GFP) in the same sample.
Figure 20A shows a schematic drawing of the modified transmigration assay. Both cell lines
were mixed before the assay and added to the filter insert of the transwell setup. After the
incubation period, the cell population in the lower compartment was analysed for their ratio
of CFP- versus GFP-positive cells by flow cytometry. The CFP/GFP-ratio of the initial cell
mixture, that was added to the transwell set up at the beginning of the transmigration, was

62
used as reference to determine the influence of the gene silencing on the migratory abilities
of the THP1 cells.
A typical flow cytometry analysis of CFP-labelled scramble control cells and GFP-labelled
ADAM10-KD LV-THP1 cells is shown in Figure 20B. The panels at the left show the analysis
of the loading control of the cell mixtures of CFP- and GFP-labelled cells that were added into
the transwell insert. The panels at the right are derived from the analysis of transmigrated
cells. Quadrant Q1 of each panel is the gate for CFP-positive cells which represent the
scramble-CFP-LV-THP1 cells while quadrant Q3 is the gate for the GFP-positive LV-THP1
cells. Both upper panels show the control sample with scramble-CFP and scramble-GFP cells.
This scramble control sample was included in each set of experiments. The lower panels
show the result of a transmigration experiment in which CFP-positive scramble control
migrated together with GFP-labelled ADAM10-KD LV-THP1 cells.
Both upper panels of Figure 20 show that the ratio of GFP- versus CFP-labelled scramble
cells stayed the same before and after the transmigration. In the loading control of the
scramble sample (upper left panel) 38% of the cells expressed CFP and 55% expressed GFP.
After the transmigration (upper right panel), the transmigrated cells contained 37% CFP
positive and 54% GFP positive cells. Percentage of GFP-positive cells in the loading control
before transmigration (55%) did not differ from percentage of GFP positive cells in the
transmigrated cell population (54%). Vice versa, the percentage of CFP-positive cells
remained the same before and after transmigration. This indicates that both, the CFP- and
the GFP labelled LV-THP1-scramble cells, migrated at about the same rate. For subsequent
experiments changes in the distribution were compared by dividing the percentage of GFP
positive cells before transmigration by that after transmigration, respectively.
As an example, the flow cytometric analysis of a transmigration experiment with ADAM10-KD
LV-THP1 is shown in the lower panels of Figure 20B. Both panels show dot blot diagrams of
a cell mixture of CFP-labelled scramble LV-THP1 control cells and GFP-labelled ADAM10-KD
cells before and after transmigration. The lower left panel shows that the loading control
before transmigration contained 36% CFP positive scramble cells and 53% GFP positive
ADAM10-KD cells. Of the transmigrated cells (lower right panel), 62% are CFP positive and
only 27% GFP positive. In this experiment the ratio of GFP positive cells before (53%) versus
after (27%) the transmigration is at 0.51 (0.27/0.53). This indicates that in this experiment
THP1 cells lacking ADAM10 migrated at a clearly lower rate than the control cells.

63
A
B
Figure 20: The refined transmigration assay using CFP labelled control cells and GFP
labelled KD cells.
A: Schematic drawing of the refined transmigration assay. CFP-labelled LV-THP1 scramble control cells (blue-labelled cells) and GFP-labelled ADAM-KD LV-THP1 cells were added into the transwell insert. At the end of the incubation period the cells that had transmigrated into the lower compartment were collected and analysed by flow cytometry. B: Dot blot diagrams of transmigrated CFP and GFP-labelled LV-THP1 which had been analysed by flow cytometry. Cells in quadrants Q1 are CFP positive while quadrant Q3 includes GFP positive cells. The upper panels show the ratio of GFP-scamble and CFP-scramble LV-THP1 before (loading control on the left) and after the transmigration (right panel). Both lower panels show the ratio of scramble-CFP and ADAM10-KD LV-THP1 before (left panel) and after the transmigration (right panel).

64
With the refined transmigration setup it is possible to look exclusively at cells carrying the
knock-down of the target genes, excluding non-transduced cells. Another advantage of this
system is that it gives highly reproducible results and that it allows the use of flow cytometry
as a read out method. Flow cytometry is a fast and straight forward read-out system which
is capable of analysing high cell numbers and many different populations in one experiment.
Effect of ADAM10 knock down on THP1 cell chemotaxis and
transmigration
The inhibition of THP1 cell chemotaxis and transmigration by the ADAM inhibitors GI254023
and GW282406 (Figure 10) had indicated that ADAM10 seems to play a more important role
in the migration of THP1 cells than ADAM17. Therefore, the LV-THP1 with the gene silencing
of ADAM10 were tested first in the refined transmigration setup. Figure 21A shows that less
ADAM10-KD cells migrated in response to MCP-1 trough the endothelial monolayer compared
to the scramble control cells. The ADAM10-650 LV-THP1 cells migrated at a rate of 80%
compared to the included scramble control, while the ADAM10-1947 cells migrated at a rate
of only 61%.
In addition, both ADAM10 deficient cell lines showed a migration deficit in MCP-1 induced
chemotaxis when endothelial cells are not present. The cell line ADAM10-650 migrated at a
rate of 80% and the ADAM10-1947 at only 65% (Figure 21B).
This findings are in accordance with the inhibitor studies where the inhibition of ADAM10 led
to a strongly decreased migration, especially in the chemotaxis assays that were performed
in the presence of the inhibitors (Figure 10A). It is noteworthy though, that the inhibition of
the ADAMs with the inhibitors GI254023 (inhibits ADAM10) and GW282406 (inhibits ADAM10
and 17) decreased the transmigration rate of the wt THP1 cells to 21% and 32%,
respectively. This may be caused by the fact, that at the concentration the inhibitors were
used, all ADAM10-molecules present are inhibited. The shRNA treatment leads to a down
regulation of about 80-90% (see Figure 18A and B and Figure 19C), which means that the
cells still possessed 10-20% of their initial amount of ADAM10 molecules.
The undirected transendothelial migration in absence of the chemotactic stimulus MCP-1
through the endothelial layer (Figure 21C) is as well impaired by the knock-down of ADAM10
(ADAM10-650 95% and ADAM10-1947 75%), although only the ADAM10-1947 cell line
showed a significant difference to the scramble LV-THP1. The same observation was made
for the undirected chemotaxis (Figure 21D) where the ADAM10-650 cells migrated at an

65
average rate of 77% and the ADAM10-1947 at a rate of 94% compared to the included
scramble LV-THP1.
A
scr
A10-6
50
A10-1
947
0.0
0.5
1.0 *
**
LV-THP1-KD-lines
cha
nge
of
CF
P/G
FP
rat
io
B
scr
A10-65
0
A10-1
947
0.0
0.5
1.0*
**
LV-THP1-KD-lines
chan
ge o
f C
FP
/GF
P r
atio
C
scr
A10-6
50
A10-1
947
0.0
0.5
1.0***
LV-THP1-KD-lines
chan
ge
of
CF
P/G
FP
ra
tio
D
scr
A10-6
50
A10-1
947
0.0
0.5
1.0
1.5
*
LV-THP1-KD-lines
chan
ge
of
CF
P/G
FP
ra
tio
Figure 21: Transmigration and chemotaxis of ADAM10-LV-THP1 in response to MCP-1.
A: Transmigration of ADAM10-KD LV-THP1 cells through an endothelial layer of HMVEC with MCP-1 as chemotactic stimulus. B: Chemotaxis of LV-THP1 with shRNA KD of ADAM10 through 8nm filters in presence of MCP-1 as chemotactic stimulus. C: Random transmigration rate of ADAM10 deficient LV-THP1 through an endothelial layer of HMVEC in the absence of a chemotactic stimulus. D: Random migration of ADAM10-KD LV-THP1 in the chemotaxis assay with no chemotactic stimulus present in the lower chamber of the transwell. All data are shown as the average change in the CFP/GFP ratio of the transmigrated cells compared to the CFP/GFP ratio of the input cell mixture that was added to the insert of the transwell. Data are shown as mean ±SD, n=6, *p<0.05, **p<0.01, ***p<0.001 compared to scramble control.
In parallel to the relative quantification, also absolute numbers of transmigrated cells were
determined. The number of transmigrated cells of each sample was determined to have an
alternative readout value for the transmigration. To count the number of transmigrated cells
by flow cytometry, a defined amount of counting beads was added to each sample before

66
the flow cytometry analysis. The flow cytometry analysis was stopped, when a defined
number of the counting beads had been detected. Since the ADAM10-KD LV-THP1 cells could
be differentiated from the scramble control cells because of their different fluorescent
proteins, it could be determined how many cells of each population had transmigrated.
A
scr
A10-6
50
A10-1
947
scr n
o stim
0
10
20
30
40
50
** *
***
GFP-positive LV-THP1
LV-THP1-KD-lines
% m
igra
ted
GF
P-p
os. c
ells
B CFP-positve scramble LV-THP1
scr
A10-650
A10-19
47
scr n
o stim
0
10
20
30
40
50
GFP positive-LV-THP1-KD-lines with whichthe CFP-scramble LV-THP1 migrated
% m
igra
ted
CFP
-po
s. c
ells
**
C GFP-positive LV-THP1
scr
A10-65
0
A10-1
947
scr n
o st
im
0
5
10
15
***
***
***
LV-THP1-KD-lines
% m
igra
ted
GF
P-p
os.
cells
D CFP-positve scramble LV-THP1
scr
A10-6
50
A10-1
947
scr n
o sti
m
0
5
10
15
**
GFP positve-LV-THP1-KD-lines with whichthe CFP-scramble LV-THP1 migrated
% m
igra
ted
CF
P-p
os.
cells
Figure 22: Percentage of migrated cells in the transmigration and chemotaxis assays of
ADAM10-LV-THP1.
A: Percentage of GFP-positive scramble (scr) and ADAM10-KD (A10-650 and A10-1947) LV-THP1 cells that migrated through the transendothelial barrier. B: Number of CFP-labelled control cells which migrated together with scramble control cells (scr) or ADAM10-KD (A10-650 and A10-1947) LV-THP1 cells. C: Migration rates of GFP expressing ADAM10-KD LV-THP1 cells in the chemotaxis assays expressed in percentage of inserted cells. D: Percentage of migrated CFP-labelled control cells that competed with scramble or ADAM10-KD cells in the chemotaxis assay. All data is shown as the average percentage of transmigrated cells compared to the number of cells that were added to the insert of the transwell. To show the effect of the MCP-1 stimulus the percentage of scramble cells that migrated in the absence of MCP-1 (scr no stim) is shown in all diagrams. Data are shown as mean ±SD, n=5, *p<0.05, **p<0.01, compared to scramble control.

67
As expected, the GFP-labelled ADAM10-KD LV-THP1 cells transmigrated through the
endothelial layer at a significant lower rate than the CFP-labelled scramble-control cells
(Figure 22A). The transmigration of the GFP-positive scramble cells which migrated together
with ADAM10-KD LV-THP1 cells, was not significantly affected (Figure 22B A10-650 and A10-
1947). However, there was a notable decrease in their number as well. When CFP-positive
scramble cells migrated with GFP-labelled control cells 30% of the inserted CFP-positive cells
migrated. When the CFP-positive scramble cells competed with ADAM10-KD LV-THP1, an
average of only 21% (ADAM10-650) respectively 22% (ADAM10-1947) migrated.
In the chemotaxis assays, the GFP-positive ADAM10-KD LV-THP1 migrated at a significant
lower percentage compared to the GFP-scramble control cells (Figure 22C). Similar to the
transendothelial migration, the total number of CFP-labelled scramble control cells was
reduced when they migrated together with ADAM10-KD LV-THP1 cells instead of scramble
GFP-positive control cells. (Figure 22D). However, this effect was not significant.
In summary, gene knock-down of ADAM10 results in reduced THP1 cell migration towards
MCP-1 independent of the presence or absence of endothelial cells. It also seems possible
that ADAM10-downregulation could affect migration of neighbouring cells with normal levels
of ADAM10. This is indicated by the attenuated migration of CFP-labelled scramble controls
in the above described experiment. Although this effect did not reach significance, it could
well be that non migrating cells with knockdown of ADAM10 compete with the control cells
for limited binding contacts on endothelial cells or chemotaxis membranes and thereby
hinder their migration.
Role of other ADAM proteases for transmigration and chemotaxis of
THP1 cells
The results of the transmigration and chemotaxis assays performed with ADAM10-KD LV-
THP1 cells (Figure 21 and Figure 22) confirmed the findings obtained with the ADAM
inhibitors GI254023 and GW282406. Both, pharmaceutical and transcriptional inhibition,
indicated a crucial role of ADAM10 in the transmigration of THP1 cells. Due to the lack of
specific inhibitors, the influence of other ADAMs such as ADAM8, ADAM9 or ADAM17 on
leukocytes could not be directly investigated by inhibition experiments. To study the
involvement of other proteases in the migration process, THP1 cell lines with the gene
silencing of ADAM8, 9 or 17 (see Figure 18 and Figure 19) were investigated.

68
Effect of ADAM8 knock down on monocytic migration
Figure 23 shows the results of the transmigration and the chemotaxis assays performed with
the ADAM8-KD LV-THP1 cell lines. Surprisingly, the gene silencing of ADAM8 had an even
higher impact on the leukocyte transmigration (Figure 23A) than the KD of ADAM10 (Figure
21A and Figure 22A). All three ADAM8 shRNA sequences tested reduced the transendothelial
migration of ADAM8-KD LV-THP1 significantly. Their inhibitory effect was stronger than that
of the ADAM10-KD shRNA sequences when comparing the change of CFP/GFP ratio (Figure
23A). In line with the transmigration experiments, the migration rates of all there ADAM8
silenced LV-THP1 cell lines were also strongly impaired in the chemotaxis assays (Figure
23B).
A
scr
A8-903
A8-18
31
A8-26
450.0
0.5
1.0
1.5
***
** **
LV-THP1-KD-lines
chan
ge o
f CF
P/G
FP
rat
io
B
scr
A8-903
A8-18
31
A8-26
450.0
0.5
1.0
1.5
***
***
LV-THP1-KD-lines
cha
nge
of C
FP
/GF
P r
atio
Figure 23: Effect of ADAM8-KD on transmigration and chemotaxis of THP1 cells.
A: Transmigration of ADAM8-KD LV-THP1 cells through an endothelial layer of HMVEC with MCP-1 as chemotactic stimulus. B: Chemotactic migration of LV-THP1 with shRNA silencing of ADAM8 through 8nm filter in presence of MCP-1 as chemotactic stimulus. Data is shown as change of CFP/GFP ratio before and after the transmigration. Data are shown as number of migrated cells relative to the scramble control. The data of all panels are shown as mean ±SD, n=4, *p<0.05, **p<0.01, ***p<0.001 compared to scramble control. Diagrams expressing the effect of the gene silencing of ADAM8 as relative number of migrated LV-THP1 cells are found in the Appendix.
Effect of ADAM9 knock down
In contrast to the gene silencing of ADAM8 (Figure 23) and ADM10 (Figure 21 and Figure
22), gene silencing of ADAM9 in LV-THP1 cells did not reduce the migratory response of the
LV-THP1 cells (Figure 24). LV-THP1 with silenced ADAM9 expression migrated almost at the
same rate as the scramble control cell (ADAM9-1967) or even at a significantly higher rate

69
than the control cells (ADAM9-1967). The ADAM9-KD LV-THP1 cells showed this migration
behaviour in presence (Figure 24A) or absence of the endothelial layer (Figure 24B).
A
scr
A9-196
7
A9-226
00.0
0.5
1.0
1.5
2.0
*
LV-THP1-KD-lines
cha
nge
of C
FP
/GF
P r
atio
B
scr
A9-19
67
A9-22
600.0
0.5
1.0
1.5
2.0
LV-THP1-KD-lines
cha
nge
of
CF
P/G
FP
ra
tio
Figure 24: Migration rates of ADAM9-LV-THP1 cells in transmigration and chemotaxis assays.
A: Transmigration assay of LV-THP1 with a gene silencing of ADAM9 through an endothelial layer of HMVEC with MCP-1 as chemotactic stimulus. B: Chemotaxis assay of ADAM9-KD LV-THP1 through 8nm filter in presence of MCP-1 as chemotactic stimulus. Data is shown as change of CFP/GFP ratio before and after the transmigration. The data of all panels are shown as mean ±SD, n=4, *p<0.05, compared to scramble control. Diagrams expressing the effect of the gene silencing of ADAM9 as relative number of migrated LV-THP1 cells are found in the Appendix.
Effect of ADAM17 Knock-down
The analysis of the migratory behaviour of the ADAM17-KD LV-THP1, (Figure 25) largely
confirmed the inhibition studies (Figure 10) which had shown that combined inhibition of
ADAM10 and ADAM17 by GW282406 does not result in an additional migratory deficit
compared to preferential inhibition of ADAM10 by GI254023. While the shRNA sequence
ADAM17-2642 did not affect the migration rate of the LV-THP1 the second sequence
ADAM17-2061 decreased the CFP/GFP-ratio of scramble versus ADAM17-KD cells slightly but
significantly (Figure 25A). This indicates that ADAM17-KD cells may have only slightly
reduced migratory abilities in direct comparison to the scramble cells. Both ADAM17-KD LV-
THP1 cell lines did not migrate at a significant lower rate in the chemotaxis assay (Figure
25).

70
A
scr
A17-2
061
A17-26
420.0
0.5
1.0
1.5
*
LV-THP1-KD-lines
chan
ge o
f C
FP
/GF
P r
atio
B
scr
A17-2
061
A17-2
642
0.0
0.5
1.0
1.5
LV-THP1-KD-lines
chan
ge o
f C
FP
/GF
P r
atio
Figure 25: Transmigration and chemotaxis assays with ADAM17-LV-THP1.
A: Transmigration of ADAM17 gene silenced LV-THP1 cells through an endothelial layer of HMVEC with MCP-1 as chemotactic stimulus. B: Chemotaxis assay of LV-THP1 with ADAM17 gene silencing through 8nm filter in presence of MCP-1 as chemotactic stimulus. Data is shown as change of CFP/GFP ratio before and after the transmigration. The data of all panels are shown as mean ±SD, n=4, *p<0.05, compared to scramble control. Diagrams expressing the effect of the gene silencing of ADAM17 as relative number of migrated LV-THP1 cells are found in the Appendix.
3.6. Role of ADAMs for the sensitivity of LV-THP1 cells towards
different MCP-1 concentrations
The transmigration and chemotaxis experiments had shown that LV-THP1 cells with a gene
silencing of ADAM8 and 10 (Figure 21 and Figure 23) have migratory deficiencies compared
to scramble LV-THP1. THP1 cells with a gene knock down of ADAM9 and 17 in contrast
migrate at more or less the same rate as scramble cells (Figure 24 and Figure 25). These
findings gave rise to the question how ADAM8 and 10 contribute to the migration of the
leukocytes.
Gene knock down of ADAM8 and ADAM10 showed the same effect on transendothelial
migration and chemotaxis of THP1 cells. The latter findings demonstrate that the migration
deficit was independent of the endothelial cell layer. One possible explanation may be that
the ADAM8-KD and ADAM10-KD affects the sensitivity of THP1 towards MCP-1.
To test this hypothesis, transmigration experiments at MCP-1 concentrations, ranging from
0nM to 30nM MCP-1, were performed with the different ADAM-KD LV-THP1 cell lines. Figure
26A shows the dose response curve of the five LV-THP1 cell lines tested. The curve has the
typical bell shaped outline which is common for dose response curves of chemokines. The
ADAM9-1967 LV-THP1 (up-pointing triangles) migrated at all MCP-1 concentration at higher

71
rates than the control scramble cell line (circles) which was in accordance with the results of
the initial transmigration experiments (Figure 24). However, a lateral shift of the peak of the
concentration dependent migration curve could not be observed. This would have indicated a
higher or lower sensitivity of ADAM9-KD LVTHP1 to MCP-1. Accordingly to the transmigration
A
0nM
1nM
3nM
10nM
30nM
0
10
20
30
40ScrA8-903A9-2260A10-1947A17-2642
MCP-1 concentration
% o
f mig
rate
d ce
lls
B
1nM
3nM10
nM30
nM 1nM
3nM10
nM30
nM1n
M3n
M10
nM30
nM1nM 3n
M10
nM30
nM 1nM
3nM10
nM30
nM
0.0
0.5
1.0
1.5
2.0 scrA8-903A9-2260A10-1947A17-2642
MCP-1 concentration
chan
ge o
f C
FP
/GF
P r
atio
Figure 26: Concentration dependent transmigration of ADAM-KD LV-THP1 towards MCP-1.
A: Dose response curve of LV-THP1 with gene silencing of ADAM8, 9, 10 and 17 and scramble control cells towards MCP. The results of one representative experiment are shown. B: Change of the CFP/GFP ratios of scramble-CFP cells versus ADAM-KD-GFP LV-THP1 over the course of the different MCP-1 concentrations. The data are shown as mean ±SD, n=3.

72
experiments of ADAM8, 10 and 17-KD-LV-THP1 at 3nM (Figure 22, Figure 23, Figure 25) the
percentage of total migrated cells of the ADAM8 (squares), ADAM10 (down pointing
triangles) and ADAM17 (diamonds) deficient LV-THP1 was lower than that of the scramble
LV-THP1. However, a lateral shift of the curve was not observed.
The change of the CFP/GFP ratios of scramble-CFP cells versus ADAM-KD-GFP LV-THP1 over
the course of the different MCP-1 concentration is shown in Figure 26B. While ADAM8 or 10
deficient cells migrated constantly at lower rates than the scramble cells, there is no
concentration at which these cells would migrate at a significant higher rate compared to
3nM MCP-1 which was the concentration at which all previous transmigration and chemotaxis
experiments had been performed. Neither ADAM9 deficient cells nor ADAM17 deficient LV-
THP1 cells showed a significant change of their CFP/GFP ratio of scramble-CFP versus ADAM-
KD-GFP LV-THP1 at any MCP-1 concentration. While ADAM9-KD LV-THP1 migrated at a
constant higher rate than the scramble control cells, the ADAM17-KD LV-THP1 migrate at
about the same rate as the scramble control cells.
3.7. The effect of ADAM8, 9, 10 and 17 knock-down on the Ca2+
response of THP1 cells to MCP-1
The results of the concentration dependent transmigration experiments (Figure 26) had
shown that the differences in the migration rates of LV-THP1 cells with a gene silencing of
ADAM8, 9, 10 or 17 were not caused by a decreased or increased sensitivity of the cells
towards MCP-1. Another possible reason for the migratory deficits of ADAM8 and ADAM10-
KD LV-THP1 could be an impaired MCP-1 signalling. One important step in the signalling
event of chemokines is the release of the second messenger Ca2+ from the endoplasmatic
reticulum which occurs after the binding of chemokines to their respective G-protein coupled
receptor. In case of MCP-1, the signalling and the Ca2+-release is mediated by the seven-
membrane spanning G-protein coupled receptor CCR2170.
MCP-1-induced Ca2+response of THP1 cells
To test the hypothesis of an impaired MCP-1-induced signalling of THP1 cells caused by the
inhibition or gene silencing of ADAM-proteinases, THP1 cells were assayed for MCP-1
induced changes in cytoplasmic free Ca2+ using the FLUOstar OPTIMA plate-reader This
fluorescence plate-reader is equipped with two injectors which make it possible to
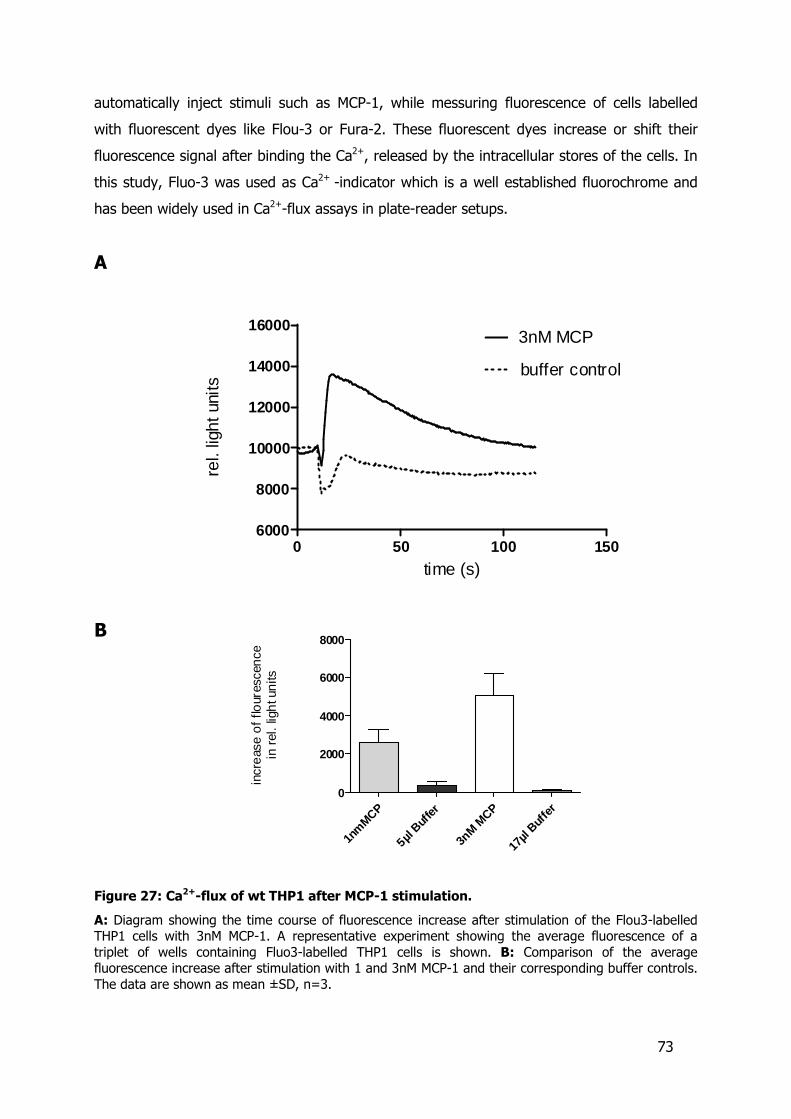
73
automatically inject stimuli such as MCP-1, while messuring fluorescence of cells labelled
with fluorescent dyes like Flou-3 or Fura-2. These fluorescent dyes increase or shift their
fluorescence signal after binding the Ca2+, released by the intracellular stores of the cells. In
this study, Fluo-3 was used as Ca2+ -indicator which is a well established fluorochrome and
has been widely used in Ca2+-flux assays in plate-reader setups.
A
0 50 100 1506000
8000
10000
12000
14000
160003nM MCP
buffer control
time (s)
rel.
light
uni
ts
B
1nm
MCP
5µl Buff
er
3nM M
CP
17µl
Buffer
0
2000
4000
6000
8000
incr
eas
e o
f flo
ures
cen
cein
rel
. lig
ht u
nits
Figure 27: Ca2+-flux of wt THP1 after MCP-1 stimulation.
A: Diagram showing the time course of fluorescence increase after stimulation of the Flou3-labelled THP1 cells with 3nM MCP-1. A representative experiment showing the average fluorescence of a triplet of wells containing Fluo3-labelled THP1 cells is shown. B: Comparison of the average fluorescence increase after stimulation with 1 and 3nM MCP-1 and their corresponding buffer controls. The data are shown as mean ±SD, n=3.

74
A typical Ca2+-flux measurement is shown in Figure 27A. During the first 10s of the
experiment, the base line fluorescence of Flou3-labelled cells was measured. Then MCP-1
(3nM solid line) was injected which led to a transient increase in fluorescence indicating the
increase of cytoplasmic free Ca2+ in the cells. The response reached its maximum within 5s
and returned to the baseline level within 90s. As control, the same volume of buffer was
injected to a different well of the labelled cells (dotted line) to exclude a false positive effect
caused by the mechanical stimulation of the cells due to the injection of the MCP-1 solution.
The Ca2+-response of the THP1 cells to different concentrations of MCP-1 was tested.
Besides, the concentration of 3nM MCP-1 at which the transmigration and chemotaxis
experiments had generally been performed 1nM MCP-1 was used as stimulation
concentration in all Ca2+-influx experiments. Figure 27B summarises the results of the
stimulation with both MCP-1 concentrations and their corresponding buffer control for three
experiments with wt THP1 cells.
Influence of the ADAM inhibitors GI254023 and GW282406 on the
Ca2+-response of wt THP1
The Ca2+-flux assay was first used to study the influence of the ADAM inhibitors GI254023
and GW282406 on the stimulation of wt THP1 cells by MCP-1. The cells were pretreated with
the inhibitors at a concentration of 10µM for 1h and subsequently stimulated with MCP-1
(1nM and 3nM). The inhibition of the ADAM proteases by the inhibitors slightly decreased
Ca2+-transients in response to 3nM MCP-1, but this effect was not significant (Figure 28).
Similar results were obtained when cells were stimulated with 1nM MCP-1 (not shown)
(compare to Figure 27B). These experiments indicate that the metalloproteinases ADAM10
and ADAM17 do not play a crucial role in the induction of intracellular calcium-transients by
MCP-1.

75
Influence of the gene silencing of ADAM8, 9, 10 and 17 on the Ca2+-
response of LV-THP1
The influence of the mRNA knockdown of ADAM proteases on calcium-transients in MCP-1
stimulated THP1 cells was analysed next. The stable ADAM8, 9, 10 or 17-KD THP1 cell lines
(see Figure 18 and Figure 19) were assayed for calcium-transients in response to 3 nM MCP-
1. Cells treated with scramble control shRNA were investigated in parallel (Figure 29).
In comparison to the scramble control, neither ADAM8, ADAM9, ADAM10 nor ADAM17-KD
LV-THP1 cells showed a significantly altered calcium response to MCP-1 stimulation.
Altogether, the inhibition as well as the mRNA knockdown experiments, indicated that
ADAMs do not influence the calcium response in THP1 cells. Therefore, the observed
migratory deficits of THP1 cells upon inhibition or silencing of ADAM10 and 8 cannot be
explained by an alteration of the Ca2+-response towards MCP-1.
DMSO GI GW
0
2000
4000
6000
8000
Inhibitors
incr
eas
e o
f fl
our
esce
nce
in r
el.
light
uni
ts
Figure 28: MCP-1 induced Ca2+-response of THP1 cells treated with the ADAM inhibitors GI254023 and GW282406.
ADAM inhibition of wt THP1 with the specific inhibitor a GI254023 (10µM) and GW282406 (10µM) did not result in changed Ca2+-influx after stimulation with 3nM MCP-1 compared to the DMSO solvent control. The data are shown as mean ±SD, n=3.

76
3.8. Influence of ADAM8, 9, 10 and 17 knock-down on adhesion
of THP1 cells to VCAM-1 and fibronectin under static
conditions
The Ca2+-influx experiments showed that the investigated ADAMs do not influence MCP-1
induced cell migration on the level of intracellular Ca2+-transients. To gain more insight in the
involvement of the ADAM proteinases in the process of leukocyte migration, adhesion
experiments under static conditions were performed with the THP1 cells.
As substrates for adhesion VCAM-1, ICAM-1 and fibronectin were chosen. These substrates
play a crucial role in cell attachment during leukocyte migration and transmigration.
Fibronectin is a component of the extracellular matrix and bound by integrins that are
A
scr
A8-90
3
A8-183
1
A8-26
450
1000
2000
3000
4000
5000
LV-THP1-KD-lines
incr
ease
of f
lou
resc
enc
ein
rel
. lig
ht u
nits
B
scr
A9-19
67
A9-226
00
1000
2000
3000
4000
5000
LV-THP1-KD-lines
incr
ease
of
flou
resc
enc
ein
rel
. lig
ht u
nits
C
scr
A10-65
0
A10-
1947
0
2000
4000
6000
8000
LV-THP1-KD-lines
incr
ease
of
flour
esce
nce
in r
el.
light
uni
ts
D
scr
A17-
2061
A17-2
642
0
1000
2000
3000
4000
5000
LV-THP1-KD-lines
incr
eas
e of
flo
ures
cen
cein
re
l. lig
ht u
nits
Figure 29: Ca2+-response of LV-THP1 with gene silencing of ADAM8, 9, 10 or 17.
Ca2+-influx of ADAM8-KD LV-THP1 (A), ADAM9-KD LV-THP1 (B), ADAM10-KD LV-THP1 (C) or ADAM17-KD LV-THP1 (D) after MCP-1 stimulation (3nM). The data are shown as mean ±SD, n=3.

77
expressed on THP1 cells. ICAM-1 and VCAM-1 are expressed on endothelial cells and are
bound by the integrins LFA1 and VLA4 of leukocytes, respectively. THP1 cells have been
found to adhere under static conditions to VCAM-1 and fibronectin but not to ICAM-1166. In
the mentioned study, adherence to both, VCAM-1 and fibronectin, was enhanced by
stimulation with MCP-1. BSA coated wells served as control.
Adhesion of THP1 cells to V-CAM and fibronectin under static
conditions
The experimental setup of the adhesion assay of Ashida et al.166 was adapted to examine
whether the inhibition or the gene silencing of ADAM8, 9, 10 or 17 affected the adhesion of
THP1. Unstimulated and MCP-1 stimulated wt THP1 were investigated for adhesion to cell
culture plates coated with VCAM-1, ICAM-1, fibronectin and BSA (Figure 30). In accordance
to Ashida and co-workers it was observed that THP1 adhered tightly to VCAM-1 and
VCAM-1 +
MCP-1
VCAM-1 no
stim
ICAM-1
+ MCP-1
ICAM-1
no st
im
fibr o
necti n
+ M
CP-1
fibr o
nectin
no st
im
BSA + MCP-1
BSA no s
tim
0
1
20
40
60
80
adhesion substrates and stimulations
% a
dhe
ren
t ce
lls
Figure 30: Adhesion of THP1 to VCAM1, ICAM-1 and fibronectin under static conditions with and without the stimulation by 3nM MCP-1.
THP1 cells in absence or presence of 3nM MCP-1 were added wells of a 96-well plates that were coated with VCAM-1, ICAM-1 and fibronectin. BSA coated wells served as negative control. After washing the well two times and lysis of cells, the cell count was determined using the glucoronidase assay. The data are shown as mean ±SD, n=3.

78
fibronectin but not to VCAM-1 and the BSA control. In contrast to the mentioned study, the
stimulation with MCP-1 did not result in adhesion changes of the THP1 cells.
The influence of the ADAM inhibitors GI254023 and GW282406 on the adhesion of wt THP1
was examined next. Compared to the solvent control, neither GI254023 nor GW282406
affected adhesion of wt THP1 to VCAM-1 (Figure 31A) or fibronectin (Figure 31B). As seen
before, almost no adhesion to ICAM-1 and the BSA control was observed (data not shown).
The same observation was made when cells were not stimulated with MCP-1 (compare to
Figure 30).
A
DMSO GIGW
0
20
40
60
80
Inhibitors
% a
dher
ent
cel
ls
B
DMSO GIGW
0
20
40
60
80
Inhibitors
% a
dhe
rent
cel
ls
Figure 31: Static adhesion of wt THP1 treated with the ADAM inhibitors GI254023 and GW282406.
A: Static adhesion of wt THP1 to VCAM-1 under the pharmaceutical inhibition of ADAM10 (GI254023) and ADAM10 and 17 (GW282406). Each inhibitor was used at a concentration of 10µM. DMSO (0.1%) served as solvent control. B: Adhesion of inhibitor treated THP1 to fibronectin. The data depicted in figures A and B show the level of adhesion with a stimulation of MCP-1 at 3nM. Unstimulated THP1 adhered at equally rates to both substrates. The percentages indicate the number of adherent cells compared to the number of cells that were initially added to the wells containing the immobilized adhesion substrates. The data are shown as mean ±SD, n=3.
To confirm these results and to include ADAM8 and ADAM9, the effect of ADAM8, 9, 10 or 17
gene silencing on adhesion of THP1 cells was analysed. Similar to the results with GI254023
and GW282406 treated wt THP1 cells (Figure 31), no significant effect of the gene silencing
of either ADAM-proteinase on the adhesion to VCAM-1 (Figure 32A) or fibronectin (Figure
32B) was observed.
Combining the results of the inhibition experiments with GI254023 and GW282406 and the
mRNA silencing experiments, an influence of ADAM8, 9, 10 or 17 on the static adhesion of
THP1 to VCAM-1 and fibronectin could be excluded.

79
A
scr
A8-90
3
A8-18
31
A8-264
5
A9-19
67
A9-22
60
A10-65
0
A10-1
947
A-17-2
061
A17-2642
0
20
40
60
80
100
LV-THP1-KD-lines
% o
f a
dher
ent
cel
ls
B
scr
A8-903
A8-18
31
A8-26
45
A9-1
967
A9-22
60
A10-6
50
A10-1
947
A-17-2
061
A17-26
420
20
40
60
80
100
LV-THP1-KD-lines
% o
f ad
here
nt c
ells
Figure 32: Static adhesion of LV-THP1 with gene silencing of ADMA8, 9 10 or 17.
Static adhesion of ADAM-KD LV-THP1 to immobilized VCAM-1 (A) or fibronectin (B). The data depicted in figures A and B show the level of adhesion after stimulation of MCP-1 at 3nM. Unstimulated THP1 adhered at equal rates to both substrates irrespective of either ADAM8, 9, 10 or 17 gene silencing. Adherence is expressed as percentage of total number of cells that were initially added to each wells containing the immobilized adhesion substrates. The data are shown as mean ±SD, n=3.
3.9. Role of ADAM8, 9, 10 and 17 gene silencing on epithelial
cell migration
The transmigration and chemotaxis assays had demonstrated that gene silencing of ADAM8
and 10 profoundly reduces chemotaxis and transmigration of THP1 cells, whereas silencing
of ADAM9 and 17 showed no comparable effects on the migratory abilities. To this end, only
the migration of leukocytic cells had been investigated. To answer the question whether the
observed effects also account for non leukocytic cells, migration experiments with an
adherent epithelial cell line were performed.
A common in vitro assay, to study the migration of epithelial or endothelial cells, is the so
called “scratch assay”. A confluent cell layer is injured by a defined scratch and the closure
of the gap in the cell layer by the immigrating cells is monitored over time by microscopy.
This assay is used as a model for the wound closure process of endothelial or epithelial
tissues.
Scratch assays were performed with the epithelial cell line ECV304 to study the role of
ADAM8, 9, 10 and 17. The scratch assays were conducted with cells which had been stably
transduced with the ADAM8, 9, 10 or 17 pLVTHM lentivirus, respectively (see Figure 13 to

80
Figure 17). Figure 33 shows the microscopic picture of the migrated ADAM8-KD LV-ECV 304
in comparison to the scramble control cells just after the scratch and 24h after the migratory
process had started. In all experiments additional photos of the scratch were taken 2h, 4h
and 8h after the scratch (data not shown).
Figure 33: Microscopic images of the scratch assay performed with ADAM8-KD LV-ECV304
and scramble control cells.
Directly after the scratch was made, the defined gap in the confluent cell layer had sharp edges (0h). 24h after the scratch, the process of gap closure is clearly detectable when compared to the original size of the scratch indicated by the red square. While the gap of the scramble control ECV304 cell layer is almost closed, fewer cells have immigrated into the gap of the two different ECV304 cell lines with the gene silencing of ADAM8.
The migration behaviour of the different ECV304 cell lines with gene silencing of ADAM8, 9,
10 or 17 was evaluated by counting the cells that had invaded a defined area of the gap
within the cell layer (red squares in Figure 33). The results of all scratch assays with different
cell lines are summarised in Figure 34.
Compared to the scramble control, ADAM8-KD LV-ECV 304 showed a significant migration
deficit in the scratch assay (Figure 34A). By contrast, ADAM9-KD and ADAM-17 LV-ECV 304
showed no significant difference in their wound healing properties compared to the scramble
control cells (Figure 34B and D). These findings are in accordance to the chemotaxis and
transmigration experiments showing that the migratory response of THP1 cells depends on
ADAM8 but not on ADAM9 and only to minor extend on ADAM17.

81
A significant migratory impairment of ADAM10 silencing on wound closure of ECV304 cells in
the scratch assay could not be detected (Figure 34C). While there was still a trend of a
reduced migration rate this did not result in a significant difference. This is in contrast to the
results of the chemotaxis or transmigration experiments performed with THP1 cells that had
demonstrated a crucial role of ADAM10 for leukocytic cell migration. Thus, the contribution of
ADAM10 to cell migration can be different, depending on the type of cell and its migratory
response.
A
scr
A8-183
1
A8-264
50.0
0.5
1.0
1.5
* **
LV-ECV-KD-lines
mig
ratio
n in
dex
(rel
. to
scr
)
B
scr
A9-1967
A9-22
600.0
0.5
1.0
1.5
LV-ECV-KD-lines
mig
rati
on in
dex
(rel
. to
scr)
C
scr
A10-6
50
A10-1
947
0.0
0.5
1.0
1.5
LV-ECV-KD-lines
mig
rati
on in
dex
(rel
. to
scr
)
D
scr
A17-2
061
A17-2
642
0.0
0.5
1.0
1.5
LV-ECV-KD-lines
mig
rati
on in
dex
(rel
. to
scr
)
Figure 34: Summary of the scratch assays performed with LV-ECV 304 with a gene
silencing of ADAM8, 9, 10 and 17.
A: Number of migrated ADAM8-KD LV-ECV304 compared to scramble control cells. B: Scratch assay results of ADAM9-KD LV-ECV 304. C: Results of wound closure of LV-ECV 304 with a gene silencing of ADAM10. D: Performance of ADAM17-KD LV-ECV-304 in the scratch assay. To be able to compare the performance of the different LV-ECV 304 cell lines in the scratch assay, the number of immigrated cells in the defined area of the gap after 8h were subtracted from the number of cells immigrated into the same area after 24h. The data is shown as migration index relative to number of immigrated scramble control cells. The data of all panels are shown as mean ±SD, n=6, *p<0.05, **p<0.01, compared to scramble control.

82
3.10. Remarks
The original data analysed and described by Figure 7, Figure 17, Figure 33 and Figure 34
were generated during the diploma thesis of Henriette Alert171 which was directly supervised
by the author of the present PhD thesis, F. Martin Hess. All mentioned experiments were
designed by F. Hess and separately evaluated for this thesis. H. Alert expressed her explicit
consent to use the mentioned data for this PhD thesis.

83
4. Discussion
Leukocyte recruitment and subsequent transendothelial migration is one of the most critical
hallmarks in inflammation. It has been shown that endothelial ADAM1015,16 and ADAM1714,66
influence endothelial permeability and thereby leukocyte diapedesis. In vivo studies with
conditional transgenic mice showed that neutrophil influx was strongly reduced when
leukocytes lacked ADAM1761–63. Recently it was reported that the absence of ADAM8 in
leukocytes reduces the number of infiltrating leukocytic cells in an experimental asthma
model131 and that PSGL-1 shedding by ADAM8 regulates the rolling of neutrophils on
endothelium133. While it has been shown that ADAM10 is essential for lymphoid
development109,113, there is no published study to date on the direct influence of leukocytic-
expressed ADAM10 in immune cell recruitment and migration .
In this study, the influence of leukocytic-expressed ADAM8, 9, 10 and 17 on leukocyte
migration was investigated by using ADAM-specific inhibitors and gene silencing of the four
ADAM proteases. As a model, the monocytic cell line THP1 was used and tested for in vitro
transendothelial migration and chemotaxis in response to the chemokine MCP-1. To our
knowledge this is the first study directly comparing the influence of all four mentioned ADAM
proteases in the same set up of migration assays.
The migration experiments revealed that directed transendothelial migration and THP1 cell
chemotaxis in response to MCP-1 was significantly reduced by the pharmaceutical inhibition
of ADAM10 and gene silencing of ADAM8 or 10, suggesting that these proteases are critically
involved in cell migration. By contrast, gene silencing of ADAM17 resulted in only a small
reduction of THP1 cell migration and the combined inhibition of ADAM10 and ADAM17 did
not decrease migration further than inhibition of ADAM10 alone. This indicated ADAM17’s
minor role in cell migration, while ADAM9 does not seem to be required at all as shown by
the silencing of the latter protease. As demonstrated by calcium flux experiments and
adhesion assays, the role of ADAM8 and ADAM10 in THP1 cell migration cannot be explained
by the changed sensitivity of THP1 cells towards MCP-1 or by decreased static adhesion of
THP1 cells to VCAM-1, ICAM-1 and fibronectin. Notably, the importance of ADAM8 and
probably, of ADAM10, is not limited to leukocytic cells but also accounts for adherent cells
such as ECV304 cells that were investigated for adhesion in scratch wound healing assays.

84
Table 9: Summary table of the outcome of the performed functional assays of this study.
For experiments performed with cell lines which had been lentiviral transduced with shRNA sequences against a ADAM protease, one symbol indicates the results of one of the two or three different cell lines with the gene silencing of the mentioned ADAM.
Differential expression of ADAMs in different cell culture lines
The expression of mRNA transcripts of the four metalloproteases ADAM8, 9, 10 and 17 was
analysed in seven cultured or primary cell lines. These cell lines have been used in previous
studies that looked into the influence of ADAM10 and/or ADAM17 at various stages of
inflammatory processes and leukocyte recruitment12,14,15,21,66,107,172. However, an analysis by
quantitative real-time PCR showed that all examined cell lines expressed the four proteases
with remarkable and unexpected differences in the expression profiles.
The two epithelial cancer cell lines ECV304 (human bladder carcinoma cell line) and A549
(human alveolar basal epithelial adenocarcinoma cell line) differed mostly in their ADAM8
expression. ADAM8 overexpression has been shown in many solid tumours (see Introduction,
for a review of expression of ADAMs in different tumours see173) and is a marker of poor
prognosis and increased invasiveness. Since both cell lines stem from different epithelia it is
difficult to say whether their differences in ADAM expression stem from this cause or
whether the tumour lines acquired the difference in gene expression during their

85
tumourigenesis. Nor can it be excluded that their ADAM expression changed during their
time as cell culture lines: A549 have been used in research since 1972174 and ECV304 since
1970175,176.
The difference in expression of ADAM10 and 17 in the primary endothelial cell HMVEC and
HUVEC was very striking. HMVEC, which are derived from microvessels of the adult lung, had
comparatively high expression levels of ADAM10 and 17. By contrast, HUVEC, which were
isolated from the human umbilical vein, showed low mRNA levels of these proteases. It is
tempting to attribute theses differences in expression level to the micro- and macrovascular
origin of both primary endothelial cell types. Since both vascular environments fulfil different
purposes it is conceivable that vascular endothelial cells have different expression patterns of
ADAM proteases. But one should also take into account that both cell lines were isolated
from their respective donors at extremely different ages and stages of development, which
could also affect the expression patterns of ADAM10 and 17.
Differential expression of ADAM10 and 17 was also observed for the two leukocytic cell lines
THP1 (primary human acute monocytic leukaemia cells) and Jurkat (primary human T cell
leukaemia cells). While both cell lines show comparatively high levels of ADAM8 and low
levels of ADAM9, THP1 cells express both ADAM10 and 17 at high levels while Jurkat cells
are amongst the cell lines with the lowest mRNA levels of both proteases. That is line with
the proposition that ADAM8, 10 and 17 may fulfil different essential functions in the
recruitment of cells of different leukocytic lineage4. A recent study showed that ADAM17
knockout leads to an increased adhesion of neutrophils in the in vivo cremaster model.
However, the adhesion and recruitment of ADAM17-null monocytes did not exhibit any
alterations in this study177.
Both cell lines, THP1 and Jurkat cells, are derived from leukemic patients. Similar to the
epithelial cell lines ECV304 and A549, the question remains whether the changes in ADAM
expression resemble their monocytic and lymphoid lineage or whether they are caused by
their oncogenesis. Both cell lines have been widely used in research since the late 1970 and
it is equally possible that their ADAM expression profile changed over the course of their
cultivation163,178.
However, the mRNA expression analysis showed that THP1 cells were the ideal cell line to
study the role of leukocytic-expressed ADAM proteases in the migration of leukocytes. They
express comparative high level of ADAM8, ADAM10 and ADAM17 and the cells have been
used in various studies as a model cell line for in vitro assays examining monocyte
recruitment and transendothelial migration164–166,179.

86
Endothelial cells support THP1 cell migration
After the optimal MCP-1 concentration for directed THP1 migration in the in vitro
transendothelial transmigration had been found, the influence of the endothelial layer in the
migration process was analysed. Surprisingly, the migration rates of THP1 cells through the
endothelial layer were more than threefold higher than in the chemotaxis assays in the
absence of the endothelial layer when the cells migrated towards MCP-1. Apparently the
endothelial layer does not constitute an additional barrier migrating THP1 cells have to
overcome. Instead, the endothelial cells obviously assist the leukocytes in their
transmigration.
One possible explanation for this finding could be that the endothelial cells bind MCP-1 from
the lower compartment and present the chemokine on their surface to the THP1 cells in the
upper compartment of the transwell insert. The local high concentration could lead to
enhanced transmigration. There are several endothelial proteins which are known to take
part in this process. For example, it has been shown that the Duffy antigen receptor for
chemokines (DARC) transported MCP-1 through a endothelial barrier in a very similar
experimental setup180. Proteoglycans like the proteins of the syndecan-family are known to
present chemokines and other inflammatory modulators on the surface of endothelial cells
and thereby act as coreceptors for leukocytic chemokine receptors181.
Another possible explanation could be that endothelial adhesion molecules and complex
changes in the endothelial cell morphology actively support leukocyte transmigration22,182. It
has been shown that the binding of leukocytic integrins, such as LFA-1 and VLA-1, to
endothelial ICAM-1 and VCAM-1 leads to their clustering on the apical endothelial
plasmamembrane25,26. This initiates a release of intracellular calcium and the activation of
intracellular signalling molecules such as src-kinases and the GTPases RhoA and Rac-1. The
signal cascade results in the polymerisation of actin near the plasmamembrane and a
contraction of the endothelial cells183–186. Due to the proteolysis of adhesion molecules such
as VE-Cadherin and JAM-A by ADAM proteases14,15 and phosphorylation of VE-Cadherin187,
the inter-cellular endothelial junctions become permissive188. Signalling events also trigger
the transport of vesicles from the lateral border recycling compartment (LBRC) to the lateral
plasmamembrane at the cellular junction of the endothelial cells. The vesicles fuse to the
plasmamembrane189,190 and phosphorylated PECAM – which is stored in the vesicles of the
LBRC – is inserted into the junctional plasmamembrane191. The phosphorylated PECAM
undergoes a homophilic interaction with leukocytic PECAM which facilitates the movement of
the leucocytes through the endothelial junctions192.

87
The latter explanation that the endothelial cells are actively engaged in the diapedesis of the
leukocytes fits the finding that the undirected migration was 10 times higher in the presence
of an endothelial layer than in its absence. It is conceivable that consequences of both
processes – the transport and presentation of chemokines by the endothelial cells and the
active assistance of the endothelial cells in the migration – contribute to the increased
migration in presence of endothelial cells.
Pharmaceutical inhibition of ADAM10 inhibits transendothelial
migration and THP1 cell chemotaxis
The in vitro transendothelial migration of THP1 cells towards MCP-1 was significantly
inhibited when THP1 cells were pretreated before the migration experiment with GI254023,
which preferentially inhibits ADAM10. Pretreatment of the leukocytic cells with GW282406,
which inhibits both ADAM10 and 17, did not result in a significantly reduced migration of the
THP1 cells. Since this experiment sought only to examine the role of leukocytic-expressed
ADAMs, the transmigration experiment itself was performed in absence of the inhibitors.
In their study showing the importance of ADAM10 shedding of endothelial-expressed VE-
Cadherin for endothelial permeability and leukocyte transendothelial migration, Schulz et al.
performed similar experiments15. The authors investigated migration of activated primary T-
cells through HUVEC in the presence of GI254023 or GW282406. In their experiments, the
use of both inhibitors resulted in a significant and more pronounced reduction in
transmigration. Schulz and co-workers attributed the reduced migration to the inhibited
shedding of VE-Cadherin.
The reduced effect of the inhibitors on the transendothelial migration of THP1 cells which
was observed in this study can be attributed to the fact that the inhibitors were used for the
preincubation of THP1 cells only and removed prior to the migration assay. Since GI254023
and GW282406 are reversible, it is conceivable that during the time course of the incubation
of the transmigration experiment the inhibitors diffused off the ADAM proteases. The
proteases thereby regained there full proteolytic activity during the experiment which led to
the inhibitors’ reduced effect on migration.
Clear inhibition was observed in THP1 cell chemotaxis experiments without endothelial cells.
In these experiments the inhibitors were present throughout the assay. ADAM10 inhibition
by GI254023X profoundly decreased migration. Combined inhibition of ADAM17 and ADAM10
by GW2280264 did not result in an additional reduction of the migration rate compared to

88
GI254023. This indicates that ADAM10 inhibition alone is responsible for the observed effect
and that ADAM17 is not essentially involved in the directed chemotaxis of THP1 cells.
The chemotaxis assays were performed in the absence of potential protease substrates such
as endothelial adhesion proteins or components of the ECM, such as matrigel, collagen or
fibronectin. These are commonly used in invasion assays of tumour cells. Donners et al.
made similar observations in their study regarding the influence of the VEGF-receptor (VEGF-
R) on the migration of endothelial cells158. In one experiment of their study, Donners et al.
looked at GI254023’s effect on the migration of primary monocytes towards fMLP (N-formyl-
methionine-leucine-phenylalanine) in a similar chemotaxis assay. Monocyte chemotaxis was
inhibited in the presence of GI254023 although the observed effect was not as strong as in
the experiments of the present study. The authors of the mentioned study hypothesized that
ADAM10 may shed adhesion molecules which would facilitate the detachment of the
monocytes. However, since the VEGF-R shedding of ADAM10 was the main aspect of their
study the authors did not look into the role of monocytic ADAM10 in detail.
Taken together, there is a strong indication that THP1 cell expressed ADAM10 plays a crucial
role in migration. ADAM10 seems be to either involved in the interaction with leukocytic
adhesion molecules which are needed for the chemotaxis or in signalling processes in THP1
cells which effect their migration. To gain more insight into this problem and to complement
the inhibitor experiments, further experiments had to be performed with cells with ADAM10
and 17 transcriptional inhibition.
ShRNA knockdown of ADAMs
To further analyse the function of leukocytic-expressed ADAMs in leukocyte diapedesis and
chemotaxis, a lentiviral-based shRNA approach for the gene silencing of ADAM8, 9 10 and 17
was successfully established. The lentiviral transduction allowed targeting of cell lines and
primary cells for the gene transfer of shRNA sequences which are generally inaccessible for
standard transfection methods. The shRNA sequences designed against each target protease
silenced their mRNA and protein expression with high efficiency. In this study the successful
gene silencing of ADAM8, 9, 10 and 17 could be shown for HUVEC, ECV304 cells and THP1
cells. Unspecific silencing effects of the ADAM-specific shRNAs against non-target proteases
were excluded; this underlines the experimental value of this method. That the gene knock-
down of ADAM10 and 17 effect the shedding functions of both proteases was proven in

89
shedding experiments with CX3CL1, which is a well-described substrate for both
proteases67,107.
Since it enables targeting only one of the cell types, the established gene silencing system is
a highly useful tool in experimental systems such as in vitro transendothelial migration,
where several different cell types interact. Pharmaceutical inhibitors are of limited use in
these experiments since it is nearly impossible to determine which cell type is responsible for
the observed effect of the inhibitors. Another problem with pharmaceutical inhibitors is their
specificity. For example, has it been shown that GI254023 inhibits ADAM10 preferential over
ADAM17 but it remains to be investigated if any other of the remaining 15 mammalian
proteolytic active ADAMs is inhibited by this compound. However, combining both
approaches (transcriptional silencing and pharmaceutical inhibition) is advisable for studies
such as this one, since both approaches complement each other.
Lentiviral-delivered shRNA sequences which suppress gene expression of ADAM proteases
have become important for studying the function of ADAM10 and ADAM17. Transgenic mice
lacking either proteases die during embryogenesis or shortly after birth60,87 and conditional
transgenic mice with tissue-specific deletions of ADAM10 or 17 have only recently become
available16,61,66,113. Before the conditional transgenic mice were established, mouse embryonic
fibroblasts (MEF cells) isolated from ADAM10 or 17-deficient transgenic embryos have been
valuable tools to analyse the shedding of substrates in both proteases60,67,87,106. However,
MEF cells are only of limited use when the functions of ADAMs in a specific cell type, such as
endothelial cells or cells of different leukocytic lineages, are the topic of investigation. These
cell types can now be transduced with the lentiviral shRNA vectors and the efficiency of the
transduction can be easily monitored thanks to the reporter gene GFP which is used in the
lentiviral system established in this study. The lentiviral shRNA system has been used in
three additional studies of our group, where it was used alongside ADAM specific inhibitors
and tissue specific ADAM17-null mice as well21,66,107.
shRNA KD of ADAM10 confirms the results of the inhibitor studies
The migration experiments performed with lentiviral-transduced THP1 cells (LV-THP1) with a
ADAM10 gene silencing confirmed the findings of the migration experiments performed with
the ADAM specific inhibitors. Both ADAM10-KD LV-THP1 cell lines migrated at a significantly
lower rate than the scramble control cell in the directed transendothelial migration. The

90
random transendothelial migration of ADAM10-KD LV-THP1 cells in absence of MCP-1 was
reduced as well.
The same effect was observed in the chemotaxis assay where the ADAM10-KD cells only
migrated through polycarbonate filter membranes. The relative migration rates of the
ADAM10-KD LV-THP1 compared to the scramble control cells was very similar in the
transmigration and chemotaxis assay. However, when looking at the total number of
transmigrated cells, it was again apparent that three times as many cells migrated in the
transendothelial migration than in the chemotaxis assays. This observation was independent
of the ADAM10 silencing.
In their study regarding ADAM10 shedding of VE-Cadherin and its influence on leukocyte
recruitment, Schulz and co-workers performed transmigration experiments in the presence of
GI254023 (see above) and with T-cells transfected with siRNA against ADAM1015. In both
experimental set-ups, ADAM10 inhibition resulted in a reduced migration of the T-Cells. The
authors speculated that a possible trans-cleavage of VE-Cadherin by ADAM10 could be
responsible for this effect, as other studies had shown that ADAM10 is capable of cleaving
substrate in trans92.
However, the findings of the present study indicate ADAM10’s more general involvement in
leukocyte migration, in addition to its VE-Cadherin shedding. The migration rates of cells
with ADAM10 gene silencing were reduced in transendothelial migration and in chemotaxis
experiments where no endothelial cells and thereby no VE-Cadherin were present.
ADAM8 is needed for THP1 cell chemotaxis and transmigration
Migration experiments performed with ADAM8-KD LV-THP1 cell lines showed that in both
transmigration and chemotaxis, ADAM8-deficient cells migrated at lower rates than the
scramble control cells. The inhibitory effect of the ADAM8 silencing was even more
pronounced than that of the ADAM10 gene silencing.
ADAM8 is not essential for the organism since ADAM8-deficient mice are fully viable121.
However, Naus and co-workers have shown that these mice are protected from developing
experimental asthma131. The role of leukocytic ADAM8 was highlighted by the findings that
wt mice which had been transplanted with ADAM8-/- bone marrow showed reduced asthma
symptoms and a reduced number of infiltrating leukocytes in the lung131. Naus et al.
performed several separate in vitro migration assays of ADAM8-/- macrophages, dendritic
cells and T-cells in which the cells migrated through matrigel. The authors managed to show

91
that the migration capabilities of all the analysed leukocytic subsets were negatively affected
compared to wt control cells. The authors hypothesized that ADAM8 either is important for
the digestion of components of the ECM or that ADAM8 is involved in activation cascades or
signalling events. As a third option, Naus et al. pointed to a possible role of the
disintegrin/cystin-rich domain of ADAM8 which may be important for cell-ECM attachment.
The group of Frederico Díaz-González could show that ADAM8 is responsible for the cleavage
of L-selectin in neutrophils119. Leukocytic L-selectin is important in the first step of the rolling
process of leukocytes, where it interacts with sulphated carbohydrates of GlyCam-1 and
CD34 expressed on endothelial cells. Inhibition of L-selectin shedding leads to a reduction of
rolling velocity and increases neutrophil adhesion to the endothelium193. In a very recent
study the same group showed via immunoprecipitation that leukocytic ADAM8 interacts with
the P-selectin glycoprotein ligand-1 (PSGL-1) through activated ezrin-radixin-moesin actin-
binding proteins (ERM)133. PSGL-1 binds to endothelial P- and E-selectins and is involved in
tethering and rolling leukocytes on the endothelial cells. The interaction of PSGL-1 with
ADAM8 results in the shedding of the adhesion molecule. The authors showed with in vitro
flow adhesion experiments that ADAM8 gene silencing leads to an increased rolling of the
neutrophil-like cell line HL-60.
In the present PhD thesis the migration experiments ADAM8-KD LV-THP1 were performed
under static conditions and the migration deficit of cells lacking ADAM8 was also observed in
the chemotaxis assays in the absence of L-selectin and PSGL-1 binding partners. However,
the finding that ADAM8 might interact with adhesion molecules via adaptor molecules such
as ERM is intriguing. It is possible that ADAM8 is needed for the assembly of multiprotein
complexes which serve as anchorage for the actin cytoskeleton of the leukocytes. It is
conceivable that the interaction between ADAM8’s cytoplasmic tail and adaptor proteins such
as ERM are responsible for this. Equally, the disintegrin domain of ADAM8 and ADAM10 could
play a crucial role in a similar clustering process on the extracellular side of the plasma
membrane.
ADAM9 gene silencing in THP1 cells does not result in migratory
inhibition
The results of the transmigration and chemotaxis experiments with ADAM9-silenced LV-THP1
clearly showed that ADAM9 knockdown did not result in an inhibition of THP1 cell migration.
One of the two ADAM9-KD LV-THP1 cell lines (ADAM9-2260) actually migrated at
92
significantly higher rates in the transendothelial migration assay than the scramble control
cells. Even in the chemotaxis assay the migration rates of this cell line was elevated, though
not statistically significant. Since the increase in migration was only observed for one of two
shRNA sequences it cannot be concluded from these experiments that ADAM9 gene silencing
increases the migratory abilities of THP1 cells. However, the findings show no inhibitory
influence of the ADAM9-KD.
The results of the migration experiments accord with a study which analysed wound healing
in ADAM9-/- mice155. Although wounds healed faster in ADAM9-/- mice, the authors of the
study did not observe increased numbers of infiltrating leukocytes in the wound area. One
explanation for the increased migration of one of the ADAM9-KD LV-THP1 could be the
ADAM10 shedding by ADAM9, which was reported by two different groups141,194. The findings
presented by both studies indicate more of a modulating role of ADAM10 shedding by
ADAM9. Henriette Alert’s diploma thesis, which was supervised by the author of the present
study, showed that ADAM9 gene silencing in ECV304 cells did not result in changes of
ADAM10 surface expression171.
shRNA KD of ADAM17 effects chemotaxis and transmigration of
THP1 cells only slightly
The transmigration and chemotaxis experiments performed with THP1 cells with a gene
silencing of ADAM17 showed that ADAM17 is not as important as ADAM8 or ADAM10 for the
THP1 cell migration. Only one of the two THP1 cell lines with ADAM17 gene silencing
migrated at a slightly but significantly lower rate in the transendothelial migration
experiments than the scramble control cells. In the chemotaxis assay both ADAM17-KD cell
lines showed no significantly reduced migration. The migration experiments performed with
the inhibitor GW282406 had already shown that ADAM17 may be of minor importance in the
migration of THP1 compared to ADAM10. The combined inhibition of ADAM17 and ADAM10
did not result in an additional inhibition of the migration compared to the inhibition of
ADAM10 alone by GI254023. Thus, ADAM17 does not seem to play a crucial role in the
migration set-up of the present study.
Several studies have shown that mice with a conditional deletion of ADAM17 in leukocytes
had a significantly reduced neutrophil infiltration and better survival rates compared to wt
mice in LPS-induced sepsis models or e. coli-mediated peritonitis61–63. This was mostly
attributed to the reduced TNFα shedding by the ADAM17-/- leukocytes, which resulted in

93
reduced levels of inflammatory cytokines IL-1β and IL-6 as well. The inhibition of L-selectin
shedding in the ADAM17 leukocytes was made responsible for the observed, significantly
earlier neutrophil recruitment. According to the authors of the study, the increased L-selectin
expression led to tighter adhesion and mediated faster recruitment of the neutrophils.
A very recent study by Tang et al. confirmed the relevance of the increased L-selectin
expression for the significantly earlier recruitment of ADAM17-/- neutrophils in a sterile
peritonitis model and showed that these neutrophils exhibited slower rolling velocities in the
in vivo cremaster model177. Tang and co-workers were able to reduce the accelerated
recruitment of ADAM17-/- neutrophils by applying a blocking antibody against L-selectin; this
reduced the recruitment of wt and ADAM17-/- neutrophils to the same level. However, the
authors also found that the recruitment of ADAM17-/- monocytes was not altered by the gene
knockout even though they exhibited higher L-selectin levels as well. The authors concluded
that L-selectin plays a crucial role in neutrophil recruitment but it is of minor relevance for
the recruitment of monocytes.
The results obtained in this thesis from the ADAM17-KD LV-THP1 cells are in line with the
finding of Tang et al.. THP1 cells resemble a cell culture model for monocytes and it is
possible that the same experiments with primary ADAM17 deficient neutrophils from
transgenic mice or with different cell lines such as Jurkat cells (cell culture model for T-cells)
or HL-60 (cell culture model for neutrophils) would have resulted in a different outcome.
Role of ADAMs in the sensitivity of LV-THP1 cells towards different
MCP-1 concentrations
One possible explanation for the migratory deficits of THP1 cells with a gene silencing of
ADAM8 or ADAM10 in the chemotaxis assay could have been that the THP1 cells undergo
changes in their sensitivity towards MCP-1 when ADAM8 or ADAM10 is silenced. To test this
hypothesis, the transmigration of LV-THP1 with a gene silencing of ADAM8, 9, 10 or 17 was
tested using different MCP-1 concentrations ranging from 0nM to 30nM.
As expected, ADAM8 and ADAM10 silencing led to decreased migration, but no significant
shift of the dose response curve towards MCP-1 was observed when ADAM8 or ADAM10
gene-silenced THP1 cells were compared with the control. While ADAM9 deficient THP1 cells
showed higher migration rates than scramble control cells at all tested concentrations,
ADAM17-KD LV-THP1 cells migrated at about the same rate as the control cells.

94
Thus, the inhibitory effect of the ADAM8 and ADAM10 gene silencing is independent of the
concentration of the chemotactic stimulus MCP-1. These results show that both proteases do
not influence the THP1 migration through a modulation of the concentration-dependent
sensitivity of THP1 cells for MCP-1.
No influence of the gene silencing of ADAM8, 9, 10 or 17 on the MCP-
1 induced Ca2+-transients in THP1 cells
It was shown that the inhibitory effect of gene silencing of ADAM8 and 10 on the
transendothelial migration of THP1 cells was independent of the concentration of the
chemotactic stimulus MCP-1. However, the question remained whether the knockdown of
both proteases effects the signal transduction of THP1 cells in response to MCP-1 in general.
To answer this question, the Ca2+-transients of THP1 cells were analysed in response to
MCP-1.
The Ca2+-transient experiments showed that neither the inhibition of THP1 cells with
GI254023 or GW282406 nor the gene silencing of ADAM8, 9, 10 or 17 resulted in a
significant change in the Ca2+-release in the THP1 cells after the MCP-1 stimulation. These
findings ruled out that the observed migratory inhibitions of inhibitor-treated THP1 cells and
THP1 cells with a gene silencing of ADAM8 and 10 were caused by an alteration in the direct
signal transduction of the MCP-1 receptor CCR2. However, the possibility remains that the
gene silencing of ADAM8 or 10 effects the arrestin-mediated internalization of CCR2 or
interferes with the complex signalling downstream of the Ca2+-transients in which kinases
such as ERK or MAPK are involved195
The adhesion of THP1 cells to VCAM-1 and fibronectin is not altered
by pharmaceutical inhibition of ADAM10 and 17 or by gene silencing
of ADAM8, 9, 10 or 17
The tight adhesion of leukocytes to the endothelial cells in the vasculature is the step in
leukocyte recruitment that directly precedes their diapedesis. Tight adhesion of leukocytes is
chiefly mediated by the interaction of leukocytic integrins LFA-1 (αLβ2 integrin) and VLA-4
(α4β1 integrin) to the endothelial adhesion molecules ICAM-1 and VCAM-1, respectively.
Fibronectin, an important component of the ECM, is bound by the integrin heterodimers α5β1
and VLA-4166. To test whether the pharmaceutical inhibition of ADAM 10 and 17 or the gene

95
silencing of ADAM8, 9, 10 or 17 changes THP1 cell adhesion, adhesion assays under static
conditions were performed using the recombinant substrates VCAM-1, ICAM-1 and
fibronectin.
The adhesion assays showed that neither the pharmaceutical inhibition nor the gene
silencing of the target proteases resulted in changes to the adhesion of THP1 to VCAM-1,
ICAM-1 or fibronectin. Accordingly to a study by Ashida et al.166 THP1 adhered strongly to
VCAM-1 and fibronectin while only a very weak binding was observed for ICAM-1. In the
present thesis, however, it could not be confirmed that the stimulation of THP1 cells with
MCP-1 results in a stronger adhesion of the cells to any of the substrates. The unchanged
adhesion of THP1 cells after MCP-1 stimulation was independent of ADAM inhibition or gene
silencing. Therefore, the results of the adhesion assays indicate that the investigated ADAM
proteases are not involved in modulating the interaction of either VLA-4 to VCAM-1 or that of
α5β1-integrin to fibronectin in THP1 cells.
No differences were observed in the adhesion of the THP1 cells to ICAM-1 in the
experimental setup used in this study and therefore no influence of the investigated
proteases on the activity of LFA-1 (αLβ2 integrin) was found. However, there are
accumulating indications for the shedding of leukocytic β2 integrin in leukocytic migration. It
is quite possible that the chosen experimental setup did not fully reflect the role of LFA-1 in
chemotaxis and transmigration, since it is reported that LFA-1 is only transiently activated
during migration.
Weber et al. showed in their study that β2-integrin is needed for the adhesion of PMA-
stimulated primary monocytes to ICAM-1. In their study, the use of a blocking antibody
against β2-integrin inhibited the in vitro transendothelial migration of the stimulated
monocytes196. The authors of this study found that differential activation kinetics of different
integrin-β2 heterodimers are responsible for the enhanced adhesion of monocytes after SDF-
1 (CXCL12) stimulation. While the SDF-1 stimulation resulted in a sustained activation of
Mac-1 (αMβ2 integrin), Weber et al. reported a transient activation of monocytic LFA-1 (αLβ2
integrin) after SDF-1 stimulation.
There are several reports that indicate a critical role of integrin shedding during the process
of leukocyte recruitment. It was shown that cleavage of the αM integrin of Mac-1 (αMβ2
integrin) by the serin proteases elastase, proteinase-3, and cathepsin G is needed for the
successful detachment of neutrophils during chemotaxis197. β2 integrin shedding has been
observed on infiltrating neutrophils in patients exhibiting a cutaneous inflammatory response
to the blistering agent cantharidin198. A proteomics study which compared the shed proteins

96
of wt macrophages to macrophages expressing constitutively active MMP-9 (matrix
metalloproteinase 9) identified β2 integrin as one of the major molecules shed by the MMP-9
overexpressing macrophages199.
A very recent publication by Elaine Raines’s group reported that β2 integrin shedding was
needed for macrophage efflux after intraperitoneal stimulation with thioglycollate200. The
authors showed that β2 integrin shedding could be inhibited with the broad spectrum zinc-
metalloproteinase inhibitor GM6001. This resulted in a reduced efflux of the peritoneal
macrophages. In comparison, macrophages lacking β2 integirn migrated faster out of the
peritoneal cavity than control macrophages. The same effect was observed when the authors
used an inhibiting antibody against β2 integrin in experiments with wt mice. However, the
authors detected the same levels of soluble β2 integrin in transgenic animals with a complete
genetic deletion of MMP-9 and in transgenic mice with myeloid ADAM10 or hematopoietic
ADAM17 deficiency as in control animals. Thereby they ruled out that any of the three
proteases is responsible for the in vivo β2 integrin shedding of macrophages. They attributed
differences with their previous study to the different in vivo and in vitro situation. While
several enzymes appear to shed the same substrates in vitro there is accumulating evidence
that in vivo shedding is cell- and context specific.
ADAM8 gene silencing affects ECV304 cell migration
To analyse whether the gene silencing of ADAM8 or 10 also affects the migration of other
cells such as epithelial cells, in vitro wound healing assays were performed with lentiviral-
transduced ECV304 cells with gene silencing of ADAM8, 9, 10 or 17. The results of the
wound healing assays showed that only the ADAM8 gene silencing resulted in a significantly
reduced migration of the ECV304 cells. While there was also a reduced migration in one of
two cell lines with ADAM10 gene silencing, the inhibitory effect was not significant.
The findings of the in vitro wound healing assay indicate that ADAM8 could play a general
role in the migration processes of various cells. Reports showing that ADAM8 overexpression
is related with invasiveness and metastasis in cancer back up the finding of the inhibition on
migration after gene silencing of ADAM8122–126. While it seems that ADAM10 is not as
essential as ADAM8 for the motility of the cancer cell line ECV304, it was reported that
ADAM10 contributes to the migration of endothelial cell lines. In the already-mentioned
study by Donners and co-workers, it was demonstrated that ADAM10 inhibition not only

97
resulted in strongly reduced VEGF-R shedding but in a reduced migration of endothelial and
monocytic cells as well158.
It would be interesting to analyse and compare keratinocytic cell lines with gene silencing of
ADAM8, 9, 10 or 17 in the in vitro wound healing assay. A faster wound healing – attributed
to increased keratinocyte motility – was observed in transgeneic mice lacking ADAM9
expression155. It is conceivable that the shRNA knockdown of ADAM9 in keratinocytic cell
lines could lead to a similar effect as observed in the ADAM9-null mice.
4.1. Conclusion
This study shows that ADAM8 and 10 have significant influence on the transendothelial
migration and chemotaxis of the monocytic cell line THP1. Notwithstanding, the precise
molecular mechanism by which the two proteases influence the migration of the monocytic
cell lines could not be identified. It could be excluded that ADAM8 or 10 interfere with the
direct MCP-1 signalling of THP1 and with their adhesion to the adhesion molecules VCAM-1
and fibronectin. The observed migration deficit was independent of the presence or absence
of an endothelial cell layer. Therefore, it seems likely that both proteases interfere with a
process in the THP1 cells themselves and that shedding events such as cleavage of
endothelial adhesion molecules in trans are not responsible for the observed effect. Two
possible mechanisms by which both ADAM proteases could influence the migration of the
THP1 cells could either be the shedding or clustering of adhesion molecules or the shedding
of growth factors which lead to an autokrine stimulation of the cells.
Possible shedding or clustering of adhesion molecules by ADAM8 or
ADAM10
A very recent report showed that β2 integrin is cleaved by a protease inhibited by the broad
spectrum inhibitor GM6001200. The role of integrin heterodimers containing β2 integrin, such
as LFA-1 or Mac-1, in leukocyte chemotaxis and transmigration is widely accepted201,202.
ADAM8 or ADAM10 expressed by THP1 cells could play a crucial role in shedding β2 integrin
that is bound to one of its endothelial substrates, thereby releasing the cell from the
endothelial cells it is attached to (Figure 35). It is conceivable that one of the two proteases
or even both contribute to the disassembly of focal adhesion of migrating cells by integrin
shedding. This would also explain why THP1 cells with a gene silencing of ADAM8 or 10

98
showed migration deficits in the chemotaxis assay in the absence of endothelial cells and
components of the ECM. The reduced shedding of other adhesion molecules such as CD44
and PSGL-1, which are cleaved by ADAM10109,203 and ADAM8133, respectively, could be the
reason for the migratory deficits of THP1 cells with a gene silencing of ADAM10 or 8.
Figure 35: Hypothesis 1: Shedding of integrins as possible contribution of ADAM8 or 10 to the migration of THP1 cells.
Proteolytic cleavage of integrins could facilitate the release of migrating THP1 cells from adhesion molecules on endothelial cells. It is equally conceivable that ADAM8 or 10 could be essential for dissolving focal adhesions of migrating cells. That would explain why the gene silencing of ADAM8 or 10 inhibited the migration of the THP1 cells in the chemotaxis assay in the absence of endothelial cells.
Although Gomez et al. did not find elevated levels of β2 integrin in mice with a myeloid
ADAM10 deletion200, it is possible that ADAM10 is able to cleave the β2 integrin of the THP1
cells in vitro or that ADAM8 is responsible for cleaving β2 integrin. To investigate whether β2
integrin shedding is effected by ADAM8 or ADAM10, the supernatants of ADAM-KD LV-THP1
could be analysed by ELISA or western blotting against β2 integrin. Moreover, the surface
staining of β2 integrin might be analysed on ADAM-KD LV-THP1. Another option would be to
analyse the migration of ADAM8-KD or ADAM10-KD LV-THP1 in the presence of an inhibiting
antibody against β2 integrin.
Due to the prominent role of ADAM proteases in the shedding of various surface molecules,
it is often overlooked that they can interact with integrins via their extracellular disintegrin-

99
domain. It is possible that either ADAM8 or 10 or even both proteases are involved in
forming clusters of integrins on the plasma membrane of adhering THP1 cells. Such clusters
of integrins are essential for the outside-in signalling of integrins and contribute to the
formation of signalosomes at the plasma membrane which are required for the recruitment
of protein tyrosine kinases201,204.
Another possible interaction interface of ADAM8 or 10 with integrins or other adhesion
molecules needed for migration (besides their extracellular disintegrin domain) could be their
cytoplasmic tail domains. Domínguez-Luis and co-workers nicely managed to show that
proteins of the ezrin-radixin-moesin family (ERM proteins) function as adaptor molecules
between ADAM8 and its shedding substrate PSGL-1133. ERM proteins link integral membrane
proteins to the cortical actin cytoskeleton and have a regulatory effect on Rho GTPases205,206.
It can be envisaged that the absence of either protease could result in a reduced recruitment
of adaptor proteins, such as ERM proteins, to the leading edge of the migrating cells with the
consequence of an affected Rho GTPase signalling and changes in the actin cytoskeleton.
Lastly, the interaction of ADAM10 with integrins in membrane microdomains organized by
proteins of the tetraspanin family could provide an explanation for the observed migratory
deficits of THP1 cells with a gene silencing of ADAM10 or 8. These microdomains are thought
to play crucial roles in leukocyte functions such as activation, motility and antigen
presentation207. It has been shown that ADAM10, together with many integrins and other
proteases, is recruited to such membrane microdomains, which themselves are stabilized by
tetraspanins208–210. Interestingly, it was reported that ADAM17, in contrast to ADAM10, is
recruited to membrane microdomains composed of different tetraspanins211,212.
However, the observed inhibitory effect of the ADAM specific inhibitors on the migration of
THP1 cells raises the question of how small molecules can influence this potential cluster-
forming function of ADAMs and whether this is the exclusive mechanism by which ADAM10
contributes to the migration of THP1 cells. Nevertheless, it could be possible that the
inhibitor which binds to ADAM10’s catalytic cleft holds the protease in a conformation state
which inhibits its interaction via its disintegrin domain. In addition, the inactive conformation
of the catalytic domain with the bound inhibitor could possibly interfere with protein
interactions of the cytoplasmic tail. Such a mechanism has been reported for the
extracellular domains of integrins which are involved in both outside-in and inside-out
signalling202,213.

100
A
B
C
Figure 36: Hypothesis 2: Interaction of ADAM8 or 10 with integrins and possible other
adhesion molecules is needed for the formation of high molecular clusters at the
plasmamembrane of migrating THP1 cells.
There are several possibilities as to how ADAM8 or 10 could contribute to the formation of such high molecular clusters. A: The ADAM proteases could bind to integrins with their disintegrin-like domain and thereby facilitate the formation of multi-molecular clusters. B: For ADAM8, it has been shown that it interacts with adhesion molecules via adaptor proteins of the ERM-family. It is possible that such interactions are needed for the efficient migration of THP1 cells. C: Lastly, there is the possibility that ADAM10 or 8 are needed for the stabilization of membrane-microdomains which use tetraspanins as scaffold proteins.

101
To analyse whether ADAM8 or 10 participate in the formation of multi-molecular clusters or
complexes on the plasma membrane, it would be feasible to perform protein complex
immunoprecipitation (Co-IP) with antibodies against ADAM8 and 10. Analysing the protein
content of such complexes with mass spectroscopy could be very helpful to identify potential
binding partners of the ADAM proteins.
Another possibility to analyse further the role of ADAM8 and 10 in the migration of leukocytic
cells could be to monitor migrating THP1 cells with high-resolution live cell microcopy, using
actin tagged to fluorescent proteins to monitor the actin dynamics during migration. This
would enable deciding whether the gene silencing of ADAM8 or 10 affects the actin assembly
at the leading edge, or the formation of podosomes of (trans)-migrating THP1 cells or
whether the cells are unable to resolve their adhesion to the substrate they are migrating on.
It could well be that the proposed clustering function of ADAM8 or 10 is not the only
mechanism by which they contribute to the migration of leukocytic cells but that the
insertion of ADAMs into such multi-protein complexes is essential for their substrate
recognition or to be in proximity to their substrates, respectively. That the interaction
between ADAMs and integrins is a topic worth investigating was shown by a very recent
publication. In this study the authors were able to show that in kidney carcinoma cells, the
binding of β1-integrin to ADAM17 suppresses its G-coupled receptor regulated activity214.
ADAM8 or 10 could be needed for the autokrine stimulation of THP1
cells
ADAM8 or 10 may contribute to the migration of THP1 cells by shedding stimulatory growth
factors which induce a migratory phenotype of the cells by auto- or parakrine stimulation.
Members of the EGF-like growth factor family could be possible shedding substrates of
ADAM10 or 8 which are involved in such a stimulation of THP1 cells. EGF-like growth factors
are expressed as transmembrane proforms and undergo proteolytic cleavage to become
mature soluble factors215. EGF-like growth factors bind to receptors of the ErbB family, which
induces their dimerization and triggers intracellular signalling cascades. ADAM10 is the major
sheddase of EGF and betacellulin and has been implicated in the shedding of HB-EGF96,216.
For ADAM8, it has been shown that it is capable of cleaving TGFα117 and that its
overexpression leads to an increased shedding of neuregulin-1β2217.

102
Figure 37: Hypothesis 3: ADAM8 or 10 contribute to the migration of THP1 cells by shedding ligands of receptors of the ErbB family, leading to an auto- or parakrine
stimulation which promotes a migratory phenotype of the monocytic cells.
To investigate further as to whether the inhibited shedding of ErbB ligands affects THP1 cell
migration, supernatants of THP1 cells with a gene silencing of ADAM8 or 10 could be
analysed for their levels of soluble EGF-like growth factors. The relevance of shed growth
factors could be determined by performing transmigration experiments with ADAM8 or
ADAM10 THP1 cells in the presence of supernatants from wtTHP1 cells or by
supplementation with recombinant growth factors. Furthermore, THP1 cell transmigration
could be performed in the presence of an EGF-receptor inhibitor and compared to cell
migration in the presence of GI254023. Since EGF-R (ErbB1) is the most prominent member
of the ErbB family and binds to many EGF-like factors (EGF, TGFα, amphiregulin, HB-EGF,
epiregulin and betacellulin218), it constitutes the first logical target for such experiments.
Lastly, there is the possibility that Notch cleavage by ADAM10 and its signalling could be
responsible for promoting a migratory phenotype in THP1 cells. It has been shown that
Notch shedding by ADAM10 is essential for lymphoid development. However, there is still
controversy regarding the influence of Notch signalling in the development and
differentiation of myeloid cells109,113. However, the outcome of the migration experiments in
presence of the ADAM inhibitors argues against this hypothesis. Since Notch signalling
mainly effects the transcription of its target genes, it would take several hours until the
inhibition of ADAM10 would show its effect on Notch signalling. In contrast, the inhibitors
induced a strong inhibition of migration of the THP1 cells within three hours.

103
It is possible that ADAM8 and ADAM10 influence the migration of the THP1 cells via the
same mechanism but it is also possible that both proteases act on the migration of THP1 via
completely different mechanisms. Moreover, ADAM8 or ADAM10 could affect migration of the
monocytic cells via more than one of the above-discussed molecular mechanisms and the
combined effect of several mechanisms could then lead to the observed migratory deficits.
In addition to the above-suggested in vitro experiments, the analysis and comparison of
leukocyte migration in transgenic mice with specific deletion of ADAM10 or 17 could be very
helpful to elucidate ADAM10’s role in leukocyte migration. While several studies have
analysed the in vivo recruitment of ADAM17-/- leukocytes61–63,177, there are still no published
studies which look into the recruitment of leukocytes in transgenic mice with a leukocyte-
specific deletion of ADAM10. Fortunately, conditional transgenic mice with a deletion of
ADAM10 in all myeloid cells are about to become available in our research group.
Additionally, mice which have a leukocyte specific knockout of ADAM17 are currently being
bred in our laboratory. Both transgenic mice strains are viable and it will be interesting to
compare the in vivo migration of ADAM10-/- to ADAM17-/- leukocytes. Additional insight could
be gained by including ADAM8-/- mice in this study.

104
5. Summary
Proteases of the ADAM family are involved in the proteolytic shedding of various cell surface
molecules. Thereby, they fulfil essential functions in embryogenesis, development, neuro-
protection and cancer development. ADAM proteases also participate in all stages of
inflammation, starting from early-response cytokine release and leukocyte recruitment to the
process of tissue repair and damaged tissue revascularisation.
The transendothelial migration of leukocytes from the blood into the inflamed tissue is an
important hallmark of inflammatory responses to infections or trauma. This migratory
process is dependent on well-orchestrated responses of both endothelial and leukocytic cells.
Endothelial ADAM10 and 17 have been shown to regulate endothelial permeability and
thereby leukocyte transendothelial migration in inflammatory settings. In vivo studies
demonstrated the importance of leukocytic-expressed ADAM8 and ADAM17 in the
recruitment of leukocytes. While ADAM10 is important in the development of lymphoid cells,
its role on leukocytes during transendothelial migration has yet to be fully elucidated.
Gene expression analysis of ADAM8, 9, 10 and 17 in several cell lines revealed distinct
expression profiles of the four proteases in each of the examined cell lines. Due its high
expression levels of ADAM8, 10 and 17 in the monocytic cell line THP1 it was decided to use
this cell line to investigate the influence of the four ADAMs in the in vitro migration of
leukocytes. In the present study the directed migration of THP1 cells to the chemotactic
stimulus of the chemokine MCP-1 was analysed in the presence of endothelial cells (in vitro
transendothelial migration) and in the absence of endothelial cells (in vitro chemotaxis).
The use of pharmaceutical ADAM inhibitors in in vitro transendothelial migration experiments
revealed that transendothelial migration of THP1 cells was inhibited in the presence of an
ADAM10 specific inhibitor. The same effect of the ADAM10 inhibitor was also observed the
for the directed chemotaxis in the absence of potential endothelial substrates of ADAM10.
The combined pharmaceutical inhibition of both ADAM10 and ADAM17 did not further
suppress leukocyte migration in either transendothelial migration or chemotaxis. This
indicates that ADAM17 is not as important as ADAM10 in the migration of THP1 cells.
To confirm these findings and further analyse the responsible mechanism, a lentiviral shRNA
system for the transcriptional inhibition of ADAM8, 9, 10 and 17 was established. The
knockdown of each protease was confirmed by flow cytometry and/or RT-PCR, respectively.
The comparison of THP1 cells with a gene silencing of ADAM8, 9, 10 or 17 in
transendothelial migration and chemotaxis experiments revealed that ADAM8 and ADAM10

105
are critically involved in THP1 cell migration. By contrast, ADAM9 expression did not seem to
be required and ADAM17 was of minor importance for the migration of THP1 cells.
Subsequent experiments, which were performed to investigate a potential effect of ADAM8
and ADAM10 on signal transduction, showed that the sensitivity of THP1 cells towards the
chemotactic stimulus MCP-1 was unaffected by the gene silencing of the investigated ADAM
proteases. The analysis of the THP1 calcium response revealed that neither the
pharmaceutical inhibition of ADAM10 and 17 nor the gene silencing of ADAM8, 9, 10 or 17
affected THP1 calcium transients after stimulation with MCP-1. Adhesion experiments were
performed to analyse the adhesion of the monocytic cells under pharmaceutical inhibition or
the gene silencing of the investigated proteases. In leukocyte recruitment, the adhesion of
leukocytes directly precedes the transendothelial migration, and so an affect of ADAM8 or
ADAM10 in this process could have explained their role during migration. However, the
adhesion of THP1 cells to the recombinant integrin ligands VCAM-1, ICAM-1 and fibronection
was not influenced by the pharmaceutical inhibition or the gene silencing of the investigated
proteases.
Since neither the direct calcium signal in response to MCP-1 nor the adhesion of THP1 cells
were affected by ADAM8 or ADAM10 gene silencing or by ADAM pharmaceutical inhibition, it
appeared that both proteases are involved in a more general mechanism affecting cell
migration. Indeed, ADAM8 gene silencing in the epithelial cancer cell line ECV304 resulted in
a reduced migration of the cells in an in vitro wound-healing assay. Although ADAM10 knock-
down resulted in a reduction of cell migration, the observed effect was not significant.
This is the first study to analyse and directly compare the role of the four proteases ADAM8,
9, 10 and 17 in the migration of leukocytic cells. It shows that ADAM8 and ADAM10 are
crucial for in vitro transendothelial migration and chemotaxis of the monocytic cell line THP1.
Furthermore, ADAM8 is critically involved in the migration of adherent epithelial cells in vitro.
This study has identified the previously unknown importance of ADAM8 and ADAM10 in cell
migration and therefore provides the basis for further analysis of the molecular mechanism
by which ADAM8 and ADAM10 contribute to leukocyte migration. In-depth investigations are
proposed, addressing the possibility that ADAM10 and ADAM8 directly interact and may also
shed adhesion molecules required for the organization of the cytoskeleton during cell
migration. These studies should also investigate the shedding of EGF-like growth factors by
ADAM8 or ADAM10 which could promote a migratory phenotype of the cells via autokrine
stimulation.

106
6. Literature
1. Scheller, J., Chalaris, A., Garbers, C. & Rose-John, S. ADAM17: a molecular switch to control inflammation and tissue regeneration. Trends in immunology 32, 380-7 (2011).
2. Pruessmeyer, J. & Ludwig, A. The good, the bad and the ugly substrates for ADAM10 and ADAM17 in brain pathology, inflammation and cancer. Seminars in cell & developmental biology 20, 164-74 (2009).
3. Dreymueller, D., Pruessmeyer, J., Groth, E. & Ludwig, A. The role of ADAM-mediated shedding in vascular biology. European journal of cell biology (2011).doi:10.1016/j.ejcb.2011.09.003
4. Zarbock, A. & Rossaint, J. Regulating inflammation: ADAM8--a new player in the game. European journal of immunology 41, 3419-22 (2011).
5. Black, R.A. et al. A metalloproteinase disintegrin that releases tumour-necrosis factor-alpha from cells. Nature 385, 729-33 (1997).
6. Murdoch, C. & Finn, A. Chemokine receptors and their role in inflammation and infectious diseases. Blood 95, 3032-43 (2000).
7. Springer, T.A. Traffic signals for lymphocyte recirculation and leukocyte emigration: The multistep paradigm. Cell 76, 301-314 (1994).
8. Baggiolini, M., Walz, A. & Kunkel, S.L. Neutrophil-activating peptide-1/interleukin 8, a novel cytokine that activates neutrophils. The Journal of clinical investigation 84, 1045-9 (1989).
9. Leonard, E.J. & Yoshimura, T. Human monocyte chemoattractant protein-1 (MCP-1). Immunology today 11, 97-101 (1990).
10. Charo, I.F. & Peters, W. Chemokine receptor 2 (CCR2) in atherosclerosis, infectious diseases, and regulation of T-cell polarization. Microcirculation (New York, N.Y. : 1994) 10, 259-64 (2003).
11. Zernecke, A. & Weber, C. Inflammatory mediators in atherosclerotic vascular disease. Basic research in cardiology 100, 93-101 (2005).
12. Hundhausen, C. et al. Regulated shedding of transmembrane chemokines by the disintegrin and metalloproteinase 10 facilitates detachment of adherent leukocytes. Journal of immunology (Baltimore, Md. : 1950) 178, 8064-72 (2007).
13. Hundhausen, C. et al. The disintegrin-like metalloproteinase ADAM10 is involved in constitutive cleavage of CX3CL1 (fractalkine) and regulates CX3CL1-mediated cell-cell adhesion. Blood 102, 1186-95 (2003).
14. Koenen, R.R. et al. Regulated release and functional modulation of junctional adhesion molecule A by disintegrin metalloproteinases. Blood 113, 4799-809 (2009).

107
15. Schulz, B. et al. ADAM10 regulates endothelial permeability and T-Cell transmigration by proteolysis of vascular endothelial cadherin. Circulation research 102, 1192-201 (2008).
16. Inoshima, I. et al. A Staphylococcus aureus pore-forming toxin subverts the activity of ADAM10 to cause lethal infection in mice. Nature medicine 17, 1310-4 (2011).
17. Li, Q., Park, P.W., Wilson, C.L. & Parks, W.C. Matrilysin shedding of syndecan-1 regulates chemokine mobilization and transepithelial efflux of neutrophils in acute lung injury. Cell 111, 635-46 (2002).
18. Manon-Jensen, T., Itoh, Y. & Couchman, J.R. Proteoglycans in health and disease: the multiple roles of syndecan shedding. The FEBS journal 277, 3876-89 (2010).
19. Charnaux, N. et al. RANTES (CCL5) induces a CCR5-dependent accelerated shedding of syndecan-1 (CD138) and syndecan-4 from HeLa cells and forms complexes with the shed ectodomains of these proteoglycans as well as with those of CD44. Glycobiology 15, 119-30 (2005).
20. Charnaux, N. et al. Syndecan-4 is a signaling molecule for stromal cell-derived factor-1 (SDF-1)/ CXCL12. The FEBS journal 272, 1937-51 (2005).
21. Pruessmeyer, J. et al. A disintegrin and metalloproteinase 17 (ADAM17) mediates inflammation-induced shedding of syndecan-1 and -4 by lung epithelial cells. The Journal of biological chemistry 285, 555-64 (2010).
22. Muller, W.A. Mechanisms of leukocyte transendothelial migration. Annual review of pathology 6, 323-44 (2011).
23. Engelhardt, B. & Wolburg, H. Mini-review: Transendothelial migration of leukocytes: through the front door or around the side of the house? European journal of immunology 34, 2955-63 (2004).
24. Carman, C.V. et al. Transcellular diapedesis is initiated by invasive podosomes. Immunity 26, 784-97 (2007).
25. Barreiro, O. et al. Dynamic interaction of VCAM-1 and ICAM-1 with moesin and ezrin in a novel endothelial docking structure for adherent leukocytes. The Journal of cell biology 157, 1233-45 (2002).
26. Carman, C.V. & Springer, T.A. A transmigratory cup in leukocyte diapedesis both through individual vascular endothelial cells and between them. The Journal of cell biology 167, 377-88 (2004).
27. Del Maschio, A. et al. Leukocyte recruitment in the cerebrospinal fluid of mice with experimental meningitis is inhibited by an antibody to junctional adhesion molecule (JAM). The Journal of experimental medicine 190, 1351-6 (1999).
28. Rawlings, N.D. & Barrett, A.J. Evolutionary families of metallopeptidases. Methods in enzymology 248, 183-228 (1995).
108
29. Stöcker, W. & Bode, W. Structural features of a superfamily of zinc-endopeptidases: the metzincins. Current opinion in structural biology 5, 383-90 (1995).
30. Gomis-Rüth, F.X. Catalytic domain architecture of metzincin metalloproteases. The Journal of biological chemistry 284, 15353-7 (2009).
31. Bode, W., Gomis-Rüth, F.X. & Stöckler, W. Astacins, serralysins, snake venom and matrix metalloproteinases exhibit identical zinc-binding environments (HEXXHXXGXXH and Met-turn) and topologies and should be grouped into a common family, the “metzincins”. FEBS letters 331, 134-40 (1993).
32. Murphy, G. The ADAMs: signalling scissors in the tumour microenvironment. Nature reviews. Cancer 8, 929-41 (2008).
33. van Goor, H., Melenhorst, W.B.W.H., Turner, A.J. & Holgate, S.T. Adamalysins in biology and disease. The Journal of pathology 219, 277-86 (2009).
34. Kuno, K. et al. Molecular cloning of a gene encoding a new type of metalloproteinase-disintegrin family protein with thrombospondin motifs as an inflammation associated gene. The Journal of biological chemistry 272, 556-62 (1997).
35. Blobel, C.P. et al. A potential fusion peptide and an integrin ligand domain in a protein active in sperm-egg fusion. Nature 356, 248-52 (1992).
36. Wolfsberg, T.G. et al. The precursor region of a protein active in sperm-egg fusion contains a metalloprotease and a disintegrin domain: structural, functional, and evolutionary implications. Proceedings of the National Academy of Sciences of the United States of America 90, 10783-7 (1993).
37. Duffy, M.J., McKiernan, E., O’Donovan, N. & McGowan, P.M. Role of ADAMs in cancer formation and progression. Clinical cancer research : an official journal of the American Association for Cancer Research 15, 1140-4 (2009).
38. White, J.M. ADAMs: modulators of cell-cell and cell-matrix interactions. Current opinion in cell biology 15, 598-606 (2003).
39. Anders, A., Gilbert, S., Garten, W., Postina, R. & Fahrenholz, F. Regulation of the alpha-secretase ADAM10 by its prodomain and proprotein convertases. FASEB journal : official publication of the Federation of American Societies for Experimental Biology 15, 1837-9 (2001).
40. Buckley, C.A. et al. Amino-terminal TACE prodomain attenuates TNFR2 cleavage independently of the cysteine switch. American journal of physiology. Lung cellular and molecular physiology 288, L1132-8 (2005).
41. Wewer, U.M. et al. ADAM12 is a four-leafed clover: the excised prodomain remains bound to the mature enzyme. The Journal of biological chemistry 281, 9418-22 (2006).
42. Iba, K. et al. The cysteine-rich domain of human ADAM 12 supports cell adhesion through syndecans and triggers signaling events that lead to beta1 integrin-dependent cell spreading. The Journal of cell biology 149, 1143-56 (2000).

109
43. Flannery, C.R. et al. Autocatalytic cleavage of ADAMTS-4 (Aggrecanase-1) reveals multiple glycosaminoglycan-binding sites. The Journal of biological chemistry 277, 42775-80 (2002).
44. Gaultier, A., Cousin, H., Darribère, T. & Alfandari, D. ADAM13 disintegrin and cysteine-rich domains bind to the second heparin-binding domain of fibronectin. The Journal of biological chemistry 277, 23336-44 (2002).
45. Smith, K.M. et al. The cysteine-rich domain regulates ADAM protease function in vivo. The Journal of cell biology 159, 893-902 (2002).
46. Cousin, H., Gaultier, A., Bleux, C., Darribère, T. & Alfandari, D. PACSIN2 is a regulator of the metalloprotease/disintegrin ADAM13. Developmental biology 227, 197-210 (2000).
47. Serrano, S.M.T., Jia, L.-G., Wang, D., Shannon, J.D. & Fox, J.W. Function of the cysteine-rich domain of the haemorrhagic metalloproteinase atrolysin A: targeting adhesion proteins collagen I and von Willebrand factor. The Biochemical journal 391, 69-76 (2005).
48. Seals, D.F. & Courtneidge, S.A. The ADAMs family of metalloproteases: multidomain proteins with multiple functions. Genes & development 17, 7-30 (2003).
49. Lu, Q., Clemetson, J.M. & Clemetson, K.J. Snake venoms and hemostasis. Journal of thrombosis and haemostasis : JTH 3, 1791-9 (2005).
50. Nath, D. et al. Interaction of metargidin (ADAM-15) with alphavbeta3 and alpha5beta1 integrins on different haemopoietic cells. Journal of cell science 112 ( Pt 4, 579-87 (1999).
51. Reiss, K., Ludwig, A. & Saftig, P. Breaking up the tie: disintegrin-like metalloproteinases as regulators of cell migration in inflammation and invasion. Pharmacology & therapeutics 111, 985-1006 (2006).
52. Eto, K. et al. Functional classification of ADAMs based on a conserved motif for binding to integrin alpha 9beta 1: implications for sperm-egg binding and other cell interactions. The Journal of biological chemistry 277, 17804-10 (2002).
53. Arribas, J., Bech-Serra, J.J. & Santiago-Josefat, B. ADAMs, cell migration and cancer. Cancer metastasis reviews 25, 57-68 (2006).
54. Huang, J., Bridges, L.C. & White, J.M. Selective modulation of integrin-mediated cell migration by distinct ADAM family members. Molecular biology of the cell 16, 4982-91 (2005).
55. Mazzocca, A. et al. A secreted form of ADAM9 promotes carcinoma invasion through tumour-stromal interactions. Cancer research 65, 4728-38 (2005).
56. Nath, D. et al. Meltrin gamma(ADAM-9) mediates cellular adhesion through alpha(6)beta(1 )integrin, leading to a marked induction of fibroblast cell motility. Journal of cell science 113 ( Pt 1, 2319-28 (2000).
110
57. Soond, S.M., Everson, B., Riches, D.W.H. & Murphy, G. ERK-mediated phosphorylation of Thr735 in TNFalpha-converting enzyme and its potential role in TACE protein trafficking. Journal of cell science 118, 2371-80 (2005).
58. Werb, Z. CELL BIOLOGY:Enhanced: A Cellular Striptease Act. Science 282, 1279-1280 (1998).
59. Pruessmeyer, J. & Ludwig, A. The good, the bad and the ugly substrates for ADAM10 and ADAM17 in brain pathology, inflammation and cancer. Seminars in cell & developmental biology 20, 164-74 (2009).
60. Peschon, J.J. et al. An essential role for ectodomain shedding in mammalian development. Science (New York, N.Y.) 282, 1281-4 (1998).
61. Horiuchi, K. et al. Cutting edge: TNF-alpha-converting enzyme (TACE/ADAM17) inactivation in mouse myeloid cells prevents lethality from endotoxin shock. Journal of immunology (Baltimore, Md. : 1950) 179, 2686-9 (2007).
62. Long, C., Wang, Y., Herrera, A.H., Horiuchi, K. & Walcheck, B. In vivo role of leukocyte ADAM17 in the inflammatory and host responses during E. coli-mediated peritonitis. Journal of leukocyte biology 87, 1097-101 (2010).
63. Arndt, P.G. et al. Leukocyte ADAM17 regulates acute pulmonary inflammation. PloS one 6, e19938 (2011).
64. Bell, J.H., Herrera, A.H., Li, Y. & Walcheck, B. Role of ADAM17 in the ectodomain shedding of TNF-alpha and its receptors by neutrophils and macrophages. Journal of leukocyte biology 82, 173-6 (2007).
65. Li, Y., Brazzell, J., Herrera, A. & Walcheck, B. ADAM17 deficiency by mature neutrophils has differential effects on L-selectin shedding. Blood 108, 2275-9 (2006).
66. Dreymueller, D. et al. Lung endothelial ADAM17 regulates the acute inflammatory response to lipopolysaccharide. EMBO Molecular Medicine Epub ahead, (2012).
67. Ludwig, A. et al. Metalloproteinase inhibitors for the disintegrin-like metalloproteinases ADAM10 and ADAM17 that differentially block constitutive and phorbol ester-inducible shedding of cell surface molecules. Combinatorial chemistry & high throughput screening 8, 161-71 (2005).
68. Garton, K.J. et al. Tumour necrosis factor-alpha-converting enzyme (ADAM17) mediates the cleavage and shedding of fractalkine (CX3CL1). The Journal of biological chemistry 276, 37993-8001 (2001).
69. Horiuchi, K. et al. Ectodomain shedding of FLT3 ligand is mediated by TNF-alpha converting enzyme. Journal of immunology (Baltimore, Md. : 1950) 182, 7408-14 (2009).
70. Weskamp, G. et al. Pathological neovascularization is reduced by inactivation of ADAM17 in endothelial cells but not in pericytes. Circulation research 106, 932-40 (2010).

111
71. Reddy, P. et al. Functional analysis of the domain structure of tumour necrosis factor-alpha converting enzyme. The Journal of biological chemistry 275, 14608-14 (2000).
72. Althoff, K., Reddy, P., Voltz, N., Rose-John, S. & Müllberg, J. Shedding of interleukin-6 receptor and tumour necrosis factor alpha. Contribution of the stalk sequence to the cleavage pattern of transmembrane proteins. European journal of biochemistry / FEBS 267, 2624-31 (2000).
73. Tsakadze, N.L. et al. Tumour necrosis factor-alpha-converting enzyme (TACE/ADAM-17) mediates the ectodomain cleavage of intercellular adhesion molecule-1 (ICAM-1). The Journal of biological chemistry 281, 3157-64 (2006).
74. Garton, K.J. et al. Stimulated shedding of vascular cell adhesion molecule 1 (VCAM-1) is mediated by tumour necrosis factor-alpha-converting enzyme (ADAM 17). The Journal of biological chemistry 278, 37459-64 (2003).
75. Stoeck, A. et al. A role for exosomes in the constitutive and stimulus-induced ectodomain cleavage of L1 and CD44. The Biochemical journal 393, 609-18 (2006).
76. Xu, P. & Derynck, R. Direct activation of TACE-mediated ectodomain shedding by p38 MAP kinase regulates EGF receptor-dependent cell proliferation. Molecular cell 37, 551-66 (2010).
77. Swendeman, S. et al. VEGF-A stimulates ADAM17-dependent shedding of VEGFR2 and crosstalk between VEGFR2 and ERK signaling. Circulation research 103, 916-8 (2008).
78. Lemjabbar-Alaoui, H., Sidhu, S.S., Mengistab, A., Gallup, M. & Basbaum, C. TACE/ADAM-17 phosphorylation by PKC-epsilon mediates premalignant changes in tobacco smoke-exposed lung cells. PloS one 6, e17489 (2011).
79. Göoz, M., Göoz, P., Luttrell, L.M. & Raymond, J.R. 5-HT2A receptor induces ERK phosphorylation and proliferation through ADAM-17 tumour necrosis factor-alpha-converting enzyme (TACE) activation and heparin-bound epidermal growth factor-like growth factor (HB-EGF) shedding in mesangial cells. The Journal of biological chemistry 281, 21004-12 (2006).
80. Amour, A. et al. TNF-alpha converting enzyme (TACE) is inhibited by TIMP-3. FEBS letters 435, 39-44 (1998).
81. Yang, P., Baker, K.A. & Hagg, T. The ADAMs family: coordinators of nervous system development, plasticity and repair. Progress in neurobiology 79, 73-94 (2006).
82. Lammich, S. et al. Constitutive and regulated alpha-secretase cleavage of Alzheimer’s amyloid precursor protein by a disintegrin metalloprotease. Proceedings of the National Academy of Sciences of the United States of America 96, 3922-7 (1999).
83. Duffy, M.J. et al. The ADAMs family of proteases: new biomarkers and therapeutic targets for cancer? Clinical proteomics 8, 9 (2011).
84. Buxbaum, J.D. et al. Evidence that tumour necrosis factor alpha converting enzyme is involved in regulated alpha-secretase cleavage of the Alzheimer amyloid protein precursor. The Journal of biological chemistry 273, 27765-7 (1998).

112
85. Matthews, V. et al. Cellular cholesterol depletion triggers shedding of the human interleukin-6 receptor by ADAM10 and ADAM17 (TACE). The Journal of biological chemistry 278, 38829-39 (2003).
86. Hikita, A. et al. Involvement of a disintegrin and metalloproteinase 10 and 17 in shedding of tumour necrosis factor-alpha. Biochemistry and cell biology = Biochimie et biologie cellulaire 87, 581-93 (2009).
87. Hartmann, D. et al. The disintegrin/metalloprotease ADAM 10 is essential for Notch signalling but not for alpha-secretase activity in fibroblasts. Human molecular genetics 11, 2615-24 (2002).
88. Krebs, L.T. et al. Notch signaling is essential for vascular morphogenesis in mice. Genes & development 14, 1343-52 (2000).
89. Klein, T. & Bischoff, R. Active metalloproteases of the A Disintegrin and Metalloprotease (ADAM) family: biological function and structure. Journal of proteome research 10, 17-33 (2011).
90. Sotillos, S., Roch, F. & Campuzano, S. The metalloprotease-disintegrin Kuzbanian participates in Notch activation during growth and patterning of Drosophila imaginal discs. Development (Cambridge, England) 124, 4769-79 (1997).
91. Hattori, M., Osterfield, M. & Flanagan, J.G. Regulated cleavage of a contact-mediated axon repellent. Science (New York, N.Y.) 289, 1360-5 (2000).
92. Janes, P.W. et al. Adam meets Eph: an ADAM substrate recognition module acts as a molecular switch for ephrin cleavage in trans. Cell 123, 291-304 (2005).
93. Moss, M.L., Stoeck, A., Yan, W. & Dempsey, P.J. ADAM10 as a target for anti-cancer therapy. Current pharmaceutical biotechnology 9, 2-8 (2008).
94. Murphy, G. The ADAMs: signalling scissors in the tumour microenvironment. Nature reviews. Cancer 8, 929-41 (2008).
95. Liu, P.C.C. et al. Identification of ADAM10 as a major source of HER2 ectodomain sheddase activity in HER2 overexpressing breast cancer cells. Cancer biology & therapy 5, 657-64 (2006).
96. Blobel, C.P., Carpenter, G. & Freeman, M. The role of protease activity in ErbB biology. Experimental cell research 315, 671-82 (2009).
97. Sahin, U. et al. Distinct roles for ADAM10 and ADAM17 in ectodomain shedding of six EGFR ligands. The Journal of cell biology 164, 769-79 (2004).
98. Zhou, B.-B.S. et al. Targeting ADAM-mediated ligand cleavage to inhibit HER3 and EGFR pathways in non-small cell lung cancer. Cancer cell 10, 39-50 (2006).
99. Sanderson, M.P. et al. ADAM10 mediates ectodomain shedding of the betacellulin precursor activated by p-aminophenylmercuric acetate and extracellular calcium influx. The Journal of biological chemistry 280, 1826-37 (2005).

113
100. Gavert, N. et al. Expression of L1-CAM and ADAM10 in human colon cancer cells induces metastasis. Cancer research 67, 7703-12 (2007).
101. Nagano, O. et al. Cell-matrix interaction via CD44 is independently regulated by different metalloproteinases activated in response to extracellular Ca(2+) influx and PKC activation. The Journal of cell biology 165, 893-902 (2004).
102. Esselens, C.W. et al. Metastasis-associated C4.4A, a GPI-anchored protein cleaved by ADAM10 and ADAM17. Biological Chemistry 389, 1075-1084 (2008).
103. Maretzky, T. et al. ADAM10 mediates E-cadherin shedding and regulates epithelial cell-cell adhesion, migration, and beta-catenin translocation. Proceedings of the National Academy of Sciences of the United States of America 102, 9182-7 (2005).
104. Reiss, K. et al. ADAM10 cleavage of N-cadherin and regulation of cell-cell adhesion and beta-catenin nuclear signalling. The EMBO journal 24, 742-52 (2005).
105. Hundhausen, C. et al. The disintegrin-like metalloproteinase ADAM10 is involved in constitutive cleavage of CX3CL1 (fractalkine) and regulates CX3CL1-mediated cell-cell adhesion. Blood 102, 1186-95 (2003).
106. Abel, S. et al. The transmembrane CXC-chemokine ligand 16 is induced by IFN-gamma and TNF-alpha and shed by the activity of the disintegrin-like metalloproteinase ADAM10. Journal of immunology (Baltimore, Md. : 1950) 172, 6362-72 (2004).
107. Schwarz, N. et al. Requirements for leukocyte transmigration via the transmembrane chemokine CX3CL1. Cellular and molecular life sciences : CMLS 67, 4233-48 (2010).
108. Schulte, M. et al. ADAM10 regulates FasL cell surface expression and modulates FasL-induced cytotoxicity and activation-induced cell death. Cell death and differentiation 14, 1040-9 (2007).
109. Gibb, D.R., Saleem, S.J., Chaimowitz, N.S., Mathews, J. & Conrad, D.H. The emergence of ADAM10 as a regulator of lymphocyte development and autoimmunity. Molecular immunology 48, 1319-27 (2011).
110. Conrad, D.H., Ford, J.W., Sturgill, J.L. & Gibb, D.R. CD23: an overlooked regulator of allergic disease. Current allergy and asthma reports 7, 331-7 (2007).
111. Lemieux, G.A. et al. The low affinity IgE receptor (CD23) is cleaved by the metalloproteinase ADAM10. The Journal of biological chemistry 282, 14836-44 (2007).
112. Gibb, D.R. et al. ADAM10 is essential for Notch2-dependent marginal zone B cell development and CD23 cleavage in vivo. The Journal of experimental medicine 207, 623-35 (2010).
113. Chaimowitz, N.S. et al. A Disintegrin and Metalloproteinase 10 Regulates Antibody Production and Maintenance of Lymphoid Architecture. Journal of immunology (Baltimore, Md. : 1950) 187, 5114-22 (2011).

114
114. Moss, M.L. et al. The ADAM10 prodomain is a specific inhibitor of ADAM10 proteolytic activity and inhibits cellular shedding events. The Journal of biological chemistry 282, 35712-21 (2007).
115. Amour, A. et al. The in vitro activity of ADAM-10 is inhibited by TIMP-1 and TIMP-3. FEBS letters 473, 275-9 (2000).
116. Reiss, K., Cornelsen, I., Husmann, M., Gimpl, G. & Bhakdi, S. Unsaturated Fatty Acids Drive Disintegrin and Metalloproteinase (ADAM)-dependent Cell Adhesion, Proliferation, and Migration by Modulating Membrane Fluidity. The Journal of biological chemistry 286, 26931-42 (2011).
117. Naus, S. et al. Identification of candidate substrates for ectodomain shedding by the metalloprotease-disintegrin ADAM8. Biological chemistry 387, 337-46 (2006).
118. Bartsch, J.W. et al. Tumour necrosis factor-alpha (TNF-alpha) regulates shedding of TNF-alpha receptor 1 by the metalloprotease-disintegrin ADAM8: evidence for a protease-regulated feedback loop in neuroprotection. The Journal of neuroscience : the official journal of the Society for Neuroscience 30, 12210-8 (2010).
119. Gómez-Gaviro, M. et al. Expression and regulation of the metalloproteinase ADAM-8 during human neutrophil pathophysiological activation and its catalytic activity on L-selectin shedding. Journal of immunology (Baltimore, Md. : 1950) 178, 8053-63 (2007).
120. Matsuno, O. et al. Role of ADAM8 in experimental asthma. Immunology letters 102, 67-73 (2006).
121. Kelly, K. et al. Metalloprotease-disintegrin ADAM8: expression analysis and targeted deletion in mice. Developmental dynamics : an official publication of the American Association of Anatomists 232, 221-31 (2005).
122. Valkovskaya, N. et al. ADAM8 expression is associated with increased invasiveness and reduced patient survival in pancreatic cancer. Journal of cellular and molecular medicine 11, 1162-74 (2007).
123. Wildeboer, D., Naus, S., Amy Sang, Q.-X., Bartsch, J.W. & Pagenstecher, A. Metalloproteinase disintegrins ADAM8 and ADAM19 are highly regulated in human primary brain tumours and their expression levels and activities are associated with invasiveness. Journal of neuropathology and experimental neurology 65, 516-27 (2006).
124. Hernández, I., Moreno, J.L., Zandueta, C., Montuenga, L. & Lecanda, F. Novel alternatively spliced ADAM8 isoforms contribute to the aggressive bone metastatic phenotype of lung cancer. Oncogene 29, 3758-69 (2010).
125. Fritzsche, F.R. et al. ADAM8 expression in prostate cancer is associated with parameters of unfavorable prognosis. Virchows Archiv : an international journal of pathology 449, 628-36 (2006).
126. Roemer, A. et al. Increased mRNA expression of ADAMs in renal cell carcinoma and their association with clinical outcome. Oncology reports 11, 529-36 (2004).

115
127. Ainola, M. et al. Involvement of a disintegrin and a metalloproteinase 8 (ADAM8) in osteoclastogenesis and pathological bone destruction. Annals of the rheumatic diseases 68, 427-34 (2009).
128. Zack, M.D. et al. Reduced incidence and severity of experimental autoimmune arthritis in mice expressing catalytically inactive A disintegrin and metalloproteinase 8 (ADAM8). Clinical and experimental immunology 158, 246-56 (2009).
129. Chiba, Y. et al. Upregulation of ADAM8 in the airways of mice with allergic bronchial asthma. Lung 187, 179-85
130. King, N.E. et al. Expression and regulation of a disintegrin and metalloproteinase (ADAM) 8 in experimental asthma. American journal of respiratory cell and molecular biology 31, 257-65 (2004).
131. Naus, S. et al. The metalloprotease-disintegrin ADAM8 is essential for the development of experimental asthma. American journal of respiratory and critical care medicine 181, 1318-28 (2010).
132. Gossens, K., Naus, S., Holländer, G.A. & Ziltener, H.J. Deficiency of the metalloproteinase-disintegrin ADAM8 is associated with thymic hyper-cellularity. PloS one 5, e12766 (2010).
133. Domínguez-Luis, M. et al. The metalloprotease ADAM8 is associated with and regulates the function of the adhesion receptor PSGL-1 through ERM proteins. European journal of immunology 41, 3436-42 (2011).
134. Hall, T. et al. Autoactivation of human ADAM8: a novel pre-processing step is required for catalytic activity. Bioscience reports 29, 217-28 (2009).
135. Amour, A. et al. The enzymatic activity of ADAM8 and ADAM9 is not regulated by TIMPs. FEBS letters 524, 154-8 (2002).
136. Weskamp, G. et al. Mice lacking the metalloprotease-disintegrin MDC9 (ADAM9) have no evident major abnormalities during development or adult life. Molecular and cellular biology 22, 1537-44 (2002).
137. Parry, D.A. et al. Loss of the metalloprotease ADAM9 leads to cone-rod dystrophy in humans and retinal degeneration in mice. American journal of human genetics 84, 683-91 (2009).
138. Asai, M. et al. Putative function of ADAM9, ADAM10, and ADAM17 as APP alpha-secretase. Biochemical and biophysical research communications 301, 231-5 (2003).
139. Izumi, Y. et al. A metalloprotease-disintegrin, MDC9/meltrin-gamma/ADAM9 and PKCdelta are involved in TPA-induced ectodomain shedding of membrane-anchored heparin-binding EGF-like growth factor. The EMBO journal 17, 7260-72 (1998).
140. Tousseyn, T. et al. ADAM10, the rate-limiting protease of regulated intramembrane proteolysis of Notch and other proteins, is processed by ADAMS-9, ADAMS-15, and the gamma-secretase. The Journal of biological chemistry 284, 11738-47 (2009).

116
141. Parkin, E. & Harris, B. A disintegrin and metalloproteinase (ADAM)-mediated ectodomain shedding of ADAM10. Journal of neurochemistry 108, 1464-79 (2009).
142. Roghani, M. et al. Metalloprotease-disintegrin MDC9: intracellular maturation and catalytic activity. The Journal of biological chemistry 274, 3531-40 (1999).
143. Dyczynska, E. et al. Proteolytic processing of delta-like 1 by ADAM proteases. The Journal of biological chemistry 282, 436-44 (2007).
144. Guaiquil, V. et al. ADAM9 is involved in pathological retinal neovascularization. Molecular and cellular biology 29, 2694-703 (2009).
145. Zhou, M., Graham, R., Russell, G. & Croucher, P.I. MDC-9 (ADAM-9/Meltrin gamma) functions as an adhesion molecule by binding the alpha(v)beta(5) integrin. Biochemical and biophysical research communications 280, 574-80 (2001).
146. Mahimkar, R.M., Baricos, W.H., Visaya, O., Pollock, A.S. & Lovett, D.H. Identification, cellular distribution and potential function of the metalloprotease-disintegrin MDC9 in the kidney. Journal of the American Society of Nephrology : JASN 11, 595-603 (2000).
147. Mahimkar, R.M., Visaya, O., Pollock, A.S. & Lovett, D.H. The disintegrin domain of ADAM9: a ligand for multiple beta1 renal integrins. The Biochemical journal 385, 461-8 (2005).
148. Fritzsche, F.R. et al. ADAM9 expression is a significant and independent prognostic marker of PSA relapse in prostate cancer. European urology 54, 1097-106 (2008).
149. Fritzsche, F.R. et al. ADAM9 is highly expressed in renal cell cancer and is associated with tumour progression. BMC cancer 8, 179 (2008).
150. O’Shea, C. et al. Expression of ADAM-9 mRNA and protein in human breast cancer. International journal of cancer. Journal international du cancer 105, 754-61 (2003).
151. Grützmann, R. et al. ADAM9 expression in pancreatic cancer is associated with tumour type and is a prognostic factor in ductal adenocarcinoma. British journal of cancer 90, 1053-8 (2004).
152. Zigrino, P., Mauch, C., Fox, J.W. & Nischt, R. Adam-9 expression and regulation in human skin melanoma and melanoma cell lines. International journal of cancer. Journal international du cancer 116, 853-9 (2005).
153. Tannapfel, A. et al. Identification of novel proteins associated with hepatocellular carcinomas using protein microarrays. The Journal of pathology 201, 238-49 (2003).
154. Shintani, Y. et al. Overexpression of ADAM9 in non-small cell lung cancer correlates with brain metastasis. Cancer research 64, 4190-6 (2004).
155. Mauch, C. et al. Accelerated wound repair in ADAM-9 knockout animals. The Journal of investigative dermatology 130, 2120-30 (2010).
117
156. Dreymueller, D. et al. Lung endothelial ADAM17 regulates the acute inflammatory response to lipopolysaccharide. EMBO molecular medicine (2012).doi:10.1002/emmm.201200217
157. Horiuchi, K. et al. Cutting Edge: TNF-{alpha}-Converting Enzyme (TACE/ADAM17) Inactivation in Mouse Myeloid Cells Prevents Lethality from Endotoxin Shock. J. Immunol. 179, 2686-2689 (2007).
158. Donners, M.M.P.C. et al. A disintegrin and metalloprotease 10 is a novel mediator of vascular endothelial growth factor-induced endothelial cell function in angiogenesis and is associated with atherosclerosis. Arteriosclerosis, thrombosis, and vascular biology 30, 2188-95 (2010).
159. Brummelkamp, T.R., Bernards, R. & Agami, R. Stable suppression of tumourigenicity by virus-mediated RNA interference. Cancer cell 2, 243-7 (2002).
160. Wiznerowicz, M. & Trono, D. Conditional Suppression of Cellular Genes : Lentivirus Vector-Mediated Drug-Inducible RNA Interference. Society 77, 8957-8961 (2003).
161. Barde, I., Salmon, P. & Trono, D. Production and titration of lentiviral vectors. Current protocols in neuroscience / editorial board, Jacqueline N. Crawley ... [et al.] Chapter 4, Unit 4.21 (2010).
162. Sambrook, J. & Russell, D.W. Molecular Cloning: A laboratory manual (third edition). 2344 (Cold Spring Harbor Laboratory Press,U.S.; 3rd Revised edition edition: 2000).
163. Tsuchiya, S. et al. Establishment and characterization of a human acute monocytic leukemia cell line (THP-1). International journal of cancer. Journal international du cancer 26, 171-6 (1980).
164. Ryu, J.-W. et al. Overexpression of uncoupling protein 2 in THP1 monocytes inhibits beta2 integrin-mediated firm adhesion and transendothelial migration. Arteriosclerosis, thrombosis, and vascular biology 24, 864-70 (2004).
165. Tikellis, C. et al. Reduced plaque formation induced by rosiglitazone in an STZ-diabetes mouse model of atherosclerosis is associated with downregulation of adhesion molecules. Atherosclerosis 199, 55-64 (2008).
166. Ashida, N., Arai, H., Yamasaki, M. & Kita, T. Distinct signaling pathways for MCP-1-dependent integrin activation and chemotaxis. The Journal of biological chemistry 276, 16555-60 (2001).
167. Koenen, R.R. et al. Regulated release and functional modulation of junctional adhesion molecule A by disintegrin metalloproteinases. Blood 113, 4799-809 (2009).
168. Elbashir, S.M. et al. Duplexes of 21-nucleotide RNAs mediate RNA interference in cultured mammalian cells. Nature 411, 494-8 (2001).
169. Pei, Y. & Tuschl, T. On the art of identifying effective and specific siRNAs PERSPECTIVE. Nature Methods 3, 1-7 (2006).

118
170. Sozzani, S. et al. MCP-1 and CCR2 in HIV infection: regulation of agonist and receptor expression. Journal of leukocyte biology 62, 30-3 (1997).
171. Alert, H. Die Rolle der Metalloproteinasen ADAM8 und ADAM9 bei der Prozessierung von Syndekanen und der Migration epithelialer Zellen. (2011).
172. Andrzejewski, M.G. et al. Distinct role of the intracellular C-terminus for subcellular expression, shedding and function of the murine transmembrane chemokine CX3CL1. Biochemical and biophysical research communications 395, 178-84 (2010).
173. Mochizuki, S. & Okada, Y. ADAMs in cancer cell proliferation and progression. Cancer science 98, 621-8 (2007).
174. Giard, D.J. et al. In vitro cultivation of human tumours: establishment of cell lines derived from a series of solid tumours. Journal of the National Cancer Institute 51, 1417-23 (1973).
175. Brown, J. et al. Critical evaluation of ECV304 as a human endothelial cell model defined by genetic analysis and functional responses: a comparison with the human bladder cancer derived epithelial cell line T24/83. Laboratory investigation; a journal of technical methods and pathology 80, 37-45 (2000).
176. Bubeník, J., Perlmann, P., Helmstein, K. & Moberger, G. Cellular and humoral immune responses to human urinary bladder carcinomas. International journal of cancer. Journal international du cancer 5, 310-9 (1970).
177. Tang, J. et al. Adam17-dependent shedding limits early neutrophil influx but does not alter early monocyte recruitment to inflammatory sites. Blood 118, 786-94 (2011).
178. Schneider, U., Schwenk, H.U. & Bornkamm, G. Characterization of EBV-genome negative “null” and “T” cell lines derived from children with acute lymphoblastic leukemia and leukemic transformed non-Hodgkin lymphoma. International journal of cancer. Journal international du cancer 19, 621-6 (1977).
179. Dellacasagrande, J. et al. Reduced transendothelial migration of monocytes infected by Coxiella burnetii. Infection and immunity 68, 3784-6 (2000).
180. Pruenster, M. et al. The Duffy antigen receptor for chemokines transports chemokines and supports their promigratory activity. Nature immunology 10, 101-8 (2009).
181. Bartlett, A.H., Hayashida, K. & Park, P.W. Molecular and cellular mechanisms of syndecans in tissue injury and inflammation. Molecules and cells 24, 153-66 (2007).
182. Muller, W.A. Mechanisms of transendothelial migration of leukocytes. Circulation research 105, 223-30 (2009).
183. Durieu-Trautmann, O., Chaverot, N., Cazaubon, S., Strosberg, A.D. & Couraud, P.O. Intercellular adhesion molecule 1 activation induces tyrosine phosphorylation of the cytoskeleton-associated protein cortactin in brain microvessel endothelial cells. The Journal of biological chemistry 269, 12536-40 (1994).

119
184. van Buul, J.D., Kanters, E. & Hordijk, P.L. Endothelial signaling by Ig-like cell adhesion molecules. Arteriosclerosis, thrombosis, and vascular biology 27, 1870-6 (2007).
185. Cernuda-Morollón, E. & Ridley, A.J. Rho GTPases and leukocyte adhesion receptor expression and function in endothelial cells. Circulation research 98, 757-67 (2006).
186. Huang, A.J. et al. Endothelial cell cytosolic free calcium regulates neutrophil migration across monolayers of endothelial cells. The Journal of cell biology 120, 1371-80 (1993).
187. Turowski, P. et al. Phosphorylation of vascular endothelial cadherin controls lymphocyte emigration. Journal of cell science 121, 29-37 (2008).
188. Schulte, D. et al. Stabilizing the VE-cadherin-catenin complex blocks leukocyte extravasation and vascular permeability. The EMBO journal 30, 4157-70 (2011).
189. Mamdouh, Z., Kreitzer, G.E. & Muller, W.A. Leukocyte transmigration requires kinesin-mediated microtubule-dependent membrane trafficking from the lateral border recycling compartment. The Journal of experimental medicine 205, 951-66 (2008).
190. Mamdouh, Z., Chen, X., Pierini, L.M., Maxfield, F.R. & Muller, W.A. Targeted recycling of PECAM from endothelial surface-connected compartments during diapedesis. Nature 421, 748-53 (2003).
191. Dasgupta, B. & Muller, W.A. Endothelial Src kinase regulates membrane recycling from the lateral border recycling compartment during leukocyte transendothelial migration. European journal of immunology 38, 3499-507 (2008).
192. Muller, W.A., Weigl, S.A., Deng, X. & Phillips, D.M. PECAM-1 is required for transendothelial migration of leukocytes. The Journal of experimental medicine 178, 449-60 (1993).
193. Walcheck, B. et al. Neutrophil rolling altered by inhibition of L-selectin shedding in vitro. Nature 380, 720-3 (1996).
194. Cissé, M.A. et al. The disintegrin ADAM9 indirectly contributes to the physiological processing of cellular prion by modulating ADAM10 activity. The Journal of biological chemistry 280, 40624-31 (2005).
195. Ferguson, S.S. Evolving concepts in G protein-coupled receptor endocytosis: the role in receptor desensitization and signaling. Pharmacological reviews 53, 1-24 (2001).
196. Weber, K.S., Klickstein, L.B. & Weber, C. Specific activation of leukocyte beta2 integrins lymphocyte function-associated antigen-1 and Mac-1 by chemokines mediated by distinct pathways via the alpha subunit cytoplasmic domains. Molecular biology of the cell 10, 861-73 (1999).
197. Zen, K. et al. Cleavage of the CD11b extracellular domain by the leukocyte serprocidins is critical for neutrophil detachment during chemotaxis. Blood 117, 4885-94 (2011).

120
198. Evans, B.J. et al. Shedding of lymphocyte function-associated antigen-1 (LFA-1) in a human inflammatory response. Blood 107, 3593-9 (2006).
199. Vaisar, T. et al. MMP-9 sheds the beta2 integrin subunit (CD18) from macrophages. Molecular & cellular proteomics : MCP 8, 1044-60 (2009).
200. Gomez, I.G. et al. Metalloproteinase-mediated shedding of integrin 2 promotes macrophage efflux from inflammatory sites. Journal of Biological Chemistry 287, 4581-9 (2011).
201. Ley, K., Laudanna, C., Cybulsky, M.I. & Nourshargh, S. Getting to the site of inflammation: the leukocyte adhesion cascade updated. Nature reviews. Immunology 7, 678-89 (2007).
202. Zarbock, A., Kempf, T., Wollert, K.C. & Vestweber, D. Leukocyte integrin activation and deactivation: novel mechanisms of balancing inflammation. Journal of molecular medicine (Berlin, Germany) (2011).doi:10.1007/s00109-011-0835-2
203. Stamenkovic, I. & Yu, Q. Shedding light on proteolytic cleavage of CD44: the responsible sheddase and functional significance of shedding. The Journal of investigative dermatology 129, 1321-4 (2009).
204. Liu, S. et al. A fragment of paxillin binds the alpha 4 integrin cytoplasmic domain (tail) and selectively inhibits alpha 4-mediated cell migration. The Journal of biological chemistry 277, 20887-94 (2002).
205. Hughes, S.C. & Fehon, R.G. Understanding ERM proteins--the awesome power of genetics finally brought to bear. Current opinion in cell biology 19, 51-6 (2007).
206. Ivetic, A. & Ridley, A.J. Ezrin/radixin/moesin proteins and Rho GTPase signalling in leucocytes. Immunology 112, 165-76 (2004).
207. Tarrant, J.M., Robb, L., van Spriel, A.B. & Wright, M.D. Tetraspanins: molecular organisers of the leukocyte surface. Trends in immunology 24, 610-7 (2003).
208. Wang, H.-X., Li, Q., Sharma, C., Knoblich, K. & Hemler, M.E. Tetraspanin protein contributions to cancer. Biochemical Society transactions 39, 547-52 (2011).
209. Le Naour, F. et al. Profiling of the tetraspanin web of human colon cancer cells. Molecular & cellular proteomics : MCP 5, 845-57 (2006).
210. Arduise, C. et al. Tetraspanins regulate ADAM10-mediated cleavage of TNF-alpha and epidermal growth factor. Journal of immunology (Baltimore, Md. : 1950) 181, 7002-13 (2008).
211. Xu, D., Sharma, C. & Hemler, M.E. Tetraspanin12 regulates ADAM10-dependent cleavage of amyloid precursor protein. FASEB journal : official publication of the Federation of American Societies for Experimental Biology 23, 3674-81 (2009).
212. Gutiérrez-López, M.D. et al. The sheddase activity of ADAM17/TACE is regulated by the tetraspanin CD9. Cellular and molecular life sciences : CMLS 68, 3275-92 (2011).

121
213. Hogg, N., Patzak, I. & Willenbrock, F. The insider’s guide to leukocyte integrin signalling and function. Nature reviews. Immunology 11, 416-26 (2011).
214. Gooz, P. et al. A Disintegrin and Metalloenzyme (ADAM) 17 Activation Is Regulated by α5β1 Integrin in Kidney Mesangial Cells. PLoS ONE 7, e33350 (2012).
215. Sanderson, M.P., Dempsey, P.J. & Dunbar, A.J. Control of ErbB signaling through metalloprotease mediated ectodomain shedding of EGF-like factors. Growth factors (Chur, Switzerland) 24, 121-36 (2006).
216. Blobel, C.P. ADAMs: key components in EGFR signalling and development. Nature reviews. Molecular cell biology 6, 32-43 (2005).
217. Guaiquil, V.H. et al. ADAM8 is a negative regulator of retinal neovascularization and of the growth of heterotopically injected tumour cells in mice. Journal of molecular medicine (Berlin, Germany) 88, 497-505 (2010).
218. Zhang, H. et al. ErbB receptors: from oncogenes to targeted cancer therapies. The Journal of clinical investigation 117, 2051-8 (2007).

122
7. List of abbreviations
A8 ADAM8
A9 ADAM9
A10 ADAM10
A17 ADAM17
ADAM a disintegrin and metalloproteinase
ADAM-TS a disintegrin and metalloproteinase with thrombospondin 1
ADP adenosine diphosphate
Amp ampicillin
ANOVA analysis of variances
APC allophycocyanin
APP amyloid precursor protein
ATP adenosine triphosphate
bp(s) base pairs
BSA bovine serum albumine
°C degrees Celsius
Ca2+ calcium2+
CD cluster of differentiation
cDNA complementary DNA
CFP cyan fluorescent protein
CMV cytomegalovirus
Da dalton
DMEM Dulbecco’s modified Eagle’s medium
DMSO dimethyl sulfoxide
DNA deoxyribonucleic acid
E. coli Escherichia coli

123
E- Cadherin epithelial cadherin
ECL enhanced chemiluminescence
ECM extracellular matrix
EDTA ethylenediamine tetra-acetic acid
EGF epidermal growth factor
EGTA ethylene glycol tetraacetic acid
ELISA enzyme-linked immunosorbent assay
ERK extracellular-signal regulated kinase
E-selectin endothelial selectin
et al. et alii
EtOH ethanol
FACS fluorescence activated cell sorter
FCS fetal calf serum
FITC fluorescein isothiocyanate
fMLP N-formyl-methionine-leucine-phenylalanine
FSC forward scatter
g g-force
G418 geneticin sulfate
GAPDH glyseraldehyde-3-phosphate dehydrogenase
G-CSF granulocyte-colony stimulating factor
GFP green fluorescent protein
GPCR G-protein coupled receptor
GTP guanosine triphosphate
h hour
H2O water
HB-EGF heparin binding epidermal growth factor
HBSS Hank's buffered salt solution

124
HCl hydrochloric acid
HEPES 4-2-hydroxyethyl-1-piperazineethanesulfonic acid
HMVEC human micro-vascular endothelial cells
HRP horseradish peroxidase
HSPG heparan-sulphate proteoglycan
HUVEC human umbilical vein endothelial cells
ICAM intercellular adhesion molecule
IFN interferon
Ig immunoglobulin
IgG immunglobulin G
IL interleukin
IL6-R interleukin-6-receptor
IP3 inositol triphosphat
JAM junctional adhesion molecule
kb kilo base pairs
KCl potassium chloride
KD knock-down
kDa kilo Dalton
l litre
LB lysogeny broth
LFA-1 lymphocyte-function associated antigen-1
LPS lipopolysaccharide
L-selectin leukocyte selectin
LV lentiviral transduced
m milli
M Molar
mAb monoclonal antibody

125
Mac-1 macrophage antigen-1
MAPK Mitogen aktivierte Protein Kinase
MCP-1 monocyte chemoattractant protein-1
MCS multiple cloning site
mg Milligramm
Mg2+ magnesium2+
min minute
ml millilitre
mM millimolar
MMP matrix metalloproteinase
mRNA messenger RNA
n nano
N normality
N- Cadherin neuronal cadherin
NaCl sodium chloride
OD optical density
ORF open reading frame
p pico
p probability
P/S penicillin/streptomycin
PAGE polyacrylamide gel electrophoresis
PBS phosphate buffered saline
PCR polymerase chain reaction
PDVF polyvinylidene fluoride
PE phycoerythrin
PECAM platelet/endothelial cell adhesion molecule
PFA paraformaldehyd

126
pH potentia hydrogenii
PIP2 phosphatidylinositol 4,5-bisphosphate
PKC protein kinase C
PMA phorbol 12-myristate 13-acetate
POD peroxidase
P-selectin platelet selectin
PSGL-1 p-selection glycoprotein ligand-1
qPCR quantitative real-time polymerase chain reaction
RNA ribonucleic acid
RNAi RNA interference
rpm rounds per minute
RPMI Roswell Park Memorial Institute
RT room temperature
s second
scr scramble shRNA
SD standard deviation
SDS sodium docecyl sulphate
shRNA short hairpin RNA
siRNA short interfering RNA
SOB super optimal broth
SSC sideward scatter
stim. stimulation
SV-40 Simian Virus 40
SVMP snake venom metalloproteinase
TACE tumour necrosis factor alpha converting enzyme
TGFα transforming growth factor-alpha
TIMP tissue inhibitor of metalloproteinase

127
TNFα tumour necrosis factor-alpha
Tris tris (hydroxymethyl) aminomethane
Tween20 polyoxyethylenesorbitan monolaurate
U unit
V volts
VCAM-1 vascular cell adhesion molecule-1
VE-Cadherin vascular endothelial-Cadherin
VEGF-R vascular endothelial growth factor receptor
VLA-4 very late antigen 4
VSV-G vesicular stomatitis virus glykoprotein
wt wildtype
Zn zinc
α alpha
β beta
γ gamma
µ mikro
µg microgram
µl microlitre
µm micrometer
Amino acids
A alanine (Ala) G glycine (Gly) M methionine (Met) S serine (Ser)
C cysteine (Cys) H histidine (His) N asparagine (Asn) T threonine (Thr)
D aspartic acid (Asp) I isoleucine (Ile) P proline (Pro) V valine (Val)
E glutamic acid (Glu) K lysine (Lys) Q glutamine (Gln) W tryptophane (Trp)
F phenylalanine (Phe) L leucine (Leu) R arginine (Arg) Y tyrosine (Tyr)
128
8. List of figures
Figure 1: The process of leukocyte recruitment.................................................................2
Figure 2: Family tree of the metzincins.............................................................................7
Figure 3: Drawing showing the distinct domain of ADAM protease. .....................................8
Figure 4: The implication of ADAM-shedding on various substrate molecules. ....................10
Figure 5: Involvement of ADAMs in inflammatory activation and leukocyte recruitment. .....14
Figure 6: General design of oligonucleotides containing the shRNA target sequences. ........29
Figure 7: Heat map of mRNA levels of ADAM8, 9, 10 and 17 in several cell culture lines.....44
Figure 8: Concentration kinetic of MCP-1-induced THP1 cell transmigration through HMVEC.
..................................................................................................................................45
Figure 9: Comparison of THP1 cells migration in in vitro chemotaxis and transdendothelial
migration assays. .........................................................................................................46
Figure 10: Influence of ADAM inhibitors on THP1 migration. ............................................48
Figure 11: Analysis of lentiviral transduced HUVEC. .........................................................50
Figure 12: Surface expression of ADAM10 on HEK293 cells transiently transfected with
pSuper-ADAM10...........................................................................................................51
Figure 13: Analysis of ADAM10 gene KD by pLVTHM-vectors ADAM10-650 and ADAM10-
1947. ..........................................................................................................................52
Figure 14: Gene silencing of ADAM17 with pLVTHM-lentiviral vectors................................53
Figure 15: Effects of shRNA against ADAM10 or ADAM17 on the surface expression of the
respective other ADAM protease. ...................................................................................55
Figure 16: Effect of ADAM10 and 17 KD on the shedding of CX3CL1. ................................56
Figure 17: Gene silencing of ADAM8 and 9. ....................................................................58
Figure 18: Flow cytometry analysis of ADAM10 and 17 surface expression on lentiviral
transduced THP1..........................................................................................................59
Figure 19: qPCR analysis of ADAM8, 9, 10 and 17 mRNA transcript levels in stable LV-THP1
cell lines. .....................................................................................................................60

129
Figure 20: The refined transmigration assay using CFP labelled control cells and GFP labelled
KD cells. ......................................................................................................................63
Figure 21: Transmigration and chemotaxis of ADAM10-LV-THP1 in response to MCP-1.......65
Figure 22: Percentage of migrated cells in the transmigration and chemotaxis assays of
ADAM10-LV-THP1.........................................................................................................66
Figure 23: Effect of ADAM8-KD on transmigration and chemotaxis of THP1 cells................68
Figure 24: Migration rates of ADAM9-LV-THP1 cells in transmigration and chemotaxis assays.
..................................................................................................................................69
Figure 25: Transmigration and chemotaxis assays with ADAM17-LV-THP1.........................70
Figure 26: Concentration dependent transmigration of ADAM-KD LV-THP1 towards MCP-1. 71
Figure 27: Ca2+-flux of wt THP1 after MCP-1 stimulation. .................................................73
Figure 28: MCP-1 induced Ca2+-response of THP1 cells treated with the ADAM inhibitors
GI254023 and GW282406. ............................................................................................75
Figure 29: Ca2+-response of LV-THP1 with gene silencing of ADAM8, 9, 10 or 17. ..............76
Figure 30: Adhesion of THP1 to VCAM1, ICAM-1 and fibronectin under static conditions with
and without the stimulation by 3nM MCP-1.....................................................................77
Figure 31: Static adhesion of wt THP1 treated with the ADAM inhibitors GI254023 and
GW282406...................................................................................................................78
Figure 32: Static adhesion of LV-THP1 with gene silencing of ADMA8, 9 10 or 17. .............79
Figure 33: Microscopic images of the scratch assay performed with ADAM8-KD LV-ECV304
and scramble control cells. ............................................................................................80
Figure 34: Summary of the scratch assays performed with LV-ECV 304 with a gene silencing
of ADAM8, 9, 10 and 17................................................................................................81
Figure 35: Hypothesis 1: Shedding of integrins as possible contribution of ADAM8 or 10 to
the migration of THP1 cells. ..........................................................................................98
Figure 36: Hypothesis 2: Interaction of ADAM8 or 10 with integrins and possible other
adhesion molecules is needed for the formation of high molecular clusters at the
plasmamembrane of migrating THP1 cells. ................................................................... 100

130
Figure 37: Hypothesis 3: ADAM8 or 10 contribute to the migration of THP1 cells by shedding
ligands of receptors of the ErbB family, leading to an auto- or parakrine stimulation which
promotes a migratory phenotype of the monocytic cells................................................. 102
Figure 38: Plasmid map of pSuper. .............................................................................. 132
Figure 39: Plasmid map of pLVTHM (Addgene number: 12247). ..................................... 133
Figure 40: Plasmid map of psPAX2 (Addgene number: 12260). ...................................... 134
Figure 41: Plasmid map of pMD2.G (Addgene number: 12259)....................................... 135
Figure 42: Expression levels of ADAM8, 9, 10 and 17 in several cell culture lines. ............ 136
Figure 43: Effect of ADAM8-KD on transmigration and chemotaxis of THP1 cells.............. 137
Figure 44: Relative migration rates of ADAM9-LV-THP1 cell in transmigration and chemotaxis
assays ....................................................................................................................... 138
Figure 45: Transmigration and chemotaxis assays with ADAM17-LV-THP1....................... 138

131
9. List of tables
Table 1: Shedding substrates of ADAM8, 9, 10 and 17 which are involved in inflammatory
responses and leukocyte migration. ...............................................................................17
Table 2: List of primary antibodies and their working dilutions..........................................28
Table 3: List of secondary antibodies and their working dilutions. .....................................29
Table 4: List of oligonucleotides for the generation of pLVTHM plasmids for the down
regulation of our target ADAM proteinases. ....................................................................30
Table 5: Sequences of qPCR-primers for ADAM8, 9, 10, 17 and GAPDH used in this study. .31
Table 6: List of plasmids used in this study.....................................................................31
Table 7: List of cell lines used in this study and their respective culture media...................32
Table 8: Annealing temperatures and number of cycles for the qPCR for each target gene. 40
Table 9: Summary table of the outcome of the performed functional assays of this study...84

132
10. Appendix
10.1. Plasmid maps
pSuper
pSuper-basic
3176 bps
500
1000
1500
2000
2500
3000
DraIIIBsaAI
NaeINgoMIV
Ecl136IISacIBstXIBstDSISacIINotIEco52IXbaISpeIBamHISmaIXmaIPstIEcoRIBstBIAatII
StyI
BbeIEheIKasINarIBstAPI
BglIIHindIIIClaIAccIHincIISalIXhoIEcoO109IAcc65IKpnI
SapI
AflI IIPciIAlwNI
AhdI
BpmI
ScaITatI
XmnI
f1(+) orign
H1 prom.
pUC orgn
Amp
Figure 38: Plasmid map of pSuper.

133
pLVTHM
pLVTHM
11085 bps
2000
4000
6000
8000
10000
PmlI
NotIEco52I
PpuMISanDISalI
BspMI
FseI
SwaIPacI
PmeI
SpeINdeI
SnaBI++Acc65IKpnI
BstXIBamHI
EcoRI
MluIClaI
XbaISgrAI
PvuI
FspI
SfiIBlnI
PshAI
XcmI
LTR
EF1a
eGFP
WPRE
H1seq.
Amp
SV40 ori
Figure 39: Plasmid map of pLVTHM (Addgene number: 12247).
MluI and ClaI were used to insert annealed oligonucleotides containing the shRNA sequences. EcoRI and ClaI were used to transfer H1-cassette together with the shRNA sequences from pSUPER. PmeI and SpeI were used to replace eGFP with eCFP. The site where the sequencing primer annealed is indicated by seq.

134
psPAX2
psPAX2
11009 bps
2000
4000
6000
8000
10000
AatIISnaBI
PmlIPshAI
SacIIBpu1102I
SgrAI
FseI
SphI
BclI
SbfI
Tth111I
AgeISwaI
AflII
Bsu36I
NheI
SfiIStuI
FspIPvuI
DraIII
CMVenh
CAGpro
gag
pol
Tat/ref
SV40 ori
Amp
Figure 40: Plasmid map of psPAX2 (Addgene number: 12260).

135
pMD2
pMD2.G
5990 bps
1000
2000
3000
4000
5000
Bsu36IApaIPspOMI
BsrGI
SnaBI
BsmBIHindIII
AhdI
PmlIClaI
PshAIVan91I
EcoNIBstAPI
PstI
AgeIBsaI
BclIBpu10IBstBI
MscI
NotIEco52I
SalIHaeII
FspI
PvuIScaI
XmnIBtrI
CMV
beta-Globin intr.
VSV-G
pBR322 ori
Ampicilin
Figure 41: Plasmid map of pMD2.G (Addgene number: 12259).

136
10.2. Complementary figure: Comparison of ADAM8, 9, 10 and
17 expression in different leukocytic, endothelial and
epithelial cell culture lines
Figure 42 shows the data which were used to generate the heat map of mRNA levels of
ADAM8, 9, 10 and 17 in several cell culture lines (see Results).
A
ECVA54
9
HEK293
HMVEC
HUVECTH
P1
Jurka
t0.0
0.5
1.0
1.5
cell lines
leve
l of
ADA
M8
mR
NA
(re
l. to
GA
PD
H)
B
ECVA54
9
HEK293
HMVEC
HUVECTHP1
Jurkat
0
1
2
3
4
5
cell lines
AD
AM
9 tr
ansk
ript
. lev
el(r
el. t
o G
AP
DH
)
C
ECVA549
HEK293
HMVEC
HUVECTHP1
Jurka
t0
1
2
3
cell lines
AD
AM
10 tr
ansk
ript
. le
vel
(re
l. to
GA
PD
H)
D
ECVA54
9
HEK293
HMVEC
HUVECTH
P1
Jurk
at0
1
2
3
4
5
cell lines
AD
AM
17 t
rans
krip
t. le
vel
(rel
. to
GA
PD
H)
Figure 42: Expression levels of ADAM8, 9, 10 and 17 in several cell culture lines.
The figure shows the mRNA levels of ADAM8 (A), ADAM9 (B), ADAM10 (C) and ADAM17 (D) in the indicated cell lines. The amount of each ADAM-mRNA was determined using qPCR (n=4) and is shown as mean ±SD. The expression rate of the ADAM genes was normalised to the housekeeping gene GAPDH. mRNA expression levels are expressed in relation to those of ECV304 cells.

137
10.3. Complementary figures: Relative number of migrated
ADAM8, ADAM9 or ADAM17-KD LV-THP1 in transmigration
and chemotaxis assay.
A
scr
A8 903
A8 183
1
A8 26
45
scr n
o s tim
0.0
0.5
1.0
1.5
*******
***
LV-THP1-KD-lines
ratio
of
mig
rate
d ce
lls(r
el.
to s
cr)
B
scr
A8 90
3
A8 1831
A8 264
5
scr n
o st im
0.0
0.5
1.0
1.5
*
***
LV-THP1-KD-linesra
tio o
f m
igra
ted
cells
(re
l. to
scr
)
Figure 43: Effect of ADAM8-KD on transmigration and chemotaxis of THP1 cells
(data expressed as number of migrated cells relative to the scr control cells).
A: Relative number of migrated ADAM8 deficient LV-THP1 through an endothelial layer of HMVEC in the presence of MCP-1 as chemotactic stimulus. B: Relative number of migrated ADAM8-KD LV-THP1 in the chemotaxis assay. Data are shown as number of migrated cells relative to the scramble control. The number of all migrated cells (LV-THP1 scramble-CFP together with ADAM8-KD GFP expressing LV-THP1) was determined with the glucoronidase assay. To show the effect of the MCP-1 stimulus the percentage of scramble cells that migrated in the absence of MCP-1 (scr no stim) shown in all diagrams. The data of all panels are shown as mean ±SD, n=4, *p<0.05, **p<0.01, ***p<0.001 compared to scramble control.

138
A
scr
A9 196
7
A9 226
0
scr n
o sti m
0.0
0.5
1.0
1.5
2.0
***
LV-THP1-KD-lines
ratio
of
mig
rate
d ce
lls(r
el. t
o s
cr)
B
scr
A9 196
7
A9 2260
scr n
o stim
0.0
0.5
1.0
1.5
2.0
2.5***
***
LV-THP1-KD-lines
rati
o of
mig
rate
d ce
lls(r
el.
to s
cr)
Figure 44: Relative migration rates of ADAM9-LV-THP1 cell in transmigration and
chemotaxis assays
(data expressed as number of migrated cells relative to the scr control cells).
A: Relative number of migrated ADAM9 deficient LV-THP1 cells through an endothelial layer of HMVEC in the presence of MCP-1. B: Relative number of migrated ADAM9-KD LV-THP1 in the chemotaxis assay. Data are shown as number of migrated cells relative to the scramble control. The number of all migrated cells (LV-THP1 scramble-CFP together with ADAM9-KD GFP expressing LV-THP1) was determined with the glucoronidase assay. To show the effect of the MCP-1 stimulus the percentage of scramble cells that migrated in the absence of MCP-1 (scr no stim) shown in all diagrams. The data of all panels are shown as mean ±SD, n=4, ***p<0.001 compared to scramble control.
A
scr
A17 20
61
A17 26
42
scr n
o sti
m
0.0
0.5
1.0
1.5
***
***
LV-THP1-KD-lines
ratio
of
mig
rate
d ce
lls(r
el.
to s
cr)
B
scr
A17 2
061
A17 2
642
scr n
o stim
0.0
0.5
1.0
1.5
***
***
LV-THP1-KD-lines
rati
o of
mig
rate
d c
ells
(rel
. to
scr
)
Figure 45: Transmigration and chemotaxis assays with ADAM17-LV-THP1
(data expressed as number of migrated cells relative to the scr control cells).
A: Relative number of migrated ADAM17 deficient LV-THP1 through an endothelial layer of HMVEC in the presence of MCP-1 as chemotactic stimulus. B: Relative number of migrated ADAM17-KD LV-THP1 in the chemotaxis assay. Data are shown as number as migrated cells relative to the scramble control. The number of all migrated cells (LV-THP1 scramble-CFP together with ADAM17-KD GFP expressing LV-THP1) was determined with the glucoronidase assay. To show the effect of the MCP-1 stimulus the percentage of scramble cells that migrated in the absence of MCP-1 (scr no stim) shown in all diagrams. The data of all panels are shown as mean ±SD, n=4, ***p<0.001 compared to scramble control.

139
11. Publications
Dreymueller, Daniela, Christian Martin, Tanja Kogel, Jessica Pruessmeyer, Franz Martin
Hess, Keisuke Horiuchi, Stefan Uhlig, and Andreas Ludwig. “Lung endothelial ADAM17
regulates the acute inflammatory response to lipopolysaccharide.” EMBO Molecular Medicine;
(2012 Feb 24). [Epub ahead of print]
Pruessmeyer, Jessica, Christian Martin, Franz Martin Hess, Nicole Schwarz, Sven Schmidt,
Tanja Kogel, Nicole Hoettecke, Boris Schmidt, Antonio Sechi, Stefan Uhlig and Andreas Uhlig.
“A disintegrin and metalloproteinase 17 (ADAM17) mediates inflammation-induced shedding
of syndecan-1 and -4 by lung epithelial cells.” The Journal of biological chemistry 285, no. 1
(January 1, 2010): 555-64.
Schwarz, Nicole, Jessica Pruessmeyer, Franz Martin Hess, Daniela Dreymueller, Elena
Pantaler, Anne Koelsch, Reinhard Windoffer, Mathias Voss, Alisina Sarabi, Christian Weber,
Antonio Sechi, Stefan Uhlig and Andreas Ludwig. “Requirements for leukocyte transmigration
via the transmembrane chemokine CX3CL1.” Cellular and molecular life sciences : CMLS 67,
no. 24 (December 2010): 4233-48.

140
12. Curriculum Vitae
Franz Martin Heß
Born: May 26th, 1980
Place of birth: Darmstadt, Germany
Nationality: German
Since December 2007 - PhD student at the Institute of Pharmacology and Toxicology,
to present University Hospital, RWTH University Aachen, Germany
Supervisor: Prof. Dr. rer. nat. Andreas Ludwig
Topic of PhD thesis: „ The role of the metalloproteases ADAM8,
9, 10 and 17 in leukocyte migration in vitro”
June - August 2007 Research assistant at the Max-Planck-working groups for
structural Molecularbiology, Hamburg
April 2006 - March 2007 Diploma thesis at the Institute for Zytobiology
Philipps University Marburg, Germany
„In Vivo Analysis of the apical and basolateral protein transport
in polarized epithelial cells“
July - December 2004 Lab internship at the Neuropharmacology and
Neuroinflammatory Research Group, RMIT University,
Melbourne, Australia
March - June 2004 Study abroad at University of Melbourne, Melbourne, Australia
October 2000 Enrolment as student of Humanbiology at the
Philipps-University Marburg, Germany
August 1990 - Secondary school at Gymnasium Michelstadt, Germany
June 2000
July 1996 - June 1997 Exchange student at the Escuela Pablo Colon Berdecia in
Barranquitas, Puerto Rico

141
13. Declaration
I hereby declare, that this thesis was carried out at RWTH Aachen University, within the
Institute for Pharmacology and Toxicology and the Institute for Molecular and Cardiovascular
Research. It was exclusively performed by myself, unless otherwise stated in the text. To my
knowledge, it contains no material used in other publications or thesis, except where
reference is made in the text.
F. Martin Heß , Aachen 03.7.2012

142
14. Acknowledgements
First of all I would like to thank my doctoral adviser Prof Dr Andreas Ludwig for his guidance
and his helpful advice which he provided over the last years. He did not only help me with
experiments and scientific matters but as well always had an open ear and understanding for
matters exceeding science.
I want to thank Prof Dr Zenke for reviewing this thesis and for letting me work in his
laboratory on the establishment of the lentiviral transduction system.
Prof Dr Baumgartner, thank you for agreeing to be my examiner in the upcoming PhD
defence.
Without the help of Dr Antonio Sechi, who introduced me to lentiviral work and helped with
the establishment of our lentiviral system, and Dr Kristin Seré this thesis would not be what
it is today. Thank you for your advice and precious time.
Our technicians, Tanja Kogel and Melanie Esser, deserve my gratitude for keeping the
laboratory running and for their help with experiments. The same goes for my congenial
colleagues of the Ludwig group, the Institute of Pharmacology and the IMCAR. Especially, I
would like to thank Michael, Mike, Svenja, Regina, Ali, Martin, Julian, Ralf and Ulla. The
anatomists shall not be forgotten: thanks for the good times Christian, Jon and Tim!
Jette Alert deserves special mentioning since it was always a great pleasure to work with
her.
Dr Phillip, you are the bon vivant who showed me how to survive writing a PhD thesis.
Brendan, my Californian Australian friend: I owe you big time for reading and correcting this
PhD thesis.
My family in law, who took me in with open arms and hearts: Thank you for accepting me as
son and brother.
Without my parents, Johanna and Franz Jakob Heß, I would not be where I am today. I
want to thank you for being loving and understanding parents who raised me, supported me
and accepted me as I am.
Finally, I thank my dear and beloved family, whose patience and benevolence gave me the
time and strength to work on this thesis. My little man Matti: without your thousand hugs
and good wishes your old man would not have made it! Kristine: thousand thanks for
everything. We made it.