The role of the IRE1/Xbp1 pathway in a Drosophila...
51
i UNIVERSIDADE DE LISBOA FACULDADE DE CIÊNCIAS DA UNIVERSIDADE DE LISBOA DEPARTAMENTO DE BIOLOGIA VEGETAL The role of the IRE1/Xbp1 pathway in a Drosophila model for Autosomal Dominant Retinitis Pigmentosa (ADRP) Rita Esperto Costa Mestrado em Biologia Molecular e Genética Lisboa 2011
Transcript of The role of the IRE1/Xbp1 pathway in a Drosophila...

i
UNIVERSIDADE DE LISBOA
FACULDADE DE CIÊNCIAS DA UNIVERSIDADE DE LISBOA
DEPARTAMENTO DE BIOLOGIA VEGETAL
The role of the IRE1/Xbp1 pathway in a Drosophila model for
Autosomal Dominant Retinitis Pigmentosa (ADRP)
Rita Esperto Costa
Mestrado em Biologia Molecular e Genética
Lisboa 2011

ii
UNIVERSIDADE DE LISBOA
FACULDADE DE CIÊNCIAS DA UNIVERSIDADE DE LISBOA
DEPARTAMENTO DE BIOLOGIA VEGETAL
The role of the IRE1/Xbp1 pathway in a Drosophila model for
Autosomal Dominant Retinitis Pigmentosa (ADRP)
Dissertação orientada pelos Professores Doutores:
Pedro M. Domingos, PhD, ITQB
Rui Gomes, PhD, FCUL
Rita Esperto Costa
Mestrado em Biologia Molecular e Genética
Lisboa 2011

iii
Acknowledgments
This research project would not have been possible without the support of many people.
Thus, I which to express my gratitude:
To Instituto de Tecnologia Química e Biológica (ITQB) and Instituto Gulbenkian Ciência
(IGC) for their facilities.
To Fundação para a Ciência e Tecnologia that financed this project and the Cell Signaling in
Drosophila laboratory.
To Pedro Domingos, my supervisor, who helped me to overcome every obstacle, always
believing in my work and encouraging me to continue.
To all my lab colleagues for their assistance, especially to Fátima for teaching me
biomolecular techniques and helping with the cell transfections and to Dina for being very
polite and helpful whenever I needed.
To Monica Dias lab for sharing Gateway reagents.
To Rui Gomes, my faculty teacher and supervisor, for his enthusiasm and his teachings.
Finally, to all my beloved families and friends for their understanding and endless love,
through the duration of my studies.
A special thank you to Jorge Costa, Paula Esperto, Gil Costa, Rafaela Costa, Diogo Claro,
Francisco Freixo, Ana Duarte, Joana Assunção, Ana Nunes, Inês Figueira e Petra Pintado.

iv
Abstract
Neurodegenerative disorders are a major medical problem for society. Growing evidence
indicates that endoplasmic reticulum (ER) stress is an important common pathological event
in a variety of neurodegenerative diseases. The unfolded protein response (UPR) is triggered
by the accumulation of misfolded proteins provoked by ER stress conditions, to restore
homeostasis. We are particularly interested in the Ire1/Xbp1 branch of the UPR, in which Ire1
mediates the unconventional splicing of Xbp1 mRNA so that Xbp1spliced can activate the
transcription of UPR effectors genes.
Our aim is to investigate the molecular mechanisms regulating the co-localization of Ire1
with Xbp1 mRNA, which are required for the splicing of Xbp1 mRNA. For this purpose we
generated two Ire1-tagged transgenes: 1) in which a mcherry tag is between the
transmembrane and the kinase domains of Ire1. 2) Ire1 is fused with a GFP tag in its C-
terminal. S2 cell transfections show that our Ire1 constructs are being expressed and correctly
localize to the ER. Also, cell transfections suggest that both Ire1 constructs are functionally
active, since they are able to splice a Xbp1-EGFP reporter.
In parallel, we want to investigate the role of microRNAs (miRNA) in the Xbp1 post-
transcription regulation. We started to establish an assay to do miRNA profiling in the context
of Ire1/Xbp1 pathway activation. We did preliminary tests where we followed the progression
of retinal degeneration induced by light in wt flies or in a ADRP fly model. So far, we could
not find the right experimental conditions in which ADRP fly eyes degenerate but control
flies do not.
Key words: ER stress, UPR, Retinal degeneration, Ire1, Xbp1

v
Resumo
As doenças neurodegenerativas constituem um problema emergente na sociedade actual,
sendo o stress do retículo endoplasmático (RE) um evento patológico comum a uma
variedade destas doenças. Quando ocorre stress no RE, um mecanismo celular denominado
unfolded protein response (UPR) é activado, pela acumulação de proteínas misfolded, para
que a célula possa restaurar a homeostasia. O UPR leva a uma diminuição da tradução de
proteínas clientes do RE e a um aumento da capacidade de lidar com proteínas misfolded, o
qual ocorre pela activação da transcrição de uma série de genes do RE, como por exemplo, as
chaperones. Paralelamente, o UPR tem também como consequência a activação da via de
degradação associada ao RE, que degrada proteínas com folding incorrecto, através do
sistema de ubiquitina-proteossoma. Em conjunto, os mecanismos activados pelo UPR
permitem restabelecer o funcionamento do RE. Contudo, nos casos em que o stress no RE é
severo e prolongado, o UPR pode não ser suficiente para contrabalançar os seus efeitos.
Nestes casos, são desencadeadas vias de sinalização que culminam na morte celular
programada – a apoptose.
O UPR é iniciado por transdutores transmembranares do RE que conseguem reconhecer a
acumulação de proteínas misfolded no lúmen do RE. Existem três transdutores: o inositol-
requiring enzyme 1 (Ire1), o pancreatic ER kinase (PKR)-like ER kinase (PERK) e o
activating transcription factor 6 (ATF6), que activam três ramos do UPR, mecanicamente
distintos. O Ire1 é o mais conservado destes transdutores, uma vez que está presente em todos
os eucariotas. Nos metazoários, depois de activado, Ire1 catalisa a remoção de um intrão do
mRNA de X-box binding protein 1 (Xbp1) – um mecanismo de splicing independente do
spliceosoma. Quer a forma spliced, quer a forma unspliced do mRNA de Xbp1 são traduzidas
e originam proteínas, mas apenas a forma spliced de Xbp1 origina um factor de transcrição
eficiente, que activa a expressão de genes-alvo do UPR a jusante. A remoção do intrão de
Xbp1 causa um frameshift durante a tradução, que introduz um novo domínio C-terminal na
proteína, o qual é essencial para função desta como factor de transcrição.
A Retinite Pigmentosa (RP) é uma doença caracterizada pela degeneração progressiva dos
fotorreceptores, tendo como principais sintomas a cegueira nocturna, seguida pela perda da
visão periférica e, numa fase mais avançada, pela perda da visão central. Utilizando um
modelo em Drosophila melanogaster de RP, conclui-se que a via de sinalização de Ire1/Xbp1
tem um papel relevante na protecção contra a degeneração da retina. Assim, mais estudos

vi
sobre a regulação da via de sinalização de Ire1/Xbp1 poderão permitir uma melhor
compreensão da RP.
Neste trabalho, estivemos particularmente interessados na via de sinalização de Ire1/Xbp1
do UPR, tendo dois objectivos principais de estudo.
1. O primeiro objectivo foi o de estudar em Drosophila o fenómeno de co-localização do
Ire1 e do mRNA de Xbp1.
Uma vez que Ire1 é uma proteína transmembranar do RE, para que se possa realizar o
splicing do mRNA de Xbp1 é necessário que este último, de alguma forma, seja recrutado
para a vizinhança do RE. Investigações recentes sugerem diferentes modelos para a co-
localização de Ire1 e do mRNA Xbp1. De acordo com o estudo em levedura de Aragon et al,
sempre que as células estão sob condições de stress, Ire1 “oligomeriza-se” e acumula-se em
foci na membrana do RE. O mRNA Hac1 (o homólogo funcional de Xbp1 na levedura) é
então recrutado por intermédio de um elemento bipartido presente no 3' untransleted region
(UTR) para estes foci. Já Yanagitani et al argumentam que a pausa na tradução de Xbp1
unspliced é que é necessária para o recrutamento (por intermédio de uma região hidrofóbica
denominada HR2) e para o splicing do mRNA de Xbp1 em células de mamíferos.
Em Drosophila, foi identificada uma região HR2 mas a sua funcionalidade ainda não foi
comprovada. O fenómeno de co-localização do Ire1 e do mRNA de Xbp1 continua por
explorar.
Neste trabalho, originámos dois transgenes de Ire1 fundidos com uma cauda fluorescente,
de modo a ser possível a sua visualização em microscopia confocal. Num dos transgenes, foi
inserida uma cauda mcherry entre o domínio transmembranar e o domínio cinase da proteína
Ire1. No outro caso, uma cauda GFP foi fundida na extremidade C-terminal de Ire1.
Seguidamente, estas construções foram clonadas em vectores pUAST e transfectadas em
células S2 para podermos avaliar se elas seriam expressas na célula, se se localizariam
correctamente e se estariam funcionais. As transfecções efectuadas mostraram que as nossas
construções de Ire1 foram expressas pelas células e localizavam-se, como esperado, no RE.
Além disso, as transfecções também sugeriram que as construções de Ire1 são funcionais, já
que realizaram o splicing do repórter Xbp1-EGFP. No entanto, para que possamos ter a
certeza que as nossas construções são viáveis, estes resultados precisam de ser repetidos e ser
validados no organismo da Drosophila.

vii
2. O segundo objectivo de estudo foi o de investigar a regulação pós-transcricional de Xbp1,
mais concretamente, de analisar se os miRNA podem ter uma função neste processo.
A regulação pós-transcricional relativamente à estabilidade, à tradução e à localização do
mRNA é muito importante para um rápido controlo da expressão génica. Este tipo de
regulação exige que se liguem ao mRNA proteínas de ligação ao RNA (RNA binding proteins
- RBPs) e microRNAs (miRNAs). A regulação pós-transcricional da via de sinalização de
Ire1/Xbp1 precisa de ser um fenómeno rápido para que o controlo de qualidade do RE não
seja comprometido. De facto, os níveis de Xbp1 spliced parecem ser rigorosamente
controlados para que as células ajustem rapidamente a sua resposta e recuperarem do stress no
RE. Apesar disto, nunca foi investigado o envolvimento dos miRNAs e RBPs no contexto da
vida de sinalização de Ire1/Xbp1, pelo que nos propusemos fazê-lo.
Com o intuito de investigar a regulação pós-transcricional de Xbp1, nós pretendemos
fazer um levantamento da expressão de miRNAs no âmbito da degeneração dos
fotorreceptores, utilizando o modelo em mosca de Retinite Pigmentosa Autossómica
Dominante (Autosomal Dominant Retinitis Pigmentosa - ADRP) que temos no laboratório.
Para tal, neste trabalho, decidimos tentar estabelecer um ensaio onde fosse possível estudar o
perfil de miRNAs no contexto da via de sinalização de Ire1/Xbp1. Tendo em conta toda a
variedade de factores envolvidos na degeneração de fotorreceptores da mosca, foi necessário
fazer alguns testes preliminares que acompanharam o desenvolvimento da degeneração da
retina induzida pela luz em moscas wt ou no nosso modelo de mosca de ADRP. Até à data,
não foi possível encontrar as condições experimentais adequadas para o ensaio pretendido: a
não degeneração dos olhos das moscas wt e a degeneração dos olhos das moscas do nosso
modelo de ADRP. Ainda assim, vamos prosseguir com este trabalho, repetindo os testes
preliminares com uma população maior e com parâmetros mais controlados. Planeamos ainda
tentar encontrar alternativas ao ensaio que estamos a desenvolver, utilizando uma estratégia
menos complexa.
Cumpre dizer que relativamente a ambos os objectivos, o trabalho aqui descrito representa
o início de um estudo que pretendemos continuar no futuro, no sentido de esclarecer qual o
modelo de co-localização de Ire1 e do mRNA de Xbp1 na célula e quais os factores
implicados na regulação pós-transcricional de Xbp1.
Palavras chave: Stress do RE, UPR, Degeneração da Retina, Xbp1, Ire1

viii
General Index
Acknowledgments ..................................................................................................................... iii
Abstract ..................................................................................................................................... iv
Resumo ....................................................................................................................................... v
General Index .......................................................................................................................... viii
Index of Figures ......................................................................................................................... x
Index of Tables .......................................................................................................................... xi
Abbreviations ........................................................................................................................... xii
1. Introduction ......................................................................................................................... 1
1.1. ER Stress and Neurodegenerative Disorders ............................................................... 1
1.2. The Unfolded Protein Response .................................................................................. 2
1.2.1. Ire1/Xbp1 signaling pathway of the UPR ............................................................. 3
1.3. Autosomal Dominant Retinitis Pigmentosa ................................................................ 4
1.3.1. Ire1/Xbp1 pathway in the degeneration of photoreceptors .............................. 4
1.3.2. Post-transcriptional regulation of IRE1/Xbp1 pathway ................................... 5
1.4. Objectives .................................................................................................................... 7
2. Materials and Methods ........................................................................................................ 8
2.1. Drosophila Melanogaster Genetics .............................................................................. 8
2.1.1. Generation of transgenic Drosophila melanogaster flies .................................. 8
2.1.2. Directed gene expression in Drosophila melanogaster ..................................... 8
2.1.3. Lines Maintenance ............................................................................................ 8
2.1.4. Crosses .............................................................................................................. 9
2.2. Microscopy .................................................................................................................. 9
2.2.1. Retinal degeneration assessment across time ................................................... 9
2.3. Molecular Biology Techniques ................................................................................... 9
2.3.1. DNA Purification from Agarose Gel ................................................................ 9

ix
2.3.2. Chemical Transformation of Competent Cells ............................................... 10
2.3.3. Restriction and Ligation Reactions ................................................................. 10
2.3.4. Purification of Plasmid DNA ......................................................................... 10
2.3.5. Molecular Cloning .......................................................................................... 10
2.3.6. Cell culture and Transfection ......................................................................... 11
2.3.7. Immunostaining .............................................................................................. 12
2.3.8. Total RNA Extraction ..................................................................................... 12
2.3.9. Reverse Transcriptase Polimerase Chain Reaction (RT-PCR) ....................... 12
3. Results and Discussion ..................................................................................................... 13
3.1. Study of Ire1 and Xbp1 mRNA localization and interaction .................................... 13
3.1.1. Ire1 fusion with fluorescent tags and cloning ................................................. 14
3.1.2. Testing for localization and functionality of cloned constructions ................ 18
3.2. Ire1/Xbp1 post-trancriptional regulation in the degerating photoreceptors .............. 23
3.2.1. Premilinary tests for microRNA profiling ...................................................... 24
4. Future Perspectives ........................................................................................................... 29
5. References ......................................................................................................................... 30
6. Attachments ...................................................................................................................... 33

x
Index of Figures
Fig. 1. The three major components of the Unfolded Protein response. 3
Fig. 2. Schematic of Xbp1-EGFP construct which serves as ER stress reporter. 5
Fig. 3. Xbp1 mRNA 3’UTR structure and conservation . 6
Fig. 4. Model for the translational pausing of XBP1unspliced mRNA and its recruitment to the ER. 7
Fig. 5. Comparison of Xbp1unspliced C-terminal sequences from Mouse, Human and Drosophila. 14
Fig. 6. Alignment between Ire1 proteins of Mouse, Drosophila and Yeast. 15
Fig. 7. Schematic of Ire1 constructs plan. 16
Fig. 8. Strategy for the fusion of mcherry to Ire1 by PCR. 16
Fig. 9. Cloning of Ire1::mcherry in pUAST. 17
Fig. 10. Schematic of the Gateway system used. 17
Fig. 11. Cloning of Ire1 in pTWG. 18
Fig. 12. Ire1 and calnexin co-localization in S2 cells. 19
Fig. 13. Ire1 and Xbp1-EGFP expression in S2 cells. 20
Fig. 14. Xbp1-EGFP splicing occurs only when it is co-transfected with one of our Ire1 constructs. 21
Fig. 15. RT-PCRs for Ire1 constructs 22
Fig. 16. Xbp1-EGFP specific band digestion with PstI. 23
Fig. 17. Retinal Degeneration assessment across time. 26
Fig. 18. Retinal Degeneration assessment across time using attB lines. 27
Fig. 19. PWIZ_attB lines hatch already with no DPP image. 27
Fig. 20. Retinal Degeneration assessment across time using attB lines with constant light. 28
Fig. 21. Examples of retinal degeneration of attB lines under constant light. 28
Attachments
Fig.1. Fig.1. Xbp1 Unspliced and Spliced forms. 33
Fig.2. Biogenesis of miRNA. 33
Fig.3. Directed gene expression in Drosophila melanogaster by the GAL4 system. 34
Fig.4. Crosses done during the master project. 35
Fig.5. Vectors used in conventional cloning. 35
Fig.6. Vectors used in Gateway cloning. 35

xi
Index of Tables
Attachments
Table 1. Lines used in pseudopupil assays 36
Table 2. Primers used for conventional cloning of Ire1::mcherry 36
Table 3. Primers utilized in the Gateway system cloning 36
Table 4. Primers utilized in RT-PCRs 37
Table 5. Retinal Degeneration assessment across time 37
Table 6. Retinal Degeneration assessment across time with attB lines 37
Table 7. Retinal Degeneration assessment across time with attB lines - constant light 38

xii
Abbreviations
µg – microgram
µL – microliter
a.a. – amino acid
ADRP – Autosomal Dominant Retinitis Pigmentosa
ATF6 – activating transcription factor 6
BiP – Immunoglobulin Binding protein
BSA – Bovine serum albumin
bZIP – basic leucine zipper
CDS – coding sequence
Cyo – Curly of Oster (dominant genetic marker)
DNA – Deoxyribonucleic acid
eIF2α – initiation factor 2 α
ER – Endoplasmic Reticulum
ERAD – ER-associated degradation
FBS – foetal bovine serum
GFP – green fluorescent protein
GMR – Glass multimer reporter
h – hour
Hac1 – Homologous to Atf/Creb1
HR2 – hydrophobic region 2 (present in Xbp1 unspliced protein)
hsc3 – heat shock cognate protein 3
Ire1 – Inositol-requiring enzyme 1
Ire1-PC – Ire1 isoform C protein
JNK – Jun N-terminal kinase
mg – milligram
min – minutes
miRNA – microRNA
mL – milliliter
mRNA – mensager ribonucleic acid
ninaE – neither inactivation nor after potential E (Rodopsin 1 gene)
ORF – open reading frame
PBS – Phosphate buffered saline
PCR – polymerase chain reaction
PEK – pancreatic eIF-2alpha kinase
pek-1 – human PERK kinase homolog

xiii
PERK – Pancreatic ER kinase (PKR)-like ER Kinase
RBPs – RNA binding proteins
Rh1 – Rhodopsin 1
RNA – ribonucleic acid
RP – Retinitis Pigmentosa
R-RNC – mRNA-ribossome-nascent chain
RT-PCR – Reverse Transcriptase Polimerase Chain Reaction
S2 cells – Schneider cells
Sb – Stubble (dominant genetic marker)
Sco – Scutoid (dominant genetic marker)
sec – seconds
TAE – Tris-acetate EDTA
Tm – temperatures of melting
TM6B – Drosophila 3rd chromosome balancer
UAS – Upstream activation sequence
UPR – Unfolded Protein Response
UTR – untranslated region
w – gene white
Xbp1 – X-box binding protein 1

1
1. Introduction
1.1. ER Stress and Neurodegenerative Disorders
Human neurodegenerative diseases constitute a major medical problem that affect
millions of people worldwide. These disorders lead to nervous system dysfunction, as a result
from the gradual and progressive loss of neural cells[1]. Consequently, they have a great
impact on the patient, the family and medical services, with repercussions in social, financial
and work life.
The proposed mechanisms of neuronal death have varied widely, puzzling scientists
and leading them to ask whether there are effects that are common to diverse diseases.
Although different neurodegenerative disorders have different etiologies and key players
throughout its progression, they may share common pathological events. Accumulating
evidence indicates that endoplasmic reticulum (ER) stress is one of the most important of
these common pathological events. ER stress is caused by the accumulation of misfolded
proteins in the ER and is observed in the symptomatic and late disease stage of many
neurodegenerative disorders[2].
In eukaryotic cells, transmembrane and secreted proteins are synthesized in the ER.
The lumen of this organelle provides an oxidative compartment where client-proteins can be
co-translationally modified, folded and maturated[3]. It is estimated that about 100mg/mL of
polypeptides are present in this compartment, a high concentration that promotes protein
aggregation [4]. To deal with this load of proteins, the ER lumen has a very complex and
dynamic network of chaperones, foldases and co-factors which prevent abnormal protein
aggregation or misfolding and thus ensure the correct folding of ER client proteins[2].
Proteins that fail to reach the native conformation even after the assistance of ER chaperones
are retrotranslocated back to the cytosol, where they undergo ubiquitination and degradation
by the proteasome, a process named ER-associated degradation (ERAD)[5]. In addition to the
function of protein synthesis, modification and folding, the ER also operates as the major
calcium intracellular store[2].
Productive folding and ERAD are important aspects of the quality control machinery
that guarantees the correct protein native conformations and the absence of protein aggregates
in the cell. However, several conditions can contribute to an imbalance between high load of
client proteins and insufficient capacity of the ER protein-folding machinery, leading to a ER
stress[6] and, in many cases, to the saturation of the proteolytic machinery of the cell[6-7].

2
Misfolded proteins not only lack their physiologic function but may also become prone to
spurious interactions with other proteins or to the formation of insoluble protein aggregates –
a pathologic symptom that has been related with many neurodegenerative disorders.
1.2.The Unfolded Protein Response
ER stress is caused by a variety of physiological and other conditions, such as
perturbations in calcium homeostasis, energy deprivation, redox changes, ischemia,
hyperhomocystinemia, viral infections and mutations that impair client protein folding[3, 7].
The unfolded protein response (UPR) is a cellular mechanism that is triggered by these stress
conditions to restore the normal functioning of the ER.
The direct consequences of the UPR are cell cycle arrest, the decrease of the protein
load that enters the ER (transient adaptation) and the increase of the capacity of the ER to
handle misfolded proteins (long-term adaptation)[3, 8]. These direct consequences are
achieved by the attenuation of client-protein synthesis and translocation into the ER, the
transcriptional activation of ER chaperones and the enhancement of the degradation of
misfolded proteins present in the ER[9]. If homeostasis cannot be reestablished, cells may die
by apoptosis as prolonged UPR activation leads to ER calcium release and pro-apoptotic
signaling[8, 10].
The UPR is initiated by transmembrane transducer(s) that sense the accumulation of
misfolded proteins in the ER. The number of such transducers has increased with evolution,
from one in Saccharomyces cerevisea (inositol-requiring enzyme 1 (Ire1)) to three in
metazoans (Ire1, pancreatic ER kinase (PKR)-like ER kinase (PERK) and activating
transcription factor 6 (ATF6)). These ER sensors are maintained in an inactive state by
binding of Immunoglobulin Binding protein (BiP), one of the key chaperones of the ER.
Upon ER stress, BiP is released from the UPR sensors to help with the folding of
accumulating misfolded proteins, allowing the activation of the UPR transducers[11].
In mammalians, after activation, PERK phosphorylates the initiation factor 2 α (eIF2α)
to attenuate protein translation and also phosphorylates NRF-2 to trigger the anti-oxidant
response[10]; ATF6 is delivered to the Golgi where it is cleaved and then goes to the nucleus
to work as a transcription factor that contributes to the increased expression of ER chaperones
[8]; and Ire1 performs the splicing of X-box binding protein 1 (Xpb1) mRNA to activate the
transcription of UPR effector genes and to activate ERAD (Fig. 1)[10, 12].

3
1.2.1. Ire1/Xbp1 signaling pathway of the UPR
Ire1 is the most conserved among the UPR transducers and it is a major regulator of
ER quality control[13]. Ire1 is a type 1 ER-resident transmembrane protein with a lumenal
domain that senses ER stress, a transmembrane domain and a cytoplasmic domain which has
both endoribonuclease and kinase activities. Under stress conditions, Ire1 becomes activated
upon oligomerization and trans-autophosphorylation of the kinase domains [8].
The Ire1 pathway was first described in yeast (S. cerevisea)[14-15]. In this organism,
once activated, Ire1 cleaves Homologous to Atf/Creb1 (Hac1) mRNA in two sites, removing
an intron from it – an unconventional splicing event which is independent of the spliceosome
[16-17]. Because this intron has the ability to block translation, only spliced Hac1 mRNA will
originate the functional transcription factor which activates downstream gene expression[18].
In metazoans, Ire1 mediates the unconventional splicing of Xbp1 mRNA (the Hac1 functional
homologue) (Fig. 1)[13]. In this case, the splicing causes a frame-shift during translation,
which introduces a new carboxyl trans-activation domain in Xbp1 protein[19] (Attachment –
Fig. 1). Spliced Xbp1 functions as a potent transcription factor for UPR-responsive genes[20].
Contrary to what happens to Hac1, both forms of Xbp1 mRNA (unspliced and spliced) are
translated but only the spliced form produces an efficient transcription factor. The
Xbp1unspliced is thought to work as negative regulator of the Xbp1spliced, promoting its
Fig. 1. The three major components of the Unfolded Protein response. PERK, Ire1 an ATF6 are inactive when
connected to BiP. Upon ER stress BiP unbinds them and they become active. PERK contributes to attenuation of
protein translation and to the antioxidant response. Cleaved ATF6 activates chaperones transcription. Ire1 leads to
Xbp1 splicing, to transcription activation of chaperones and to stimulation of ERAD (from [10]).

4
degradation[21]. In Drosophila, the mutant allele xbp1k13803
is recessive lethal, indicating that
xbp1 is an essential gene during development[9].
Both Xbp1spliced and Hac1 translocate to the nucleus where they bind to DNA by a basic
leucine zipper (bZIP) to activate the transcription of UPR target genes that code for ER
chaperones, foldases, proteins involved in ER biogenesis, ERAD proteins and other protein
folding quality control molecules[8, 22].
1.3.Autosomal Dominant Retinitis Pigmentosa
Retinitis pigmentosa (RP) defines a group of retinal neurodegenerative diseases, that
affects about 1.5 million people across the world, in which abnormalities of the
photoreceptors lead to progressive visual loss[6, 23]. The common symptoms are the
defective dark adaptation or "night blindness", followed by constriction of the peripheral
visual field and, eventually, loss of central vision late in the course of the disease. These
symptoms result from degeneration of the photoreceptors and consequent impairment of the
cone-receptor function[24]. It is estimated that about 30% of RP patients have mutations in
rhodopsin (the light sensing protein present in photoreceptors). Actually, over 120 mutations
have been identified in rhodopsin that are linked with RP and most of them cause Autosomal
Dominant RP (ADRP)[6]. Nathans and Khorana showed that several of these pathogenic
mutations fail to fold correctly[25-26].
In a Drosophila model for ADRP, flies, as humans, show late-onset retinal degeneration,
which is caused by apoptosis of the photoreceptors cells[27].The Drosophila Rhodopsin 1
(Rh-1) shows a 22% homology in amino acid (a.a.) sequence with the human rhodopsin.
Moreover, several alleles of Drosophila ninaE (gene encoding Rh-1) have both molecular and
phenotypic characteristics identical to those found in class III ADRP[28-29]. These alleles
have mutations in the transmembrane domain or in the “extracellular” portions of Rh1, which
interfere with the correct folding of the protein[28, 30].
1.3.1. Ire1/Xbp1 pathway in the degeneration of photoreceptors
In a Drosophila model of ADRP, Xbp1 splicing and activation of an ER chaperone, the
heat shock cognate protein 3 (hsc3), occur in response to ER stress caused by the
accumulation of misfolded Rhodopsin-1 and the Ire1/Xbp1 pathway has a protective role
against retinal degeneration[9]. In this study it was designed a fusion protein between Xbp1
and EGFP, in which EGFP is only in frame with Xbp1 when Ire1 mediated splicing occurs
(Fig.2). Therefore, the Xbp1-EGFP protein functions as a reporter for ER stress and for the
5
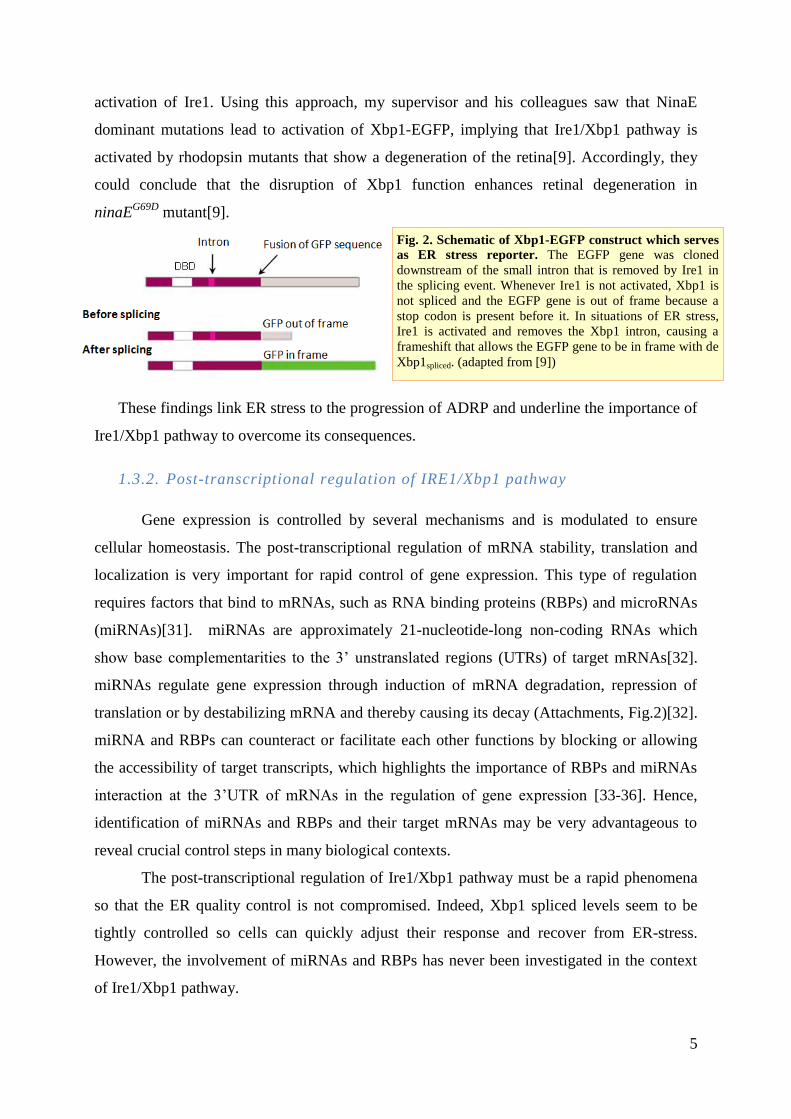
activation of Ire1. Using this approach, my supervisor and his colleagues saw that NinaE
dominant mutations lead to activation of Xbp1-EGFP, implying that Ire1/Xbp1 pathway is
activated by rhodopsin mutants that show a degeneration of the retina[9]. Accordingly, they
could conclude that the disruption of Xbp1 function enhances retinal degeneration in
ninaEG69D
mutant[9].
These findings link ER stress to the progression of ADRP and underline the importance of
Ire1/Xbp1 pathway to overcome its consequences.
1.3.2. Post-transcriptional regulation of IRE1/Xbp1 pathway
Gene expression is controlled by several mechanisms and is modulated to ensure
cellular homeostasis. The post-transcriptional regulation of mRNA stability, translation and
localization is very important for rapid control of gene expression. This type of regulation
requires factors that bind to mRNAs, such as RNA binding proteins (RBPs) and microRNAs
(miRNAs)[31]. miRNAs are approximately 21-nucleotide-long non-coding RNAs which
show base complementarities to the 3’ unstranslated regions (UTRs) of target mRNAs[32].
miRNAs regulate gene expression through induction of mRNA degradation, repression of
translation or by destabilizing mRNA and thereby causing its decay (Attachments, Fig.2)[32].
miRNA and RBPs can counteract or facilitate each other functions by blocking or allowing
the accessibility of target transcripts, which highlights the importance of RBPs and miRNAs
interaction at the 3’UTR of mRNAs in the regulation of gene expression [33-36]. Hence,
identification of miRNAs and RBPs and their target mRNAs may be very advantageous to
reveal crucial control steps in many biological contexts.
The post-transcriptional regulation of Ire1/Xbp1 pathway must be a rapid phenomena
so that the ER quality control is not compromised. Indeed, Xbp1 spliced levels seem to be
tightly controlled so cells can quickly adjust their response and recover from ER-stress.
However, the involvement of miRNAs and RBPs has never been investigated in the context
of Ire1/Xbp1 pathway.
Fig. 2. Schematic of Xbp1-EGFP construct which serves
as ER stress reporter. The EGFP gene was cloned
downstream of the small intron that is removed by Ire1 in
the splicing event. Whenever Ire1 is not activated, Xbp1 is
not spliced and the EGFP gene is out of frame because a
stop codon is present before it. In situations of ER stress,
Ire1 is activated and removes the Xbp1 intron, causing a
frameshift that allows the EGFP gene to be in frame with de
Xbp1spliced. (adapted from [9])

6
Another important aspect of the Ire1/Xbp1 pathway is the fact that, once activated,
Ire1 needs to be in contact with Xbp1 mRNA, which means that, whenever there is ER stress,
Xbp1 mRNAs should concentrate around the ER membrane, where Ire1 is localized. Aragon
et al, found that the splicing of Hac1 was significantly reduced when the 3’UTR was deleted
or replaced by a non-specific one [37]. Further investigation revealed that Hac1 3’UTR forms
a stem-loop structure, containing two short motifs (bipartite element) that are highly
conserved among all Hac1 orthologues (Fig.3) [37]. The 3’UTR bipartite element was shown
to be essential for the recruitment of Hac1 mRNA into Ire1 foci upon ER stress [37].
According to this study, whenever cells are under stress conditions, Ire1 oligomerizes and
cluster into foci localized in the ER membrane, to where Hac1 mRNA is recruited, by an
unknown mechanism that requires the 3’UTR bipartite element. The targeting of Hac1 mRNA
only occurs while it is translational repressed, since the targeting signal is inactivated when
Hac1 mRNA translation resumes (although 3’UTR bipartite element is still there)[37]. This
suggests the role of translational repression by Hac1 intron not only in facilitating an UPR
sensitive synthesis of Hac1 but also in the actual recruitment of its mRNA to vicinity of ER.
In mammalian cells, Yanagitani et al, argue that translational pausing is also required for
the targeting and splicing of Xbp1 mRNA, although in a process that is independent of the
Xbp1 3’UTR (Fig.4)[38]. Yanagitani and colleagues showed that Xbp1unspliced protein has an
hydrophobic region – hydrophobic region 2 (HR2) –, which is a membrane targeting signal,
that is responsible for the recruitment of Xbp1unspliced protein and its mRNA to the ER
membrane[39]. This hydrophobic region is present in Homo sapiens, Danio rerio, Xenopus
tropicalis and Drosophila melanogaster. In addition, Xbp1unspliced contains a C-terminal 26-
a.a. region, evolutionary conserved, that is required to the translational pausing of
Fig. 3. Xbp1 mRNA 3’UTR structure and conservation A. Schematic of 3’UTR stem loop with the Bipartite
element shown in expanded view to the right. The two red motifs are in the same region in opposite strands,
constituting a Bipartite Element. Positional numbering is from UGA stop codon B. Alignment of the 3’ BE in HAC1
orthologues (Saccharomyces cerevisiae, Aspergillus nidulans, Coccidioides posadasii, Gibberella zeae, Candida glabrata,
Magnaporthea grisea, Neurospora crassa, Kluyveromyces lactis). BE- bipartite Element. From[37]

7
Xbp1unspliced, to allow sufficient time for HR2 to target R-RNC complex to the ER[38]. In this
model, translation of Xbp1unspliced mRNA is paused just before translation termination, when
HR2 is exposed outside of the ribosome tunnel to drag R-RNC complex to the ER membrane
(Fig.4)[38]. The amino acids required for this pausing are likely buried inside the ribosome
tunnel at this stage.
Yanagitani et al hypothesis leaves aside the role of 3’UTR claimed by Aragon et al.
Nevertheless, the two studies were done with different strategies since the first was done in S.
cerevisea organism, using live microscopy, and the second was realized in cell culture and in
vitro, utilizing mainly a biochemical assay in which the Xbp1 mRNA is detected (or not) in a
membrane-rich fraction (ER membrane) or a cytoplasmic fraction.
In Drosophila, regulation of Ire1/Xbp1 pathway has not been explored so far and the
parties involved in gene expression control and in the gathering of Ire1 and Xbp1 mRNA still
need to be revealed. Since Drosophila is an organism that is evolutionary between yeast and
mammalians, it would be interesting to explore how these processes occur in Drosophila and
try to understand its relation with other organisms. And even more important, clarification of
Ire1/Xbp1 pathway regulation could provide the development of new therapeutic approaches
for the prevention of many neurodegenerative disorders associated with ER stress, particularly
of ADRP.
1.4.Objectives
The aim of this project is to investigate the regulation of the Ire1/Xbp1 in the UPR, more
specifically to try to understand what are the requirements for the targeting of Xbp1 mRNA to
the ER membrane and to assess if there is an involvement of miRNAs or RBPs in the
regulation of Xbp1 gene expression. To address that purpose several tasks were carried out.
The work reported here is the starting point for the investigation we want to pursue in the
future and, therefore, has as main objectives:
Fig. 4. Model for the translational pausing of XBP1unspliced mRNA and its recruitment to the ER. HR2-
hydrophobic region 2. From [38]

8
- The cloning of Ire1 fused with a tag in a Drosophila expression vector so that Ire1 can
be visualized together with Xbp1 mRNA in live microscopy;
- The evaluation of expression, localization and functionality of cloned constructs by
doing transfections of Drosophila Schneider cells (S2), imaging and Reverse
Transcriptase Polimerase Chain Reactions (RT-PCRs);
- The establishment of an assay to analyze miRNA expression in the context of
Ire1/Xbp1 pathway.
2. Materials and Methods
2.1. Drosophila Melanogaster Genetics
2.1.1. Generation of transgenic Drosophila melanogaster flies
All the transgene lines used in this project were inserted into pUAST (to random
insertions) or pUAST-AttB vectors (for site-specific insertions). The plasmids were then
injected into the fly embryos by BestGeneInc (U.S.A). pUAST-AttB vectors enable the using
of øC31 system which allows the insertion of the transgenes in a specific site of the acceptor
fly genome[40]. The øC31 system guarantees that all transgenes integrated in the same site
will have the same level of transcription and, supposedly, the same level of expression.
2.1.2. Directed gene expression in Drosophila melanogaster
All transgenic flies used in the project are based on a directed gene expression method –
the gal4 system. This system was adapted from a yeast transcriptional mechanism and allows
the separation of the target gene from its transcriptional activator in two distinct transgenic
lines. There are fly lines in which the yeast transcriptional activator GAL4 expression is
derived from different genomic enhancers[41]. A GAL4-dependent target gene can be
constructed by subcloning any sequence next to the GAL4 binding sites – the UAS sites – in
another line. The target gene is silent in the absence of GAL4. To activate the target gene,
flies carrying the UAS-Gene are crossed to flies expressing GAL4[41]. In the progeny of this
cross, UAS-Gene will be activated in cells where GAL4 is expressed (Attachments, Fig.3).
In this project we utilized GMR-Gal4 (expression in the developing eye), Rh1-Gal4
expression in photoreceptors in the pupal and adult stages) and Actin5C-Gal4 (ubiquitously
expression) enhancers.
2.1.3. Lines Maintenance

9
All flies were kept at 25°C in 70% of humidity in vials with food made from corn flour,
sugar, molasses, agar and 10% Nipagin (in ethanol) , exposed to a 12h light/12h dark cycle.
2.1.4. Crosses
Crosses done in this work will be briefly explained here (details -Attachments, Fig. 4).
i) Crosses to the eye degeneration assessment across time
- Rh1Gal4;UASGFPninac
/(cyo);Sb/TM6B was crossed with the lines:
w-;Sco/Cyo;UASninaEG69D
/(TM6B) , w-;Sco/Cyo;UASninaEG69D68A4
/(TM6B) and
w-;Sco/Cyo;UASninaEWT68A4
/(TM6B) to obtain:
Rh1Gal4;UASGFPninac
/(cyo);UASninaEG69D
/(TM6B)
Rh1Gal4;UASGFPninac
/(cyo);UASninaEwt68A4
/(TM6B)
Rh1Gal4;UASGFPninac
/(cyo);UASninaEG69D68A4
/(TM6B)
- w;Sco/Cyo;pWIZ /TM6B was crossed with the lines:
Rh1Gal4;UASGFPninac
/(cyo);UASninaEG69D68A4
/(TM6B)
Rh1Gal4;UASGFPninac
/(cyo);UASninaEWT68A4
/(TM6B) to obtain flies without eye pigment:
Rh1Gal4;UASGFPninac
/(cyo);UASninaEwt68A4
/Pwiz
Rh1Gal4;UASGFPninac
/(cyo);UASninaEG69D68A4
/Pwiz
2.2. Microscopy
2.2.1. Retinal degeneration assessment across time
This method consists in the evaluation of the deep pseudopupil (DPP) image – a marker of
eye integrity[42] – in the fly eyes throughout time to stipulate the state of photoreceptors
degeneration. 10 flies per vial were kept at 25ºC in a light intensity around 2000 lux. Light
cycle of the firsts experiments was 12h light/12h dark and was then changed to a constant
light regime. For this assessment fly eyes were analyzed every 3 to 4 days. A fly was
considered to have degenerated eyes when at least one of the two eyes had lost the
pseudopupil image. The number of flies with degenerated eyes per number of flies alive per
line was counted until there were no flies alive (used lines – Attachments, Table 1). The total
number of flies of each line was different between the assays but the same within each assay.
2.3.Molecular Biology Techniques
Commercial products and kits were used according to manufacturer's instructions.
2.3.1. DNA Purification from Agarose Gel
DNA purification was done using gels of 0,8% agarose (SeaKem LE, Lonza) run in TAE
buffer 1X (Tris-acetate 0,04M, EDTA 0,001M; Lonza). Size of DNA fragments was

10
estimated by comparison with the molecular marker NZYDNA Ladder III (NZYTech). DNA
was extracted from gel using the ZymoCleanTM
Gel DNA Recovery Kit (Zymo Research).
2.3.2. Chemical Transformation of Competent Cells
The strain E. Clone 10G (Lucigen) was used in every transformations except for
propagating vectors containing the ccdB gene, in which cases transformations were done with
DB3.1™ (Invitrogen) competent cells. Ligation mixture or plasmid DNA was added to 100µl
of competent cells. After 1h of incubation on ice cells were subjected a heat shock at 42ºC for
1:30 min. Then cells were again put on ice for 1-2 minutes and, followed the addition of 800
µl of LB medium (Scharlau), they were incubated at 37ºC with agitation for 1h. Finally, cells
were plated on LA plates supplemented with the specific antibiotic for posterior selection.
2.3.3. Restriction and Ligation Reactions
Restriction reactions were incubated overnight at 37°C. The enzymes BglI, BglII, Acc65I,
EcoRV, PstI, DnaseI (New England Biolabs) were utilized with the appropriate buffers.
Ligation reactions were performed using T4 DNA ligase (New England Biolabs) and
incubated overnight at 18°C. The ratio between the insert and the vector used was 3:1(in µg).
2.3.4. Purification of Plasmid DNA
In the purification of plasmid DNA on a small scale, it was used the kit NZYMiniprep
(NZYTech). In large scale purifications it was used the kit NZYMidiprep (NZYTech).
2.3.5. Molecular Cloning
Conventional cloning
Ire1 was fused with a mcherry tag between the Ire1 residues G394 and S395. Primers
were designed to fuse these two proteins by PCR and to flank the final fused DNA fragment
with BglII and Acc65I restriction sites (Attachments, Table 2). Ire1I (N-terminal part), Ire1II
(C-terminal part) and mcherry were amplified by PCR, from pUAST_IRE1-PC and from
pUAST_nlsmcherry, using those primers. For PCRs it was utilized the PhusionTM
High-
Fidelity DNA polymerase (Finnzymes), which has a proof-reading activity, to create
homology zones between the 3 DNA fragments, using the following conditions: initial
denaturation step (3min at 98ºC), followed by 32 cycles of denaturation (15sec at 98ºC),
annealing (30sec at temperature of melting (Tm)) and elongation (72ºC – for times see
Attachments, Table 2) and lastly by a final elongation step (10min at 72ºC). Then they were
gel purified and fused by PCR with the same polymerase, using the forward primer for Ire1 I
and the reverse primer for Ire1 II and the above conditions (Tm- 60ºC, elongantion time-

11
2min). After, Ire1::mcherry was gel purified and cloned into an intermediate vector – pJET
(Attachments, Fig.5-A) – utilizing Clone JET PCR Cloning kit (Fermentas). Finally,
Ire1::mcherry was separated from pJET by restriction digestion with BglII and Acc65I and
cloned into pUAST (Attachments, Fig.5-B) that was also digested with these two enzymes.
Cloning was confirmed by PCRs, by restriction digestion and by sequencing (STABVIDA).
Gateway®
system
Ire1 was fused with a GFP tag in the C-terminal. Primers with attB sites were designed
for Ire1 gene (Attachments, Table 3), excluding the stop codon. Ire1 was amplified from
pUAST_IRE1-PC by PCR using those primers and PhusionTM
High-Fidelity DNA
polymerase (Finnzymes), with the following conditions: initial denaturation step (1min at
98ºC), followed by 28 cycles of denaturation (10sec at 98ºC), annealing (30sec at 50ºC) and
elongation (2min at 72ºC) and lastly by a final elongation step (10min at 72ºC). Then Ire1 was
gel purified and cloned into the pDONRTM
221 (Invitrogen - Attachments, Fig.6-A) using the
Gateway® BP ClonaseTM
II Enzyme Mix kit (Invitrogen), by recombination between attB
sites from Ire1 fragment and attP sites present in the vector. Next Ire1 was transferred from
pDONRTM
22 to pTWG (pUAST_White+_GFPC-terminal - Attachments, Fig.6-B), using the
Gateway® LR ClonaseTM
II Enzyme Mix kit (Invitrogen), by recombination between attL and
attR sites (Results and Discussion for details in Gateway®
technology). Cloning was
confirmed by PCRs and by sequencing (STABVIDA).
2.3.6. Cell culture and Transfection
Schneider 2 (S2) cells were and cultured in Schneider’s Drosophila Medium (Gibco®
)
containing 10% heat-inactivated foetal bovine serum (FBS - Gibco®) and supplemented with
50U/mL penicillin and 50µg/mL streptomycin antibiotics. Cells were maintained at 25ºC with
no CO2 and passed at a cell density between 6 to 20x106 cells/mL, splitting at a 1:2 to 1:5
dilution.
Cell transfections were performed using the Effectene (Qiagen) transfection reagent. The
day before transfection, 3x10⁵ cells per well (in a 12 well plate) were seeded on 1mL of
growth medium containing serum and antibiotics and were then incubated overnight at normal
growth conditions. Cells to be used in immunostaining were seeded on a cover glass inside
the well. On the day of transfections, for each of them, 0,3µg of each plasmid was diluted in
the DNA-condensation buffer (Qiagen) to a total volume of 75μl, to which was added 2,4μl of
Enhancer (Qiagen) per plasmid. Next, an incubation of 5min at room temperature was done,
followed by the addition of 3 of transfection reagent Effectene (Qiagen) per plasmid. Then the

12
mixture was incubated for 10min at room temperature. Meanwhile, cell medium was
aspirated, cells were washed with 1mL of PBS 1X and added 1mL of new medium. Then,
125μl of medium was added to the tube containing the transfection complexes. After mixing
well, all the volume was added drop-wise onto the cells in each well. To conclude, cells were
incubated at normal conditions for 72h for expression of the transfected transgenes.
Following the expression of 72h, cells in a cover glass were fixed by adding 200µl of 4%
formaldehyde in 1X PBS (Phosphate buffered saline) and incubating with that for 15min.
Next the 200µl were pipeted off and cells were washed with 1X PBS, 3 times for 5min each.
For samples not to be immunostained, cells were immediately mounted on a slide.
2.3.7. Immunostaining
Fixed an washed cells had 1h of incubation with blocking buffer (1X PBS, 0,1% Bovine
serum albumin (BSA), 0,1% Tween 20, 250mM NaCl). Then 200µl of rabit calnexin primary
antibody[43], diluted at 1:400 in blocking buffer, was added to cells and incubated overnight
at 4ºC. On the second day, cells were again washed 3 times, as before and were incubated
with anti-rabit secondary antibody (Jakson ImmunoResearch), diluted at 1:200 in blocking
buffer, for 2h at room temperature. Cells were washed again 3 times and mounted on a slide.
2.3.8. Total RNA Extraction
RNA extraction was done using the RNeasy® Mini Kit (Qiagen) and performing a
column DNA digestion step with DnaseI (Promega). There were utilized samples of non
transfected S2 cells (control) and of S2 cells transfected with the reagents: ActinGAL4 +
pTWG_Ire1 + pUAST_Xbp1-EGFP; ActinGAL4 + pUAST_Ire1::mcherry + pUAST_Xbp1-
EGFP and ActinGAL4 + pUAST_Xbp1-EGFP.
2.3.9. Reverse Transcriptase Polimerase Chain Reaction (RT -PCR)
The purified total RNA was used to synthesize the first strand of cDNA with the
RevertAidTM
H Minus First Strand cDNA Synthesis Kit (Fermentas). It was done a negative
control for each sample (with no reverse transcriptase enzyme). PCR amplification of first
cDNA strand was done using 2µl of first strand cDNA synthesis reaction mixture as template.
It was utilized the NZYTaq DNA polymerase (NZYTech) at standard PCR conditions. To
amplify Ire1::GFP, Ire1:.mcherry and Xbp1-EGFP it was realized (for primers, Tms and
elongation times- Attachments, Table 4): initial denaturation step (5min at 95ºC), followed by
32 cycles of denaturation (30sec at 95ºC), annealing (30sec at Tm) and elongation (elongation
time at 72ºC) and lastly by a final elongation step (5min at 72ºC).

13
3. Results and Discussion
3.1. Study of Ire1 and Xbp1 mRNA localization and interaction
The Xbp1 mRNA splicing mediated by Ire1 is a crucial step in the regulation of the
Ire1/Xbp1 pathway. This splicing reaction differs significantly from conventional mRNA
splicing, as it is believed to occur in the cytoplasm, in the absence of the nuclear splicing
machinery [44]. Thus, the features that underlie this event are necessarily different from
nuclear splicing and yet poorly understood. Given that Ire1 is localized at the ER membrane,
it is assumed that Xbp1 mRNA splicing occurs in the cytoplasm, near the ER membrane. For
that to happen, Xbp1 mRNA must be targeted to the vicinity of ER membrane by some
means. The role of Xbp1 mRNA 3’UTR has not been explored in Drosophila and can actually
be important in Xbp1 mRNA targeting to the ER/Ire1. The HR2 region exists in Drosophila
Xbp1unspliced, although its functionality has not been proven.
Concerning the importance of 3’UTR in the recruitment of Xbp1 to the ER, we searched
in Drosophila Xbp1unspliced 3’UTR sequence and identified one UGGCG and two GCGA
regions that could represent an evolutionary change of the UGGCGCG and GCGAC regions
of the yeast Hac1 bipartite element. However, these regions in Drosophila Xbp1unspliced
3’UTR are around 150bp and 190 bp apart from each other and may not be able to form a
bipartite element as Hac1 3’UTR motifs do. However, it is also possible that Drosophila
Xbp1unspliced 3’UTR has another targeting element responsible for its recruitment to the ER.
So, further studies on 3’UTR secondary structure and its importance in Xbp1-Ire1 co-
localization are needed to analyze this question.
Regarding the Yanagitani et al model (Fig.4), we decided to examine the C-terminal 26-
a.a. region which was shown to be responsible for the translational pausing of Xbp1unspliced in
mammals. The alignment between C-terminal 26-a.a. region of mouse, human and fly
Xbp1unspliced (Fig.5) demonstrates that there is not much similarity between the first two and
the last. Fig. 5 shows that there was an evolutionary change in the C-terminal of Xbp1unspliced
protein between invertebrates and vertebrates since only five of the 15 a.a. that are conserved
in human, mouse, chicken, frog and zebrafish ([38] and Fig.5-black arrows) are also
conserved in Drosophila (Fig.5-green arrows). Interestingly, Yanaginati et al showed that the
S255 to A255 mutation of human Xbp1unspliced increased translational pausing [38] and, as
observed in Fig.5, there is an A297 (homologous position) in the Drosophila sequence
(Fig.5-red arrow). This finding leads us to ask whether Xbp1unspliced A297 could increase

14
translation pausing in Drosophila, even though fly Xbp1unspliced C-terminal is considerably
different from the conserved region identified by Yanaginati et al. In addition, the presence of
the HR2 region in Drosophila Xbp1unspliced lead us to not set aside the hypothesis that
translation pausing is also important in Drosophila.
3.1.1. Ire1 fusion with fluorescent tags and cloning
To investigate how Ire1 and Xbp1 mRNA co-localize in Drosophila in vivo, using live
microscopy, we decided to create Ire1 protein and Xbp1mRNA linked with fluorescent tags.
This project reports the development of the Ire1 constructs.
As explained before, Ire1 protein has three topological domains: the luminal domain, the
transmembrane domain and the cytoplasmic domain. The last one, in its turn, is constituted by
two functional domains which have, from N-terminal to C-terminal, kinase and
endoribonuclease activities, that are conserved from yeast to fly and mouse (Fig.6).
In such a complex protein it is possible that incorporating a tag in it will interfere with its
folding or function. Thus, we chose to insert a tag in two different positions within Ire1, using
two different strategies. One construct was done inserting a mcherry tag in the middle of Ire1
gene, between the transmembrane and the kinase domains (between G394 and S395 residues,
Fig.7-A). The second construct was done by inserting a GFP tag after the Ire1 C-terminus
(Fig.7-B). In the first case (Fig.7-A), mcherry was fused with Ire1 by PCR. On the first
generation of PCRs the N-terminal part of Ire1 (Ire1 I), the mcherry tag (without the Stop
codon) and the C-terminal part of Ire1 (Ire1 II) were amplified using primers that allowed the
addition of homology zones between these three DNA fragments (Fig.8). Then, a second
generation of PCR was done using the gel-purified first generation PCR products Ire1 I,
mcherry and Ire1 II with the forward and reverse primers for Ire1 gene to generate a single
DNA fragment (Fig.8).
Fig. 5. Comparison of Xbp1unspliced C-terminal sequences from Mouse, Human and Drosophila. Boxes (blue for
vertebrates and yellow for fly) represent the 26-a.a. conserved sequence suggested to be important for translational
pausing by Yanagitani et al. Black arrows point a.a. that are conserved in Human, Mouse, Chicken, Frog and Zebrafish
according to Yanagitani et al. Of these a.a., green arrows point the ones that are also conserved in Drosophila. Red
arrow represents a S to A difference that may augment the translational pausing according to Yanagitani et al.* marks
for translation termination.

15
.
Fig. 6. Alignment between Ire1 proteins of Mouse, Drosophila and Yeast. Red boxes- transmembrane domains,
green boxes- kinase domains, yellow boxes- endoribonuclease domains.

16
Ire1 I and Ire1 II were amplified using as template the plasmid pUAST_Ire1-PC. This
vector contains the sequence encoding for Ire1 isoform C protein (Ire1-PC), which had been
already cloned in the lab from larvae cDNA. In the cloned sequence of Ire1-PC there are two
non-synonymous substitutions comparing to the Flybase sequence: CAG instead of CAC
(Q137 instead of H137) and AGC instead of ATC (S953 instead of I953). Ire1-PC was
proven to induce the splicing of the reporter Xbp1-EGFP and to rescue the Ire1f02170
mutant
phenotype (data not shown, Dina Coelho unpublished). Ire1f02170
mutation is a P element
insertion in the Ire1 coding sequence (CDS) so its protein is not functional and cannot
perform the splicing of Xbp1-EGFP reporter (data not shown). Thus, we believe that the
differences that exist in Ire1-PC correspond to natural polymorphisms and that the cloned
Ire1-PC is functional in the cell.
Ire1 I, mcherry and Ire1 II were amplified with primers CH1 and C2, C-3 and C-4 and C-5
and CH6, respectively (Fig.9-A (primers -Attachments, Table 3)). After purification, Ire1 I,
mcherry and Ire1 II served as template for the second PCR, in which the primers CH1 and
CH6 were used, to create Ire1::mcherry (Fig.9-B (primers -Attachments, Table 3)). Then
Ire1::mcherry was cloned in pJET (Fig.9-C) and subcloned into pUAST in the orientation
from BglII site to Acc65I site (Fig.9-D). Sequencing proved that Ire1::mcherry was present in
pUAST and showed that there were no errors in both sequences of Ire1 (comparing with
pUAST_Ire1-PC from which it was amplified) and mcherry.
In the cloning of second construct (Fig.7-B), a GFP tag was fused with Ire1 C-terminal
using the Gateway system (Fig.10). Ire1 was amplified again from pUAST_Ire1-PC using
primers that were designed not to include the stop codon and also to insert attB sites in each
end of the gene (Fig. 11-A (primers-Attachments, Table 4)). Then Ire1 flanked with attB sites
Fig. 7. Schematic of Ire1 constructs plan. A. mcherry
tag was inserted between the transmembrane and the
kinase domain. B. GFP tag was inserted in the C-
terminal. S- sensing stress luminal domain and
transmembrane domain; K- Kinase domain; R-
endoRibonuclease domain and C-terminal of Ire1. Red
circle-mcherry tag; green circle-GFP tag
Fig. 8. Strategy for the fusion of
mcherry to Ire1 by PCR. On the first
generation of PCRs, it was created
homology zones between Ire1 I, Ire1 II
and mcherry with the different primers.
On the second generation of PCR, these
three DNA fragments were used as a
template to create Ire1::mcherry. Red –
mcherry sequences; Black – Ire1
sequences

17
was cloned into pDONR221 (Fig.11-B) and subcloned to pTWG (Fig.11-C). pTWG is a
destination vector that has a GFP tag to make C-terminal fusions, upon recombination. The
presence of Ire1 in the positive clones was confirmed by PCRs (Fig.11-D). Sequencing of
pTWG showed there were no errors in Ire1 sequence comparing with pUAST_Ire1-PC and
that it was in frame with GFP tag.
Fig. 9. Cloning of Ire1::mcherry in pUAST. A. Ire1 I, Ire1 II and mcherry fragments after first generation of
PCRs B. Ire1::mcherry fused by a second generation of PCR C. Digestion of plasmid DNA from colonies
transformed with ligation mixture of pJET + Ire1::mcherry with Acc65I and BglII. Colonies 2, 4 and 9 are
positive for the presence of pJET_Ire1::mcherry. We pursued with the cloning in pUAST using colony 2 D.
Digestion of plasmid DNA from colonies transformed with ligation mixture of pUAST + Ire1::mcherry with
Acc65I and BglII. Colonies 1, 2, 4, 6, 7 and 8 are positive for the presence of pUAST_Ire1::mcherry. We pursued
with colony number 2 in our investigation. Col.- colony; D- digested with Acc65I and BglII; ND- non digested.
Fig. 10. Schematic of the Gateway system used. The Gateway system allows cloning of any DNA fragment into any expression
vector by recombination. First, a gene of interest flanked with attB sites is cloned into a donor vector which has attP sites, by
recombination (BP reaction). This recombination is done in vitro by the BP ClonaseTM. The recombination products are an entry clone
(donor vector + gene cloned) in which the cloned gene is flanked with attL sites and a by-product (the ccdB gene) flanked with attR sites.
Colonies with plasmid in which recombination did not occur dye due to the effect of the ccdB gene present in the donor vector, so there
is no need to do a posterior selection of the clones. Then, from an entry clone, the gene of interest can be subcloned to any destination
vector (for expression in any organism) by means of LR ClonaseTM, which performs a recombination between attL sites from an entry
clone and attR sites present in a destination vector (LR reaction). The result of this is an expression clone with the gene flanked with attB
and a by-product vector with the ccdB gene flanked with attP sites. Again only the expression clone will allow the formation of colonies
because of the lethality of the ccdB gene. All recombinations are reversible using the other Clonase, thus a gene can rapidly be moved
from an entry clone to destination vector or from an expression clone to a donor vector (from Invitrogen Gateway manual)

18
3.1.2. Testing for localization and functionality of cloned constructions
After cloning the 2 tagged Ire1 constructs in UAST vectors, we needed to prove whether
our constructs were functional. For that purpose we transfected S2 cells with our constructs to
see where they localized in the cell and to check if they were able to perform the Xbp1-EGFP
reporter splicing. All transfections were done in duplicates with an expression time of 72h. As
all transfected transgenes were cloned in UAST plasmids, they were co-transfected with
ActinGAL4 to induce expression in S2 cells.
To investigate Ire1::GFP and Ire1::mcherry localization in cells we transfected S2 cells
with Ire1::GFP and with Ire1::mcherry and did immunostaining using anti-Drosophila
Calnexin antibody[43]. Calnexin is an ER transmembrane lectin chaperone which is involved
in the folding of glycoproteins[45]. As Ire1 is also an ER transmembrane protein, we used
calnexin antibody as an ER marker to verify if our constructs were localizing in the right
place in the cell. In Fig.12 we can observe that both Ire1::GFP and Ire1::mcherry have the
same pattern of localization as Calnexin, meaning tags are not interfering with the right
positioning of Ire1 in cells – the ER.
Fig. 11. Cloning of Ire1 in pTWG. A. Ire1 with attB sites after PCR B. Digestion of plasmid DNA from colonies
transformed with BP reaction with EcoRV to linearize the entry clone. Colonies 1, 2, 4, 5 and 6 are positive for the
presence of pDONR221_Ire1. We pursued with the cloning in pTWG using colony 1 C. Digestion of plasmid
DNA from colonies transformed LR reaction with EcoRV and BglI. Colonies 1, 2, and 5 are positive for the
presence of pTWG_Ire1. We pursued with colony number 1 in our investigation. D. PCRs for Ire1 gene confirmed
its presence in the plasmid pTWG. Col.- colony; D- digested; ND- non digested

19
Regarding the functionality of the constructs, we wanted to verify if Ire1::GFP and
Ire1::mcherry were able to do the Xbp1-EGFP reporter splicing (Fig.2). To that end, S2 cells
were transfected with Ire1::GFP + Xbp1-EGFP, with Ire1::mcherry + Xbp1-EGFP and only
with Xbp1-EGFP (negative control). Previous experiments done in our lab led to the
conclusion that the over-expression of Ire1, both in S2 cells and in the fly, was sufficient to
provoke the Xbp1-EGFP reporter splicing, even in the absence of induced ER stress (data not
shown). Accordingly, we expected that only the in the cells transfected with our Ire1
transgenes should be possible to see the splicing of the Xbp1-EGFP reporter.
As observed in Fig.13, both constructs are able to splice the Xbp1-EGFP reporter. In
Fig.13-A, Ire1::mcherry shows the same pattern of localization as in Fig.12-B, in the
perinuclear and cytosolic space, and the spliced Xbp1-EGFP is localizing in the nucleus of the
cell, as it was expected (because Xbp1-EGFP has a nuclear localization signal). Looking at
Fig.13-B it is impossible to be sure of the presence or the exact localization of each of the
transfected transgenes because both have GFP tags. Nevertheless, comparing Fig.13-B with
Fig.12-A and Fig.13-A, we can infer that both Ire1::GFP and Xbp1-EGFP spliced are
localizing in the correct place in the cell, ER and nucleus, respectively. Also, the fact that we
Fig. 12. Ire1 and calnexin co-localization in S2 cells A. Expression of Ire1::GFP and immunostaining for
calnexin show the same pattern. B. Expression of Ire1::mcherry and immunostaining for calnexin show also the
same pattern.

20
have seen cells in which there was only the presence of Ire1::GFP (supposedly due to
transfection of Ire1::GFP only) that coincided with the pattern seen in Fig.12-A make us be
confident about the presence of Xbp1-EGFP in the nucleus of the cells seen in Fig.13-B.
Analyzing Fig.13 we can deduce that Ire1::mcherry and Ire1::GFP are present in the cells
and that Xbp1-EGFP reporter is being spliced. Still, we cannot be certain that the splicing is
being done by our constructs rather than by endogenous Ire1. One of the experiments to be
done to be sure that our constructs, and not endogenous Ire1, are performing the splicing of
Xbp1-EGFP reporter is to do a negative control experiment (the transfection of the Xbp1-
EGFP alone). In our negative control we cannot observe any GFP (Fig.14-B), indicating that
the Xbp1-EGFP splicing only occur in cells transfected with our Ire1 transgenes (Fig.13 and
Fig.14-A). However, there is also the possibility that over-expression of our constructs
somehow induce ER stress in cells and leads to the activation of the endogenous Ire1 that
splices the Xbp1-EGFP reporter. To exclude this possibility an Ire1 mutant rescue experiment
in fly is essential (see Future Perspectives). Nevertheless, these results suggest that both our
Ire1 constructs are being expressed and that they are functionally active.
Fig. 13. Ire1 and Xbp1-EGFP expression in
S2 cells. A. Ire1::mcherry and Xbp1-EGFP
co-expression. Ire1::mcherry seems to be able
to perform the splicing of the Xbp1 reporter.
B. Ire1::GFP and Xbp1-EGFP co-expression.
Ire1::GFP seems to be able to perform the
splicing of the Xbp1 reporter.

21
In addition to microscopy imaging, we did RT-PCRs to confirm the above results. We
made RT-PCRs for both our Ire1 constructs and for Xbp1-EGFP, using always one primer
specific for the tags (Attachments, Table 4), ensuring that we were targeting only the
transfected transgenes and not the endogenous genes. All RT-PCRs were done with negative
controls (using no reverse transcriptase enzyme) to detect DNA contamination. We could
amplify all our targets although we had DNA contaminations (Fig.15). The DNA digestion on
column during RNA extraction was not sufficient to eliminate all the DNA from our RNA
samples. Subsequent to doing these RT-PCRs (Fig.15), extra DnaseI digestions were done to
clean the RNA samples, resulting in partial degradation of RNAs that prevent us to further
analyze them (data not shown). Thus, we considered only our initial RT-PCRs results.
In Fig.15-A, we can observe that Ire1::GFP was amplified only in the sample transfected
with Ire1::GFP + Xbp1-EGFP (Fig.15-B-1, black arrow) and in the negative control of that
same sample (Fig.15-B-1). Fig.15-C shows that RT-PCRs for Ire1::mcherry only amplified it
in the sample transfected with Ire1::mcherry + Xbp1-EGFP (Fig.15-C-2, black arrow) and in
the negative control of that same sample (Fig.15-C-2-). Consistently, for both Ire1 constructs,
there is more intensity in the band of the samples in which it was used reverse transcriptase
Fig. 14. Xbp1-EGFP splicing occurs only when it is co-transfected with one of our Ire1 constructs. A. Cells
transfected with Ire1::mcherry and Xbp1-EGFP. It is possible to see GFP, which means that Xbp1-EGFP splicing
occurred. B. Cells transfected only with Xbp1-EGFP. It seems that splicing of Xbp1-EGFP did not occur in any cell.

22
enzyme than in the negative controls, suggesting Ire1::GFP and Ire1::mcherry were being
expressed by the cells transfected with them.
After looking at the expression of the Ire1trangenes we also wanted to confirm if the
Xbp1-EGFP reporter was being spliced in the S2 cells transfected with Ire1::GFP and
Ire1::mcherry. We performed the RT-PCRs for Xbp1-EGFP and verified that it was present in
all the samples except for the non transfected S2 cells samples (positive and negative for RT
enzyme), meaning there was DNA contamination in our negative control samples (with no RT
enzyme). As Xbp1 unspliced and spliced forms differ only in 23 nucleotides it was not
possible to interpret if there was splicing of the reporter just by doing the RT-PCR for Xbp1-
EGFP. With the set of primers we used (Attachments, Table 4), the specific Xbp1-EGFP
product has two PstI restriction sites: one in the intron (if present) and the other one 26
nucleotides before the “C-terminal” of the amplified PCR product (Fig.16- Restriction Map).
Therefore, by doing PstI digestion, the unspliced form is digested in two sites, resulting in two
visible bands (because the 26 nucleotide band is not visible on an agarose gel) and the spliced
form is only digested in one site and results in one visible band (Fig.16- Restriction Map). So,
we gel purified the specific band for Xbp1-EGFP in our RT-PCRs and digested them with
PstI. The result observed in Fig.16 suggests that there was splicing in the cells transfected
with the reporter and the Ire1 constructs (Fig.16-white arrows) but not in the cells transfected
only with the reporter, which is consistent with our imaging results. The samples from RT-
PCRs negative controls (with no RT enzyme) here served as a control for the digestion
efficiency, as genomic or plasmid Xbp1 has always the intron and, thus, should originate two
bands. Once there was total digestion of RT-PCRs negative controls we can assume that the
bands we see for samples 1 and 2 (Fig.16-white arrows) do not represent any undigested
DNA.
Fig. 15. RT-PCRs for Ire1 constructs A. RT-
PCRs for Ire1::GFP B. RT-PCRs for
Ire1::mcherry. Templates: 1 – S2 cells transfected
with Ire1::GFP and Xbp1-EGFP; 2 – S2 cells
transfected with Ire1::mcherry and Xbp1-EGFP; 3 – S2
cells transfected with Xbp1-EGFP; 4 – S2 cells non
transfected (control); 1- – negative control of S2 cells
transfected with Ire1::GFP and Xbp1-EGFP (no RT
enzyme); 2- – negative control S2 cells transfected with
Ire1::mcherry and Xbp1-EGFP (no RT enzyme); 3- –
negative control of S2 cells transfected with Xbp1-
EGFP (no RT enzyme); 4- – negative control of S2 cells
non transfected (no RT enzyme). Arrows – band
corresponding to the Ire1 construct we wanted to
amplify

23
Obviously, these results do not prove by themselves the expression of the transfected
constructs because they contain DNA contamination and unspecific PCR products. But,
taking the microscopy imaging and the RT-PCRs results together, they corroborate one
another, suggesting that S2 cells are expressing the transfected genes and that our Ire1
constructs are localizing correctly and are also functionally active. Nevertheless, repeating
these experiments and doing simultaneously a western bolt for the transfected constructs
would be necessary to take unambiguous conclusions and be certain about the Ire1::GFP,
Ire1::mcherry and Xbp1-EGFP expression, as well as the Xbp1-EGFP splicing by Ire1.
3.2. Ire1/Xbp1 post-trancriptional regulation in the degerating photoreceptors
As already mentioned, miRNAs are important players in the post-transcriptional
regulation of gene expression. Despite the identification of hundreds of miRNAs, the
biological functions of most of them are poorly understood[46]. Though, it is known that
miRNAs are important regulators during neuronal development[47]. In fact, recent findings
link miRNAs with neurodegenerative diseases and cancer[46]. It has been shown that
mammalian miRNA expression vary in a developmental- or tissue-specific manner, and that,
in the case of the mouse visual system, specific miRNAs are expressed in various parts of the
eye, suggesting a role in controlling cell differentiation in the retina[48-49]. Additionally,
Fig. 16. Xbp1-EGFP specific band digestion with PstI. 1 – S2 cells transfected with Ire1::GFP and Xbp1-EGFP; 2 –
S2 cells transfected with Ire1::mcherry and Xbp1-EGFP; 3 – S2 cells transfected with Xbp1-EGFP; 1- – negative control of S2
cells transfected with Ire1::GFP and Xbp1-EGFP (no RT enzyme); 2- – negative control S2 cells transfected with Ire1::mcherry
and Xbp1-EGFP (no RT enzyme); 3- – negative control of S2 cells transfected with Xbp1-EGFP (no RT enzyme).

24
miRNAs in mouse retina seem to have a high turnover capacity in adaptation to different
levels of light[49].
Of all the miRNAs described, we are particularly interested in those related with the UPR
and apoptosis, given that previous studies demonstrated that retinal degeneration in ADRP is
apoptosis-dependent[27]. Several miRNAs have been associated with cell proliferation and
apoptosis in Drosophila but none has ever been associated with UPR.
We aim to elucidate the role of miRNAs in the post-transcriptional regulation of the
Ire1/Xbp1 signaling pathway of UPR, in the context of ER stress and retinal degeneration.
With that intention, we want to evaluate the miRNA expression pattern of flies with
degenerating photoreceptors comparing with flies with normal eyes. But, first we need to
understand what are the best conditions to perform a comparative assay between wt flies
(upon no ER stress circumstances) and flies carrying ninaE mutations (which lead to UPR
activation and photoreceptors degeneration – our ADRP model).
To study miRNA influence in Ire1/Xbp1 pathway we decided to follow the evolution of
photoreceptors degeneration that happens in our ADRP model flies, which is provoked by
normal exposure to light, and to evaluate miRNA expression in different stages of its
progression. However, some features have to be taken into account to assure an adequate
comparison between wt and ADRP flies miRNA expression. Since flies do not have eyelids,
light-induced retinal degeneration occurs even in wild type animals, resulting from the acute
exposure to very intense illumination or from long-term exposure to continuous moderate
levels of light[50]. Also, light-induced blindness is accelerated greatly at higher temperatures,
while red-eyed flies seem to slow down the visual impairment process[50]. And curiously,
flies carrying ninaE mutations, which are known to cause ER stress and activate the UPR, do
not show retina degeneration when maintained in the absence of light.
Besides all these features that reflect the variety of factors involved in fly photoreceptors
degeneration, it also is important to remind that miRNAs are involved in the regulation of the
circadian cycle and that the circadian cycle is mostly regulated by light. Taken everything
together, the experiments to study the miRNA expression in the context of ER stress and
photoreceptors degeneration needs to be thoroughly designed to assure the right interpretation
of the achieved results.
3.2.1. Premilinary tests for microRNA profiling
Considering these previous findings, some preliminary tests needed to be done to define
what are the best conditions of light intensity, time of exposure to light and culture

25
temperature so that wt fly eyes do not degenerate early but ninaEG69D
fly eyes do, trying not to
interfere with circadian cycle. In this way we can diminish artifacts in miRNA patterns
comparison interpretation.
In the preliminary assays we examined the deep pseudopupil (DPP)[42] of flies to
comprehend the effect of different culture features in the retinal degeneration of wt and ADRP
flies. The DPP image can be seen by the projection of GFP light inside the eye under the
control of the Rh1 Gal4 driver, which shows the trapezoidal shape of the outer R1-R6
photoreceptors that form the ommatidia - the small parts that assemble the compound eye of
the fly. When the eye starts to degenerate it gradually looses the DPP image, as the ommatidia
losses its shape. So, DPP is a marker for the integrity of the eye. This allows us to outline the
optimal experimental conditions, as well as the proper controls required for the comparative
assay to be performed in miRNA profiling.
Hence, in the preliminary tests we wanted to access retinal degeneration across time. To
do so, we initiated a trial with control and ADRP flies, in which the number of flies with no
DPP image in the eyes per number of flies alive per line was counted until there were no flies
alive, with a goal of finding a difference in the initiation, in the progression and in the level of
retinal degeneration between the different lines.
Initially we tried to use twenty flies per genotype, at 25ºC in a light cycle of 12h light/12h
dark with a mean of light intensity of 2200 lux. We started to use lines that already existed in
the laboratory, which we named in this preliminary experiment as: Control
(Rh1Gal4;UASGFPninac
/(cyo);Sb/TM6B), ninaEG69D
(Rh1Gal4;UASGFPninac
/(cyo);ninaEG69D
/(TM6B)) and UASninaEG69D
(Rh1Gal4;
UASGFPninac
/(cyo);UASninaEG69D
/(TM6B)). As seen in Fig.17 (see also Attachments, Table
5), in none of the lines was registered a high rate of retinal degeneration and also there was
not a considerable difference in that rate between the control and the rest of the lines. To
notice, ninaEG69D
line was the only that did not registered any retinal degeneration across
time. Additionally, the lines did not have the same pattern of survival and, surprisingly, the
control line was the one that had the lower survival rate.

26
Since those results were not conclusive, we chose to do the same assay using only two
lines which are genetically very similar, differing only in the ninaE transgene that they over-
express – ninaEwt
or ninaEG69D
. These lines were created using the øC31 system, integrating
the transgenes in the same attP specific site (the 68A4 site). The øC31 system guarantees that
the lines resulting from this system will have the same level of transcription and, supposedly,
the same level of expression of the transgene. It ensures too that if the insertion of the
transgenes by any chance influences the expression of any of the self genes of the flies, it will
occur in all the lines, as they will be all in the same conditions. Thus, the results are more
reliable to compare within the flies used in the preliminary tests. We named these lines
collectively as attB lines, and particularly as: attBUASninaEwt
(Rh1Gal4;UASGFPninac
/(cyo);UASninaEwt68A4
/(TM6B)) and attBUASninaEG69D
(Rh1Gal4;UASGFPninac
/(cyo);UASninaEG69D68A4
/(TM6B)) (for crosses – Attachments, Fig.4).
This time we used a larger population size to assess the retinal degeneration of the attB lines
across time. Looking at Fig. 18 (see also Attachments, Table 6), we can observe that
attBUASninaEwt
flies died in a much higher rate than attBUASninaEG69D
. Concerning retinal
degeneration we cannot see much difference between the two lines in study.
0
2
4
6
8
10
12
14
16
18
20
22
1 2 3 4 7 10 14 17 21 24 28 35 42 49
Nu
mb
er
of
flie
s
Days of exposure to light - 12h/12h cycle
Degenerated Flies per Flies Alive
Control
UASninaEG69D/(TM6B)
ninaEG69D/(TM6B)
Control Degenerated flies
Fig. 17. Retinal Degeneration assessment across time. Number of degenerated flies per number of flies alive per line.
Bars- Number of flies alive, lines- number of degenerated flies. Light cycle- 12h of light followed by 12h of darkness.
Mean of light intensity- 2200 lux

27
Fig. 19. PWIZ_attB lines hatch
already with no DPP image.
Flies in figure were 1day old.
Once we still could not verify a considerable difference between the retinal degeneration
of attB lines, we generated fly lines without eye pigment from our attB lines in order to
accelerate the retinal degeneration and maybe be able to see a difference in its progression
between the two lines (for crosses – Attachments, Fig.4). To do so, we used the pWIZ, a
transgenic line expressing RNAi against white, the gene encoding the eye pigment in flies,
and created pWIZ_attB lines: Pwiz_attBUASninaEwt
(Rh1Gal4; UASGFPninac
/(Cyo);
UASninaEwt68A4
/Pwiz) and Pwiz_attBUASninaEG69D
(Rh1Gal4; UASGFPninac
/(Cyo);
UASninaEG69D68A4
/Pwiz). Intriguingly, pWIZ_attB lines hatch already with no DPP image
(Fig.19), meaning that pWIZ must be interfering with the GFP expression, which prevented
us to further use.
Our next step was to use constant light of around 2000 lux to induce a higher retinal
degeneration. As observed in Fig.20 (see also Attachments, Table 7), retinal degeneration was
considerably higher than in the cases in which was used a 12h light/12h dark cycle.
Conversely, attBUASninaEwt
flies started to degenerate earlier than attBUASninaEG69D
flies. For
example, on day 19th
, almost 50% of the attBUASninaEwt
flies were already degenerated while
0
10
20
30
40
50
60
70
80
90
100
1 4 7 11 15 19 25 29 33 35 41 49
Nu
mb
er
of
flie
s
Days of exposure to light - 12h/12h cycle
Degenerated Flies per Flies Alive
attbUASninaEwt
attbUASninaEG69D
attbUASninaEwt Degenerated flies
Fig. 18. Retinal Degeneration assessment across time using attB lines. Number of degenerated flies per number of
flies alive per line. Bars- Number of flies alive, lines- number of degenerated flies. Light cycle- 12h of light followed by
12h of darkness. Mean of light intensity- 2200 lux
0
5
10
15
20
25
30
35
40
1 5 7 12 15 19 26 29 32 35 41 43 48 54 60
Nu
mb
er
of
flie
s
Days of exposure to light - constant light
Degenerated Flies per Flies Alive
attbUASninaEwt
attbUASninaEG69D
attbUASninaEwt Degenerated flies
attbUASninaEG69D Degenerated flies

28
only one of the attBUASninaEG69D
flies was too. Also, the level of degeneration in
attBUASninaEwt
seem to be worse than in the other assays and than in attBUASninaEG69D
of this
assay (Fig.21), since some of attBUASninaEwt
flies lost almost all the GFP expression in the
eye. Again, attBUASninaEwt
had a lower survival rate comparing to attBUASninaEG69D
.
Given all the preliminary tests, it is clear that we could not yet establish an assay where it
would be possible to analyze miRNA expression in the context of Ire1/Xbp1 pathway. To
achieve that assay, we are planning to repeat our preliminary tests with three independent
crosses for each line and a larger population size to reduce eventual artifacts. Using another
strategy, such as the cinnabar and brown mutations, to take out the eye pigment of flies is also
a viable option. Still we may need to change our approach into something less complex (see
Future Perspectives).
0
5
10
15
20
25
30
35
40
1 5 7 12 15 19 26 29 32 35 41 43 48 54 60
Nu
mb
er
of
flie
s
Days of exposure to light - constant light
Degenerated Flies per Flies Alive
attbUASninaEwt
attbUASninaEG69D
attbUASninaEwt Degenerated flies
attbUASninaEG69D Degenerated flies
Fig. 20. Retinal Degeneration assessment across time using attB lines with constant light. Number of degenerated
flies per number of flies alive per line. Bars- Number of flies alive, lines- number of degenerated flies. Light cycle-
constant light. Mean of light intensity- 2000 lux
Fig. 21. Examples of retinal degeneration of attB lines under constant light. Most of the attBUASninaEG69D
had the
DPP image intact. Nearly half of the attBUASninaEwt
had already retinal degeneration and some of them showed severe
degeneration (photo on right). Photos taken on the 19th
day of exposure to constant light. Mean of light intensity- 2000 lux

29
4. Future Perspectives
Concerning section 3.1., we are planning on pursuing our investigation in the Drosophila
organism. Although cell lines are a helpful tool, they have several limitations since they
cannot characterize the complexity of a full being. Therefore, the reported results need to be
validated with experiments in the fly. Our plan is to evaluate the Ire1 constructs (which were
already sent to by BestGeneInc (U.S.A) for embryo injection and production of transgenic
strains) for functionality by doing a rescue experiment of the Ire1f02170
mutant phenotype. For
that purpose, in the case of Ire1::mcherry, we will generate a fly with the genotype:
eyFlpGMRGal4;UASXbp1-EGFP/UASIre1::mcherry;F82B Ire1f02170
/F82BLacZ and look for
Xbp1-EGFP splicing in clones of Ire1f02170
. If we see Xbp1 splicing in those clones we can be
sure that it is being performed by our construct because there is no endogenous functional
Ire1 protein in the homozygous mutant clones. In the case of Ire1::GFP, this is not possible to
do because Ire1 and Xbp1 reporter have the same tag. To overcome that, we plan to clone a
mcherry tag in the C-terminal of Ire1 and then use the same approach to see if the position of
the tag in Ire1 protein interferes with its function.
After the validation of the reported results we will analyze by live microscopy the co-
localization of Ire1 and Xbp1 mRNA, using Ire1::mcherry (here reported) and Xbp1 mRNA
labeled with the MS2-GFP system (ongoing work in the lab - the MS2 binding sites are
inserted in the Xbp1 mRNA after the 3’UTR and before the polyA. This reagent will be
expressed in cells also expressing MS2-GFP fusion protein, which binds to the respective
binding sites allowing the imaging of Xbp1 mRNAs).
In the future, we would like to study the localization of Ire1 and Xbp1 mRNA in an
endogenous context, to minimize possible artifacts caused by over-expression of tagged Ire1.
To do that we will need to tag Ire1 in the fly genome by modification (recombineering) of a
PACMAN reagent (library of bacterial artificial chromosomes with inserts on average of 20
kb covering the Drosophila genome and ready for modification and transgenic insertion in the
genome). We have already obtained and sent for injection the clone CH322-7H5, which
contains the full open reading frame (ORF) of Ire1 and 10 kb of additional 5’ genomic
sequence, which may or may not contain all the enhancers and promoter of Ire1. To test if
CH322-7H5 is a bona-fide genomic rescue construct, we will use this reagent to attempt to
rescue Ire1f02170
mutant phenotype (for example lethality), after which CH322-7H5 will be
modified by recombineering to insert the GFP or mcherry tags in the ORF of Ire1.

30
Regarding section 3.2, we will repeat our preliminary tests using independent crosses and
a larger population size but, at the same time, we will try to set up another strategy for the
miRNA profiling experiment. That strategy consists in using a fly line in which there is
induced retinal degeneration by over-expression of Xbp1spliced protein –
w;sGMRGal4/Cyo;UASXbp1spliced/Tm6B – to do the miRNA profiling, using
w;sGMRGal4/Cyo as a control. We intend to dissect eye imaginal discs of 3rd
instar larvae,
extract total RNA, evaluate its quality and send for miRNA analysis. From that, we can try to
understand if there are any miRNAs candidates, which may have a role in controlling Xbp1
post-transcriptional regulation, and further investigate them.
5. References
1. Brown, R.C., A.H. Lockwood, and B.R. Sonawane, Neurodegenerative diseases: an overview
of environmental risk factors. Environ Health Perspect, 2005. 113(9): p. 1250-6.
2. Matus, S., L.H. Glimcher, and C. Hetz, Protein folding stress in neurodegenerative diseases:
a glimpse into the ER. Curr Opin Cell Biol, 2011. 23(2): p. 239-52.
3. Diehl, J.A., S.Y. Fuchs, and C. Koumenis, The cell biology of the unfolded protein response.
Gastroenterology, 2011. 141(1): p. 38-41 e2.
4. Stevens, F.J. and Y. Argon, Protein folding in the ER. Semin Cell Dev Biol, 1999. 10(5): p.
443-54.
5. Meusser, B., et al., ERAD: the long road to destruction. Nat Cell Biol, 2005. 7(8): p. 766-72.
6. Mendes, H.F., et al., Mechanisms of cell death in rhodopsin retinitis pigmentosa: implications
for therapy. Trends Mol Med, 2005. 11(4): p. 177-85.
7. Kaufman, R.J., Orchestrating the unfolded protein response in health and disease. J Clin
Invest, 2002. 110(10): p. 1389-98.
8. Ron, D. and P. Walter, Signal integration in the endoplasmic reticulum unfolded protein
response. Nat Rev Mol Cell Biol, 2007. 8(7): p. 519-29.
9. Ryoo, H.D., et al., Unfolded protein response in a Drosophila model for retinal degeneration.
EMBO J, 2007. 26(1): p. 242-52.
10. Naidoo, N., ER and aging-Protein folding and the ER stress response. Ageing Res Rev, 2009.
8(3): p. 150-9.
11. Bertolotti, A., et al., Dynamic interaction of BiP and ER stress transducers in the unfolded-
protein response. Nat Cell Biol, 2000. 2(6): p. 326-32.
12. DuRose, J.B., A.B. Tam, and M. Niwa, Intrinsic capacities of molecular sensors of the
unfolded protein response to sense alternate forms of endoplasmic reticulum stress. Mol Biol
Cell, 2006. 17(7): p. 3095-107.
13. Mori, K., Signalling pathways in the unfolded protein response: development from yeast to
mammals. J Biochem, 2009. 146(6): p. 743-50.
14. Mori, K., et al., A transmembrane protein with a cdc2+/CDC28-related kinase activity is
required for signaling from the ER to the nucleus. Cell, 1993. 74(4): p. 743-56.
15. Cox, J.S., C.E. Shamu, and P. Walter, Transcriptional induction of genes encoding
endoplasmic reticulum resident proteins requires a transmembrane protein kinase. Cell, 1993.
73(6): p. 1197-206.

31
16. Kawahara, T., et al., Endoplasmic reticulum stress-induced mRNA splicing permits synthesis
of transcription factor Hac1p/Ern4p that activates the unfolded protein response. Mol Biol
Cell, 1997. 8(10): p. 1845-62.
17. Cox, J.S. and P. Walter, A novel mechanism for regulating activity of a transcription factor
that controls the unfolded protein response. Cell, 1996. 87(3): p. 391-404.
18. Mori, K., et al., mRNA splicing-mediated C-terminal replacement of transcription factor
Hac1p is required for efficient activation of the unfolded protein response. Proc Natl Acad Sci
U S A, 2000. 97(9): p. 4660-5.
19. Souid, S., J.A. Lepesant, and C. Yanicostas, The xbp-1 gene is essential for development in
Drosophila. Dev Genes Evol, 2007. 217(2): p. 159-67.
20. Yoshida, H., et al., XBP1 mRNA is induced by ATF6 and spliced by IRE1 in response to ER
stress to produce a highly active transcription factor. Cell, 2001. 107(7): p. 881-91.
21. Yoshida, H., et al., pXBP1(U) encoded in XBP1 pre-mRNA negatively regulates unfolded
protein response activator pXBP1(S) in mammalian ER stress response. J Cell Biol, 2006.
172(4): p. 565-75.
22. Travers, K.J., et al., Functional and genomic analyses reveal an essential coordination
between the unfolded protein response and ER-associated degradation. Cell, 2000. 101(3): p.
249-58.
23. Chen, Y.F., et al., Examining rhodopsin retention in endoplasmic reticulum and intracellular
localization in vitro and in vivo by using truncated rhodopsin fragments. J Cell Biochem,
2011. 112(2): p. 520-30.
24. Zhao, C., et al., Autosomal-dominant retinitis pigmentosa caused by a mutation in SNRNP200,
a gene required for unwinding of U4/U6 snRNAs. Am J Hum Genet, 2009. 85(5): p. 617-27.
25. Sung, C.H., et al., Functional heterogeneity of mutant rhodopsins responsible for autosomal
dominant retinitis pigmentosa. Proc Natl Acad Sci U S A, 1991. 88(19): p. 8840-4.
26. Kaushal, S. and H.G. Khorana, Structure and function in rhodopsin. 7. Point mutations
associated with autosomal dominant retinitis pigmentosa. Biochemistry, 1994. 33(20): p.
6121-8.
27. Davidson, F.F. and H. Steller, Blocking apoptosis prevents blindness in Drosophila retinal
degeneration mutants. Nature, 1998. 391(6667): p. 587-91.
28. Colley, N.J., et al., Defective intracellular transport is the molecular basis of rhodopsin-
dependent dominant retinal degeneration. Proc Natl Acad Sci U S A, 1995. 92(7): p. 3070-4.
29. Leonard, D.S., et al., Degeneration of photoreceptors in rhodopsin mutants of Drosophila. J
Neurobiol, 1992. 23(6): p. 605-26.
30. Kurada, P. and J.E. O'Tousa, Retinal degeneration caused by dominant rhodopsin mutations
in Drosophila. Neuron, 1995. 14(3): p. 571-9.
31. Garneau, N.L., J. Wilusz, and C.J. Wilusz, The highways and byways of mRNA decay. Nat
Rev Mol Cell Biol, 2007. 8(2): p. 113-26.
32. Filipowicz, W., S.N. Bhattacharyya, and N. Sonenberg, Mechanisms of post-transcriptional
regulation by microRNAs: are the answers in sight? Nat Rev Genet, 2008. 9(2): p. 102-14.
33. Leibovich, L., Y. Mandel-Gutfreund, and Z. Yakhini, A structural-based statistical approach
suggests a cooperative activity of PUM1 and miR-410 in human 3'-untranslated regions.
Silence, 2010. 1(1): p. 17.
34. Kedde, M. and R. Agami, Interplay between microRNAs and RNA-binding proteins
determines developmental processes. Cell Cycle, 2008. 7(7): p. 899-903.
35. Guo, X. and R. Hartley, MicroRNA-RNA binding protein face-off in cancer. Cell Cycle, 2010.
9(7): p. 1234-5.
36. George, A.D. and S.A. Tenenbaum, MicroRNA modulation of RNA-binding protein regulatory
elements. RNA Biol, 2006. 3(2): p. 57-9.
37. Aragon, T., et al., Messenger RNA targeting to endoplasmic reticulum stress signalling sites.
Nature, 2009. 457(7230): p. 736-40.
38. Yanagitani, K., et al., Translational pausing ensures membrane targeting and cytoplasmic
splicing of XBP1u mRNA. Science, 2011. 331(6017): p. 586-9.
39. Yanagitani, K., et al., Cotranslational targeting of XBP1 protein to the membrane promotes
cytoplasmic splicing of its own mRNA. Mol Cell, 2009. 34(2): p. 191-200.

32
40. Fish, M.P., et al., Creating transgenic Drosophila by microinjecting the site-specific phiC31
integrase mRNA and a transgene-containing donor plasmid. Nat Protoc, 2007. 2(10): p. 2325-
31.
41. Brand, A.H. and N. Perrimon, Targeted gene expression as a means of altering cell fates and
generating dominant phenotypes. Development, 1993. 118(2): p. 401-15.
42. Franceschini, N. and K. Kirschfeld, [Pseudopupil phenomena in the compound eye of
drosophila]. Kybernetik, 1971. 9(5): p. 159-82.
43. Rosenbaum, E.E., R.C. Hardie, and N.J. Colley, Calnexin is essential for rhodopsin
maturation, Ca2+ regulation, and photoreceptor cell survival. Neuron, 2006. 49(2): p. 229-
41.
44. Back, S.H., et al., Cytoplasmic IRE1alpha-mediated XBP1 mRNA splicing in the absence of
nuclear processing and endoplasmic reticulum stress. J Biol Chem, 2006. 281(27): p. 18691-
706.
45. Ellgaard, L. and A. Helenius, Quality control in the endoplasmic reticulum. Nat Rev Mol Cell
Biol, 2003. 4(3): p. 181-91.
46. Bilen, J., N. Liu, and N.M. Bonini, A new role for microRNA pathways: modulation of
degeneration induced by pathogenic human disease proteins. Cell Cycle, 2006. 5(24): p.
2835-8.
47. Kloosterman, W.P. and R.H. Plasterk, The diverse functions of microRNAs in animal
development and disease. Dev Cell, 2006. 11(4): p. 441-50.
48. Karali, M., et al., Identification and characterization of microRNAs expressed in the mouse
eye. Invest Ophthalmol Vis Sci, 2007. 48(2): p. 509-15.
49. Krol, J., et al., Characterizing light-regulated retinal microRNAs reveals rapid turnover as a
common property of neuronal microRNAs. Cell, 2010. 141(4): p. 618-31.
50. Lee, S.J. and C. Montell, Suppression of constant-light-induced blindness but not retinal
degeneration by inhibition of the rhodopsin degradation pathway. Curr Biol, 2004. 14(23): p.
2076-85.

33
6. Attachments
Fig.1. Xbp1 Unspliced and Spliced forms. DXbp-1u- Xbp1 unslipced, DXbp-1s- Xbp1 spliced. Blue and Red-
Different C-terminals comparing the two forms of Xbp1 From [19]
Fig.2. Biogenesis of miRNA. miRNAs are
processed from precursor molecules (pri-
miRNAs), which are either transcribed from
independent miRNA genes or are portions of
introns of protein-coding RNA polymerase II
transcripts. In animals, pri-miRNAs fold into
hairpin structures and are processed by Drosha and
Dicer, RNase III type endonucleases. Both Drosha
and Dicer function in complexes with proteins
containing dsRNA-binding domains (dsRBDs). In
mammals, the Drosha–DGCR8 complex processes
pri-miRNAs to ~70-nucleotide hairpins known as
pre-miRNAs. Then pre-miRNAs are transported to
the cytoplasm by exportin5, where they are
cleaved by Dicer to yield ~20-bp miRNA
duplexes. One strand is then selected to function as
a mature miRNA, while the other strand is
degraded. Following their processing, miRNAs are
assembled into ribonucleoprotein (RNP)
complexes called micro-RNPs (miRNPs) or
miRNA-induced silencing complexes (miRISCs).
The key components of miRNPs are proteins of
the Argonaute (AGO) family. The mature miRNA
then binds to complementary sites in the 3’UTR of
them RNA target to negatively regulate gene
expression. If perfect complementarity is achieved
the mRNA is cleaved endonucleolytically in the middle of the miRNA–mRNA duplex. If there is imperfect complementarity,
gene expression is blocked at the level of protein translation ou mRNA destabilization. From [32]

34
Fig.3. Directed gene expression in Drosophila
melanogaster by the GAL4 system. The gene
encoding the yeast transcriptional activator GAL4 was
inserted randomly into the Drosophila genome to create
various lines in which one GAL4 expression is drived
from a different genomic enhancer. Then, a GAL4-
dependent target gene can then be constructed by
subcloning any sequence next to the GAL4 binding sites
– the UAS sites. To activate the target gene in a cell- or
tissue-specific pattern, flies carrying the UAS-Gene X
are crossed to flies expressing GAL4. In the progeny of
this cross, UAS-Gene X will be activated in cells where
GAL4 is expressed (from [41])
Cross 1
Cross 2
Cross 3

35
Cross 4
Fig.4. Crosses done during the master project
A B
Fig.6. Vectors used in Gateway cloning. A-pDONRTM221 Map, B- pTWG Map with its unique restriction sites
Fig.5. Vectors used in conventional cloning. A- pJET Map, B-pUAST Map

36
Table 1. Lines used in pseudopupil assays
Name given in the experiences Genotype
Control Rh1Gal4;UASGFPninac
/(cyo);Sb/TM6B
UASninaEG69D
Rh1Gal4;UASGFPninac
/(cyo);UASninaEG69D
/(TM6B)
ninaEG69D
Rh1Gal4;UASGFPninac
/(cyo);ninaEG69D
/(TM6B)
attBUASninaEwt
Rh1Gal4;UASGFPninac
/(cyo);UASninaEwt68A4
/(TM6B)
attBUASninaEG69D
Rh1Gal4;UASGFPninac
/(cyo);UASninaEG69D68A4
/(TM6B)
Pwiz_attBUASninaEwt
Rh1Gal4;UASGFPninac
/(cyo);UASninaEwt68A4
/Pwiz
Pwiz_attBUASninaEG69D
Rh1Gal4;UASGFPninac
/(cyo);UASninaEG69D68A4
/Pwiz
Table 2. Primers used for conventional cloning of Ire1::mcherry
Primers Features
PCR Primers IRE1 I
IRE1 CH1
5’- C GTT AAC AGA TCT ATG GGC AGT CTT AAG AAG TTA CC – BglII site
C-2 -- Tm: 65,2
5’- CTC GCC CTT GCT CAC CAT ACC ATT CTC GCT CTG CTT TTG CAG
Time of elongation
1min10sec
Tm
55ºC
PCR Primers mCherry
C-3
5´- CAA AAG CAG AGC GAG AAT GGT ATG GTG AGC AAG GGC GAG GAG GAC
C-4
5’- GGC TAT GGC AAA GGT TTT TGA GTA CAG CTC GTC CAT GCC GCC GGT
Time of elongation
50sec
Tm
60ºC
PCR Primers IRE1 II
C-5
5’- GGC GGC ATG GAC GAG CTG TAC TCA AAA ACC TTT GCC ATA GCC CAA
IRE1 CH6
5’- TCT AGA GGT ACC TCA ATC CTG CGT TGA AGG – Acc65I site
Time of elongation
1min10sec
Tm
55ºC
Red - mcherry sequences, Blue - Ire1 sequences, Grey - homology zones created by the PCRs
Table 3. Primers utilized in the Gateway system cloning
Primer name Primer sequence
Ire1_forward_gateway
5’ GGGG ACA AGT TTG TAC AAA AAA GCA GGC TTC ACC ATG GGC AGT CTT AAG AAG TTA
Ire1_reverse_gateway 5’ GGG GAC CAC TTT GTA CAA GAA AGC TGG GTC ATC CTG CGT TGA AGG TGG CAG CGT
Green - attb sequences, Red - the initiation codon of Ire1

37
Table 4. Primers utilized in RT-PCRs
Gene Primer name Primer sequence
Ire1::mcherry
IRE1 CH1 5’ C GTT AAC AGA TCT ATG GGC AGT CTT AAG
AAG TTA CC Tm- 58ºC
Elongation time – 2min10sec C-4
5’ GGC TAT GGC AAA GGT TTT TGA GTA CAG CTC
GTC CAT GCC GCC GGT
Ire1::GFP IRE1-5 5’ Tm- 46ºC
Elongation time – 2min10sec IRE1 CH6 5’ TCT AGA GGT ACC TCA ATC CTG CGT TGA AGG
Xbp1-EGFP Xbp1-n 5’ Tm- 60ºC
Elongation time – 1min10sec GFP-Rw2 5’
Table 5. Retinal Degeneration assessment across time. Light cycle- 12h light/12h dark
Table 6. Retinal Degeneration assessment across time with attB lines. Light cycle- 12h light/12h dark
Fly line Sb/TM6B UASninaEG69D/(TM6B) ninaEG69D/(TM6B)
Day Degenerated flies
/Flies alive
Degenerated flies /Flies
alive
Degenerated flies /Flies
Alive
1 0/20 0/20 0/19
2 0/20 0/20 0/19
3 0/19 0/19 0/18
4 0/19 0/19 0/16
7 0/14 0/17 0/14
10 0/11 0/14 0/11
14 1/8 2/14 0/10
17 0/7 1/9 0/8
21 0/3 1/8 0/6
24 0/2 2/7 0/2
28 0/1 2/6 0/0
35 0/0 2/3 0/0
42 0/0 1/2 0/0
49 0/0 0/0 0/0
Lines attbUASninaEwt
attbUASninaEG69D
Day Degenerated flies /Flies
alive
Degenerated flies /Flies
alive
1 0/100 0/100
4 0/92 0/96
7 0/73 0/91
11 1/46 2/87
15 1/31 0/78
19 0/18 0/71
25 7/15 4/46
29 4/8 4/21
33 1/2 4/7
35 2/2 2/5
41 0/0 1/2
49 0/0 1/1

38
Table 7. Retinal Degeneration assessment across time with attB lines. Light cycle- constant light
Lines attbUASninaEwt
attbUASninaEG69D
Day Degenerated flies
/Flies alive
Degenerated flies /Flies
alive
1 0/40 0/40
5 0/37 0/37
7 2/35 0/34
12 9/31 0/27
15 12/30 1/24
19 11/21 1/24
26 8/12 3/22
29 6/10 10/20
32 7/9 11/17
35 9/9 14/16
41 5/5 6/8
43 5/5 6/8
48 3/3 2/2
54 2/2 0/0
60 0/0 0/0