
The role of the HLA region in Hashimoto's Thyroiditisetheses.bham.ac.uk/778/1/Zeitlin10MPhil.pdf ·...
157
The role of the HLA region in Hashimoto's Thyroiditis by Abigail Zeitlin A thesis submitted to The University of Birmingham For the degree of Master of Philosophy Department of Medicine Division of Medical Sciences The University of Birmingham January 2010
Transcript of The role of the HLA region in Hashimoto's Thyroiditisetheses.bham.ac.uk/778/1/Zeitlin10MPhil.pdf ·...

The role of the HLA region in Hashimoto's Thyroiditis
by
Abigail Zeitlin
A thesis submitted to
The University of Birmingham For the degree of
Master of Philosophy
Department of Medicine Division of Medical Sciences
The University of Birmingham January 2010

University of Birmingham Research Archive
e-theses repository This unpublished thesis/dissertation is copyright of the author and/or third parties. The intellectual property rights of the author or third parties in respect of this work are as defined by The Copyright Designs and Patents Act 1988 or as modified by any successor legislation. Any use made of information contained in this thesis/dissertation must be in accordance with that legislation and must be properly acknowledged. Further distribution or reproduction in any format is prohibited without the permission of the copyright holder.

SYNOPSIS
Hashimoto’s Thyroiditis is an autoimmune disease of the thyroid gland characterised by
thyrocyte death. Although it was previously thought that Hashimoto’s thyroiditis shared
common aetiology with Graves’ disease, there is now significant evidence to suggest separate
causal loci. The aims of this thesis were, i) to investigate HLA class II as a causal factor for
Hashimoto’s thyroiditis ii) to investigate the potential role played by HLA class I MICA and
MICB in Hashimoto’s thyroiditis. Several predisposing and protective loci within the HLA
class II region were determined including the strongly associated DR4 haplotype and its
component alleles. Of note DR4 is not associated with Graves’ disease providing evidence for
a difference in the aetiology of autoimmune thyroid disease. There were no strong
associations in MICA and MICB in the context of Hashimoto’s thyroiditis. Further work is
required to screen the HLA gene region to determine additional casual loci for Hashimoto’s
thyroiditis. As the HLA gene region is an area of strong linkage disequilibrium this additional
screening is also required to determine the primary associated loci. The data presented in this
thesis provides further evidence for a difference in the aetiology of Hashimoto’s thyroiditis
compared to that of Graves’ disease.

DEDICATION
For my father, who seems to be making a collection of these.

ACKNOWLEDGEMENTS
I would like to thank my supervisors Dr. Matt Simmonds and Professor Stephen Gough for
the help and support in the completion of this thesis. I would also like to thank the other
members of the research group, Dr. Joanne King, Mr Oliver Brand and Mr Paul Newby for
their help and advice.
I would also like to thank all the doctors and nurses for recruiting into the AITD UK National
Collection of index cases and families from Birmingham, Bournemouth, Cardiff, Exeter, Leeds,
Newcastle and Sheffield.

CONTENTS
CHAPTER 1: INTRODUCTION 1.1 Autoimmune disease. . . . . . . . . .1 1.2 Immune system regulatory mechanisms . . . . . . .1
Positive selection . . . . . . . . .2 Negative selection . . . . . . . . .3
1.3 The immune system as a causal factor for disease . . . . .4 1.4 Autoimmune Thyroid Disease . . . . . . . .5
1.4.1 Mechanisms of thyroid function. . . . . . .6 1.4.2 Graves’ Disease . . . . . . . . .7 1.4.3 Hashimoto’s thyroiditis . . . . . . . .9
Diagnosis . . . . . . . . .12 Treatment . . . . . . . . .13 1.4.4 Pathogenesis of Hashimoto’s Thyroiditis . . . . .14 Tumour-necrosis factor mediated apoptosis . . . . .16
Autoantibodies . . . . . . . .17 Environmental cause . . . . . . . .18
1.5 Genetic and environmental causal factors of AITD . . . . .18 1.5.1 Environmental Factors in AITD . . . . . .21
Infection . . . . . . . . .21 Smoking . . . . . . . . .22 Iodine . . . . . . . . . .23
1.6 Genetics of AITD . . . . . . . . . .24 1.6.1 Identification of Genetic causal factors . . . . . .24
Candidate Gene studies . . . . . . .24 Linkage disequilibrium-mapping and Tag Single nucleotide polymorphisms (SNPs) . . . . . . .25 Genome wide linkage studies . . . . . .25 Problems surrounding the identification of the genetic causal factors for HT . . . . . . . . .28
1.7 Genetic Causal Factors for AITD . . . . . . . .29 CTLA4 . . . . . . . . . . .31 Tg . . . . . . . . . . .32 PTPN22 . . . . . . . . . .33
1.8 Commonality and distinction in AITD genetic causal factors . . . .35 CD40 . . . . . . . . . . .35 TSHR . . . . . . . . . . .36 Clustering of autoimmune diseases . . . . . . .36
CHAPTER 2: MATERIALS AND METHODS 2.1 Subjects . . . . . . . . . . .42 2.2 Blood Pelleting and DNA Extraction . . . . . . .42 2.3 PicoGreen® DNA Quantification . . . . . . . .44 2.4 Polymerase chain reaction (PCR) . . . . . . . .47 Oligonucleotide primers . . . . . . . .48 Taq Polymerase . . . . . . . . .48 dNTP concentration . . . . . . . . .50

Buffer and Magnesium chloride . . . . . . .50 Purity of PCR components . . . . . . . .51 Thermal cycling . . . . . . . . .51
2.5 Alelle Specific PCR (ASPCR) . . . . . . . .53 2.6 Agarose gel electrophoresis . . . . . . . .53 2.7 Tag SNPs . . . . . . . . . . .55 Assays . . . . . . . . . . .56 Taqman Probes . . . . . . . . .56 2.8 Statistical analysis . . . . . . . . . .57
2.8.1 Power calculations . . . . . . . .57 2.8.2 Case control analysis . . . . . . . .59 2.8.3 Hardy Weinberg Equilibrium (HWE) . . . . . .60 2.8.4 Linkage Disequilibrium (LD) . . . . . . .61
CHAPTER 3: HLA CLASS II 3.1 Introduction . . . . . . . . . .62
3.1.2 HLA class II . . . . . . . . .64 Structure and function of the HLA Class II molecules . . .66
3.2 Association of HLA with Autoimmune Thyroid disease . . . . .68 Graves’ disease . . . . . . . . .69 Hashimoto’s Thyroiditis . . . . . . . .71
3.3 Aims of Chapter 3 . . . . . . . . . .74 3.4 HLA methods . . . . . . . . . .74
3.4.1 Subjects . . . . . . . . . .74 3.4.2 Genotyping . . . . . . . . .75
Primers . . . . . . . . .75 PCR . . . . . . . . . .76 Agarose gel electrophoresis of samples . . . . .77 DYNAL . . . . . . . . .77
3.4.3 Statistical analysis . . . . . . . .80 3.5 Results . . . . . . . . . . .81
Genotyping results . . . . . . . . .81 Phenotype/genotype associations . . . . . . .82
3.6 Discussion . . . . . . . . . . .88 CHAPTER 4: MICA AND MICB 4.1 Introduction. . . . . . . . . . .92
4.1.1 HLA Class I . . . . . . . . .92 Structure and function of the HLA Class I molecules . . .92
4.2 MICA and MICB . . . . . . . . . .94 MICA and MICB gene structure . . . . . .95 Function of MICA and MICB genes . . . . . .96
4.2.1 Previous associations of MICA and MICB with AID . . . .97 4.3 Aims . . . . . . . . . . 100 4.4 Methods . . . . . . . . . . 100
4.4.1 Subjects . . . . . . . . . 100 4.4.2 Genotyping . . . . . . . . 101 4.4.3 Method . . . . . . . . . 101 4.4.4 Analysis . . . . . . . . . 103 4.4.5 Statistical analysis . . . . . . . 105

4.5 Results . . . . . . . . . . 105 Genotyping results . . . . . . . . 105 Phenotype/genotype associations . . . . . . 106
4.6 Discussion . . . . . . . . . . 110 CHAPTER 5: DISCUSSION 5.1 Discussion . . . . . . . . . . 113 5.2 Future Work . . . . . . . . . 115
Phenotype correlations . . . . . . . 115 HLA Class I loci . . . . . . . . 116 Genome Wide Scans . . . . . . . . 117
5.3 Conclusions . . . . . . . . . 118 APPENDIX 6.1 Disclaimer . . . . . . . . . . 120
Collection of AITD samples . . . . . . . 120
DNA Extraction and quantification . . . . . . 120
6.2 Solutions . . . . . . . . . . 120
6.3 Calculations . . . . . . . . . 121
Chi-squared . . . . . . . . . 121
Fishers Exact Probability Test . . . . . . 121
Woolf’s method of OR calculation . . . . . . 121
95% Confidence intervals . . . . . . . 121
6.4 HLA class II primers used to type the DRB1, DQA1 and DRB1 regions . 122
Primers used to type DRB1 region . . . 122 Primers to type DRB3, DRB4 and DRB5 regions . . . . 124 Primers to type DQB1 region . . . . . . . 125 Primers to type DQA1 region . . . . . . . 126
6.5 SNPs used to genotype the MICA and MICB gene regions . . . 127
SNPS used to gentotype the MICA gene . . . . . 127 SNPs used to genotype the MICB gene . . . . . . 128
PUBLICATIONS . . . . . . . . . 129 REFERENCES . . . . . . . . . 130

LIST OF FIGURES CHAPTER 1: INTRODUCTION Figure 1.1: The hypothalamic pituitary axis . . . . . .8 Figure 1.2: Mechanism of action of thyroid destruction . . . . .11 Figure 1.3: Possible pathogenic pathways of Hashimoto’s thyroiditis . . .15 Figure 1.4: Haplotype formation of SNPs in high and low LD . . . .26 Figure 1.5: Some of the suggested and confirmed susceptibility loci for GD
involved in antigen presentation to T cells . . . . .30 CHAPTER 2: METHODS AND MATERIALS Figure 2.1: Layout of the 96 flat well plate for the Picogreen® protocol . . .46 Figure 2.2: cycle of DNA replication via the polymerase chain reaction. . .49 Figure 2.3: Primers used in PCR reactions . . . . . .54 Figure 2.4: Probe binding and fluorescence . . . . . .58 CHAPTER 3: HLA CLASS II Figure 3.1: Schematic of the HLA gene region . . . . . .63 Figure 3.2: schematic of HLA class II gene region . . . . .65 Figure 3.3: HLA class I and class II molecule structures . . . . .67 Figure 3.4: Visualisation of agarose gel electrophoresis . . . . .78 CHAPTER 4: MICA AND MICB Figure 4.1: Schematic of allelic results . . . . . . 104
LIST OF TABLES CHAPTER 1: INTRODUCTION Table 1.1: A summary of genes investigated for association with Graves’ disease . .39
CHAPTER 3: HLA CLASS II Table 3.1: Past associations of HLA class II with HT . . . . .73 Table 3.2: Distribution of DRB1, DQB1 and DQA1 alleles in patients with . . .83
Hashimoto’s thyroiditis and control subjects Table 3.3: Distribution of associated DRB1, DQB1, DQA1 haplotypes in . . .84
patients with Hashimoto’s thyroiditis and control subjects Table 3.4: Distribution of non-associated DRB1, DQB1, DQA1 haplotypes . . .85
in patients with Hashimoto’s thyroiditis and control subjects Table 3.5: Distribution of DRB1, DQB1 and DQA1 alleles in patients with . . .86
Hashimoto’s thyroiditis with a diffuse goitre and patients with Hashimotos thyroiditis with no goitre present
Table 3.6: Distribution of DRB1, DQB1 and DQA1 alleles in patients with . . .87 Hashimoto’s thyroiditis with TSH levels between 5.5-15mIU/liter and patients with Hashimotos thyroiditis with TSH levels greater than 15mIU/liter
CHAPTER 4: MICA AND MICB Table 4.1: Distribution of alleles and genotypes in MICA SNPs in patients with
Hashimoto’s thyroiditis and control subjects . . . . 107 Table 4.2: Distribution of alleles and genotypes in MICB SNPs in patients with
Hashimoto’s thyroiditis and control subjects . . . . 109

Chapter 1 Introduction
1
CHAPTER 1: INTRODUCTION
The immune system plays a key role in protecting the body against invading or foreign
pathogens. The normal immune response is launched when immune cells recognise foreign
pathogens in the host system. Upon recognition of the pathogen the immune cells attempt to
neutralise the pathogens by various methods including recruitment of other immune cells,
endocytosis/phagocytosis of small pathogens and initiation of necrosis of cellular pathogens. In
autoimmune disease this response is directed not at a foreign pathogen but at the hosts own cells.
The autoimmune response may differ in specificity, being directed at only one type of cell within
one organ through to targeting several organs and systems within the body. The pathology of
each disease will therefore be related to the cells, tissues and organs affected. Whilst originally
autoimmune diseases were classified into two discrete groups (Goldsby and Goldsby 2003),
‘organ’ specific and ‘non-organ’ specific later findings have shown that a spectrum is more
appropriate. This is due to the fact that even in ‘organ’ specific diseases although one tissue may
be the major target of autoimmunity others tissues are also targeted.
1.1 Autoimmune disease
To understand how immune system regulatory mechanisms break down to cause autoimmunity
the normal function of this system must first be examined.
1.2 Immune system regulatory mechanisms

Chapter 1 Introduction
2
One of the key cells of the immune system are T lymphocytes. T lymphocytes begin as
hemopoietic stem cells which are released from the bone marrow, at this stage showing no
specific lineage. These early stem cells migrate to the thymus, changing into the T cell
precursors, CD4-/CD8- T cells. To permit T cells to recognise a wide variety of antigens the T
cell receptor (TCR) is encoded by a series of segmented genes which may be expressed in
different combinations allowing for a large degree of diversity within the T cell population. At
the point of entry into the thymus the CD4-/CD8- T cells have yet to rearrange the TCR gene
segments. The CD4-/CD8- T cells remain in the thymus in this indeterminate state for around
three weeks during which time they proliferate. After this stage the cells rearrange the TCR gene
segments and begin to express TCRs on the cell surface. As the rearrangement of the TCR gene
segments is a random process not all T cells will develop a combination which is functional and
compatible with the host’s immune system requirements. Due to this factor a double selection
process is implemented to ensure that the eventual T cell population contains cells which express
useful versions of the TCR; a process which is involves screening out self reactive T cells before
they are released into the periphery.
Positive selection
The first stage of the double selection process includes positive selection, whereby thymic
cortical epithelial cells present peptides bound by HLA class I and II molecules. Naive
CD4+/CD8+ thymocytes which show an affinity to either the HLA class I or class II molecules
receive a protective signal. Those which do not interact, due to low affinity for the individuals
own HLA molecules, do not receive the protective signal and die through apoptosis. This first

Chapter 1 Introduction
3
stage eliminates thymocytes which are unreactive towards HLA bound peptides as this mimics
the eventual process of antigen fragment presentation in a real immune response.
Negative selection
The initial stage of positive selection generates a mixture of pre-T cells which will react to a
presented antigen. However due to the random TCR gene segment rearrangement, there will also
be T cells which will react towards the host’s own cells within this initial group. The process of
negative selection is designed to eliminate these potentially harmful T cells. Medullary thymic
epithelial cells, dendritic cells and macrophages act as antigen presenting cells by displaying
peptide bound HLA class I and HLA class II molecules for recognition by the T cell population.
Pre-T cells which react too strongly to the presented HLA molecules receive the signal for
apoptosis (Simmonds and Gough 2004a, Alberts 2002). AIRE has been shown to be expressed in
medullary epithelial cells and is thought to play a role in the presentation of tissue restricted
antigens from the periphery that T cells may encounter (Giraud et al. 2007, Kyewski and
Derbinski 2004). This process effectively removes any T cells which would view the hosts own
cells as harmful antigens and as a result mount an autoimmune response.
This dual process of positive and negative selection should ensure that only T cells which are
useful to the host’s immune reaction remain and are released from the thymus after this process.
However one of the major flaws in this is that not all self antigens are present in the thymus,
hence they cannot be presented in the negative selection process. This results in the possibility
that some of the T cells which survive the selection process may still be self-reactive.

Chapter 1 Introduction
4
The mechanisms mentioned in the previous section should prevent any self reactive T cells from
remaining in the host system. These pathways are, however, subject to dysfunction for a variety
of reasons, a factor which may lead to the onset of AID.
1.3 The immune system as a causal factor for disease
As part of the normal healthy immune system a small number self reactive T cells are released
into the periphery due to the absence of various self antigens in the thymus. If a breakdown in the
negative selection process occurs then an unusually high number of self reactive T cells may be
released into the periphery. A mutation in AIRE is thought to be a causal factor in this breakdown
as it induces a reduction in the transcription of the organ specific self antigens found in the
thymus (Liston et al. 2007). AIRE has been the subject of much debate over recent years
concerning its role in autoimmune disease. Mutations in the AIRE gene are known to cause
autoimmune polyendocrinopathy-candidiases-ectodermal dystrophy (APECED). Although
APECED is itself a multi-organ disease patients often show other autoimmune conditions such as
thyroiditis and T1D indicating that AIRE may play a role as a general autoimmune susceptibility
locus. It has been demonstrated that individuals who are homozygous for AIRE mutations or
double AIRE knockout mice show a greater level of immune disfunction than those who are
heterozygous (Mathis and Benoist 2009). As a result it has been postulated that whilst individuals
who are homozygous for AIRE mutations develop APECED those who are heterozygous for
mutations show characteristics of other autoimmune disorders. In argument to this theory
however a study investigating the expression of common mutations in AIRE in a cohort

Chapter 1 Introduction
5
comprising of individuals with T1D, Addison’s disease, GD or HT showed no association of the
mutations (Meyer et al. 2001).
Conversely, a breakdown in the positive selection process may also lead to inappropriate
autoimmune responses. During the positive selection stages only T cells with high affinity to the
presented peptides receive the protective signal necessary to avoid apoptosis. However if an
abnormally large amount of any given peptide is presented then T cells with only weak affinity
will also react (McIver and Morris 1998). These cells when released into the periphery will react
to even small amounts of antigen.
As has already been stated some self reactive T cells will be released into the periphery with the
assumption that in a working system these will be indentified and removed by CD4+ regulatory T
lymphocytes (Tregs). Tregs present in the peripheral immune system, detect the presence of the
self-reactive T lymphocytes and send a destructive signal causing apoptosis preventing them
causing autoimmune attack (Abbas et al. 2004). A number of studies have shown that either a
reduction in the number of Tregs or a reduction in the suppressive abilities of the Tregs may
cause self reactive T cells to remain and lead to autoimmune disease (Brusko et al. 2008, Curotto
de Lafaille and Lafaille 2002, Paust and Cantor 2005, Tang et al. 2004).
Two of the most common autoimmune diseases are GD and HT, both of which are centred
around autoimmune attack against the thyroid gland. In total AITD represents 2-5% of the iodine
1.4 Autoimmune Thyroid Disease

Chapter 1 Introduction
6
replete western population. To be able to understand how autoimmunity in HT and GD affects
the normal function of the thyroid gland, the regulatory system of the hypothalamic-pituitary axis
in a euthyroid (defined as normal thyroid function) individual must be explored.
Thyroid hormone production by the thyroid gland is controlled by a cyclical mechanism relying
on both positive and negative feedback. The following describes the normal process of the release
of thyroid hormones within a euthyroid individual.
1.4.1 Mechanisms of thyroid function
The Hypothalamus, located in the brain just below the thalamus, secretes thyrotropin releasing
hormone (TRH) which acts as a stimulus to the anterior pituitary gland which is situated below
the hypothalamus. This results in the release of thyroid stimulating hormone (TSH) from the
anterior pituitary. The released TSH migrates to the thyroid gland where it binds to thyroid
stimulating hormone receptors (TSHRs) (previously known as thyrotropin receptors). As the TSH
binds to the TSHR it induces the catalyst thyroid peroxidase (TPO) to react with thyroglobulin
(Tg) causing iodinisation (Deme et al. 1976, Chistiakov 2003), which results in the formation of
thyroxine (T4). T4 is released from the thyroid and converted into its active form, triiodothyronine
(T3), by deiodination in the target tissues. Although the majority of T3 is produced outside of the
thyroid a small amount is produced within the thyroid by conversion of T4 whilst still in the
gland. The serum levels of T4 and T3 control the release of TSH from the anterior pituitary via
negative feedback; as serum levels of T4 and T3 increase, this is detected by the hypothalamus
and anterior pituitary gland and less TSH is released (Deneareaz and Lemarchand-Beraud 1995).

Chapter 1 Introduction
7
This mechanism therefore allows a constant level of serum T4 and T3 to be maintained. The
schematics of this process are shown in Figure 1.1. It is disruptions within this pathway that can
lead to the symptoms exhibited in AITD.
There are two main forms of disruption of the thyroid hormone system, hyperthyroidism and
hypothyroidism which are key features of the common AITDs GD and HT, respectively.
Although it is known that the thyroid and associated molecular pathways provide the basis for
GD, the actual mechanisms by which the disease is caused still await clarification. The
predominant feature of GD is hyperthyroidism. Atypical binding of TSHR autoantibodies
(TSHRAb) to TSHR (McIver and Morris 1998) causes constant stimulation of the TSHR. This
results in overactivity of the thyroid gland and hence the production of large quantities of thyroid
hormones (Cooper 2003). Due to the presence of these antibodies the normal mechanism of
negative feedback (see section 1.4.1) is disrupted. The TSHRAb bind to TSHR in place of TSH
stimulating the thyroid to produce T4 and T3, an effect which replicates the mechanism of normal
TSH binding. Whereas increasing serum levels of thyroid hormones would cause a reduction in
the release of TSH due to negative feedback the TSHRAb continue to bind to TSHR
independently of this negative feedback system. This causes a high concentration of T4 and T3 to
be present in the serum.
1.4.2 Graves’ Disease

Chapter 1 Introduction
8
Figure 1.1: The hypothalamic-pituitary axis
TSH: Thyroid stimulating hormone
TRH: Thyrotropin releasing hormone
T4: Thyroxine
T3: Triiodothyronine

Chapter 1 Introduction
9
The first few descriptions of the clinical manifestations of GD by Parry (Andrew 2004) and
Graves (Weetman 2000) led the way for further investigation and the full range of symptoms
associated with GD were soon uncovered. Early findings of hyperthyroidism, diffuse goitre and
exophthalmos were validated and what had previously been described as ‘palpitations’ were
attributed to tachycardia and arrhythmia; now recognized as a common symptom. In addition
increased bowel frequency, heat intolerance and hyperhidrosis of the hands (excessive sweating),
tremor and aspects of the ophthalmopathy described in earlier findings (also known as thyroid
eye disease (TED)) were also attributed to the effects of GD (Simmonds and Gough 2004b). The
onset of GD is typically in the 4th decade of life and a 5-10 fold increased female preponderance
is seen (Tunbridge et al. 1977). From the beginning GD was described as a disorder of the
thyroid, however it was not until the 1956 study by Adams and Purves (Adams and H.D. 1956)
that the underlying mechanism was explored. This study concerning the assay of thyrotropins led
to the discovery that autoantibodies directed at the thyroid stimulating hormone receptor (TSHR)
may be the cause of the hyperthyroidism experienced in GD (Adams and H.D. 1956, Evans
2002). The involvement of TSHRAb is now accepted and it has been found that 90% of GD
patients test positive for TSHR autoantibodies (Evans 2002). In addition the remaining 10% may
also exhibit TSHRAb but in such small amounts that current assays cannot detect them.
The mechanism outlined in the section 1.4.1 describes the cyclical process of the normal control
of thyroid hormone production, in HT this cycle is disrupted and hypothyroidism ensues. The
death of thyrocytes begins to increase beyond the rate at which they are replaced in a healthy
1.4.3 Hashimoto’s thyroiditis

Chapter 1 Introduction
10
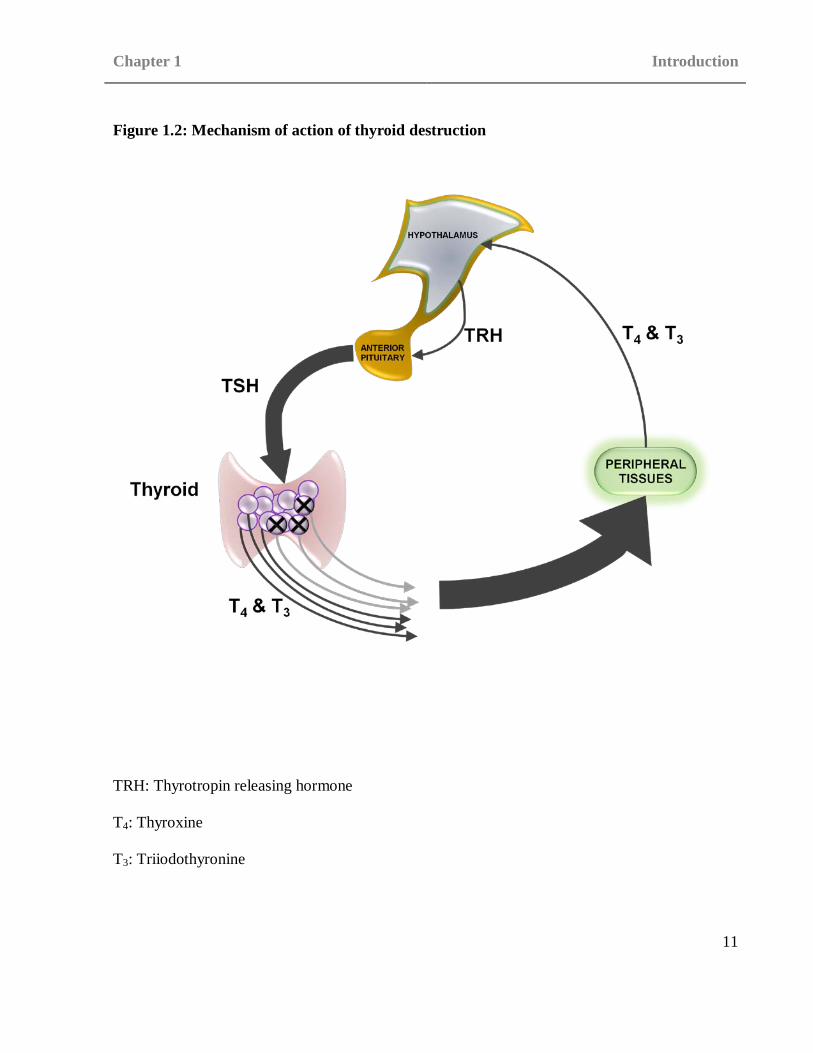
euthyroid individual the thyroids ability to produce T3 and T4 is reduced. This is due simply to a
reduction in the number of cells able to produce the hormones. In turn this leads to a decrease in
the serum levels of T3 and T4 and hence the levels of these hormones that are detected by the
hypothalamus. In reaction the hypothalamus increases the output of TRH stimulating the anterior
pituitary to increase the production of TSH in an attempt to stimulate the thyroid to produce
greater quantities of T3 and T4 (see Figure 1.2). Contrary to the eventual outcome of
hypothyroidism this can in fact lead to a transient state of hyperthyroidism caused by the
excessive production of T3 and T4 as a result of this feedback loop. This transient thyrotoxicosis
in combination with an initial and incorrect diagnosis of GD may also be the reason for some
theories which postulate that GD can transform in to HT.
In 1912 Hakaru Hashimoto first described four patients who had attended his clinic over the
course of 6 years (Hashimoto 1912). All four patients he noted were over 40 years of age and
female. These patients presented with slightly varying symptoms, the one common symptom to
all however was the appearance of a large ‘tumour’ in the neck. Hashimoto performed surgery on
all four patients and found that the thyroid gland was enlarged in each. He also ruled out the
possibility of this being a normal ‘tumour’ as no metastases were reported and all other organs
Chapter 1 Introduction
11
Figure 1.2: Mechanism of action of thyroid destruction
TRH: Thyrotropin releasing hormone
T4: Thyroxine
T3: Triiodothyronine

Chapter 1 Introduction
12
seemed healthy at the time (Hashimoto 1912). Following the operations Hashimoto kept tissue
samples to further investigate the cause of this enlargement. His most prominent finding was that
lymph tissue was abundant in the thyroid of these individuals, a fact which resulted in the
alternate and original name for HT, Struma lymphomatosa (Hashimoto 1912).
These early findings provided the first insight into the disease. It was not by coincidence that the
4 patients Hashimoto investigated were all female as a high female preponderance is displayed in
HT with women being five to seven times more likely to be affected than men (Vanderpump et
al. 1995). Again the ages of the four initial patients coincide with the later finding that HT most
commonly occurs in the fourth or fifth decade of life (Vanderpump et al. 1995).
Diagnosis
Initially the symptoms of HT may not be apparent. As the disease progresses and hypothyroidism
becomes more severe, visible symptoms may occur. Common symptoms include intolerance to
cold, mild weight gain, fatigue, constipation, dry skin, hair loss, heavy and irregular menses,
difficulty concentrating or thinking, joint stiffness and facial swelling (Hashimoto 1912). In some
cases mild thyrotoxicosis (a sometimes transient elevation of free T3 and T4. hyperthyroidism is a
subset of this) and in extreme cases myxedema (dermal and cutaneous edema caused by deposit
of large amounts of mucoproteins in the tissues) leading to a coma may occur. An enlarged
swelling in the neck or goitre may also be present as a result of either inflammation or
hashitoxicosis and late in the disease a small or atrophic thyroid gland. If a goitre is present it
may be unilateral or bilateral and will be diffuse and firm with pyramidal lobe enlargement.
Chapter 1 Introduction
13
If HT is suspected then levels of T3 and T4 should be investigated to confirm biochemical
hypothyroidism. Furthermore antibody tests are carried out to confirm the diagnosis with positive
antibodies to Tg or TPO indicating HT.
Treatment
The effects of the disease cause decreased levels of T4 to be present hence levothyroxine sodium,
a synthetic form of T4, is used as a replacement treatment. By replacing the T4 only, the lost T3
can also be regained via outer ring deiodination of T4 as would occur in a euthyroid patient (see
Figure 1.1). Whilst it is generally accepted that levothyroxine therapy is a suitable course of
treatment the actions of the levothyroxine and the dosage required are often brought in to
question. The dose required must be carefully adjusted throughout the course of the disease.
Some cases of HT result in a euthyroid state and therefore the withdrawal of therapy entirely may
be necessary in some instances (Lorini et al. 2003).
Other treatments have been postulated and studied, one of the most notable being the use of
selenium. The deiodination of T4 to produce T3 (see Figure 1.1) occurs via enzymes containing
selenocysteine. Whilst three types of deiodination enzyme are present in the body, each acting in
different tissues all three are reliant on adequate resources of selenocysteine, a source of
selenium. In addition to this glutathione peroxidases are selenium based antioxidant enzymes
which catalyse the breakdown of reactive oxygen species such as hydrogen peroxide. A reduction
in the normal levels of these selenoproteins can lead to inefficient and incomplete breakdown of

Chapter 1 Introduction
14
the reactive oxygen species and result in inflammation. This may be a causal factor in not only
HT but several AIDs (Duntas 2008). In support of these theories and findings selenium
deficiency has been shown to have an adverse effect on the deiodination rate in rats (Stefanou
and Wooster 1975) whilst selenium therapy has been shown to have a suppressive effect on TPO
antibodies in human studies (Mazokopakis and Chatzipavlidou 2007). This preliminary evidence
suggests that selenium may be beneficial in the treatment of HT. There is however no evidence to
indicate that selenium improves thyroid function significantly and is therefore not used routinely
as a treatment for HT.
Levothyroxine treatment manages HT resulting in lifelong medication, rather than cure it. There
has been little investigation in to the possibility of more aggressive treatments involving targeting
the autoantibodies themselves or a more permanent cure.
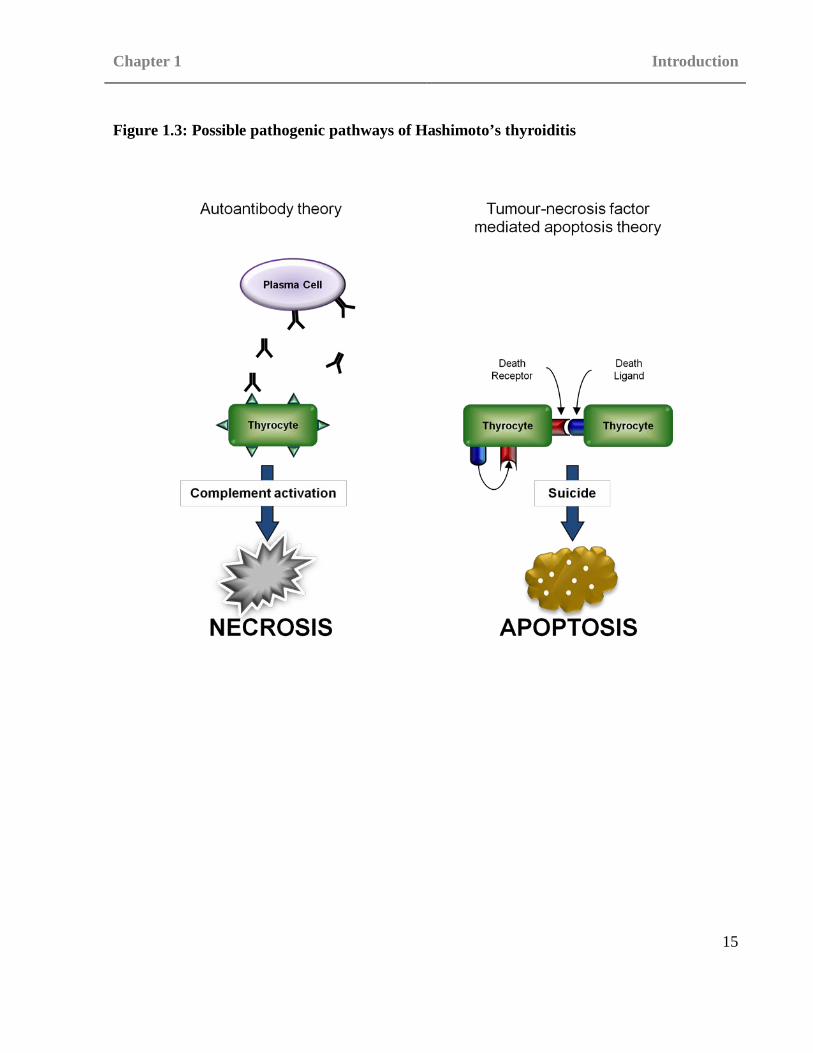
There is little available data on the pathogenesis of HT. Whilst some aspects of the etiology are
known (see section 1.5) the actual mechanisms and pathways that result in the formation of
disease are harder to elucidate. The involvement of the death of thyrocytes and the resulting
impact on T4 and T3 plasma levels is accepted. However, although thyrocyte death is a known
fact of HT the mechanism behind it remains unclear. There are several theories and studies which
support various possible mechanisms of either apoptosis or necrosis of the thyrocytes (see figure
1.3).
1.4.4 Pathogenesis of Hashimoto’s Thyroiditis
Chapter 1 Introduction
15
Figure 1.3: Possible pathogenic pathways of Hashimoto’s thyroiditis

Chapter 1 Introduction
16
Tumour-necrosis factor mediated apoptosis
As thyrocyte death is a feature of HT changes within the pathways causing apoptosis may be
linked to HT onset. One of the theories suggested centres around tumour-necrosis factor
receptors, in particular the death receptor Fas (also known as TNF receptor superfamily, member
6) and the Fas ligand (FasL) and their roles in apoptosis. One method by which apoptosis occurs
is that death receptors such as Fas on the target cell interacts with the ligands present on the T
cell such as FasL causing the apoptotic chain to commence. The first step within apoptosis
involves the activation of pro-caspases 8 or 10. Active caspases 8 or 10 initiate the mitochondrial
membrane of the target cell to become damaged, cellular respiration to cease and finally the
activation caspases 3, 6 and 7 which lead to fatal changes in the cell membrane, cytoskeleton and
nucleus causing cell death (Lumachi and Basso 2002). The study of Fas and FasL highlights the
opposing natures of HT and GD. Several studies have shown that Fas/FasL were upregulated and
expressed in thyrocytes of HT patients indicating that this raised level may be responsible for the
thyrocyte destruction seen as the disease progresses (Salmaso et al. 2002, Xu et al. 2007, Stassi
and De Maria 2002, Chistiakov 2005).
The Fas mediated thyrocyte death seen in HT is not just due to the presence of T cells, these
thyrocytes are able to produce both Fas and FasL on their cellular surface (Giordano et al. 2001).
This allows fratricidal apoptosis to occur where one thyrocyte induces the death of another
independent of T cell interaction (Lumachi and Basso 2002, Chistiakov 2005). Interestingly,
Interleukin-1β (IL-1β) is expressed in the thyroid, which stimulates Fas expression in normal
thyrocytes pointing towards a potential pathway for the upregulation seen of Fas/FasL. It remains
Chapter 1 Introduction
17
unclear however whether the upregulation of Fas/FasL seen in HT patients is independent of IL-
1β or not.
Autoantibodies
Although it is clear that autoantibodies are present in HT including TPO and Tg, their exact role
in the onset and pathogenesis of the disease remains to be validated. At present it is unclear
whether the autoantibodies present are the trigger or the result of an autoimmune attack. This is
due in part to the variable titres of autoantibodies detected in HT patients and the presence of
autoantibodies (albeit in lower levels) in healthy euthyroid patients (Nielsen et al. 2008).
The TPO autoantibodies found in HT are able to fix complement. As such, a theory has been
proposed suggesting that TPO autoantibodies may be responsible for the thyrocyte death seen in
HT (Blanchin et al. 2003, Stassi and De Maria 2002). The complement pathway plays an integral
role in the innate immune system and may also be utilised by the adaptive immune system. There
are three complement pathways, classical, alternative and lectin which, whilst different in the
initial stages, all result in similar final stages of the pathway. The classical complement pathway
is the only one which is typically due to a specific immune response and is mediated by
antibodies (the alternative pathway is stimulated by direct contact with pathogen surface
molecules whereas the lectin pathway is stimulated by mannose binding lectin). At the end of the
complement pathway the membrane attack pathway is activated and subsequently the membrane
attack complex is formed from cytokine fragments C5b, C6, C7 and C8. This complex is a

Chapter 1 Introduction
18
transmembrane channel which effectively changes the osmotic pressures on the cell causing
necrosis.
Environmental cause
One theory suggests that HT is either caused, or the onset of disease induced in an already
predisposed individual, by an inflammatory event. An environmental causal factor such as
variation in iodine levels or bacterial/viral infection may affect the thyroid causing an
inflammatory response and an influx of dendritic cells and macrophages which could be the
trigger to activate other immune cells resulting in an autoimmune response. (see section 1.5.1)
(Chistiakov 2005). This theory also links to the Selenium therapy mentioned in the discussion of
the treatment of HT in section 1.4.3. A deficiency in the levels of selenium would cause a
prolonged and intensified inflammatory response (Duntas 2008). This may then cause a
heightened sensitivity to pathogens resulting in self antigens being recognised as non-self.
The vast majority of the original work concerning AITD was performed using either solely GD
patient cohorts or mixed cohorts where GD and HT were grouped together. As a result the work
discussed in the following sections is concentrated on GD and mixed AITD cohorts.
1.5 Genetic and environmental causal factors of AITD
Some of the most striking evidence for a genetic basis to AITD can be seen in the twin studies
performed. In two studies of Danish twins GD concordance rates of 0.35-0.36 and 0-0.07 were
found for monozygotic (MZ) and dizygotic (DZ) twins respectively (Brix et al. 2001, Brix et al.

Chapter 1 Introduction
19
1998). In a similar Californian based study concordance rates of 0.17 and 0.019 were found for
MZ and DZ twins respectively (Ringold et al. 2002). A further study by Brix et al. attempted to
investigate HT in a Danish twin cohort. Only 24 HT patients were used with 3 MZ pairs
displaying concordance and 0 DZ pairs showing concordance. The low numbers were taken into
consideration and “crude” concordance rates of 0.55 for MZ twins and 0 for DZ twins were
reported (Brix et al. 2000). Although this does point towards a genetic component to HT the
study requires replication in a much larger cohort to verify the findings. This method of using the
comparison of MZ and DZ twin pairs is well established for demonstrating the existence of a
genetic component in the causal factors of a disease (Osborne et al. 1958). Whilst MZ twins
share one hundred percent of their genetic material DZ twins do not, as each is formed from a
separate fertilised egg. In most cases however, both MZ and DZ twins share environments hence
the comparison of concordance rates between MZ and DZ twins can help elucidate whether the
causal factors for a disease are genetic and/or environmental factors. The two sets of concordance
rates gained from the Danish and Californian GD studies along with a concordance rate of 0.036
between probands and first degree relatives (defined as a relative who is separated by a single
meiotic division from the proband and hence shares around 50% of genetic information, i.e.
parent, sibling, child) in the Californian (Ringold et al. 2002) indicate that there is a definite
genetic influence; however they also demonstrate that there are other aspects which need to be
investigated concerning the causal factors affecting the development of AITD. With a disease
whose only causal factors are genetic, a concordance rate approaching 1.00 would be expected
for the MZ twin sets. The concordance rates for MZ twins in the GD studies fall far below the

Chapter 1 Introduction
20
1.00 mark indicating that the development of GD in an individual is influenced by factors other
than a germline variant, be it a somatic variation or environmental factor.
These and other familial clustering and twin studies have clearly demonstrated that AITD does
not occur because of a single gene defect and does not follow a simple pattern of Mendelian
inheritance (Evans et al. 1967, Stenszky et al. 1985, Farid 1981). With a single gene defect a
clear path of inheritance from parent to child would be expected, although AITD clusters in
families it does not necessarily passed from one generation to another and often is found to skip
generations (Farid 1992). This irregular pattern of inheritance is characteristic of many of the
common medical conditions which are now referred to as complex diseases in which both genetic
and environmental factors contribute to disease development (Simmonds and Gough 2004a). This
pattern may also imply that AITD is caused by genetic variations conforming to the ‘two-hit
mutation’ theory (Nordling 1953, Knudson 1971). This theory suggests that a germline
polymorphism or mutation is indeed inherited but that this alone is not enough to cause disease.
For the disease to develop a second somatic or germline polymorphism or mutation must also be
present. Although referred to as the two hit mutation hypothesis a disease may require three or
more mutations to fully develop (Tomlinson et al. 2001). This theory may well account for the
erratic pattern of inheritance seen in AITD. If a single mutation is inherited then the progeny will
have the potential to develop AITD but will require at least one other mutation to occur for the
eventual disease state to develop. This has led to the use of statistical modelling as a possible
means of identifying the genetic contribution to AITD. The previously mentioned study by Brix
et al. which investigated the concordance rates in Danish twins used statistical modelling to
Chapter 1 Introduction
21
determine the impact of genetic contribution to GD which they proposed was around 79% (Brix
et al. 2001). This indicates that the inherited component to AITD is likely to arise from numerous
common and also rare genetic variants, with contributions from all over the human genome,
producing a “DNA fingerprint” that confers an increased risk for the development of disease
(Brickman and Shoenfeld 2001). Although the genetic factors are almost certainly the main
causal factors in AITD the impact of potential environmental factors should not be ruled out.
To investigate the majority of environmental factors patients are interviewed and the relevant
history taken including family history if applicable. This method of data collection may cause
inconsistencies in the data for these studies due to the reliance on patient testimony for a number
of environmental factors. Embarrassment for example may lead a patient to under-quote the
number of cigarettes smoked a day or units of alcohol consumed. For the vast majority of
environmental factors however previous notes and documentation may be available to aid with
this possible pitfall. A range of statistical tests may be performed on the collated data including
assessment of the mean for factors such as age of onset, comparison of environmental factors
against physical or biochemical findings such as smoking versus NOSPECS score or variations in
physical and biochemical findings between males and females.
1.5.1 Environmental Factors in AITD
Infection
It remains unclear as to whether infection is a significant causal factor for HT (see section 1.4.3
for further information on the pathogenesis of HT). There has been some evidence however for

Chapter 1 Introduction
22
bacterial infections, in particular Yersinia enterocolitica as causal factors for both HT and GD
(Corapcioglu et al. 2002). Y.enterocolitica displays molecular mimicry to TSH whereby the
bacteria closely mimics the binding sites displayed on TSH without being identical. As the
binding sites are not completely identical the host system recognises the presence of a foreign
antigen and launches an immune attack accordingly. The similarity of the Y.enterocolitica
binding sites to the TSH binding sites is so great however that cross reactive antibodies, those
which respond to TSH rather than Y.enterocolitica can occur. Whilst some weak correlation
between autoantibody titres and Y.enterocolitica infection have been shown (Corapcioglu et al.
2002) there is little evidence to support this particular model of infection as a causal factor for
AITD.
Smoking
Conventionally smoking has been associated with increased risk of AITD and associated
symptoms, in particular the severity of thyroid eye disease in GD (Manji et al. 2006, Fukata et al.
1996, Holm et al. 2005, Vestergaard 2002). The effects are presumed to centre on two
constituents of cigarette smoke, nicotine and tar. They have been shown to affect the expression
HLA, most notably that of HLA-DR (Muller et al. 1995). This change in expression causes
changes in the presentation of antigens by APCs hence the actions of T cells during positive and
negative selection (Vestergaard et al. 2002) (see section 1.2). There is some evidence to suggest
that smoking can have a positive effect on at least one aspect of HT though. Several studies have
shown negative correlations between smoking and TPO antibodies in patients with AITD
(Strieder et al. 2003, Goh et al. 2004, Belin et al. 2004). It is thought that one explanation is the

Chapter 1 Introduction
23
inhibitory effect of thiocynate, a component in cigarette smoke, on iodide organification in the
thyroid (Fukayama et al. 1992). As organification is catalysed by TPO a reduction in the TPO
levels may give rise to a smaller immune response against that particular antigen.
Iodine
Iodine is a central part of the normal mechanisms of the thyroid with both T3 and T4 being iodine
based hormones (see section 1.4.1). Several animal based studies have shown the ability of
increased iodine intake to affect normal thyroid function and induce hypothyroidism and
thyroiditis (Rasooly et al. 1996, Follis 1964, Allen et al. 1986). Furthermore there is evidence
that Tg reactive T cells show a greater affinity for highly iodinated Tg than low iodinated Tg
(Sundick et al. 1987). An increased dietary intake of iodine may therefore lead to a heightened
immune response increasing the possibility of an inappropriate response such as one directed at
self.
It is thought that the involvement of the TPO autoantibodies play a more prominent role than
those of the Tg autoantibodies in HT (see section 1.4.3). Increased dietary iodine has been shown
to cause hypothyroidism, in particular when iodine supplements are introduced in geographical
areas of poor iodine intake (Harach et al. 1985). However this observed hypothyroidism may not
be associated with the autoimmune forms seen in AITD.

Chapter 1 Introduction
24
1.6 Genetics of AITD
It has long been established that there is a genetic component to both HT and GD. The primary
concern of early AITD studies was to determine whether there was a genetic component to both
GD and HT rather than assessing the exact causal loci. As has been previously mentioned, little
work has been done concerning HT alone and the majority of the early genetic studies have been
performed using either mixed cohorts or solely GD cohorts. A variety of different methods have
been used to investigate the genetics of AITD including case control and genome wide studies.
1.6.1 Identification of Genetic causal factors
Candidate Gene studies
Candidate gene studies are based on a prior knowledge or theory of the pathogenesis of the
disease or of similar diseases. This may be either from a general hypothesis, such as the
investigation of the genes involved in the immune response in autoimmune diseases or from a
previous non-genetic study where a protein or molecule was found to be present in abnormal
amounts in the sera of affected patients. In AIDs there is a certain amount of crossover of genetic
causal factors. The common autoimmune association means that a gene associated with one AID
may well be associated with another, in particular if the gene or gene region in question plays a
major role in the autoimmune response in a healthy individual.
Once a gene has been chosen variations within that region are investigated in candidate control
studies by comparison of unrelated affected subjects with control subjects who are unrelated and
unaffected and are matched to cases for sex, age, ethnicity and all other variables with the

Chapter 1 Introduction
25
exception of disease state . Alternatively in family based studies the affected subjects may be
compared with unaffected individuals from the same family.
Linkage disequilibrium-mapping and Tag Single nucleotide polymorphisms (SNPs)
Early candidate gene studies examined only one or two polymorphisms due to the constraints of
time, expense and knowledge of the gene region. This lead to some genes being falsely excluded
as susceptibility loci as the small portion tested was not associated but other areas within the
same gene region were later discovered to be associated such as the early work performed on
TSHR (Cuddihy et al. 1995). Linkage disequilibrium (LD) is a measure of the probability that
two markers will be inherited on the same haplotype (see chapter 2 section 2.8.4 for further
detail). Utilising the strong LD seen in some regions one SNP can be chosen which will give a
good representation of the associated LD block and several other SNPs within that block
allowing a more comprehensive coverage of the gene region of interest (see Figure 1.4). This
allows for an estimation of a large number of genotypes by only typing a few that capture, or tag,
a block of LD (Johnson et al. 2001).
Genome wide linkage studies
Genome-wide screens can be used to investigate entire genomes for loci which show signs of
association with disease. One strength of genome wide screens is that a prior hypothesis is not
required. One method used is based on the presence of short tandem repeats (STRs) within the
genome. These STRs are normally composed of di-, tri- or tetra-nucleotide repeats and are known
as microsatellites. Microsatellites are highly polymorphic; in combination with their

Chapter 1 Introduction
26
Figure 1.4: Haplotype formation of SNPs in high and low LD
Complete LD allows for only one haplotype to be formed. Low levels of linkage allow for several
different SNP combinations.
SNP selected
1.0 0 0.8 D
A/G C/T T/G
A T T A T G G T T G T G
A C G G C G A C T G C T
SNPs with low LD
C/A A/G C/T A/G
LD block
C A A C
A G G T
Chapter 1 Introduction
27
frequent appearance in the genome they can be used as markers to identify associated loci.
Following the completion of the first family based genome wide linkage study in type 1 diabetes
(T1D) (Davies et al. 1994), many investigators adopted this approach to identify novel
susceptibility loci for complex diseases. Using microsatellite markers, a number of linkage
studies and genome wide scans have been conducted in AITD (Tomer et al. 1999, Tomer et al.
2003, Taylor et al. 2006, Sakai et al. 2001). One of the first of these was performed by Tomer et
al in 1999 on 56 multiplex families and identified six regions of linkage to GD, HT and AITD,
AITD-1 (6p), GD-1 (14q31), GD-2 (20q11.2), GD-3 (Xq21), HT-1 (13q32) and HT-2 (12q22)
(Tomer et al. 1999). HT-1 was found to show linkage in all HT families within the cohort
whereas HT-2 was linked only in the European HT families and not in the North American
families. Upon expansion of the dataset GD-3 and HT-1 were not replicated and three new
markers D7S502 (7q), D8S284 (8q) and D10S537 (10q) were proposed as susceptibility loci
(Tomer et al. 2003). Disparity is also seen when comparing these studies to that of Taylor et al,
where only 3 areas of possible susceptibility were identified 18p11, 2q36 and 11p15 (Taylor et al.
2006).
Whilst putative loci have been reported for AITD, few if any linkages have been convincingly
replicated and none of the chromosomal regions of linkage, including HT-2, have led to the
identification of a novel locus. The conclusions drawn from many of these studies is that linkage
analysis alone is unlikely to deliver a significant number of new loci in complex disease, largely
in part, because of inadequate sample size (Wang et al. 2005).
Chapter 1 Introduction
28
A recent initiative has aimed to overcome many of the problems seen in previous genome-wide
screens and linkage studies. The Wellcome Trust Case Control Consortium (WTCCC) has
conducted several large association studies in which the cohort size is far greater than previous
studies. The second major improvement made in these studies is the switch from microsatellite
markers to the use of SNPs. Whilst new STRs appear more frequently than new SNPs the overall
number of SNPs is normally greater than the overall number of STRs in a given region (Xing et
al. 2005, Ulgen and Li 2005). For this reason the use of SNPs in this project has allowed a more
detailed analysis of the genome by investigating a greater number of markers.
The WTCCC investigated 14,436 non-synonymous SNPs throughout the genome and 897 SNPs
from within the HLA region, in 4 diseases; GD, breast cancer, multiple sclerosis and ankylosing
spondylitis. For each disease a cohort of 1000 samples was used and a common control cohort of
1500 samples. Several associated SNPs were discovered for GD including numerous associations
within the HLA region, 3 SNPs in FCRL5 and one in each of FLJ32784, FCRL3, MRPL53,
HDLBP, PPP1R3B, ADRA1A, ZNF268, TEKT1, ADCYAP1, AMH and UTX. An associated SNP
was also found in TSHR in an expanded data set (Burton et al. 2007).
Problems surrounding the identification of the genetic causal factors for HT
The primary difficulty in elucidating the genetic components of AITD is that the individual
genetic effects at each locus are small. As previously stated AITD is not a monogenic disease, the
collective effect of the multiple mutations and polymorphisms may be considerable and indeed

Chapter 1 Introduction
29
enough to confer disease. However it seems likely that the majority of individual loci confer odds
ratios (OR) for the development of disease between 1.2 and 1.5 (Wang et al. 2005).
As a consequence, the sample sizes in almost all the early candidate gene population based case
control studies, have been too small to detect these effects, whilst at the same time generating
non-reproducible false positive results (Ioannidis et al. 2001). Sample sizes and power
calculations depend greatly on allele frequencies and the size of effect expected. Generally,
therefore, whilst some small studies have identified and excluded true specific effects, those with
less than 500 cases and 500 controls could be viewed with caution as they may be too small to
provide reliable, reproducible data (Dahlman et al. 2002).
1.7 Genetic Causal Factors for AITD
There are few indentified genetic causal factors for HT. Of note are the HLA region (discussed in
chapter 3) and CTLA4, Tg and PTPN22. It is worth however investigating the studies showing
associated regions to GD and general AITD cohorts as they may provide some insight into future
candidate genes for HT. (see diagram 1.5 for the schematic of the interactions of the molecules
encoded by these genes)

Figure 1.5: Some of the suggested and confirmed susceptibility loci for GD involved in antigen presentation to T cells

Chapter 1 Introduction
31
CTLA4
CTLA4 is a negative regulatory molecule central to the immune system. It inhibits T cell
responses by opposing the action of CD28, molecule which promotes T cell actions (Gough et al.
2005). CTLA4 was first reported to be associated with GD (Yanagawa et al. 1995), since then it
has also been shown to be associated with HT (Ueda et al. 2003) and many AIDs (Gough et al.
2005). Initially only four polymorphisms were known and investigated including an (AT)n repeat
sequence in the 3’ untranslated region which was associated with potential functional effects
(Braun et al. 1998, Vaidya et al. 1999, Yanagawa et al. 1995, Heward et al. 1999a).
At this stage the primary disease determinants within this gene region remained unknown. A
large resequencing effort and fine mapping of all common variants detected within the gene
allowed GD susceptibility to be mapped to four SNPs (CT60, J030, JO31 and JO27_1) within a
non-coding 6.1kb region. The common allelic variation (G allele) of the CT60 SNP was
associated with lower messenger RNA levels of the soluble alternative splice form of CTLA. The
CT60 SNP was shown to have an association with HT (OR=1.45, 95%CI=1.17–1.80); P=0.0005)
in the same study (Ueda et al. 2003). Association of the CT60 SNP with GD has since been
confirmed by several independent studies including a recent meta-analysis using data collected
from 7246 GD patients which showed a significant association (Kavvoura et al. 2007). The
association has also been confirmed in HT (Donner et al. 1997). In contrast to the large numbers
available for the GD studies and meta-analysis it should be noted that the two HT studies had
patient cohorts of only 228 and 73 respectively and that similar studies showing association of
CTLA4 with HT have also used small patient cohorts (Kotsa et al. 1997, Nithiyananthan et al.

Chapter 1 Introduction
32
2002). These findings have yet to be replicated in large numbers. The mechanism by which
polymorphism of CTLA4 acts to inhibit autoimmunity and specifically the role of soluble, as
opposed to full length CTLA4, currently remains unknown (Gough et al. 2005), but is the subject
of ongoing functional analysis.
Tg
Two genome wide linkage studies have reported evidence for linkage between AITD and
chromosome 8q24 (Sakai et al. 2001, Tomer and Greenberg 2004). This is however inconsistent
with the findings of the largest linkage study to date which observed no evidence for linkage
between chromosome 8q24 and AITD nor GD or HT (Taylor et al. 2006). Tg maps to
chromosome 8q24 and a number of candidate gene case control association studies have been
conducted examining both microsatellite (Collins et al. 2003) and SNP markers (Ban et al. 2003,
Collins et al. 2004a) The original study by Collins et al. demonstrated weak association of the
intron 27 Tg microsatellite with AITD (P < 0.001) (Collins et al. 2003). It was however
presumed at the time that this may be a false result. This conclusion was strengthened by the
second study performed by Collins et al. in which no association of Tg with AITD was noted
(Collins et al. 2004a). Whilst no association was found in these studies Ban et al. described
association of a SNP cluster in exons 10 and 12 and also of a separate SNP within exon 33 (Ban
et al. 2003). Although Tg autoantibodies are seen in both HT and GD, making Tg a viable
candidate gene, findings have been inconsistent with the largest association study to date
providing no evidence for association between Tg markers and AITD (Collins et al. 2004a).
However, as was the case with the early CTLA4 association studies only a fraction of the gene

Chapter 1 Introduction
33
has been tested for association with AITD. This may be improved upon in further years following
the resequencing of all exons within Tg and the genotyping of all exonic SNPs (Ban et al. 2003).
PTPN22
PTPN22 located on chromosome 1p13 encodes a protein PTPN22 (also known as LYP). PTPN22
inhibits T cell signalling by dephosphorylating autophosphorylation sites on Src kinases hence
preventing activation of T cells. PTPN22 interacts with several accessory molecules including
protein tyrosine kinase Csk and Grb2 (Brand et al. 2005, Bottini et al. 2004). Initially association
of PTPN22 was reported in T1D (Brand et al. 2005, Smyth et al. 2004) and this was soon
followed by positive associations in AITD (Smyth et al. 2004, Velaga et al. 2004) and also in
other autoimmune diseases including systemic lupus erythematosus (Kyogoku et al. 2004) and
rheumatoid arthritis (RA) (Begovich et al. 2004).
The association of PTPN22 with several AIDs suggests that this may be a general susceptibility
locus for AID. This theory is supported by the functional knowledge of both the general role of
PTPN22 as mentioned above and also the specific effects of the C and T allelic variants of the
associated 1858 SNP (rs2476601). It has been demonstrated that the change from the major allele
C to the minor allele T causes a change of the amino acid sequence encoded by this region at
position 620 in PTPN22 (Bottini et al. 2004). The common allele encodes arginine and the rarer
allele tryptophan. This change in amino acid also changes the binding properties of PTPN22 with
protein tyrosine kinase Csk with the rarer allele form tryptophan leading to a reduction in the
ability of PTPN22 to inhibit T cell activation. This results in a change from arginine in the
Chapter 1 Introduction
34
common form to tryptophan in the rarer allele, which in turn affects the binding properties of
PTPN22 with protein tyrosine kinase Csk. The rarer T allele leads to a reduction in the ability of
PTPN22 to inhibit T cell activation, resulting in an exaggerated immune response (Bottini et al.
2004).
The rs2476601 SNP appears to be common to a number of AIDs, however other independent
associations within the PTPN22 gene region have been detected, with different patterns of
association observed in individual diseases (Michou et al. 2007, Heward et al. 2007, Carlton et
al. 2005, Onengut-Gumuscu et al. 2006). In GD several disease specific haplotypes have been
identified, in particular the strongly associated AATTCT 6.77x10⁻⁸ and the strongly protective
AACTTT 3.7x10⁻⁵ (both corresponding to alleles from each of the following SNPs (rs2488458 ,
rs12730735, rs2476601, rs1310182, rs1217413 and rs3811021) (Heward et al. 2007). These
disease specific haplotypes suggest that the mechanism by which PTPN22 confers susceptibility
to GD may be different, for example, to T1D and RA.
In addition there is one notable report of HT specific association in a cohort of size. In a study by
Criswell et al. 256 multiplex families which contained at least two different autoimmune diseases
within the family were investigated for association with PTPN22. From the families chosen 746
affected individuals, of which 194 were affected with HT, were compared to 2,064 unaffected
control subjects. An association of the T allele of rs2476601 SNP with HT was noted with
OR=1.77, 95%CI=1.31-2.40 (Criswell et al. 2005).

Chapter 1 Introduction
35
Commonality and distinction in AITD genetic causal factors
Whilst for many genetic studies HT and GD are combined and referred to as AITD, which
suggests a single diseases state, more information is becoming available to suggest that these two
diseases are distinct conditions. HT and GD represent two extremes of the AITD spectrum. HT is
primarily a hypothyroid disorder characterized by the presence of hypothyroidism together with
positive antibodies directed against Tg or TPO. In contrast GD is typified by hyperthyroidism and
autoantibodies directed against the TSHR in addition to those against Tg and TPO. Many of the
genetic studies focusing on AITD have either grouped both HT and GD patients together as a
single cohort or have focused solely on GD. This is in part due to the lack of large cohorts
available for HT studies; hence to obtain the power necessary for a viable statistical result the
cohorts have been predominantly GD where larger cohorts are more readily available. This, in
turn, means that whilst many of the causal genetic factors for GD have been established there are
few confirmed results for HT. Interestingly although GD and HT share several genetic factors,
there are genetic differences already established between these diseases for the CD40 and TSHR
genes.
CD40
Genome wide microsatellite screening has linked chromosome 20q11.2 to GD and has been
designated GD-2 (Tomer et al. 1999, Tomer et al. 2003). Further weak support for this result was
present in 12 UK Caucasian sib-pairs who appeared to have dominantly inherited GD (Pearce et
al. 1999), although no evidence for linkage was found in the largest linkage study to date of 1119
Caucasian sib-pairs (Taylor et al. 2006). CD40 has been mapped close to the initial region of

Chapter 1 Introduction
36
linkage and a single Kozak SNP has been reported to be associated with GD in a study by Tomer
et al. (Tomer et al. 2002a). Whilst this result has been replicated in Koreans (Kim et al. 2003)
and Japanese (Ban et al. 2006, Mukai et al. 2005) this has not been the case in two large UK
Caucasian cohorts (Houston et al. 2004, Heward et al. 2004). The Kozak SNP investigated by
Tomer et al. was shown not to be associated with HT (Tomer et al. 2002a) and to date, no
association has been reported with HT.
TSHR
Autoantibodies targeted against the TSHR can both stimulate and inhibit the thyroid gland with
the stimulating antibodies leading to hyperthyroidism and the classical clinical features of GD
(Weetman 2000) (see section 1.4). Using a combination of the TagSNP approach and SNPs
previously examined in earlier studies, a total of 40 SNPs were examined in two large
independent AITD case control cohorts; one International cohort with 2030 subjects and one
exclusively UK with 2427 subjects (Dechairo et al. 2005). Convincing, replicated statistical
evidence for association of a number of intronic SNPs with GD in the Caucasian population was
found. A lack of association with HT identified the TSHR as the first GD specific susceptibility
locus.
Clustering of Autoimmune Diseases
The clustering of apparently separate AIDs within one individual has been recognised as
relatively common, occurring in around 25% of individuals with an existing AID (Mohan and
Ramesh 2003). The presentation of three or more separate AIDs in one individual has been

Chapter 1 Introduction
37
classified as multiple autoimmune syndrome of which there are three groupings. Type I includes
myasthenia gravis, thymoma, polymyositis and giant cell myocarditis, Type II includes Sjögren's
syndrome, RA, primary biliary cirrhosis, scleroderma and AITD and Type III comprises AITD,
myasthenia gravis and/or thymoma, Sjögren's syndrome, pernicious anaemia, idiopathic
thrombocytopenic purpura, Addison's disease, insulin-dependent diabetes, vitiligo, autoimmune
haemolytic anaemia and systemic lupus erythematosus (Humbert and Dupond 1988). The
clustering of more than one type of AID in families and also in individuals indicates that there
may be a shared component in the cellular or molecular pathways responsible for the
manifestation of some AIDs. This theory of a common cellular or molecular pathway is further
supported by the one common theme in all AIDS, the presence of self reactive antibodies.
When investigating the causal factors of a single disease it is unquestionable that a significant
result, be it a positive or negative association will further the understanding of that disease.
Taking note of the theory of common causal components between AIDs it can be seen though
that a significant finding in one AID may also aid in the future research and understanding of
other AIDs. Extending this theory further it may also mean that a greater understanding of
autoimmune disease in general can be gleaned from findings of common or similar genetic and
environmental causal factors. For this study the HLA gene region is being investigated for
association with HT, one of the contributing factors in the choice of this region was the previous
associations seen with not only GD but also with other AIDs (see Chapter 3).The results from this
study and others like it will in turn go on to provide starting points for the investigation of causal
genetic factors and pathogenic pathways for other AIDs.

Chapter 1 Introduction
38
The association of CD40 and TSHR and several other genes (see Table 1.1) with GD but not HT
does not necessarily imply that they are not common AITD susceptibility loci. As previously
stated most HT genetic studies have been performed on small cohorts, many of which would
have been greatly underpowered had they revealed an association. The multifactorial nature of
HT means that many, if not all genetic causal factors will have a low odd ratio (OR) making them
almost impossible to reliably detect in small cohorts (see Chapter 2, section 2.8 for the definitions
and explanations of power and OR). On the other hand these GD only associations may be just as
they seem and may be GD specific associations not shared by HT. The extreme difference
between both the symptoms of GD and HT and also between the cellular pathways of
pathogenesis for these diseases suggests the presence of at least some separate causal factors.
One genetic region where there is much confusion over whether HT and GD are identical is at the
HLA class II region. HLA class II molecules play a crucial role in peptide presentation to T cells
both in the periphery and in thymic selection. For this reason HLA class II has been investigated
as a candidate gene for a wide range of AIDs (Simmonds and Gough 2004a). HLA class II has
already been shown to have associations not only in GD (Heward et al. 1998) but also in several
other autoimmune diseases such as T1D (Todd 1995), systemic lupus erythematosus (SLE)
(Graham et al. 2002) and RA (Weyand et al. 1992). Due however to the aforementioned use of
small HT datasets combined with a lack of replication between studies, progress in determining
HLA class II associations in HT has been much slower. This leaves a degree of uncertainty
pertaining to whether GD and HT share the same susceptibility loci within this region (see
Chapter 3).
Table 1.1: A summary of genes investigated for association with Graves’ disease

Chapter 1 Introduction
39
Locus Reference CONSISTENTLY REPLICATED
CTLA-4 (Furugaki et al. 2004), (Ueda et al. 2003), (Vaidya et al. 1999), (Yanagawa et al. 1995)
HLA Class II (Ban et al. 2004), (Chen et al. 2000), (Simmonds et al. 2005c), (Ban et al. 2004), (Wongsurawat et al. 2006)
PTPN22 (Heward et al. 2007), (Smyth et al. 2004), (Velaga et al. 2004) TSHR (Dechairo et al. 2005), AWAITING CONFIRMATION CD25 (Brand et al. 2007) IDDM2 (Taylor et al. 2006) IFIH1 (Sutherland et al. 2007) IRF1 (Yang et al. 2005) LMP2 (Heward et al. 1999b), (Vives-Pi et al. 1997) LMP7 (Heward et al. 1999b), (Vives-Pi et al. 1997) PDCD1 (Newby et al. 2007) TCR-β (Demaine et al. 1989), (Pickerill et al. 1993), (Zhang et al. 2000) TNFα (Nakkuntod et al. 2006a), (Simmonds et al. 2004)
TPO (Kotani et al. 1986a, Kotani et al. 1986b) , (Ludgate and Vassart 1990), (Pirro et al. 1995)
UGRP1 (Yang et al. 2005) INCONSISTENT FINDINGS
CD40 (Heward et al. 2004), (Houston et al. 2004), (Jacobson et al. 2005, Jacobson et al. 2007), (Tomer et al. 2002a)
FCRL3 (Kochi et al. 2005), (Owen et al. 2007), (Simmonds et al. 2005a) FOXP3 (Ban et al. 2007), (Owen et al. 2006)
HLA Class I (Farid et al. 1976), (Grumet et al. 1974), (Huang et al. 2003), (Mather et al. 1980)
IL-13 (Bednarczuk et al. 2003), (Bednarczuk et al. 2003), (Simmonds et al. 2005b)
IL-1RN (Blakemore et al. 1995), (Muhlberg et al. 1998) IL-4 (Heward et al. 2001), (Yang et al. 2005)
Tg (Collins et al. 2003, Collins et al. 2004a), (Tomer and Greenberg 2004, Tomer et al. 2002b),
TNFβ (Nakkuntod et al. 2006b)
Vitamin D receptor (Ban et al. 2000a, Ban et al. 2000b), (Collins et al. 2004b) , (Ramos-Lopez et al. 2005), (Stefanic et al. 2005)
X Chromosome (various loci) (Barbesino et al. 1998), (Brix et al. 2005), (Imrie et al. 2001), (Ozcelik et al. 2006), (Tomer et al. 2003)
Consistently replicated loci: Associations confirmed by replication Loci awaiting conformation: Preliminary associations found but awaiting replication Inconsistent findings: Conflicting results from independent studies

Chapter 1 Introduction
40
For this reason the investigation of HLA class II susceptibility factors in a large HT only cohort is
important for elucidating the differences between the associated loci in HT and GD in this area.
In addition the HLA class I region has been associated in several AIDs (see Chapter 4). Hence
this will also be investigated to determine if components of this region are associated with HT.
The aim of this thesis therefore is to investigate HLA for association with HT in a large cohort.
Chapter 2 will look at the methods used in preparation for genetic analysis from blood samples. It
will also look at the specific protocols used in analysis of DNA samples via polymerase chain
reaction (PCR), allele specific PCR (ASPCR) and TagSNP analysis.
Chapter 3 will look at HLA class II as a causal factor for autoimmune disease and will investigate
the following aims:
i. Genotype a large cohort comprising of HT patients and controls at the DRB1, DQA1
and DQB1 loci in the HLA class II region to determine the predisposing and
protective genetic factors in the region.
ii. Analyse the combined DRB1, DQA1, DQB1 haplotypes for association with HT
iii. Investigate possible phenotype/genotype interactions.

Chapter 1 Introduction
41
Chapter 4 will look at the HLA class I MICA and MICB molecules as causal factors for AID and
will investigate the following aims:
i. To genotype a large cohort comprising of HT patients and controls using TagSNPs to
cover the majority of common polymorphisms with a minor allele frequency of > 20%
within MICA and MICB.
To determine the predisposing and protective factors within the MICA and MICB genes via
statistical analysis of TagSNP frequencies.

Chapter 2 Methods and Materials
42
CHAPTER 2: METHODS AND MATERIALS
Unrelated white Caucasian patients of United Kingdom (UK) origin with no history of thyroid
surgery, radioiodine therapy or GD were recruited from specialist clinics in Birmingham,
Bournemouth, Cambridge, Cardiff, Exeter, Leeds, Sheffield, and Newcastle, (UK), as part of the
UK AITD National collection (see Appendix, 6.1). HT was defined by the presence of
biochemical hypothyroidism and positive autoantibodies to thyroglobulin (Tg) or Thyroid
peroxidase (TPO), the presence of lymphocytic infiltrate in a fine-needle aspirate, or the presence
of a diffuse goitre on physical examination by a thyroid specialist (Manji et al. 2006). Two sets of
ethnically and gender matched control subjects with no family history of AITD were used in this
study. Blood samples from control subjects were collected at Blood Transfusion Services
(Birmingham, UK and Oxford, UK), Birmingham Heartlands Hospital and the Queen Elizabeth
Hospital (Birmingham, UK) as part of the Birmingham control collection. A set of controls were
also selected from the 1958 British birth cohort taken from individuals from across the UK who
were all born within a single week in 1958 (UKDA 2002, CLS 2005).
2.1 Subjects
The following procedures of blood pelleting, DNA extraction and PicoGreen® were performed
by myself and other members of the thyroid research group (see Appendix, section 6.1).
2.2 Blood Pelleting and DNA Extraction
DNA was extracted from 18ml of whole blood collected in two 9ml vacuette tubes (Greiner Bio-
One Ltd, UK) which contained sodium ethylenediaminetetraacetic acid (EDTA) to prevent

Chapter 2 Methods and Materials
43
clotting. The vacuette tubes were stored at 4oC overnight to allow the plasma to separate from the
erythrocytes. Following this 1ml of plasma was pipetted from each vacuette tube and placed into
a labelled cryovial (Alpha, UK) and stored at -80oC for potential microsomal and Tg antibody
testing. The remaining blood samples were each poured into a 50ml falcon tube (TRP,
Switzerland) and Reagent A (see Appendix, section 6.2) added to the sample to make a total
volume of 40ml. The samples were inverted several times and then shaken at 170rpm for 4
minutes on a shaker (Geneflow, UK), then centrifuged at 2400rpm for a further 4 minutes. Once
the supernatant had been removed, without disturbing the white pellet, 15ml of Reagent A was
added and the above process repeated to ensure purity of the sample. Once more removing the
supernatant, 2ml of Reagent B (see Appendix, section 6.2) was added and the tube briefly
vortexed to re-suspend the pellet. The sample was transferred into a 5ml Cryovial (Alpha, UK)
and 500µl of Sodium Perchlorate (see Appendix, section 6.2) added to each sample to denature
the protein. Chloroform (stored at -20oC) was added to further aid protein denaturation and create
a total volume of 5ml. The Cryovial was inverted 10 times to mix and then centrifuged at
3000rpm for 5 minutes creating two phases, a supernatant and a protein layer. The supernatant
was gently removed by pipette and transferred into a fresh Cryovial with care taken not to include
any of the protein layer. Hundred percent ethanol (-20oC) was then added to precipitate the DNA
and make up a final volume of 5ml. The presence of precipitated DNA was characterized by a
white mass within the solution (if no DNA was apparent then the tube was incubated at -80oC for
30 minutes to aid precipitation). The sample was then centrifuged at 3000rpm for 10 minutes to
pellet the DNA and the ethanol then removed and discarded.

Chapter 2 Methods and Materials
44
To the pellet, 1ml of 70% ethanol was added; the tube was inverted several times, followed by
the sample being centrifuged for 5 minutes at 3000rpm. The ethanol was then removed and the
tube left exposed to air for at least 3 hours to allow the samples to dry (indicated by the pellet
turning from a milky white to transparent). Once dry, 200µl of T.E. Buffer (see Appendix,
section 6.2) was added to each sample and the samples incubated at 37oC for 2 hours to allow the
DNA to re-suspend.
PicoGreen® reagent (Molecular Probes, Eugene, Oregon, USA) was used to quantify the DNA
samples collected from both HT individuals and control subjects. PicoGreen® is a fluorochrome
which binds to double stranded DNA (dsDNA) and fluoresces highly when bound. The non-
bound reagent has little fluorescence hence produces little ‘noise’ when samples are processed
using a standard fluorimeter. PicoGreen® has an excitation maximum at 480nm and an emission
peak at 520nm.
2.3 PicoGreen® DNA Quantification
Sigma Calf Thymus DNA (Sigma Aldrich, UK) was re-suspended overnight in 1.0ml of T.E.
buffer to create a concentration of 1mg/ml. Four µl of re-suspended Calf Thymus DNA and 1246
µl T.E. buffer provided the starting concentration of 1600ng/ml for a serial dilution. Using T.E.
buffer as the dilutant, the resulting concentrations of calf thymus DNA were produced to
complete the standard curve: 800ng/ml, 400ng/ml, 200ng/ml, 100ng/ml, 50ng/ml, 25ng/ml,
12.5ng/ml, 6.25ng/ml.

Chapter 2 Methods and Materials
45
Two µl of each DNA sample needing to be quantified was diluted in 198 µl T.E. buffer in a
sterile 0.5 ml microtube (Alpha, UK) in duplicate and left overnight at 4oC to re-suspend.
Using a sterile 96 flat well plate (Alpha, UK) 50 µl of T.E. buffer was added to the first two wells
in order to serve as controls for the procedure. Fifty µl of each of the standard curve dilutions
were added to the remaining wells on the first row with duplicates added to the second row. Five
µl of each of the duplicated DNA samples were added to the remaining wells on the plate,
allowing 36 samples to be analysed in total(see Figure 2.1).
1194 µl T.E. buffer was added to 6 µl of thawed PicoGreen® reagent in an amber microtube
(Alpha, UK) to create PicoGreen solution A. To create PicoGreen solution B 7580 µl T.E. Buffer
was added to 20 µl PicoGreen® reagent. As the PicoGreen compound displays light sensitivity
all solutions containing the compound were prepared and stored in amber/foil covered vessels.
Fifty µl of PicoGreen solution A was added to each of the standards and T.E. controls whilst 95
µl of PicoGreen solution B was added to each of the DNA samples. The plate was read
immediately on a Wallac Victor 3™ Multilabel counter (Applied Biosystems, UK) using
standard fluorescein wavelengths, excitation 480nm and emission 520nm.

Figure 2.1: Layout of the 96 flat well plate for the Picogreen® protocol
1 2 3 4 5 6 7 8 9 10 11 12 A CONTROL 800ng/ml 400ng/ml 200ng/ml 100ng/ml 50ng/ml 25ng/ml 12.5ng/ml 6.25ng/ml EMPTY EMPTY EMPTY
B CONTROL 800ng/ml 400ng/ml 200ng/ml 100ng/ml 50ng/ml 25ng/ml 12.5ng/ml 6.25ng/ml EMPTY EMPTY EMPTY
C Sample 1 Sample1 Sample 2 Sample 2 Sample 3 Sample 3 Sample 4 Sample 4 Sample 5 Sample 5 Sample 6 Sample 6
. . . . . . . . . . . . .
. . . . . . . . . . . . .
. . . . . . . . . . . . .
. . . . . . . . . . . . . H Sample 31 Sample 31 Sample 32 Sample 32 Sample 33 Sample 33 Sample 34 Sample 34 Sample 35 Sample 35 Sample 36 Sample 36
Wells A1 and B1 show blank controls containing 50 µl of T.E. buffer. Wells A2-A10 and B2-B10 show concentrations of the serial dilution of calf thymus DNA forming the standard curve. Rows C through H show DNA samples in duplicate.
Chapter 2 Methods and Materials
47
The standard dilutions formed the basis of a standard curve against which the DNA samples can
be compared. Repeat tests were performed on any 2 samples for which there was a difference of
greater than 20%. Using the concentrations determined each DNA stock sample was then diluted
in T.E. Buffer to a concentration of 100ng/ul and then to 20ng/ul to create a uniform DNA
dilution for all samples. The 20ng/ul samples prepared were used in the MICA and MICB study
(see chapter 4). Neat DNA was used in the HLA study (see chapter 3)
The PCR technique for DNA amplification was used for both the HLA and MICA and MICB
studies. The following gives an overview of the general principles of PCR whilst the exact
methods for each study can be found later in Chapter 3 and Chapter 4.
2.4 Polymerase chain reaction (PCR)
The PCR technique is designed to amplify a section of DNA. Oligonucleotides are designed
around the region of interest which act as primers in the reaction. The two oligonucleotides are
different in sequence and are complimentary to the known areas of sequence either side of the
desired region for amplification. The PCR reaction also requires Taq polymerase, magnesium
chloride and the presence of deoxyribonucleoside triphosphates (dNTPs) which act as free base
pairings for the forming strands.
The amplification of the DNA is achieved by first denaturing the template double stranded DNA
in the presence of the primers. The cooling step following this allows annealing of the primers to
their target sequences on the template DNA. The Taq polymerase then allows the extension of the
primers to form complementary DNA strands across the length of the desired region utilising the

Chapter 2 Methods and Materials
48
free dNTPs available. This cycle of denaturing and annealing is repeated numerous times
allowing the strands formed from the last cycle to serve as the templates for the following cycle.
With each cycle the quantity of the target DNA is doubled. (see Figure 2.2)
Oligonucleotide primers
To avoid unnecessary amplification of unwanted areas the primers must only anneal to the
flanking region and hence a sequence unique to that region must be chosen as the template for the
primers. The two sequences should exhibit minimal complementarity to reduce the likelihood of
the formation of primer dimers (Fuchs and Podda 2005). Ideally the primers should be between
20-30 bases in length. A high CG content requires a high annealing temperature, so it is
preferable to use a sequence with a low CG content (around 50% or less) for the primers. CG
base pairs are more stable than AT pairs due to the triple hydrogen bond between the nucleotides
(as opposed to the double bond in AT pairs). Therefore high GC content, causes a high melting
temperature to be required (Ausubel et al. 2003, Gray and Honigberg 2001). Similarly the CG
content of the two primers should be similar so that the annealing stage occurs at a similar
temperature.
Taq Polymerase
PCR is catalysed by Taq DNA polymerase a form of polymerase originally isolated from the
bacterium Thermus aquaticus. T.aquaticus reside in hot springs, hence the polymerase derived
from these bacteria is able to withstand the unusually high temperatures (of up to 95oC) required

Chapter 2 Methods and Materials
49
Figure 2.2: cycle of DNA replication via the polymerase chain reaction.
1. Taq Polymerase allows the extension of the primers to from two new complimentary strands
2. The cycle repeats using both the original dsDNA as a template for the new strands in addition
to the 2 short sections of DNA formed from the first cycle.
3. The cycle continues, with each repetition the short DNA sections from the previous cycle are
used as templates in the new cycle. This allows for exponential growth in the number of strands
formed in each cycle.

Chapter 2 Methods and Materials
50
for PCR protocol. The amount of Taq polymerase used in each reaction must be carefully
determined. Increasing the volume used increases the efficiency of the reaction, however this can
also increase the frequency of non-specific primer binding. Most common forms of Taq
polymerase used in PCR reactions do not have 3’-5’ proof reading ability.
dNTP concentration
The dNTPs present in the PCR reaction serve as the raw material from which the new DNA
strands are formed. If the concentration is too low then there is not enough raw material to
complete the number of cycles needed. Increasing the concentration increases the efficiency of
the reaction; however above a certain point increasing the concentration may cause the error rate
of the Taq polymerase to increase. An increased concentration of dNTPs will also affect the
MgCl2 concentration required as dNTPs chelate magnesium. For 12.5µg of synthesised DNA,
200µM of each dNTP allows half of the dNTPs to become incorporated (Ausubel 2001).
Buffer and Magnesium chloride
PCR reactions require a buffer to be used to maintain the pH at a level in which Taq polymerase
can function. Magnesium chloride is used as a source of magnesium in the PCR reaction.
Magnesium binds to single nucleotides forming a substrate which allows Taq polymerase to bind.
The optimal MgCl2 concentration must be determined for each primer pair used in PCR reactions
separately as the concentration required is dependent on the DNA sequence. The optimal
concentration is determined via titration and is normally found to be within the range of 0.5mM –
4.0mM. Concentrations below this range do not allow the PCR product to be visualised whilst
concentrations above the stated range may result in non-specific banding.

Chapter 2 Methods and Materials
51
Purity of PCR components
Due to the repetitive nature of the PCR cycling a small anomaly can become greatly magnified. If
DNA foreign to the desired sample is present or a mutagenic component is introduced then the
final PCR product will show anomalies. To minimise this the reagents used in the PCR reaction
must be free from contamination. The reagents mentioned previously must be of high quality and
purity and in addition MilliQ water (NANOpure DiamondTM, UK) is used to dilute where
required as MilliQ water contains lower levels of DNase, RNase, microorganisms and other
contaminants than normal distilled water. To test for DNA contamination at least one well on
each plate is left blank, containing only the reagents but none of the sample DNA. Any
amplification seen in this well will indicate if a foreign source of DNA in present in any of the
reagents used or has been transferred onto the plate from equipment used during the PCR
protocol.
Thermal cycling
Two different PCR thermal cycling methods were used in this study. They both however follow
the same basic pattern with the main difference being an additional primary step for the MICA
and MICB thermal cycling protocol. For this the temperature was first raised to 50oC for a period
of 2 minutes to facilitate activation of the Taq polymerase. The following steps of denaturation
and annealing were common to both studies.
For the denaturation step the temperature is kept within the range of 93 oC to 96oC. This range
allows for separation of the DNA double strand whilst conferring little or no decrease on the
activity of the Taq polymerase. The exact temperature used is again dependent on the CG content

Chapter 2 Methods and Materials
52
of the template with higher CG content requiring higher temperatures. This is a rapid stage and
does not normally exceed 1 minute.
The temperature is lowered for the annealing stage (in this thesis temperatures ranging between
55oC and 70oC were used). The temperature must be such that the DNA template remains in a
semi-denatured state whilst allowing the primers to anneal stably to the template and 55oC is the
average optimal temperature for this. However this process is once again dependent on CG
content. Primers with a CG content which is either higher or lower than 50% may require
annealing temperatures of either higher or lower than 55oC respectively. Using non-optimal
temperatures in this stage increases the occurrence of non-specific primer annealing.
In these studies extension temperatures of between 60oC and 72oC were used. The optimal
working temperature for the Taq polymerase used is 75oC, hence using temperatures around this
region will allow for efficient use of Taq polymerase whilst allowing the primers to remain
attached to the template DNA. The length of the DNA section which is required to be amplified
affects the length of time needed for the extension procedure and in these studies times of 25
seconds to 90 seconds were used.
Conventionally in PCR reactions the annealing and extension stages are separate with the
annealing stage being at a lower temperature than that of the extension. However in the MICA
and MICB study the primers were designed by Applied Biosystems UK to anneal at a higher
temperature, meaning that a separate stage is not required. As well as making the PCR much

Chapter 2 Methods and Materials
53
quicker the samples are at less risk of contamination because the temperature is kept higher at
this stage.
ASPCR uses two or more primers which are able to discriminate between the different alleles of
a given locus. The primers are designed to be able to discriminate between the different alleles by
insertions, deletions, single base polymorphisms or other small base pair changes found in the
DNA region of interest. Each primer will therefore only bind to the single strand of DNA for
which it is complementary (see Figure 2.3).
2.5 Allele Specific PCR(ASPCR)
In each reaction control primers which amplify a DNA region outside the region of interest are
used. These primers amplify products of different sizes to those produced from within the region
of interest. Presence of the control bands in a PCR reaction ensures the PCR reaction was
successful if allele bands are absent from the sample.
Agarose gel electrophoresis was used to visualise PCR products in the HLA class II study (See
Chapter 3). This method allows the DNA fragments to be separated by size and charge. A solid
agarose gel is created, the concentration of which is proportional to the size of the products to be
analysed. These gels are placed in gel tanks and covered with buffer. The DNA samples are
loaded through the layer of buffer into wells cut into the gel. A general outline of the method is
given below with further details of the volumes and measure used given later in Chapter 3.
2.6 Agarose gel electrophoresis
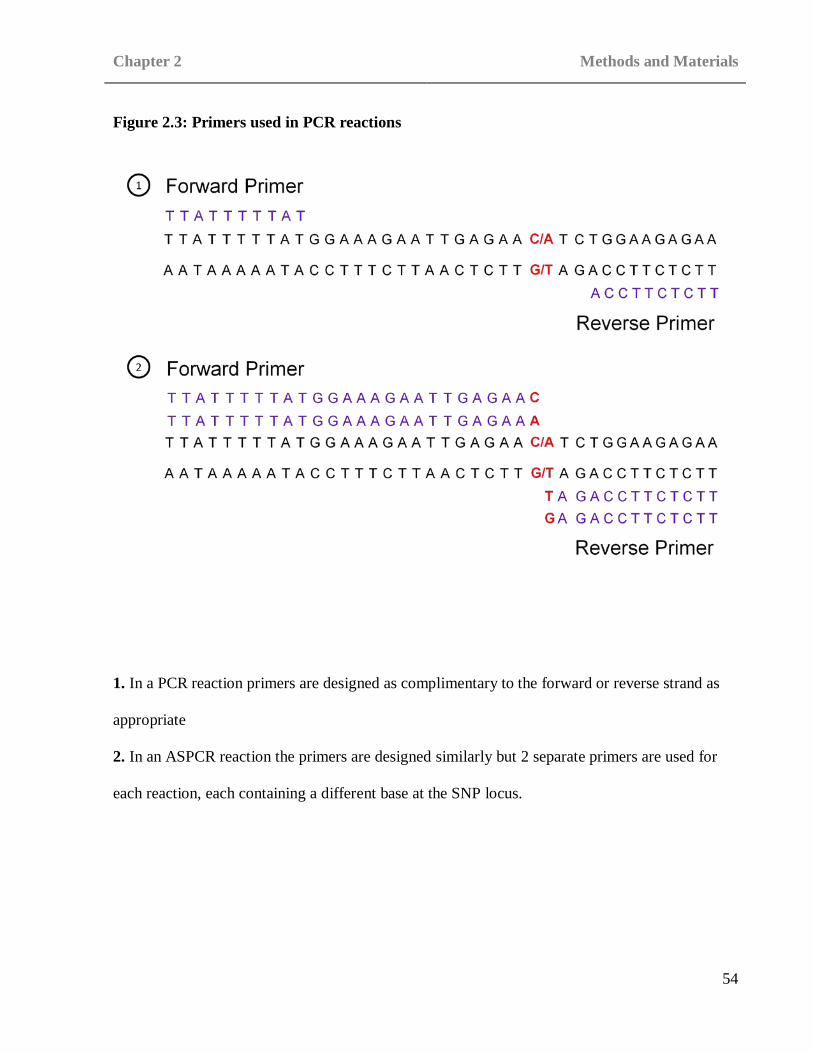
Chapter 2 Methods and Materials
54
Figure 2.3: Primers used in PCR reactions
1. In a PCR reaction primers are designed as complimentary to the forward or reverse strand as
appropriate
2. In an ASPCR reaction the primers are designed similarly but 2 separate primers are used for
each reaction, each containing a different base at the SNP locus.
Chapter 2 Methods and Materials
55
A fixed volume of electrophoresis buffer (0.5% x TBE; see Appendix, section 6.2) was prepared
for both the creation of the gels and to be used as buffer in the gel tanks. Five grams of
electrophoresis-grade agarose (Sigma, UK) was added to 500ml 0.5% TBE to create the gels.
This was heated using a hotplate and magnetic stirrer (Geneflow, UK). The gel was heated until
the agarose powder had fully dissolved, at which point the solution was allowed to cool. Once the
solution had cooled to below 55oC an appropriate amount of ethidium bromide (Sigma, UK) was
added to facilitate later visualisation. A casting tray with gel combs and casting gates was
prepared and the gel solution poured into it. Once the gel had hardened the casting gates and gel
combs were removed and the gel still in the casting tray placed into a gel tank. A volume of TBE
(see Appendix, section 6.2) was added to the gel tank so as to completely cover the gel and again
an appropriate volume of ethidium bromide was added to this. The DNA samples were mixed
with loading buffer (see Appendix, section 6.2) and loaded into the wells in the gel. The gel was
then run at an appropriate voltage for a set amount of time to allow a current to be created across
the length of the gel and the DNA fragments to separate and move down the gel. When finished
the gel was removed and visualised under UV light with a photograph taken as a permanent
record of the results.
The allelic discrimination in the MICA and MICB study was performed using single nucleotide
polymorphisms (SNPs). SNPs are loci where the DNA differs by a single base and the rare allele
occurs at a frequency ≥ 1% in the general population (Pasternak 2005). Genotyping data for the
MICA and MICB gene regions was obtained from the International Haplotype Mapping Project
web site [www.hapmap.org]. The data was then incorporated into the Haploview program
2.7 Tag SNPs

Chapter 2 Methods and Materials
56
[http://www.broad.mit.edu/mpg/haploview/] which allowed the number of SNPs with an allelic
frequency greater than 5% to be calculated. The tagger function on the Haploview program was
used to calculate the linkage disequilibrium (LD) between the selected SNPs and determine
groups of SNPs which were in strong LD with each other. For each group a tag SNP was chosen
which was in strong LD (D’>0.80) with those which it tagged (Gabriel et al. 2002) (see section
2.8.4 Linkage Disequilibrium for further information)
Assays
Pre-validated assays were purchased from Applied Biosystems ‘assay on demand’ service
[www.appliedbiosystems.com] for 8 SNPs. For the remaining 7 SNPs no assay had previously
been designed. For these SNPs sequencing data surrounding the SNP of interest was obtained
from the NCBI SNP web site [www.ncbi.nlm.nih.gov/entrez/query.fcgi?db=Snp] was used to
design an appropriate assay and the sequences were then submitted to Applied Biosystems
‘assays by design’ service [www.appliedbiosystems.com].
Taqman Probes
All assays contained two probes; VIC and FAM to detect alleles 1 and 2 respectively of the SNP
being assayed. Initially the fluorescing portion of the probe, either VIC or FAM, is prevented
from fluorescing by a non-fluorescent quencher (NFQ). As the forming strand reaches the
location of the probe the fluorescent portion is displaced hence it is no longer attached to the
NFQ and is seen to fluoresce (see Figure 2.4). The probe will bind to the DNA present in
accordance with the allele exhibited; in a heterozygous sample VIC and FAM will both bind, in a
homozygous sample only one type of probe will bind. The probes fluoresce with different

Chapter 2 Methods and Materials
57
wavelengths enabling the sample to be read using the ABI7900 prism (Applied Biosystems, UK).
2.8.1 Power calculations
2.8 Statistical analysis
Association studies have been commonly seen as a useful method for detecting small genetic
contributions to disease. Unfortunately association studies also commonly show a high degree of
variation in results between replication studies. As a means of combating this problem power
calculations can be used to define the probability that a test can identify a given difference in the
population frequency of a marker between cases and control subjects in a given dataset as being
significant (P=0.05) and is based on a null hypothesis (Barcikowski 1981, Risch and Merikangas
1996, Lalouel and Rohrwasser 2002). Power calculations can be used to determine the probability
that a false null hypothesis will be rejected. It is assumed that any test with a statistical outcome
of P< 0.05 indicates that the outcome was not by chance or coincidence. Conventionally a power
of >80% is accepted (see Chapter 1, section 1.6.1 for further discussion).

Chapter 2 Methods and Materials
58
Figure 2.4: Probe binding and fluorescence

Chapter 2 Methods and Materials
59
2.8.2 Case control analysis
All analysis of case control data was performed using the χ2 test or for small numbers the Fisher’s
exact probability test.
The χ2 test was used in conjunction with a 2 x 2 contingency table as shown below.
Positive for marker Negative for marker
Hashimoto’s thyroiditis patients a b
Control subjects c d
The χ2 value was calculated and probabilities assigned (see Appendix, section 6.3 for χ2
calculation). All χ2 calculations were performed using Excel (Microsoft® Excel, © 1985-2003
Microsoft Corporation).
The Fishers exact probability test was used when any number in the contingency table had a
value of 10 or less and all calculations were performed using the MINITAB statistical package
(MINITAB Release 14.1 © 1972–2003, Minitab Inc, USA.) (see Appendix, section 6.3 for
Fishers exact probability test calculation).

Chapter 2 Methods and Materials
60
All P values are presented as uncorrected and P<0.05 was considered significant. All P values
presented have not been corrected for multiple tests. Statistical correlations are not commonly
presented for the methods of genetic analysis use in this thesis.
For any result found to be significantly associated with disease the odds ratio (OR) and 95%
confidence interval (95% CI) was calculated using the method of Woolf with Haldane’s
modification for small numbers (Woolf 1955) (see Appendix, section 6.3 for OR and 95% CI
calculations). The OR test is a form of the χ2 test where the probability of an individual with the
major allele exhibiting HT is compared to the probability of an individual with the minor allele
exhibiting HT. The 95% CI calculation is a measure of variation. It implies that although the OR
calculated may be incorrect there is only a 5% chance that the confidence limits generated do not
contain the true OR (BMJ 2006). If the OR is greater than 1 and the lower boundary of the 95%
CI is greater than 1 then there is a significant risk of exhibiting the disease phenotype if the
mutant allele is present (Shephard 2005).
2.8.3 Hardy Weinberg Equilibrium (HWE)
The law of HWE proposes that polymorphisms become stable in the general population after one
generation of random mating. HWE calculations were performed for all successfully genotyped
Hashimoto’s thyroiditis patients and control subjects in both studies using a program based on
one designed by Dr. Heather Cordell, University of Cambridge, UK.

Chapter 2 Methods and Materials
61
2.8.4 Linkage Disequilibrium (LD)
The global D prime (D’) calculation (Hedrick 1987) may be used to calculate the LD between
two given genetic markers. LD gives a measure of the likelihood that two markers will be
inherited as a haplotype. The calculation compares the probability at which the markers would be
inherited as a pair if linked compared to the rate at which they would be inherited if combined
randomly. A strong LD is often indicative of a physically close relationship between the two
markers. A D’ of 1 is complete LD, a D’ greater than 0.8 is considered to be strong LD, a D’
between 0.2 and 0.8 is incomplete LD and less than 0.2 is considered negligible (Ardlie et al.
2002). For the Tag SNP study SNPs which displayed LD greater than 0.8 were selected.

Chapter 3 HLA class II
62
CHAPTER 3: HLA CLASS II
The HLA region is located at chromosome 6p21-23 (NLM 2008). The region consists of a
group of genes primarily concerned with humoral and cell mediated immune response. Within
this region three major groupings are apparent, HLA class I, HLA class II and HLA class III
(see Figure 3.1 for HLA class arrangement). The HLA class I and class II gene regions
encode membrane bound glycoproteins which display structural and functional similarity. In
contrast the HLA class III region genes encode proteins which differ in both structure and
function to the class I and class II loci. In addition the HLA class III genes also encode a
variety of other secreted products. The class I region spans approximately 2Mb and contains
the classical class I genes HLA-A, HLA-B and HLA-C and non-classical class I genes
including HLA-E, HLA- F, HLA-G, HFE, HLA-J, HLA-X, MICA, MICB, MICC, MICD and
MICE. (see chapter 4 for further discussion of HLA Class I). The class III region encodes
various components of the innate and adaptive immune response (see Chapter 1, section 1.2
for further discussion of the immune response) including the complement components C4, C2
which are involved in the mannose-binding lectin pathway and factor B which is involved in
the alternative complement pathway. Several inflammatory cytokines including tumour
necrosis factor α (TNFα), lymphotoxin α, heat shock proteins and several other products are
also encoded in this region.
3.1 Introduction
Whilst most genetic studies in autoimmune disease has concentrated on the role of HLA class
I and class II regions in disease, some work has explored association of the class III genes
with an association of TNFα with GD (Simmonds et al. 2004) and a tentative association with

Figure 3.1: Schematic of the HLA gene region
C: Complement
HSP: Heat shock protein
TNF: Tumor necrosis factor
MIC: MHC class I chain related

Chapter 3 HLA class II
64
HT (Chen et al. 2006) being demonstrated. For this chapter the role of HLA class II as a
susceptibility locus for HT is discussed.
The HLA Class II gene region spans approximately 1 x 10⁶ bp and contains genes encoding
polymorphic, heterodimeric, bound glycoproteins mainly expressed on antigen presenting
cells such as macrophages, dendritic cells and B cells in addition to many other molecules.
The best characterised of these genes, DP, DQ and DR encode proteins that display processed
antigenic peptides for recognition by T helper cells (TH cells) (see Figure 3.2).
3.1.2 HLA Class II
The HLA Class II molecules are comprised of an α and β chain encoded by two separate
genes. The α and β chain are indentified by having a letter A or B after the molecule being
encoded for example the DR alpha chain is called DRA and the DR beta chain is called DRB.
Both the α and β genes contain a leader exon, α1 or β1 exon, α2 or β2 exon, a transmembrane
exon and one or more cytoplasmic exons. The DR and DQ chains all have similar
substructures.In each the first exon encodes the signal sequence, the second the α1 or β1
domain, the third the α2 or β2 domain, the fourth the transmembrane domain and part of the
cytoplasmic domain and the fifth again part of the cytoplasmic domain. DRA, DRB and DQA
also share the encoding of the cytoplasmic domain over a sixth exon whilst DQB completes
the cytoplasmic domain and terminates at exon 5 (Goldsby and Goldsby 2003).
The DQA1, DQB1 and DRB1-9 (specifically DRB1) regions are all highly polymorphic.
DQA1 contains 6 loci and 22 alleles, DQB1 5 loci and 46 alleles and DRB1 13 loci and 335
alleles (http://www.ebi.ac.uk/imgt/hla/links.html). This makes these regions ideal for this

Figure 3.2: schematic of HLA class II gene region
PSMB: proteasome subunit beta-type
TAP: transporter associated with antigen processing

Chapter 3 HLA class II
66
study as the numerous polymorphisms allow for a high density scan of this region. These
polymorphisms are reflected in the nomenclature, for example, DRB1*04 denotes that DRB1
is the beta chain in question and that the locus is 04. The DRA region however contains
relatively few polymorphisms and for this reason was not investigated
(http://www.ebi.ac.uk/imgt/hla/links.html).
Structure and function of the HLA Class II molecules
The HLA Class II molecules are comprised of two polypeptide chains, a 33kDa α chain and a
28kDa β chain. These two chains are linked by non-covalent interactions to form a membrane
bou nd glycop ro tein. Each chain con sists of two external d omain s α1 , α2 or β1 , β2 , a
transmembrane segment and a cytoplasmic segment. (see Figure 3.3). The outermost portions
of the molecule, the α1 and β1 segments, form the antigen binding cleft
The bound peptides originate via the exogenous pathway from antigen presenting cells
(APCs) including macrophages, immature dendritic cells, B cells and CD4+ T cells.
Membrane bound proteins and other external proteins are internalised by APCs via
phagocytosis, endocytosis or a combination of both. Internalised antigen then enters the
endolytic processing pathway. The exogenous antigen passes through three compartments,
early endosomes, endolysosomes and finally lysosomes. Each compartment contains
hydrolytic enzymes and is more acidic than the last at around pH 6.0-6.5, pH 5.0-6.0 and pH
4.5-5.0, respectively and is degraded into peptide. This results in oligopeptides of around 13-
18 residues in length which are optimal for binding by HLA class II molecules.
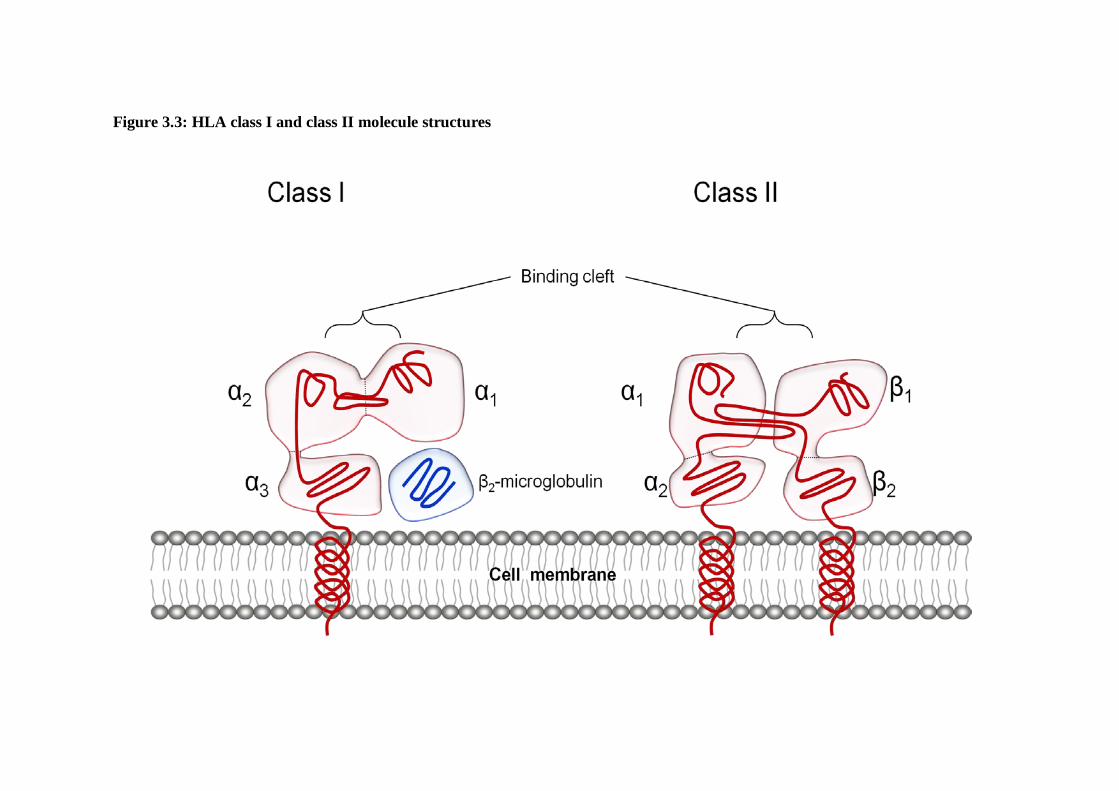
Figure 3.3: HLA class I and class II molecule structures

Chapter 3 HLA class II
68
HLA class II molecules are synthesised in the rough endoplasmic reticulum. Once synthesised
they are immediately able to bind peptides. To prevent unwanted peptides or unfolded
proteins or endogenous antigens from attaching to the binding cleft the HLA class II invariant
chain (Ii) binds in its place. By association with Ii the HLA class II molecules can then move
to a low pH endosomal compartment to allow peptide binding to occur. For peptides to bind
in the HLA Class II binding cleft the Ii must first be removed. This is done in a series of steps
where the Ii is cleaved into shorter fragments. The remaining fragment, the HLA class II
associated invariant chain peptide (CLIP), must either be displaced or must dissociate to allow
binding of other peptides to occur. Once a peptide has bound the HLA class II molecule then
moves to the cell surface for presentation to CD4+ T cells and Tregs as part of peripheral
tolerance. HLA class II molecules also present antigens to CD4+8+ thymocytes during
positive selection during central tolerance (see Chapter 1, section 1.2). If however no peptide
binds then the molecule becomes unstable and degrades in the acidic environment of the
endosome.
As previously stated the majority of studies investigating the genetic causal factors of AITD
have focused primarily on GD. This has been in part due to the previous assumption that the
causal factors for HT were common to GD also. The early results obtained for HT were
pertinent due to the findings in HLA class II association studies in GD. One example of this
can be seen in the common AITD predisposing loci found in genome wide scans (see Chapter
1, section 1.6.1). Due to the vast amount of work performed concerning the association of the
HLA region with GD it is important to investigate these findings in addition to the
comparatively few studies performed on HT cohorts.
3.2 Association of HLA with Autoimmune Thyroid disease
Chapter 3 HLA class II
69
Graves’ disease
Early studies had shown association of the DR3 haplotype (DRB1*03-DQB1*02-DQA1*05 )
and its component alleles with GD (Dahlberg et al. 1981, Farid et al. 1980) The association of
DR3 with GD has been validated with consistent reports finding association of the DR3
haplotype with GD in studies using large cohorts (Boehm et al. 1992, Heward et al. 1998,
Simmonds et al. 2005, Mangklabruks et al. 1991, Badenhoop et al. 1992)..
The nature of the association of the DR3 haplotype with GD has been brought into question.
It has been proposed that DQA1*0501 was associated with GD independently of the DR3
haplotype as a whole. This was based on increased prevalence in GD patients in a study of
USA Caucasian subjects (Yanagawa et al. 1993). The question of whether the DR3 haplotype
is associated with GD as a result of strong LD between the included alleles or whether the
haplotype as a whole is associated has attempted to be answered by several studies (Cuddihy
and Bahn 1996, Hunt et al. 2001, Yanagawa et al. 1994, Maciel et al. 2001, Heward et al.
1998). The work performed by Heward et al. (Heward et al. 1998) in one such study was
furthered by regression mapping of the HLA region in a study performed by the same group
(Simmonds et al. 2005). Using stepwise logistic-regression DQB1 did not improve allele
based models containing either DRB1 (P=0.154) or DQA1 (P=0.04). When an allele based
model containing DQB1 was used however both DRB1 (P=1.88×10⁻⁸) and DQA1 (P=3.99×10-
8) improved the model. This indicated that the main associated locus within the HLA class II
region was not contained within the DRB1 gene. It could not be ruled out however whether
the main etiological variant within the HLA class II region was contained in DRB1 or DQA1
(Simmonds et al. 2005).

Chapter 3 HLA class II
70
Some moves have been made to further narrow the associated locus within the DRB1 region
of HLA class II. Two studies have shown association of Arginine at position β74 of the DRB1
chain (Ban et al. 2004, Simmonds et al. 2006). Using stepwise logistic regression this result
was further examined in comparison to other amino acids in the DRB1 chain with the finding
that β74 remained the most strongly associated, although a series of other amino acid
positions were also found to be associated (β10, β11, β12, β13, β14, β25, β26, β30, β32, β47,
β58 and β71) (Simmonds et al. 2005). Whilst this association was reported in both the studies
by Ban et al. (Ban et al. 2004) and Simmonds et al. (Simmonds et al. 2006) the relation of the
finding to the previously reported DR3 association is still in question. Although the former
study found that the β74 association was independent of the DR3 association the latter study
could not confirm this.
Other associations of HLA class II have also been shown with GD, DRB1*07 and the DR7
haplotype (DRB1*07-DQB1*02-DQA1*02) have been shown to have a protective effect
against onset of GD (Simmonds et al. 2005). DRB1*08 has also been shown to be associated
with GD in a North American Caucasian cohort (P<0.01, OR=3.2) (Chen et al. 1999).The
study showed however that DRB1*08 was only significantly associated with early onset GD
(P=0.001, OR=5.0) and no significant association with late onset GD was reported. It should
be noted that by splitting up the cohort of 92 GD patients only 30 were classified as affected
by early onset GD. This is an incredibly small dataset on which to perform age of onset
correlations and requires confirmation in a larger cohort.

Chapter 3 HLA class II
71
Hashimoto’s Thyroiditis
As with many genetic studies in HT there have been few performed concerning HLA Class II
associations. Those which have been performed have often been on small numbers using
cohorts of under 500 HT cases and 500 controls. In early association studies using serologic
markers DR3 and DR5 haplotypes were shown to be associated, although with differing
results. In 1978 a study using a cohort of 262 Canadian Caucasian individuals (127 cases, 135
controls) showed the DRw3 (now known as DR3) haplotype to be associated with HT (RR =
3.5) (Moens et al. 1978). In 1980 a study using a cohort of 199 Austrian Caucasian
individuals (39 cases, 160 controls) showed association of DR5 (RR = 3.2) (Weissel et al.
1980). In 1981 these first two studies were seemingly supported by the findings of a Canadian
study where both DR3 and DR5 were found to be associated in a Caucasian cohort of 120
individuals (40 cases and 80 controls) (Farid et al. 1981). Again in 1987 an association of
DR3 with a cohort of 68 Eastern Hungarian HT patients was observed (Stenszky et al. 1987).
In 1991 using a UK Caucasian dataset of 186 (86 cases and 100 controls) DR3 (OR = 3.3) and
DQw2 were found to be associated (Tandon et al. 1991). The association of DQw2 in this
study may not be an independent risk factor as it is known to be in strong LD with the DR3
haplotype; hence this may be as a result of the DR3 association.
Following these early results studies began to use larger cohorts in an attempt to provide
more accurate results. In 2001 two larger Caucasian studies attempted to provide insight into
the HLA Class II association with HT. In a UK Caucasian cohort of 344 individuals an
association of HLA-DRB1*03 (P=0.02, OR=1.9) with HT was observed (Hunt et al. 2001). In
the same year an Italian study performed by Petrone et al. using a Caucasian cohort of 427
(126 HT patience and 301 controls) showed association of DRB1*04-DQB1*0301 with HT

Chapter 3 HLA class II
72
(Petrone et al. 2001). Although these later studies used much larger cohorts the disparity in
the results may indicate that the cohorts were still too small to detect associations reliably.
In addition to the tentative associations proposed for DR3 and DR5 haplotypes, other alleles
and haplotypes have been investigated. In 1986 Farid et al. found association of the DR4
haplotype (HLA-DRB1*04, HLA-DQA1*03, HLA-DQB1*03) in a small cohort of 192 (52
cases, 140 controls) (OR = 3.1) (Farid and Thompson 1986). This finding was replicated in
Caucasians in Petrone’s 2001 study as previously mentioned (Petrone et al. 2001). A study
utilising a Japanese cohort of 388 individuals with 71 HT patients and 317 controls showed
associations of the DR4 haplotype (RR = 4.5) (Wan et al. 1995). However, due to the
differing genetic backgrounds seen in different ancestral geographical regions, these results
may not be comparable to those obtained in studies using Caucasian cohorts.
In addition to these findings Badenhoop et al. found association of DQA1*0201/*0301
heterozygotes and also DQA1*0301/DQB1*0301 (RR = 4.7) with HT (Badenhoop et al.
1990). Also a protective effect has also been proposed by Tamai et al. in a Japanese cohort of
105 HT patients and 317 control subjects for DQA1*0102 (RR = 0.3) and DQB1*0602 (RR =
0.1). This, however, is yet to be replicated.
.
There have been many other studies which have investigated the associations of HLA Class II
with HT (see Table 3.1). However the cohorts used in these were very small, often with the
entire dataset being under 100 hence the results of these studies are not considered in detail.

Chapter 3 HLA class II
73
Table 3.1: Past associations of HLA class II with HT
Author Cases Controls Total cohort
Nationality Allele/haplotype OR/ RR
(Badenhoop et al. 1990)
64 98 162 - DQA1*0201/*0301 heterozygotes
- -
DQA1*0301/DQB1*0301 - 4.7
(Hunt et al. 2001) 77 267 344 UK* DRB1*03 - -
(Moens et al. 1978) 127 135 262 Canadian* DR3 - 3.5 (Santamaria et al. 1994)
17 71 - N. European DQB1*0201
- -
(Shi et al. 1992) 46 50 96 Caucasian DQA*0301 - -
32 50 82 DQB*0201 - -
(Stenszky et al. 1987)
68 - - Hungarian DR3 3.3 -
(Tamai et al. 1994) 105 317 - Japanese DQA1*0102 (protective) - 0.3
DQB1*0602 (protective) - 0.1
(Tandon et al. 1991) 86 100 186 English* DR3,DQA1*0501/DQB1*0201 - -
(Wan et al. 1995) 71 317 388 Japanese DRB1*0403 - 3.2
DR4*0101 - 4.5
(Weissel et al. 1980) 39 160 199 Austrian* DR5 - 3.2
*denotes that the cohort was Caucasian - denotes that no data was given

Chapter 3 HLA class II
74
This proposed study aims to compare HLA class II associations found in GD patients with
class II associations in HT patients. The HT patients used in this study were recruited as part
of the UK AITD national collection. These patients were recruited from the same geographic
regions as GD patients in the UK national collection. In addition the same control cohort was
used for this study as several previous GD association studies. This provides a basis for a
direct comparison of the HT and GD associated loci within the HLA class II region.
The primary aim of this study was to:
3.3 Aims of Chapter 3
i) Genotype a large cohort comprising of HT patients and controls at the DRB1,
DQA1 and DQB1 loci in the HLA class II region to determine the predisposing
and protective genetic factors in the region.
ii) Analyse the combined DRB1, DQA1, DQB1 haplotypes for association with
HT
iii) Investigate possible phenotype/genotype interactions.
3.4 HLA methods
As described in Chapter 2, section 2.1. In total, DNA was obtained from 640 HT patients and
621 control subjects taken from the control set for the Birmingham control collection. The
621 control subjects used in this study had all been previously genotyped (Simmonds et al.
2005)
3.4.1 Subjects

Chapter 3 HLA class II
75
The HLA-DRB1, DQB1 and DQA1 regions were amplified using the phototyping method of
allele specific PCR (ASPCR) as previously published (Bunce et al. 1995) (see Appendix,
section 6.4 for primers). To screen these three regions, 48 ASPCR reactions were performed.
For each of the 48 ASPCRs a given allele or set of alleles for the HLA-DRB1, DQB1 and
DQA1 loci were amplified. A set of control primers (which amplified a 796bp fragment from
the third intron of HLA-DRB1) were also included in each reaction to ensure that the PCR
had not failed and that non-amplification of allelic bands was due to their absence.
3.4.2 Genotyping
Primers
All primer sequences and working primer concentrations for HLA-DRB1, -DQA1 and -DQB1
were obtained from previous work by Bunce et al (Bunce et al. 1995) (see Appendix, section
6.4). All primers were obtained from Sigma Genosys, UK. The primers were reconstituted
with 1 ml of TE Buffer to stabilise the primers. The primers were then diluted to their
working concentration at a final volume of 1ml using the following formulae:
Primer amount (μM) = Primer OD x 100 / (1.5(A) + 0.71(C) + 1.2 (G) + 0.84(T))
Primer amount (μl/ml) = required working primer conc. x 1000 / primer amount
Where A C G T refer to the frequency of each base in the primer sequence.
All primer working concentrations were frozen at -20oC until required.
Five μl of each of the prepared primer solutions were pipetted into 48 wells of a 96 well plate
(Greiner, UK) with two sets of ASPCR per 96 well plate. Ten μl of mineral oil (Sigma, UK)
was added to each well to cover the primer and reduce evaporation in the later PCR process.
The prepared 96 well plates were frozen at -20oC until required.

Chapter 3 HLA class II
76
PCR
For each patient and control sample a solution of 300 μl TDMH (see Appendix, section 6.2)
169 μl Millq water, 9 μl DNA sample and 2.25 μl Taq (Bioline, UK) was produced, then
briefly vortexed before 8 μl of the resulting solution was added to each of the 48 wells on the
PCR plate containing the ASPCR primers. The plate was then sealed with a plastic sealer
(Griener, UK), and centrifuged at 1000rpm for 1 minute. The plates were then run on M J
Research PTC-225 Peltier Thermal cycler machine (Genetic Research Instrumentation, UK)
using the following program:
60 seconds denaturation – 96oC
5 cycles: 20 seconds – 96 oC
45 seconds – 70 oC
25 seconds – 72 oC
21 cycles: 25 seconds – 96 oC
50 seconds – 65 oC
30 seconds – 72 oC
4 cycles: 30 seconds – 96 oC
60 seconds – 55 oC
90 seconds – 72 oC
300 seconds holding at 20oC.
Three μl of loading buffer (Appendix, section 6.2) was then added to each well of the ASPCR
reactions.

Chapter 3 HLA class II
77
Agarose gel electrophoresis of samples
Agarose gels were created using 5g agarose (Sigma, UK) and 500ml 0.5xTBE (Appendix,
section 6.2) with 1 2 μl eth idium bromid e (Sigma, UK) added once the gel had cooled but
before setting to aid visualization of the samples (see chapter 2, section 2.6). These were
placed in a gel tank (Geneflow, UK) with a sufficient volume of 0.5xTBE to allow complete
submersion of the gel. Twelve μl of ethidium bromide was also added to the surrounding TBE
to further aid visualization of the samples. The initial volume of 12µl of ethidium bromide
used in both the creation of the gels and in the surrounding TBE was later changed to 15µl as
visualisation was poor when using the lower volume. The gel was electrophoresed for a total
of 15 minutes using the following program:
350 Volts
300 amps
150 Watts.
The results were then visualised using an ultraviolet light box (Geneflow, UK) (see figure 3.4)
DYNAL
For some samples ambiguous results were obtained. This may have been due to several
reasons including the degradation of the stored DNA sample, inefficient visualisation due to
non-optimal volumes of reagents used or cross contamination. In order to resolve these,
DYNAL AllSet+™ SSP kits (Invitrogen, UK) were employed to provide clarification of results
via in depth analysis of specific HLA DRB1, DQA1 or DQB1 loci.
For each p atient and control sample a solu tion of 4 8 0 μl of the DYNAL master mix, 5 7 μl
Millq water, 57μl DNA sample and 4.8μl Taq (Bioline, UK) was produced and 10μl of this

Chapter 3 HLA class II
78
Figure 3.4: Visualisation of agarose gel electrophoresis

Chapter 3 HLA class II
79
solution added to each of the 48 wells on the PCR plate containing the ASPCR primers
provided by DYNAL. The plate was then sealed with a plastic sealer (Griener, UK), and
centrifuged at 1000rpm for 1 minute. The plates were then run on M J Research PTC-225
Peltier Thermal cycler machine (Genetic Research Instrumentation, UK) using the following
program:
120 seconds denaturation – 96oC
10 cycles: 15 seconds – 96 oC
60 seconds – 65 oC
20 cycles: 10 seconds – 96 oC
50 seconds – 61 oC
30 seconds – 72 oC
Three μl of loading buffer (Appendix, section 6.2) was then added to each well of the ASPCR
reactions.
All other conditions were as stated in the previous PCR section with the exception that 25µl
ethidium bromide was added to the agarose gel during preparation in place of 15µl ethidium
bromide.
Any samples which remained ambiguous or failed completely were not included in the final
results.

Chapter 3 HLA class II
80
Analysis of case control data was performed using the Chi-squared (χ2) test with P < 0.05
considered significant, with the Fisher’s exact test performed for samples with counts lower
than 10. Odds ratios (OR) and 95% confidence intervals (CI) were calculated using the
method of Woolf with Haldane’s modification for small numbers (Woolf 1955). The Fisher’s
exact test was performed using the MINITAB statistical package (MINITAB Release 14.1 ©
1972–2003, Minitab Inc, USA.); all other calculations were performed using Excel
(Microsoft® Excel, © 1985-2003 Microsoft Corporation). (See Chapter 2, section 2.8)
3.4.3 Statistical analysis

Chapter 3 HLA class II
81
3.5 Results
Genotyping results
All cases and controls for each genotype were in Hardy Weinberg equilibrium. In total 625
HT patients and 619 control subjects were successfully genotyped at the DRB1, DQB1 and
DQA1 loci (Table 3.2). One allele from each of the DRB1, DQB1 and DQA1 regions was
observed to have a strong association, DRB1*04 (P=0.002, OR=1.37, 95% CI 1.13-1.67),
DQB1*0301/4 (P=3.47x10⁻⁴, OR=1.43, 95% CI=1.17-1.73) and DQA1*03011/12
(P=1.53x10⁻⁴, OR=1.44, 95% CI=1.19-1.74). Small predisposing effects for HT were detected
at DRB1*03, DRB1*08, DQB1*04, and DQA1*0401 (P=0.034-0.017, OR = 1.25-1.93).
Protective effects against the development of HT were also seen at DRB1*07, DRB1*13,
DQB1*06, DQA1*01012/3 and DQA1*0201 (P=0.002, OR=0.72-0.79). No other
associations were detected.
Strong LD observed between the DRB1, DQB1, and DQA1 regions allowed analysis of
classical HLA haplotypes to be performed (Table 3.3). A strong predisposing effect was seen
for the DR4 haplotype (P=6.79x10⁻⁷ OR=1.98 [95% CI=1.51-2.59]). A strong association of
each of the loci within this haplotype was also seen as mentioned previously; DRB1*04
(P=0.002), DQB1*0301/4 (P=3.47x10⁻⁴) and DQA1*03011/12 (P=1.53x10⁻⁴). A weaker
predisposing effect for DRB1*08-DQB1*04-DQA1*04 (DR8 haplotype) (P=0.038, OR=1.80,
[95% CI=1.01-3.18]) was observed, all loci within this haplotype also demonstrated
association. Protective effects were detected for the DR7 haplotype (P=0.013 OR=0.70 [95%
CI=0.53-0.93]), DRB1*13-DQB1*06-DQA1*01 (DR13) (P=0.001 OR=0.61 [95% CI=0.45-
0.83]) and DRB1*15-DQB1*06-DQA1*01 (DR15) (P=0.034, OR=0.76 [95% CI=0.59-

Chapter 3 HLA class II
82
0.98]). All alleles within these haplotypes were shown to have association when investigated
individually barring the DQB1*02 locus (P=0.703) within the DR7 haplotype. Although the
DRB1*03 allele was seen to be associated with HT (P=0.034), only a borderline association
of the DRB1*03-DQB1*02-DQA1*05 (DR3) haplotype with HT was detected (P=0.050)
(Table 3.3). No other associations were detected (Table 3.4).
Phenotype/genotype associations
Data was only available to investigate associations between the presence or absence of diffuse
goitre and serum TSH levels at time of diagnosis. Data on the presence or absence of diffuse
goitre was only available for a total of 399 HT patients. Data for serum TSH levels was only
available for 277 HT patients. No significant differences were seen between HLA class II
alleles or haplotypes and individual phenotypes in presence or absence of diffuse goitre
(Table 3.5) and HT sub-classified on the basis of TSH levels, 5.5-15 mIU/liter and > 15
mIU/liter (Table 3.6).

Chapter 3 HLA class II
83
Table 3.2: Distribution of DRB1, DQB1 and DQA1 alleles in patients with Hashimoto’s thyroiditis and control subjects
P* - uncorrected P values Χ2 = Chi-squared, OR = Odds ratios, 95% CI = 95% confidence interval † - Number of HT patients = 625, number of control subjects = 619. Each sample produces 2 haplotypes due to the diploid nature of the human genome
HLA class II alleles
Hashimoto’s thyroiditis n = 1250†
( %)
Control subjects
n = 1238† ( %) Χ2 P* OR 95% CI
DRB1 01 110 (8.80) 130 (10.50) 2.064 0.151 03 247 (19.76) 204 (16.48) 4.514 0.034 1.25 1.02 - 1.53 04 285 (22.80) 219 (17.69) 10.055 0.002 1.37 1.13 - 1.67 07 152 (12.16) 185 (14.94) 4.115 0.043 0.79 0.63 – 0.99 08 41 (3.28) 24 (1.94) 4.399 0.036 1.70 1.02 - 2.83 09 24 (1.92) 21 (1.70) 0.175 0.675 10 8 (0.64) 3 (0.24) FISHER 0.226 11 77 (6.16) 81 (6.54) 0.153 0.695 12 21 (1.68) 19 (1.53) 0.083 0.773 13 104 (8.32) 132 (10.66) 3.975 0.046 0.76 0.58 - 1.00 14 25 (2.00) 35 (2.83) 1.808 0.179 15 148 (11.84) 177 (14.30) 3.307 0.069 16 8 (0.64) 8 (0.65) 0.000 0.985
DQB1 02 360 (28.80) 348 (28.11) 0.146 0.703 0301/4 297 (23.76) 222 (17.93) 12.796 3.47x10⁻⁴ 1.43 1.17 - 1.73 0302 103 (8.24) 111 (8.97) 0.417 0.518 03032 53 (4.24) 60 (4.85) 0.528 0.468 0305 0 (0.00) 0 (0.00) - - 04 37 (2.96) 20 (1.62) 5.023 0.025 1.84 1.06 - 3.18 05 154 (12.32) 173 (13.97) 1.491 0.222 06 246 (19.68) 304 (24.56) 8.587 0.003 0.75 0.62 - 0.91
DQA1 0101/4 140 (11.20) 165 (13.33) 2.618 0.106 0102/3 249 (19.92) 311 (25.12) 9.647 0.002 0.74 0.61 - 0.90 0201 137 (10.96) 180 (14.54) 7.168 0.007 0.72 0.57 - 0.92 03011/12 325 (26.00) 243 (19.63) 14.333 1.53 x10⁻⁴ 1.44 1.19 - 1.74 0302 1 (0.08) 0 (0.00) FISHER 1.000 0401 37 (2.96) 19 (1.53) 5.743 0.017 1.93 1.11 - 3.38 0501/2 361 (28.88) 317 (25.61) 3.363 0.067 0601 0 (0.00) 3 (0.24) FISHER 0.123

Chapter 3 HLA class II
84
Table 3.3: Distribution of associated DRB1, DQB1, DQA1 haplotypes in patients with Hashimoto’s thyroiditis and control subjects
Table showing individuals displaying at least one copy of specified haplotype P* - uncorrected P values Χ2 = Chi-squared, OR = Odds ratios, 95% CI = 95% confidence interval
HLA class II haplotypes (DRB1, DQB1, DQA1) Haplotype
Hashimoto’s Thyroiditis n=625 (%)
Control subjects
n=619 (%) Χ2 P* OR 95% CI 03, 02, 0501/2 DR3 235 (37.60) 200 (32.31) 3.827 0.050 1.26 1.00 - 1.59 04, 0301/4, 03011/12 DR4 180 (28.80) 105 (16.96) 24.673 6.79 x 10⁻⁷ 1.98 1.51 - 2.59 07, 02, 0201 DR7 108 (17.28) 142 (22.94) 6.205 0.013 0.7 0.53 - 0.93 08, 04, 0401 DR8 34 (5.44) 19 (3.07) 4.284 0.038 1.8 1.01 - 3.18 13, 06, 01012/3 DR13 83 (13.28) 124 (20.03) 10.222 0.001 0.61 0.45 - 0.83 15, 06, 0102/3 DR15 143 (22.88) 174 (28.11) 4.48 0.034 0.76 0.59 - 0.98

Chapter 3 HLA class II
85
Table 3.4: Distribution of non-associated DRB1, DQB1, DQA1 haplotypes in patients with Hashimoto’s thyroiditis and control subjects
Table showing individuals displaying at least one copy of specified haplotype P* - uncorrected P values Χ2 = Chi-squared, OR = Odds ratios, 95% CI = 95% confidence interval
HLA class II haplotypes (DRB1, DQB1, DQA1)
Hashimoto’s thyroiditis
Control subjects
Χ2 P* n = 625
( %) n = 619
( %) 01, 0301/4, 0101/4 0 (0.00) 0 (0.00) - - 01, 05, 0101/4 107 (17.12) 122 (19.71) 1.388 0.239 03, 02, 0501/2 235 (37.60) 200 (32.31) 3.827 0.050 03, 06, 0501/2 5 (0.80) 1 (0.16) FISHER 0.218 04, 0302, 03011/12 93 (14.88) 110 (17.77) 1.903 0.168 07, 02, 03011/12 12 (1.92) 4 (0.65) FISHER 0.075 07, 03032, 0201 24 (3.84) 38 (6.14) 3.471 0.062 07, 03032, 03011/12 2 (0.32) 0 (0.00) FISHER 0.500 08, 0301/4, 0401 1 (0.16) 0 (0.00) FISHER 1.000 09, 03032, 0301 20 (3.20) 21 (3.39) 0.036 0.849 10, 05, 0101/4 6 (0.96) 3 (0.48) FISHER 0.506 11, 0301/4, 0501/2 68 (10.88) 78 (12.60) 0.889 0.346 11, 05, 0501/2 2 (0.32) 0 (0.00) FISHER 0.500 11, 06, 0501/2 3 (0.48) 0 (0.00) FISHER 0.249 12, 0301/4, 0501/2 1 (0.16) 0 (0.00) FISHER 1.000 12, 05, 0501/2 0 (0.00) 0 (0.00) - - 12, 06, 0501/2 1 (0.16) 0 (0.00) FISHER 1.000 13, 02, 0201 0 (0.00) 0 (0.00) - - 13, 02, 0301 0 (0.00) 0 (0.00) - - 13, 0301/4, 0201 0 (0.00) 0 (0.00) - - 13, 0301/4, 03011/12 0 (0.00) 0 (0.00) - - 14, 0301/4, 03011/12 0 (3.52) 0 (0.00) - - 14, 05, 001/4 22 (0.00) 35 (5.65) 3.240 0.072 15, 0301/4, 0102/3 2 (0.32) 0 (0.00) FISHER 0.500 16, 0301/4, 0101/4 0 (0.00) 0 (0.00) - - 16, 05, 0101/4 3 (0.48) 5 (0.81) FISHER 0.504
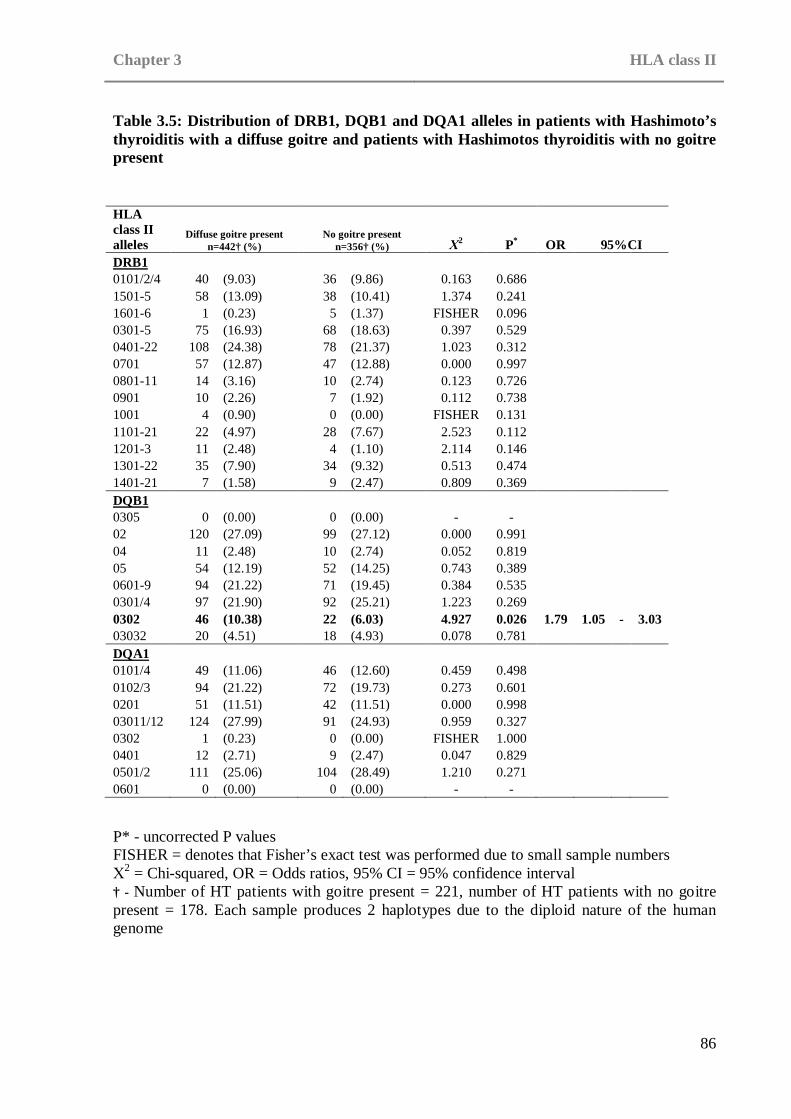
Chapter 3 HLA class II
86
Table 3.5: Distribution of DRB1, DQB1 and DQA1 alleles in patients with Hashimoto’s thyroiditis with a diffuse goitre and patients with Hashimotos thyroiditis with no goitre present
P* - uncorrected P values FISHER = denotes that Fisher’s exact test was performed due to small sample numbers Χ2 = Chi-squared, OR = Odds ratios, 95% CI = 95% confidence interval † - Number of HT patients with goitre present = 221, number of HT patients with no goitre present = 178. Each sample produces 2 haplotypes due to the diploid nature of the human genome
HLA class II alleles
Diffuse goitre present n=442† (%)
No goitre present n=356† (%) Χ2 P* OR 95%CI
DRB1 0101/2/4 40 (9.03) 36 (9.86) 0.163 0.686 1501-5 58 (13.09) 38 (10.41) 1.374 0.241 1601-6 1 (0.23) 5 (1.37) FISHER 0.096 0301-5 75 (16.93) 68 (18.63) 0.397 0.529 0401-22 108 (24.38) 78 (21.37) 1.023 0.312 0701 57 (12.87) 47 (12.88) 0.000 0.997 0801-11 14 (3.16) 10 (2.74) 0.123 0.726 0901 10 (2.26) 7 (1.92) 0.112 0.738 1001 4 (0.90) 0 (0.00) FISHER 0.131 1101-21 22 (4.97) 28 (7.67) 2.523 0.112 1201-3 11 (2.48) 4 (1.10) 2.114 0.146 1301-22 35 (7.90) 34 (9.32) 0.513 0.474 1401-21 7 (1.58) 9 (2.47) 0.809 0.369
DQB1 0305 0 (0.00) 0 (0.00) - - 02 120 (27.09) 99 (27.12) 0.000 0.991 04 11 (2.48) 10 (2.74) 0.052 0.819 05 54 (12.19) 52 (14.25) 0.743 0.389 0601-9 94 (21.22) 71 (19.45) 0.384 0.535 0301/4 97 (21.90) 92 (25.21) 1.223 0.269 0302 46 (10.38) 22 (6.03) 4.927 0.026 1.79 1.05 - 3.03 03032 20 (4.51) 18 (4.93) 0.078 0.781
DQA1 0101/4 49 (11.06) 46 (12.60) 0.459 0.498 0102/3 94 (21.22) 72 (19.73) 0.273 0.601 0201 51 (11.51) 42 (11.51) 0.000 0.998 03011/12 124 (27.99) 91 (24.93) 0.959 0.327 0302 1 (0.23) 0 (0.00) FISHER 1.000 0401 12 (2.71) 9 (2.47) 0.047 0.829 0501/2 111 (25.06) 104 (28.49) 1.210 0.271 0601 0 (0.00) 0 (0.00) - -

Chapter 3 HLA class II
87
Table 3.6: Distribution of DRB1, DQB1 and DQA1 alleles in patients with Hashimoto’s thyroiditis with TSH levels between 5.5-15mIU/liter and patients with Hashimotos thyroiditis with TSH levels greater than 15mIU/liter P* - uncorrected P values FISHER = denotes that Fisher’s exact test was performed due to small sample numbers. Χ2 = Chi-squared, OR = Odds ratios, 95% CI = 95% confidence interval † - Number of HT patients where TSH=5.5 - 15mIU/liter = 128, number of HT patients where TSH >15mIU/liter = 149. Each sample produces 2 haplotypes due to the diploid nature of the human genome
HLA class II alleles
TSH = 5.5 - 15mIU/liter n=256† (%)
TSH >15mIU/liter n=298† (%) Χ2 P*
DRB1 0101/2/4 20 (7.78) 35 (11.71) 2.387 0.122 1501-5 31 (12.06) 29 (9.70) 0.802 0.371 1601-6 0 (0.00) 2 (0.67) FISHER 0.502 0301-5 42 (16.34) 66 (22.07) 2.900 0.089 0401-22 65 (25.29) 63 (21.07) 1.390 0.238 0701 33 (12.84) 39 (13.04) 0.005 0.943 0801-11 7 (2.72) 5 (1.67) FISHER 0.560 0901 7 (2.72) 5 (1.67) FISHER 0.560 1001 1 (0.39) 0 (0.00) FISHER 0.462 1101-21 13 (5.06) 21 (7.02) 0.930 0.335 1201-3 5 (1.95) 5 (1.67) FISHER 1.000 1301-22 26 (10.12) 24 (8.03) 0.738 0.390 1401-21 6 (2.33) 4 (1.34) FISHER 0.525
DQB1 0305 0 (0.00) 0 (0.00) - - 02 66 (25.68) 96 (32.11) 2.764 0.096 04 6 (2.33) 5 (1.67) FISHER 0.762 05 31 (12.06) 42 (14.05) 0.477 0.490 0601-9 51 (19.84) 54 (18.06) 0.287 0.592 0301/4 65 (25.29) 70 (23.41) 0.266 0.606 0302 22 (8.56) 20 (6.69) 0.693 0.405 03032 15 (5.84) 11 (3.68) 1.443 0.230
DQA1 0101/4 25 (9.73) 38 (12.71) 1.223 0.269 0102/3 57 (22.18) 53 (17.73) 1.727 0.189 0201 27 (10.51) 36 (12.04) 0.324 0.569 03011/12 78 (30.35) 73 (24.41) 2.461 0.117 0302 1 (0.39) 0 (0.00) FISHER 0.462 0401 5 (1.95) 5 (1.67) FISHER 1.000 0501/2 63 (24.51) 93 (31.10) 2.974 0.085 0601 0 (0.00) 0 (0.00) - -

Chapter 3 HLA class II
88
3.6 Discussion
Although progress has been made in determining the genetic predisposition to GD, less is
known about the genetic predisposition to HT, due in part to the use of small datasets and the
assumption of genetic homology between both diseases. This study has investigated
association of the HLA class II region, long known to be associated with several AIDs, in a
large UK Caucasian HT case control dataset.
The strongest association in this study was between the DR4 haplotype and HT. This was
closely followed by the associations of the individual alleles included in this haplotype
(DRB1*04, DQB1*0301/4 and DQA1*03011/12). As previously mentioned in section 3.2
this is not the first time that association of the DR4 haplotypes and its included loci with HT
has been proposed. The DR4 haplotype has been shown to be associated in two Caucasian
cohorts (Petrone et al. 2001, Farid and Thompson 1986) and DRB1*04 has been associated in
a Japanese HT cohort (Wan et al. 1995). Whilst the previous associations have been based on
small cohort sizes this study does serve to support this association.
Although there is limited data on previous associations with HT, the DR4 haplotype has long
been associated with type 1 diabetes (T1D) (Cucca et al. 2001, Thomson et al. 1988). The
shared epitope, a highly conserved amino acid sequence encoded in several DRB variations,
including *0401, DRB1*0404, DRB1*0405 and DRB1*0408 has also been associated with
rheumatoid arthritis (RA) (Gourraud et al. 2006). This may indicate that the DR4 haplotype is
a common susceptibility haplotype for autoimmune disease, or more specifically for
autoimmune disease centred around cellular destruction such as HT, T1D and RA. It was not
possible to assess the impact of T1D and/or RA on the HLA class II associations found in this

Chapter 3 HLA class II
89
study due to lack of available phenotype data concerning the autoimmune history of the
patient or family history. This would however be useful to investigate as it may elucidate
whether the association of DR4 was due to the coexistence of T1D and/or RA or if it is an
independent association
To understand this association and the possible general autoimmune connection, the function
of the DR4 haplotype and included alleles must be investigated. Schonland et al demonstrated
that individuals with the DRB1*04 allele exhibited shortening of the telomeres in both CD4+
T cells and granulocytes in the first two decades of life (Schonland et al. 2003). Telomeric
shortening is known to lead to replicative senescence (Harley et al. 1990)however this is
normally a gradual process which occurs over the course of a lifetime. The early onset
telomeric shortening seen in the DRB1*04 positive individuals may lead to an accelerated
replicative senescence of CD4+ T cells and granulocytes resulting in a decrease in cell
turnover rates. This change in the nature of the T cell population may reduce the efficacy of
the immune system in response to antigenic stimuli. It may be that the T cells entering
senescence are unable to prevent autoreactive cells from expanding. Alternatively it may be
that the senescent T cells, which are less responsive to controlling stimuli, attack the hosts
own cells (Sakaguchi 2000, Schonland et al. 2003).
The DRB1*03 allele and DR3 haplotype have however been previously associated with GD
(Simmonds et al. 2005). In particular the strong DR3 association with GD seen in a study by
Heward et al. and then expanded upon in a study by Simmonds et al. can be compared to the
results in this thesis with some accuracy (Simmonds et al. 2005, Heward et al. 1998). The HT

Chapter 3 HLA class II
90
patients recruited for this study are UK Caucasians and are part of the UK national AITD
collection (Manji et al. 2006). They are taken from the same sample population as that used to
recruit GD patients in both Heward’s and Simmonds’ GD studies and the same control set has
been used for all three studies hence allowing comparative analysis. The strong association of
DR4 and weak association of DR3 in this HT study are in marked contrast to Heward’s GD
study where DR3 was the strongest association noted (Heward et al. 1998). This study was
furthered by Simmonds et al. and again showed an increase in the DR3 haplotype and further
confirmed the association of the DRB1*03 allele with GD by showing not only an association
of a single copy of DRB1*03 (OR 1.94; 95% CI 1.52–2.48) but that individuals homozygous
for DRB1*03 showed even stronger association (OR 3.49; 95% CI 1.77–6.87) (Simmonds et
al. 2005). This provides a strong case for the theory that the genetic causal factors of GD and
HT are, at least in part, different.
Although both HT and GD are centred around autoimmune attack of the thyroid gland there
are many differences in the etiology and pathogenesis of the two diseases (see chapter 1,
sections 1.4.2 and 1.4.3). This may imply that the relationship of genetic causal factors
between HT and GD are similar to that between HT and other autoimmune diseases. Whilst
some causal factors will be common to both, some will show association only with one. One
of the striking differences between HT and GD is the involvement of TSHR autoantibodies.
Whilst in GD the formation of TSHR autoantibodies results in increased thyroid hormone
production and is a key factor in the pathogenesis of the disease, TSHR autoantibodies are not
seen in HT (see Chapter 1, section 1.4). Association of the TSHR gene with GD has also been
reported in GD (Brand et al. 2009) but not in HT (see chapter 1 section 1.8). It may be

Chapter 3 HLA class II
91
therefore that the DR3 haplotype is involved in the production of TSHR autoantibodies, a
feature unique to GD, hence the lack of association seen in this HT study. Similarly the DR4
haplotype, seen to be associated with HT but not GD may be involved in the as yet poorly
understood mechanism of action for thyrocyte destruction in HT.
In this study protective roles were detected for DRB1*07 and the DR7 haplotype and a trend
towards a predisposing role for the DRB1*08 allele and DR8 haplotype. In contrast to the
differences observed with the predisposing associations, the DR7 and DR8 haplotypes have
also been identified as having a protective role in GD (Simmonds et al. 2005). Whilst there
are many differences between the pathogenesis of these two AITDs there are also some
common aspects such as the presence of Tg and TPO autoantibodies. It may be that the DR7
and/or DR8 haplotypes protect against one or both of these autoantibody colonies forming.

Chapter 4 MICA and MICB
92
CHAPTER 4: MICA AND MICB
4.1 Introduction
The HLA class I region spans approximately 1.8Mb on chromosome 6. There are potentially
118 genes in this region however only 34 have been shown to be expressed, the remainder
being pseudogenes, sequence tagged sites, potential coding sequences or expressed sequences
(Shiina et al. 1999). The HLA Class I loci are subdivided into the classical and non-classical
genes. The classical genes are further grouped into HLA-A, HLA-B and HLA-C whilst the
non-classical genes comprise of the HLA-D, HLA-E, HLA-F and HLA-G groups, the MIC
genes and a variety of other genes. (Bahram et al. 1994, Klein and O'HUigin 1994).
4.1.1 HLA Class I
Structure and function of the HLA Class I molecules
The HLA Class I genes are all remarkably similar in basic structure. All HLA Class I genes
begin with a 5’ leader exon which encodes a short signal peptide. This region is followed by 3
exons which encode the extracellular α1, α2, α3 domains of the HLA Class I molecule. The
exon encoding the transmembrane region of the molecule follows this and finally a 3’
terminal exon encoding the cytoplasmic domains. All HLA Class I genes follow this pattern
with the only apparent differences being whether the α chain is encoded by 5 or 6 exons and
whether there are 1 or 2 terminal exons (Goldsby and Goldsby 2003).
The HLA Class I molecule is comp rised of a 45 kilod alton (k Da) α chain non-covalently
associated with a 12 kDa β2-microglobulin molecule (Goldsby and Goldsby 2003). Whilst the
α chain is encod ed b y the HLA Class I g enes on chromosome 6 , the β2-microglobulin
molecule is encoded by a highly conserved gene located at 15q21-q22. The hydrophobic

Chapter 4 MICA and MICB
93
transmembrane region and hydrophilic cytoplasmic tail of the α chain anchors the α chain and
β2-microglobulin dimer in the plasma membrane (see Figure 3.3)
The primary function of the HLA class I genes is to encode glycoproteins involved in the
presentation of endogenous peptide antigens to cytotoxic T cells (Tc cells) (see chapter 1,
section 1.2).
HLA Class I molecules bind peptides derived from endogenous intracellular proteins. Proteins
present within the cell such as those from expressed viral genes, become associated with
molecules of ubiquitin. The ubiquitin-protein complex is then degraded by a multifunctional
protease complex called a proteasome, including specialised proteases proteasome subunit
beta-type 9 (PSMB9), proteasome subunit beta-type 8 (PSMB8) and proteasome subunit beta-
type 10 (PSMB10), within the central hollow of the proteasome into short length peptides for
association with HLA class I molecules. This process is part of the cytosolic processing
pathway present in all cells that allows the proteins, once digested in the cytosol, to be
transported to the cisternae of the endoplasmic reticulum which is aided by the transporter
associated with antigen processing (TAP) heterodimer. The TAP heterodimer is comprised of
TAP1 and TAP2 protein subunits (Goldsby and Goldsby 2003). Each of the subunits is
similar in configuration and has a domain projecting into the lumen of the rough endoplasmic
reticulum (RER) and a domain that projects into the cytosol. The domain projecting into the
cytosol also binds adenosine triphosphates (ATP), which facilitates TAPs function in the
ATP-dependent transport of amino acids, sugars, ions and peptides. Although TAP mediates
several transport of several molecules it shows the highest affinity for peptides of 8-10 amino

Chapter 4 MICA and MICB
94
acids and peptides with hydrophobic or basic C-terminal amino acids, which are also the
optimal length and peptide anchor residues for binding by HLA class I molecules.
The mature HLA class I molecule consists of an alpha chain and a β2-microglobulin chain
which are synthesised as separate units on polysomes present on the (RER) of the cell. A
chaperone molecule, calnexin associates with the α chain aiding in the folding of the protein
chain. The β2-microglobulin chain then binds to the α chain causing the calnexin molecule to
be released and a new chaperone molecule, calreticulin, to associate with the now joined α
and β2-microglobulin chains. For the HLA class I molecule to become a stable unit which can
then exit the RER a peptide must be present in the binding site of the molecule. The TAP
assisted protein (tapasin) associates with the HLA class I around the same time as the
association of calrecticulin occurs. Tapasin brings the TAP complex and HLA class I
molecule together allowing transport of the peptides through the membrane of the RER. This
HLA class I tapasin complex allows capture of the peptide formed from the proteasome
before it can be degraded by the RER lumen. The now stable HLA class I complex can leave
the RER and move towards the cell surface. Each HLA Class I molecule binds unique sets of
peptides and on average a single cell can express around 105 copies of each class I molecule,
enabling a great variety of different peptides to be expressed simultaneously (Goldsby and
Goldsby 2003).
Although the classical HLA class I genes are the most commonly investigated the non-
classical HLA class I genes, are also worthy of investigation. The six MHC class I chain-
related (MIC) genes, MICA, MICB, MICC, MICD, MICE and MICF are all non-classical
4.2 MICA and MICB
Chapter 4 MICA and MICB
95
class I HLA genes. Only two of these genes, MICA and MICB are expressed and produce
protein products (Janeway 2005, Frigoul and Lefranc 2005). Unlike the majority of the HLA
region MICA and MICB were only identified relatively recently in 1994 (Bahram et al. 1994)
and as a result there still much to be learned about their structure and function.
MICA and MICB gene structure
MICA is located at 6p21.3, 46.4kb centromeric to HLA-B and MICB 70kb centromeric to
MICA. The initial study in 1994 concluded that MICA consisted of a single long open reading
frame of 1149bp and encodes a 383 amino acid long polypeptide with a relative molecular
mass of 43kDa (Bahram et al. 1994). Since then it has become apparent that a microsatellite
polymorphism in exon 5 consisting of between four to ten GCT repeats encoding four to ten
alanine amino acids means that MICA is between 360 and 366 amino acids in length (Frigoul
and Lefranc 2005).
The structure of the MICA gene and protein is similar to that of classical HLA class I genes
and encoded proteins. There are three external domains, α1, α2, α3, two distal G-like
domains, a C-like domain, connecting region, transmembrane region and a cytoplasmic tail.
The protein is highly glycosylated with 3 glycosylation sites in the G like domains and 5 in
the C-like domain. In marked difference to the classical HLA class I molecules the expression
of the MICA protein does not require, nor has found to be associated with either peptide or β2
microglobulin (Rodriguez-Rodero et al. 2007). Whilst similar to that of classical HLA class I
genes, the structure of the MICA gene has some variations. Exon 1, which is 70bp in length
and encodes the L-region. Similarly to classical HLA class I molecules this first exon encodes
a signal peptide. Exon 2 is 255bp and encodes the first extracellular distal G-like domain of
Chapter 4 MICA and MICB
96
85 amino acids. This is in contrast to the single exon of classical HLA class I molecules. Exon
3 is 288bp and encodes the second of the distal G-like domains, 96 amino acids in length.
Exon 4 is 279bp in length and encodes the 279 amino acid C-like domain. Exon 5 contains the
microsatellite polymorphism hence can be between 132 and 150bp. Exon 5 encodes the 12
amino acid connecting region, the transmembrane region which can be between 19 and 25
amino acids in length owing to the polymorphism and finally 13 amino acids of the
cytoplasmic region. A very large intron of 2551bp separates exon 5 from exon 6 which is
itself 125bp in length and codes the remaining 42 amino acids of the cytoplasmic region and
3’ untranslated region. This is in contrast to the separation of the exon encoding the
cytoplasmic tail and untranslated regions in classical HLA class I genes.
Whilst there are similarities in the overall genetic and protein structure of MICA and MICB to
classical HLA class I genes and molecules there is little similarity in the genetic sequences
with the MIC genes showing only 15-30% sequence identity (Goldsby and Goldsby 2003).
MICA and MICB are extremely similar sharing 91% identity in their coding sequences
(Bahram et al. 1994). Although this primary knowledge is known about MICA, there has
been little work on the structure and function of MICB and the associated protein products.
Function of MICA and MICB genes
It was initially presumed that the expression of MICA and MICB was restricted mainly to
intestinal epithelial cells (Groh et al. 1996). However a more recent study has shown that
MICA and MICB were transcribed in every tissue type examined with the exception of the
central nervous system indicating that it has the potential to be transcribed in nearly all tissue
types (Schrambach et al. 2007). MICA and MICB are expressed in response to cellular stress
Chapter 4 MICA and MICB
97
or injury, in particular in response to heat shock protein formation due to either heat or
oxidative stress from hydrogen peroxide (Frigoul and Lefranc 2005). The MICA and MICB
protein chains are expressed on the surface of these cells where they can be recognised by a
receptor on natural killer (NK) cells, and a specific subset of T cells, γδT cells and CD8+ αβT
cells (Bauer et al. 1999). Of particular interest is the γδT cell subset which carry the activating
C-type lectin NK receptor killer cell lectin-like receptor, subfamily K, member 1 (KLRK1)
which MICA and MICB molecules bind to, with a single MIC molecule binding to each
KLRK1 homodimer. This then induces apoptosis of the affected cell.
There has not been a great deal of previous work performed concerning MICA association
with autoimmune disease (AID) and even less concerning MICB however a few associations
have previously been reported. Five alleles of exon 5 (see MICA and MICB gene structure),
each consisting of GCT trinucleotide repetitions have been identified. These are denoted as
MICA4, MICA5, MICA6, MICA9 and MICA5.1, each referring to the number of
trinucleotide repeats present in that allele. MICA5.1 is so named due to the repetition
consisting of 5 GGCT rather than the trinucleotide GCT (Gambelunghe et al. 2000).
4.2.1 Previous associations of MICA and MICB with AID
Only one previous study has shown evidence of association of MICA with HT. In a German
cohort of 129 GD patients, 56 HT patients and 206 controls weak association of MICA9 was
observed (P=0.016). In addition weak association of the MICA5.1/MICA9 haplotype was
seen (P=0.025, OR=2.5, 95%CI=1.2-5.4) (Ide et al. 2007). This study was performed in a
mixed dataset using a very small HT cohort; the results therefore should be treated with
caution until replicated in a larger dataset.

Chapter 4 MICA and MICB
98
In a study performed by Gambelunghe et al. on a cohort of 195 type 1 diabetes (TID) patients
and 158 controls association of the MICA5 allele was observed (OR=5.1; corrected P(Pc) <
0.0005) MICA5.1 was also seen to be associated with adult onset T1D in this study (OR=
7.0; corrected P (Pc) < 0.001) (Gambelunghe et al. 2001). The MICA5 and MICA5.1 alleles
were not however found to be associated in a Korean cohort whereas a borderline association
of MICA6 was reported. In addition to this the same Korean study also found evidence for
MICA4 as a protective factor against T1D (Relative risk (RR)=0.44, Pc<0.01) (Park et al.
2001). Whilst it should be noted the associations found in both studies were weak the lack of
replication does not necessarily point to a false positive in either study. It may be that the
different genetic backgrounds of the different ethnic groups used in the two studies
contributed to this discrepancy. This phenomenon has been seen previously in the TSHR gene
in GD when association within UK Caucasians was located to intron 1 and in Japanese GD
patients was located in intron 7 (Dechairo et al. 2005, Hiratani et al. 2005). Additional
associations of MICA5.1 and MICA-129met have also been observed in Addison’s disease
(OR=22, Pc<10 −3) (Park et al. 2002) and ankylosing spondylitis (Pc=0.006, OR=2.57;
95%CI=1.29–5.1) (Amroun et al. 2005) respectively.
In a study performed by Lo et al. on a cohort of 129 GD patients and 396 controls several
associations were observed (Lo et al. 2003). The MICA5/MICA5 haplotype was associated
(RR=2.49, 95% CI=1.52–4.10, 0.00024, Pc=0.0035) as was the MICA5/MICA5.1 haplotype
(RR=2.13, 95% CI=1.31–3.47, P=0.0020, Pc=0.030). In addition the MICA5 allele was
strongly associated (RR=2.12; 95%CI=1.59–2.82; P=1.9 x 10⁻⁷; Pc=9.5 x 10⁻⁷). The
MICA5.1/MICA5.1 haplotype was seen to be protective (RR=0.09, 95% CI=0.01–0.66,
P=0.0030, Pc=0.044) (Lo et al. 2003). It can be seen that as MICA5.1/MICA5.1 was

Chapter 4 MICA and MICB
99
protective but MICA5/MICA5.1 was not, two copies of the MICA5.1 alleles are required to
confer protection. An unusual factor about this study is that was performed on children with
GD and as GD does not commonly present until the fourth decade of life the results may be
specific to early onset GD.
It should also be noted that of all the associations mentioned, with the exception of the A5
allele in the study by Lo et al., all were relatively weak associations. Due to lack of consistent
replication of these studies it is difficult to say whether this is due to the MICA gene having
only a low impact on pathogenesis of AID or whether some of these may be false positives
due to underpowered studies (see Chapter 2, section 2.8.1)
Although little work has been done concerning the MICB gene some associations have been
recorded. The MICB0106 allele was found to be strongly associated with coeliac disease (Pc<
0.000001, OR=5.6, 95%CI=3.1–10.1) (Gonzalez et al. 2004) and the MICB004 allele with
rheumatoid arthritis (Pc=0.01, OR=2.2, 95%CI=1.3–3.7) (Lopez-Arbesu et al. 2007). Both
studies did however suggest that the association of these MICB alleles may be due to the
strong LD of the area causing other HLA associations to be interpreted as a MICB,
independent association.

Chapter 4 MICA and MICB
100
Due to the important role of the HLA region in encoding key immune response genes it is
possible that additional susceptibility loci may be present within this gene dense region above
and beyond the known HLA class II association I have detected previously (refer to Chapter
3). The role of MICA and MICB in the causation of apoptosis could indicate that these genes
play a role in the thyrocyte destruction seen in HT. Although the results for MICA and MICB
in autoimmune disease have varied, only a very limited amount of work has been performed
in AITD
4.3 Aims
i. To genotype a large cohort comprising of HT patients and controls using TagSNPs
to cover the majority of common polymorphisms with a minor allele frequency of
> 20% within MICA and MICB.
ii. To determine the predisposing and protective factors within the MICA and MICB
genes via statistical analysis of TagSNP frequencies.
4.4 Methods
The sample cohort comprised of 745 individuals with HT and 617 control subjects
(comprising of 288 control subjects from the Birmingham control collection and 329 control
subjects taken from the 1958 birth cohort control set) as described in Chapter 2, section 2.1.
4.4.1 Subjects

Chapter 4 MICA and MICB
101
Genotyping data for the MICA and MICB regions was obtained from the International
Haplotype mapping project web site [www.hapmap.org] (using the July ’06 release and a
minor allele frequency (MAF) of 0.2) and then processed using the Haploview program
(version 3.32) [www.hapmap.org/haploview_help.html]. Power calculations determined that
with this smple cohort and a MAF of 0.2 there was power to exclude an effect of OR=1.3 or
above (see Chapter 2, section 2.8.1). For MICA a region of 11.7Kb was identified containing
10 TagSNPs covering a total of 14 variants. For MICB a region of 12.9Kb was identified
containing 5 TagSNPs covering an additional 14 variants. For both gene regions all SNPs
with an r2>0.80 were tagged.
4.4.2 Genotyping
Pre-designed genotyping assays for rs1131896, rs1131904, rs2256175, rs2844519,
rs2855812, rs2853977, rs3130615, and rs9267390 were purchased from Applied Biosystems,
UK. No previous assays had been designed for rs2523497, rs2844514, rs2844518, rs2853975,
rs3131638, rs6934187 and rs7383312 so the sequences surrounding these SNPs (see
Appendix, section 6.5) were submitted to Applied Biosystems, UK and genotyping assays
designed and validated. All assays were genotyped on an ABI7900 HT using TaqMan®
genotyping technologies (Applied Biosystems, UK).
The DNA was prepared as previously described in Chapter 2 sections 2.2 and 2,3.
4.4.3 Method
DNA samples were previously diluted to a concentration of 20ng/ul and stored in 96 well
plates. 2.25 µl of each 20ng/ul DNA sample was aliquoted from four different 96 well plates
of samples into separate wells on a 384 well plate (Applied Biosystems, UK). On each plate

Chapter 4 MICA and MICB
102
2.25 µl of Millq water was used in place of DNA in a minimum of four wells to be used as
non-template controls (NTC) to check for plate contamination.
A reaction solution comprising of 2.75 µl Applied Biosystems genotyping master mix
(Applied Biosystems, UK), 0.18 µl of genotyping assay (Applied Biosystems, UK) and 0.09
µl millq water was aliquoted into each well of the 384 well plate including the NTCs. The
plate was then sealed with an optically clear sealer (Griener, UK), and centrifuged at 1000rpm
for 1 minute. The plates were then run on M J Research PTC-225 Peltier Thermal cycler
machine (Genetic Research Instrumentation, UK) using the following PCR program:
120 seconds Taq activation - 50oC
600 seconds denaturation - 95oC
40 cycles: 15 seconds denaturation - 92oC
60 seconds annealing and extension - 60oC
Conventionally in PCR reactions the annealing and extension stages are separate with the
annealing stage being at a lower temperature than that of the extension. However in this
process the primers have been designed by Applied Biosystems to anneal at a higher
temperature, thus a separate stage is not required (http://www.appliedbiosystems.com). This
reduces the time required for the PCR process and also reduces risk of contamination by
allowing the temperature to remain high during this stage.
All assays contained two probes; VIC and FAM to detect alleles 1 and 2 respectively (see
Figure 2.4 for binding process) of the SNP being assayed. Each assay is provided with
Chapter 4 MICA and MICB
103
information concerning which allele of a given SNP represents allele 1 and which allele
presents allele 2. The probe will bind to the DNA present in accordance with the allele
exhibited; in a heterozygous sample VIC and FAM will both bind in a homozygous sample
only one type of probe will bind. The probes fluoresce with different wavelengths enabling
the sample to be read using the ABI7900 prism (Applied Biosystems, UK).
The results from the ABI7900 prism were incorporated into the SDS software (Version 2.2.2,
Applied Biosystems, UK). The preliminary results were displayed in both a graphical and
tabular form (see Figure 4.1). From this the initial validity of the results could be assessed.
Using the graphical representation any results which did not appear to fall into one of the two
homozygote or the heterozygote groupings (and which were not previously defined as NTCs)
could be considered as outliers and repeated or eliminated from further analysis. Any of the
samples defined as NTCs which did not fall into the NTC grouping demonstrated a possible
contamination of the plate by extraneous DNA and would necessitate the repetition of the
entire plate. If the results did not appear to group at all or an abnormal grouping was observed
then the validity of the results was checked via the tablature representation. By comparing the
strength of fluorescence for each of the two probes in each individual well it could be
determined whether the grouping was an anomaly due to the failure of the assay or the DNA.
4.4.4 Analysis

Chapter 4 MICA and MICB
104
Figure 4.1: Schematic of allelic results
Chapter 4 MICA and MICB
105
4.4.5 Statistical analysis
Analysis of case control data was performed using the Chi-squared (χ2) test with P < 0.05
considered significant, with the Fisher’s exact test performed for samples with counts lower
than 10. Odds ratios (OR) and 95% confidence intervals (CI) were calculated using the
method of Woolf with Haldane’s modification for small numbers (Woolf 1955). The Fisher’s
exact test was performed using the MINITAB statistical package (MINITAB Release 14.1 ©
1972–2003, Minitab Inc, USA.); all other calculations were performed using Excel
(Microsoft® Excel, © 1985-2003 Microsoft Corporation).
4.5 Results
Genotyping results
All cases and controls for each assay were in Hardy Weinberg equilibrium. No differences
were observed between HT cases and controls for either genotype or allele frequencies for 13
of the SNPs assayed (rs1131904, rs2256175, rs2523497, rs2844514, rs2844518, rs2844519,
rs2853977, rs2855812, rs3130615, rs3131638, rs6934187, rs7383312 and rs9267390). A
small association (P=0.024) was observed for the TT genotype of MICA SNP rs2853975
SNP with a similar association (P=0.030, OR=1.21, 95% CI= 1.02-1.43) for the T allele. (see
Tables 4.1 and 4.2).
Although the assay for the rs1131896 SNP was purchased and initial genotype investigations
carried out, information from this assay was unavailable for the final data analysis. Despite
several replications no fluorescence was seen in samples processed with this assay indicating
that the probe had not bound to the target DNA. As results were gained from all other assays
it can be concluded that the DNA was of sufficient quality and rather the design of the

Chapter 4 MICA and MICB
106
sequence used in the rs1131896 SNP assay was at fault. As no other SNPs were present in this
TagSNP group there was no viable alternative. Had more time been available for this project a
redesigned sequence could have been submitted to attempt to reassess the association of this
SNP.
Phenotype/genotype associations
Insufficient data was available for phenotype correlations. Only partial data had been
collected or was available on the various phenotypes of the HT patients used in this study.
The numbers of patients with available data for each phenotype was so small as to greatly
underpower the analysis.
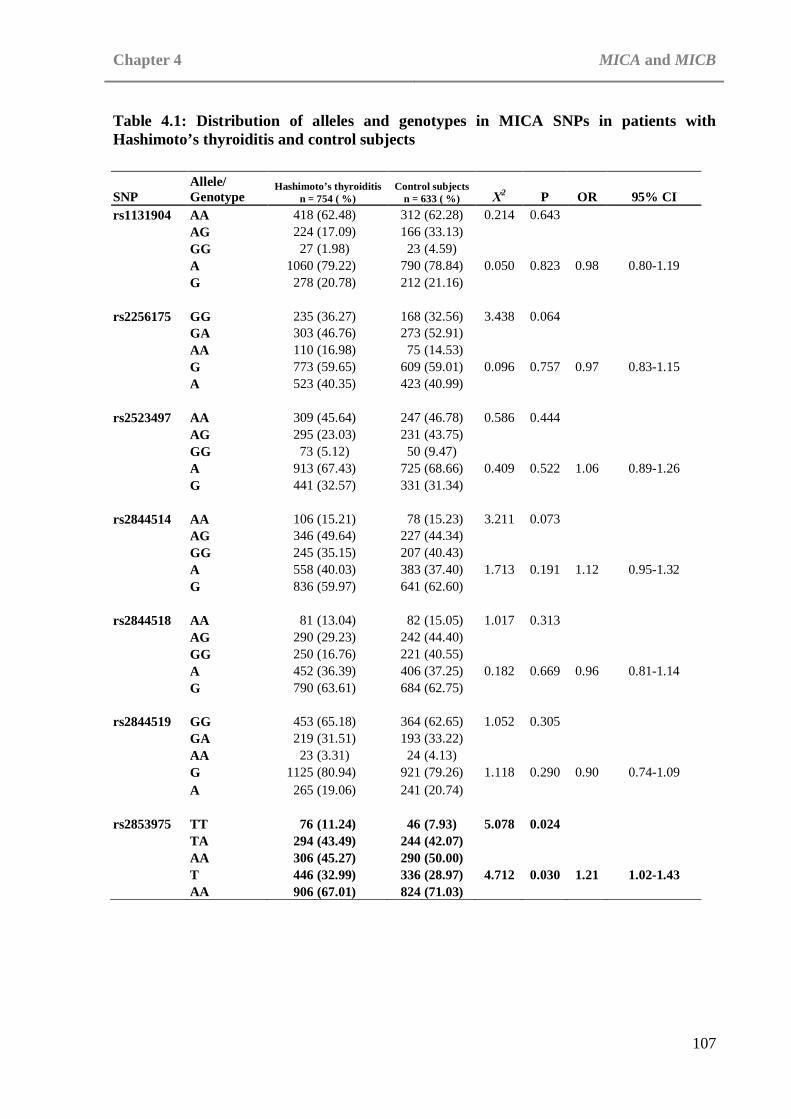
Chapter 4 MICA and MICB
107
Table 4.1: Distribution of alleles and genotypes in MICA SNPs in patients with Hashimoto’s thyroiditis and control subjects
SNP Allele/ Genotype
Hashimoto’s thyroiditis n = 754 ( %)
Control subjects n = 633 ( %) Χ2 P OR 95% CI
rs1131904 AA 418 (62.48) 312 (62.28) 0.214 0.643 AG 224 (17.09) 166 (33.13) GG 27 (1.98) 23 (4.59) A 1060 (79.22) 790 (78.84) 0.050 0.823 0.98 0.80-1.19 G 278 (20.78) 212 (21.16) rs2256175 GG 235 (36.27) 168 (32.56) 3.438 0.064 GA 303 (46.76) 273 (52.91) AA 110 (16.98) 75 (14.53) G 773 (59.65) 609 (59.01) 0.096 0.757 0.97 0.83-1.15 A 523 (40.35) 423 (40.99) rs2523497 AA 309 (45.64) 247 (46.78) 0.586 0.444 AG 295 (23.03) 231 (43.75) GG 73 (5.12) 50 (9.47) A 913 (67.43) 725 (68.66) 0.409 0.522 1.06 0.89-1.26 G 441 (32.57) 331 (31.34) rs2844514 AA 106 (15.21) 78 (15.23) 3.211 0.073 AG 346 (49.64) 227 (44.34) GG 245 (35.15) 207 (40.43) A 558 (40.03) 383 (37.40) 1.713 0.191 1.12 0.95-1.32 G 836 (59.97) 641 (62.60) rs2844518 AA 81 (13.04) 82 (15.05) 1.017 0.313 AG 290 (29.23) 242 (44.40) GG 250 (16.76) 221 (40.55) A 452 (36.39) 406 (37.25) 0.182 0.669 0.96 0.81-1.14 G 790 (63.61) 684 (62.75) rs2844519 GG 453 (65.18) 364 (62.65) 1.052 0.305 GA 219 (31.51) 193 (33.22) AA 23 (3.31) 24 (4.13) G 1125 (80.94) 921 (79.26) 1.118 0.290 0.90 0.74-1.09 A 265 (19.06) 241 (20.74) rs2853975 TT 76 (11.24) 46 (7.93) 5.078 0.024 TA 294 (43.49) 244 (42.07) AA 306 (45.27) 290 (50.00) T 446 (32.99) 336 (28.97) 4.712 0.030 1.21 1.02-1.43 AA 906 (67.01) 824 (71.03)
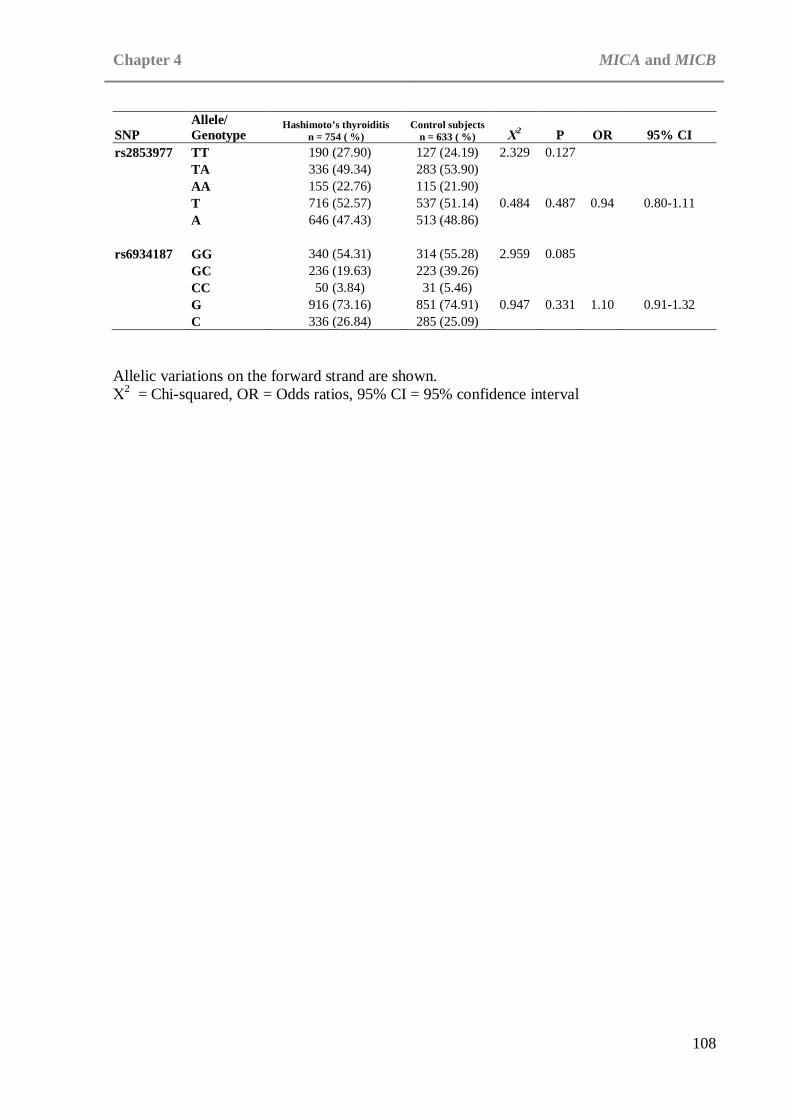
Chapter 4 MICA and MICB
108
Allelic variations on the forward strand are shown. Χ2 = Chi-squared, OR = Odds ratios, 95% CI = 95% confidence interval
SNP Allele/ Genotype
Hashimoto’s thyroiditis n = 754 ( %)
Control subjects n = 633 ( %) Χ2 P OR 95% CI
rs2853977 TT 190 (27.90) 127 (24.19) 2.329 0.127 TA 336 (49.34) 283 (53.90) AA 155 (22.76) 115 (21.90) T 716 (52.57) 537 (51.14) 0.484 0.487 0.94 0.80-1.11 A 646 (47.43) 513 (48.86) rs6934187 GG 340 (54.31) 314 (55.28) 2.959 0.085 GC 236 (19.63) 223 (39.26) CC 50 (3.84) 31 (5.46) G 916 (73.16) 851 (74.91) 0.947 0.331 1.10 0.91-1.32 C 336 (26.84) 285 (25.09)

Chapter 4 MICA and MICB
109
Table 4.2: Distribution of alleles and genotypes in MICB SNPs in patients with Hashimoto’s thyroiditis and control subjects
Allelic variations on the forward strand are shown. Χ2 = Chi-squared, OR = Odds ratios, 95% CI = 95% confidence interval
SNP Allele/ Genotype
Hashimoto’s thyroiditis n = 754 ( %)
Control subjects n = 633 ( %) Χ2 P OR 95% CI
rs2855812 GG 339 (49.78) 308 (54.13) 1.909 0.167 GT 294 (43.17) 225 (39.54) TT 48 (7.05) 36 (6.33) G 972 (71.37) 841 (73.90) 2.001 0.157 1.14 0.95-1.36 T 390 (28.63) 297 (26.10) rs3130615 TT 391 (57.33) 303 (56.95) 0.094 0.760 TC 254 (19.14) 198 (37.22) CC 37 (2.64) 31 (5.83) T 1036 (75.95) 804 (75.56) 0.049 0.824 0.98 0.81-1.18 C 328 (24.05) 260 (24.44) rs3131638 CC 33 (4.90) 27 (4.66) 0.077 0.781 CT 230 (24.57) 195 (33.68) TT 410 (23.35) 357 (61.66) C 296 (21.99) 249 (21.50) 0.087 0.768 1.03 0.85-1.24 T 1050 (78.01) 909 (78.50) rs7383312 AA 75 (10.93) 80 (13.89) 2.888 0.089 AG 318 (29.47) 267 (46.35) GG 293 (17.60) 229 (39.76) A 468 (34.11) 427 (37.07) 2.390 0.122 0.88 0.75-1.04 G 904 (65.89) 725 (62.93) rs9267390 AA 293 (45.08) 245 (46.85) 0.301 0.583 AG 288 (23.40) 224 (42.83) GG 69 (5.04) 54 (10.33) A 874 (67.23) 714 (68.26) 0.281 0.596 1.05 0.88-1.25 G 426 (32.77) 332 (31.74)

Chapter 4 MICA and MICB
110
4.6 Discussion
For association of MICA with HT 10 TagSNPs covering a total of 14 variants were
investigated and for association of MICB 5 TagSNPs covering an additional 14 variants were
investigated. Of the 15 investigated SNPs one was not able to provide genotype data (see
section 4.5). Of the remaining 14 SNPs investigated weak association with HT was seen in
one, rs2853975. Only one previous HT study has been performed investigating association of
MICA where a small positive correlation was observed for the A9 allele (P=0.016) and
A5.1/A9 genotype ( P=0.025, OR=2.5, 95%CI=1.2-5.4) (Ide et al. 2007). This is a similar
level of effect to the small positive correlation observed in this study for the TT genotype
(P=0.024) and T allele (P=0.030, OR=1.21, 95% CI= 1.02-1.43) of rs2853975. Whilst this
study has added further evidence for the role of MICA in HT by performing this investigation
in a larger cohort, 745 HT patients were analysed in comparison to 56 in the study performed
by Ide et al.(Ide et al. 2007), both results were weak positives. Had a smaller P value been
observed in this study then it would seek to confirm the association of MICA with HT,
however as neither study showed association stronger than P=0.024 there may be other
factors to consider. Although it is considered a ‘significant’ association, being below the
boundary of P=0.05 it is only just so, the weak association may be due instead to a
coincidentally high proportion of MICA polymorphisms in the affected individuals rather
than to the associated polymorphisms being causal factors for disease pathogenesis.
The strong LD within this region should also be taken into account when viewing both the
results from this study and that by Ide et al. As stated previously one of the main problems
with determining a reliable result in the HLA region and extended region is the issue of strong
LD. The findings of this study may not reflect an independent association but rather an

Chapter 4 MICA and MICB
111
association of a nearby region within strong LD. To determine the likelihood of LD playing a
role in the association observed in this study further analysis would need to be performed
however due to the time constraints of this investigation it was not possible to do so for this
thesis. The primary goal would be to attempt to identify the common LD blocks within the
region surrounding and including MICA. This could be performed via use of data available at
the International haplotype mapping project web site [www.hapmap.org] and further
processed using the Haploview program [www.hapmap.org/haploview_help.html]. Loci
which then proved to be in strong LD with MICA polymorphisms, in particular with the
associated SNP rs2853975, could be genotyped in the same cohort as used for the initial
study.
Although LD only usually extends up to 200kb, LD within the HLA region can extend much
further including LD seen between the HLA class II and class I regions (Pritchard and
Przeworski 2001, Chapman et al. 2003, Gabriel et al. 2002). Several associations within the
HLA class II gene region with HT have been detected (see Chapter 3), including very strong
association of the DR4 haplotype and individual included alleles (See chapter 3). LD analysis
between MICA/MICB and components of the DR4 haplotype would therefore be of benefit to
determine if this weak association detected in rs2853975 could be due to weak LD with DR4.
The HLA gene region in general is of great interest concerning autoimmune disease due to the
involvement of numerous HLA class I, class II and class III genes with the immune response
(see chapter 1, chapter 3 and section 4.1 for further details). As HT is a multifactorial
autoimmune disease it may be that there are several causal factors within the entire HLA gene
region contributing to HT. However, it may be that there are a small number of highly

Chapter 4 MICA and MICB
112
associated casual factors within this region that are in areas of strong LD. If this is the case
then it is not unlikely that any number of falsely associated loci would be detected in studies
investigating the association of the HLA gene region with HT.
Due to time constraints further screening was not possible. Ideally to further this work work
the remainder of the genetic variation within MICA and MICB and the surrounding areas
would be investigated. SNPs with at least a MAF of 0.20 were chosen for this study. For
MICA 10 TagSNPs capturing a total of 14 variations were genotyped, decreasing the MAF to
0.10 would allow 13 TagSNPs to cover a total of 24 variations. For MICB 5 TagSNPs
covering 14 variants were identified and genotyped, decreasing the MAF to 0.10 would allow
8 TagSNPS to cover a total of 27 variations ([www.hapmap.org] using the July ’06 release).
By increasing the number of genotyped SNPs within the MICA and MICB genes a denser
map of the area may be obtained. This may highlight associated SNPs which are not in strong
LD with the original set of TagSNPs investigated. In order to detect these additional SNPs the
size of the cohort used would also need to be increased to ensure sufficient power (see
Chapter 2, section 2.8.1). Furthermore the additional SNPs could be screened for LD with
HLA class II to determine if new associations were independent of the already demonstrated
HLA class II associations (see Chatper 3).
HLA-B, and HLA-C lie close to the MICA and MICB genes and have also shown to be
strongly associated with GD (Simmonds et al. 2007). Screening of these genes, in addition to
other portions of the HLA class I gene region such as HLA-A would therefore be beneficial.
Again these areas could be assessed for LD with both the MICA and MICB genes and also
the HLA class II region.
Chapter 5 Discussion
113
CHAPTER 5: DISCUSSION
Whilst much work has been done to investigate autoimmune thyroid diseases (AITDs)
Graves’ disease (GD) and Hashimoto’s Thyroiditis (HT) in combined datasets and to
investigate GD, there has been minimal work on the determination of the causal factors of HT
alone (see Chapter 1). Although there is a commonality between HT and GD in that they are
both exhibit autoimmune attack against the thyroid there are a few differences, a fact which
highlights the need for separate investigation of these two diseases.
5.1 Discussion
Several studies have previously been conducted which investigate association of the HLA
class II region with HT however they have all been on small data sets and many have been in
mixed GD and HT datasets (Moens et al. 1978, Weissel et al. 1980, Farid et al. 1981,
Stenszky et al. 1987, Tandon et al. 1991, Petrone et al. 2001, Hunt et al. 2001, Tomer et al.
2003a). The primary aim of this study therefore was to perform a candidate gene association
study to determine the genetic causal variants present in the HLA class II region in a large HT
only cohort.
Strong association of both the DR4 haplotype as a whole and the strong association of its
component alleles (DRB1*04, DQB1*0301/4 and DQA1*03011/12) were detected within this
study and serve to reinforce smaller previous studies that identified the DR4 haplotype as a
causal factor in two Caucasian HT cohorts (Petrone et al. 2001, Farid and Thompson 1986).

Chapter 5 Discussion
114
Although previous studies have found association of the DR4 haplotype and alleles in both
Type 1 Diabetes (Cucca et al. 2001) and Rheumatoid arthritis (Gourraud et al. 2006) no
association has been observed in GD. The fact that the DR4 haplotype appears to be a
common susceptibility locus to autoimmune disease (AID) in general but not for the more
specific grouping of autoimmune thyroid disease may be explained by the different nature of
the diseases in question. Whilst HT and GD share a commonality, in that they affect the same
organ, they have very different effects on the thyroid, with cellular destruction a key feature
of HT but notably absent in GD. The differences between HT and GD are further highlighted
in this study by the lack of association of DR3, a strongly associated GD locus.
HT and Type 1 Diabetes are centred around the destruction of cells pertaining to a specific
organ. Rheumatoid arthritis similarly is centred around cellular destruction of specific tissue
types. It may be that the DR4 susceptibility locus plays a role in this specific aspect of AID by
affecting the normal patterns of telomeric shortening and as a result replicative senescence of
T-cells and granulocytes. A theory also supported by the work performed by Schonland et al
concerning the effects of DRB1*04 on telomeric shortening (Schonland et al. 2003).
As the HLA region contains immune system regulatory genes throughout the entire region it
is unsurprising that associations have been found in genes outside of HLA class II. This, in
combination with the strong LD exhibited in the HLA gene region meant it was also
important to assess whether any associations in the HLA class II region were independent of
possible associations in the HLA Class I region. Hence the secondary aim was to perform a
preliminary study into the associations present in the HLA Class I region with HT.

Chapter 5 Discussion
115
A small association was found for the rs2853975 SNP in the MICA gene with HT and no
other associations were detected. This finding is similar to that of the only other previous
study concerning association of MICA with HT where a small positive correlation was
observed for the A9 allele (Ide et al. 2007). This may be a true small, independent association
however no significant associations have as yet been found for either MICA or MICB with
any of the other AIDs. It is therefore prudent to consider the possibility that this result is
either a false positive or is a result of the strong LD seen in the HLA region. To fully
investigate the LD full linkage analysis needs to be performed between this area and the
associated alleles in the HLA class II region. It is also necessary to perform an in-depth
association study of the whole HLA Class I region and once again perform a linkage analysis
to determine if any associations are independent of the known HLA class II associations.
Phenotype correlations
5.2 Future Work
Whilst a strong association was found for the DR4 haplotype with the cohort in general it may
be that a specific feature such as age of onset of HT is influenced by this causal factor. It may
also be that the DR4 haplotype becomes a susceptibility factor of note when found in
conjunction with an environmental factor such as smoking. The cohort used for this study did
not provide sufficient phenotype data to perform an in depth phenotypical analysis of the
results with only TSHR serum antibody presence and presence of diffuse goitre correlations
analysed. Although my work has been performed on the largest HT dataset collected
worldwide, to date, it would be prudent to perform further work using a cohort with complete
data for age, sex, TPO and Tg serum antibody levels and smoking. If the size of the cohort

Chapter 5 Discussion
116
was also increased then it would also be possible to perform phenotype genotype correlations
using finer subdivisions of the phenotypes and environmental factors.
Whilst a significant difference in the genetic causal factors between those for GD and HT has
been found in this study HT remains part of the general group of AIDs. It is known that there
are several common susceptibility factors between the AIDs; hence it would also be beneficial
to investigate the incidence of other AIDs within the probands immediate family. With this
information the correlation of AID incidence and discovered HT genetic causal factors could
be investigated. This would help determine whether the presence of another AID was
enriching HT patients for AID susceptibility loci.
HLA Class I loci
Whilst a preliminary study into the association of HLA Class I encoded MICA and MICB loci
with HT was performed as part of this investigation, the full gene region was not explored.
The initial results suggest that due to lack of strong association in the MICA and MICB genes
the associations found in the HLA Class II region were independent and not reliant on the
associated loci being in LD with potential causal factors in the HLA Class I region. The genes
investigated, MICA and MICB were however non-classical HLA Class I genes and an
extensive investigation of both the classical HLA Class I genes and the remaining non-
classical HLA Class I genes is required to fully rule out LD as the cause of the reported HLA
class II associations. This is particularly important following the work performed by
Simmonds et al. which showed the association of HLA-C with GD to be stronger than the
effects of associated HLA class II (Simmonds et al. 2007).

Chapter 5 Discussion
117
To investigate classical HLA class I genes the photoyping method of allele specific PCR
could be used. This is the same method as described in chapter 3 for the investigation of HLA
class II associations. The alleles used would be those detailed in Bunce et al (Bunce et al.
1995). For non-classical HLA class I genes the Tag SNP method detailed in chapter 4 for the
investigation of the non-classical HLA class I genes MICA and MICB may be used.
Alternatively HLA SNP chip panels, such as those designed for the WTCCC non-
synonymous SNP screen (WTCCC 2007) or those commercially available from companies
such as illumina (illumine, N America), may be used to screen the entire HLA region.
Genome Wide Scans
Further investigation into the HLA region and other candidate genes such may only complete
part of the picture. As HT is a multigenic disease where the two, three or multi-hit mutational
hypothesis may apply, it is important to fully investigate all possible sources of genetic causal
variants. Previously genome-wide screens have been used to investigate entire genomes for
loci which show signs of association with disease. One method, based on short tandem repeats
which are composed of di-, tri- or tetra-nucleotide repeats known as microsatellites, has been
used to investigate GD, HT and common AITD loci (Tomer et al. 2003a, Tomer et al. 1999,
Tomer et al. 1998). The first of these studies produced two possible susceptibility loci for HT
(HT-1 (13q32) and HT-2 (12q22)), three for GD and one for AITD (Tomer et al. 1999). When
this genome screen was repeated with an expanded dataset the results changed dramatically.
One locus for HT (HT-1) and one for locus for GD were not replicated and three new
susceptibility loci were suggested, D7S502 (7q), D8S284 (8q) and D10S537 (10q) (Tomer et
al. 2003b). These inconsistencies highlight the danger of using genome-wide screens to assess
causal factors for complex diseases. In monogenic diseases this method can provide a definite

Chapter 5 Discussion
118
locus for further fine mapping however in complex diseases where the frequency of each
susceptibility loci may be low it is easy to gain false positives and miss legitimate association
loci.
Whilst the precise method may be flawed the idea of scanning the entire genome to hunt out
causal loci is sound and could produce susceptibility loci which would not have been
considered as candidate genes. A new technique, genome wide association studies, whereby
association analysis is performed across the entire genome may provide a means to rectify the
flaws of the genome-wide screen method (Duerr et al. 2006, Hampe et al. 2007, Sladek et al.
2007, Gaffney et al. 1998, Jorgenson and Witte 2006, Steer et al. 2007). This method allows
for association analysis to be performed on over 500,000 SNPs in large cohorts of around two
to three thousand samples. Although the HT cohort used in this thesis is one of the largest
used to date it is still small by comparison to those used in genome wide scans. To perform a
genome wide association analysis a much larger cohort, one of roughly 2,000 cases and 2,000
controls, similar to those used in other genome wide association analyses (WTCCC 2007),
would need to be collected first to ensure sufficient power for the study. In addition
independent similarly sized cohorts would need to be available to replicate and association
detected
Whilst it is not possible to perform a genome wide scan on an HT cohort at this time the
results from genome wide association analyses on other AIDs may provide useful candidate
genes which can be investigated as common AID susceptibility loci. In particular the
Wellcome Trust Case Control Consortium’s (WTCCC) [http://www.wtccc.org.uk] association

Chapter 5 Discussion
119
studies include one performed on a large GD cohort in which 14,436 non-synonymous coding
SNPs were typed in 1,000 cases and 1,500 controls (Burton et al. 2007). This may allow
identification of novel AITD susceptibility loci.
This study has shown a strong predisposing association of the DRB1*04, DQB1*0301/4 and
DQA1*03011/12 loci with HT. Furthermore, the DR4 haplotype (DRB1*04-DQB1*03-
DQA1*03) was shown to have a predisposing effect. Weaker predisposing effects and
protective effects were also observed in this area demonstrating the importance of the genetic
factors in the HLA class II region for HT. As only a small association was seen in the MICA
region and no associations were observed in the MICB region further work is required to
clarify the association in the HLA Class I region. Larger datasets are now required, combined
with more thorough screening of the entire HLA region in order to determine the exact
location and extent of susceptibility loci within this region.
5.3 Conclusions

Appendix
120
APPENDIX
6.1 Disclaimer
Collection of AITD samples
All UK AITD samples were collected by specialist doctors and nurses from clinics in
Birmingham, Bournemouth, Cambridge, Cardiff, Exeter, Leeds, Sheffield, and Newcastle.
DNA Extraction and quantification
All procedures of blood pelleting, DNA extraction and PicoGreen® were performed by Dr
Joanne king, Miss Helen Foxall, Ms Sarah Gibson, Dr Matt Simmonds, Mr Paul Newby and
myself.
6.2 Solutions
Reagent A: 2L distilled H2O
275g Sucrose
2.5ml1.0M Tris HCL pH8.0
2.55ml 4.9M MgCl
25ml TritonX
Reagent B: 200ml 1.0M Tris HCL pH .0
60ml 0.5M EDTA pH 8.0
15ml 5.0M NaCl
205ml distilled H2O
20ml 25% SDS.

Appendix
121
5M Sodium Percholate: 200ml distilled H2O
140.46g NaCl O4
T.E. Buffer: 1.0 ltr distilled H2O
186.1g EDTA
10g NaOH
Loading Buffer: 0.25g bromophenol blue
40 sucrose
Made up to 100mls with distilled water
TDMH: 169μl 10 x buffer
12μl dNTPs (200 μM)
135μl 25mM MgCl2
334μl distilled water
6.3 Calculations
Chi-squared
χ2 = (ad-bc)2 x (a+b+c+d)/(a+d)(b+c)(a+b)(c+d)
Fishers Exact Probability Test
P= (a+b)!(c+d)!(a+c)!(b+d)!/a!b!c!d!(a+b+c+d)!
Woolf’s method of OR calculation
OR=(a+0.5)(d+0.5)/(b+0.5)(c+0.5)
95% Confidence intervals
95% CI = (lnOR±1.96√(1/a + 1/b + 1/c + 1/d))

6.4 HLA class II primers used to type the DRB1, DQA1 and DRB1 regions Primers used to type DRB1 region
DRB1 Allele(s) Amplified Forward Primer(s) Reverse Primer(s) DRB1*0101/2/4 CCGCCTCTGCTCCAGGAG TTGTGGCGCTTAAGTTTGAAT DRB1*0103 CCCGCTCGTCTTCCAGGAT TTGTGGCGCTTAAGTTTGAAT DRB1*1501-5 CCACCGCGGCCCGCGC TCCTGTGGCAGCCTAAGAG DRB1*1601-6 CTCCGTCACCGCCCGGT TCCTGTGGCAGCCTAAGAG DRB1*03011/012/2/3/4/5, 1107 GTCCACCCGGCCCCGCT GTTTCTTGGGTACTCTACGTC DRB1*0301/4 CTGCACTGTGAAGCTCTCCA GACGGAGCGGGTGCGGTA DRB1*0302/5, 1302/5, 1109/20, 1402/3/9/13/19 CTGCACTGTGAAGCTCTCAC TACTTCCATAACCAGGAGGAGA DRB1*0401-22, 1410, 1122 CTGCACTGTGAAGCTCTCAC GTTTCTTGGAGCAGGTTAAACA
CTGCACTGTGAAGCTCTCCA
DRB1*0701 CCCGTAGTTGTGTCTGCACAC CCTGTGGCAGGGTAAGTATA DRB1*0801-11, 1415 CTGCAGTAGGTGTCCACCAG AGTACTCTACGGGTGGTGTT
TGTTCCAGTACTCGGCGCT
DRB1*0901 CCCGTAGTTGTGTCTGCACAC GTTTCTTGAGCAGGATAAGTTT DRB1*1001 CTGCACTGTGAAGCTCTCAC CGGTTGCTGGAAAGACGCG DRB1*1101-21, 1411 CTGGCTGTTCCAGTACTCCT GTTTCTTGGGTACTCTACGTC
TTCTTGGAGTACTCTACGGG
DRB1*1201/2/3 CTGTTCCAGGACTCGGCGA AGTACTCTACGGGTGGTGTT DRB1*1301/2/4/8/15-17/19/20/22, 1416, 1102/3/11/14/16/20/21
TCCACCGCGGCCCGCTC GTTTCTTGGGTACTCTACGTC
TTCTTGGAGTACTCTACGGG
DRB1*1301/2/8/9/16/20, 1116/20, 1416 TCCACCGCGGCCCGCTC GTTCCTGGACAGATACTTCC
CCACCGCGGCCCGCGC

DRB1 Allele(s) Amplified Forward Primer(s) Reverse Primer(s) DRB1*1301/2/(6)/10/15/16, 1116/20, 1419/21
CCCGCTCGTCTTCCAGGAT TACTTCCATAACCAGGAGGAGA TCCACCGCGGCCCGCTT
DRB1*1305/6/10, 1109, 1419/21 ACCGCGGCCCGCCTGTC TACTTCCATAACCAGGAGGAGA
TCCACCGCGGCCCGCTT
DRB1*1303/10, 1419/21 TCCACCGCGGCCCGCTT GTTTCTTGGGTACTCTACGTC DRB1*1303/4/12/21, 1413 TGTTCCAGTACTCGGCGCT GTTTCTTGGGTACTCTACGTC DRB1*1305/7/11/14/18/21, 1101/4/6/9/10/(11)/12/15 CCCGCCTGTCTTCCAGGAA GTTTCTTGGGTACTCTACGTC DRB1*1301/2/5-9/10/11/14-16/18/19/20/22, 1402/3/6/9/12/14/17/19-21, 0301-5 CTGTTCCAGTACTCGGCATC GTTTCTTGGGTACTCTACGTC DRB1*1401/3-5/7/8/10-12/14/15/18, 1318, 0809, 1117
TCTGCAATAGGTGTCCACCT GTTCCTGGACAGATACTTCC CTGCAGTAGGTGTCCACCAG GTTCCTGGAGAGATACTTCC
DRB1*1401/7/16 CTGTTCCAGTGCTCCGCAG GTTTCTTGGGTACTCTACGTC DRB1*1402-3/6/9/12/13/17, (1418/19/21), (0301/2/3/5), 1318 CTGCAGTAGGTGTCCACCAG TACTTCCATAACCAGGAGGAGA
CCGCCTCTGCTCCAGGAG

Primers to type DRB3, DRB4 and DRB5 regions
DRB Allele(s) Amplified Forward Primer(s) Reverse Primer(s) DRB5*0101/2, 0201/2/3 GCTGTTCCAGTACTCGCG GTTTCTTGCAGCAGGATAAGTA DRB3*0101 CTGCAGTAATTGTCCACCCG TTTCTTGGAGCTGCGTAAGTC DRB3*0201/2/3 CCCGCGGTACGCCACCTC GGAGTACCGGGCGGTGAG DRB3*0201, 0301 CTGCACTGTGAAGCTCTCCA GTTTCTTGGAGCTGCTTAAGTC DRB4*0101101, 0102/3 CTGGTACTCCCCCAGGTCA GATCGTTCGTGTCCCCACAG DRB4*0101102N TCCCCCAGGTCACTGTTGT GATCGTTCGTGTCCCCACAA
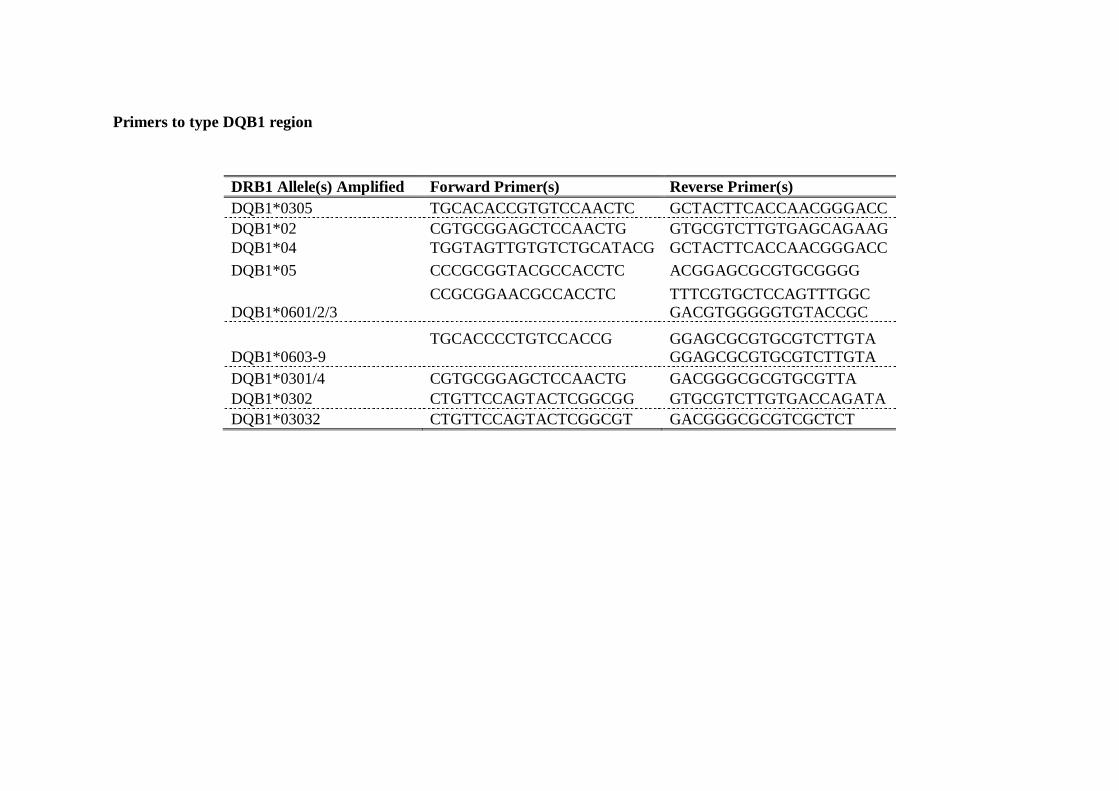
Primers to type DQB1 region
DRB1 Allele(s) Amplified Forward Primer(s) Reverse Primer(s) DQB1*0305 TGCACACCGTGTCCAACTC GCTACTTCACCAACGGGACC DQB1*02 CGTGCGGAGCTCCAACTG GTGCGTCTTGTGAGCAGAAG DQB1*04 TGGTAGTTGTGTCTGCATACG GCTACTTCACCAACGGGACC DQB1*05 CCCGCGGTACGCCACCTC ACGGAGCGCGTGCGGGG DQB1*0601/2/3
CCGCGGAACGCCACCTC TTTCGTGCTCCAGTTTGGC
GACGTGGGGGTGTACCGC
DQB1*0603-9
TGCACCCCTGTCCACCG GGAGCGCGTGCGTCTTGTA
GGAGCGCGTGCGTCTTGTA
DQB1*0301/4 CGTGCGGAGCTCCAACTG GACGGGCGCGTGCGTTA DQB1*0302 CTGTTCCAGTACTCGGCGG GTGCGTCTTGTGACCAGATA DQB1*03032 CTGTTCCAGTACTCGGCGT GACGGGCGCGTCGCTCT
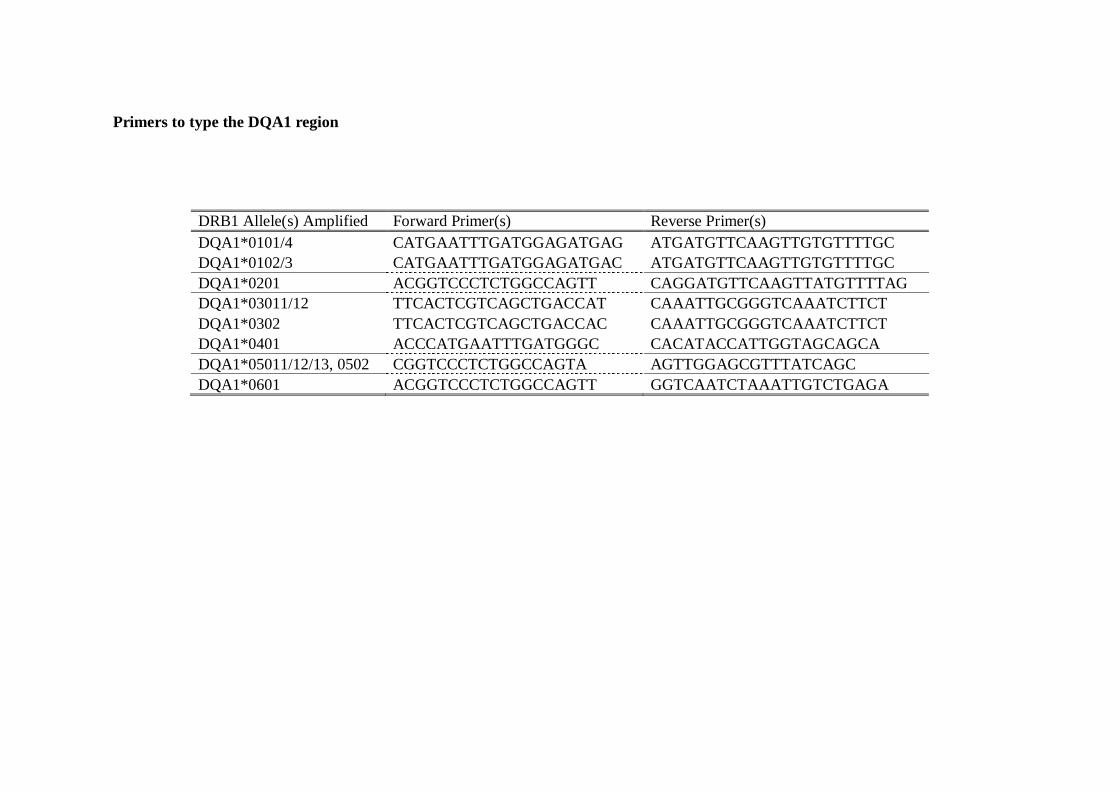
Primers to type the DQA1 region
DRB1 Allele(s) Amplified Forward Primer(s) Reverse Primer(s) DQA1*0101/4 CATGAATTTGATGGAGATGAG ATGATGTTCAAGTTGTGTTTTGC DQA1*0102/3 CATGAATTTGATGGAGATGAC ATGATGTTCAAGTTGTGTTTTGC DQA1*0201 ACGGTCCCTCTGGCCAGTT CAGGATGTTCAAGTTATGTTTTAG DQA1*03011/12 TTCACTCGTCAGCTGACCAT CAAATTGCGGGTCAAATCTTCT DQA1*0302 TTCACTCGTCAGCTGACCAC CAAATTGCGGGTCAAATCTTCT DQA1*0401 ACCCATGAATTTGATGGGC CACATACCATTGGTAGCAGCA DQA1*05011/12/13, 0502 CGGTCCCTCTGGCCAGTA AGTTGGAGCGTTTATCAGC DQA1*0601 ACGGTCCCTCTGGCCAGTT GGTCAATCTAAATTGTCTGAGA

6.5 SNPs used to genotype the MICA and MICB gene regions SNPS used to gentotype the MICA gene
SNP Sequence rs1131896 AGGAACTACGGCGATATCTAGAATCC[A/G]GCGTAGTCCTGAGGAGAACAGGTAC rs1131904 CTGCAAAATGTTAGTAGATATGAGGC[A/G]TTTGCAGCTGTGCCATATTAATTGG rs2256175 CTGCCCACTCCTCACCTGCAGCAGGA[A/G]GATGCCACAGCTGGGCGTTTGACCC rs2523497 AAAAGGTAGAAGTAACCCAAGTGTCC[A/G]TTGTCTGAGGGATGGATAACCAAGA rs2844514 ATTCCCCAACTTTCATCCCCTGTTAT[A/G]GAAGCCTTGTCACCAACATGCCTAT rs2844518 GGGGCCACCATGAGGCAGGGTCCAGA[A/G]CAGGCATCTGCACTGGAGGGGAGGG rs2844519 AAAGGGAAGATGCCAGCCAGAAGCAG[A/G]AAGACCGGGCCCAGCCCCATGGCCC rs2853975 TTGTGTTTATTCCCTGGGGACTTTTC[A/T]CTCTTCAGTTGCTCCAAAACCAGAT rs2853977 ACACTGGATGGTCCAGTCCCTGACCC[A/T]CTGTCTTTATCCAGTGGCTCTAACA rs6934187 GGCCTCCCTGAGTTTCTTGCAGATGA[C/G]ATGGATGAGTAGATAAGCAGATGTC

SNPs used to genotype the MICB gene
SNP Sequence rs2855812 CTGAAAAGATGGACTTACTCTTTGA[G/T]ACCCTGTCACCTGCCCACCCCAGTG rs3130615 AAGACGTAGGTGACAAGGCTGCTGG[A/G]ACAGGGGATGGAAGCTGGGGTATTT rs3131638 ATAAGGGGTTCCTGCCTCTGTGTTTT[G/T]TTTTTCCTCTATTAGATTATCTGGC rs7383312 CGTGTATGTGGAGTACTATTCAGCCA[C/T]CATGTCATTTGCAAAGAACTGGAGG rs9267390 GAGTGCTGGAGCATATGACAGCTCT[A/G]TTATATTTTTAGTTTTTGGAAGAAC

Publications
129
PUBLICATIONS
Zeitlin A A, Heward J M, Newby P R, Carr-Smith J D, Franklyn J A, Gough S C &
Simmonds M J (2008) Analysis of HLA class II genes in Hashimoto's thyroiditis reveals
differences compared to Graves' disease. Genes and Immunity, 9, 358-63.
Zeitlin A A, Simmonds M J & Gough S C (2008) Genetic developments in autoimmune
thyroid disease: an evolutionary process. Clinical Endocrinology (Oxf), 68, 671-82.

References
130
Abbas A K, Lohr J, Knoechel B & Nagabhushanam V (2004) T cell tolerance and autoimmunity. Autoimmunity Review, 3, 471-5.
Adams D D & H.D. P (1956) Abnormal responses in the assay of thyrotroptins. Proc Univ Otago Sch Med, 34, 11-12.
Alberts B (2002) Molecular biology of the cell, New York, Garland Science. Allen E M, Appel M C & Braverman L E (1986) The effect of iodide ingestion on the
development of spontaneous lymphocytic thyroiditis in the diabetes-prone BB/W rat. Endocrinology, 118, 1977-81.
Amroun H, Djoudi H, Busson M, Allat R, El Sherbini S M, Sloma I, Ramasawmy R, Brun M, Dulphy N, Krishnamoorthy R, Toubert A, Charron D, Abbadi M C & Tamouza R (2005) Early-onset ankylosing spondylitis is associated with a functional MICA polymorphism. Hum Immunol, 66, 1057-61.
Andrew L (2004) Neurological Contributions of Caleb Hilier Parry. Advances in Clinical Neuroscience and Rehabilitation, 4, 38-39.
Ardlie K G, Kruglyak L & Seielstad M (2002) Patterns of linkage disequilibrium in the human genome. Nat Rev Genet, 3, 299-309.
Ausubel F M (2001) Current protocols in molecular biology: Supplement 56, [New York] : Greene, 1987-.
Ausubel F M, Brent R, Kingston R E, Moore D D, Seigman J G, Smith J A & Struhl K (Eds.) (2003) Current Protocols in Molecular Biology, Wiley.
Badenhoop K, Schwarz G, Schleusener H, Weetman A P, Recks S, Peters H, Bottazzo G F & Usadel K H (1992) Tumor necrosis factor beta gene polymorphisms in Graves' disease. J Clin Endocrinol Metab, 74, 287-91.
Badenhoop K, Schwarz G, Walfish P G, Drummond V, Usadel K H & Bottazzo G F (1990) Susceptibility to thyroid autoimmune disease: molecular analysis of HLA-D region genes identifies new markers for goitrous Hashimoto's thyroiditis. J Clin Endocrinol Metab, 71, 1131-7.
Bahram S, Bresnahan M, Geraghty D E & Spies T (1994) A second lineage of mammalian major histocompatibility complex class I genes. Proc Natl Acad Sci U S A, 91, 6259-63.
Ban Y, Ban Y, Taniyama M & Katagiri T (2000a) Vitamin D receptor initiation codon polymorphism in Japanese patients with Graves' disease. Thyroid, 10, 475-80.
Ban Y, Davies T F, Greenberg D A, Concepcion E S, Osman R, Oashi T & Tomer Y (2004) Arginine at position 74 of the HLA-DR beta1 chain is associated with Graves' disease. Genes Immun, 5, 203-8.
Ban Y, Greenberg D A, Concepcion E, Skrabanek L, Villanueva R & Tomer Y (2003) Amino acid substitutions in the thyroglobulin gene are associated with susceptibility to human and murine autoimmune thyroid disease. Proc Natl Acad Sci U S A, 100, 15119-24.
Ban Y, Taniyama M & Ban Y (2000b) Vitamin D receptor gene polymorphism is associated with Graves' disease in the Japanese population. Journal of Clinical Endocrinology and Metabolism, 85, 4639-43.
Ban Y, Tozaki T, Taniyama M, Tomita M & Ban Y (2006) Association of a C/T single-nucleotide polymorphism in the 5' untranslated region of the CD40 gene with Graves' disease in Japanese. Thyroid, 16, 443-6.
Ban Y, Tozaki T, Tobe T, Ban Y, Jacobson E M, Concepcion E S & Tomer Y (2007) The regulatory T cell gene FOXP3 and genetic susceptibility to thyroid autoimmunity: An association analysis in Caucasian and Japanese cohorts. J Autoimmun, 28, 201-7.

References
131
Barbesino G, Tomer Y, Concepcion E S, Davies T F & Greenberg D A (1998) Linkage analysis of candidate genes in autoimmune thyroid disease. II. Selected gender-related genes and the X-chromosome. International Consortium for the Genetics of Autoimmune Thyroid Disease. Journal of Clinical Endocrinology and Metabolism, 83, 3290-5.
Barcikowski R S (1981) Statistical power with group mean as the unit of analysis. Journal of Educational Statistics, 6, 267-285.
Bassuny W M, Ihara K, Sasaki Y, Kuromaru R, Kohno H, Matsuura N & Hara T (2003) A functional polymorphism in the promoter/enhancer region of the FOXP3/Scurfin gene associated with type 1 diabetes. Immunogenetics, 55, 149-56.
Bauer S, Groh V, Wu J, Steinle A, Phillips J H, Lanier L L & Spies T (1999) Activation of NK cells and T cells by NKG2D, a receptor for stress-inducible MICA. Science, 285, 727-9.
Bednarczuk T, Placha G, Jazdzewski K, Kurylowicz A, Kloza M, Makowska U, Hiromatsu Y & Nauman J (2003) Interleukin-13 gene polymorphisms in patients with Graves' disease. Clin Endocrinol (Oxf), 59, 519-25.
Begovich A B, Carlton V E, Honigberg L A, Schrodi S J, Chokkalingam A P, Alexander H C, Ardlie K G, Huang Q, Smith A M, Spoerke J M, Conn M T, Chang M, Chang S Y, Saiki R K, Catanese J J, Leong D U, Garcia V E, McAllister L B, Jeffery D A, Lee A T, Batliwalla F, Remmers E, Criswell L A, Seldin M F, Kastner D L, Amos C I, Sninsky J J & Gregersen P K (2004) A missense single-nucleotide polymorphism in a gene encoding a protein tyrosine phosphatase (PTPN22) is associated with rheumatoid arthritis. Am J Hum Genet, 75, 330-7.
Belin R M, Astor B C, Powe N R & Ladenson P W (2004) Smoke exposure is associated with a lower prevalence of serum thyroid autoantibodies and thyrotropin concentration elevation and a higher prevalence of mild thyrotropin concentration suppression in the third National Health and Nutrition Examination Survey (NHANES III). J Clin Endocrinol Metab, 89, 6077-86.
Bennett C L, Christie J, Ramsdell F, Brunkow M E, Ferguson P J, Whitesell L, Kelly T E, Saulsbury F T, Chance P F & Ochs H D (2001) The immune dysregulation, polyendocrinopathy, enteropathy, X-linked syndrome (IPEX) is caused by mutations of FOXP3. Nat Genet, 27, 20-1.
Blakemore A I, Watson P F, Weetman A P & Duff G W (1995) Association of Graves' disease with an allele of the interleukin-1 receptor antagonist gene. J Clin Endocrinol Metab, 80, 111-5.
Blanchin S, Estienne V, Durand-Gorde J M, Carayon P & Ruf J (2003) Complement activation by direct C4 binding to thyroperoxidase in Hashimoto's thyroiditis. Endocrinology, 144, 5422-9.
BMJ (2006) Statistics at Square One. IN JOURNAL, B. M. (Ed.) Statements of probability and confidence intervals. BMJ Publishing Group Ltd.
Boehm B O, Kuhnl P, Manfras B J, Chen M, Lee J C, Holzberger G, Seidl S, Schifferdecker E, Schumm-Draeger P M & Usadel K H (1992) HLA-DRB3 gene alleles in Caucasian patients with Graves' disease. Clin Investig, 70, 956-60.
Bottini N, Musumeci L, Alonso A, Rahmouni S, Nika K, Rostamkhani M, MacMurray J, Meloni G F, Lucarelli P, Pellecchia M, Eisenbarth G S, Comings D & Mustelin T (2004) A functional variant of lymphoid tyrosine phosphatase is associated with type I diabetes. Nat Genet, 36, 337-8.

References
132
Brand O, Gough S & Heward J (2005) HLA, CTLA-4 and PTPN22: the shared genetic master-key to autoimmunity? Expert Reviews in Molecular Medicine. Cambridge University Press.
Brand O J, Barrett J C, Simmonds M J, Newby P R, McCabe C J, Bruce C K, Kysela B, Carr-Smith J D, Brix T, Hunt P J, Wiersinga W M, Hegedus L, Connell J, Wass J A, Franklyn J A, Weetman A P, Heward J M & Gough S C (2009) Association of the thyroid stimulating hormone receptor gene (TSHR) with Graves' disease. Hum Mol Genet, 18, 1704-13.
Brand O J, Lowe C E, Heward J M, Franklyn J A, Cooper J D, Todd J A & Gough S C (2007) Association of the interleukin-2 receptor alpha (IL-2Ralpha)/CD25 gene region with Graves' disease using a multilocus test and tag SNPs. Clin Endocrinol (Oxf), 66, 508-12.
Braun J, Donner H, Siegmund T, Walfish P G, Usadel K H & Badenhoop K (1998) CTLA-4 promoter variants in patients with Graves' disease and Hashimoto's thyroiditis. Tissue Antigens, 51, 563-6.
Brickman C M & Shoenfeld Y (2001) The mosaic of autoimmunity. Scand J Clin Lab Invest Suppl, 235, 3-15.
Brix T H, Christensen K, Holm N V, Harvald B & Hegedus L (1998) A population-based study of Graves' disease in Danish twins. Clin Endocrinol (Oxf), 48, 397-400.
Brix T H, Knudsen G P, Kristiansen M, Kyvik K O, Orstavik K H & Hegedus L (2005) High frequency of skewed X-chromosome inactivation in females with autoimmune thyroid disease: a possible explanation for the female predisposition to thyroid autoimmunity. J Clin Endocrinol Metab, 90, 5949-53.
Brix T H, Kyvik K O, Christensen K & Hegedus L (2001) Evidence for a major role of heredity in Graves' disease: a population-based study of two Danish twin cohorts. J Clin Endocrinol Metab, 86, 930-4.
Brix T H, Kyvik K O & Hegedus L (2000) A population-based study of chronic autoimmune hypothyroidism in Danish twins. J Clin Endocrinol Metab, 85, 536-9.
Brusko T M, Putnam A L & Bluestone J A (2008) Human regulatory T cells: role in autoimmune disease and therapeutic opportunities. Immunol Rev, 223, 371-90.
Bunce M, O'Neill C M, Barnardo M C, Krausa P, Browning M J, Morris P J & Welsh K I (1995) Phototyping: comprehensive DNA typing for HLA-A, B, C, DRB1, DRB3, DRB4, DRB5 & DQB1 by PCR with 144 primer mixes utilizing sequence-specific primers (PCR-SSP). Tissue Antigens, 46, 355-67.
Burton P R, Clayton D G, Cardon L R, Craddock N, Deloukas P, Duncanson A, Kwiatkowski D P, McCarthy M I, Ouwehand W H, Samani N J, Todd J A, Donnelly P, Barrett J C, Davison D, Easton D, Evans D M, Leung H T, Marchini J L, Morris A P, Spencer C C, Tobin M D, Attwood A P, Boorman J P, Cant B, Everson U, Hussey J M, Jolley J D, Knight A S, Koch K, Meech E, Nutland S, Prowse C V, Stevens H E, Taylor N C, Walters G R, Walker N M, Watkins N A, Winzer T, Jones R W, McArdle W L, Ring S M, Strachan D P, Pembrey M, Breen G, St Clair D, Caesar S, Gordon-Smith K, Jones L, Fraser C, Green E K, Grozeva D, Hamshere M L, Holmans P A, Jones I R, Kirov G, Moskivina V, Nikolov I, O'Donovan M C, Owen M J, Collier D A, Elkin A, Farmer A, Williamson R, McGuffin P, Young A H, Ferrier I N, Ball S G, Balmforth A J, Barrett J H, Bishop T D, Iles M M, Maqbool A, Yuldasheva N, Hall A S, Braund P S, Dixon R J, Mangino M, Stevens S, Thompson J R, Bredin F, Tremelling M, Parkes M, Drummond H, Lees C W, Nimmo E R, Satsangi J, Fisher S A, Forbes A, Lewis C M, Onnie C M, Prescott N J, Sanderson J, Matthew C G, Barbour J, Mohiuddin M K,

References
133
Todhunter C E, Mansfield J C, Ahmad T, Cummings F R, Jewell D P, Webster J, Brown M J, Lathrop M G, Connell J, Dominiczak A, Marcano C A, Burke B, Dobson R, Gungadoo J, Lee K L, Munroe P B, Newhouse S J, Onipinla A, Wallace C, Xue M, Caulfield M, Farrall M, Barton A, Bruce I N, Donovan H, Eyre S, Gilbert P D, Hilder S L, Hinks A M, John S L, Potter C, Silman A J, Symmons D P, Thomson W, Worthington J, Dunger D B, Widmer B, Frayling T M, Freathy R M, Lango H, Perry J R, Shields B M, Weedon M N, Hattersley A T, Hitman G A, Walker M, Elliott K S, Groves C J, Lindgren C M, Rayner N W, Timpson N J, Zeggini E, Newport M, Sirugo G, Lyons E, Vannberg F, Hill A V, Bradbury L A, Farrar C, Pointon J J, Wordsworth P, Brown M A, Franklyn J A, Heward J M, Simmonds M J, Gough S C, Seal S, Stratton M R, Rahman N, Ban M, Goris A, Sawcer S J, Compston A, Conway D, Jallow M, Rockett K A, Bumpstead S J, Chaney A, Downes K, Ghori M J, Gwilliam R, Hunt S E, Inouye M, Keniry A, King E, McGinnis R, Potter S, Ravindrarajah R, Whittaker P, Widden C, Withers D, Cardin N J, Ferreira T, Pereira-Gale J, Hallgrimsdo'ttir I B, Howie B N, Su Z, Teo Y Y, Vukcevic D, Bentley D, Mitchell S L, Newby P R, Brand O J, Carr-Smith J, Pearce S H, Reveille J D, Zhou X, Sims A M, Dowling A, Taylor J, Doan T, Davis J C, Savage L, Ward M M, Learch T L, Weisman M H & Brown M (2007) Association scan of 14,500 nonsynonymous SNPs in four diseases identifies autoimmunity variants. Nat Genet, 39, 1329-37.
Carlton V E, Hu X, Chokkalingam A P, Schrodi S J, Brandon R, Alexander H C, Chang M, Catanese J J, Leong D U, Ardlie K G, Kastner D L, Seldin M F, Criswell L A, Gregersen P K, Beasley E, Thomson G, Amos C I & Begovich A B (2005) PTPN22 genetic variation: evidence for multiple variants associated with rheumatoid arthritis. Am J Hum Genet, 77, 567-81.
Chapman J M, Cooper J D, Todd J A & Clayton D G (2003) Detecting disease associations due to linkage disequilibrium using haplotype tags: a class of tests and the determinants of statistical power. Hum Hered, 56, 18-31.
Chen Q Y, Huang W, She J X, Baxter F, Volpe R & Maclaren N K (1999) HLA-DRB1*08, DRB1*03/DRB3*0101, and DRB3*0202 are susceptibility genes for Graves' disease in North American Caucasians, whereas DRB1*07 is protective. J Clin Endocrinol Metab, 84, 3182-6.
Chen Q Y, Nadell D, Zhang X Y, Kukreja A, Huang Y J, Wise J, Svec F, Richards R, Friday K E, Vargas A, Gomez R, Chalew S, Lan M S, Tomer Y & Maclaren N K (2000) The human leukocyte antigen HLA DRB3*020/DQA1*0501 haplotype is associated with Graves' disease in African Americans. J Clin Endocrinol Metab, 85, 1545-9.
Chen R H, Chang C T, Chen W C, Tsai C H & Tsai F J (2006) Proinflammatory cytokine gene polymorphisms among Hashimoto's thyroiditis patients. J Clin Lab Anal, 20, 260-5.
Chistiakov D A (2003) Thyroid-stimulating hormone receptor and its role in Graves' disease. Mol Genet Metab, 80, 377-88.
Chistiakov D A (2005) Immunogenetics of Hashimoto's thyroiditis. J Autoimmune Dis, 2, 1. CLS (2005) The Centre for Longitudinal Studies Collins J E, Heward J M, Carr-Smith J, Daykin J, Franklyn J A & Gough S C (2003)
Association of a rare thyroglobulin gene microsatellite variant with autoimmune thyroid disease. J Clin Endocrinol Metab, 88, 5039-42.
Collins J E, Heward J M, Howson J M, Foxall H, Carr-Smith J, Franklyn J A & Gough S C (2004a) Common allelic variants of exons 10, 12, and 33 of the thyroglobulin gene are

References
134
not associated with autoimmune thyroid disease in the United Kingdom. J Clin Endocrinol Metab, 89, 6336-9.
Collins J E, Heward J M, Nithiyananthan R, Nejentsev S, Todd J A, Franklyn J A & Gough S C (2004b) Lack of association of the vitamin D receptor gene with Graves' disease in UK Caucasians. Clinical Endocrinology 60, 618-24.
Cooper D S (2003) Hyperthyroidism. Lancet, 362, 459-68. Corapcioglu D, Tonyukuk V, Kiyan M, Yilmaz A E, Emral R, Kamel N & Erdogan G (2002)
Relationship between thyroid autoimmunity and Yersinia enterocolitica antibodies. Thyroid, 12, 613-7.
Criswell L A, Pfeiffer K A, Lum R F, Gonzales B, Novitzke J, Kern M, Moser K L, Begovich A B, Carlton V E, Li W, Lee A T, Ortmann W, Behrens T W & Gregersen P K (2005) Analysis of families in the multiple autoimmune disease genetics consortium (MADGC) collection: the PTPN22 620W allele associates with multiple autoimmune phenotypes. Am J Hum Genet, 76, 561-71.
Cucca F, Lampis R, Congia M, Angius E, Nutland S, Bain S C, Barnett A H & Todd J A (2001) A correlation between the relative predisposition of MHC class II alleles to type 1 diabetes and the structure of their proteins. Hum Mol Genet, 10, 2025-37.
Cuddihy R M & Bahn R S (1996) Lack of an independent association between the human leukocyte antigen allele DQA1*0501 and Graves' disease. J Clin Endocrinol Metab, 81, 847-9.
Cuddihy R M, Dutton C M & Bahn R S (1995) A polymorphism in the extracellular domain of the thyrotropin receptor is highly associated with autoimmune thyroid disease in females. Thyroid, 5, 89-95.
Curotto de Lafaille M A & Lafaille J J (2002) CD4(+) regulatory T cells in autoimmunity and allergy. Curr Opin Immunol, 14, 771-8.
Dahlberg P A, Holmlund G, Karlsson F A & Safwenberg J (1981) HLA-A, -B, -C and -DR antigens in patients with Graves' disease and their correlation with signs and clinical course. Acta Endocrinol (Copenh), 97, 42-7.
Dahlman I, Eaves I A, Kosoy R, Morrison V A, Heward J, Gough S C, Allahabadia A, Franklyn J A, Tuomilehto J, Tuomilehto-Wolf E, Cucca F, Guja C, Ionescu-Tirgoviste C, Stevens H, Carr P, Nutland S, McKinney P, Shield J P, Wang W, Cordell H J, Walker N, Todd J A & Concannon P (2002) Parameters for reliable results in genetic association studies in common disease. Nat Genet, 30, 149-50.
Davies J L, Kawaguchi Y, Bennett S T, Copeman J B, Cordell H J, Pritchard L E, Reed P W, Gough S C L, Jenkins S C, Palmer S M, Balfour K M, Rowe B R, Farrall M, Barnett A H, Bain S C & Todd J A (1994) A genome-wide search for human type 1 diabetes susceptibility genes. Nature, 371, 130-136.
Dechairo B M, Zabaneh D, Collins J, Brand O, Dawson G J, Green A P, Mackay I, Franklyn J A, Connell J M, Wass J A, Wiersinga W M, Hegedus L, Brix T, Robinson B G, Hunt P J, Weetman A P, Carey A H & Gough S C (2005) Association of the TSHR gene with Graves' disease: the first disease specific locus. Eur J Hum Genet, 13, 1223-30.
Dejaco C, Duftner C, Grubeck-Loebenstein B & Schirmer M (2006) Imbalance of regulatory T cells in human autoimmune diseases. Immunology, 117, 289-300.
Demaine A G, Ratanachaiyavong S, Pope R, Ewins D, Millward B A & McGregor A M (1989) Thyroglobulin antibodies in Graves' disease are associated with T-cell receptor beta chain and major histocompatibility complex loci. Clin Exp Immunol, 77, 21-4.

References
135
Deme D, Pommier J & Nunez J (1976) Kinetics of thyroglobulin iodination and of hormone synthesis catalysed by thyroid peroxidase. Role of iodide in the coupling reaction. Eur J Biochem, 70, 435-40.
Deneareaz N & Lemarchand-Beraud T (1995) Severe but not mild alterations of thyroid function modulate the density of thyroid-stimulating hormone receptors in the rat thyroid gland. Endocrinology, 136, 1694-700.
Donner H, Braun J, Seidl C, Rau H, Finke R, Ventz M, Walfish P G, Usadel K H & Badenhoop K (1997) Codon 17 polymorphism of the cytotoxic T lymphocyte antigen 4 gene in Hashimoto's thyroiditis and Addison's disease. J Clin Endocrinol Metab, 82, 4130-2.
Duerr R H, Taylor K D, Brant S R, Rioux J D, Silverberg M S, Daly M J, Steinhart A H, Abraham C, Regueiro M, Griffiths A, Dassopoulos T, Bitton A, Yang H, Targan S, Datta L W, Kistner E O, Schumm L P, Lee A T, Gregersen P K, Barmada M M, Rotter J I, Nicolae D L & Cho J H (2006) A genome-wide association study identifies IL23R as an inflammatory bowel disease gene. Science, 314, 1461-3.
Duntas L H (2008) Environmental factors and autoimmune thyroiditis. Nat Clin Pract Endocrinol Metab, 4, 454-60.
Evans A W, Woodrow J C, McDougall C D, Chew A R & Evans R W (1967) Antibodies in the families of thyrotoxic patients. Lancet, 1, 637-41.
Evans M B (2002) Graves' Disease. Grand Rounds Archive. Farid N R (1981) Graves' Disease. IN FARID, N. R. (Ed.) HLA in Endocrine and Metabolic
Disorders. New York, Academic Press. Farid N R (1992) Understanding the genetics of autoimmune thyroid disease--still an illusive
goal! J Clin Endocrinol Metab, 74, 495A-495B. Farid N R, Barnard J M & Marshall W H (1976) The association of HLA with autoimmune
thyroid disease in Newfoundland. The influence of HLA homozygosity in Graves' disease. Tissue Antigens, 8, 181-9.
Farid N R, Sampson L, Moens H & Barnard J M (1981) The association of goitrous autoimmune thyroiditis with HLA-DR5. Tissue Antigens, 17, 265-8.
Farid N R, Stone E & Johnson G (1980) Graves' disease and HLA: clinical and epidemiologic associations. Clin Endocrinol (Oxf), 13, 535-44.
Farid N R & Thompson C (1986) HLA and autoimmune endocrine disease 1985. Mol Biol Med, 3, 85-97.
Follis R H, Jr. (1964) Further Observations on Thyroiditis and Colloid Accumulation in Hyperplastic Thyroid Glands of Hamsters Receiving Excess Iodine. Lab Invest, 13, 1590-9.
Frigoul A & Lefranc M-P (2005) MICA: Standardized IMGT allele nomenclature, polymorphisms and diseases. Recent Res. Devel. Human Genet., 95-145. Fuchs J J & Podda M (2005) Encyclopedia of medical genomics and proteomics, New York,
Marcel Dekker. Fukata S, Kuma K & Sugawara M (1996) Relationship between cigarette smoking and
hypothyroidism in patients with Hashimoto's thyroiditis. J Endocrinol Invest, 19, 607-12.
Fukayama H, Nasu M, Murakami S & Sugawara M (1992) Examination of antithyroid effects of smoking products in cultured thyroid follicles: only thiocyanate is a potent antithyroid agent. Acta Endocrinol (Copenh), 127, 520-5.

References
136
Furugaki K, Shirasawa S, Ishikawa N, Ito K, Ito K, Kubota S, Kuma K, Tamai H, Akamizu T, Hiratani H, Tanaka M & Sasazuki T (2004) Association of the T-cell regulatory gene CTLA4 with Graves' disease and autoimmune thyroid disease in the Japanese. J Hum Genet, 49, 166-8.
Gabriel S B, Schaffner S F, Nguyen H, Moore J M, Roy J, Blumenstiel B, Higgins J, DeFelice M, Lochner A, Faggart M, Liu-Cordero S N, Rotimi C, Adeyemo A, Cooper R, Ward R, Lander E S, Daly M J & Altshuler D (2002) The structure of haplotype blocks in the human genome. Science, 296, 2225-9.
Gaffney P M, Kearns G M, Shark K B, Ortmann W A, Selby S A, Malmgren M L, Rohlf K E, Ockenden T C, Messner R P, King R A, Rich S S & Behrens T W (1998) A genome-wide search for susceptibility genes in human systemic lupus erythematosus sib-pair families. Proc Natl Acad Sci U S A, 95, 14875-9.
Gambelunghe G, Ghaderi M, Cosentino A, Falorni A, Brunetti P & Sanjeevi C B (2000) Association of MHC Class I chain-related A (MIC-A) gene polymorphism with Type I diabetes. Diabetologia, 43, 507-14.
Gambelunghe G, Ghaderi M, Tortoioli C, Falorni A, Santeusanio F, Brunetti P & Sanjeevi C B (2001) Two distinct MICA gene markers discriminate major autoimmune diabetes types. J Clin Endocrinol Metab, 86, 3754-60.
Giordano C, Richiusa P, Bagnasco M, Pizzolanti G, Di Blasi F, Sbriglia M S, Mattina A, Pesce G, Montagna P, Capone F, Misiano G, Scorsone A, Pugliese A & Galluzzo A (2001) Differential regulation of Fas-mediated apoptosis in both thyrocyte and lymphocyte cellular compartments correlates with opposite phenotypic manifestations of autoimmune thyroid disease. Thyroid, 11, 233-44.
Giraud M, Taubert R, Vandiedonck C, Ke X, Levi-Strauss M, Pagani F, Baralle F E, Eymard B, Tranchant C, Gajdos P, Vincent A, Willcox N, Beeson D, Kyewski B & Garchon H J (2007) An IRF8-binding promoter variant and AIRE control CHRNA1 promiscuous expression in thymus. Nature, 448, 934-7.
Goh S Y, Ho S C, Seah L L, Fong K S & Khoo D H (2004) Thyroid autoantibody profiles in ophthalmic dominant and thyroid dominant Graves' disease differ and suggest ophthalmopathy is a multiantigenic disease. Clin Endocrinol (Oxf), 60, 600-7.
Goldsby R A & Goldsby R A K i (2003) Immunology, New York ; Houndmills, W.H. Freeman.
Gonzalez S, Rodrigo L, Lopez-Vazquez A, Fuentes D, Agudo-Ibanez L, Rodriguez-Rodero S, Fdez-Morera J L, Martinez-Borra J & Lopez-Larrea C (2004) Association of MHC class I related gene B (MICB) to celiac disease. Am J Gastroenterol, 99, 676-80.
Gough S C, Walker L S & Sansom D M (2005) CTLA4 gene polymorphism and autoimmunity. Immunol Rev, 204, 102-15.
Gourraud P A, Boyer J F, Barnetche T, Abbal M, Cambon-Thomsen A, Cantagrel A & Constantin A (2006) A new classification of HLA-DRB1 alleles differentiates predisposing and protective alleles for rheumatoid arthritis structural severity. Arthritis Rheum, 54, 593-9.
Graham R R, Ortmann W A, Langefeld C D, Jawaheer D, Selby S A, Rodine P R, Baechler E C, Rohlf K E, Shark K B, Espe K J, Green L E, Nair R P, Stuart P E, Elder J T, King R A, Moser K L, Gaffney P M, Bugawan T L, Erlich H A, Rich S S, Gregersen P K & Behrens T W (2002) Visualizing human leukocyte antigen class II risk haplotypes in human systemic lupus erythematosus. Am J Hum Genet, 71, 543-53.

References
137
Gray M & Honigberg S M (2001) Effect of chromosomal locus, GC content and length of homology on PCR-mediated targeted gene replacement in Saccharomyces. Nucleic Acids Res, 29, 5156-62.
Groh V, Bahram S, Bauer S, Herman A, Beauchamp M & Spies T (1996) Cell stress-regulated human major histocompatibility complex class I gene expressed in gastrointestinal epithelium. Proc Natl Acad Sci U S A, 93, 12445-50.
Grumet F C, Payne R O, Konishi J & Kriss J P (1974) HL-A antigens as markers for disease susceptibility and autoimmunity in Graves' disease. J Clin Endocrinol Metab, 39, 1115-9.
Hampe J, Franke A, Rosenstiel P, Till A, Teuber M, Huse K, Albrecht M, Mayr G, De La Vega F M, Briggs J, Gunther S, Prescott N J, Onnie C M, Hasler R, Sipos B, Folsch U R, Lengauer T, Platzer M, Mathew C G, Krawczak M & Schreiber S (2007) A genome-wide association scan of nonsynonymous SNPs identifies a susceptibility variant for Crohn disease in ATG16L1. Nat Genet, 39, 207-11.
Harach H R, Escalante D A, Onativia A, Lederer Outes J, Saravia Day E & Williams E D (1985) Thyroid carcinoma and thyroiditis in an endemic goitre region before and after iodine prophylaxis. Acta Endocrinol (Copenh), 108, 55-60.
Harley C B, Futcher A B & Greider C W (1990) Telomeres shorten during ageing of human fibroblasts. Nature, 345, 458-60.
Hashimoto H (1912) Zur Kenntniss der lymphomatosen Veranderung der Schilddruse (Struma lymphomatosa). Arch Klin Chir, 97, 219-48.
Hedrick P W (1987) Gametic disequilibrium measures: proceed with caution. Genetics, 117, 331-41.
Heward J M, Allahabadia A, Armitage M, Hattersley A, Dodson P M, Macleod K, Carr-Smith J, Daykin J, Daly A, Sheppard M C, Holder R L, Barnett A H, Franklyn J A & Gough S C (1999a) The development of Graves' disease and the CTLA-4 gene on chromosome 2q33. J Clin Endocrinol Metab, 84, 2398-401.
Heward J M, Allahabadia A, Daykin J, Carr-Smith J, Daly A, Armitage M, Dodson P M, Sheppard M C, Barnett A H, Franklyn J A & Gough S C (1998) Linkage disequilibrium between the human leukocyte antigen class II region of the major histocompatibility complex and Graves' disease: replication using a population case control and family-based study. J Clin Endocrinol Metab, 83, 3394-7.
Heward J M, Allahabadia A, Sheppard M C, Barnett A H, Franklyn J A & Gough S C (1999b) Association of the large multifunctional proteasome (LMP2) gene with Graves' disease is a result of linkage disequilibrium with the HLA haplotype DRB1*0304-DQB1*02-DQA1*0501. Clin Endocrinol (Oxf), 51, 115-8.
Heward J M, Brand O J, Barrett J C, Carr-Smith J D, Franklyn J A & Gough S C (2007) Association of PTPN22 haplotypes with Graves' disease. J Clin Endocrinol Metab, 92, 685-90.
Heward J M, Nithiyananthan R, Allahabadia A, Gibson S, Franklyn J A & Gough S C (2001) No association of an interleukin 4 gene promoter polymorphism with Graves' disease in the United Kingdom. J Clin Endocrinol Metab, 86, 3861-3.
Heward J M, Simmonds M J, Carr-Smith J, Foxall H, Franklyn J A & Gough S C (2004) A single nucleotide polymorphism in the CD40 gene on chromosome 20q (GD-2) provides no evidence for susceptibility to Graves' disease in UK Caucasians. Clin Endocrinol (Oxf), 61, 269-72.

References
138
Hiratani H, Bowden D W, Ikegami S, Shirasawa S, Shimizu A, Iwatani Y & Akamizu T (2005) Multiple SNPs in intron 7 of thyrotropin receptor are associated with Graves' disease. J Clin Endocrinol Metab, 90, 2898-903.
Holm I A, Manson J E, Michels K B, Alexander E K, Willet W C & Utiger R G (2005) Smoking and oher lifestyle factors and the risk of Grave's hperthyroidism. Archives of Internal Medicine, 165, 1606-11.
Houston F A, Wilson V, Jennings C E, Owen C J, Donaldson P, Perros P & Pearce S H (2004) Role of the CD40 locus in Graves' disease. Thyroid, 14, 506-9.
Huang S M, Wu T J, Lee T D, Yang E K, Shaw C K & Yeh C C (2003) The association of HLA -A, -B, and -DRB1 genotypes with Graves' disease in Taiwanese people. Tissue Antigens, 61, 154-8.
Humbert P & Dupond J L (1988) [Multiple autoimmune syndromes]; Les syndromes auto-immuns multiples (S.A.M.). Ann Med Interne (Paris), 139, 159-68.
Hunt P J, Marshall S E, Weetman A P, Bunce M, Bell J I, Wass J A & Welsh K I (2001) Histocompatibility leucocyte antigens and closely linked immunomodulatory genes in autoimmune thyroid disease. Clin Endocrinol (Oxf), 55, 491-9.
Ide M, Dittmar M, Wurm M, Kanitz M & Kahaly G J (2007) [Polymorphisms of MICA microsatellites in thyroidal autoimmunity]. Med Klin (Munich), 102, 11-5.
Imrie H, Vaidya B, Perros P, Kelly W F, Toft A D, Young E T, Kendall-Taylor P & Pearce S H (2001) Evidence for a Graves' disease susceptibility locus at chromosome Xp11 in a United Kingdom population. J Clin Endocrinol Metab, 86, 626-30.
Ioannidis J P, Ntzani E E, Trikalinos T A & Contopoulos-Ioannidis D G (2001) Replication validity of genetic association studies. Nat Genet, 29, 306-9.
Jacobson E M, Concepcion E, Oashi T & Tomer Y (2005) A Graves' disease-associated Kozak sequence single-nucleotide polymorphism enhances the efficiency of CD40 gene translation: a case for translational pathophysiology. Endocrinology, 146, 2684-91.
Jacobson E M, Huber A K, Akeno N, Sivak M, Li C W, Concepcion E, Ho K & Tomer Y (2007) A CD40 Kozak sequence polymorphism and susceptibility to antibody-mediated autoimmune conditions: the role of CD40 tissue-specific expression. Genes Immun.
Janeway C (2005) Immunobiology : the immune system in health and disease, New York ; London, Garland Science.
Johnson G C, Esposito L, Barratt B J, Smith A N, Heward J, Di Genova G, Ueda H, Cordell H J, Eaves I A, Dudbridge F, Twells R C, Payne F, Hughes W, Nutland S, Stevens H, Carr P, Tuomilehto-Wolf E, Tuomilehto J, Gough S C, Clayton D G & Todd J A (2001) Haplotype tagging for the identification of common disease genes. Nat Genet, 29, 233-7.
Jorgenson E & Witte J S (2006) A gene-centric approach to genome-wide association studies. Nat Rev Genet, 7, 885-91.
Kavvoura F K, Akamizu T, Awata T, Ban Y, Chistiakov D A, Frydecka I, Ghaderi A, Gough S C, Hiromatsu Y, Ploski R, Wang P W, Ban Y, Bednarczuk T, Chistiakova E I, Chojm M, Heward J M, Hiratani H, Juo S H, Karabon L, Katayama S, Kurihara S, Liu R T, Miyake I, Omrani G H, Pawlak E, Taniyama M, Tozaki T & Ioannidis J P (2007) CTLA-4 Gene Polymorphisms and Autoimmune Thyroid Disease: A Meta Analysis. J Clin Endocrinol Metab.
References
139
Kim T Y, Park Y J, Hwang J K, Song J Y, Park K S, Cho B Y & Park D J (2003) A C/T polymorphism in the 5'-untranslated region of the CD40 gene is associated with Graves' disease in Koreans. Thyroid, 13, 919-25.
Klein J & O'HUigin C (1994) The conundrum of nonclassical major histocompatibility complex genes. Proc Natl Acad Sci U S A, 91, 6251-2.
Knudson A G, Jr. (1971) Mutation and cancer: statistical study of retinoblastoma. Proc Natl Acad Sci U S A, 68, 820-3.
Kochi Y, Yamada R, Suzuki A, Harley J B, Shirasawa S, Sawada T, Bae S C, Tokuhiro S, Chang X, Sekine A, Takahashi A, Tsunoda T, Ohnishi Y, Kaufman K M, Kang C P, Kang C, Otsubo S, Yumura W, Mimori A, Koike T, Nakamura Y, Sasazuki T & Yamamoto K (2005) A functional variant in FCRL3, encoding Fc receptor-like 3, is associated with rheumatoid arthritis and several autoimmunities. Nat Genet, 37, 478-85.
Kotani T, Kato E, Hirai K, Kuma K & Ohtaki S (1986a) Immunoglobulin G subclasses of anti-thyroid peroxidase autoantibodies in human autoimmune thyroid diseases. Endocrinol Jpn, 33, 505-10.
Kotani T, Umeki K, Matsunaga S, Kato E & Ohtaki S (1986b) Detection of autoantibodies to thyroid peroxidase in autoimmune thyroid diseases by micro-ELISA and immunoblotting. J Clin Endocrinol Metab, 62, 928-33.
Kotsa K, Watson P F & Weetman A P (1997) A CTLA-4 gene polymorphism is associated with both Graves disease and autoimmune hypothyroidism. Clin Endocrinol (Oxf), 46, 551-4.
Kyewski B & Derbinski J (2004) Self-representation in the thymus: an extended view. Nat Rev Immunol, 4, 688-98.
Kyogoku C, Langefeld C D, Ortmann W A, Lee A, Selby S, Carlton V E, Chang M, Ramos P, Baechler E C, Batliwalla F M, Novitzke J, Williams A H, Gillett C, Rodine P, Graham R R, Ardlie K G, Gaffney P M, Moser K L, Petri M, Begovich A B, Gregersen P K & Behrens T W (2004) Genetic association of the R620W polymorphism of protein tyrosine phosphatase PTPN22 with human SLE. Am J Hum Genet, 75, 504-7.
Lalouel J M & Rohrwasser A (2002) Power and replication in case-control studies. Am J Hypertens, 15, 201-5.
Liston A, Hardy K, Pittelkow Y, Wilson S R, Makaroff L E, Fahrer A M & Goodnow C C (2007) Impairment of organ-specific T cell negative selection by diabetes susceptibility genes: genomic analysis by mRNA profiling. Genome Biol, 8, R12.
Lo F S, Lee Y J, Huang C Y, Lin C H, Chang S C, Dang C W & Liu H F (2003) Polymorphism in the transmembrane region of the major histocompatibility complex class I chain-related gene A: association of five GCT repetitions with Graves' disease in children. Thyroid, 13, 839-43.
Lopez-Arbesu R, Ballina-Garcia F J, Alperi-Lopez M, Lopez-Soto A, Rodriguez-Rodero S, Martinez-Borra J, Lopez-Vazquez A, Fernandez-Morera J L, Riestra-Noriega J L, Queiro-Silva R, Quinones-Lombrana A, Lopez-Larrea C & Gonzalez S (2007) MHC class I chain-related gene B (MICB) is associated with rheumatoid arthritis susceptibility. Rheumatology (Oxford), 46, 426-30.
Lorini R, Gastaldi R, Traggiai C & Perucchin P P (2003) Hashimoto's Thyroiditis. Pediatr Endocrinol Rev, 1 Suppl 2, 205-11; discussion 211.
Ludgate M & Vassart G (1990) The molecular genetics of three thyroid autoantigens: thyroglobulin, thyroid peroxidase and the thyrotropin receptor. Autoimmunity, 7, 201-11.

References
140
Lumachi F & Basso S (2002) Apoptosis: life through planned cellular death regulating mechanisms, control systems, and relations with thyroid diseases. Thyroid, 12, 27-34.
Maciel L M, Rodrigues S S, Dibbern R S, Navarro P A & Donadi E A (2001) Association of the HLA-DRB1*0301 and HLA-DQA1*0501 alleles with Graves' disease in a population representing the gene contribution from several ethnic backgrounds. Thyroid, 11, 31-5.
Mangklabruks A, Cox N & DeGroot L J (1991) Genetic factors in autoimmune thyroid disease analyzed by restriction fragment length polymorphisms of candidate genes. J Clin Endocrinol Metab, 73, 236-44.
Manji N, Carr-Smith J D, Boelaert K, Allahabadia A, Armitage M, Chatterjee V K, Lazarus J H, Pearce S H, Vaidya B, Gough S C & Franklyn J A (2006) Influences of age, gender, smoking, and family history on autoimmune thyroid disease phenotype. J Clin Endocrinol Metab, 91, 4873-80.
Mather B A, Roberts D F, Scanlon M F, Mukhtar E D, Davies T F, Smith B R & Hall R (1980) HLA antigens and thyroid autoantibodies in patients with Graves' disease and their first degree relatives. Clin Endocrinol (Oxf), 12, 155-63.
Mathis D & Benoist C (2009) Aire. Annu Rev Immunol, 27, 287-312. Mazokopakis E E & Chatzipavlidou V (2007) Hashimoto's thyroiditis and the role of
selenium. Current concepts. Hell J Nucl Med, 10, 6-8. McIver B & Morris J C (1998) The pathogenesis of Graves' disease. Endocrinol Metab Clin
North Am, 27, 73-89. Meyer G, Donner H, Herwig J, Bohles H, Usadel K H & Badenhoop K (2001) Screening for
an AIRE-1 mutation in patients with Addison's disease, type 1 diabetes, Graves' disease and Hashimoto's thyroiditis as well as in APECED syndrome. Clin Endocrinol (Oxf), 54, 335-8.
Michou L, Lasbleiz S, Rat A C, Migliorini P, Balsa A, Westhovens R, Barrera P, Alves H, Pierlot C, Glikmans E, Garnier S, Dausset J, Vaz C, Fernandes M, Petit-Teixeira E, Lemaire I, Pascual-Salcedo D, Bombardieri S, Dequeker J, Radstake T R, Van Riel P, van de Putte L, Lopes-Vaz A, Prum B, Bardin T, Dieude P & Cornelis F (2007) Linkage proof for PTPN22, a rheumatoid arthritis susceptibility gene and a human autoimmunity gene. Proc Natl Acad Sci U S A, 104, 1649-54.
Moens H, Farid N R, Sampson L, Noel E P & Barnard J M (1978) Hashimoto's thyroiditis is associated with HLA-DRw3. N Engl J Med, 299, 133-4.
Mohan M P & Ramesh T C (2003) Multiple autoimmune syndrome. Indian J Dermatol Venereol Leprol, 69, 298-9.
Muhlberg T, Kirchberger M, Spitzweg C, Herrmann F, Heberling H J & Heufelder A E (1998) Lack of association of Graves' disease with the A2 allele of the interleukin-1 receptor antagonist gene in a white European population. Eur J Endocrinol, 138, 686-90.
Mukai T, Hiromatsu Y, Fukutani T, Ichimura M, Kaku H, Miyake I & Yamada K (2005) A C/T polymorphism in the 5' untranslated region of the CD40 gene is associated with later onset of Graves' disease in Japanese. Endocr J, 52, 471-7.
Muller B, Zulewski H, Huber P, Ratcliffe J G & Staub J J (1995) Impaired action of thyroid hormone associated with smoking in women with hypothyroidism. N Engl J Med, 333, 964-9.
Nakkuntod J, Wongsurawat T, Charoenwongse P, Snabboon T, Sridama V & Hirankarn N (2006a) Association of TNF-alpha, TNF-beta, IFN-gamma and IL-1Ra gene

References
141
polymorphisms with Graves' disease in the Thai population. Asian Pacific Journal of Allergy and Immunology, 24, 207-11.
Nakkuntod J, Wongsurawat T, Charoenwongse P, Snabboon T, Sridama V & Hirankarn N (2006b) Association of TNF-alpha, TNF-beta, IFN-gamma and IL-1Ra gene polymorphisms with Graves' disease in the Thai population. Asian Pac J Allergy Immunol, 24, 207-11.
Newby P R, Roberts-Davies E L, Brand O J, Heward J M, Franklyn J A, Gough S C & Simmonds M J (2007) Tag SNP screening of the PDCD1 gene for association with Graves' disease. Clin Endocrinol (Oxf), E-publication.
Nielsen C H, Brix T H, Gardas A, Banga J P & Hegedus L (2008) Epitope recognition patterns of thyroid peroxidase autoantibodies in healthy individuals and patients with Hashimoto's thyroiditis*. Clin Endocrinol (Oxf), 69, 664-8.
Nithiyananthan R, Heward J M, Allahabadia A, Franklyn J A & Gough S C (2002) Polymorphism of the CTLA-4 gene is associated with autoimmune hypothyroidism in the United Kingdom. Thyroid, 12, 3-6.
NLM (2008) NCBI dbMHC. National Library of Medicine. Nordling C O (1953) A new theory on cancer-inducing mechanism. Br J Cancer, 7, 68-72. Onengut-Gumuscu S, Buckner J H & Concannon P (2006) A haplotype-based analysis of the
PTPN22 locus in type 1 diabetes. Diabetes, 55, 2883-9. Ono M, Yaguchi H, Ohkura N, Kitabayashi I, Nagamura Y, Nomura T, Miyachi Y, Tsukada
T & Sakaguchi S (2007) Foxp3 controls regulatory T-cell function by interacting with AML1/Runx1. Nature, 446, 685-9.
Osborne R H, Horowitz S L & De George F V (1958) Genetic variation in tooth dimensions: a twin study of the permanent anterior teeth. Am J Hum Genet, 10, 350-6.
Owen C J, Eden J A, Jennings C E, Wilson V, Cheetham T D & Pearce S H (2006) Genetic association studies of the FOXP3 gene in Graves' disease and autoimmune Addison's disease in the United Kingdom population. J Mol Endocrinol, 37, 97-104.
Owen C J, Kelly H, Eden J A, Merriman M E, Pearce S H & Merriman T R (2007) Analysis of the Fc Receptor-Like-3 (FCRL3) Locus in Caucasians with Autoimmune Disorders Suggests a Complex Pattern of Disease Association. J Clin Endocrinol Metab, 92, 1106-11.
Ozcelik T, Uz E, Akyerli C B, Bagislar S, Mustafa C A, Gursoy A, Akarsu N, Toruner G, Kamel N & Gullu S (2006) Evidence from autoimmune thyroiditis of skewed X-chromosome inactivation in female predisposition to autoimmunity. Eur J Hum Genet, 14, 791-7.
Pacholczyk R & Kern J (2008) The T-cell receptor repertoire of regulatory T cells. Immunology, 125, 450-8.
Park Y, Lee H, Sanjeevi C B & Eisenbarth G S (2001) MICA polymorphism is associated with type 1 diabetes in the Korean population. Diabetes Care, 24, 33-8.
Park Y S, Sanjeevi C B, Robles D, Yu L, Rewers M, Gottlieb P A, Fain P & Eisenbarth G S (2002) Additional association of intra-MHC genes, MICA and D6S273, with Addison's disease. Tissue Antigens, 60, 155-63.
Pasternak J J (2005) An introduction to human molecular genetics : mechanisms of inherited diseases, Hoboken, N.J., Wiley-Liss, Chichester : John Wiley [distributor].
Paust S & Cantor H (2005) Regulatory T cells and autoimmune disease. Immunol Rev, 204, 195-207.
Pearce S H, Vaidya B, Imrie H, Perros P, Kelly W F, Toft A D, McCarthy M I, Young E T & Kendall-Taylor P (1999) Further evidence for a susceptibility locus on chromosome
References
142
20q13.11 in families with dominant transmission of Graves disease. Am J Hum Genet, 65, 1462-5.
Petrone A, Giorgi G, Mesturino C A, Capizzi M, Cascino I, Nistico L, Osborn J, Di Mario U & Buzzetti R (2001) Association of DRB1*04-DQB1*0301 haplotype and lack of association of two polymorphic sites at CTLA-4 gene with Hashimoto's thyroiditis in an Italian population. Thyroid, 11, 171-5.
Pickerill A P, Watson P F, Tandon N & Weetman A P (1993) T cell receptor beta chain gene polymorphisms in Graves' disease. Acta Endocrinol (Copenh), 128, 499-502.
Pirro M T, De Filippis V, Di Cerbo A, Scillitani A, Liuzzi A & Tassi V (1995) Thyroperoxidase microsatellite polymorphism in thyroid diseases. Thyroid, 5, 461-4.
Pritchard J K & Przeworski M (2001) Linkage disequilibrium in humans: models and data. Am J Hum Genet, 69, 1-14.
Ramos-Lopez E, Kurylowicz A, Bednarczuk T, Paunkovic J, Seidl C & Badenhoop K (2005) Vitamin D receptor polymorphisms are associated with Graves' disease in German and Polish but not in Serbian patients. Thyroid, 15, 1125-30.
Rasooly L, Burek C L & Rose N R (1996) Iodine-induced autoimmune thyroiditis in NOD-H-2h4 mice. Clin Immunol Immunopathol, 81, 287-92.
Ringold D A, Nicoloff J T, Kesler M, Davis H, Hamilton A & Mack T (2002) Further evidence for a strong genetic influence on the development of autoimmune thyroid disease: the California twin study. Thyroid, 12, 647-53.
Risch N & Merikangas K (1996) The future of genetic studies of complex human diseases. Science, 273, 1516-7.
Rodriguez-Rodero S, Gonzalez S, Rodrigo L, Fernandez-Morera J L, Martinez-Borra J, Lopez-Vazquez A & Lopez-Larrea C (2007) Transcriptional regulation of MICA and MICB: a novel polymorphism in MICB promoter alters transcriptional regulation by Sp1. Eur J Immunol, 37, 1938-53.
Sakaguchi S (2000) Regulatory T cells: key controllers of immunologic self-tolerance. Cell, 101, 455-8.
Sakaguchi S (2005) Naturally arising Foxp3-expressing CD25+CD4+ regulatory T cells in immunological tolerance to self and non-self. Nat Immunol, 6, 345-52.
Sakai K, Shirasawa S, Ishikawa N, Ito K, Tamai H, Kuma K, Akamizu T, Tanimura M, Furugaki K, Yamamoto K & Sasazuki T (2001) Identification of susceptibility loci for autoimmune thyroid disease to 5q31-q33 and Hashimoto's thyroiditis to 8q23-q24 by multipoint affected sib-pair linkage analysis in Japanese. Hum Mol Genet, 10, 1379-86.
Salmaso C, Bagnasco M, Pesce G, Montagna P, Brizzolara R, Altrinetti V, Richiusa P, Galluzzo A & Giordano C (2002) Regulation of apoptosis in endocrine autoimmunity: insights from Hashimoto's thyroiditis and Graves' disease. Ann N Y Acad Sci, 966, 496-501.
Santamaria P, Barbosa J J, Lindstrom A L, Lemke T A, Goetz F C & Rich S S (1994) HLA-DQB1-associated susceptibility that distinguishes Hashimoto's thyroiditis from Graves' disease in type I diabetic patients. J Clin Endocrinol Metab, 78, 878-83.
Schonland S O, Lopez C, Widmann T, Zimmer J, Bryl E, Goronzy J J & Weyand C M (2003) Premature telomeric loss in rheumatoid arthritis is genetically determined and involves both myeloid and lymphoid cell lineages. Proc Natl Acad Sci U S A, 100, 13471-6.
Schrambach S, Ardizzone M, Leymarie V, Sibilia J & Bahram S (2007) In vivo expression pattern of MICA and MICB and its relevance to auto-immunity and cancer. PLoS ONE, 2, e518.

References
143
Shephard N (2005) Centre for Integrated Genomic Medical Research. Calculating and Interpreting Odds-Ratios.
Shi Y, Zou M, Robb D & Farid N R (1992) Typing for major histocompatibility complex class II antigens in thyroid tissue blocks: association of Hashimoto's thyroiditis with HLA-DQA0301 and DQB0201 alleles. J Clin Endocrinol Metab, 75, 943-6.
Shiina T, Tamiya G, Oka A, Takishima N & Inoko H (1999) Genome sequencing analysis of the 1.8 Mb entire human MHC class I region. Immunol Rev, 167, 193-9.
Simmonds M J & Gough S C (2004a) Genetic insights into disease mechanisms of autoimmunity. British Medical Bulletin, 71, 93-113.
Simmonds M J & Gough S C (2004b) Unravelling the genetic complexity of autoimmune thyroid disease: HLA, CTLA-4 and beyond. Clinical & Experimental Immunology, 136, 1-10.
Simmonds M J, Heward J M, Barrett J C, Franklyn J A & Gough S C (2006) Association of the BTNL2 rs2076530 single nucleotide polymorphism with Graves' disease appears to be secondary to DRB1 exon 2 position beta74. Clin Endocrinol (Oxf), 65, 429-32.
Simmonds M J, Heward J M, Carr-Smith J, Foxall H, Franklyn J A & Gough S C (2005a) Contribution of single nucleotide polymorphisms within FCRL3 and MAP3K7IP2 to the pathogenesis of Graves' disease. J Clin Endocrinol Metab.
Simmonds M J, Heward J M, Franklyn J A & Gough S C (2005b) IL-13 and chromosome 5q31-q33: problems of identifying association within regions of linkage to Graves' disease. Clin Endocrinol (Oxf), 63, 695-7.
Simmonds M J, Heward J M, Howson J M, Foxall H, Nithiyananthan R, Franklyn J A & Gough S C (2004) A systematic approach to the assessment of known TNF-alpha polymorphisms in Graves' disease. Genes Immun, 5, 267-73.
Simmonds M J, Howson J M, Heward J M, Carr-Smith J, Franklyn J A, Todd J A & Gough S C (2007) A novel and major association of HLA-C in Graves' disease that eclipses the classical HLA-DRB1 effect. Hum Mol Genet, 16, 2149-53.
Simmonds M J, Howson J M, Heward J M, Cordell H J, Foxall H, Carr-Smith J, Gibson S M, Walker N, Tomer Y, Franklyn J A, Todd J A & Gough S C (2005c) Regression mapping of association between the human leukocyte antigen region and Graves disease. Am J Hum Genet, 76, 157-63.
Sladek R, Rocheleau G, Rung J, Dina C, Shen L, Serre D, Boutin P, Vincent D, Belisle A, Hadjadj S, Balkau B, Heude B, Charpentier G, Hudson T J, Montpetit A, Pshezhetsky A V, Prentki M, Posner B I, Balding D J, Meyre D, Polychronakos C & Froguel P (2007) A genome-wide association study identifies novel risk loci for type 2 diabetes. Nature, 445, 881-5.
Smyth D, Cooper J D, Collins J E, Heward J M, Franklyn J A, Howson J M, Vella A, Nutland S, Rance H E, Maier L, Barratt B J, Guja C, Ionescu-Tirgoviste C, Savage D A, Dunger D B, Widmer B, Strachan D P, Ring S M, Walker N, Clayton D G, Twells R C, Gough S C & Todd J A (2004) Replication of an association between the lymphoid tyrosine phosphatase locus (LYP/PTPN22) with type 1 diabetes, and evidence for its role as a general autoimmunity locus. Diabetes, 53, 3020-3.
Stassi G & De Maria R (2002) Autoimmune thyroid disease: new models of cell death in autoimmunity. Nat Rev Immunol, 2, 195-204.
Steer S, Abkevich V, Gutin A, Cordell H J, Gendall K L, Merriman M E, Rodger R A, Rowley K A, Chapman P, Gow P, Harrison A A, Highton J, Jones P B, O'Donnell J, Stamp L, Fitzgerald L, Iliev D, Kouzmine A, Tran T, Skolnick M H, Timms K M, Lanchbury J S & Merriman T R (2007) Genomic DNA pooling for whole-genome

References
144
association scans in complex disease: empirical demonstration of efficacy in rheumatoid arthritis. Genes Immun, 8, 57-68.
Stefanic M, Karner I, Glavas-Obrovac L, Papic S, Vrdoljak D, Levak G & Krstonosic B (2005) Association of vitamin D receptor gene polymorphism with susceptibility to Graves' disease in Eastern Croatian population: case-control study. Croat Med J, 46, 639-46.
Stefanou J & Wooster M J (1975) Proceedings: A superfusion system used for loading and washing out 45Ca from frog ventricular strips. Br J Pharmacol, 54, 280P-281P.
Stenszky V, Balazs C, Kraszits E, Juhasz F, Kozma L, Balazs G & Farid N R (1987) Association of goitrous autoimmune thyroiditis with HLA-DR3 in eastern Hungary. J Immunogenet, 14, 143-8.
Stenszky V, Kozma L, Balazs C, Rochlitz S, Bear J C & Farid N R (1985) The genetics of Graves' disease: HLA and disease susceptibility. J Clin Endocrinol Metab, 61, 735-40.
Strieder T G, Prummel M F, Tijssen J G, Endert E & Wiersinga W M (2003) Risk factors for and prevalence of thyroid disorders in a cross-sectional study among healthy female relatives of patients with autoimmune thyroid disease. Clin Endocrinol (Oxf), 59, 396-401.
Sundick R S, Herdegen D M, Brown T R & Bagchi N (1987) The incorporation of dietary iodine into thyroglobulin increases its immunogenicity. Endocrinology, 120, 2078-84.
Sutherland A, Davies J, Owen C J, Vaikkakara S, Walker C, Cheetham T D, James R A, Perros P, Donaldson P T, Cordell H J, Quinton R & Pearce S H (2007) Genomic Polymorphism at the Interferon-Induced Helicase (Ifih1) Locus Contributes to Graves' Disease Susceptibility. J Clin Endocrinol Metab.
Tamai H, Kimura A, Dong R P, Matsubayashi S, Kuma K, Nagataki S & Sasazuki T (1994) Resistance to autoimmune thyroid disease is associated with HLA-DQ. J Clin Endocrinol Metab, 78, 94-7.
Tandon N, Zhang L & Weetman A P (1991) HLA associations with Hashimoto's thyroiditis. Clin Endocrinol (Oxf), 34, 383-6.
Tang Q, Henriksen K J, Bi M, Finger E B, Szot G, Ye J, Masteller E L, McDevitt H, Bonyhadi M & Bluestone J A (2004) In vitro-expanded antigen-specific regulatory T cells suppress autoimmune diabetes. J Exp Med, 199, 1455-65.
Taylor J C, Gough S C, Hunt P J, Brix T H, Chatterjee K, Connell J M, Franklyn J A, Hegedus L, Robinson B G, Wiersinga W M, Wass J A, Zabaneh D, Mackay I & Weetman A P (2006) A genome-wide screen in 1119 relative pairs with autoimmune thyroid disease. J Clin Endocrinol Metab, 91, 646-53.
Thomson G, Robinson W P, Kuhner M K, Joe S, MacDonald M J, Gottschall J L, Barbosa J, Rich S S, Bertrams J, Baur M P & et al. (1988) Genetic heterogeneity, modes of inheritance, and risk estimates for a joint study of Caucasians with insulin-dependent diabetes mellitus. Am J Hum Genet, 43, 799-816.
Todd J A (1995) Genetic analysis of type 1 diabetes using whole genome approaches. Proc Natl Acad Sci U S A, 92, 8560-5.
Tomer Y, Ban Y, Concepcion E, Barbesino G, Villanueva R, Greenberg D A & Davies T F (2003a) Common and Unique Suceptibility Loci in Graves and Hashimoto Diseases: Results of Whole-Genome Screening in a Data Set of 102 Multiplex Families. American Journal of Human Genetics, 73, 736-747.
Tomer Y, Ban Y, Concepcion E, Barbesino G, Villanueva R, Greenberg D A & Davies T F (2003b) Common and unique susceptibility loci in Graves and Hashimoto diseases:

References
145
results of whole-genome screening in a data set of 102 multiplex families. Am J Hum Genet, 73, 736-47.
Tomer Y, Barbesino G, Greenberg D A, Concepcion E & Davies T F (1998) Linkage analysis of candidate genes in autoimmune thyroid disease. III. Detailed analysis of chromosome 14 localizes Graves' disease-1 (GD-1) close to multinodular goiter-1 (MNG-1). International Consortium for the Genetics of Autoimmune Thyroid Disease. Journal of Clinical Endocrinology & Metabolism, 83, 4321-7.
Tomer Y, Barbesino G, Greenberg D A, Concepcion E & Davies T F (1999a) Mapping the major susceptibility loci for familial Graves' and Hashimoto's diseases: evidence for genetic heterogeneity and gene interactions. Journal of Clinical Endocrinology & Metabolism, 84, 4656-64.
Tomer Y, Barbesino G, Greenberg D A, Concepcion E & Davies T F (1999b) Mapping the major susceptibility loci for familial Graves' and Hashimoto's diseases: evidence for genetic heterogeneity and gene interactions. J Clin Endocrinol Metab, 84, 4656-64.
Tomer Y, Concepcion E & Greenberg D A (2002a) A C/T single-nucleotide polymorphism in the region of the CD40 gene is associated with Graves' disease. Thyroid, 12, 1129-35.
Tomer Y & Greenberg D (2004) The thyroglobulin gene as the first thyroid-specific susceptibility gene for autoimmune thyroid disease. Trends Mol Med, 10, 306-8.
Tomer Y, Greenberg D A, Concepcion E, Ban Y & Davies T F (2002b) Thyroglobulin is a thyroid specific gene for the familial autoimmune thyroid diseases. J Clin Endocrinol Metab, 87, 404-7.
Tomlinson I P, Roylance R & Houlston R S (2001) Two hits revisited again. J Med Genet, 38, 81-5.
Tunbridge W M, Evered D C, Hall R, Appleton D, Brewis M, Clark F, Evans J G, Young E, Bird T & Smith P A (1977) The spectrum of thyroid disease in a community: the Whickham survey. Clin Endocrinol (Oxf), 7, 481-93.
Ueda H, Howson J M, Esposito L, Heward J, Snook H, Chamberlain G, Rainbow D B, Hunter K M, Smith A N, Di Genova G, Herr M H, Dahlman I, Payne F, Smyth D, Lowe C, Twells R C, Howlett S, Healy B, Nutland S, Rance H E, Everett V, Smink L J, Lam A C, Cordell H J, Walker N M, Bordin C, Hulme J, Motzo C, Cucca F, Hess J F, Metzker M L, Rogers J, Gregory S, Allahabadia A, Nithiyananthan R, Tuomilehto-Wolf E, Tuomilehto J, Bingley P, Gillespie K M, Undlien D E, Ronningen K S, Guja C, Ionescu-Tirgoviste C, Savage D A, Maxwell A P, Carson D J, Patterson C C, Franklyn J A, Clayton D G, Peterson L B, Wicker L S, Todd J A & Gough S C (2003) Association of the T-cell regulatory gene CTLA4 with susceptibility to autoimmune disease. Nature, 423, 506-11.
UKDA (2002) UK Data Archive. Ulgen A & Li W (2005) Comparing single-nucleotide polymorphism marker-based and
microsatellite marker-based linkage analyses. BMC Genet, 6 Suppl 1, S13. Vaidya B, Imrie H, Perros P, Young E T, Kelly W F, Carr D, Large D M, Toft A D,
McCarthy M I, Kendall-Taylor P & Pearce S H (1999) The cytotoxic T lymphocyte antigen-4 is a major Graves' disease locus. Hum Mol Genet, 8, 1195-9.
Vanderpump M P, Tunbridge W M, French J M, Appleton D, Bates D, Clark F, Grimley Evans J, Hasan D M, Rodgers H, Tunbridge F & et al. (1995) The incidence of thyroid disorders in the community: a twenty-year follow-up of the Whickham Survey. Clin Endocrinol (Oxf), 43, 55-68.
Velaga M R, Wilson V, Jennings C E, Owen C J, Herington S, Donaldson P T, Ball S G, James R A, Quinton R, Perros P & Pearce S H (2004) The codon 620 tryptophan allele
References
146
of the lymphoid tyrosine phosphatase (LYP) gene is a major determinant of Graves' disease. J Clin Endocrinol Metab, 89, 5862-5.
Vestergaard P (2002) Smoking and thyroid disorders--a meta-analysis. European Journal of Endocrinology, 146, 153-161.
Vestergaard P, Rejnmark L, Weeke J, Hoeck H C, Nielsen H K, Rungby J, Laurberg P & Mosekilde L (2002) Smoking as a risk factor for Graves' disease, toxic nodular goiter, and autoimmune hypothyroidism. Thyroid, 12, 69-75.
Vives-Pi M, Vargas F, James R F, Trowsdale J, Costa M, Sospedra M, Somoza N, Obiols G, Tampe R & Pujol-Borrell R (1997) Proteasome subunits, low-molecular-mass polypeptides 2 and 7 are hyperexpressed by target cells in autoimmune thyroid disease but not in insulin-dependent diabetes mellitus: implications for autoimmunity. Tissue Antigens, 50, 153-63.
Wan X L, Kimura A, Dong R P, Honda K, Tamai H & Sasazuki T (1995) HLA-A and -DRB4 genes in controlling the susceptibility to Hashimoto's thyroiditis. Hum Immunol, 42, 131-6.
Wang W Y, Barratt B J, Clayton D G & Todd J A (2005) Genome-wide association studies: theoretical and practical concerns. Nat Rev Genet, 6, 109-18.
Weetman A P (2000) Graves' disease. N Engl J Med, 343, 1236-48. Weissel M, Hofer R, Zasmeta H & Mayr W R (1980) HLA-DR and Hashimoto's thyroiditis.
Tissue Antigens, 16, 256-7. Weyand C M, Hicok K C, Conn D L & Goronzy J J (1992) The influence of HLA-DRB1
genes on disease severity in rheumatoid arthritis. Ann Intern Med, 117, 801-6. Wildin R S, Ramsdell F, Peake J, Faravelli F, Casanova J L, Buist N, Levy-Lahad E,
Mazzella M, Goulet O, Perroni L, Bricarelli F D, Byrne G, McEuen M, Proll S, Appleby M & Brunkow M E (2001) X-linked neonatal diabetes mellitus, enteropathy and endocrinopathy syndrome is the human equivalent of mouse scurfy. Nat Genet, 27, 18-20.
Wongsurawat T, Nakkuntod J, Charoenwongse P, Snabboon T, Sridama V & Hirankarn N (2006) The association between HLA class II haplotype with Graves' disease in Thai population. Tissue Antigens, 67, 79-83.
Woolf B (1955) On estimating the relation between blood group and disease. Ann Hum Genet, 19, 251-3.
WTCCC (2007) Genome-wide association study of 14,000 cases of seven common diseases and 3,000 shared controls. Nature, 447, 661-78.
Xing C, Schumacher F R, Xing G, Lu Q, Wang T & Elston R C (2005) Comparison of microsatellites, single-nucleotide polymorphisms (SNPs) and composite markers derived from SNPs in linkage analysis. BMC Genet, 6 Suppl 1, S29.
Xu W C, Chen S R, Huang J X, Zheng Z C, Chen L X, Lin J J & Li Y G (2007) Expression and distribution of S-100 protein, CD83 and apoptosis-related proteins (Fas, FasL and Bcl-2) in thyroid tissues of autoimmune thyroid diseases. Eur J Histochem, 51, 291-300.
Yanagawa T, Hidaka Y, Guimaraes V, Soliman M & DeGroot L J (1995) CTLA-4 gene polymorphism associated with Graves' disease in a Caucasian population. J Clin Endocrinol Metab, 80, 41-5.
Yanagawa T, Mangklabruks A, Chang Y B, Okamoto Y, Fisfalen M E, Curran P G & DeGroot L J (1993) Human histocompatibility leukocyte antigen-DQA1*0501 allele associated with genetic susceptibility to Graves' disease in a Caucasian population. J Clin Endocrinol Metab, 76, 1569-74.

References
147
Yanagawa T, Mangklabruks A & DeGroot L J (1994) Strong association between HLA-DQA1*0501 and Graves' disease in a male Caucasian population. J Clin Endocrinol Metab, 79, 227-9.
Yang Y, Lingling S, Ying J, Yushu L, Zhongyan S, Wei H & Weiping T (2005) Association study between the IL4, IL13, IRF1 and UGRP1 genes in chromosomal 5q31 region and Chinese Graves' disease. J Hum Genet, 50, 574-82.
Zhang J, Hu S & Wang H (2000) Expression of T cell receptor V(alpha) gene families in intrathyroidal T cells of Chinese patients with Graves' disease. Chin Med Sci J, 15, 175-8.
Zhang L & Zhao Y (2007) The regulation of Foxp3 expression in regulatory CD4(+)CD25(+)T cells: multiple pathways on the road. J Cell Physiol, 211, 590-7.


![Hashimoto’s Thyroiditis and Encephalopathy · Hashimoto’s Thyroiditis and Encephalopathy David S. Younger Department of Neurology, ... [36]. In humans, disease susceptibility](https://static.fdocuments.in/doc/165x107/5c814ac809d3f263728c0c55/hashimotos-thyroiditis-and-hashimotos-thyroiditis-and-encephalopathy-david.jpg)


