
The Role of Technology in Mortgage Lending...December 2016, all FinTech lenders are stand-alone...
74
The Role of Technology in Mortgage Lending Andreas Fuster Matthew Plosser Philipp Schnabl James Vickery * February 13, 2018 Abstract Technology-based (“FinTech”) lenders increased their market share of U.S. mort- gage lending from 2% to 8% from 2010 to 2016. Using market-wide, loan-level data on U.S. mortgage applications and originations, we show that FinTech lenders process mortgage applications about 20% faster than other lenders, even when controlling for detailed loan, borrower, and geographic observables. Faster processing does not come at the cost of higher defaults. FinTech lenders adjust supply more elastically than other lenders in response to exogenous mortgage demand shocks, thereby alleviating capacity constraints associated with traditional mortgage lending. In areas with more FinTech lending, borrowers refinance more, especially when it is in their interest to do so. We find no evidence that FinTech lenders target marginal borrowers. Our results suggest that technological innovation has improved the efficiency of financial intermediation in the U.S. mortgage market. * Fuster, Plosser and Vickery: Federal Reserve Bank of New York. Schnabl: NYU Stern School of Busi- ness, NBER and CEPR. We thank an anonymous reviewer, Sudheer Chava, Scott Frame, Itay Goldstein, Wei Jiang, Andrew Karolyi, Chris Mayer, Stephen Zeldes, and seminar and conference participants at Columbia (RFS FinTech conference), NYU Stern, Kellogg School of Management, University of St. Gallen, Federal Re- serve Bank of Atlanta 2017 Real Estate Conference, Homer Hoyt Institute, and the University of Technology, Sydney, for helpful comments. We also thank a number of anonymous mortgage industry professionals for providing information about institutional details and industry trends. Katherine di Lucido, Patrick Farrell, Eilidh Geddes, Drew Johnston, April Meehl, Akhtar Shah, Shivram Viswanathan and Brandon Zborowski provided excellent research assistance. The views expressed in this paper are solely those of the authors and not necessarily those of the Federal Reserve Bank of New York or the Federal Reserve System.
Transcript of The Role of Technology in Mortgage Lending...December 2016, all FinTech lenders are stand-alone...

The Role of Technology in Mortgage Lending
Andreas Fuster Matthew Plosser Philipp Schnabl James Vickery∗
February 13, 2018
Abstract
Technology-based (“FinTech”) lenders increased their market share of U.S. mort-gage lending from 2% to 8% from 2010 to 2016. Using market-wide, loan-level dataon U.S. mortgage applications and originations, we show that FinTech lenders processmortgage applications about 20% faster than other lenders, even when controlling fordetailed loan, borrower, and geographic observables. Faster processing does not comeat the cost of higher defaults. FinTech lenders adjust supply more elastically than otherlenders in response to exogenous mortgage demand shocks, thereby alleviating capacityconstraints associated with traditional mortgage lending. In areas with more FinTechlending, borrowers refinance more, especially when it is in their interest to do so. Wefind no evidence that FinTech lenders target marginal borrowers. Our results suggestthat technological innovation has improved the efficiency of financial intermediation inthe U.S. mortgage market.
∗Fuster, Plosser and Vickery: Federal Reserve Bank of New York. Schnabl: NYU Stern School of Busi-ness, NBER and CEPR. We thank an anonymous reviewer, Sudheer Chava, Scott Frame, Itay Goldstein, WeiJiang, Andrew Karolyi, Chris Mayer, Stephen Zeldes, and seminar and conference participants at Columbia(RFS FinTech conference), NYU Stern, Kellogg School of Management, University of St. Gallen, Federal Re-serve Bank of Atlanta 2017 Real Estate Conference, Homer Hoyt Institute, and the University of Technology,Sydney, for helpful comments. We also thank a number of anonymous mortgage industry professionals forproviding information about institutional details and industry trends. Katherine di Lucido, Patrick Farrell,Eilidh Geddes, Drew Johnston, April Meehl, Akhtar Shah, Shivram Viswanathan and Brandon Zborowskiprovided excellent research assistance. The views expressed in this paper are solely those of the authors andnot necessarily those of the Federal Reserve Bank of New York or the Federal Reserve System.

I Introduction
The U.S. residential mortgage industry is experiencing a wave of technological innovation as
both start-ups and existing lenders seek ways to automate, simplify and speed up each step of
the mortgage origination process. At the forefront of this development are FinTech lenders,
which have a complete end-to-end online mortgage application and approval process that
is supported by centralized underwriting operations, rather than the traditional network of
local brokers or “bricks and mortar” branches. For example, Rocket Mortgage from Quicken
Loans, introduced in 2015, provides a tool to electronically collect documentation about
borrower’s income, assets and credit history, allowing the lender to make approval decisions
based on an online application in as little as eight minutes.
In the aftermath of the 2008 financial crisis, FinTech lenders have become an increasingly
important source of mortgage credit to U.S. households. We measure “FinTech lenders”
as lenders that offer an application process that can be completed entirely online. As of
December 2016, all FinTech lenders are stand-alone mortgage originators that primarily
securitize mortgages and operate without deposit financing or a branch network. Their
lending has grown annually by 30% from $34bn of total originations in 2010 (2% of market) to
$161bn in 2016 (8% of market). The growth has been particularly pronounced for refinances
and for mortgages insured by the Federal Housing Administration (FHA), a segment of the
market which primarily serves lower income borrowers.
In this paper, we study the effects of FinTech lending on the U.S. mortgage market. Our
main hypothesis is that the FinTech lending model represents a technological innovation that
reduces frictions in mortgage lending, such as lengthy loan processing, capacity constraints,
inefficient refinancing, and limited access to finance by some borrowers. The alternative
hypothesis is that FinTech lending is not special on these dimensions, and that FinTech
lenders offer services that are similar to traditional lenders in terms of processing times and
scalability. Under this explanation, there are economic forces unrelated to technology that
explain the growth in FinTech lending (e.g., regulatory arbitrage or marketing).
It is important to distinguish between these explanations to evaluate the impact of techno-
logical innovation on the mortgage market. If FinTech lenders do indeed offer a substantially
1

different product from traditional lenders, they may increase consumer surplus or expand
credit supply, at least for individuals who are comfortable obtaining a mortgage online. If,
however, FinTech lending is driven primarily by other economic forces, there might be little
benefit to consumers. FinTech lending may even increase the overall risk of the U.S. mort-
gage market (e.g., due to lax screening). In addition, the results are important for evaluating
the broader impact of recent technological innovation in loan markets. Mortgage lending is
arguably the market in which technology has had the largest economic impact thus far, but
other loan markets may undergo similar transformations in the future.1
Our analysis identifies several frictions in U.S. mortgage markets and examines whether
FinTech lending alleviates them. We start by examining the effect of FinTech lending on
loan outcomes. We focus particularly on the time it takes to originate a loan as a measure of
efficiency. FinTech lenders may be faster at processing loans than traditional lenders because
online processing is automated and centralized, with less scope for human error. At the same
time, this more automated approach may be less effective at screening borrowers; therefore,
we also examine the riskiness of FinTech loans using data on loan defaults.
We find that FinTech lenders process mortgages faster than traditional lenders, measured
by total days from the submission of a mortgage application until the closing. Using loan-
level data on the near-universe of U.S. mortgages from 2010 to 2016, we find that FinTech
lenders reduce processing time by about 10 days, or 20% of the average processing time.
In our preferred specifications, this effect is larger for refinance mortgages (14.6 days) than
purchase mortgages (9.2 days). The result holds when we restrict the sample to non-banks,
indicating that it is not solely due to differences in regulation. The results are also robust
to including a large set of borrower, loan, and geographic controls; along with other tests
we conduct, this suggests that faster processing is not explained by endogenous matching of
“fast” borrowers with FinTech lenders.
Faster processing times by FinTech lenders do not result in riskier loans. We measure
loan risk using default rates on FHA mortgages, which is the riskiest segment of the market
in recent years. We find that default rates on FinTech mortgages are about 25% lower than
1Many industry observers believe that technology will soon disrupt a wide range of loan markets includ-ing small business loans, leveraged loans, personal unsecured lending, and commercial real estate lending(Goldman Sachs Research, 2015).
2
those for traditional lenders, even when controlling for detailed loan characteristics. There
is no significant difference in interest rates. These results speak against a “lax screening”
hypothesis, and instead indicate that FinTech lending technologies may help attract and
screen for less risky borrowers.
We also find that FinTech lenders respond more elastically to changes in mortgage de-
mand. Existing research documents evidence of significant capacity constraints in U.S. mort-
gage lending.2 FinTech lenders may be better able to better accommodate demand shocks
because they collect information electronically and centralize and partially automate their
underwriting operations. To empirically identify capacity constraints across lenders, we use
changes in nationwide application volume as a source of exogenous variation in mortgage
demand and trace out the correlation with loan processing times.
Empirically, we find that a doubling of the application volume raises the loan processing
time by 13.5 days (or 26%) for traditional lenders, compared to only 7.5 days for FinTech
lenders. The result is robust to including a large number of loan and borrower observables,
restricting the sample to nonbanks, or using an interest rate refinancing incentive or a Bartik-
style instrument to measure demand shocks. The estimated effect is larger for refinances,
where FinTech lenders are particularly active. We also document that FinTech lenders reduce
denial rates relative to other lenders when application volumes rise, suggesting that their
faster processing is not simply due to credit rationing during peak periods.
Given that FinTech lenders particularly focus on mortgage refinances, we next study
their effect on household refinancing behavior. Prior literature has shown that many U.S.
households refinance too little or at the wrong times (e.g., Campbell, 2006; Keys et al., 2016).
FinTech lending may encourage efficient refinancing by offering a faster, less cumbersome
loan process. We examine this possibility by studying the relationship between the FinTech
lender market share and refinancing propensities across U.S. counties.
We find that borrowers are more likely to refinance in counties with a larger FinTech
lender presence (controlling for county and time effects). An 8 percentage point increase
2Fuster et al. (2017b) show that increases in aggregate application volumes are strongly associated withincreases in processing times and higher interest rate margins, thereby attenuating the pass-through of lowermortgage rates to borrowers. Sharpe and Sherlund (2016) and Choi et al. (2017) also find evidence ofcapacity constraints, which they argue alter the mix of loan applications that lenders attract.
3

in the lagged market share of FinTech lenders (which corresponds to moving from the 10th
percentile to the 90th percentile in 2015) raises the likelihood of refinancing by about 10% of
the average. This increase in refinancing appears to be most pronounced among borrowers
estimated to benefit from refinancing. Our findings suggest that FinTech lending, by reducing
refinancing frictions, increases the pass-through of market interest rates to households.
We also analyze cross-sectional patterns in who borrows from FinTech lenders. We find
that FinTech borrowing is higher among more educated populations, and surprisingly among
older borrowers who may be more familiar with the process of obtaining a mortgage. We
find little evidence that FinTech lenders disproportionately target marginal borrowers with
low access to finance. We find no consistent correlation between FinTech lending and local
Internet usage or speed; similarly, using the entry of Google Fiber in Kansas City as a natural
experiment, we find no evidence that improved Internet access increases FinTech mortgage
take-up. These results mitigate concerns about a digital divide in mortgage lending.
Taken together, our results suggest that recent technological innovations are improving
the efficiency of the U.S. mortgage market. We find that FinTech lenders process mortgages
more quickly without increasing loan risk, respond more elastically to demand shocks, and
increase the propensity to refinance, especially among borrowers that are likely to benefit
from it. We find, however, little evidence that FinTech lending is more effective at allocating
credit to otherwise constrained borrowers.
Our results do not necessarily predict how FinTech lending will evolve in the future.
FinTech lenders are nonbanks who securitize most of their mortgages—their growth could
be affected by regulatory changes or reforms to the housing finance system. There is also
uncertainty as to how the increased popularity of machine learning techniques, which FinTech
lenders may be using more intensely, will influence the quantity and distribution of credit.3
Related to this issue, although we find no evidence FinTech lenders select the highest-quality
borrowers (“cream skim”), which could reduce credit for other borrowers, these results could
change as technology-based lending becomes more widespread. Lastly, FinTech lenders use
a less personalized loan process that relies on hard information, which could reduce credit
3See Bartlett et al. (2017) and Fuster et al. (2017a) for recent studies of these issues in the context of theU.S. mortgage market.
4

to atypical applications.
Our research contributes to several strands of the literature. Although a large body of
research has studied residential mortgage lending (see Campbell, 2013 and Badarinza et al.,
2016 for surveys), much of the recent work focuses on securitization and the lending boom
prior to the U.S. financial crisis.4 Our paper instead focuses on how technology affects the
structure of residential mortgage lending after the crisis. Most closely related to this paper,
Buchak et al. (2017) study the recent growth in the share of nonbank mortgage lenders,
including FinTech lenders. While there is some overlap between the descriptive parts of
our analyses, and we use similar approaches to classify FinTech lenders, the two papers are
otherwise strongly complementary. Buchak et al. focus on explaining the growth of non-
bank lending, using reduced-form analysis and a calibrated structural model. Our paper
focuses on how technology impacts frictions in the mortgage origination process, such as
slow processing times, capacity constraints and slow or suboptimal refinancing.5
Our findings also inform research on the role of mortgage markets in the transmission
of monetary policy (e.g., Beraja et al., 2017; Di Maggio et al., 2017). If lenders constrain
the pass-through of interest rates (Agarwal et al., 2017; Drechsler et al., 2017; Fuster et al.,
2017b; Scharfstein and Sunderam, 2016), or borrowers are slow to refinance (Andersen et al.,
2015; Agarwal et al., 2015), changes in interest rates will not be fully reflected in mortgage
rates and originations. Our findings suggest that technology may be easing these frictions,
potentially improving monetary policy pass-through in mortgage markets.
Finally, our paper contributes to a growing literature on the role of technology in finance
(see Philippon, 2016, for an overview), and a broader literature on how new technology can
lead to productivity growth (see e.g. Syverson, 2011 and Collard-Wexler and De Loecker,
2015). In our case, the “productivity” or “efficiency” measures we consider are processing
times, supply elasticity, default and refinancing propensities, and we are the first to document
that FinTech lending appears to lead to improvements along these dimensions.
4See, for example, Mian and Sufi (2009), Keys et al. (2010), Purnanandam (2010), Acharya et al. (2013),or Jiang et al. (2014). Aside from this paper, research focusing on mortgage lending in the post-crisisenvironment includes D’Acunto and Rossi (2017), DeFusco et al. (2017), and Gete and Reher (2017).
5We also study loan defaults and mortgage pricing in a similar way to Buchak et al., but focus on theriskier FHA segment of the market; they primarily study loans insured by Fannie Mae and Freddie Mac.
5
II Who is a FinTech Lender?
A. Defining FinTech lenders
A central feature of our study is the distinction between FinTech mortgage originators and
other lenders. While many mortgage lenders are adopting new technologies to varying de-
grees, it is clear that some lenders are at the forefront of using technology to fundamentally
streamline and automate the mortgage origination process. The defining features of this busi-
ness model are an end-to-end online mortgage application platform and centralized mortgage
underwriting and processing augmented by automation.6
How does the FinTech business model affect the mortgage origination process in prac-
tice?7 Online applications mean that a borrower can be approved for a loan without talking
to a loan officer or visiting a physical location. The online platform is able to directly access
the borrower’s financial account statements and tax returns to electronically collect informa-
tion about assets and income. Other supporting documents can be uploaded electronically,
rather than by being sent piecemeal by mail, fax or email.8 This automates a labor-intensive
process, speeds up information transfer, and can improve accuracy, for example by elimi-
nating transcription errors (Goodman 2016, Housing Wire 2015). The online platform also
allows borrowers to customize their mortgage based on current lender underwriting standards
and real-time pricing.
Supporting and complementing this online application process, FinTech mortgage lenders
6 The discussion of institutional details in this section draws upon extensive conversations with mortgageindustry professionals, market economists within the Federal Reserve, and other industry experts. For moredetail on how technology is reshaping the mortgage market, see Oliver Wyman (2016), The Economist(2016), Goodman (2016), Goldman Sachs Research (2015) and Housing Wire (2015, 2017).
7Obtaining a purchase mortgage involves three main steps (see e.g., Freddie Mac, 2016). (1) An initialapplication and pre-approval—a pre-approval letter is nonbinding, but is indicative of a borrower’s creditcapacity and is often required to make an offer on a home. (2) Processing and underwriting, which is usuallyundertaken after a property has been identified and sale price agreed upon. This step involves verificationof all supporting documentation, often involving many interactions between the processor, loan officer andborrower, and can take from 1-2 days to several weeks or more (known as the “turn time”). (3) Closing,when the funds and property deed are transferred. FinTech lenders partially automate the first two stepsand allow them to be completed online. Recently, some lenders have also digitized the third and final stepby creating an electronic mortgage note (e.g., see Quicken Loans, 2017a).
8FinTech lenders also offer email and phone support. The key distinction to traditional lenders is thatborrowers can process the entire application without using paper forms, email, or phone support. In practice,the degree of automation is much larger among FinTech lenders relative to other lenders, even if some FinTechborrowers communicate via email or over the phone with their lender.
6

have developed “back-end” processes to automatically analyze the information collected dur-
ing the application. For example, borrower information is compared against employment
databases, property records, as well as marriage and divorce records; additionally, algo-
rithms can examine whether recent bank account deposits are consistent with the borrower’s
paystubs. Optical character recognition and pattern recognition software can be used to
process documents uploaded by the borrower and flag missing or inconsistent data. These
systems make the mortgage underwriting process more standardized and repeatable, and
may help identify fraud (Goodman, 2016).
This approach does not eliminate the role of human underwriters, but does make mort-
gage processing less labor-intensive. In contrast with more hub-and-spoke loan origination
operations that put loan officers and underwriters in branches, FinTech lenders centralize
their processing operations, which allows for labor specialization in the underwriting process.
Lenders have told us anecdotally that this makes it easier to train new workers and to adjust
labor supply in response to demand shocks.
Against these advantages, there may also be important disadvantages of a more auto-
mated approach to mortgage underwriting. For example, poorly designed online platforms
may confuse borrowers or lead to errors, and a lack of personal interaction may impede
the transmission of soft information, resulting in less effective borrower screening or credit
rationing.9 Our empirical analysis examines both the benefits and costs of the FinTech
mortgage lending model.
We emphasize that automation and online applications are not entirely new.10 For exam-
ple many lenders in recent years have allowed borrowers to initiate a mortgage application
online. However, the online application is often just a first step before directing applicants to
speak to a loan officer who then initiates a more traditional loan application process. Simi-
larly, although online mortgage rate comparison services such as LendingTree and BankRate
have been a feature of the mortgage market for many years, these services simply provide
information and connect borrowers and lenders; they do not automate the mortgage origi-
9A substantial academic literature has emphasized the role of soft versus hard information in lending(e.g., Petersen and Rajan, 2002; Stein, 2002).
10More generally, the use of information technology in mortgage lending and servicing is not a recentphenomenon—see e.g. LaCour-Little (2000) for a discussion of developments in the 1990s.
7

nation process or put it online.
The emergence of several stand-alone FinTech firms as major lenders over the last few
years is a strong indicator that fundamental change is underway. These firms are at the
technological frontier and focus exclusively on the new business model. In contrast, estab-
lished lenders with branch-based mortgage origination processes face significant obstacles
in recalibrating their operations away from branches and loan officers. For this reason, the
vanguard of FinTech lenders is composed of nonbanks, which do not have access to deposit
finance and therefore do not retain originated loans on balance sheet. Like other nonbanks,
the vast majority of FinTech lenders sell their loans through established channels supported
by government guarantee programs (FHA, VA, Fannie Mae, and Freddie Mac).
That said, a significant and growing number of mortgage lenders are at present incorpo-
rating aspects of the “FinTech model,” and the current distinction between FinTech origi-
nators and other firms, including banks, may be temporary. The current market structure
presents a window of opportunity to study the impact of FinTech on mortgage origination,
and to draw inferences about what is likely to happen to the mortgage industry as a whole
as these technologies diffuse more broadly.
B. Classifying FinTech lenders
For our empirical analysis, we classify an originator as a FinTech lender if they enable a
mortgage applicant to obtain a pre-approval online. We believe this classification distin-
guishes FinTech lenders from more traditional mortgage originators that may use “online
applications” for marketing purposes but still require interaction with a loan officer.
Our classification should be viewed as a proxy, since an online application platform is only
one dimension of the FinTech “model”. Even so, it is an important component, and is also
easily measurable in a consistent way across a large number of mortgage lenders. In practice,
the set of lenders classified as FinTech by our approach matches up well with firms considered
by industry observers and media to be at the frontier of technology-based mortgage lending.
It also matches quite closely with the independent classification by Buchak et al. (2017).11
11Our classification and empirical analysis closely follows the methodology in our proposal to the RFSFinTech initiative submitted on March 15, 2017. Our proposal was submitted before we and Buchak et al.
8
We implement our classification by first compiling lists of the top 100 non-bank lenders
for purchase loans and for refinancings over the analysis period.12 The resulting list includes
135 lenders. We then manually initiate a mortgage application with each lender and analyze
whether it is possible to obtain a pre-approval online. Most lenders halt the online application
prior to the pre-approval and ask the borrower to directly contact a loan officer or broker. We
classify the lender as a FinTech lender if we are able to continue with the online process until
we get to the pre-approval decision that is based on a hard credit check of the applicant’s
credit score.
Our final classification is based on an analysis completed in June 2017. To construct a
panel, we go back in time using a database that archives websites (“Wayback Machine”).
Using the database from 2010 to 2017, we evaluate at which point in time a lender appears
to have adopted their qualifying online lending process. We cannot always conduct a full
evaluation because online application processes often rely on a technological process that
evaluates information in real time. However, we can use the archived website to evaluate
when a lender adopted an application which resembles the qualifying application in 2017.
We use this information to determine the year in which a lender adopted a FinTech lending
model. We corroborate our results using industry reports.13
FinTech lenders exhibit several other distinguishing characteristics relative to their com-
petitors. For example, FinTech firms typically require a Social Security Number and conduct
a hard credit check online, unlike most traditional mortgage originators we classified. Fin-
Tech lenders also tend to orient their marketing efforts around their website or mobile phone
app. In particular, FinTech lender advertisements emphasize the functionality and ease of
use of their website or app, and direct borrowers to those platforms. Other lenders may in-
clude their website in their marketing material but do not emphasize it to the same degree,
and may primarily use it for “lead generation.”
Figure 1 plots the number of FinTech lenders by year based on our classification. The
became aware of each others’ work and pre-dates the first public version of their working paper.12We also examined several top depository bank lenders, but did not classify any of them as FinTech
through 2016 (although some began offering online pre-approvals in 2017). As discussed above, entrenchedbank business models may slow their ability to integrate new technology into their existing branch-basedmortgage origination process.
13We find no instance of a lender that stopped offering online processing during the analysis period.
9

number increases from two firms in 2010 to 18 lenders by 2017. In Table 1 we list the top 20
lenders in 2016, along with other FinTech lenders in the data in that year. The three largest
originators identified as FinTech lenders are Quicken, LoanDepot.com, and Guaranteed Rate.
All of the primary analyses in this paper use this classification, although we have verified
that our main results are robust to the alternative classification of Buchak et al. (2017).14
Table 2 provides summary statistics of mortgage originations and applications, in to-
tal and by lender type, based on data collected under the Home Mortgage Disclosure Act
(HMDA). HMDA data report characteristics of individual residential mortgage applications
and originations from the vast majority of U.S. banks and non-banks. Data include the
identity of the lender, loan amount, property location, borrower income, race and gender,
though not credit score or loan-to-value ratio (LTV). Based on known local conforming loan
limits, we impute whether each loan has “jumbo” status and thus cannot be securitized by
Fannie Mae, Freddie Mac, or Ginnie Mae. The processing time of loan applications, one of
our main outcome variables of interest, can only be computed from a restricted version of
the dataset available to users within the Federal Reserve System.15 We include loans with
application dates between January 2010 and June 2016.16 First, we see that in terms of basic
risk characteristics, non-bank lenders originate loans to borrowers with relatively low-income
and high loan to income (LTI) ratio relative to banks. Similarly, FinTech lenders and other
non-bank lenders have a much higher share of FHA and VA loans, but a lower share of jumbo
mortgages, than banks. FinTech lenders originate many more refinance loans (as opposed
to loans used for a home purchase) than banks and other non-bank lenders.17
We also see that FinTech lenders have shorter average processing times than both banks
and other non-bank lenders. In the next section, we study whether this result persists once
14Our classification is similar tho one proposed by Buchak et al. (2017). There are only minor differenceswith respect to the classification of a few smaller lenders.
15This restricted version of the data records the exact date the lender receives an application, as well asthe date on which the application was resolved (e.g. origination of the loan or denial or withdrawl of theapplication). The publicly available HMDA data only contains the year. All other variables are the same.
16We end the sample in June because for applications submitted later in the year, processing times maybe biased downward. This is due to the fact that only applications for which an action (origination, denial,etc.) was taken by the end of 2016 are included in the HMDA data available at the time of writing.
17As Buchak et al. (2017) also note, FinTech lenders have a higher fraction of applications where appli-cant race or gender information is missing. We understand this is because borrowers can complete onlineapplications without being required to provide this information.
10

we control for loan characteristics and location-time fixed effects. In Section VII we will
study differences in borrower and location characteristics between FinTech and non-FinTech
mortgages more systematically, building on Table 2.
III Is FinTech Lending Faster?
Our first research question is whether FinTech lenders are able to process mortgage appli-
cations more quickly than other lenders. We measure processing time by the number of
days between application and origination date, as in Fuster et al. (2017b). We estimate the
following OLS regression using loan-level HMDA data:
Processing Timeijct = δct + βFinTechj + γControlsijct + εijct (1)
where Processing Timeijct is for loan i issued by lender j in census tract c for an application
received in month t, FinTechj is an indicator variable equal to one for FinTech lenders and
zero otherwise, δct is a vector of census-tract-month fixed effects, and Controlsijct includes
loan and borrower controls.18 We winsorize the top and bottom 1% of processing times and
cluster standard errors at the lender-month level.
Our regression includes a large number of observable loan and borrower characteristics
to control for factors other than lender efficiency that may affect processing time (e.g., local
laws, housing market conditions, the complexity of the loan, borrower, and property, and
the speed of obtaining a property appraisal). We expect that our rich set of controls should
account well for these factors. In particular, census-tract-month fixed effects control in a
highly disaggregated way for common geographic and time variation in processing times.
We conduct the analysis separately for home purchase mortgages and refinances because the
latter do not require the homeowner to move and the application process is simpler.
18The control variables are the natural logarithm of borrower income, the natural logarithm of total loanamount, indicator variables for race and gender, an indicator variable for whether there is a coapplicant,an indicator variable for whether a pre-approval was requested, indicator variables for the occupancy andlien status of the loan, indicator variables for property type, indicator variables for whether the loan isinsured by the FHA or the Department of Veterans Affairs (VA) and an indicator variable for loans abovethe conforming loan limit (i.e. jumbo loans), and an indicator variable in case applicant income is missing.
11
A. Processing time results
Panel A of Table 3 presents the results for purchase mortgages. In column (1), we find that
FinTech lenders process loans 7.9 days faster than non-FinTech lenders. This effect is large,
corresponding to 15% of average home purchase processing time of 52 days. The result is
slightly larger in magnitude and remains statistically significant when we include loan and
borrower controls (col. 2), census tract-month fixed effects (col. 3), and both (col. 4, where
the estimated effect corresponds to 18% of the average processing time). The results are also
robust to dropping deposit-taking banks from the sample (col. 5), which suggests that the
results are not driven by regulatory factors or the different funding model of banks.
Panel B of Table 3 finds even larger effects for refinances. Across specifications, FinTech
lenders process mortgages 9.3 to 14.6 days faster than other lenders. The effect corresponds
to 17%-29% of the average refinance loan processing time of 51 days. Again, the result is
robust to comparing FinTech lenders only to other nonbanks, which suggests that it is not
driven by regulation or funding. The FinTech advantage for refinance loans might be larger
because refinances offer more scope for automation than home purchase loans. For example,
home mortgage loans always require an appraisal, which is administered locally and is not
(yet) automated. This interpretation is consistent with the fact that FinTech lending growth
has been larger for refinances relative to home purchase loans.19
While these regressions capture average effects, it is instructive to study the entire dis-
tribution of processing times across lender types. We do so in Figure A.1 in the Internet
Appendix, where we plot the cumulative distributions of processing times for both purchase
and refinance mortgages, after accounting for census-tract-month fixed effects and loan char-
acteristics. For purchase mortgages the advantage of FinTech lenders comes primarily from
the right tail (i.e., there are few loans with very long processing times), while for refinances
the entire distribution is shifted to the left. This again suggests that for refinances, it is
more easily possible for FinTech lenders to realize efficiency gains, while for purchase loans
19In unreported results we also condition on whether the loans are FHA or VA insured loans, sinceanecdotally, underwriting rules are less flexible for these loans, possibly constraining the advantages ofFinTech lenders. Indeed, we find for refinances that the FinTech lender advantage is lower by 3 days(relative to a sample of non-government or “conventional” loans). However, we detect no correspondingdifference in FinTech lenders’ processing time advantage among new purchase loans.
12
the scope may be more limited.
B. Additional analysis
One potential concern is that our processing time results are affected by endogenous match-
ing between borrowers and lenders. For instance, if younger borrowers are more likely to
use FinTech lenders and also tend to submit their paperwork faster, FinTech lenders would
appear to process mortgages more quickly, even if they do not have an inherent techno-
logical advantage. Alternatively, FinTech lenders may attract the most complex mortgage
applications, which would attenuate the estimated FinTech processing time advantage.
We emphasize that the coefficient on FinTech lenders is robust across specifications and
samples. If FinTech lenders matched with borrowers or loan types that are easier to process,
then adding the control variables should attenuate the estimated coefficient; instead, the
coefficient tends to get larger with additional controls. To the extent that unobservable
factors that make some borrowers faster than others are also correlated with observables,
this is a first piece of evidence that our results are unlikely to be driven by endogenous
matching or other unobserved variables, but instead represent the direct effect of FinTech
lending on processing times.
To investigate further, we examine whether the FinTech processing time advantage is
driven by “fast borrowers” migrating to FinTech lenders. We implement this test in two
stages. In the first stage, we predict the probability that each loan is originated by a
FinTech lender as a function of loan and borrower characteristics. We then take this predicted
probability and use it as an explanatory variable in a second stage analysis of processing
times among non-FinTech mortgages. If non-FinTech lenders lose their faster customers to
FinTech lenders, non-FinTech processing times should have increased disproportionately for
borrower and loan types with high FinTech penetration (as measured by a high first-stage
probability).
The second stage results are shown in Table A.1 in the Internet Appendix. In our baseline
specification, we find a positive effect of the predicted FinTech probability on non-Fintech
processing times. This is consistent with selection, although the coefficient is not nearly
13

large enough to explain our earlier processing time results.20 In addition, the coefficient of
interest flips sign once we control for lender-by-census tract fixed effects to allow for the
possibility that FinTech lenders have a high market share in areas where traditional lenders
are slow (col. 2 and 4 of the table). In sum, it does not appear that selection effects could
easily explain the large processing time differences we document.
Furthermore, as a direct test of whether FinTech lenders match with “fast” borrowers,
we study whether FinTech originators have gained the highest market share in geographic
locations where processing times were shortest ex ante, measured in 2010 prior to the growth
in FinTech. These results are presented in Section VII. To preview the key result, we in fact
find the opposite; FinTech lenders have become popular in locations where processing times
were originally slow conditional on observables. This is inconsistent with an “endogenous
selection” interpretation of our processing time estimates, and in fact suggests that slow
processing by traditional lenders may be a driver of the growth in FinTech lending.
Summing up, our results suggest that FinTech mortgage lenders are roughly 20% faster
at processing mortgage originations than other lenders; the estimated effects range from 7.5-
9.4 days for purchase mortgages and 9.3-14.6 days for refinances. Several pieces of evidence
suggest that this finding is not due to endogenous borrower-lender matching or other omitted
variable biases.21
IV Is FinTech More Efficient or Just Less Careful?
The faster processing speeds of FinTech lenders could simply be a product of less careful
screening of borrowers, rather than greater efficiency.22 We test this “lax screening” hypoth-
20For instance, the coefficient of 2.5 in column (1) of Table A.1 means that moving from the 1st to the99th percentile in predicted FinTech propensity, corresponding to a difference of 0.335, increases expectedprocessing time by 0.85 days. This is only about one-tenth of the processing time advantage of FinTechlenders as estimated in Table 3. Magnitudes are similar in column (3), which limits the sample to refinances.
21As a “reality check”, our estimates also appear roughly comparable to industry-based estimates of theprocessing-time advantage of technology-based lending. In particular, Quicken Loans (2017b) claims thatimporting income and asset information through their online platform reduces client mortgage processing by12 days on average. Although it is not clear exactly how this statistic is calculated, it is interesting that it isin the same ballpark as our estimate of a 8-14 day difference in processing times between FinTech originatorsand other lenders.
22For instance, using proprietary lender data, LaCour-Little (2007) documents that prior to the financialcrisis, processing times were shortest for non-agency non-prime mortgages. This category of loans subse-
14

esis by studying the ex-post performance of FinTech loans compared to similar mortgages
from other lenders. We focus on FHA lending, which has been the riskiest segment of the
mortgage market in recent years and where we are therefore most likely to detect differences
in loan risk.23 We use two separate sources of publicly available data on FHA mortgage
defaults: segment level data extracted from the FHA Neighborhood Watch Early Warning
System (“FHA NW data”) and FHA loan-level data from Ginnie Mae (“FHA Ginnie Mae
data”). To our knowledge, this is the first academic study to make systematic use of either
of these data sources.24
A. Analysis of default rates in FHA NW data
We start by analyzing default rates on FHA loans using FHA NW data. The data contains
origination volume and default rates for each lender at the national level and by state and
metropolitan statistical area (MSA). The data are available for all FHA loans as well as cer-
tain subcategories including home purchase mortgages, refinances, and mortgages originated
in underserved census tracts.25 The data generally covers the period 2015:Q3 to 2017:Q3,
although state and national data for all loans (not broken down by loan type) are available
over a longer sample period from 2012:Q3 to 2017:Q3.
Default rates are calculated as the share of loans that become at least 90 days delinquent
or are the subject of an FHA insurance claim within a specific time horizon after origination.
The data include rates at one-year (“1 Year Default”) and two-year (“2 Year Default”)
quently experienced extremely high default rates during the crisis.23FHA mortgages require a down payment of as little as 3.5% and are generally made to borrowers with
low credit scores who do not qualify for a prime conforming loan. FHA loans are government-guaranteed,which limits the credit risk for the lender. However the lender is not fully indemnified against risk sincethe FHA can refuse to compensate the lender for credit losses in cases of fraud or other defects in mortgageunderwriting. FHA lenders have also paid out large legal settlements on FHA loans due to breaches of theFalse Claims Act and other laws. As a result of these risks, many large bank lenders have withdrawn fromFHA lending or wound back their participation in the market (see e.g., Wall Street Journal, 2015).
24The FHA Ginnie Mae data are similar to the loan-level data made available by government-sponsoredenterprises (GSEs) Fannie Mae and Freddie Mac. These are analyzed by Buchak et al. (2017), who find littledifference in default probabilities between FinTech and other lenders (for origination vintages 2010-2013).The main drawback of the GSE data is that these prime agency mortgages have experienced very low defaultrates for recent vintages (as they are significantly less risky than FHA loans) so that it may be difficult todetect differences across lenders.
25A census tract is considered underserved by the FHA based on an administrative classification derivedfrom median income and the share of minority households.
15

horizons. In order to control for geographic variation in default rates we scale a lender’s
default rate in each location by the overall default rate in that area. As an alternative to
raw default rates, the data also contain the “Supplementary Performance Metric” (SPM),
which scales a lender’s default rate by a benchmark default rate defined based on the credit
score distribution of the underlying mortgages. Again, we then take the ratio of the lender’s
SPM to the overall SPM in the area. The SPM is only available at the state and national
level and at a two-year horizon after origination (“Mix-Adjusted 2 Year Default”).
Our analysis focuses on the difference in default rates between FinTech lenders and
other lenders. We compute the difference by taking by taking the weighted average of
FinTech relative default rates using origination volume by region and lender as weights and
subtracting one. This measure yields zero if there no differences in default rates between
FinTech lenders and other lenders. We use a difference-in-means test to examine the null
hypothesis that FinTech lender default rates are the same as other lenders.
Table 4 reports the results. Column (1) presents the relative difference in default rates
for FinTech lenders using 1-year default as the default measure. In Panel A, we find that
loans originated by FinTech lenders are 35% less likely to default than comparable loans
originated by non-FinTech lenders. The coefficient is almost unchanged when using MSA-
level data instead of state-level data and when using the 2-year default rate instead of
the 1-year default rate (col. 2). The coefficient remains statistically significant, albeit the
effect is smaller (-25.5%) when using the mix-adjusted default rate, based on the SPM, as
the outcome variable (col. 3). We find quantitatively similar results when restricting the
sample to high-market share regions (Panel B), when considering home purchase loans or
refinances separately (Panel C), for loans to underserved neighborhoods (Panel D), and when
considering a longer sample period (Panel E). Overall, we find no evidence that FinTech loans
are risker than non-FinTech loans; in fact, they appear to default less often.
B. Loan-level analysis of FHA default rates
We complement this evidence with a loan-level analysis of data on FHA mortgages securitized
into Ginnie Mae MBS. The main advantage of the Ginnie Mae data relative to the FHA NW
16

data is that they include a rich set of loan and borrower characteristics (e.g., the borrower’s
credit score and the loan-to-value ratio). This allow us to investigate whether FinTech lenders
target specific borrower types based on their riskiness and whether differences in default
rates can be explained by differences in observable characteristics. A disadvantage of the
Ginnie Mae data is that they only include the identity of the MBS issuer, not the mortgage
originator. Hence, the data do not perfectly identify which loans come from FinTech lenders.
However, the issuer and originator are typically the same and a comparison to HMDA
suggests mismeasurement is concentrated among small lenders.26
Our sample consists of data from September 2013 (when the Ginnie Mae data first become
available) until May 2017. We restrict the sample to 30-year fixed-rate mortgages, which are
by far the most common FHA loan type. We estimate the following OLS regression:
Defaultijst = α + βFinTechj + γControlsijst + εijst (2)
where Defaultijst on loan i by lender j in state s originated in month t is an indicator variable
equal to one if a loan ever becomes delinquent for 90 days or longer over our observation
period, FinTechj is an indicator variable equal to one for FinTech issuers, and Controlsijst is
a broad set of control variables such as origination month or state-by-origination month fixed
effects, loan purpose fixed effects, and other loan controls including borrower FICO score,
loan-to-value ratio (LTV) and debt-to-income ratio (DTI).27 We cluster standard errors at
the issuer-origination month level.
Table 5 presents the results. Column (1) controls for origination-month fixed effects
only and finds that FinTech borrowers are 1.29 percentage points less likely to default than
non-FinTech borrowers, equivalent to 35% of the overall default rate of 3.65%. This result
is very similar to the estimates based on FHA NW data. Column (2) adds loan purpose
fixed effects. The effect declines to 0.91 percentage points, or 27%, but remains statistically
26For some small FinTech lenders, the number of MBS-issued loans is substantially smaller than theirnumber of originated loans in HMDA, implying that they sell a significant portion of their loans to otherfirms before issuance. The effect on identifying FinTech loans should be limited given that this issue primarilyaffects smaller lenders.
27Other loan controls include the log of the loan amount and indicators for the number of borrowers, theproperty type, whether the borrower received down payment assistance, and for whether a loan’s FICO,LTV, or DTI are missing.
17

significant. This result reflects the fact that FinTech lenders issue more refinance mortgages
than home purchase mortgages, and that refinances tend to be less risky (especially those
not involving cash-out). In column (3), we add further loan level controls such as FICO
and LTV. We see that this has only a small incremental effect on the coefficient of interest,
implying that FinTech lenders do not originate loans that are less risky based on these
observable characteristics. Columns (4) and (5) split the sample by loan purpose; the effect
is slightly larger for home purchase mortgages, but is also sizable for refinances.28
C. Are FinTech lenders cream skimming?
Our analysis of default rates finds no evidence that FinTech lenders originate riskier mortgages—
in fact, in the FHA market we find the opposite result. The difference in default rates varies
across specifications but is statistically significant in almost all of them and the magnitude
is economically large—default rates for FinTech-originated loans are about 25% lower in
column (3) of Table 5, which includes the largest set of controls, and ranges between 10-40
percent in the other specifications. The results are robust to using two different datasets
(FHA Neighborhood data and Ginnie Mae loan-level data) and to different sets of controls
for loan, borrower and location characteristics.
Our findings speak directly against the “lax screening” hypothesis. If anything, they sug-
gest that the automated technologies used by FinTech lenders may screen borrowers more
effectively than the more labor-intensive methods used by other lenders (e.g., because the
automated systems directly check databases of original source documents, reducing the pos-
sibility of fraud). This reasoning has been emphasized by industry experts (e.g., Goodman,
2016), and to our knowledge we provide the first systematic evidence to support it.
Although superior screening of credit risk can be viewed as an advantage of FinTech
lending, it may also have negative consequences for some borrowers, or for the government,
due to “cream skimming” of the highest value customers. For example, cream skimming
could lead to ex ante credit rationing by weakening the credit quality of the remaining
28In further (unreported) regressions, we have found that the relative effect size is fairly stable if we repeatthe regressions for each loan origination year 2013-2017. Furthermore, the Ginnie Mae data also containmortgages guaranteed by the Department of Veterans Affairs (VA); for those loans, which default at lowerrates than FHA ones, the relative decrease in default hazard for FinTech-originated loans is again similar.
18

borrower pool—this mechanism is explored by Mayer et al. (2013) in the context of private
subprime mortgage lending. Alternatively, it could shift costs to the government if private
and public lenders compete for borrowers, an argument that has been made in the context
of FinTech lenders like SoFi in the student loan market29.
In the context of mortgage lending in the current environment, it is unlikely that cream
skimming by FinTech lenders has economically significant effects. The reason is that during
our analysis period the vast majority of all risky mortgages in the U.S. are government insured
at a pre-set price, either by the FHA or other government agencies such as the Department of
Veterans Affairs. Consequently, cream skimming by FinTech lenders is unlikely to materially
affect credit access for remaining borrowers, who will still qualify for government insurance.
Even so, we estimate two specifications to investigate possible cream-skimming effects.
First, we examine whether a higher FinTech market share in a location helps to reduce
overall mortgage default risk in that location, as opposed to FinTech lenders just selecting
the lowest-default borrowers from a fixed pool. We also test whether the default advantage
of FinTech lenders diminishes as their market share increases. If the distribution of risky
borrowers is unchanged by the presence of FinTech lenders, then as their market share
increases in an area their performance advantage will diminish, as they expand their lending
to the more risky borrowers.
We present the results, based on the Ginnie Mae data from the previous subsection, in
columns (6) and (7) of Table 5. Column (6) estimates the direct effect of FinTech state-level
market share on default. Although the point estimate is negative, the effect is economically
small and statistically insignificant. This result suggests that there is no discernable effect
of an increased FinTech footprint on the overall default risk of borrowers receiving mortgage
credit. We note that the estimate has large standard errors; it would be interesting to revisit
this analysis in the future when the market share of FinTech lending is larger.
Column (7) adds the interaction of the FinTech lender indicator variable and local Fin-
Tech market share and finds that the coefficient on the interaction is negative and marginally
significant. This result suggests that the better default performance of FinTech mortgages
29See e.g. https://www.bloomberg.com/news/articles/2015-06-10/student-loan-refinancing-
boom-could-cost-u-s-taxpayers-billions.
19

in fact tends to be more pronounced in regions where FinTech has a larger market share. On
the other hand, however, in Panel B of Table 4, we find a lower FinTech default advantage in
markets where the lender has a high market share (although the difference is not statistically
significant, and even in these locations, FinTech default rates remain lower than the market
as a whole).
While somewhat mixed, none of the results suggest a robust positive relation between
market share and risk. In addition, we find no evidence that the lower default rate of FinTech
lenders disappears in locations where their market share is high. In sum, the findings suggest
that the lower default rates associated with FinTech lending is not simply due to positive
selection of low-risk borrowers.
D. Are FinTech lenders charging higher interest rates?
Related, we can also use FHA loan-level data from Ginnie Mae to test whether FinTech
lenders charge higher or lower mortgage interest rates conditional on observables. Results
are shown in Table A.2 in the Internet Appendix. We find that FinTech lenders offer interest
rates which are 2.3bp lower overall—splitting the sample by loan purpose, the effect is 7.5bp
for purchase mortgages and effectively zero for refinances.30 Although these differences
are small in magnitude, the direction of the effect is consistent with the Buchak et al.
(2017) estimates for FHA loans (although they are cautious in drawing inferences from their
results because their FHA dataset includes fewer loan-level controls than the data used here).
However, it contrasts with Buchak et al.’s finding that FinTech lenders charge higher rates
for GSE mortgages. One possible explanation that could account for both sets of results,
and is in line with some of Buchak et al.’s other evidence, is that lower-income borrowers,
who are more likely to obtain FHA loans, are more price sensitive and less willing to pay a
premium for convenience.
30We note that these coefficients are not particularly stable if we allow them to vary over time — in sometime periods the FinTech coefficient is positive and significant, but over others it is negative and significant.A potential explanation is that movements in market interest rates may be reflected at different times onrates on originated loans between FinTech and other lenders, due to differences in processing times. TheGinnie Mae data, or the GSE data used by Buchak et al. (2017), does not easily allow one to cleanly controlfor this.
20

V Is FinTech Lending More Elastic?
We next study whether FinTech lenders are better able to accommodate shocks to mort-
gage demand. Mortgage application volumes in the U.S. fluctuate enormously over time,
primarily due to movements in interest rates that can lead to “refinancing waves.” There is
also substantial cross-sectional variation in demand for new mortgages, for example due to
differential housing market trends.
Managing volatility in mortgage applications is a key challenge for lenders. If a lender
receives more applications than their underwriting process can accommodate, their process-
ing cycle times increase and they risk losing money (and future business) due to loans not
closing in a timely manner. Figure 2, which is similar to evidence in Fuster et al. (2017b),
illustrates two main points. First, as shown in panel (a), there is large variation in the level
of monthly applications, with the peak level being almost three times as high as the trough.
Application volume co-moves closely with borrowers’ average incentive to refinance, here
proxied by the difference between the average coupon rate on outstanding mortgages and
the 10-year Treasury yield. Second, panel (b) shows that fluctuations in median processing
times are sizable (from a low of 37 days to a high of 51 days), and that processing times are
strongly positively correlated with total mortgage applications.31
By automating, centralizing and standardizing much of the underwriting process, FinTech
lenders may conceivably increase the short-run elasticity of lending supply in response to
demand shocks. However, testing whether capacity constraints are less binding for FinTech
lenders presents a clear empirical challenge: the volume of applications a lender receives
is endogenous. For example, lenders may solicit applications when processing constraints
are slack and discourage applications when processing times are expected to be long. Both
behaviors would attenuate the relationship between applications and processing time and
obfuscate differences across lenders.
31One exception: between October and December 2015, processing times increase even though applicationsdecrease. This is most likely due to the implementation of new loan disclosure rules (“TILA-RESPA Inte-grated Disclosure,” or TRID) on October 3, 2015. These new rules required many lenders to adjust their un-derwriting processes, resulting in delays. For more details, see e.g. https://www.wsj.com/articles/new-
mortgage-rules-may-spark-delays-frustration-1443519000.
21
A. Demand shocks and processing time
We identify differences in supply elasticity by exploiting demand shocks that vary application
volumes independent of firm-specific conditions. We use time-series variation in total ap-
plications, which is primarily determined by macroeconomic factors, in particular long-term
interest rates, and is plausibly exogenous to the capacity contraints facing any individual
lender. We test whether FinTech mortgage processing times are less sensitive to variation in
total application volume by estimating the following regression using loan-level HMDA data
from 2010 through June of 2016:
Processing Timeijct = γApplicationst + βApplicationst × FinTechj + αj + δc + θControlsit + εijct (3)
where Processing Timeijct is the number of days between application and closing for mortgage
i from lender j in census tract c and application month t, Applicationst is the log of aggregate
mortgage applications in month t, FinTechj is an indicator variable equal to one for FinTech
lenders, αj and δc are vectors of lender and census-tract fixed effects, and Controlsit includes
borrower and loan controls similar to Table 3 as well as calendar month dummies to account
for seasonality and dummies for loan purpose (purchase versus refinancing). Standard errors
are clustered by lender-month.
Table 6 presents the results. The first two columns consider all originated loans; column
(1) controls only for lender dummies, while column (2) includes additional controls for loan
and borrower characteristics, location, and month. We find that FinTech lenders are about
half as sensitive to aggregate mortgage application volumes as other lenders. Quantitatively,
a 10% rise in overall application volume increases processing time by 1.3 days for non-FinTech
lenders but only 0.7 days for FinTech firms (based on column 2). Column (3) restricts the
sample to refinances, the market where FinTech lenders specialize and where interest rates
matter most for demand. We find that processing times for refinances are more sensitive
to aggregate volumes, but again FinTech lenders are only half as sensitive. Column (4)
considers all applications, including denied and withdrawn applications; again, the results
are similar. All results are statistically significant at the 1% level. Columns (5)-(7) repeat the
prior three specifications but restrict the sample to nonbanks. The degree to which FinTech
22

lenders are less sensitive to aggregate applications is not as large in this sample but the
magnitudes are still economically meaningful. FinTech lenders are 20-40% less sensitive to
aggregate volumes relative to nonbanks, again statistically significant at the 1% level except
for column (5), where p = 0.14.32
The differential sensitivity of FinTech lender processing times to application volume is
also illustrated visually in Figure 3. This binned scatter plot confirms that FinTech lenders
have shorter processing times on average, as already shown in Section III. More impor-
tantly, processing time for Fintech lenders is also less sensitive to demand for new mortgages
compared to banks and (to a lesser extent) other non-bank lenders. This lower sensitivity is
particularly apparent at the highest levels of application volume (when aggregate application
volume exceeds 1.2 million mortgages per month).
B. Alternative demand shocks and processing time
We repeat the analysis using the weighted average coupon on the universe of fixed-rate MBS
less the 10-year Treasury yield (“Refi Incentive”) as our measure of mortgage demand, in-
stead of log application volume.33 Our findings, presented in columns (1)-(3) of Table A.3 in
the Internet Appendix, are similar to those discussed above. A higher refinancing incentive
is significantly correlated with longer processing times across specifications, but processing
times for FinTech lenders are significantly less sensitive, if anything by a larger proportion
than in our main results. The consistency with our earlier findings is sensible given that
we show in Figure 2 that refinancing incentives are the key determinant of mortgage appli-
cation volume. The result does, however, address any concerns that our earlier results are
affected by idiosyncratic shocks to individual large lenders that are large enough to influence
aggregate applications.
As alternative approach, we also construct a “Bartik-style” index of exposure to local
fluctuations in mortgage application volume based on the geography of lender activity. The
32In unreported results, we consider specifications with time fixed effects and draw similar conclusions.While it absorbs all time-series variation, this alternative specification does not allow us to observe theuninteracted coefficient on aggregate application volume.
33As in Fuster et al. (2017b), we use the 10-year Treasury rate rather than a market rate on new mortgagesin order to prevent endogeneity to concurrent supply conditions in the mortgage market.
23

index is calculated as the log of the weighted sum of county-level mortgage applications in
month t, where the weights are the lender’s average market shares in each county measured
over the entire sample period. The identification assumption is that application volumes in
a geographic area are exogenous to any given market participant’s share. We present the
results in in columns (4)-(6) of Table A.3 in the Internet Appendix. Processing times are
positively correlated with the proxy, although once again, less so for FinTech lenders when
we consider refinancing loans and all applications. There is no statistically significant effect
for the sample of all originated loans (col. 4).
Taking together, results based on two alternative measures of loan demand indicate that
FinTech lenders are less sensitive to exogenous demand shocks than other lenders, supporting
our main findings in Table 6.
C. Demand shocks and application denial rates
A possible concern is that our results may reflect credit rationing. If FinTech lenders avoid
capacity constraints by becoming more selective and rationing credit when total mortgage
demand rises, their processing times may seem less sensitive to demand even if they are
not actually more elastic. We test this hypothesis by examining whether denial rates for
FinTech lenders are differentially sensitive to aggregate application volume. The regression
specification is identical to Eq. (3) above, except that the left-hand side variable is an
indicator variable equal to one if a loan application was denied and zero otherwise. The
sample includes all applications that were either approved or denied.
Table 7 presents the results. We find that FinTech lenders reduce denial rates by 1.1%
percentage points for each 10% increase in application volume (col. 1). The effect is similar
when focusing on refinance mortgages (col. 2), restricting the sample to nonbanks (col. 3),
and focusing on refinance mortgages among nonbanks (col. 4). These results are inconsistent
with credit rationing and instead provide further evidence that FinTech lenders’ credit supply
is more elastic than those of other lenders.34
34In unreported results, we find that FinTech lenders on average have a roughly 2.5 percentage point higherdenial rate than banks (though the difference is statistically insignificant), and a 3.5 percentage higher denialrate than other nonbank lenders (significant at p < 0.1), conditional on our typical set of controls. Thiscould reflect more stringent screening, or alternatively that with online applications, there is no “filtering”
24

We point out that the direct effect of application volume on denial rates is negative
across all specifications. This may seem counter-intuitive, although it likely reflects the fact
that when applications rise due to changes in interest rates, the average credit quality of
applicants improves.35
D. Demand shocks and origination volumes
We also analyze whether mortgage origination volumes for FinTech lenders respond differ-
entially to changes in total applications. Analysis of quantities over our short sample period
is difficult because there are differential trends in application volumes across lender types
and across individual firms within a type. We estimate a model in first differences to partial
out these trends:
∆Originationsjt = γ∆Applicationst + β∆Applicationst × FinTechj + αj + εjt
where Originationsjt is the log of originated applications (by lender j for applications in
month t) and Applicationst is the log of aggregate application volume. Lender origination
changes are winsorized at the top and bottom 1% to mitigate the impact of extreme outliers.
We include lender fixed effects, αi, to allow for lender-specific differences in the average
growth rate over the analysis period. We restrict the sample to lenders who rank in the top
500 in volume at some point during the sample period.
We find no meaningful difference in origination sensitivity for FinTech lenders. As shown
in Table 8, FinTech origination volume appears equally sensitive to changes in aggregate
application volumes as those of all other lenders (col. 1 and 2) and nonbanks (cols. 3 and
4). Hence, similar to our results on denials, we find no evidence that the lower sensitivity
of FinTech lender processing times comes at the expense of lower originations due to credit
rationing; conversely, though, we do not see an obvious increase in origination growth for
by a loan officer that may discourage borrowers from applying when their chances of approval are low.35In line with this interpretation, Fuster and Willen (2010) show that denial probabilities fell for all
income levels in the wake of the first MBS purchase announcement by the Federal Reserve in late 2008(when application volumes surged), and that average FICO scores (which are not in HMDA) increasedsharply.
25

FinTech lenders when application volume rises. Overall, we are cautious about drawing
strong conclusions from this analysis as it is quite difficult to establish lender-type specific
effects given the strong and nonlinear upward trend in the FinTech lender market share
during this period.
VI FinTech and Mortgage Refinancing
This section examines whether the presence of FinTech lenders affects mortgage refinancing
behavior by borrowers. Prior work has shown that many borrowers do not refinance their
fixed-rate mortgages optimally; they commit errors either by failing to refinance when it is
in their financial interest to do so, or by refinancing even though the costs of doing so exceed
the benefits (e.g., Campbell, 2006; Agarwal et al., 2015; Andersen et al., 2015; Keys et al.,
2016). In addition to behavioral factors, intermediation frictions in the mortgage market
also contribute to inefficient refinancing patterns (e.g., Agarwal et al., 2017; Bond et al.,
2017; Scharfstein and Sunderam, 2016). These frictions weaken the “refinancing channel” of
monetary policy (e.g., Beraja et al., 2017; Di Maggio et al., 2016; Wong, 2016). Examining
the effect of FinTech on refinancing is thus important, since this is one channel through
which technological progress in the mortgage industry may have real effects on the economy.
Industry reports and academic research indicate that mortgage-backed securities backed
by FinTech loans do exhibit faster prepayment speeds than pools from other lenders, con-
sistent with an effect of FinTech on the speed of refinancing (e.g., Goldman Sachs Research,
2016; Buchak et al., 2017). However, it is unclear whether this fact reflects faster-prepaying
borrowers selecting into mortgages from FinTech lenders, or whether FinTech lending directly
affects the likelihood of refinancing, thereby potentially affecting aggregate refinancing be-
havior. If FinTech mortgage lending does affect the market-wide propensity to refinance,
an important follow-up question is whether this is due to a reduction in errors of omission
(meaning that more borrowers who should refinance do so), or instead reflects an increase
in errors of commission (more borrowers refinance even when they should not). Below, we
assess this based on the optimal refinancing decision rule of Agarwal et al. (2013).
To measure refinancing behavior, we use data from Equifax’s Credit Risk Insight Servicing
26

McDash (CRISM) dataset, which merges McDash mortgage servicing records from Black
Knight with credit bureau data from Equifax. The sample period is January 2010 through
June 2016. The CRISM dataset provides information on loan and borrower characteristics
such as FICO score, CLTV, interest rate, and loan term, and features borrower identifiers
that allow us to track a borrower across loans and thereby identify mortgage refinancing.36
We focus on the 500 largest counties by loan volume. Details on the sample construction and
how we measure refinancing are provided in Section D of the Internet Appendix, where we
also confirm that the average refinance propensity we measure in our data is closely aligned
with variation over time in the volume of of refinancing loans in HMDA.
A. Refinancing propensity
We measure the effect of FinTech lending on monthly refinancing propensities using the
following OLS regression:
Refi Propensityc,t = αc + αt + β · FinTechSharec,t−s + Γ · Xc,t + εc,t (4)
where Refi Propensityc,t is the share of mortgages in county c in month t that are refinanced
and FinTechSharec,t−s is the one-quarter-lagged four-quarter moving average market share
of FinTech mortgage lenders among refinance loans in a county. We include county fixed
effects, αc, to control for fixed unobservable differences in refinancing speeds across counties
and month fixed effects, αt, to control for aggregate conditions.37 The time-varying county-
level controls Xc,t include average FICO score, average CLTV, the average interest rate on
outstanding loans, and the share of outstanding loans that are FHA or VA loans. We run
the regressions separately for the sample of all outstanding loans, and restricting to 30-year
36CRISM has previously been used to study refinancing by Beraja et al. (2017) and Di Maggio et al.(2016).
37Market shares are calculated based on HMDA. Results are similar if we use all loans, rather than justrefinances, to calculate the market share (although we view this alternative approach as less conceptuallyappealing, because composition effects imply that the overall FinTech market share will be affected by therelative volume of purchase loans versus refinances, which in turn is related to our outcome variable). Marketshares are calculated on a volume-weighted basis, although results are similar if we use loan-count weightedshares instead. Similarly, our results are robust to using alternative timing conventions, such as the shareover the previous calendar year.
27
FRMs only. We cluster standard errors by county.
Table 9 shows that there is a positive and strongly statistically significant association
between refinancing propensities and FinTech market share. The estimate of 0.689 in column
(2) implies that an 8 percentage point increase in FinTech market share (corresonding to
moving from the 10th to 90th percentile of county averages in 2015) is associated with a
0.055 percentage point increase in the refinancing propensity, about a 10% increase relative
to the average monthly refinancing propensity over this time period of 0.54%. Thus, the
magnitude of the effect is economically meaningful.38
Figure 4 further illustrates the effect. Here we sort the counties into fixed terciles based
on their FinTech market share in the middle of our sample period (between mid-2012 to
mid-2013). We then plot the average refinance propensity in each tercile over time. We see
that in 2010, before the growth in FinTech lending, the tercile of counties where FinTech
lenders subsequently gained the most market share has the slowest refinancing speeds. The
refinancing propensity across the three terciles converge over time, however, coincident with
the growth in FinTech lending. This suggests that FinTech mortgage lenders have helped
“slow” refinancing counties to “catch up.”
In summary, our results show that the faster prepayment speeds on FinTech mortgages
are also reflected in overall market-wide local refinancing propensities, rather than just being
due to a selection of “fast” borrowers into FinTech loans. As a caveat on our results, we note
that, although our regressions condition on county and time fixed effects, the differential
growth in FinTech market share across counties may not be exogenous with respect to
refinancing propensities. For instance, it is possible that FinTech lenders predicted correctly
which geographic regions still had the most potential for higher refinancing volumes, and
advertised and expanded most intensively there. At the least, however, our results suggest
that a higher presence of FinTech lending leads to faster mortgage refinancing, perhaps by
reducing the transaction or time costs of refinancing.39
38We have also replicated these regressions using HMDA data, where we use the log of the number ofrefinance loans originated in a county-month as the dependent variable. The lagged FinTech market share(controlling for county and month fixed effects) is again positively and significantly associated with refinanceoriginations, and the magnitude of the effect is comparable to the estimates in Table 9.
39Our findings here have an interesting parallel to earlier work by Bennett et al. (2001), who find evidencethat technological innovation in the 1990s reduced refinancing frictions and increased mortgage refinancingspeeds.
28

B. Refinancing optimality
We next examine whether the increase in refinancing speeds documented above is associated
with more optimal refinancing decisions. In other words, is it driven by higher refinancing
by borrowers with a high mortgage coupon rate relative to the available rate on new loans,
and who thus realize large savings in interest costs by refinancing (fewer errors of omission)?
Or is it due in large part to borrowers who refinanced more frequently but should not have
done so because the interest savings were small and outweighed by the costs of refinancing
(more errors of commission)?
To determine the breakeven interest rate differential beyond which a borrower should
refinance, we use the “square-root rule” of Agarwal, Driscoll, and Laibson (2013), henceforth
ADL.40 For this analysis, we restrict the sample to 30-year FRMs, since the ADL optimality
calculation was derived for FRMs; it does not apply to adjustable-rate loans. We note
that the ADL calculation embeds a number of assumptions about the costs and benefits of
refinancing; among these, it does not account for other common refinancing motives, such
as cashing out home equity, shortening the term of the loan, or refinancing from a mortgage
type that requires mortgage insurance (such as FHA loans) to one that does not. While the
ADL benchmark is very useful, it is ultimately a simplification.
Based on the ADL rule, we find, similar to Keys et al. (2016), that at certain points over
our sample period, a lot of borrowers should refinance. For instance, in late 2012, about 60%
of all 30-year FRM borrowers in our sample should have refinanced according to the ADL
benchmark, yet only a significantly smaller percentage did so. However, similar to Agarwal
et al. (2015), we find that among refinances that do occur, more than half are executed at a
rate differential that is too small when assessed against the ADL rule. Thus, at least when
compared to this benchmark, there is substantial scope for enhanced refinancing efficiency.
In Table 10, we estimate loan-level regressions similar to the county-level specifications
from above, but now separating outstanding mortgages into different bins depending on
how “in the money” the refinancing option is. Specifically, the “refi incentive” shown in
40The square-root rule is a second-order approximation that comes close to the (more complicated) optimaldecision rule derived by ADL. As inputs to the calculation, we require assumptions on discount rates, taxrates, moving probabilities, interest rate volatility, and (most importantly) the upfront costs associated withrefinancing; we use the same parameter values as ADL’s baseline calibration (following also Keys et al. 2016).
29
the table is equal to the difference between the outstanding mortgage rate and current
market rate, minus the optimal refinancing differential according to ADL.41 For instance, if
a borrower is currently paying 6.5%, the market interest rate is at 4.5%, and the optimal
refinancing differential is 1.5% based on the ADL formula, the borrower would have a 0.5%
positive refinancing incentive. If the market rate increases to 5.5%, the refinancing incentive
would become negative. Even though a refinancing in this situation would still reduce the
borrower’s monthly payments, the savings would not be sufficient to outweigh the fixed costs
of refinancing and the loss of option value.
Column (1) shows that for borrowers where the refinancing option is more than 1 per-
centage point out of the money, a higher local FinTech share has a marginally negative effect
on the likelihood of refinancing. The effect of a higher FinTech share then becomes positive,
and is highest for borrowers that are within 50 basis points of their optimal refinancing
differential (columns 3 and 4). The effect size then decreases again somewhat for borrowers
that have a large refinancing incentive according to ADL; these borrowers in many cases
have suboptimally failed to refinance for a long period of time (given that the refinancing in-
centive is driven by market interest rates, which drift only slowly through time). In industry
jargon, these borrowers are sometimes called “woodheads” (Deng and Quigley, 2012).
The results imply that an increased presence of FinTech lenders is most strongly asso-
ciated with higher refinancing when the borrower’s incentive to refinance is either “at the
money” or just “in the money.” It does not appear that FinTech lenders induce an increase
in grossly inefficient refinancings (if anything, the reverse is true), although they also do not
spur a large increase in refinancing for the borrowers who would gain the most from doing
so.
We present additional evidence in Table A.4 of the Internet Appendix. Specifically we
examine refinances from 30-year FRMs to new 30-year FRMs, and find that a higher local
FinTech share is associated with a higher fraction of refinances that would be classified as
optimal; larger decreases in the interest rate a borrower is paying; and a higher fraction of
cash-out refinancings.
41The FRM market rate is measured using the 30-year FRM rate from Freddie Mac’s Primary MortgageMarket Survey, which is a standard source for academic research and policy analysis.
30

In sum, the results suggest that a higher share of FinTech lending is associated not
just with faster refinancing, but also more optimal refinancing decisions. However, this
effect appears somewhat weaker for the borrowers that would most benefit from additional
refinancing. Such borrowers may be less financially literate; we show in the next section
that proxies for financial literacy are negatively correlated with takeup of mortgages from
FinTech lenders. In some cases seemingly “woodhead” borrowers may face other obstacles
that prevent refinancing (e.g., a significant decline in income since the original mortgage was
received). To the extent that an increased FinTech share in the market overall continues to
lead to faster refinancing, it is in fact possible that borrowers who themselves are limited
in their sophistication or are otherwise unable to refinance may be worse off: in equilibrium
faster prepayment speeds will be priced in MBS valuations, which could feed through to
higher market mortgage rates.
VII Who Borrows From FinTech Lenders?
The market share of FinTech lenders varies significantly by geography and across segments
of the mortgage market.42 In this section we estimate a simple model of the likelihood of
borrowing from a FinTech mortgage lender as a function of loan, borrower and location
characteristics. We then compare the cross-sectional patterns in the data to a number of
hypotheses about the drivers of the growth in FinTech mortgage borrowing.
We estimate a loan-level linear probability model using pooled HMDA data on mortgage
originations from 2010 to 2016:
FinTechi,c,t = αt + β · Controlsi,c,t + Γ · locationc + εl,c,t (5)
where FinTechi,c,t is equal to 100 if mortgage i in census tract c originated at time t was orig-
42Table 2 provides univariate summary statistics about the characteristics of mortgages from FinTechlenders. Figure E in the Internet Appendix maps the FinTech market share of mortgage originations in2010 and 2016. This map highlights the substantial geographic variation in the market share of FinTechlenders, as well as the widespread growth in technology-based lending over our sample period. One limitationof HMDA is that market coverage outside of MSAs may be more limited, because very small lenders andlenders that do not operate in MSAs do not need to report. However, our regression results in this sectionare robust to restricting the sample to MSAs.
31

inated by a FinTech lender and zero otherwise, αt is a vector of time dummies, Controlsi,c,t
is a set of loan and borrower characteristics drawn from HMDA, and locationc is a set of
local geographic and socioeconomic variables measured at the census tract or county level,
drawn from a variety of sources including the U.S. Census, American Community Survey
and the FRBNY consumer credit panel. These location variables are measured in 2010, or
otherwise as early in time as possible, to minimize any concerns about reverse causality.
Data definitions and sources are provided in the Data Appendix.
We estimate this model separately for purchase mortgages and refinances, because the
determinants of demand may be quite different between the two, and because the market
share of FinTech lenders is significantly higher for refinances (Table 2). Since differences in
borrower characteristics between FinTech lenders and banks may be driven by regulatory
factors, we present each specification both including and excluding mortgages from banks.
In the specifications excluding banks, FinTech lenders are compared to other nonbanks, who
are regulated similarly and have the same funding model.
A. Results
Estimates are presented in Table 11. Each continuous right-hand side variable is normalized
to have a standard deviation of one, so that magnitudes can be compared across variables.43
Below, we discuss the cross-sectional patterns relative to the predictions of four sets of
potential drivers of the growth in FinTech mortgage lending: (i) access to finance, (ii)
technology adoption and financial literacy, (iii) Internet access, and (iv) local mortgage and
housing market conditions.
Access to finance. We find no strong evidence that FinTech lenders disproportionately
cater to financially constrained borrowers (e.g., borrowers with low incomes or poor credit
43Beyond the main variables of interest reported in the table, regressions also control for loan size (in logs),dummies for loan type (jumbo, FHA, VA), dummies for coapplicant and investor loan, additional individual-level race dummies, state dummies, and dummies for missing values for each variable with incomplete datacoverage. See Internet Appendix F for a full table of results including these variables. The table in theInternet Appendix also presents results of univariate regressions in which the FinTech dummy is regressedindividually on each right-hand-side variable. The only additional control included in these univariate re-gressions is the vector of time dummies. Comparing the univariate and multivariate results helps to showwhich results are robust to the inclusion or exclusion of other variables.
32

histories), particularly compared to other nonbanks. Although the FinTech market share
is higher in census tracts where mortgage borrowers have lower average credit scores, the
results for income and the share of FHA/VA-insured mortgages are mixed depending on
the type of loan and comparison group.44 As shown in Section IV, FinTech mortgages also
have comparatively lower default rates on FHA loans, suggesting they are not targeting the
riskiest borrowers. Nonbank lenders overall, including FinTech lenders, originate a signifi-
cantly higher share of FHA and VA loans than banks, however (see Table 2 or the Internet
Appendix). Buchak et al. (2017) attribute the low levels of bank FHA lending to regulatory
and legal factors. FinTech lenders attract a higher share of female borrowers, although the
share of black or hispanic borrowers is lower in most specifications.45
Also related to access to finance, we test whether FinTech borrowing is higher in census
tracts with few physical bank branches. We measure branch access as the number of bank
branches within a 25 mile radius of the geographic midpoint of the census tract, based on
FDIC Summary of Deposits data. Even though the FinTech business model is focused on
online applications, we find that the share of FinTech borrowing is increasing in bank branch
density.
Technology adoption and financial literacy. Early technology adoption is often
concentrated in urban areas as well as among younger and more educated consumers. Indeed,
we find that the FinTech market share is higher in more urban neighborhoods, measured by
population density, although only for purchase mortgages (for refinances, the coefficient flips
sign across specifications).
Examining education and age directly, we find that the FinTech market share is increasing
in the fraction of adults with at least a bachelor’s degree. Interestingly, however, the share
of FinTech borrowing is increasing with average mortgage borrower age. Although this may
44Among purchase mortgages, FinTech borrowers have higher incomes either compared to all lenders orjust nonbanks, and are also less likely to be FHA/VA guaranteed than loans from other nonbanks. Forrefinances, FinTech borrowers have lower incomes and the fraction of FHA/VA insured loans is generallyhigher. –see Internet Appendix F for the FHA and VA coefficients
45Our estimates with regard to borrower gender and race should be treated with caution, because asdiscussed earlier, a significant fraction of race and gender fields in HMDA are coded as missing or “NA”for FinTech lenders. As a result, the measured shares of female and minority borrowers are likely to be alower bound. Using census tract variation in minority population from the 2010 Census, we find that theFinTech share is lower in tracts with a high share of minority borrowers, although this is not always true inthe univariate specifications in the Internet Appendix.
33

seem counterintuitive, we have been told by industry practitioners that first-time mortgage
borrowers often prefer to interact face-to-face with a mortgage broker or loan officer, rather
than applying online, because they are less familiar with the steps involved; in other words
they are less financially experienced and literate (consistent with Agarwal et al., 2009, who
find that financial literacy increases with age up to individuals’ mid-50’s).
Internet access. As online services become more ubiquitous, there is growing concern
about the “digital divide”, meaning that inequality in access to Internet services may be ex-
acerbating income and wealth inequality. We examine whether the availability of high-speed
Internet is a constraint on FinTech mortgage borrowing (where applications are generally
completed online), using two data sources: first, the fraction of households with high-speed
Internet access from the Census Bureau American Community Survey (available from 2013
by county); second, census-block data from the FCC and NTIA for the ten largest states
by population on the fraction of households with the option to connect to fiber or cable
Internet, which we aggregate by census tract.
Empirically, these two variables have opposite signs, and the coefficients are generally
small in magnitude. We conclude that lack of access to adequate Internet does not ap-
pear to be a significant constraint on the diffusion of technology-based mortgage lending.
This interpretation is also consistent with more detailed analysis described below about the
staggered rollout of Google Fiber in one local market.
Local mortgage and housing market conditions. As FinTech lending becomes
more widely available, it may be particularly beneficial in areas with long processing times.
Indeed, we find that a higher share of FinTech mortgage borrowing in census tracts where
mortgage processing times were slow ex ante, measured in 2010 prior to the growth in
FinTech lending.46 This result suggests that borrowers have turned to FinTech lenders in
part to alleviate bottlenecks in mortgage origination associated with “traditional” mortgage
lenders.47
46We measure average processing time in 2010 conditional on borrower characteristics. Using 2010 HMDAdata, we regress processing time on loan and borrower characteristics. We then take the residuals from thisregression and aggregate them to the census tract level.
47As discussed in Section III, the sign of this correlation also speaks against concerns that our earlierprocessing time results are due to selection effects. If “fast processor” borrowers (conditional on observables)are attracted to FinTech lenders, we would have expected a higher ex post FinTech share in neighborhoodswhere 2010 processing times were faster than would be expected based on observables. In fact, however, we
34

We also examine whether FinTech mortgage borrowing is more prevalent in “hot” real
estate markets where prices are rising rapidly and quick closing may be more important.
Anecdotal evidence suggests that borrowers may be particuarly attracted to the convenience
and fast processing speeds of FinTech lenders in such markets.48 We find no empirical
support for this hypothesis; in fact, home price growth is negatively correlated with the
market share of FinTech lending for purchase mortgages (which are the relevant group to
consider for this hypothesis).
We examine whether the FinTech share is lower in neighborhoods with high average
home prices (measured in 2010). This hypothesis is motivated by the fact that FinTech
lenders rely on securitization for funding mortgages; as a result these lenders originate few
jumbo loans, which are difficult to securitize. This in turn means that FinTech lenders may
advertise less in high-home-price markets where jumbo mortgages predominate. There also
may be less social learning about the FinTech mortgage lending model in such markets. We
do indeed find that the likelihood of borrowing from a FinTech lender is lower in high home
price areas, conditional on loan size and other observables.
B. Interpretation
We interpret our evidence as supporting the view that FinTech mortgage borrowers are
attracted to the faster processing times and greater convenience involved with online appli-
cations and partial automation of mortgage underwriting. This is consistent with the faster
growth of FinTech in census tracts with previously long mortgage processing cycle times and
the higher incomes and education of FinTech borrowers. It is also consistent with the high
share of refinances for FinTech lenders.49 We find no empirical support for the hypothesis
that FinTech lenders have grown by disproportionately targeting risky, marginal borrowers.
find that the opposite correlation is true in the data.48For example, a September 2015 The Street article titled “Online Mortgage Lenders Are Beating Tra-
ditional Bank Loans” highlights the shorter closing times of online lenders, and includes the followingquote from the CEO of the lender Bank of the Internet “We have very short underwriting term times andthat’s a plus for our purchase oriented borrowers – we give quick answers,” Garrabrants said. ”In a reallyhot market, that’s important.” (see https://www.thestreet.com/story/13282079/1/online-mortgage-
lenders-are-beating-traditional-bank-loans.html).49The more standardized set of tasks involved in refinancing a mortgage may be the best fit for FinTech
lending at the current state of technology.
35

Despite the emphasis of the FinTech lending model on online applications and interactions,
we also find no evidence that younger borrowers or borrowers located in census tracts with
better Internet access are more likely to borrow from FinTech lenders.
We emphasize that we do not attach a strong causal interpretation to our results, given
the reduced-form nature of our analysis. Yet, we believe that the empirical relationships
documented here are a useful benchmark for further analysis.50
C. Evidence from Google Fiber rollout
In addition to our reduced-form analysis, we also conduct an in-depth empirical analysis
of the potential causal effect of improved Internet access on FinTech lending. We exploit
the staggered entry of a new high-speed Internet provider in a single market, namely the
entry of Google Fiber in Kansas City starting in late 2012. Google Fiber is a large-scale
initiative by Google to establish a new Internet service provider. The first metro area that
Google Fiber entered was the Kansas City area, consisting of Johnson, Leavenworth, and
Wyandotte counties in Kansas and Cass, Clay, Jackson, and Platte counties in Missouri.
A major factor behind the selection of Kansas City was that households had poor access
to high-speed Internet prior to the entry of Google Fiber. High-speed Internet was only
available to a relatively small fraction of households over this period (cable and fiber Internet
from providers other than Google was limited), and there was a rapid expansion in high-
speed Internet access over this time period as Google Fiber became available broadly across
the Kansas City area.
Using HMDA data, we analyze how the market share of FinTech lenders across different
neighborhoods in the Kansas City MSA evolved over this period, exploiting the staggered
rollout of Google Fiber across census tracts and controlling for time and census-tract fixed
effects. Results are presented in Internet Appendix G. Our main finding is that the discrete
improvements in Internet access generated by the entry of Google Fiber did not induce a
50We note that, where comparable, our results are generally consistent with Buchak et al. (2017), whoestimate similar reduced-form regressions of the determinants of borrowing from FinTech lenders and othernonbanks. For example, Buchak et al. (2017) also find that FinTech lenders originate a significantly highershare of refinances compared to purchase mortgages, and have a high incidence of missing race and gender.Besides differences in modelling choices, we also examine a number of determinants of FinTech demandwhich Buchak et al. (2017) do not (e.g., bank branch density, borrower age, or Internet access).
36

higher share of FinTech borrowing. The results are often not statistically significant; in
the cases where they are significant they have the opposite sign to that predicted, due to a
migration in mortgage lending from nonbanks to banks.
Consistent with our earlier evidence, these results indicate that adequate Internet access is
unlikely to be a significant constraint on the diffusion of online mortgage lending, mitigating
concerns about the “digital divide” in this setting.
VIII Conclusion
This paper presents new evidence on how technology is reshaping the U.S. mortgage mar-
ket by studying the vanguard of technology-based lenders. Our results show that FinTech
lenders offer a faster origination process that is less sensitive to fluctuations in demand than
traditional lenders. These improvements are associated with an increase in the propensity to
refinance, especially among borrowers that are likely to benefit from it. We find no evidence
that FinTech lending is more risky.
Going forward, we expect that other lenders will seek to replicate the “FinTech model”
characterized by electronic application processes with centralized, semi-automated under-
writing operations. However, it is unclear whether traditional lenders or small institutions
will all be able to adopt these practices as these innovations require significant reorganiza-
tion and sizable investments. The end result could be a more concentrated mortgage market
dominated by those firms that can afford to innovate. From a consumer perspective, we
believe our results shed light on how mortgage credit supply is likely to evolve in the fu-
ture. Specifically, technology will allow the origination process to be faster and to more
easily accommodate changes in interest rates, leading to greater transmission of monetary
policy to households via the mortgage market. Our findings also imply that technological
diffusion may reduce inefficiencies in refinancing decisions, with significant benefits to U.S.
households.
Our results have to be considered in the prevailing institutional context of the U.S.
mortgage market. Specifically, at the time of our study FinTech lenders are non-banks that
securitize their mortgages and do not take deposits. It remains to be seen whether we find
37

the same benefits of FinTech lending as the model spreads to deposit-taking banks and their
borrowers. Changes in banking regulation or the housing finance system may affect FinTech
lenders going forward. Also, the benefits we document stem from innovations that rely on
hard information; as these innovations spread, they may affect access to credit for those
borrowers with applications that require soft information or borrowers that require direct
communication with a loan officer. We leave these issues for future research.
38
References
Acharya, V. V., P. Schnabl, and G. Suarez (2013): “Securitization without risk
transfer,” Journal of Financial Economics, 107, 515–536.
Agarwal, S., G. Amromin, S. Chomsisengphet, T. Landvoigt, T. Piskorski,
A. Seru, and V. Yao (2017): “Mortgage Refinancing, Consumer Spending, and Com-
petition: Evidence From the Home Affordable Refinance Program,” Working Paper 21512,
National Bureau of Economic Research.
Agarwal, S., J. Driscoll, D. Laibson, and X. Gabaix (2009): “The Age of Reason:
Financial Decisions over the Life Cycle and Implications for Regulation,” Brookings Papers
on Economic Activity, 30, 51–101.
Agarwal, S., J. C. Driscoll, and D. I. Laibson (2013): “Optimal Mortgage Refi-
nancing: A Closed-Form Solution,” Journal of Money, Credit and Banking, 45, 591–622.
Agarwal, S., R. J. Rosen, and V. Yao (2015): “Why Do Borrowers Make Mortgage
Refinancing Mistakes?” Management Science, 62, 3494–3509.
Andersen, S., J. Y. Campbell, K. M. Nielsen, and T. Ramadorai (2015): “Inat-
tention and Inertia in Household Finance: Evidence from the Danish Mortgage Market,”
Working Paper 21386, National Bureau of Economic Research.
Badarinza, C., J. Y. Campbell, and T. Ramadorai (2016): “International compar-
ative household finance,” Annual Review of Economics, 8, 111 – 144.
Bartlett, R., A. Morse, R. Stanton, and N. Wallace (2017): “Consumer Lending
Discrimination in the FinTech Era,” Working paper, UC Berkeley.
Bennett, P., R. Peach, and S. Peristiani (2001): “Structural Change in the Mortgage
Market and the Propensity to Refinance,” Journal of Money, Credit and Banking, 33, 955–
975.
Beraja, M., A. Fuster, E. Hurst, and J. Vavra (2017): “Regional Heterogeneity
and Monetary Policy,” Staff Report No. 731, Federal Reserve Bank of New York.
Bond, P., R. Elul, S. Garyn-Tal, and D. K. Musto (2017): “Does Junior Inherit?
Refinancing and the Blocking Power of Second Mortgages,” Review of Financial Studies,
30, 211–244.
Buchak, G., G. Matvos, T. Piskorski, and A. Seru (2017): “Fintech, Regulatory
Arbitrage, and the Rise of Shadow Banks,” Working Paper 23288, National Bureau of
Economic Research.
Campbell, J. Y. (2006): “Household Finance,” Journal of Finance, 61, 1553 – 1604.
39

——— (2013): “Mortgage Market Design,” Review of Finance, 17, 1 – 33.
Choi, D. B., H.-S. Choi, and J.-E. Kim (2017): “Clogged Intermediation: Were Home
Buyers Crowded Out?” Working paper, Federal Reserve Bank of New York.
Collard-Wexler, A. and J. De Loecker (2015): “Reallocation and Technology: Ev-
idence from the US Steel Industry,” American Economic Review, 105, 131–71.
D’Acunto, F. and A. G. Rossi (2017): “Regressive Mortgage Credit Redistribution in
the Post-crisis Era,” Working paper, University of Maryland.
DeFusco, A. A., S. Johnson, and J. Mondragon (2017): “Regulating Household
Leverage,” Working paper, Northwestern University.
Deng, Y. and J. M. Quigley (2012): “Woodhead Behavior and the Pricing of Residential
Mortgages,” Working Paper IRES2012-025, NUS Institute of Real Estate Studies.
Di Maggio, M., A. Kermani, B. J. Keys, T. Piskorski, R. Ramcharan, A. Seru,
and V. Yao (2017): “Interest rate pass-through: Mortgage rates, household consumption,
and voluntary deleveraging,” American Economic Review, 107, 3550–3588.
Di Maggio, M., A. Kermani, and C. Palmer (2016): “How Quantitative Easing Works:
Evidence on the Refinancing Channel,” Working Paper No. 22638, National Bureau of
Economic Research.
Drechsler, I., A. Savov, and P. Schnabl (2017): “The deposits channel of monetary
policy,” Quarterly Journal of Economics, 132, 1819–1876.
Freddie Mac (2016): “Your Step-by-Step Mortgage Guide: From Application to
Closing,” http://www.freddiemac.com/singlefamily/docs/Step_by_Step_Mortgage_
Guide_English.pdf, accessed 2017-08-15.
Fuster, A., P. Goldsmith-Pinkham, T. Ramadorai, and A. Walther (2017a):
“Predictably Unequal? The Effects of Machine Learning on Credit Markets,” Discussion
Paper 12448, CEPR.
Fuster, A., S. H. Lo, and P. S. Willen (2017b): “The Time-Varying Price of Financial
Intermediation in the Mortgage Market,” Staff Report 805, Federal Reserve Bank of New
York.
Fuster, A. and P. S. Willen (2010): “$1.25 Trillion is Still Real Money: Some Facts
About the Effects of the Federal Reserve’s Mortgage Market Investments,” Public Policy
Discussion Paper 10-4, Federal Reserve Bank of Boston.
Gete, P. and M. Reher (2017): “Mortgage Supply and Housing Rents,” Review of
Financial Studies, forthcoming.
40

Goldman Sachs Research (2015): “The Future of Finance,” https://www.planet-
fintech.com/file/167061, accessed 2018-01-15.
——— (2016): “The Mortgage Analyst: Prepays catching up to Quicken? Not
so quick,” http://www.thebondbeat.com/bondbeat/wp-content/uploads/2016/02/
gs-TMA.pdf, accessed 2017-03-15.
Goodman, L. (2016): “Why Rocket Mortgage Won’t Start Another Housing Crisis,” Urban
Institute Urban Wire Blog, February 12. Accessed 2017-03-15.
Housing Wire (2015): “Guaranteed Rate Purchases Remains of Discover Home Loans,”
https://www.housingwire.com/articles/34986-guaranteed-rate-purchases-
remains-of-discover-home-loans, accessed 2018-01-15.
——— (2017): “Quicken Loans’ Rocket Mortgage Finally a Fully Digital Mortgage Thanks
to Pavaso Partnership,” https://www.housingwire.com/articles/41498-quicken-
loans-rocket-mortgage-finally-a-fully-digital-mortgage-thanks-to-pavaso-
partnership, accessed 2018-01-15.
Jiang, W., A. A. Nelson, and E. Vytlacil (2014): “Securitization and Loan Perfor-
mance: Ex Ante and Ex Post Relations in the Mortgage Market,” Review of Financial
Studies, 27, 454–483.
Keys, B., D. Pope, and J. Pope (2016): “Failure to Refinance,” Journal of Financial
Economics, 122, 482 – 499.
Keys, B. J., T. Mukherjee, A. Seru, and V. Vig (2010): “Did securitization lead
to lax screening? Evidence from subprime loans,” Quarterly Journal of Economics, 125,
307–362.
LaCour-Little, M. (2000): “The Evolving Role of Technology in Mortgage Finance,”
Journal of Housing Research, 11, 173–205.
——— (2007): “The Home Purchase Mortgage Preferences of Low- and Moderate-Income
Households,” Real Estate Economics, 35, 265–290.
Mayer, C., T. Piskorski, and A. Tchistyi (2013): “The inefficiency of refinancing:
Why prepayment penalties are good for risky borrowers,” Journal of Financial Economics,
107, 694 – 714.
Mian, A. and A. Sufi (2009): “The consequences of mortgage credit expansion: Evidence
from the US mortgage default crisis,” Quarterly Journal of Economics, 124, 1449–1496.
Oliver Wyman (2016): “The Future of Technology in Mortgage Originations,” White
paper.
41
Petersen, M. and R. Rajan (2002): “Does distance still matter? The information
revolution in small business lending,” Journal of Finance, 57, 2533 – 2570.
Philippon, T. (2016): “The FinTech Opportunity,” Working Paper 22476, National Bureau
of Economic Research.
Purnanandam, A. (2010): “Originate-to-distribute model and the subprime mortgage
crisis,” Review of Financial Studies, 24, 1881–1915.
Quicken Loans (2017a): “Quicken Loans and eOriginal Partner on Next Mortgage
Revolution,” http://www.quickenloans.com/press-room/2017/10/17/quicken-
loans-eoriginal-partner-next-phase-digital-mortgage-revolution/, accessed
2018-01-08.
——— (2017b): “Quicken Loans Continues Simplifying Mortgage Process, Allows
More Financial Information in Fewer Steps,” http://www.quickenloans.com/press-
room/2017/10/23/quicken-loans-continues-simplifying-mortgage-process-
allows-clients-share-financial-information-fewer-steps/, accessed 2018-01-06.
Scharfstein, D. and A. Sunderam (2016): “Market Power in Mortgage Lending and
the Transmission of Monetary Policy,” Working Paper, Harvard University.
Sharpe, S. A. and S. M. Sherlund (2016): “Crowding Out Effects of Refinancing on
New Purchase Mortgages,” Review of Industrial Organization, 48, 209–239.
Stein, J. (2002): “Information production and capital allocation: Decentralized versus
hierarchical firms,” Journal of Finance, 57, 1891 – 1921.
Syverson, C. (2011): “What Determines Productivity?” Journal of Economic Literature,
49, 326–65.
The Economist (2016): “A New Foundation: One of America’s Biggest Mortgage Lenders
is Not Like the Others,” May 26.
Wall Street Journal (2015): “FHA Offers Olive Branch to Hesitant Lenders,” Septem-
ber 1.
Wong, A. (2016): “Population Aging and the Transmission of Monetary Policy to Con-
sumption,” Working paper, Northwestern University.
42

Appendix: Data Sources and Variable Definitions
Variable Definition Level ofAggregation
HMDALog(income) Log of borrower income IndividualLog(loan size) Log of loan amount IndividualLoan-to-income (LTI) Loan amount divided by borrower income IndividualJumbo Loan [0,1] Indicator variable equal to one if loan amount exceeds FHFA con-
forming loan limit for the month of originationIndividual
Loan Type [0,1] Indicator variables for conventional, FHA, and VA loans. Con-ventional is omitted category in regressions.
Individual
Loan purpose [0,1] Indicator variables for whether whether loan is a home purchaseloan or a refinancing
Individual
No Coapplicant [0,1] Indicator variable equal to one if no coapplicant on the mortgageapplication
Individual
Owner Occupied [0,1] Indicator for the property being the borrower’s principal dwelling IndividualGender [0,1] Indicators for borrower gender being Female, Male, or Unknown
(unreported). Male is omitted category in regressions.Individual
Race & Ethnicity [0,1] Indicators for race & ethnicity. Non-hispanic white is omittedcategory in regressions.
Individual
Processing Time Number of calendar days between the application date and actiondate of a loan (based on restricted-use version of HMDA data).
Individual
Log(application volume) Log of aggregate application volume National
U.S. Census% Black or Hispanic Percent of population identifying as Black, Hispanic, or both in
2010Tract
Population density Thousands of residents in thousands per square mile in 2010 Tract
American Community Survey% bachelor degree Percent of population 25 years or older with a bachelor’s or higher
degree in 2010Tract
% with broadband sub-scription
Percent of population with an Internet subscription other thandial-up (including DSL, cable, fiber optic, mobile broadband,satellite, or fixed wireless) in 2010
County
EquifaxCredit score Mean credit score of all individuals with a positive mortgage bal-
ance (measured as of 2014Q3)Tract
Age Median age of individuals with a positive mortgage balance (mea-sured as of 2014Q3)
Tract
ZillowHome price appreciation Home price appreciation over the 12 months up to the month of
loan originationCounty
Log(2010 home price) Log of average home price as of January 2010 County
NTIA/FCCHigh speed internet cov-erage
Percent of households with access to either cable or fiber services,or Google Fiber, measured at a half-yearly frequency. Data iscollected from the NTIA from 2011 to mid-2014 and from theFCC from end-2014 to end-2016. Data only available for the tenlargest US states.
Tract
43

Variable Definition Level ofAggregation
FDIC Summary of DepositsBank branch density Number of bank branches (in 000s) within a 25 mile radius of the
center of census tract in 2010Tract
FHA Neighborhood Watch Early Warning SystemOne- and two-year com-parative default rate
Default rate (90+ days delinquent or teriminated in a claim as % ofloans) for FinTech lender i measured as the percent deviation fromthe default rate for all FHA loans in the same geography and timeperiod. 1 year default rate considers only defaults occurring in thefirst year of the mortgage life. For most analysis, performance ismeasured over the sample period 2015:Q3 to 2017:Q3.
MSA,state ornational
Mix-adjusted 2-year de-fault rate
Based on the FHA supplementary performance measure (SPM,equal to the ratio of the lender’s two-year default rate to a bench-mark default rate for a portfolio of loans with the same mix ofcredit scores.) Mix-adjusted default rate is the ratio of the lender’sSPM to the SPM for all FHA loans in the same geography andtime period.
MSA,state ornational
Ginnie Mae loan-level dataDefault Indicator variable for whether FHA mortgage enters 90+ days
delinquencyIndividual
FICO Borrower credit score at origination IndividualLTV Ratio of loan amount to appraised property value IndividualDTI Ratio of total debt payment to borrower income Individual
Equifax CRISM borrower level dataCoupon minus 10-yearTreasury yield
Difference between average coupon rate on outstanding mortgagesand 10-year Treasury bond yield (used in Figure 2)
National
Refinancing propensity Share of outstanding mortgages in month t that are refinanced inmonth t+1
County
FICO Borrower credit score (updated monthly), county average CountyCLTV Combined loan-to-value ratio (sum of all mortgage liens divided
by updated home value)County
Average current rate Current mortgage coupon rate, county average CountyFHA/VA share Share of FHA/VA mortgages in county County
Author derived variables2010 conditional process-ing time
Average processing time in 2010 (census tract average, residualafter regressing processing time in days on HMDA borrower &loan characteristics)
Tract
Refinancing incentive Difference between coupon rate and rate at which borrower wouldbe indifferent between refinancing and not refinancing based onthe ‘square root rule’ of Agarwal et al. (2013)
Individual
44

Figures and Tables
Figure 1: Number of FinTech mortgage lenders (according to our classification) over time
45
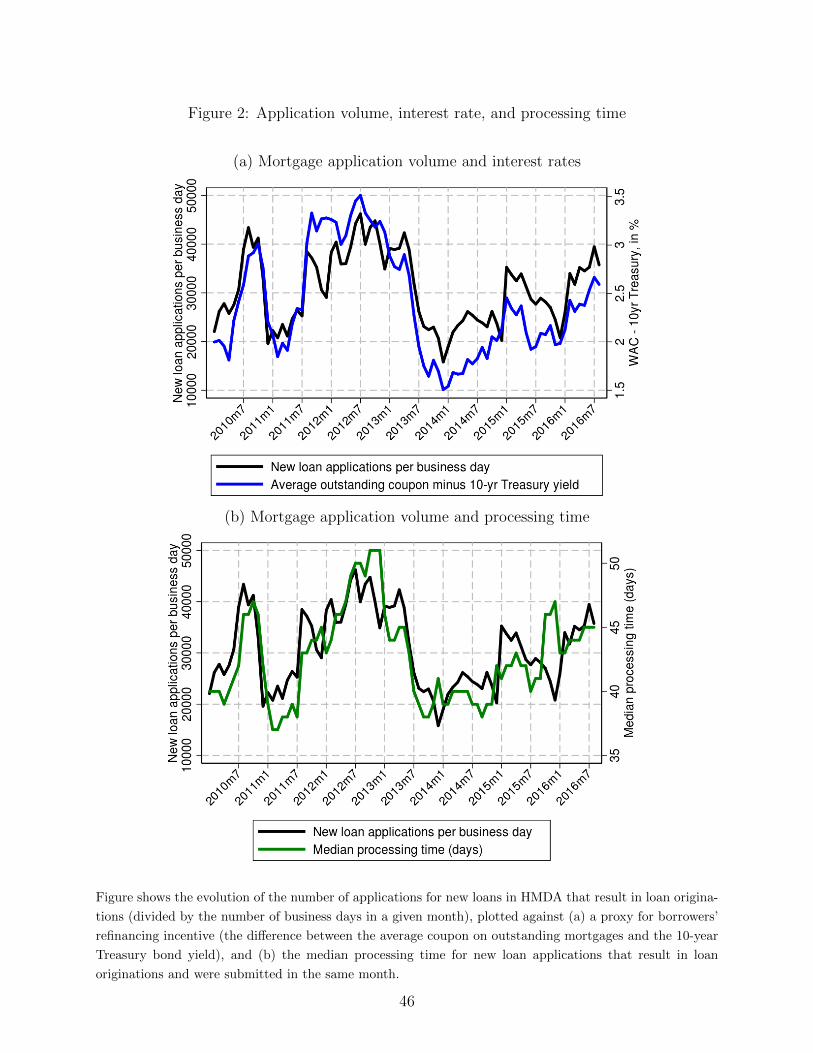
Figure 2: Application volume, interest rate, and processing time
(a) Mortgage application volume and interest rates
(b) Mortgage application volume and processing time
Figure shows the evolution of the number of applications for new loans in HMDA that result in loan origina-
tions (divided by the number of business days in a given month), plotted against (a) a proxy for borrowers’
refinancing incentive (the difference between the average coupon on outstanding mortgages and the 10-year
Treasury bond yield), and (b) the median processing time for new loan applications that result in loan
originations and were submitted in the same month.
46
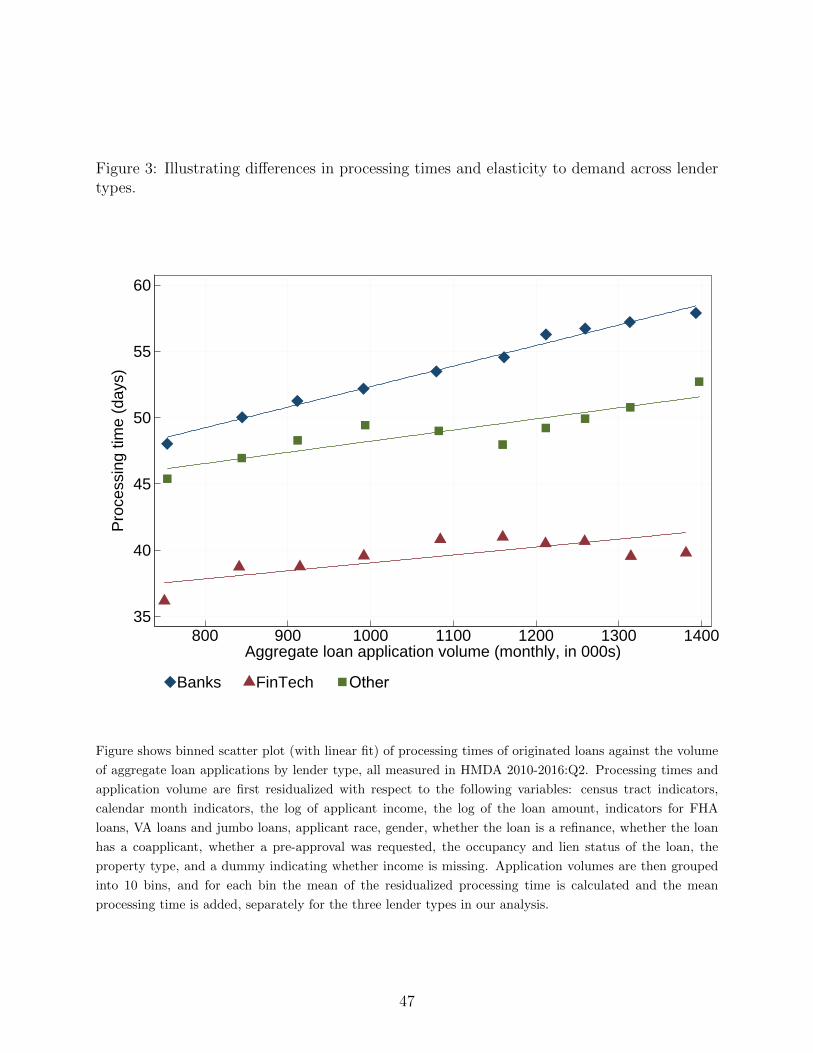
Figure 3: Illustrating differences in processing times and elasticity to demand across lendertypes.
35
40
45
50
55
60
Pro
cess
ing
time
(day
s)
800 900 1000 1100 1200 1300 1400Aggregate loan application volume (monthly, in 000s)
Banks FinTech Other
Figure shows binned scatter plot (with linear fit) of processing times of originated loans against the volume
of aggregate loan applications by lender type, all measured in HMDA 2010-2016:Q2. Processing times and
application volume are first residualized with respect to the following variables: census tract indicators,
calendar month indicators, the log of applicant income, the log of the loan amount, indicators for FHA
loans, VA loans and jumbo loans, applicant race, gender, whether the loan is a refinance, whether the loan
has a coapplicant, whether a pre-approval was requested, the occupancy and lien status of the loan, the
property type, and a dummy indicating whether income is missing. Application volumes are then grouped
into 10 bins, and for each bin the mean of the residualized processing time is calculated and the mean
processing time is added, separately for the three lender types in our analysis.
47

Figure 4: Refinancing propensities across counties with different levels of FinTech marketshare
0
.5
1
1.5
Mon
thly
Ref
inan
ce P
rope
nsity
(gr
oup
aver
age,
%)
2010m1 2011m1 2012m1 2013m1 2014m1 2015m1 2016m1
Lowest FinTech Tercile Middle Tercile Highest FinTech Tercile
Figure shows average monthly refinance propensities across three groups of counties, sorted based on county-
level FinTech market shares (among refinance loans) over mid-2012 to mid-2013. Data source: CRISM.
48

Table 1: FinTech and Top 20 Mortgage Originators in 2016, based on Home MortgageDisclosure Act (HMDA)
Rank Type ofLender
Lender Name Volume(Bn)
MarketShare (%)
FinTechSince
1 Bank Wells Fargo 132.58 6.622 FinTech Quicken Loans 90.55 4.52 20103 Bank JPMorgan Chase 75.52 3.774 Bank Bank Of America 60.24 3.015 FinTech Loandepot.com 35.94 1.80 20166 Mtg Freedom Mortgage 32.17 1.617 Bank US Bank 30.69 1.538 Mtg Caliber Home Loans 27.94 1.409 Bank Flagstar 27.31 1.3610 Mtg United Shore 22.93 1.1511 Bank Citibank 21.73 1.0912 FinTech Guaranteed Rate 18.44 0.92 201013 Mtg Finance of America 17.63 0.8814 Mtg Fairway Independent 16.10 0.8015 Bank USAA Federal Savings 15.52 0.7816 Mtg Guild Mortgage 15.07 0.7517 Mtg Stearns Lending 14.93 0.7518 Bank Suntrust Mortgage 14.77 0.7419 Bank Primelending 13.87 0.6920 Mtg Nationstar Mortgage 13.50 0.67...23 FinTech Movement Mortgage 11.61 0.58 201439 FinTech Everett Financial
(Supreme)7.62 0.38 2016
534 FinTech Avex Funding(Better.com)
0.49 0.02 2016
Bank = Depository Institution, Mtg = Non-bank Mortgage Lender, FinTech = FinTech Lender
Market share is based on dollar volume of originations in HMDA.
49

Table 2: Descriptive statistics by lender type, HMDA data 2010 - mid-2016
Banks Non-bank lenders All LendersNon-FinTech FinTech
Mean p50 Mean p50 Mean p50 Mean p50
Originated MortgagesApplicant Income 121 86.00 102 82.00 102 84.00 115 84.00Loan amount / income 1.96 1.80 2.46 2.40 2.34 2.19 2.13 2.00Home Purchase 0.34 0 0.52 1 0.22 0 0.38 0Refinancing 0.66 1 0.48 0 0.78 1 0.62 1Jumbo 0.05 0 0.02 0 0.02 0 0.04 0Loan Type:
Conventional 0.86 1 0.61 1 0.71 1 0.78 1FHA 0.09 0 0.28 0 0.20 0 0.15 0VA 0.05 0 0.11 0 0.09 0 0.07 0
Owner Occupied 0.88 1 0.92 1 0.92 1 0.89 1Male 0.67 1 0.69 1 0.59 1 0.68 1Female 0.25 0 0.27 0 0.26 0 0.26 0No Coapplicant 0.45 0 0.52 1 0.50 0 0.48 0Race:
White 0.79 1 0.78 1 0.68 1 0.78 1Black/African American 0.04 0 0.06 0 0.05 0 0.05 0Asian 0.05 0 0.07 0 0.04 0 0.06 0Other 0.01 0 0.01 0 0.01 0 0.01 0Unknown 0.11 0 0.09 0 0.22 0 0.11 0
Processing Time 53.04 45.00 50.20 40.00 42.58 37.00 51.71 43.00Observations 32,751,662 14,742,227 2,306,237 49,800,126
All ApplicationsLoan Outcome
Originated 0.64 1 0.58 1 0.66 1 0.62 1Approved, Not Accepted 0.04 0 0.05 0 0.03 0 0.04 0Denied 0.20 0 0.16 0 0.27 0 0.19 0Withdrawn 0.09 0 0.15 0 0.03 0 0.11 0Closed for Incompleteness 0.03 0 0.06 0 0.01 0 0.04 0
Processing Time 47.16 40.00 46.98 35.00 40.11 35.00 46.80 38.00Observations 51,448,444 25,604,501 3,473,506 80,526,451
Table contains summary statistics of HMDA data by lender type, for loan applications from January 2010 through June 2016. “Banks” are
depository institutions, “Non-bank lenders” are non-bank mortgage lenders, and “FinTech” lenders are classified according to Section II.
In the first part of the table, summary statistics are calculated for originated mortgages only. In the second part of the table, statistics are
calculated for all applications, which include applications that ended up being originated, approved by the lender but not accepted by the
borrower, denied, withdrawn by the applicant before a decision was made, or closed for incompleteness. “Applicant Income” is in thousands
of USD and does not include missing values. ”Loan amount / income“ (LTI) is loan amount divided by applicant income; LTI is winsorized
at the 0.5% level and does not include missing values. “Jumbo” is an indicator for the loan amount being greater than the applicable FHFA
Conforming Loan Limit. “Owner Occupied” is an indicator for the property being the borrower’s principal dwelling. “No Coapplicant” is
an indicator for no coapplicant provided for the loan. Race: “Other” is an indicator for applicant race being American Indian, Alaskan,
Hawaiian, or Pacific Islander. “Unknown” is an indicator for race being unreported or “Not Applicable”. “Processing Time” is the number
of days between application date and action date of a loan. Loan outcomes: “Originated” are applications that were successfully originated.
“Approved, Not Accepted” are applications where the application was approved, but not accepted by applicant. “Denied” are applications
that were denied by originator. “Withdrawn” are applications that were withdrawn by the applicant before a credit decision was made.
“Closed for Incompleteness” are applications where the application file was closed for incompleteness.
50

Table 3: FinTech lenders and processing times: Loan-level results
Panel A: Purchase Loans (1) (2) (3) (4) (5)
FinTech Lender -7.93*** -9.43*** -8.33*** -9.24*** -7.46***(0.52) (0.61) (0.43) (0.48) (0.45)
Log(Applicant Income) -0.55*** -1.00*** -0.44***(0.04) (0.03) (0.06)
Log(Loan Amount) 4.47*** 4.90*** 6.09***(0.08) (0.05) (0.13)
FHA 0.65*** 0.27*** -0.34***(0.15) (0.10) (0.09)
VA 1.68*** 1.51*** 1.91***(0.22) (0.20) (0.30)
Jumbo 3.17*** 5.29*** 5.90***(0.22) (0.15) (0.28)
Observations 19,159,345 19,159,345 18,551,855 18,551,855 7,185,042R2 0.00 0.02 0.23 0.24 0.34Census Tract-Month No No Yes Yes YesLoan Controls No Yes No Yes YesSample All Lenders All Lenders All Lenders All Lenders Nonbanks
Panel B: Refinance Loans (1) (2) (3) (4) (5)
FinTech Lender -9.99*** -13.64*** -10.82*** -14.61*** -9.32***(0.59) (0.57) (0.79) (0.71) (0.53)
Log(Applicant Income) 0.04 -0.17*** -0.25**(0.09) (0.06) (0.12)
Log(Loan Amount) 4.74*** 4.60*** 1.24***(0.10) (0.09) (0.14)
FHA 5.83*** 5.67*** 5.48***(0.46) (0.40) (0.29)
VA 1.70*** 2.04*** 1.42***(0.53) (0.44) (0.41)
Jumbo 7.06*** 7.23*** 9.71***(0.23) (0.21) (0.17)
Observations 30,616,247 30,616,247 30,169,300 30,169,300 8,041,746R2 0.01 0.10 0.18 0.24 0.29Census Tract-Month No No Yes Yes YesLoan Controls No Yes No Yes YesSample All Lenders All Lenders All Lenders All Lenders Nonbanks
Table reports regressions of loan processing time (in days) on an indicator variable identifying FinTech
lenders, census tract-month fixed effects, loan controls and borrower controls. Data source: HMDA. The
sample consists of originated purchase loans in Panel A and refinancing loans in Panel B with application
dates from 2010 to 2016Q2. Displayed loan controls include the log of applicant income, the log of the loan
amount, indicators for FHA loans, VA loans and jumbo loans. Suppressed loan controls include applicant
race, gender, whether the loan has a coapplicant, whether a preapproval was obtained, the occupancy and
lien status of the loan, the property type, and a dummy indicating whether income is missing. Column (5)
excludes bank lenders. Standard errors reported in parentheses are clustered by lender-month. ***, **, *
indicate statistical significance at 1%, 5%, and 10%, respectively.
51

Table 4: Default rate for FinTech lenders, FHA loans (% deviation from region)
Default definition
1 Year 2 Year Mix-AdjustedDefault Default 2 Year Default
A. All FHA loansState level -35.0*** -35.8*** -25.5***
(3.8) (3.9) (4.5)MSA level -35.3*** -36.2***
(2.4) (2.6)B. High market share regions only (loans in top quartile markets by lender):State level -24.7*** -23.4*** -11.7
(8.4) (8.6) (9.9)MSA level -19.8*** -20.5***
(6.0) (6.1)C. Disaggregated by purchase versus refinancing (all loans, state level)Purchase -14.8*** -17.1*** -10.1*
(3.6) (4.3) (5.9)Refinancing -30.6*** -27.5*** -40.3***
(2.6) (3.5) (2.4)D. Disaggregated by neighborhood socioeconomic status (all loans, state level)Underserved (low income/minority) -33.5*** -32.4*** -25.3***
(4.5) (4.4) (4.4)Not Underserved -36.8*** -36.5*** -25.4***
(3.6) (3.9) (4.3)E. All FHA loans: longer time seriesNational level -44.7*** -45.6*** -32.7***
(4.8) (4.5) (5.7)State level -45.4*** -46.1*** -33.4***
(3.2) (3.1) (3.9)
Table reports weighted average percent difference in default rate between mortgages fromFinTech lenders and all FHA mortgages originated in same time period and market (ei-ther MSA, state or national market). Values less than zero indicate lower default ratesfor FinTech lenders. These statistics are calculated as the weighted average of compareir =(default rateir/default rater)−1 across FinTech lenders i and regions r, weighting by lenderorigination volume. In practice we calculate this weighted average by regressing compareiron a constant term using weighted least squares. Default definition is either default withinfirst year, default within first two years, or the ‘mix-adjusted’ default rate which is based onthe supplementary performance metric, an adjusted default rate which takes into accountthe credit score distribution of originations (see text for details). Sample period 2015:Q3 to2017:Q3 except for panel E, where sample period is 2012:Q3 to 2017:Q3. Data extractedfrom the FHA Early Warning System portal in December 2017. Robust standard errorsin parentheses; standard errors clustered by state in state-level regression using longer timeseries (section E). ***, **, * indicate statistical significance at 1%, 5%, and 10%, respectively.
52
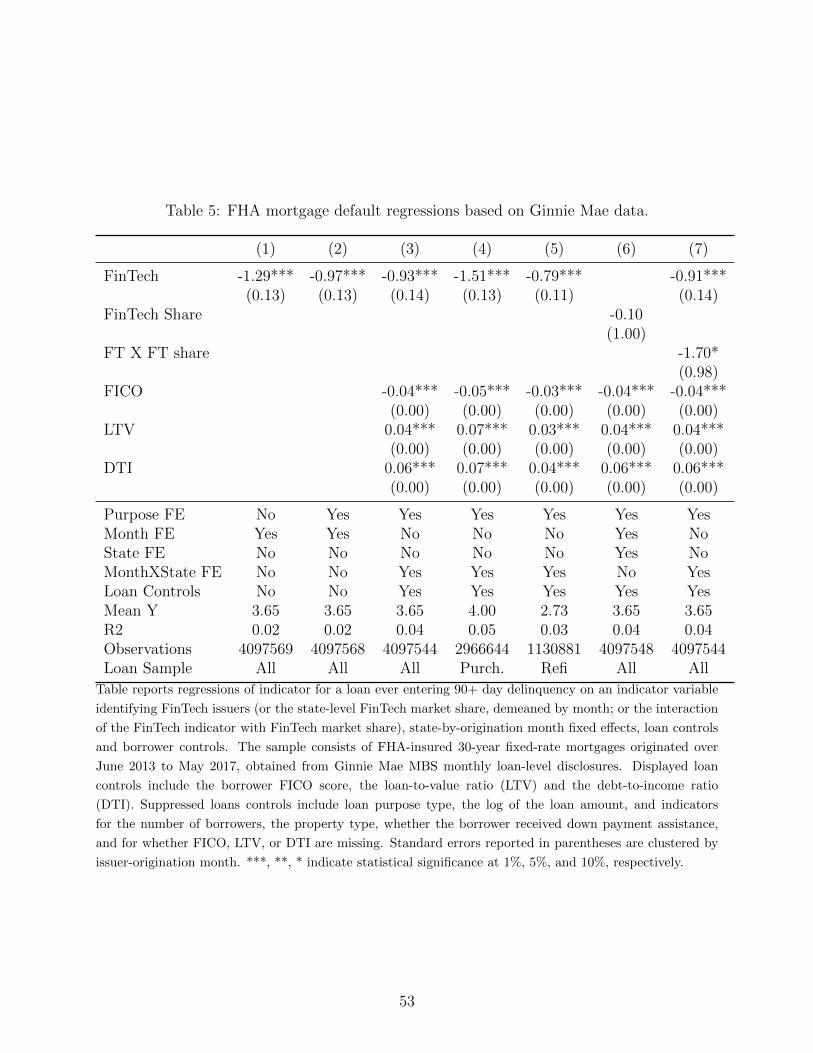
Table 5: FHA mortgage default regressions based on Ginnie Mae data.
(1) (2) (3) (4) (5) (6) (7)
FinTech -1.29*** -0.97*** -0.93*** -1.51*** -0.79*** -0.91***(0.13) (0.13) (0.14) (0.13) (0.11) (0.14)
FinTech Share -0.10(1.00)
FT X FT share -1.70*(0.98)
FICO -0.04*** -0.05*** -0.03*** -0.04*** -0.04***(0.00) (0.00) (0.00) (0.00) (0.00)
LTV 0.04*** 0.07*** 0.03*** 0.04*** 0.04***(0.00) (0.00) (0.00) (0.00) (0.00)
DTI 0.06*** 0.07*** 0.04*** 0.06*** 0.06***(0.00) (0.00) (0.00) (0.00) (0.00)
Purpose FE No Yes Yes Yes Yes Yes YesMonth FE Yes Yes No No No Yes NoState FE No No No No No Yes NoMonthXState FE No No Yes Yes Yes No YesLoan Controls No No Yes Yes Yes Yes YesMean Y 3.65 3.65 3.65 4.00 2.73 3.65 3.65R2 0.02 0.02 0.04 0.05 0.03 0.04 0.04Observations 4097569 4097568 4097544 2966644 1130881 4097548 4097544Loan Sample All All All Purch. Refi All All
Table reports regressions of indicator for a loan ever entering 90+ day delinquency on an indicator variable
identifying FinTech issuers (or the state-level FinTech market share, demeaned by month; or the interaction
of the FinTech indicator with FinTech market share), state-by-origination month fixed effects, loan controls
and borrower controls. The sample consists of FHA-insured 30-year fixed-rate mortgages originated over
June 2013 to May 2017, obtained from Ginnie Mae MBS monthly loan-level disclosures. Displayed loan
controls include the borrower FICO score, the loan-to-value ratio (LTV) and the debt-to-income ratio
(DTI). Suppressed loans controls include loan purpose type, the log of the loan amount, and indicators
for the number of borrowers, the property type, whether the borrower received down payment assistance,
and for whether FICO, LTV, or DTI are missing. Standard errors reported in parentheses are clustered by
issuer-origination month. ***, **, * indicate statistical significance at 1%, 5%, and 10%, respectively.
53

Table 6: Elasticity of processing time with respect to aggregate application volume: FinTechvs. other lenders
(1) (2) (3) (4) (5) (6) (7)
ln(App. Vol.) 11.76*** 13.48*** 18.88*** 13.43*** 8.85*** 13.60*** 10.55***(0.52) (0.47) (0.67) (0.47) (0.45) (0.81) (0.79)
ln(App. Vol.) × FinTech -7.55*** -6.15*** -9.57*** -7.46*** -2.06 -4.45*** -4.47***(1.46) (1.51) (1.80) (1.50) (1.40) (1.67) (1.56)
Observations 49,775,550 49,775,312 30,615,852 80,495,817 17,024,138 8,927,175 29,048,184R2 0.14 0.20 0.25 0.17 0.20 0.16 0.16
Loan Controls No Yes Yes Yes Yes Yes YesLender FE Yes Yes Yes Yes Yes Yes YesCensus Tract FE No Yes Yes Yes Yes Yes YesMonth FE No Yes Yes Yes Yes Yes YesApplication Sample Originated Originated Refi All Originated Refi AllLender Sample All All All All Nonbanks Nonbanks Nonbanks
Table reports regressions of loan processing time (in days) on the log of aggregate monthly application
volume, an interaction with the FinTech indicator, loan controls, lender fixed effects, census-tract fixed
effects and calendar month fixed effects. Data source: HMDA. The sample is restricted to application
dates from 2010 to 2016:Q2. Columns (1), (2), and (5) include all originated loans; Columns (3) and (6)
include originated refinancing loans; and Columns (4) and (7) include all applications (including denied
and withdrawn applications). The sample of lenders includes all lender types in Columns (1)-(4) and
nonbanks only in Columns (5)-(7). Loan controls include the log of applicant income, the log of the loan
amount, indicators for FHA loans, VA loans and jumbo loans, applicant race, gender, whether the loan has
a coapplicant, whether a preapproval was obtained, the occupancy and lien status of the loan, the property
type, and a dummy indicating whether income is missing. Columns (4) and (7) also include indicators
for whether a loan was denied or withdrawn. Standard errors reported in parentheses are clustered by
lender-month. ***, **, * indicate statistical significance at 1%, 5%, and 10%, respectively.
54
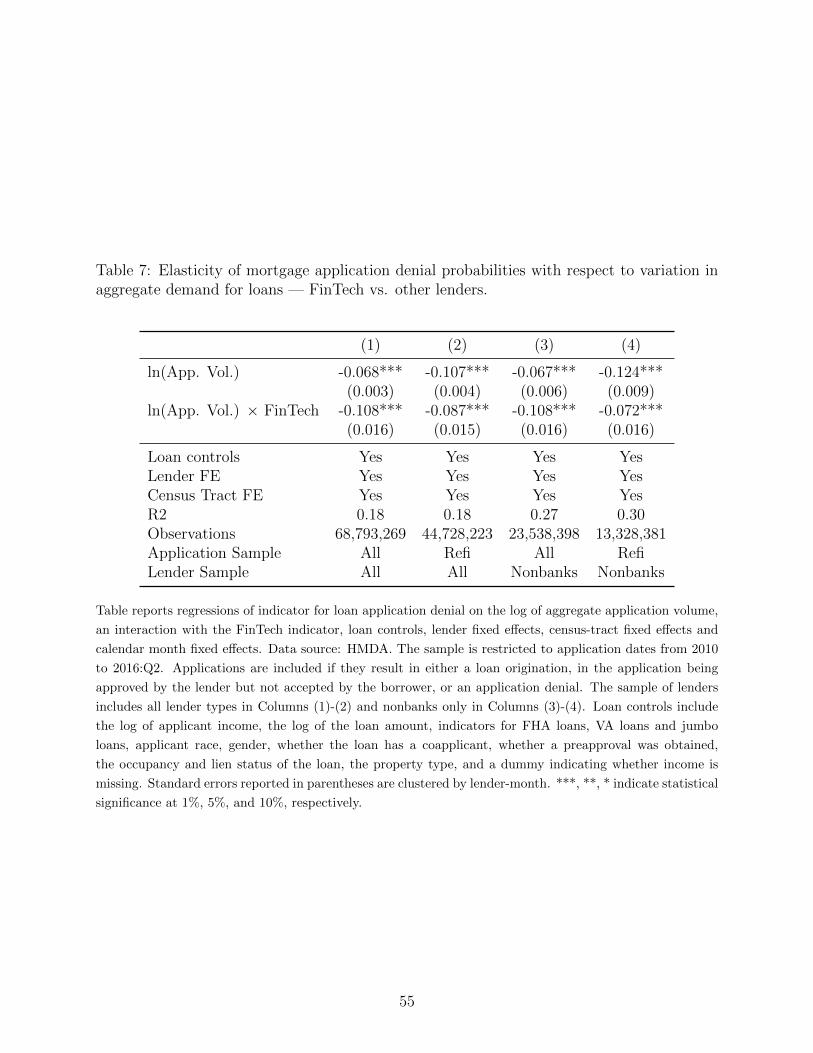
Table 7: Elasticity of mortgage application denial probabilities with respect to variation inaggregate demand for loans — FinTech vs. other lenders.
(1) (2) (3) (4)
ln(App. Vol.) -0.068*** -0.107*** -0.067*** -0.124***(0.003) (0.004) (0.006) (0.009)
ln(App. Vol.) × FinTech -0.108*** -0.087*** -0.108*** -0.072***(0.016) (0.015) (0.016) (0.016)
Loan controls Yes Yes Yes YesLender FE Yes Yes Yes YesCensus Tract FE Yes Yes Yes YesR2 0.18 0.18 0.27 0.30Observations 68,793,269 44,728,223 23,538,398 13,328,381Application Sample All Refi All RefiLender Sample All All Nonbanks Nonbanks
Table reports regressions of indicator for loan application denial on the log of aggregate application volume,
an interaction with the FinTech indicator, loan controls, lender fixed effects, census-tract fixed effects and
calendar month fixed effects. Data source: HMDA. The sample is restricted to application dates from 2010
to 2016:Q2. Applications are included if they result in either a loan origination, in the application being
approved by the lender but not accepted by the borrower, or an application denial. The sample of lenders
includes all lender types in Columns (1)-(2) and nonbanks only in Columns (3)-(4). Loan controls include
the log of applicant income, the log of the loan amount, indicators for FHA loans, VA loans and jumbo
loans, applicant race, gender, whether the loan has a coapplicant, whether a preapproval was obtained,
the occupancy and lien status of the loan, the property type, and a dummy indicating whether income is
missing. Standard errors reported in parentheses are clustered by lender-month. ***, **, * indicate statistical
significance at 1%, 5%, and 10%, respectively.
55

Table 8: Elasticity of originations with respect to changes in aggregate volume: FinTech vs.other lenders
(1) (2) (3) (4)
∆ ln(App. Vol.) 1.17*** 1.57*** 1.17*** 1.71***(0.01) (0.01) (0.01) (0.02)
∆ ln(App. Vol.) × FinTech -0.06 0.06 -0.06 -0.08(0.07) (0.12) (0.07) (0.12)
Observations 52,030 51,311 24,450 23,831Adjusted R2 0.35 0.35 0.32 0.33
Month FE Yes Yes Yes YesApplication Sample Originated Refi Originated RefiLender Sample All All Nonbanks Nonbanks
Table reports regressions of the log change in lender-level originated loans on the log change in aggregate
application volumes, an interaction with the FinTech indicator, loan controls, lender fixed effects, census-
tract fixed effects and calendar month fixed effects. The unit of observation is lender-month. Data source:
HMDA. The sample is restricted to 2010 through 2016:Q2. Columns (1) and (3) include all originated loans;
columns (2) and (4) included originated refinancing loans. The sample of lenders includes all lender types in
columns (1) and (2) and nonbanks only in columns (3) and (4). Standard errors reported in parentheses are
White-Huber standard errors. ***, **, * indicate statistical significance at 1%, 5%, and 10%, respectively.
56
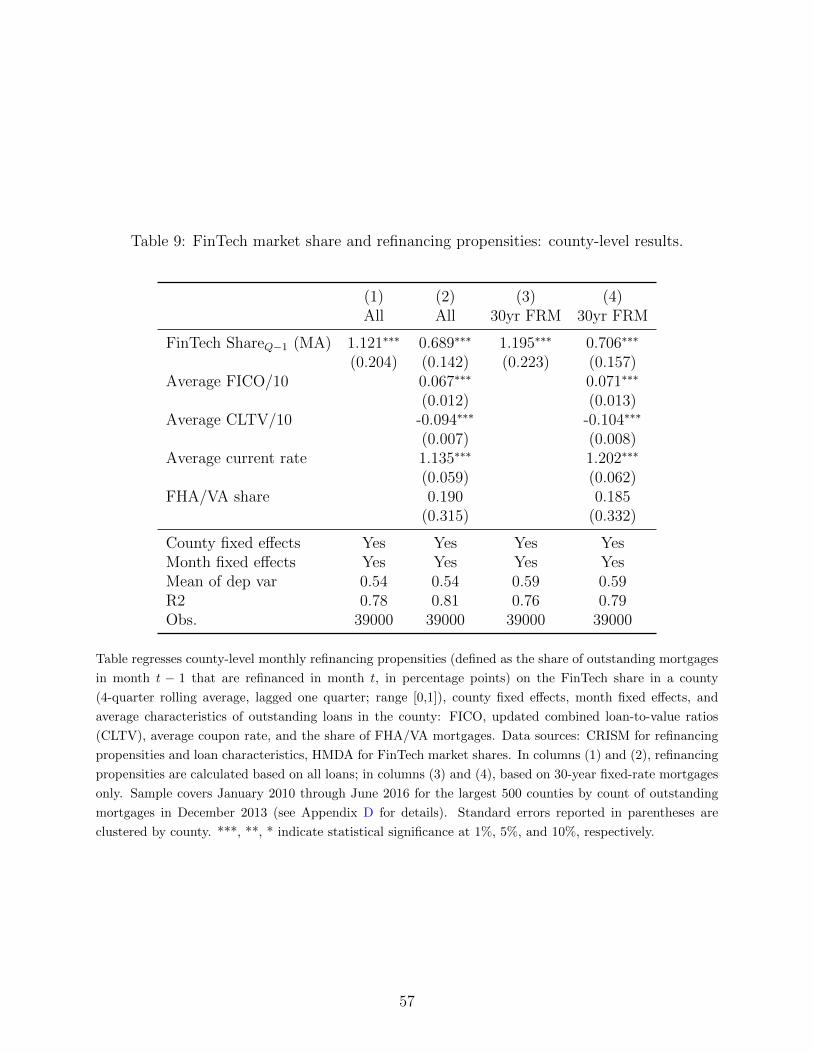
Table 9: FinTech market share and refinancing propensities: county-level results.
(1) (2) (3) (4)All All 30yr FRM 30yr FRM
FinTech ShareQ−1 (MA) 1.121∗∗∗ 0.689∗∗∗ 1.195∗∗∗ 0.706∗∗∗
(0.204) (0.142) (0.223) (0.157)Average FICO/10 0.067∗∗∗ 0.071∗∗∗
(0.012) (0.013)Average CLTV/10 -0.094∗∗∗ -0.104∗∗∗
(0.007) (0.008)Average current rate 1.135∗∗∗ 1.202∗∗∗
(0.059) (0.062)FHA/VA share 0.190 0.185
(0.315) (0.332)
County fixed effects Yes Yes Yes YesMonth fixed effects Yes Yes Yes YesMean of dep var 0.54 0.54 0.59 0.59R2 0.78 0.81 0.76 0.79Obs. 39000 39000 39000 39000
Table regresses county-level monthly refinancing propensities (defined as the share of outstanding mortgages
in month t − 1 that are refinanced in month t, in percentage points) on the FinTech share in a county
(4-quarter rolling average, lagged one quarter; range [0,1]), county fixed effects, month fixed effects, and
average characteristics of outstanding loans in the county: FICO, updated combined loan-to-value ratios
(CLTV), average coupon rate, and the share of FHA/VA mortgages. Data sources: CRISM for refinancing
propensities and loan characteristics, HMDA for FinTech market shares. In columns (1) and (2), refinancing
propensities are calculated based on all loans; in columns (3) and (4), based on 30-year fixed-rate mortgages
only. Sample covers January 2010 through June 2016 for the largest 500 counties by count of outstanding
mortgages in December 2013 (see Appendix D for details). Standard errors reported in parentheses are
clustered by county. ***, **, * indicate statistical significance at 1%, 5%, and 10%, respectively.
57
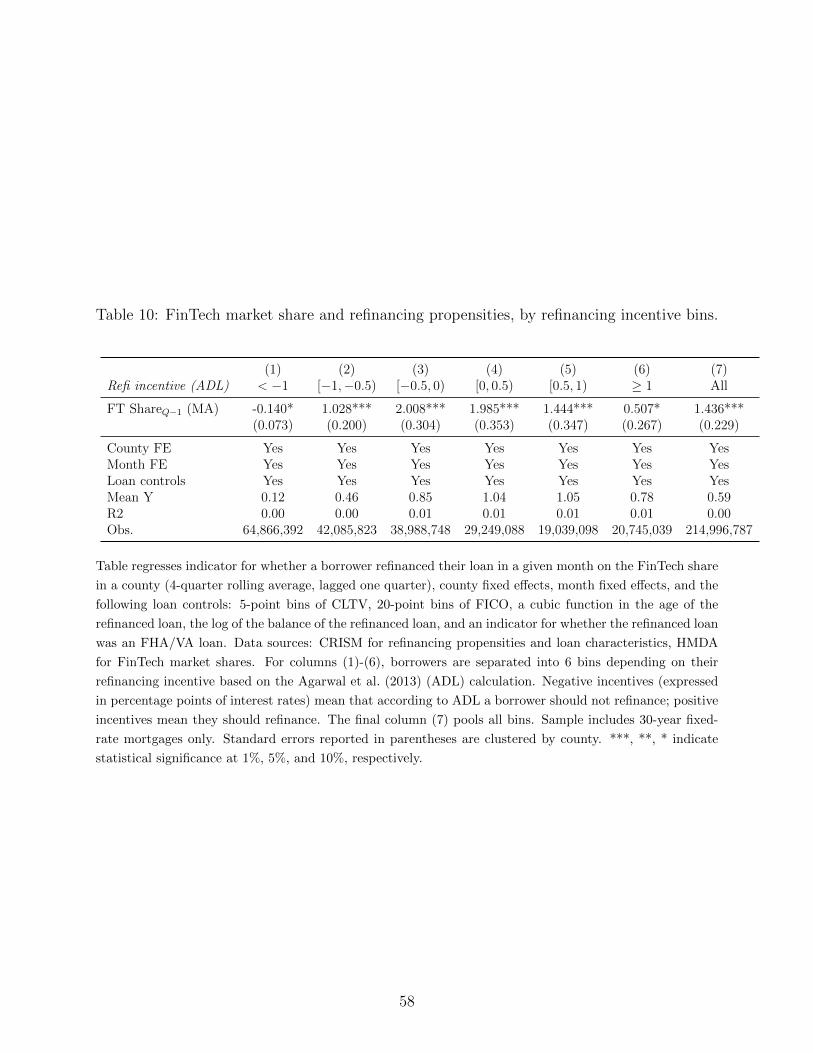
Table 10: FinTech market share and refinancing propensities, by refinancing incentive bins.
(1) (2) (3) (4) (5) (6) (7)Refi incentive (ADL) < −1 [−1,−0.5) [−0.5, 0) [0, 0.5) [0.5, 1) ≥ 1 All
FT ShareQ−1 (MA) -0.140* 1.028*** 2.008*** 1.985*** 1.444*** 0.507* 1.436***(0.073) (0.200) (0.304) (0.353) (0.347) (0.267) (0.229)
County FE Yes Yes Yes Yes Yes Yes YesMonth FE Yes Yes Yes Yes Yes Yes YesLoan controls Yes Yes Yes Yes Yes Yes YesMean Y 0.12 0.46 0.85 1.04 1.05 0.78 0.59R2 0.00 0.00 0.01 0.01 0.01 0.01 0.00Obs. 64,866,392 42,085,823 38,988,748 29,249,088 19,039,098 20,745,039 214,996,787
Table regresses indicator for whether a borrower refinanced their loan in a given month on the FinTech share
in a county (4-quarter rolling average, lagged one quarter), county fixed effects, month fixed effects, and the
following loan controls: 5-point bins of CLTV, 20-point bins of FICO, a cubic function in the age of the
refinanced loan, the log of the balance of the refinanced loan, and an indicator for whether the refinanced loan
was an FHA/VA loan. Data sources: CRISM for refinancing propensities and loan characteristics, HMDA
for FinTech market shares. For columns (1)-(6), borrowers are separated into 6 bins depending on their
refinancing incentive based on the Agarwal et al. (2013) (ADL) calculation. Negative incentives (expressed
in percentage points of interest rates) mean that according to ADL a borrower should not refinance; positive
incentives mean they should refinance. The final column (7) pools all bins. Sample includes 30-year fixed-
rate mortgages only. Standard errors reported in parentheses are clustered by county. ***, **, * indicate
statistical significance at 1%, 5%, and 10%, respectively.
58

Table 11: Who Borrows from FinTech Mortgage Lenders?
Dependent variable: = 100 if originator is FinTech lender, = 0 otherwisePurchases Refinances
All Nonbanks All NonbanksBorrower income and demographyLog(income) 0.104∗∗∗ 0.701∗∗∗ -0.833∗∗∗ -0.159∗∗∗
(0.00650) (0.0173) (0.00725) (0.0275)Gender:
Female 0.0592∗∗∗ 0.184∗∗∗ 0.756∗∗∗ 3.056∗∗∗
(0.00947) (0.0208) (0.0126) (0.0379)Unknown 2.887∗∗∗ 10.13∗∗∗ 6.728∗∗∗ 24.99∗∗∗
(0.0421) (0.117) (0.0437) (0.100)Race and ethnicity:
Black -0.306∗∗∗ -0.387∗∗∗ -0.415∗∗∗ 1.166∗∗∗
(0.0254) (0.0495) (0.0291) (0.0814)Hispanic -0.880∗∗∗ -1.577∗∗∗ -1.432∗∗∗ -1.982∗∗∗
(0.0200) (0.0391) (0.0250) (0.0629)Unknown 1.551∗∗∗ 3.220∗∗∗ 3.632∗∗∗ 6.540∗∗∗
(0.0294) (0.0658) (0.0310) (0.0710)% black or hispanicTRACT -0.228∗∗∗ -1.064∗∗∗ -0.256∗∗∗ -2.273∗∗∗
(0.0166) (0.0394) (0.0165) (0.0501)Access to financeCredit scoreTRACT -0.279∗∗∗ -0.731∗∗∗ -1.068∗∗∗ -3.002∗∗∗
(0.0192) (0.0468) (0.0193) (0.0618)Bank branch densityTRACT 0.467∗∗∗ 0.954∗∗∗ 0.275∗∗∗ 0.479∗∗∗
(0.0262) (0.0574) (0.0201) (0.0530)Technology diffusion and adoptionPopulation densityTRACT 0.141∗∗∗ 0.920∗∗∗ -0.0691∗∗∗ 0.421∗∗∗
(0.0275) (0.0697) (0.0236) (0.0607)Borrower ageTRACT 0.119∗∗∗ 0.340∗∗∗ 0.263∗∗∗ 0.869∗∗∗
(0.0168) (0.0400) (0.0169) (0.0502)% bachelor degreeTRACT 0.307∗∗∗ 0.920∗∗∗ 0.262∗∗∗ 0.690∗∗∗
(0.0213) (0.0529) (0.0180) (0.0553)Internet access% high speed coverageTRACT 0.101∗∗∗ 0.255∗∗∗ 0.0689∗∗∗ 0.371∗∗∗
(0.0127) (0.0316) (0.0127) (0.0461)% with broadband subscriptionCTY -0.132∗∗∗ -0.487∗∗∗ -0.0344∗∗ -0.0551
(0.0179) (0.0460) (0.0167) (0.0555)
Local housing market conditions% home price appreciationCTY -0.0362∗∗∗ -0.836∗∗∗ 0.277∗∗∗ -1.258∗∗∗
(0.0114) (0.0258) (0.0132) (0.0382)Processing time coefficientsTRACT 0.0182 0.205∗∗∗ 0.588∗∗∗ 1.599∗∗∗
(0.0111) (0.0269) (0.0119) (0.0397)Log(2010 home price)CTY -0.127∗∗∗ -0.688∗∗∗ -0.812∗∗∗ -2.993∗∗∗
(0.0188) (0.0471) (0.0213) (0.0675)Additional controls Yes Yes Yes YesObservations 20790255 8901875 32936746 9888845Mean of Dependent Variable 2.888 6.745 6.129 20.41
Linear probability model based on HMDA data from 2010-16. All continuous right-hand size variablesnormalized to have mean of zero and standard deviation of one. Superscripts TRACT and CTY indicatevariable is measured at the census tract or county level of aggregation, respectively, rather than at theloan level. Robust standard errors in parentheses, clustered by census tract. Regressions include controlsfor loan size, loan type, dummies for jumbo loan, coapplicant, owner occupied, other race categories, andmissing values for any variable with positive incidence of missing values. See Internet Appendix for fullresults including coefficients on these variables as well as univariate regressions. See Data Appendix forvariable definitions and sources.∗ p < 0.10, ∗∗ p < 0.05, ∗∗∗ p < 0.0159
Internet Appendix for“The Role of Technology in Mortgage Lending”
Andreas Fuster, Matthew Plosser, Philipp Schnabl, and James Vickery
1

A Processing time: additional analysis
Figure A.1: Distribution of processing times by lender type. (These are residuals aftercontrolling for loan characteristics and census tract × month fixed effects as in Table 3.)
(a) Purchase mortgages
(b) Refinance mortgages
2

Table A.1: Testing whether high FinTech probability is associated with slower processingtime for non-FinTech lenders.
(1) (2) (3) (4)
FinTech 2.547*** -0.808*** 3.109*** -0.559***(0.163) (0.144) (0.216) (0.183)
Loan controls Yes Yes Yes YesLender-Month FE Yes Yes Yes YesLender-Census Tract FE No Yes No YesR2 0.22 0.27 0.30 0.33Observations 47180463 44210993 28616765 26127401Loan type All All Refi RefiSample Non-Fintech Non-Fintech Non-Fintech Non-Fintech
Table regresses loan processing time (in days) for non-FinTech lenders on the predicted probability that an
application would go to a FinTech lender ( FinTech), lender-month fixed effects, lender-census tract fixed
effects, and loan controls. FinTech comes from an unreported first-stage OLS regression where, in the full
sample including all lender types, an indicator for a loan being originated by a FinTech lender is regressed on
census tract-month fixed effects and loan controls. In both stages, loan controls include the log of applicant
income, the log of the loan amount, indicators for FHA loans, VA loans and jumbo loans, applicant race,
gender, loan purpose (purchase or refinancing), whether the loan has a coapplicant, whether a preapproval
was obtained, the occupancy and lien status of the loan, the property type, and a dummy indicating whether
income is missing. Both purchase and refinance loans are included in columns (1)-(2), while only refinance
loans are included in columns (3)-(4). Standard errors reported in parentheses are clustered by lender-month.
***, **, * indicate statistical significance at 1%, 5%, and 10%, respectively.
3

B Is FinTech lending cheaper?
Table A.2: FHA mortgage interest rate regressions based on Ginnie Mae data. Includes30-year fixed-rate mortgages originated 2013-2017.
(1) (2) (3) (4)
FinTech 0.000 -0.023** -0.075*** 0.002(0.009) (0.010) (0.010) (0.008)
FICO -0.002*** -0.002*** -0.001***(0.000) (0.000) (0.000)
LTV 0.000*** 0.003*** -0.001***(0.000) (0.000) (0.000)
DTI 0.000*** 0.001*** -0.001***(0.000) (0.000) (0.000)
Sample All All Purch. RefiPurpose FE? No Yes Yes YesMonth FE? Yes No No NoMonthXState FE? No Yes Yes YesLoan cont.? No Yes Yes YesMean Y 4.00 4.00 4.01 3.96R2 0.31 0.41 0.42 0.46Observations 4097569 4097544 2966644 1130881
Table regresses mortgage interest rate on an indicator variable identifying FinTech issuers, state-by-
origination month fixed effects, loan controls and borrower controls. The sample consists of FHA-insured
30-year fixed-rate mortgages originated over June 2013 to June 2017, obtained from Ginnie Mae MBS
monthly loan-level disclosures. Displayed loan controls include the borrower FICO score, the loan-to-value
ratio (LTV) and the debt-to-income ratio (DTI). Suppressed loans controls include loan purpose type, the
log of the loan amount, and indicators for the number of borrowers, the property type, whether the bor-
rower received down payment assistance, and for whether FICO, LTV, or DTI are missing. Standard errors
reported in parentheses are clustered by issuer-origination month. ***, **, * indicate statistical significance
at 1%, 5%, and 10%, respectively.
4

C Is FinTech lending more elastic? Additional results
Table A.3: Elasticity of processing time with respect to demand proxies: FinTech vs. otherlenders
(1) (2) (3) (4) (5) (6)
Refi Incentive 4.79*** 6.72*** 5.14***(0.20) (0.28) (0.19)
Refi Inc. × FinTech -3.95*** -5.45*** -4.56***(0.64) (0.74) (0.65)
Bartik App. × FinTech 9.73*** 13.78*** 8.97***(0.34) (0.50) (0.35)
Bartik App. × FinTech 0.05 -3.27*** -2.51***(0.82) (0.82) (0.67)
Observations 49,775,312 30,615,852 80,495,817 49,775,312 30,615,852 80,495,817R2 0.20 0.25 0.17 0.19 0.24 0.17
Loan Controls Yes Yes Yes Yes Yes YesLender FE Yes Yes Yes Yes Yes YesCensus Tract FE Yes Yes Yes Yes Yes YesMonth FE Yes Yes Yes Yes Yes YesApplication Sample Originated Refi All Originated Refi AllLender Sample All All All All All All
Table A.3 regresses loan processing time on two proxies for aggregate mortgage demand: the average
outstanding coupon less the 10-yr Treasury yield (Refi Incentive) and the log of the weighted sum of
county-level applications where weights are the unconditional market share of applications received in
the county (Bartik Applications). Regressions include an interaction between the proxy and the FinTech
indicator, loan controls, lender fixed effects, census-tract fixed effects and calendar month fixed effects. The
sample is restricted to application dates from 2010 to 2016Q2. Columns 1 and 4 include all originated
loans; Columns 2 and 5 included originated refinancing loans; and Columns 3 and 6 include all applications
(including denied applications). The sample of lenders includes all lender types. Loan controls include the
log of applicant income, the log of the loan amount, indicators for FHA loans, VA loans and jumbo loans,
applicant race, gender, whether the loan has a coapplicant, whether the application was a preapproval,
the occupancy and lien status of the loan, the property type, and a dummy indicating whether income is
missing. Columns 3 and 6 also include indicators for whether a loan was denied or withdrawn. Standard
errors reported in parentheses are clustered by lender-month. ***, **, * indicate statistical significance at
1%, 5%, and 10%, respectively.
5
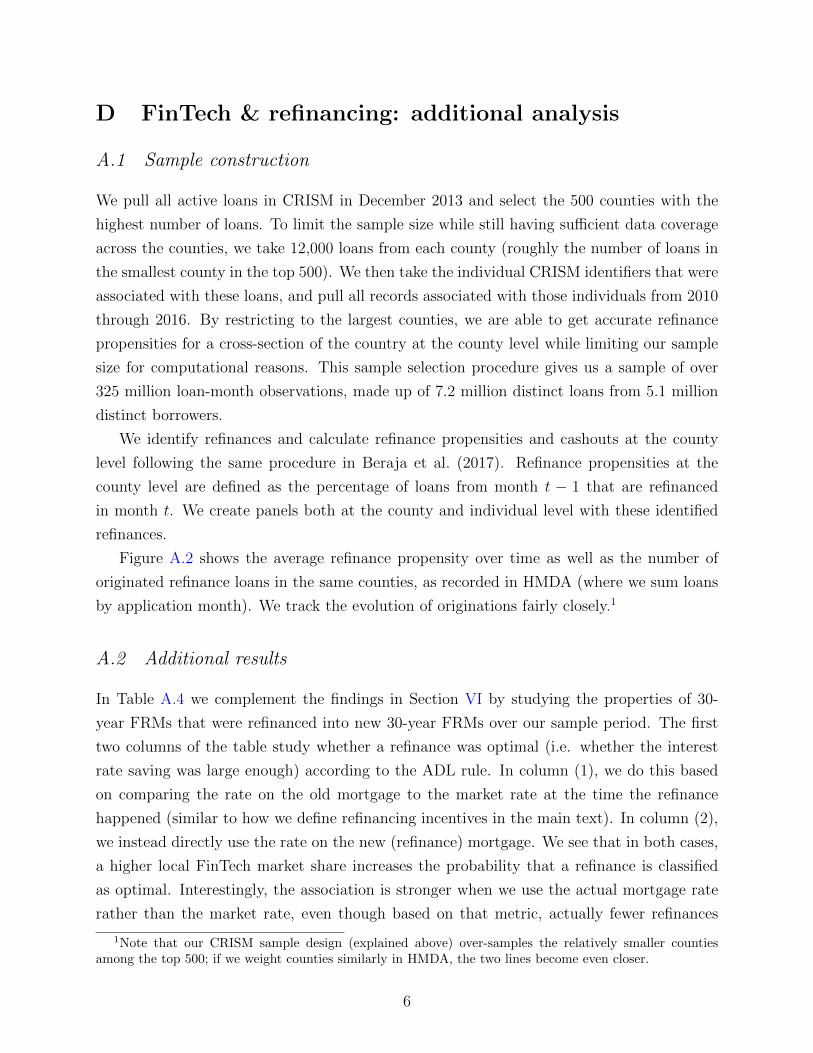
D FinTech & refinancing: additional analysis
A.1 Sample construction
We pull all active loans in CRISM in December 2013 and select the 500 counties with the
highest number of loans. To limit the sample size while still having sufficient data coverage
across the counties, we take 12,000 loans from each county (roughly the number of loans in
the smallest county in the top 500). We then take the individual CRISM identifiers that were
associated with these loans, and pull all records associated with those individuals from 2010
through 2016. By restricting to the largest counties, we are able to get accurate refinance
propensities for a cross-section of the country at the county level while limiting our sample
size for computational reasons. This sample selection procedure gives us a sample of over
325 million loan-month observations, made up of 7.2 million distinct loans from 5.1 million
distinct borrowers.
We identify refinances and calculate refinance propensities and cashouts at the county
level following the same procedure in Beraja et al. (2017). Refinance propensities at the
county level are defined as the percentage of loans from month t − 1 that are refinanced
in month t. We create panels both at the county and individual level with these identified
refinances.
Figure A.2 shows the average refinance propensity over time as well as the number of
originated refinance loans in the same counties, as recorded in HMDA (where we sum loans
by application month). We track the evolution of originations fairly closely.1
A.2 Additional results
In Table A.4 we complement the findings in Section VI by studying the properties of 30-
year FRMs that were refinanced into new 30-year FRMs over our sample period. The first
two columns of the table study whether a refinance was optimal (i.e. whether the interest
rate saving was large enough) according to the ADL rule. In column (1), we do this based
on comparing the rate on the old mortgage to the market rate at the time the refinance
happened (similar to how we define refinancing incentives in the main text). In column (2),
we instead directly use the rate on the new (refinance) mortgage. We see that in both cases,
a higher local FinTech market share increases the probability that a refinance is classified
as optimal. Interestingly, the association is stronger when we use the actual mortgage rate
rather than the market rate, even though based on that metric, actually fewer refinances
1Note that our CRISM sample design (explained above) over-samples the relatively smaller countiesamong the top 500; if we weight counties similarly in HMDA, the two lines become even closer.
6

.2
.4
.6
.8
1
1.2
Agg
rega
te R
efin
ance
Pro
pens
ity (%
)
100
200
300
400
500
600
HM
DA
Ref
inan
ces
(000
s)
2010m1 2011m1 2012m1 2013m1 2014m1 2015m1 2016m1
HMDA Refinances (000s)Aggregate Refinance Propensity (from CRISM)
Figure A.2: Refinance propensity over time: comparing CRISM-derived measure to numberof refinance mortgages in top 500 counties recorded in HMDA.
(only 41%) are classified as optimal.2
In column (3), instead of relying on the ADL calculation, we directly look at the gap
between the old mortgage rate and the new mortgage rate, which averages 1.35%. There,
again, a higher local FinTech share is associated with a larger gap. Finally, the last columns
shows that in places with higher FinTech shares, borrowers were more likely to also withdraw
some home equity when refinancing.3
2This reflects the fact that, on average, rates on actually originated mortgages tend to be somewhathigher than the rate reported in the Freddie Mac Primarly Mortgage Market Survey, which applies to thehighest credit quality borrowers.
3The cash out indicator that is used as the left-hand side variable here is equal to 1 if, after subtracting 2percent from the new loan to cover closing costs, the new mortgage is at least $5,000 above the old mortgage(including junior liens) that is being paid off.
7

Table A.4: Testing for link between local FinTech share and properties of realized refinancesof 30-year fixed-rate mortgages.
(1) (2) (3) (4)Opt. refi? Opt. refi? Rate gap Cash out?(mkt rate) (actual rate) (old−new)
FT ShareQ−1 (MA) 0.266*** 0.610*** 0.939*** 0.175**(0.083) (0.092) (0.122) (0.081)
County FEs Yes Yes Yes YesMonth FEs Yes Yes Yes YesLoan controls Yes Yes Yes YesMean Y 0.55 0.41 1.34 0.17R2 0.35 0.25 0.42 0.13Obs. 666,070 666,070 666,070 666,072
Table shows results of four different regressions of characteristics of refinance loans in CRISM where both
the old and new mortgage are 30-year FRMs. The left-hand side variables are, by column, 1) an indicator
for whether a refinancing occurred at a time where the market interest rate was below the rate at which
the Agarwal et al. (2013) (ADL) rule would prescribe that the borrower refinance (so “1” would mean the
refinancing was “optimal” in that sense); (2) an indicator of whether the mortgage rate on the new (refinance)
loan is below the ADL rate; (3) the difference between the old mortgage rate and the new mortgage rate
(winsorized at 1%); (4) an indicator variable for the refinance involving “cashing out” home equity (set equal
to 1 if the balance of the new loan exceeds the balance of the old loan by more than $5000 plus closing costs
(assumed to correspond to 2 percent of the loan amount). Independent variables in each case include the
one-quarter-lagged four-quarter county-level FinTech market share, county fixed effects, month fixed effects,
and the following loan controls: 5-point bins of CLTV, 20-point bins of FICO, a cubic function in the age of
the refinanced loan, the log of the balance of the refinanced loan, and an indicator for whether the refinanced
loan was an FHA/VA loan. Standard errors reported in parentheses are clustered by county. ***, **, *
indicate statistical significance at 1%, 5%, and 10%, respectively.
8
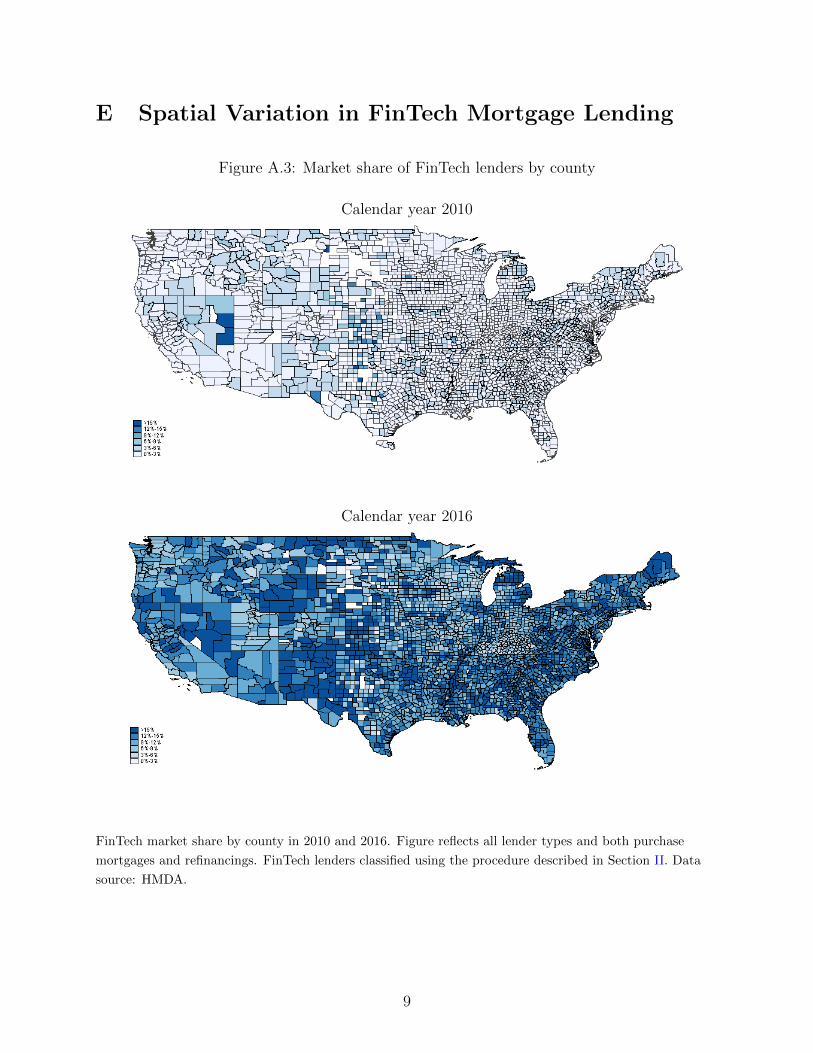
E Spatial Variation in FinTech Mortgage Lending
Figure A.3: Market share of FinTech lenders by county
Calendar year 2010
Calendar year 2016
FinTech market share by county in 2010 and 2016. Figure reflects all lender types and both purchase
mortgages and refinancings. FinTech lenders classified using the procedure described in Section II. Data
source: HMDA.
9

F Cross-sectional regressions: Additional results
Dependent variable: = 100 if fintech lender, = 0 otherwise
Purchases Refinances
All Nonbanks All Nonbanks
Univariate Multivariate Univariate Multivariate Univariate Multivariate Univariate Multivariate
Borrower income and demography
Log(income) -0.0932∗∗∗ 0.104∗∗∗ 0.761∗∗∗ 0.701∗∗∗ -0.549∗∗∗ -0.833∗∗∗ -2.677∗∗∗ -0.159∗∗∗
(0.00777) (0.00650) (0.0242) (0.0173) (0.00877) (0.00725) (0.0321) (0.0275)
Gender:
Female 0.00683 0.0592∗∗∗ -0.502∗∗∗ 0.184∗∗∗ -0.130∗∗∗ 0.756∗∗∗ 0.199∗∗∗ 3.056∗∗∗
(0.00973) (0.00947) (0.0218) (0.0208) (0.0119) (0.0126) (0.0380) (0.0379)
Unknown 3.027∗∗∗ 2.887∗∗∗ 13.09∗∗∗ 10.13∗∗∗ 8.712∗∗∗ 6.728∗∗∗ 30.88∗∗∗ 24.99∗∗∗
(0.0334) (0.0421) (0.120) (0.117) (0.0384) (0.0437) (0.0990) (0.100)
Race and ethnicity:
Black 0.0808∗∗∗ -0.306∗∗∗ -1.181∗∗∗ -0.387∗∗∗ -0.218∗∗∗ -0.415∗∗∗ -2.862∗∗∗ 1.166∗∗∗
(0.0276) (0.0254) (0.0568) (0.0495) (0.0298) (0.0291) (0.0877) (0.0814)
Hispanic -0.729∗∗∗ -0.880∗∗∗ -3.314∗∗∗ -1.577∗∗∗ -1.542∗∗∗ -1.432∗∗∗ -7.162∗∗∗ -1.982∗∗∗
(0.0180) (0.0200) (0.0370) (0.0391) (0.0253) (0.0250) (0.0759) (0.0629)
Unknown 2.594∗∗∗ 1.551∗∗∗ 8.604∗∗∗ 3.220∗∗∗ 7.206∗∗∗ 3.632∗∗∗ 19.53∗∗∗ 6.540∗∗∗
(0.0262) (0.0294) (0.0796) (0.0658) (0.0303) (0.0310) (0.0814) (0.0710)
% black or hispanicTRACT 0.0449∗∗∗ -0.228∗∗∗ -0.816∗∗∗ -1.064∗∗∗ 0.288∗∗∗ -0.256∗∗∗ -1.452∗∗∗ -2.273∗∗∗
(0.0102) (0.0166) (0.0224) (0.0394) (0.0117) (0.0165) (0.0393) (0.0501)
Access to finance
Credit scoreTRACT -0.0777∗∗∗ -0.279∗∗∗ 0.408∗∗∗ -0.731∗∗∗ -0.532∗∗∗ -1.068∗∗∗ -2.523∗∗∗ -3.002∗∗∗
(0.0123) (0.0192) (0.0315) (0.0468) (0.0120) (0.0193) (0.0423) (0.0618)
Bank branch densityTRACT 0.523∗∗∗ 0.467∗∗∗ 1.040∗∗∗ 0.954∗∗∗ 0.266∗∗∗ 0.275∗∗∗ -1.382∗∗∗ 0.479∗∗∗
(0.0239) (0.0262) (0.0604) (0.0574) (0.0186) (0.0201) (0.0623) (0.0530)
Technology diffusion and adoption
Population densityTRACT 0.269∗∗∗ 0.141∗∗∗ 0.672∗∗∗ 0.920∗∗∗ -0.000996 -0.0691∗∗∗ -1.538∗∗∗ 0.421∗∗∗
(0.0237) (0.0275) (0.0669) (0.0697) (0.0194) (0.0236) (0.0714) (0.0607)
Borrower ageTRACT 0.0400∗∗∗ 0.119∗∗∗ 0.673∗∗∗ 0.340∗∗∗ -0.0186 0.263∗∗∗ 1.680∗∗∗ 0.869∗∗∗
(0.0154) (0.0168) (0.0390) (0.0400) (0.0161) (0.0169) (0.0538) (0.0502)
% bachelor degreeTRACT 0.116∗∗∗ 0.307∗∗∗ 0.940∗∗∗ 0.920∗∗∗ -0.199∗∗∗ 0.262∗∗∗ -1.388∗∗∗ 0.690∗∗∗
(0.0175) (0.0213) (0.0476) (0.0529) (0.0143) (0.0180) (0.0489) (0.0553)
Internet access
% high speed 0.192∗∗∗ 0.101∗∗∗ 0.294∗∗∗ 0.255∗∗∗ 0.120∗∗∗ 0.0689∗∗∗ -0.611∗∗∗ 0.371∗∗∗
coverageTRACT (0.0118) (0.0127) (0.0316) (0.0316) (0.0130) (0.0127) (0.0575) (0.0461)
% with broadband -0.0924∗∗∗ -0.132∗∗∗ -0.466∗∗∗ -0.487∗∗∗ -0.279∗∗∗ -0.0344∗∗ -2.864∗∗∗ -0.0551
subscriptionCTY (0.0131) (0.0179) (0.0341) (0.0460) (0.0138) (0.0167) (0.0462) (0.0555)
Local housing market conditions
% home price -0.0522∗∗∗ -0.0362∗∗∗ -0.971∗∗∗ -0.836∗∗∗ 0.315∗∗∗ 0.277∗∗∗ -1.999∗∗∗ -1.258∗∗∗
appreciationCTY (0.0112) (0.0114) (0.0271) (0.0258) (0.0137) (0.0132) (0.0443) (0.0382)
Processing time 0.0961∗∗∗ 0.0182 0.204∗∗∗ 0.205∗∗∗ 0.760∗∗∗ 0.588∗∗∗ 1.561∗∗∗ 1.599∗∗∗
coefficientsTRACT (0.0108) (0.0111) (0.0290) (0.0269) (0.0133) (0.0119) (0.0502) (0.0397)
Log(2010 home price)CTY -0.150∗∗∗ -0.127∗∗∗ -0.628∗∗∗ -0.688∗∗∗ -0.440∗∗∗ -0.812∗∗∗ -4.321∗∗∗ -2.993∗∗∗
(0.0111) (0.0188) (0.0284) (0.0471) (0.0139) (0.0213) (0.0411) (0.0675)
Observations 20790255 20790255 8901875 8901875 32936746 32936746 9888845 9888845
Mean Dependent Var 2.888 2.888 6.745 6.745 6.129 6.129 20.41 20.41
10

Dependent variable: = 100 if fintech lender, = 0 otherwise
Purchases Refinances
All Nonbanks All Nonbanks
Univariate Multivariate Univariate Multivariate Univariate Multivariate Univariate Multivariate
Additional race variables
American Indian/Alaska Native -0.605∗∗∗ -0.351∗∗∗ -1.837∗∗∗ -1.165∗∗∗ 0.185∗∗∗ 0.873∗∗∗ 0.431∗∗ 1.100∗∗∗
(0.0471) (0.0469) (0.100) (0.103) (0.0697) (0.0681) (0.200) (0.199)
Asian -0.401∗∗∗ -0.223∗∗∗ -0.820∗∗∗ -0.573∗∗∗ -1.673∗∗∗ -0.582∗∗∗ -8.575∗∗∗ -2.263∗∗∗
(0.0289) (0.0309) (0.0679) (0.0698) (0.0403) (0.0445) (0.105) (0.123)
Hawaiian/Pacific Islander -0.198∗∗∗ -0.0433 -1.731∗∗∗ -0.307∗∗∗ -0.815∗∗∗ -0.316∗∗∗ -5.427∗∗∗ 0.309
(0.0611) (0.0614) (0.114) (0.113) (0.0809) (0.0916) (0.212) (0.220)
Missing variable indicators
Missing Log(income) -3.037∗∗∗ -5.187∗∗∗ -7.263∗∗∗ -11.55∗∗∗ -2.545∗∗∗ -9.490∗∗∗ -14.23∗∗∗ -18.42∗∗∗
(0.0144) (0.0297) (0.0526) (0.151) (0.0207) (0.0290) (0.0609) (0.0693)
Missing % black or hispanicTRACT 4.111∗∗∗ 5.285∗∗∗ 2.929∗∗∗ 7.582∗∗∗ -0.0931 3.341 -5.258 4.777
(1.214) (1.383) (0.556) (1.971) (2.551) (2.698) (6.680) (5.378)
Missing Credit scoreTRACT -0.916∗∗∗ -0.589∗∗∗ -2.476∗∗∗ -0.948 -1.354∗∗∗ -0.312 -4.354∗∗∗ -1.116
(0.191) (0.198) (0.462) (0.636) (0.401) (0.397) (1.191) (1.318)
Missing Bank branch densityTRACT 0.156∗∗∗ 0.129∗∗∗ -0.213∗∗∗ 0.0722 0.615∗∗∗ 0.234∗∗∗ 0.468∗∗∗ 0.469∗∗∗
(0.0272) (0.0318) (0.0670) (0.0771) (0.0294) (0.0305) (0.108) (0.101)
Missing Population densityTRACT 1.412 -1.939∗∗∗ 1.100 -3.873∗∗∗ -1.702 -2.794 -6.470∗ -1.920
(1.632) (0.432) (1.476) (0.996) (1.100) (1.920) (3.674) (5.038)
Missing Borrower ageTRACT -0.724∗∗ 0.176 -2.392∗∗∗ -0.343 -1.070 -0.336 -4.657∗∗ -1.447
(0.363) (0.429) (0.706) (0.998) (0.767) (0.707) (2.145) (2.225)
Missing % bachelor degreeTRACT 2.803∗ 0.992 1.941∗ 0.544 -1.160 -0.289 -6.413 -3.266
(1.535) (0.726) (1.098) (1.945) (1.560) (1.629) (4.561) (5.304)
Missing % high speed -0.947∗∗∗ -0.886∗∗∗ -1.532∗∗∗ -1.917∗∗∗ -0.718∗∗∗ -0.652∗∗∗ -0.575∗∗∗ -2.222∗∗∗
coverageTRACT (0.0251) (0.0250) (0.0628) (0.0604) (0.0268) (0.0243) (0.0979) (0.0766)
Missing % with broadband -0.222∗∗∗ 0.613∗∗∗ 2.194∗∗∗ 3.157∗∗∗ -0.482∗∗∗ 0.0861∗∗ 6.369∗∗∗ 2.676∗∗∗
subscriptionCTY (0.0280) (0.0362) (0.0968) (0.116) (0.0326) (0.0355) (0.142) (0.134)
Missing % home price -0.675∗∗∗ 0.109∗∗ -0.190∗∗ 0.150 -0.395∗∗∗ 0.0437 6.062∗∗∗ 0.391
appreciationCTY (0.0241) (0.0518) (0.0835) (0.172) (0.0315) (0.0747) (0.123) (0.270)
Missing Processing time 0.179∗∗∗ 0.0334 -0.594∗∗∗ -0.314∗∗∗ 0.733∗∗∗ 0.135∗∗∗ -0.398∗∗∗ -0.387∗∗∗
coefficientsTRACT (0.0426) (0.0475) (0.0962) (0.106) (0.0455) (0.0475) (0.140) (0.136)
Missing Log(2010 home price)CTY -0.704∗∗∗ -0.728∗∗∗ 0.0130 -0.906∗∗∗ -0.415∗∗∗ 0.384∗∗∗ 5.403∗∗∗ 2.375∗∗∗
(0.0237) (0.0536) (0.0790) (0.171) (0.0306) (0.0762) (0.118) (0.273)
Other loan controls
Log(loan size) 0.0252∗∗∗ 0.0909∗∗∗ -0.138∗∗∗ -0.494∗∗∗ 1.295∗∗∗ 2.435∗∗∗ -5.397∗∗∗ -1.665∗∗∗
(0.00930) (0.00931) (0.0264) (0.0240) (0.0108) (0.00762) (0.0487) (0.0626)
Jumbo Loans -1.951∗∗∗ -2.599∗∗∗ 0.605∗∗∗ -0.524∗∗∗ -4.578∗∗∗ -6.870∗∗∗ -6.122∗∗∗ -0.401∗∗∗
(0.0226) (0.0314) (0.116) (0.100) (0.0272) (0.0358) (0.132) (0.129)
Loan Type: FHA 1.078∗∗∗ 1.223∗∗∗ -1.124∗∗∗ -0.379∗∗∗ 5.864∗∗∗ 9.225∗∗∗ -2.041∗∗∗ 2.884∗∗∗
(0.0165) (0.0149) (0.0358) (0.0286) (0.0341) (0.0362) (0.0585) (0.0593)
Loan Type: VA 0.0610∗∗∗ 0.497∗∗∗ -1.282∗∗∗ -0.889∗∗∗ 2.990∗∗∗ 7.633∗∗∗ -3.873∗∗∗ 3.893∗∗∗
(0.0229) (0.0222) (0.0458) (0.0444) (0.0494) (0.0486) (0.0846) (0.0806)
No Coapplicant 0.533∗∗∗ 0.469∗∗∗ 0.498∗∗∗ 0.860∗∗∗ 0.451∗∗∗ 0.138∗∗∗ -0.755∗∗∗ -1.694∗∗∗
(0.00977) (0.00945) (0.0230) (0.0215) (0.0121) (0.0121) (0.0368) (0.0343)
Owner Occupied 0.543∗∗∗ 0.0652∗∗∗ -1.652∗∗∗ -0.589∗∗∗ 1.881∗∗∗ 0.908∗∗∗ 3.194∗∗∗ 3.855∗∗∗
(0.0176) (0.0193) (0.0619) (0.0593) (0.0203) (0.0189) (0.0694) (0.0658)
Observations 20790255 20790255 8901875 8901875 32936746 32936746 9888845 9888845
Mean Dependent Var 2.888 2.888 6.745 6.745 6.129 6.129 20.41 20.41
Linear probability model based on HMDA data from 2010-16. All continuous right-hand size variables normalized to have mean of zero and standard deviation of one.TRACT and CTY indicate variable is measured at the census tract or county level of aggregation, respectively, rather than at the loan level. Robust standard errors in
parentheses, clustered by census tract. Regressions include controls for loan size, loan type, dummies for jumbo loan, coapplicant, owner occupied, other race categories,
and missing values for any variable with positive incidence of missing values. See Internet Appendix for full results including coefficients on these variables as well as
univariate regressions. See Data Appendix for variable definitions and sources.∗ p < 0.10, ∗∗ p < 0.05, ∗∗∗ p < 0.01
11
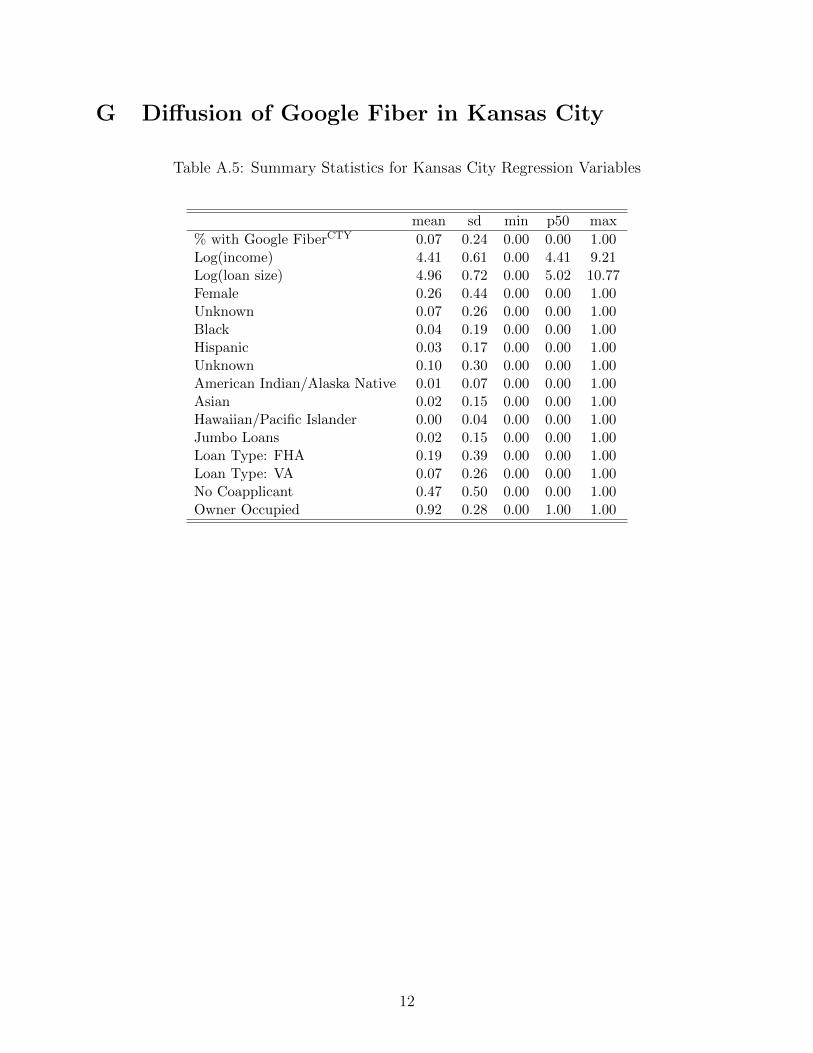
G Diffusion of Google Fiber in Kansas City
Table A.5: Summary Statistics for Kansas City Regression Variables
mean sd min p50 max
% with Google FiberCTY 0.07 0.24 0.00 0.00 1.00Log(income) 4.41 0.61 0.00 4.41 9.21Log(loan size) 4.96 0.72 0.00 5.02 10.77Female 0.26 0.44 0.00 0.00 1.00Unknown 0.07 0.26 0.00 0.00 1.00Black 0.04 0.19 0.00 0.00 1.00Hispanic 0.03 0.17 0.00 0.00 1.00Unknown 0.10 0.30 0.00 0.00 1.00American Indian/Alaska Native 0.01 0.07 0.00 0.00 1.00Asian 0.02 0.15 0.00 0.00 1.00Hawaiian/Pacific Islander 0.00 0.04 0.00 0.00 1.00Jumbo Loans 0.02 0.15 0.00 0.00 1.00Loan Type: FHA 0.19 0.39 0.00 0.00 1.00Loan Type: VA 0.07 0.26 0.00 0.00 1.00No Coapplicant 0.47 0.50 0.00 0.00 1.00Owner Occupied 0.92 0.28 0.00 1.00 1.00
12

Tab
leA
.6:
Fin
tech
Mor
tgag
eShar
e&
Goog
leF
iber
Acc
ess
Dep
enden
tva
riab
le:
=10
0if
finte
chle
nder
,=
0ot
her
wis
e
Purc
has
esR
efinan
ces
All
Non
ban
kA
llN
onban
k
%w
ith
Goog
leF
iber
TR
AC
T-0
.800
∗∗∗
-0.7
38∗∗
∗-1
.260
-0.9
03-0
.487
-0.4
170.
0186
0.59
5(0
.244
)(0
.243
)(0
.935
)(0
.926
)(0
.357
)(0
.341
)(1
.023
)(0
.996
)Y
ear-
Mon
thF
Es
YY
YY
YY
YY
Cen
sus
Tra
ctF
Es
YY
YY
YY
YY
Bor
row
er&
Loa
nC
ontr
ols
NY
NY
NY
NY
Obse
rvat
ions
1383
0613
8306
3479
634
796
1807
7718
0777
5189
051
890
Mea
nD
epen
den
tV
ar2.
147
2.14
78.
535
8.53
55.
189
5.18
918
.08
18.0
8
Lin
ear
pro
bab
ilit
ym
od
elof
bor
row
ing
from
aF
inT
ech
len
der
on
Fib
eracc
ess,
base
don
HM
DA
data
from
2011-1
6.
Rob
ust
stan
dar
der
rors
inp
aren
thes
es,
clu
ster
edby
censu
str
act
.B
orr
ower
an
dlo
an
chara
cter
isti
csin
clu
de
ap
pli
cant
in-
com
e,in
dic
ator
for
mis
sin
gap
pli
cant
inco
me,
loan
size
,b
orr
ower
gen
der
,ra
ce,&
eth
nic
ity
ind
icato
rs,lo
an
typ
e,co
ap
pli
cant
ind
icat
or,
and
own
erocc
up
ied
ind
icat
or.
∗p<
0.10,∗∗
p<
0.05,∗∗
∗p<
0.0
1
13

Figure A.6: Staggered Entry of Google Fiber
Google Fiber Availability in December 2011
No Google Fiber
Google Fiber Availability in December 2015
No Google Fiber<75% 75% - 95%≥95%
Figure shows the share of the population for each census tract that lives in a census block with Google
Fiber in Kansas City. Source: NTIA and FCC data on Internet coverage by census block, provider, and
technology in December 2011 and 2015. 14