The role of structural facial asymmetry in asymmetry of ... · structural asymmetry in the face...
22
The role of structural facial asymmetry in asymmetry of peak facial expressions Karen L. Schmidt University of Pittsburgh, PA, USA Yanxi Liu Carnegie Mellon University, Pittsburgh, PA, USA Jeffrey F. Cohn University of Pittsburgh, PA, USA Asymmetric facial expression is generally attributed to asymmetry in movement, but structural asymmetry in the face may also affect asymmetry of expression. Asymmetry in posed expressions was measured using image-based approaches in digitised sequences of facial expression in 55 individuals, N /16 men, N /39 women. Structural asymmetry (at neutral expression) was higher in men than women and accounted for .54, .62, and .66 of the variance in asymmetry at peak expression for joy, anger, and disgust expressions, respectively. Movement asymmetry (measured by change in pixel values over time) was found, but was unrelated to peak asymmetry in joy or anger expressions over the whole face and in facial subregions relevant to the expression. Movement asymmetry was negatively related to peak asymmetry in disgust expressions. Sidedness of movement asymmetry (defined as the ratio of summed movement on the left to movement on the right) was consistent across emotions within individuals. Sidedness was found only for joy expressions, which had significantly more movement on the left. The significant role of structural asymmetry in asymmetry of emotion expression and the exploration of facial expression asymmetry have important implications for evolutionary interpretations of facial signalling and facial expressions in general. Address correspondence to: Karen L. Schmidt, Department of Psychiatry, University of Pittsburgh, 121 University Place, Pittsburgh PA 15217, USA. E-mail: [email protected] This study is part of a larger programme of research that is ongoing in the Department of Psychiatry at the University of Pittsburgh, in collaboration with the Department of Computer Science and the Robotics Institute at Carnegie Mellon University. This study was supported in part by grants from the National Institute of Mental Health (MH 15279 and MH067976 (K. Schmidt) and MH51435 (J. Cohn). Additional support for this project was received from Office of Naval Research (HID 29-203). The authors acknowledge the contribution of Rebecca McNutt to this article. A preliminary version of these results was presented at the Tenth Annual Conference: Facial Measurement and Meaning in Rimini, Italy, September 2003. LATERALITY, 2006, 11 (6), 540 561 # 2006 Psychology Press, an imprint of the Taylor & Francis Group, an informabusiness http://www.psypress.com/laterality DOI: 10.1080/13576500600832758
Transcript of The role of structural facial asymmetry in asymmetry of ... · structural asymmetry in the face...
The role of structural facial asymmetry in asymmetry of
peak facial expressions
Karen L. Schmidt
University of Pittsburgh, PA, USA
Yanxi Liu
Carnegie Mellon University, Pittsburgh, PA, USA
Jeffrey F. Cohn
University of Pittsburgh, PA, USA
Asymmetric facial expression is generally attributed to asymmetry in movement,
but structural asymmetry in the face may also affect asymmetry of expression.
Asymmetry in posed expressions was measured using image-based approaches in
digitised sequences of facial expression in 55 individuals, N�/16 men, N�/39
women. Structural asymmetry (at neutral expression) was higher in men than
women and accounted for .54, .62, and .66 of the variance in asymmetry at peak
expression for joy, anger, and disgust expressions, respectively. Movement
asymmetry (measured by change in pixel values over time) was found, but was
unrelated to peak asymmetry in joy or anger expressions over the whole face and in
facial subregions relevant to the expression. Movement asymmetry was negatively
related to peak asymmetry in disgust expressions. Sidedness of movement
asymmetry (defined as the ratio of summed movement on the left to movement
on the right) was consistent across emotions within individuals. Sidedness was
found only for joy expressions, which had significantly more movement on the left.
The significant role of structural asymmetry in asymmetry of emotion expression
and the exploration of facial expression asymmetry have important implications for
evolutionary interpretations of facial signalling and facial expressions in general.
Address correspondence to: Karen L. Schmidt, Department of Psychiatry, University of
Pittsburgh, 121 University Place, Pittsburgh PA 15217, USA. E-mail: [email protected]
This study is part of a larger programme of research that is ongoing in the Department of
Psychiatry at the University of Pittsburgh, in collaboration with the Department of Computer
Science and the Robotics Institute at Carnegie Mellon University. This study was supported in part
by grants from the National Institute of Mental Health (MH 15279 and MH067976 (K. Schmidt)
and MH51435 (J. Cohn). Additional support for this project was received from Office of Naval
Research (HID 29-203). The authors acknowledge the contribution of Rebecca McNutt to this
article. A preliminary version of these results was presented at the Tenth Annual Conference: Facial
Measurement and Meaning in Rimini, Italy, September 2003.
LATERALITY, 2006, 11 (6), 540�561
# 2006 Psychology Press, an imprint of the Taylor & Francis Group, an informa business
http://www.psypress.com/laterality DOI: 10.1080/13576500600832758

Asymmetric facial movement has generally been interpreted as the primary
source of asymmetry in emotional facial expression (Sackeim, Weiman, &
Forman, 1984). The side that moves more is described as corresponding to
the more expressive side of the face at peak expression. This is attributed to
the effects of functional brain asymmetry on facial muscles, especially during
deliberate emotional expression (Sackeim, 1985; Sackeim, Gur, & Saucy,
1978). Human faces, however, are also structurally asymmetric, often with
one side larger than the other. Structural asymmetry, approximated by
distance from facial landmarks to centre points, ranges from 4% to 12%
average difference, depending on the landmark measured (Ferrario, Sforza,
Ciusa, Dellavia, & Tartaglia, 2001). It is logical to suggest therefore that
structural asymmetry in the face could be a major source of expression
asymmetry. Although earlier work found that asymmetry of facial measure-
ments was not related to asymmetry of facial expression (Koff, Borod, &
White, 1981; Sackeim et al., 1984), newer and more comprehensive objective
measures of the face allow a more detailed analysis of this question.
In this study we used objective quantification of facial asymmetry to
describe and evaluate structural, movement, and peak expression asymmetry
across three emotion expressions (joy, anger, and disgust). We compared the
role of movement asymmetry with the role of structural asymmetry in
creating asymmetric emotion expressions, testing the hypothesis that
structural asymmetry has a significant role in creating facial asymmetry at
peak expression. Finally, we compared the sidedness of expression in three
emotion conditions with previously identified values to determine if
expressions were left-sided as previously found.Although the asymmetry of facial expressions of emotion is well
established in the literature (Borod, Koff, Yecker, Santschi & Schmidt,
1998), the relative contributions of structural facial asymmetry during
emotional expression remain uncertain, since most studies of facial
expression either have not measured structural asymmetry or were unable
to assess asymmetry at resting neutral.1 The chimeric approach that
compares judgements of expressivity in right/right composite face images
to left/left face images relies on judgements of relative expressiveness in peak
expression images (Ekman, 1980). In this approach to measuring asymmetry
of facial expression, the sides of the face are equally inexpressive at neutral
by definition (the face as a whole is neutral). Judgement studies of the resting
neutral face have found that perceivers did not differ in their attributions
of situational disposition and emotion for different sides of the face
(Van Gelder & Borod, 1990). This suggests that emotion in the expressive
face chimeras resulted wholly from facial movements during expression.
1 This is in contrast to studies where participants were asked to ‘‘pose neutral’’ (Borod, Kent,
Koff, Martin, & Alpert, 1988).
FACIAL ASYMMETRY IN EXPRESSION 541

However, Kowner (1995) found that the neutral left hemiface was viewed as
more intense in more cases than the right neutral hemiface (Kowner, 1995).
For example, Kowner (1998) found that composite faces constructed using
the participants’ smaller neutral hemifaces were perceived as revealing more
positive and more intense emotion than those constructed of participants’
larger neutral hemifaces (Kowner, 1998).The effects of side-to-side differences in neutral expression are unre-
solved, as these studies do not compare hemifacial size or other measures of
asymmetry in resting faces with the expressiveness of either side of the same
face at peak facial expression. Particularly in the case of directional
asymmetry, where one entire hemiface is larger than the other, one might
reasonably conclude that expression on the larger side would appear more
intense than that on the other side of the face. If hemifacial composites
reveal differences in intensity of emotion in the neutral face, this suggeststhat there are significant side-to-side differences in facial structure.
A measurable and perceptible amount of asymmetry characterises the
human face at rest, and this structural asymmetry is socially and biologically
relevant. Evolutionarily, facial asymmetry (readily visible to interaction
partners) has been proposed as a signal of developmental stability that can
indicate mate quality (Grammer & Thornhill, 1994; Kowner 2001). In
general, the less asymmetric a face is, the more attractive it appears
(Grammer, Fink, Moller, & Thornhill, 2003; Grammer & Thornhill, 1994;but see Kowner, 2001, for an alternate view). Evolutionary hypotheses of
facial asymmetry based on the concept of fluctuating asymmetry (asymme-
tries measured in features across the body) have found that the face is
asymmetric (Fink, Manning, Neave, & Grammer, 2004; Gangestad &
Thornhill, 1997; Grammer & Thornhill, 1994; Hume & Montgomerie,
2001; Namano, Behrend, Harcourt, & Wilson, 2000). This asymmetry is
believed to reflect past developmental stresses and to be related to the likely
quality of the individual as a potential mating partner (Fink et al., 2004).However, these articles do not address the question of whether or not the
asymmetry is primarily directional or sided (for discussion of directional
asymmetry see Swaddle & Cuthill, 1995). Rather, they report multiple
variable departures from symmetry around a midline.
Two studies that assess the sidedness of the neutral face in holistic
fashion, allowing for assessment of directional asymmetry, have found
variation in hemifacial size or ‘‘facedness’’ by gender and occupation (Smith,
1998, 2000). Faces of male students and those of professors in academicdepartments requiring extensive spatial or mathematic ability were larger on
the left side on average. Female students and professors in humanities
departments were primarily right-faced. In the study of 90 undergraduates,
women were found to have larger right faces, and men were found to have
larger left faces (Smith, 2000).
542 SCHMIDT, LIU, COHN
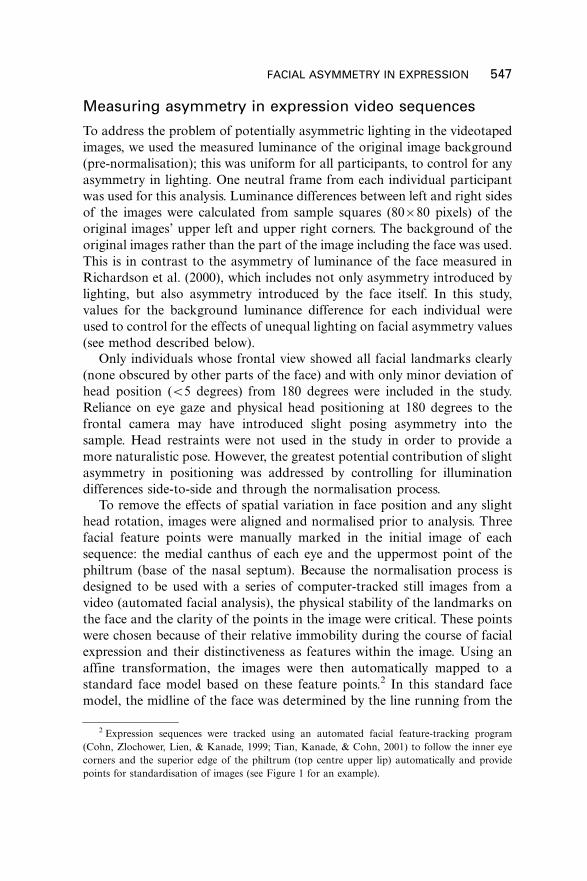
The degree of reported structural asymmetry varies across studies in
which it has been measured quantitatively rather than holistically. Anato-
mical measurements of the soft tissue of the face in North Americans have
found an overall degree of asymmetry, about 3% in children (Farkas &
Cheung, 1981), with greater upper face asymmetry in 18-year-old men than
in 18-year-old women. Measurements in this study consisted of the relativeposition of anatomical landmarks or the length of chords running from
laterally placed landmarks on the ear, cheekbones, and lower jaw to
landmarks at the centre of the face (Farkas & Cheung, 1981). These
measurements provide overall estimates of asymmetry in the different
regions of the face, but may not be directly relevant to the focus of the
current study on the question of facial expression asymmetry, where
appearance changes in features occur more towards the midline of
the face. Another study of facial soft tissue found asymmetry ranging from4% to 12% in three-dimensional landmarks in adults of different ages and
genders. There were no significant gender differences observed overall,
although results were similar to those of Farkas and Cheung (1981) in that
adolescents of both genders had the greatest asymmetry (Ferrario et al.,
2001). This study, in contrast to earlier work, relied on a larger number of
facial landmarks, with some positioned more to the front of the face, and
therefore potentially more relevant to asymmetry change in facial expression.
Several earlier studies have reported the effects of measured structuralfacial asymmetry on expression asymmetry, as measured through judge-
ments of expression in different sides of the face. Early reports of both
structural asymmetry and asymmetric facial expression in the same
participants showed no effect of structural asymmetry in a limited set of
facial measurements on the judgements of expressivity in chimeric facial
expressions (Sackeim, 1985) and on the overall mobility of the sides of the
face (Koff et al., 1981). However, structural asymmetry has never been
compared to quantitatively measured movement asymmetry in the sameindividuals, although the possibility that structural asymmetry may play a
role in facial expression asymmetry has been suggested (Sackeim, 1985). In
addition to finding asymmetry, researchers have found that the face is often
asymmetric during facial expression, with one side*most often the left*appearing more expressive (Borod et al., 1998). However, the majority of
studies of facial appearance during deliberate expression have found that
both positive and negative emotional expressions, as well as non-emotional
expressions, are likely to be left-sided (Asthana, 2001; Asthana & Mandal,1997; Dimberg & Petterson, 2000; Kowner, 1995; Pennock, Johnson,
Manders, & VanSwearingen, 1999; Skinner & Mullen, 1991). There is also
support for a general left-sided bias for emotion expression in non-human
primates (Fernandez-Carriba, Loeches, Morcillo, & Hopkins, 2002; Hauser
& Akre, 2001). These data are interpreted as supporting the hypothesis that
FACIAL ASYMMETRY IN EXPRESSION 543

the right hemisphere dominates the processing of emotion, including
emotional expression (Phillips & David, 1997). They are also interpreted
as supporting facial movement as the origin of sidedness in facial expression.
The current study is based on the quantitative measure of asymmetry in
image sequences that begin with neutral facial expression and end at peak
facial expression. These quantitative image-based approaches to themeasurement of facial asymmetry are based on computer vision (measure-
ment of pixelwise change in images of the face) and preserve the capability of
looking at the whole face while allowing the objective and accurate measure
of asymmetry over the course of expression. In a study of pixelwise change in
face images during expression, Scriba and coworkers (Scriba, Stoeckli,
Pollack, Veraguth, & Fisch, 1999) reported an average of 7�9% movement
asymmetry during deliberate expression in individuals of either gender,
similar to the values reported in Richardson, Bowers, Bauer, Heilman, andLeonard (2000). O’Grady and Antonyshyn (1999) measured pathological
asymmetry in the face using a combination of methods based on the
information from three-dimensional scans. Their study primarily provides a
comparison of methods for use in plastic surgery, detailing what could be
considered normal amounts of facial asymmetry. Both of these studies,
however, focus on the asymmetry of facial movement during the course of
expression, rather than on the asymmetric appearance of the face at neutral
or peak expression.Asymmetry of peak expression likely represents both the effects of
baseline structural facial asymmetry and asymmetry of movement during
emotional expression. Although this point has been raised before (Ekman,
1980; Kowner, 1996; Van Gelder & Borod, 1990), newer methods of
measurement of the face provide an opportunity to re-address this issue.
As acknowledged by earlier researchers, there are several inadequacies in the
comparison of facial morphology and expressive asymmetry (Sackeim,
1985). Although studies of facial features and facial size have not shown acorrelation with expression asymmetry, they are quite limited in that they
used only gross measures of structural asymmetry, such as facial width,
hemifacial area, or the distance between facial landmarks. Soft tissue studies
of asymmetry in the face tend to focus on landmarks that do not move, for
obvious reasons (Farkas & Cheung, 1981). Although this simplifies
measurement, these measurements may not be particularly relevant to the
changes in the face during expression. Expression asymmetry, for the most
part, relies on judgements of the whole face, including moving and non-moving features.
New methods of assessing asymmetry in facial expression allow us to
compare baseline facial asymmetry at neutral expression and dynamic
asymmetry with asymmetry at peak expression in images comparable to
those used in previous studies. Asymmetry in this study was based on
544 SCHMIDT, LIU, COHN

measures of pixel differences within frame images and between neutral and
peak frames of facial expression image sequences (Liu, Weaver, Schmidt,
Serban, & Cohn, 2001; Richardson et al., 2000; for additional complemen-
tary approaches, see Grammer et al., 2003). Extending the current emphasis
on objective, quantitative measures of facial asymmetry to determine the
effects of both baseline structural asymmetry and movement asymmetry onexpression appearance allows re-interpretation of the results of previous
experiments using classic, yet limited, measurement approaches.
Because the sides of the face are capable of independent voluntary
movement, asymmetry is more likely to be apparent during deliberate, rather
than spontaneous, expressions (Rinn, 1984; Ross & Mathiesen, 1998). The
prediction of asymmetry in deliberate expressions is supported by the findings
that laterality in observable facial actions, although inconsistent as to side, is
increased in deliberate as compared to spontaneous expression (Hager &Ekman, 1997). We focused on deliberate rather than spontaneous expression
in the current study because of the likelihood of greater variation in side-to-
side asymmetry. This variation allowed for testing the differing roles of
structural and movement asymmetry on peak facial expression asymmetry.
Overall movement asymmetry in this group of participants, as well as the
sidedness of emotion expressions, was also measured and compared with
previously obtained studies that utilised similar methods. Due to previous
reports of gender differences in structural asymmetry (Farkas & Cheung,1981), we expected that men and women in our sample would differ in
asymmetry at neutral expression, and possibly also during movement and at
peak expression.
The model of asymmetry in facial expression tested in this article proposes
that the asymmetry in the face at peak is dependent on the asymmetry of the
baseline neutral face as well as asymmetric movement occurring over the
course of the expression. Using measured asymmetry, we then determined
the relative contribution of movement (facial expression itself) and baselineasymmetry in the face (general trait asymmetry) in producing asymmetry at
peak expression. Given the documented existence of structural facial
asymmetry at rest, we predicted that this variable would account for a
significant portion of the variance in asymmetry at peak expression. Finally,
we explored the sidedness of emotion expression by comparing the total
amount of movement on the right and left sides of the face.
METHOD, SAMPLE, AND PROCEDURES
Deliberate facial expressions
Original deliberate expression sequences used in this study were collected as
part of a directed facial action task (Kanade, Cohn, & Tian, 2000).
FACIAL ASYMMETRY IN EXPRESSION 545

Participants were seated in front of uniform grey background. The frontal
camera was located at 180 degrees to the participant’s face, participants were
instructed to look directly at the camera, and both camera and participant
were positioned in the direct frontal orientation before videotaping began.
Participants were instructed by an experimenter to perform a series of 23
facial displays; these included single action units and emotion-specified
expressions of joy, surprise, anger, disgust, fear, and sadness.Image sequences were recorded using two synchronised S-VHS cameras
and studio lighting. Videotape used in the current study originated from the
camera positioned directly in front of the participant. Image sequences were
digitised at 30 frames per second into 640 by 480 pixel arrays with 8-bit
greyscale resolution.Expression sequences were coded for facial actions by certified FACS
coders (Ekman & Friesen, 1978), and on the basis of these codes, sequences
were truncated to include neutral to peak expression only. Reliability of
coding for peak expression was established in this sample at kappa�/ 0.86.
Only image sequences from the frontal camera are used in this report. Data
for three expressions (joy, anger, and disgust) were available from 55
participants (n�/ 16 men, n�/ 39 women) and these formed the data set for
this study (see Figure 1 for examples of these expressions). The participants
were young adults (ranging in age from 18 to 30) and a majority reported
white or European ancestry (n�/ 50). The expressions (joy, anger, disgust)
were chosen because they represented variation along two dimensions of
affect: approach�withdrawal (joy and anger versus disgust; Davidson,
Ekman, Saron, Senulis, & Friesen, 1990) and positive and negative valence
(joy versus anger and disgust; Russell, 1980).
Figure 1. (a) Examples of neutral, disgust, anger, and joy images (640�/480 pixels) from the Cohn
Kanade database (Kanade et al., 2000). Feature tracking points are marked in the neutral image, as an
example. (b) Examples of normalised neutral, disgust, anger, and joy images (128�/128 pixels).
546 SCHMIDT, LIU, COHN
Measuring asymmetry in expression video sequences
To address the problem of potentially asymmetric lighting in the videotaped
images, we used the measured luminance of the original image background
(pre-normalisation); this was uniform for all participants, to control for any
asymmetry in lighting. One neutral frame from each individual participant
was used for this analysis. Luminance differences between left and right sides
of the images were calculated from sample squares (80�/80 pixels) of the
original images’ upper left and upper right corners. The background of the
original images rather than the part of the image including the face was used.
This is in contrast to the asymmetry of luminance of the face measured in
Richardson et al. (2000), which includes not only asymmetry introduced by
lighting, but also asymmetry introduced by the face itself. In this study,
values for the background luminance difference for each individual were
used to control for the effects of unequal lighting on facial asymmetry values
(see method described below).Only individuals whose frontal view showed all facial landmarks clearly
(none obscured by other parts of the face) and with only minor deviation of
head position (B/5 degrees) from 180 degrees were included in the study.
Reliance on eye gaze and physical head positioning at 180 degrees to the
frontal camera may have introduced slight posing asymmetry into the
sample. Head restraints were not used in the study in order to provide a
more naturalistic pose. However, the greatest potential contribution of slight
asymmetry in positioning was addressed by controlling for illumination
differences side-to-side and through the normalisation process.
To remove the effects of spatial variation in face position and any slight
head rotation, images were aligned and normalised prior to analysis. Three
facial feature points were manually marked in the initial image of each
sequence: the medial canthus of each eye and the uppermost point of the
philtrum (base of the nasal septum). Because the normalisation process is
designed to be used with a series of computer-tracked still images from a
video (automated facial analysis), the physical stability of the landmarks on
the face and the clarity of the points in the image were critical. These points
were chosen because of their relative immobility during the course of facial
expression and their distinctiveness as features within the image. Using an
affine transformation, the images were then automatically mapped to a
standard face model based on these feature points.2 In this standard face
model, the midline of the face was determined by the line running from the
2 Expression sequences were tracked using an automated facial feature-tracking program
(Cohn, Zlochower, Lien, & Kanade, 1999; Tian, Kanade, & Cohn, 2001) to follow the inner eye
corners and the superior edge of the philtrum (top centre upper lip) automatically and provide
points for standardisation of images (see Figure 1 for an example).
FACIAL ASYMMETRY IN EXPRESSION 547

philtrum to the midpoint of the line between the two canthi (Liu, Schmidt,
Cohn, & Mitra, 2003). A normalised face image (128�/128 pixels) was
produced, with row 48 of each normalised image defined as the inner eye
corner (inner canthus) row and row 84 defined as the philtrum row. By
automatically controlling for face position, orientation, and scale within the
image in this initial processing step, asymmetry measures in each frame had
exact geometric correspondence. This process allows the comparison of face
images from different individuals, while preserving asymmetry inherent in
the faces. Asymmetry was preserved, as values for individual pixels were not
changed but affine transformed into the standard frame (128�/128 pixels).
Normalised face images were then processed and asymmetry scores were
calculated for each row of the image.
Calculating structural (neutral) and peak asymmetry
The centre of image was identified (between pixel 64 and pixel 65 in each
row) and pixels were measured in pairs, each pixel on the right paired with
the corresponding pixel on the left side of the image (see Figure 2 for
examples of paired pixels). Pixel difference scores (absolute values) were
calculated for each pair of pixels, based on individual pixel intensity values
(range: 0�255). These pixel pair difference values were summed by row, and
data were smoothed based on these row values. For purposes of these
analyses, row values were then summed over rows 20�128 of the face image
Figure 2. Measuring structural and peak asymmetry. In neutral frame, the absolute difference in
intensity between a pixel (ar) and the corresponding pixel on the opposite side (al) is measured. The
sum of these differences for the whole image (N�/ 8192 pixel pairs) produces a measure of structural
asymmetry (S). S�/jar�/alj�/jbr�/blj�/. . .�/jxr�/xlj. In the peak frame, pixel difference is calculated in
the same way, providing a measure of peak expression asymmetry (P).
548 SCHMIDT, LIU, COHN

for the whole face and rows 20�48 (upper face), rows 49�84 (midface), and
rows 85�128 (lower face) separately for analyses of different facial
subregions. Earlier studies have suggested that the innervation of the upper
face (muscles located above the upper brow) is more bilateral than the
innervation of the lower face (Rinn, 1984). Subregions were chosen to allow
the separate analysis of upper versus mid or lower face, while tying dataanalysis to anatomically identifiable landmarks (inner canthi, philtrum).
Data from the first 19 rows of each image were omitted because of the
presence of hair in the normalised images of several of the participants.
Values of pixel pair difference at neutral and at peak frames for rows 20�128
and for separate facial subregions were analysed with respect to independent
variables such as gender and type of emotion expressed (joy, anger, or
disgust). The most relevant facial subregions (those identified as involving
major muscle activity in that region) for each emotion expression were alsoanalysed (brow lowering in upper face for anger, nose wrinkling in midface
for disgust, and lip movement in lower face for joy; Ekman & Friesen, 1978).
These values constitute the neutral (structural) and peak asymmetry of the
face.
Because structural and peak asymmetry were calculated from the sum of
differences between the sides of the face, both were directly affected by
luminance differences. Linear regression of whole face asymmetry scores on
luminance difference scores (as described above) was performed on neutral(structural) and peak expression values, and residuals values were recorded.
Regression analyses confirmed the effect of side-to-side luminance difference
on asymmetry scores for joy, F (1, 53)�/ 4.766, p�/ .03, F (1, 53)�/ 8.156, p�/
.006 for structural and peak, respectively; anger F (1, 53)�/ 5.647, p�/ .02,
F (1, 53)�/ 5.564, p�/ .02 for structural and peak, respectively; and disgust
F (1, 53)�/ 9.366, p�/ .003, F (1, 53)�/ 16.312, p�/ .0002 for structural and
peak, respectively. Therefore, for further analyses, only the residual values of
structural and peak asymmetry scores were used, representing asymmetrynot accounted for by luminance differences. Facial subregion scores for
structural and peak asymmetry were residualised in the same manner.
Movement asymmetry was assessed using a measure of within-side pixel
intensity change. In this case, the pixel change is the difference in intensity
values of the same pixel, from frame to frame over the course of neutral-to-
peak progression of the expression (see Figure 3). Absolute values of pixel
change that were summed separately for each side of the face in each frame
from neutral to peak represent the cumulative movement of the face duringemotion expression, similar to calculation of entropy in Richardson et al.
(2000). This procedure was performed separately on left and right sides of
the face image, with pixels 1�64 in each row defined as the right side of the
face (image left), and pixels 65�128 in each row defined as the left side of the
face (image right). Because movement asymmetry was calculated separately
FACIAL ASYMMETRY IN EXPRESSION 549
within left and right sides of the face image, there was no need to control for
any asymmetry in luminance between the two sides. For comparison with
previously published values, the proportional movement asymmetry was
calculated by dividing the cumulative movement score of the less active side
by the cumulative movement of the more active side. Values for movement
asymmetry within upper, mid, and lower face subregions were also
calculated. Sidedness of individual participants’ facial movement was
calculated as the ratio of left-sided movement to right-sided movement, incontrast to the variable proportional movement asymmetry, which was
calculated as the ratio of the side with less movement to the side with more
movement. As a result, sidedness values of less than or greater than 1.00
were obtained, where proportional movement asymmetry was always less
than 1.00.
Data analysis
Individual consistency in structural asymmetry was investigated using
coefficient alpha across the three emotion expressions to establish the
suitability of the structural asymmetry measure for representing underlying
anatomical asymmetry. The effects of emotion displayed (joy, anger, or
disgust) and gender on structural, movement, and peak expression
asymmetry were investigated using three separate repeated measures
analyses of variance. In order to determine whether or not facial movementwas asymmetric, and therefore a potential contributor to peak emotion
asymmetry, the tendency of individual people to display more movement on
one side of the face was tested by comparing the proportional asymmetry
values to a standard of 1.00 (perfectly symmetric motion).
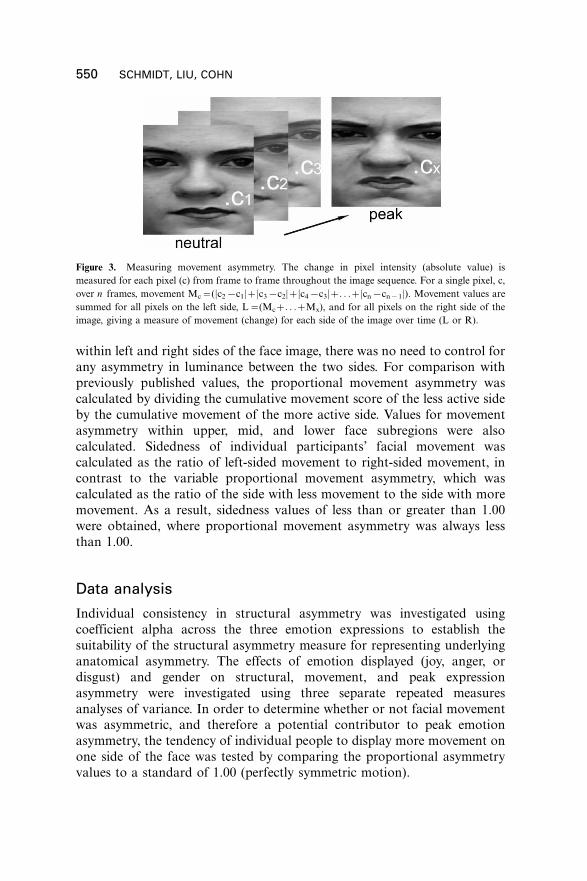
Figure 3. Measuring movement asymmetry. The change in pixel intensity (absolute value) is
measured for each pixel (c) from frame to frame throughout the image sequence. For a single pixel, c,
over n frames, movement Mc�/(jc2�/c1j�/jc3�/c2j�/jc4�/c3j�/. . .�/jcn�/cn�1j). Movement values are
summed for all pixels on the left side, L�/(Mc�/. . .�/Mx), and for all pixels on the right side of the
image, giving a measure of movement (change) for each side of the image over time (L or R).
550 SCHMIDT, LIU, COHN

The central hypothesis that structural asymmetry has a significant role in
creating asymmetry at peak expression was addressed using separate
hierarchical regression analyses for each emotion condition. Predictors of
peak asymmetry were structural asymmetry and movement asymmetry. To
address the possible contribution of relatively immobile parts of the face to
the effect of structural on peak asymmetry overall, separate regressionanalyses were conducted on individual facial subregions showing the most
movement for each separate emotion: lower face for joy, upper face for
anger, midface for disgust.
In follow-up analyses we examined the consistency of individual sidedness
of expression (tendency of individual people to display more movement on
one side of the face) using coefficient alpha. To determine whether gender of
participant contributed to differences in sidedness of emotion expression,
chi-square tests were used to investigate the proportion of left- versus right-sided expressions in men and women in each of three emotional expression
categories (joy, anger, disgust). Overall sidedness of emotion expressions
(joy, anger, disgust) was investigated by computing sidedness values as left
movement divided by right movement (R/L) and comparing asymmetry
values to a standard of 1.00.
RESULTS
Individual consistency of structural asymmetry acrossemotion conditions
In defining structural asymmetry as asymmetry at neutral expression, it was
important to establish that these values were comparable across emot-
ions (joy, anger, disgust) for each participant. Within participants, overallfacial asymmetry at neutral expression was reliable with alpha�/ 0.90, F (55,
108)�/10.05, p B/.001.
Structural, movement, and peak asymmetry
Results of repeated measures analyses of variance showed that differences in
asymmetry between men and women were significant across emotion
conditions, but that emotion and the interaction between emotion and
gender did not significantly affect variation in asymmetry. Men had
significantly higher values for both structural and peak overall asym-metry than did women, F (1, 53)�/ 7.911, p�/.007, observed power�/ .79;
F (1, 53)�/ 8.967, p�/ .004, observed power�/ .84, for structural and peak
asymmetry, respectively. There was no gender difference in overall movement
asymmetry, F (1, 53)�/ .291, p�/ .592, observed power�/ .083. Main effects of
FACIAL ASYMMETRY IN EXPRESSION 551
emotion on structural, movement, and peak asymmetry, and the interaction
between independent variables (gender, emotion) were not significant (all
p �/.10).3
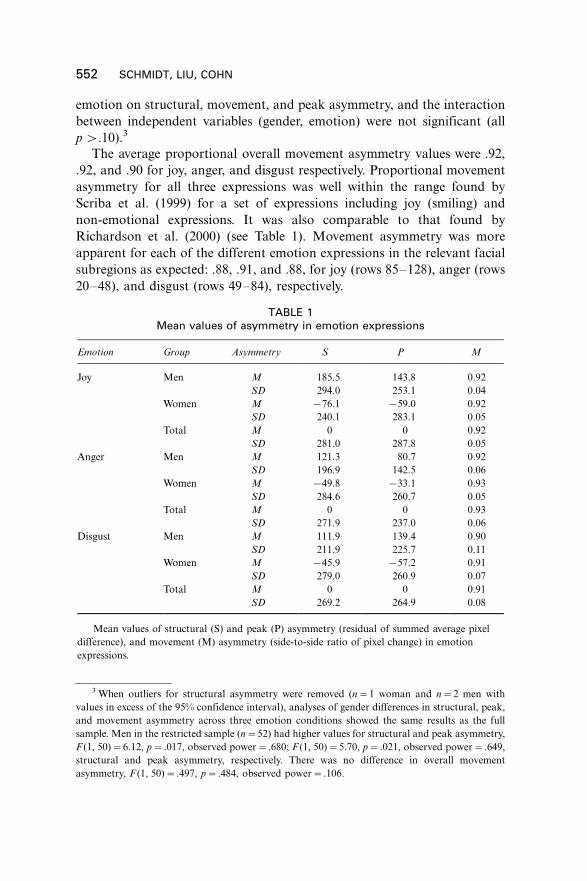
The average proportional overall movement asymmetry values were .92,
.92, and .90 for joy, anger, and disgust respectively. Proportional movement
asymmetry for all three expressions was well within the range found by
Scriba et al. (1999) for a set of expressions including joy (smiling) and
non-emotional expressions. It was also comparable to that found by
Richardson et al. (2000) (see Table 1). Movement asymmetry was more
apparent for each of the different emotion expressions in the relevant facial
subregions as expected: .88, .91, and .88, for joy (rows 85�128), anger (rows
20�48), and disgust (rows 49�84), respectively.
TABLE 1Mean values of asymmetry in emotion expressions
Emotion Group Asymmetry S P M
Joy Men M 185.5 143.8 0.92
SD 294.0 253.1 0.04
Women M �/76.1 �/59.0 0.92
SD 240.1 283.1 0.05
Total M 0 0 0.92
SD 281.0 287.8 0.05
Anger Men M 121.3 80.7 0.92
SD 196.9 142.5 0.06
Women M �/49.8 �/33.1 0.93
SD 284.6 260.7 0.05
Total M 0 0 0.93
SD 271.9 237.0 0.06
Disgust Men M 111.9 139.4 0.90
SD 211.9 225.7 0.11
Women M �/45.9 �/57.2 0.91
SD 279.0 260.9 0.07
Total M 0 0 0.91
SD 269.2 264.9 0.08
Mean values of structural (S) and peak (P) asymmetry (residual of summed average pixel
difference), and movement (M) asymmetry (side-to-side ratio of pixel change) in emotion
expressions.
3 When outliers for structural asymmetry were removed (n�/ 1 woman and n�/ 2 men with
values in excess of the 95% confidence interval), analyses of gender differences in structural, peak,
and movement asymmetry across three emotion conditions showed the same results as the full
sample. Men in the restricted sample (n�/ 52) had higher values for structural and peak asymmetry,
F (1, 50)�/ 6.12, p�/ .017, observed power�/ .680; F (1, 50)�/ 5.70, p�/ .021, observed power�/ .649,
structural and peak asymmetry, respectively. There was no difference in overall movement
asymmetry, F (1, 50)�/ .497, p�/ .484, observed power�/ .106.
552 SCHMIDT, LIU, COHN
The tendency of individual people to display more movement on one side
of the face was tested by comparing the proportional asymmetry values to a
standard of 1.00 (perfectly symmetric motion). As expected for deliberate
expressions, overall movement asymmetry values differed significantly from
1.00, t(54)�/ �/1.8, t(54)�/ �/9.7, t(54)�/ �/8.6, for joy, anger, and disgust,
respectively. See Table 1 for mean movement asymmetry values. Sidedness
was not calculated for facial subregions as overall asymmetry is most
comparable to previous judgement studies of facial sidedness.
Relative contributions of structural and movementasymmetry to expression asymmetry at peak
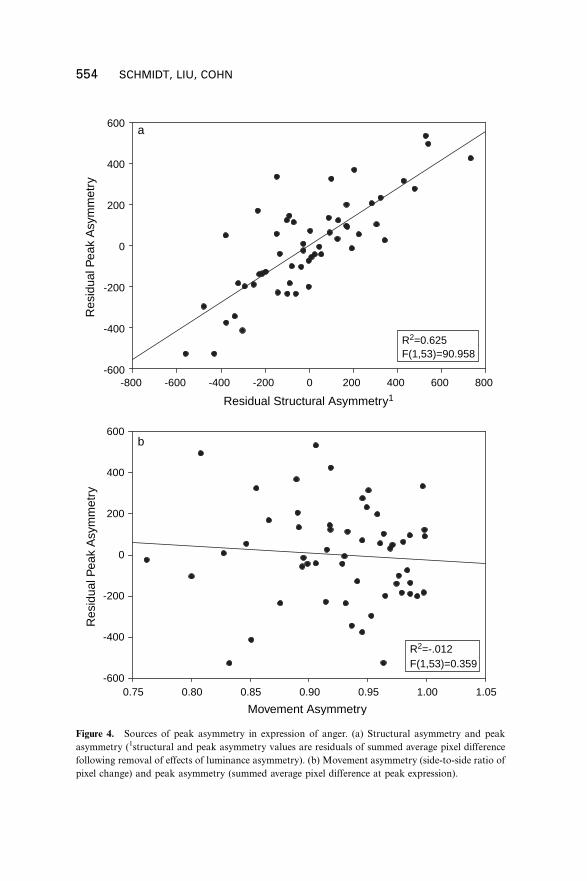
Hierarchical regression analysis of the relationships among structural
asymmetry, movement asymmetry, and peak expression asymmetry showed
that structural asymmetry explained a significant amount of the variance inpeak expression asymmetry for all three emotion expressions. Adjusted R2
values were .53, .62, and .67 for effects of structural asymmetry on peak
asymmetry in joy, anger, and disgust, respectively. Overall movement
asymmetry, in contrast, did not make a statistically significant contribution
to variance in peak expression asymmetry, within the context of these
regression analyses (see Figure 4 for examples of individual regression lines
of peak anger asymmetry on structural and movement asymmetry,
respectively).Separate hierarchical regression analyses were conducted for lower, upper,
and midface subregions for joy, anger, and disgust expressions, respectively.
Structural asymmetry accounted for a significant amount of the variance in
peak expression within the relevant facial subregions for each expression.
Adjusted R2 values were .29, .36, and .80 for effects of structural asymmetry
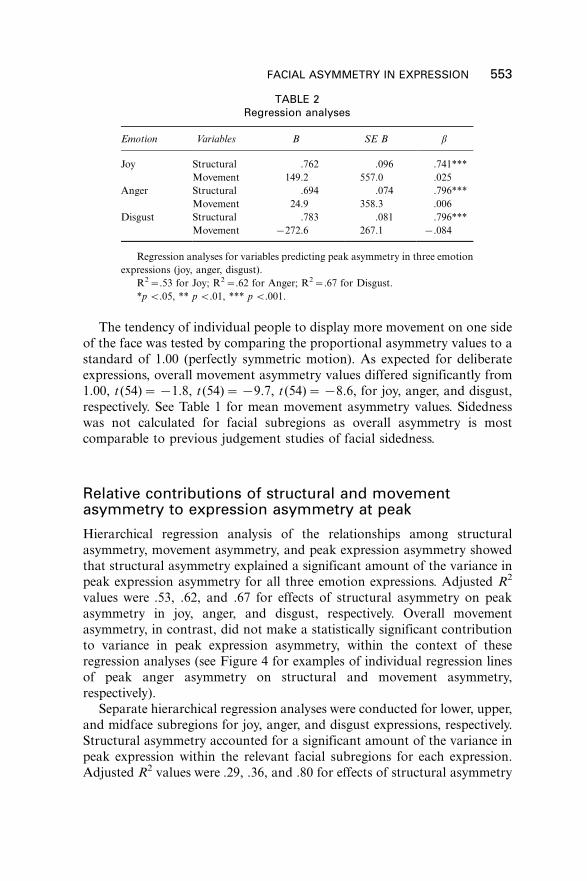
TABLE 2Regression analyses
Emotion Variables B SE B b
Joy Structural .762 .096 .741***
Movement 149.2 557.0 .025
Anger Structural .694 .074 .796***
Movement 24.9 358.3 .006
Disgust Structural .783 .081 .796***
Movement �/272.6 267.1 �/.084
Regression analyses for variables predicting peak asymmetry in three emotion
expressions (joy, anger, disgust).
R2�/.53 for Joy; R2�/.62 for Anger; R2�/.67 for Disgust.
*p B/.05, ** p B/.01, *** p B/.001.
FACIAL ASYMMETRY IN EXPRESSION 553
Residual Structural Asymmetry1
-800 -600 -400 -200 0 200 400 600 800
Res
idua
l Pea
k A
sym
met
ry
-600
-400
-200
0
200
400
600a
b
R2=0.625F(1,53)=90.958
R2=-.012F(1,53)=0.359
Movement Asymmetry
0.75 0.80 0.85 0.90 0.95 1.00 1.05
Res
idua
l Pea
k A
sym
met
ry
-600
-400
-200
0
200
400
600
Figure 4. Sources of peak asymmetry in expression of anger. (a) Structural asymmetry and peak
asymmetry (1structural and peak asymmetry values are residuals of summed average pixel difference
following removal of effects of luminance asymmetry). (b) Movement asymmetry (side-to-side ratio of
pixel change) and peak asymmetry (summed average pixel difference at peak expression).
554 SCHMIDT, LIU, COHN

on peak asymmetry for joy (lower face), anger (upper face), and disgust
(midface). Subregion movement asymmetry did not contribute significantly
to the variance of asymmetry in the subregion at peak expression for joy and
anger expressions (all p �/.4). There was a trend towards significance of
midface movement asymmetry in peak asymmetry in the midface of disgust
expressions (p�/ .05).
Sidedness of movement in expression
The sidedness of facial movement, based on the ratio of accumulated pixelchange on the left to accumulated pixel change on the right, was determined
for each individual’s expression. For an analysis of consistency of sidedness
within individuals, values greater than 1 were recoded as left-sided and
values less than 1 were recoded as right-sided. Individual participants
exhibited greater movement on either left or right, which was largely
consistent across the three emotion expressions, alpha�/ 0.80; N�/ 55.
Between-participants analyses showed that the numbers of individuals
with left-sided or right-sided expressions for each emotional expressionvaried. Of 17 men tested, 11 (65%) displayed left-sided joy and anger
expressions, and 12 (71%) displayed left-sided disgust expressions. Of 41
women tested, a majority also displayed left-sided expressions: n�/ 29 (71%),
n�/ 24 (59%), and n�/ 23 (56%) for joy, anger, and disgust, respectively.
However, chi-square tests of the frequency of left- versus right-sided
expressions in men and women were non-significant in each of three
emotional expression categories, x2(1)�/ 0.20, x2(1)�/ 0.19, and x2(1)�/
1.05 for joy, anger, and disgust, respectively.The sidedness of specific emotion expressions overall was also investi-
gated. Posed emotion expressions had overall mean sidedness values of 1.04,
1.01, and 1.02 for joy, anger, and disgust, respectively. All emotion
expressions were left-sided on average, although only sidedness for joy was
significantly different from 1.00, t(57)�/ 3.34, p�/ .001, t (57)�/ 1.62, p�/ .11,
t(57)�/ 1.28, p�/ .21 for joy, anger, and disgust, respectively.
DISCUSSION
The comparison of movement and structural asymmetry in these posed
expressions indicates that the appearance of asymmetry at the peak of facial
expression is significantly related to the amount of asymmetry in a neutralpose. Movement asymmetry results support this finding, in that side-to-side
differences in movement during expression did not significantly contribute
to increasing asymmetry at peak expression. Asymmetry of overall move-
ment in disgust expressions even appeared to decrease asymmetry at peak.
FACIAL ASYMMETRY IN EXPRESSION 555

Subregions were analysed as a way to explore variation in the structural/peak
asymmetry relation in the context of greater amounts of facial movement
during emotion expression. Similar results were found for facial subregions
that were likely to have shown the most movement for each emotion. An
exception was disgust, in which both structural and movement asymmetry
were associated with peak expression asymmetry. This result is surprising,given earlier reports of the non-significance of structural facial asymmetry,
but may provide an explanation for the varying experimental results that
have found left-, right-, or non-sidedness in posed expressions in the past
(Borod et al., 1998). The results for the amount of asymmetry within
individuals are very similar to those obtained using similar quantitative
methods, and are therefore likely to represent normally occurring amounts
of asymmetry in the face, both at rest and during expression (Richardson
et al., 2000; Scriba et al., 1999).Asymmetry in judgement studies is fairly clear, with the left side
predominating. Asymmetry in studies using more objective quantitative
methods is less clear. Richardson et al. (2000) found that left was dominant
on the lower face, but not upper, a result reinforcing a similar earlier finding
of Asthana and Mandal (1997), who used judgement-based data. Scriba
et al. (1999) found that the left side moved slightly more on average, though
non-significantly, although neither side was dominant in the group as a
whole. In a quantitative study using three-dimensional measures of sidednessof expression, movement was found to be greater on the left for both sad and
happy expressions (Nicholls, Ellis, & Clement, 2004). An additional
quantitative study, focusing on eyebrow movements only, found an average
sidedness movement (displacement) asymmetry of 1.05 (SD�/ 0.13) in
normals during deliberate brow raising (Bajaj-Luthra, Mueller, & Johnson,
1997). Pennock et al. (1999) found an average proportional movement
(displacement) asymmetry of .83, with 13 of 16 individuals studied showing
greater activity of the left brow. Results of both studies were comparable tosidedness and proportional movement asymmetry values reported here. The
asymmetry of motion observed could potentially be accounted for by
structural anatomical differences among individuals in either case. If
movements are primarily left-sided, it could be that faces are primarily
left-sided to begin with.
The advantage of the methods used in this study is that the degree of
asymmetry during neutral expression can be assessed, as well as the degree
of movement asymmetry. A limitation is that the description of a face as left-sided cannot be obtained using quantitative methods described here for the
neutral (structural) face.
We did find that the face moved slightly more on the left (more pixel
change) over the course of expression, although this left-sided advantage was
relatively weak across individuals and expressions, with the ratio of left to
556 SCHMIDT, LIU, COHN

right movement of 1.04, 1.01, and 1.02 for joy, disgust, and anger
expressions. Only joy was significantly different from 1. These values for
sidedness were similar to those of Scriba et al. (1999) who used similar,
whole face methods to determine dynamic asymmetry (left�right asymme-
try) during expression. However, smiles measured in their study were not
significantly left- or right-sided (average left to right movement ratio�/ 1.01),while joy expressions in this study did have significantly more movement on
the left side. To the extent that participants turned their faces slightly to one
side or another despite the positioning at 180 degrees to the frontal camera,
the normalisation procedures, and the controls in place for side-to-side
illumination differences, it is possible that there may have been subtle effects
on asymmetry measures. Posing differences from 180 degrees were appar-
ently slight, and in none of the participants were facial features obscured by
the turning of the head to the side (any slight posing differences were within5 degrees of frontal). Additionally, the central portions of the face, which
were the focus of this investigation, were adequately represented in all
participant video frames and no systematic sidedness differences related to
posing differences were identified.
At neutral and peak expression, men were more asymmetrical than were
women, consistent with the work of Farkas and Cheung (1981) with
adolescents. This is not surprising, since the college-age sample in this study
is close in age to the 18-year-olds in the previous study, although therelatively small number of men in the current study limits interpretation of
the gender differences described. Movement asymmetry, however, was not
significantly different for men and women in the current sample, consistent
with findings based on much larger samples (Borod et al., 1998).
The size and significance of the effect of structural asymmetry on
asymmetry of the face at peak in these data confirms the importance of
considering the role of baseline structural asymmetry in facial expression.
Although movement asymmetry and sidedness of facial expressions wereobserved and appeared similar to asymmetry as described in comparable
studies, asymmetric movement does not seem to have a consistent effect on
the asymmetry of the face at peak expression. In some individuals, the
appearance of facial asymmetry was reduced by the movements of facial
expression, where in other cases apparent asymmetry was increased.
Overall, the total amount of facial movement was very similar between
the sides of the face, even in the deliberate facial expressions described here.
The relatively small differences between left- and right-sided movement inthe face, even in posed expressions, suggest that the differences in neural
control of the face are not as great as has been suggested. Although the face
at peak expression was asymmetric, we conclude that this asymmetry cannot
be related to the unequal movement of the different sides of the face. Left-
sided change was, on average, only about 2% greater than right-sided change
FACIAL ASYMMETRY IN EXPRESSION 557

overall. However, this amount may still be perceptually significant, especially
when one considers the perceptual bias towards looking first at the left face
(Mertens, Siegmund, & Gruesser, 1993; Phillips & David, 1997; Schirillo,
2000). A tendency to look first at the side that has more movement could be
an adaptation for nonverbal communication. This issue can be resolved with
future study of the perception of these faces.Additionally, the relation between perception of emotion and amount of
movement in expression may require a more complex understanding of the
role of movement asymmetry in emotion perception. A recent study showed
that although movement in the happy and sad expressions was greater on the
left, observers rated emotion in each hemiface differently. Sad expressions
were perceived as sadder in the left hemiface and joyful expressions as more
joyful in the right hemiface, despite the fact that expressions had both shown
greater movement on the left (Nicholls et al., 2004).By providing a baseline and objective data we have investigated the
relative importance of facial movement asymmetry in creating asymmetry of
the resulting expression. Theories of brain asymmetry for emotion depend in
part on data from facial expression judgement studies implying that
expressions appear stronger on one side because of differential movement
of the face on that side. If movement is not the only major contributor to
asymmetry of expression, then facial expression data can no longer be
interpreted as strong support for theories of neurobiological emotionalasymmetry.
Asymmetry in the face and its relationship to attractiveness has been
studied extensively in recent years (Mealey, Bridgstock, & Townsend, 1999).
Because of the congruence of asymmetry values reported here with those
from other quantitative studies of facially normal individuals, an implication
of this work is that a range of normal levels of expression asymmetry could
be quantified and used as a screen for developmental or other clinical
problems (Lahat, Heyman, Barkay, & Goldberg, 2000; Nakamura,Okamoto, & Maruyama, 2001).
Within the range of normal asymmetry, there are also implications for the
role of asymmetry in facial signalling. The possibility that facial expressions
provide a potential method for increasing symmetry has not been discussed.
If, as suggested by these results, the face can actually become less
asymmetrical in appearance during expression, then facial expression may
act to increase symmetry and ultimately to increase attractiveness in some
individuals. This perspective expands on and provides a dynamic view oncurrent notions of asymmetry as a reliable trait marker of developmental
disruption (Gangestad & Thornhill, 1997; Grammer & Thornhill, 1994;
Rhodes, Proffitt, Grady, & Sumich, 1998). In most natural environments,
attractiveness would be decided during social interaction, a context in which
facial expression is typical. Variation in the ability of individuals to increase,
558 SCHMIDT, LIU, COHN
consciously or unconsciously, the symmetry of expression in deliberate facial
expression has important implications for evolutionary signalling hypotheses
such as Brown and Moore’s work concerning facial signals of altruistic
intent (Brown & Moore, 2002; Schmidt & Cohn, 2001).
Nevertheless, the strength of structural asymmetry as a predictor of peak
expression asymmetry reinforces the status of facial asymmetry as a reliablemarker of mate quality, even during facial expression. More detailed study of
faces, both at rest and in expression, would help to distinguish the
contribution of structural asymmetry and the strategies adopted by raters
in viewing either still or moving asymmetric faces.
Manuscript received 4 November 2005
Revised manuscript received 14 February 2006
First published online 2 August 2006
REFERENCES
Asthana, H. (2001). Hemiregional facial asymmetry in expression of emotion: A concept needs to
be verified. Perceptual and Motor Skills , 93 , 690�692.
Asthana, H., & Mandal, M. (1997). Hemiregional variations in facial expressions of emotions.
British Journal of Psychology, 88 , 519�525.
Bajaj-Luthra, A., Mueller, T., & Johnson, P. (1997). Quantitative analysis of facial motion
components: Anatomic and nonanatomic motion in normal persons and in patients with
complete facial paralysis. Plastic and Reconstructive Surgery, 99 , 1894�1902.
Borod, J. C., Kent, J., Koff, E., Martin, C., & Alpert, M. (1988). Facial asymmetry while posing
positive and negative emotions: Support for the right hemisphere hypothesis. Neuropsycholo-
gia , 26 (5), 759�764.
Borod, J. C., Koff, E., Yecker, S., Santschi, C., & Schmidt, J. M. (1998). Facial asymmetry during
emotional expression: Gender, valence and measurement technique. Psychophysiology, 36 ,
1209�1215.
Brown, W. M., & Moore, C. (2002). Smile asymmetries and reputation as reliable indicators of
likelihood to cooperate: An evolutionary analysis. In S. Shohov (Ed.), Advances in psychology
research (Vol. 11 pp. 59�78). Huntington, NY: Nova Science Publishers.
Cohn, J. F., Zlochower, A., Lien, J., & Kanade, T. (1999). Automated face analysis by feature point
tracking has high concurrent validity with manual FACS coding. Psychophysiology, 36 , 35�43.
Davidson, R., Ekman, P., Saron, C., Senulis, J., & Friesen, W. (1990). Approach�withdrawal and
cerebral asymmetry: Emotional expression and brain physiology. Journal of Personality and
Social Psychology, 58 , 330�341.
Dimberg, U., & Petterson, M. (2000). Facial reactions to happy and angry facial expressions:
Evidence for right hemisphere dominance. Psychophysiology, 37 (5), 693�696.
Ekman, P. (1980). Asymmetry in facial expression. Science , 209 , 833�834.
Ekman, P., & Friesen, W. V. (1978). Facial Action Coding System . Palo Alto, CA: Consulting
Psychologists Press.
Farkas, L. G., & Cheung, G. (1981). Facial asymmetry in healthy North American caucasians.
Angle Orthodontist , 51 , 70�77.
Fernandez-Carriba, S., Loeches, A., Morcillo, A., & Hopkins, W. (2002). Asymmetry in facial
expressions of emotion by chimpanzees. Neuropsychologia , 40 , 1523�1533.
FACIAL ASYMMETRY IN EXPRESSION 559
Ferrario, V., Sforza, C., Ciusa, V., Dellavia, C., & Tartaglia, G. (2001). The effect of sex and age on
facial asymmetry in healthy participants: A cross-sectional study from adolescence to mid-
adulthood. Journal of Oral and Maxillofacial Surgery, 59 , 382�388.
Fink, B., Manning, J. T., Neave, N., & Grammer, K. (2004). Second to fourth digit ratio and facial
asymmetry. Evolution and Human Behavior, 25 , 125�132.
Gangestad, S. W., & Thornhill, R. (1997). Human sexual selection and developmental stability. In
J. A. Simpson & D. T. Kenrick (Eds.), Evolutionary social psychology (pp. 169�196). Mahwah,
NJ: Lawrence Erlbaum Associates, Inc.
Grammer, K., Fink, B., Moller, A. P., & Thornhill, R. (2003). Darwinian aesthetics: Sexual
selection and the biology of beauty. Biological Review, 78 , 385�407.
Grammer, K., & Thornhill, R. (1994). Human (Homo sapiens ) facial attractiveness and sexual
selection: The role of symmetry and averageness. Journal of Comparative Psychology, 108 , 233�242.
Hager, J. C., & Ekman, P. (1997). The asymmetry of facial actions is inconsistent with models of
hemispheric specialization. In P. Ekman & E. Rosenberg (Eds.), What the face reveals (pp. 40�62). New York: Oxford University Press.
Hauser, M. D., & Akre, K. (2001). Asymmetries in the timing of facial and vocal expressions by
rhesus monkeys: Implications for hemispheric specialization. Animal Behaviour, 61 , 391�400.
Hume, D. K., & Montgomerie, R. (2001). Facial attractiveness signals different aspects of
‘‘quality’’ in women and men. Evolution and Human Behavior, 22 , 93�112.
Kanade, T., Cohn, J. F., & Tian, Y. (2000). Comprehensive database for facial expression analysis.
Proceedings of the Fourth IEEE International Conference on Automatic Face and Gesture
Recognition (FG’00) (pp. 46�53), Grenoble, France: Institute of Electrical & Electronics
Engineers.
Koff, E., Borod, J. C., & White, B. (1981). Asymmetries for hemiface size and mobility.
Neuropsychologia , 19 (6), 825�830.
Kowner, R. (1995). Laterality in facial expressions and its effect on attributions of emotion and
personality. Neuropsychologia , 33 , 539�559.
Kowner, R. (1996). Facial asymmetry and attractiveness judgement in developmental perspective.
Journal of Experimental Psychology: Human Perception and Performance , 22 (3), 525�529.
Kowner, R. (1998). Perceiving and attributing hemispheric width in faces of normal adults.
Perceptual and Motor Skills , 87 , 567�572.
Kowner, R. (2001). Psychological perspective on developmental stability and fluctuating
asymmetry: Sources, applications, and implications. British Journal of Psychology, 92 , 447�469.
Lahat, E., Heyman, E., Barkay, A., & Goldberg, M. (2000). Asymmetric crying faces and
associated congenital anomalies: Prospective study and review of the literature. Journal of Child
Neurology, 15 (12), 808�810.
Liu, Y., Schmidt, K. L., Cohn, J. F., & Mitra, S. (2003). Facial asymmetry quantification for
expression invariant human identification. Computer Vision and Image Understanding , 91 ,
138�159.
Liu, Y., Weaver, R., Schmidt, K., Serban, N., & Cohn, J. F. (2001). Facial asymmetry: A new
biometric (Tech. Rep. No. CMU-RI-TR-01-23). Pittsburgh, PA: Carnegie Mellon University.
Mealey, L., Bridgstock, R., & Townsend, G. C. (1999). Symmetry and perceived facial
attractiveness: A monozygotic co-twin comparison. Journal of Personality and Social
Psychology, 76 , 151�158.
Mertens, I., Siegmund, H., & Gruesser, O. J. (1993). Gaze motor asymmetries in the perception of
faces during a memory task. Neuropsychologia , 31 , 989�998.
Nakamura, T., Okamoto, K., & Maruyama, T. (2001). Facial asymmetry in patients with
cervicobrachial pain and headache. Journal of Oral Rehabilitation , 28 , 1009�1014.
560 SCHMIDT, LIU, COHN

Namano, S., Behrend, D., Harcourt, J., & Wilson, P. (2000). Angular asymmetries of the human
face. International Journal of Prosthodontics , 13 , 41�46.
Nicholls, M. E. R, Ellis, B. E., & Clement, J. G. (2004). Detecting hemifacial asymmetries in
emotional expression with three-dimensional computerized image analysis. Proceedings of the
Royal Society of London, Series B , 271 , 663�668.
O’Grady, K., & Antonyshyn, O. (1999). Facial asymmetry: Three-dimensional analysis using laser
surface scanning. Plastic and Reconstructive Surgery, 104 , 928�937.
Pennock, J. D., Johnson, P. C., Manders, E. K., & Van Swearingen, J. M. (1999). Relationship
between muscle activity of the frontalis and the associated brow displacement. Plastic and
Reconstructive Surgery, 104 , 1789.
Phillips, M., & David, A. (1997). Viewing strategies for simple and chimeric faces: An investigation
of perceptual bias in normals and schizophrenic patients using visual scan paths. Brain and
Cognition , 35 , 225�238.
Rhodes, G., Proffitt, F., Grady, J. M., & Sumich, A. (1998). Facial symmetry and the perception of
beauty. Psychonomic Bulletin and Review, 5 , 659�669.
Richardson, C., Bowers, D., Bauer, R., Heilman, K., & Leonard, C. (2000). Digitising the moving
face during dynamic displays of emotion. Neuropsychologia , 38 , 1028�1039.
Rinn, W. E. (1984). The neuropsychology of facial expression: A review of the neurological and
psychological mechanisms for producing facial expressions. Psychological Bulletin , 95 , 52�77.
Ross, R. T., & Mathiesen, R. (1998). Volitional and emotional supranuclear facial weakness. New
England Journal of Medicine , 338 , 1515.
Russell, J. A. (1980). A circumplex model of affect. Journal of Personality and Social Psychology,
39 , 1161�1178.
Sackeim, H. (1985). Facial morphologic asymmetry: A review. Brain and Cognition , 4 , 296�312.
Sackeim, H., Gur, R. C., & Saucy, M. C. (1978). Emotions are expressed more intensely on the left
side of the face. Science , 202 , 434�436.
Sackeim, H. A., Weiman, A. L., & Forman, B. D. (1984). Asymmetry of the face at rest: Size, area
and emotional expression. Cortex , 20 , 165�178.
Schirillo, J. (2000). Hemispheric asymmetries and gender influence Rembrandt’s portrait
orientations. Neuropsychologia , 38 , 1593�1606.
Schmidt, K. L., & Cohn, J. F. (2001). Human facial expressions as adaptations: Evolutionary
questions in facial expression research. Yearbook of Physical Anthropology, 44 , 3�24.
Scriba, H., Stoeckli, S. J., Pollack, A., Veraguth, D., & Fisch, U. (1999). Objective evaluation of
normal facial function. Annals of Otology, Rhinology and Otolaryngology, 108 , 641�644.
Skinner, M., & Mullen, B. (1991). Facial asymmetry in emotional expression: A meta-analysis of
research. British Journal of Social Psychology, 30 , 113�124.
Smith, W. M. (1998). Hemispheric and facial asymmetry: Faces of academe. Journal of Cognitive
Neuroscience , 10 , 663�667.
Smith, W. M. (2000). Hemispheric and facial asymmetry: Gender differences. Laterality, 5 , 251�258.
Swaddle, J. P., & Cuthill, I. C. (1995). Asymmetry and human facial attractiveness: Symmetry may
not always be beautiful. Proceedings of the Royal Society of London, B: Biological Sciences ,
1261 (1360), 111�116.
Tian, Y., Kanade, T., & Cohn, J. F. (2001). Recognizing action units for facial expression analysis.
IEEE Transactions on Pattern Analysis and Machine Intelligence , 23 , 97�115.
Van Gelder, R. S., & Borod, J. C. (1990). Neurobiological and cultural aspects of facial asymmetry.
Journal of Communication Disorders , 23 , 273�286.
FACIAL ASYMMETRY IN EXPRESSION 561