The Role of Process Mineralogy in Identif
8
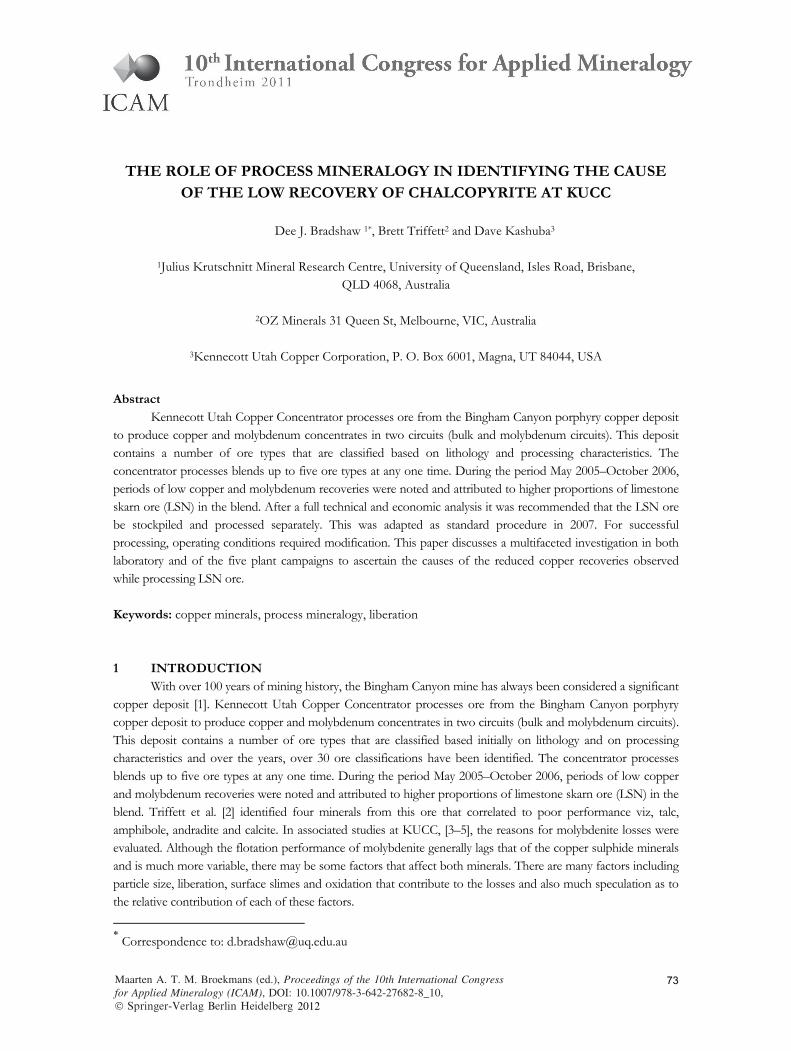
Maarten A. T. M. Broekmans (ed.), Proceedings of the 10th International Congress for Applied Mineralogy (ICAM), DOI: 10.1007/978-3-642-27682-8_10, Ó Springer-Verlag Berlin Heidelberg 2012 THE ROLE OF PROCESS MINERALOGY IN IDENTIFYING THE CAUSE OF THE LOW RECOVERY OF CHALCOPYRITE AT KUCC Dee J. Bradshaw 1* , Brett Triffett 2 and Dave Kashuba 3 1 Julius Krutschnitt Mineral Research Centre, University of Queensland, Isles Road, Brisbane, QLD 4068, Australia 2 OZ Minerals 31 Queen St, Melbourne, VIC, Australia 3 Kennecott Utah Copper Corporation, P. O. Box 6001, Magna, UT 84044, USA Abstract Kennecott Utah Copper Concentrator processes ore from the Bingham Canyon porphyry copper deposit to produce copper and molybdenum concentrates in two circuits (bulk and molybdenum circuits). This deposit contains a number of ore types that are classified based on lithology and processing characteristics. The concentrator processes blends up to five ore types at any one time. During the period May 2005–October 2006, periods of low copper and molybdenum recoveries were noted and attributed to higher proportions of limestone skarn ore (LSN) in the blend. After a full technical and economic analysis it was recommended that the LSN ore be stockpiled and processed separately. This was adapted as standard procedure in 2007. For successful processing, operating conditions required modification. This paper discusses a multifaceted investigation in both laboratory and of the five plant campaigns to ascertain the causes of the reduced copper recoveries observed while processing LSN ore. Keywords: copper minerals, process mineralogy, liberation 1 INTRODUCTION With over 100 years of mining history, the Bingham Canyon mine has always been considered a significant copper deposit [1]. Kennecott Utah Copper Concentrator processes ore from the Bingham Canyon porphyry copper deposit to produce copper and molybdenum concentrates in two circuits (bulk and molybdenum circuits). This deposit contains a number of ore types that are classified based initially on lithology and on processing characteristics and over the years, over 30 ore classifications have been identified. The concentrator processes blends up to five ore types at any one time. During the period May 2005–October 2006, periods of low copper and molybdenum recoveries were noted and attributed to higher proportions of limestone skarn ore (LSN) in the blend. Triffett et al. [2] identified four minerals from this ore that correlated to poor performance viz, talc, amphibole, andradite and calcite. In associated studies at KUCC, [3–5], the reasons for molybdenite losses were evaluated. Although the flotation performance of molybdenite generally lags that of the copper sulphide minerals and is much more variable, there may be some factors that affect both minerals. There are many factors including particle size, liberation, surface slimes and oxidation that contribute to the losses and also much speculation as to the relative contribution of each of these factors. * Correspondence to: [email protected] 73
Transcript of The Role of Process Mineralogy in Identif
Maarten A. T. M. Broekmans (ed.), Proceedings of the 10th International Congressfor Applied Mineralogy (ICAM), DOI: 10.1007/978-3-642-27682-8_10,� Springer-Verlag Berlin Heidelberg 2012
THE ROLE OF PROCESS MINERALOGY IN IDENTIFYING THE CAUSE OF THE LOW RECOVERY OF CHALCOPYRITE AT KUCC
Dee J. Bradshaw 1*, Brett Triffett2 and Dave Kashuba3
1Julius Krutschnitt Mineral Research Centre, University of Queensland, Isles Road, Brisbane, QLD 4068, Australia
2OZ Minerals 31 Queen St, Melbourne, VIC, Australia
3Kennecott Utah Copper Corporation, P. O. Box 6001, Magna, UT 84044, USA
Abstract
Kennecott Utah Copper Concentrator processes ore from the Bingham Canyon porphyry copper deposit to produce copper and molybdenum concentrates in two circuits (bulk and molybdenum circuits). This deposit contains a number of ore types that are classified based on lithology and processing characteristics. The concentrator processes blends up to five ore types at any one time. During the period May 2005–October 2006, periods of low copper and molybdenum recoveries were noted and attributed to higher proportions of limestone skarn ore (LSN) in the blend. After a full technical and economic analysis it was recommended that the LSN ore be stockpiled and processed separately. This was adapted as standard procedure in 2007. For successful processing, operating conditions required modification. This paper discusses a multifaceted investigation in both laboratory and of the five plant campaigns to ascertain the causes of the reduced copper recoveries observed while processing LSN ore.
Keywords: copper minerals, process mineralogy, liberation 1 INTRODUCTION
With over 100 years of mining history, the Bingham Canyon mine has always been considered a significant copper deposit [1]. Kennecott Utah Copper Concentrator processes ore from the Bingham Canyon porphyry copper deposit to produce copper and molybdenum concentrates in two circuits (bulk and molybdenum circuits). This deposit contains a number of ore types that are classified based initially on lithology and on processing characteristics and over the years, over 30 ore classifications have been identified. The concentrator processes blends up to five ore types at any one time. During the period May 2005–October 2006, periods of low copper and molybdenum recoveries were noted and attributed to higher proportions of limestone skarn ore (LSN) in the blend. Triffett et al. [2] identified four minerals from this ore that correlated to poor performance viz, talc, amphibole, andradite and calcite. In associated studies at KUCC, [3–5], the reasons for molybdenite losses were evaluated. Although the flotation performance of molybdenite generally lags that of the copper sulphide minerals and is much more variable, there may be some factors that affect both minerals. There are many factors including particle size, liberation, surface slimes and oxidation that contribute to the losses and also much speculation as to the relative contribution of each of these factors.
* Correspondence to: [email protected]
73

Late 2005, an MLA was installed and commissioned at KUCC to help determine where circuit losses occurred on days when recovery was less than 80% of the available copper [6]. This provided quantitative evidence of the nature of the losses. Dunn [7] conducted a technical and economic evaluation and recommended that the LSN ore be stockpiled and processed separately, which was adapted as the site procedure in 2007. This paper discusses the causes of the reduced copper recoveries observed while processing LSN ore relative to the normal monzonite ores (MZME3). In the first part of the work, the mineralogical differences between LSN ore and MZME3 ore were characterized, and laboratory batch flotation tests evaluated this effect on flotation performance. In the second part of the work conducted on site, the performance of the five LSN campaigns of 2007 was compared and the effect of reagent changes compared. Surface analysis of selected particles by SEM and EDAX at the University of Utah was done.
2 EXPERIMENTAL DETAILS 2.1 Laboratory and mineralogical evaluation
Thirty-kilogram samples of MZME3 (good ore) and LSN (problematic ore) were obtained directly from the KUCC pit (modal mineralogy in Table 1). Specimens were selected from each sample for producing thin sections and the remainder crushed and split into 1-kg aliquots for batch flotation tests. Milling curves were done and the time identified to obtain flotation feed particle size distributions of 70% <150 μm (12 min for MZME3 and 10 min for LSN) and the mass distributions shown in Table 2. Feed samples were screened at 150
μm, 75 μm and 20 μm. All four size fractions were then assayed and subjected to QEMSCAN examination and
elemental ICP-OES and the liberation data used for Figure 4.
2.2 Batch flotation test procedure One kg of ore was combined with 1.6-g lime, 0.9-μL burner oil (molybdenite collector) and 500-mL synthetic plant water of equivalent composition to plant water (755-ppm Ca 2+; 205-ppm Mg2+; 74-ppm K
+; 1203-ppm Na+; 2591-ppm SO42−; 1947-ppm Cl− ). After grinding, the pulp was placed in a 3-L Denver flotation cell and made up to the required volume with synthetic plant water (33% solids). The impellor was then turned on (1300 rpm) and lime, CaO, was added (between 2.06 and 2.49 g) until the pulp reached a steady pH of 10.3. Collector (10.3-μL S8989) and frother (20-μL FF109) were subsequently added and the slurry conditioned for a further 3 min. The air was then turned on and froth allowed to build up for 1 min. Three concentrates were then collected at 1, 2 and 5 min. The air was then turned off and a further 3-μ
L collector, 0.9-μL burner oil and 10-μL frother was added. The air was then turned on for a further 5 min and the last concentrate was collected. After the tests the concentrated were filtered, dried, and assayed for Cu.
2.3 Plant surveys Five LSN campaigns were run in 2007 between 3 and 7 days durations and the production summary and flotation performance is shown in Table 3. During this time the molybdenum plant was shut down and ore that had been stockpiled was processed. For surveys 1 and 2, the plant operating conditions remained ‘standard’ with the burner oil and other reagents kept constant as though the molybdenum plant was in operation. For the next three surveys the conditions and reagents for molybdenite flotation were stopped and operating conditions modified. Samples of final concentrate and tails were evaluated using the site based MLA [7].
3 RESULTS 3.1 Mineralogical characterisation Photomicrographs of the thin sections in Figure 1 show the difference in textures between the ores and that the major copper minerals are more disseminated in the LSN ore. Table 1 reports the modal mineralogy of
74

the ores evaluated and comparison with Figure 2, the copper mineral abundance, shows that although the total amount of copper is similar there are significant differences in the nature and proportion of the gangue minerals in the two ores. Table 1 shows the distribution of the mass of material in each size fraction and that the LSN ore has a less even distribution with both more material in the coarse and fines fraction. This could result from the presence of hard minerals, such as andradite, as well as softer minerals in the LSN ore.
Figure 3 shows the distribution of magnesium minerals in various sizes and that there are different magnesium bearing minerals as well as a different distribution by size. The MZME3 ore contains predominantly biotite, phlogopite, and chlorite and the amount in each size fraction is even, whereas although there is some biotite in the magnesium minerals in the LSN ore, amphibole, talc, and pyroxene are the predominant minerals and there is considerably more amphibole in the −20-μm size fraction.
3.2 Laboratory flotation tests
Figure 4 shows the theoretical grade versus recovery curve for LSN and MZME3 ores obtained from the QEMSCAN analysis of the flotation feeds and show the lower liberation of the LSN ore in the coarser sizes. These results correlate to the lower flotation performance obtained for LSN ore at these sizes in the batch flotation tests as shown in Figure 5. The lower recovery of LSN ore in the finer size fractions indicates that there is another mechanism also responsible for the reduced flotation of copper minerals in the LSN ore, potentially slimes coating of the magnesium rich amphibole minerals. 3.3 Plant results
Table 3 summarizes the production and copper recovery for the duration of the five surveys compared in term of two sets of surveys. Surveys 1 and 2 were undertaken at standard (initial) conditions whereas 3–5 undertaken at ‘improved conditions’ without the molybdenum reagents. For the second set of surveys, the throughput was lower and the grind was finer which suggests that increased liberation was the reason for the increased recovery. However, Figure 6 shows that there was reduced chalcopyrite recovery for all size fractions for the first set of surveys. Figure 7 shows that recovery was independent of the reduced particle size distribution. The MLA analysis of the losses for both these sets of surveys relative to those obtained with good ‘MZME3’ ore shows that losses for ‘LSN’ Standard conditions’ consisted of liberated material, indicating a surface effect.
4 DISCUSSION
Although there was little difference in copper grades (0.64% Cu for MZME3 and 0.54% for LSN), the major copper minerals were more finely disseminated in the LSN ore affecting liberation and the theoretical grade recovery curve for the same particle size distribution. There were major differences in the gangue minerals in the two ores, which affected the ore hardness and milling time to get to the same particle size distribution. There were more magnesium and calcium bearing minerals in the LSN ore than in the MZME3 ore. The presence of calcite in the LSN ore has the potential to add calcium ions to the solution. As similar levels of ions were measured with both ores, it is possible that there was some precipitation of Ca salts on the mineral surfaces. The mineralogical characterization indicated that there were potential processing problems with the LSN ore arising from both the coarse (unliberated) and fine fractions causing slimes coatings.
The plant tests showed that the changed reagent conditions improved the copper recovery significantly, particularly of the fully liberated material. The identification of slimes material on the copper and gangue (‘insol’) particle showed that this was a potential mechanism to be further investigated.
75

5 CONCLUSIONS
The mineralogical investigation showed the more disseminated texture of the LSN ore. The finer grain size of the copper minerals and the copper mineral deportment by size after milling led to less liberation of the valuable minerals in LSN ore compared to MZME3 ore, particularly in the coarser size fractions.
Laboratory batch flotation tests showed that the poor performance in the LSN ore could be attributed to; less material being in the optimum size fraction for flotation as well as less liberation of copper minerals in the coarser fractions.
The higher amount of magnesium bearing minerals in the −20-μm size fraction could also result in slimes coating and reduced recovery of copper to the concentrate for all size fractions.
Comparison of the first two LSN campaigns with the second three, showed that although the ores were similar with similar indicator minerals, plant recovery had increased from 60.0 % (average 7 test days) for the first two campaigns to 78.8% (average 18 test days) for the next three campaigns indicating that operational changes had significantly increased recovery resulting in greater production of copper in spite of the lower amount of tons being processed.
Evaluation of the MLA data for selected days of these campaigns showed that increased copper recovery was obtained from the recovery of liberated coarse chalcopyrite and that this was accompanied by a lower recovery of magnesium minerals, particularly in the fines, indicating a mechanism of slimes coating, which was reduced once operating conditions were changed.
Inspection of selected particles from the tails with SEM showed that slimes coating was possible under the flotation conditions. It should be noted that samples were not analyzed immediately and the time of exposure of particles to the flotation pulp was a few days, and these tests should be repeated.
Further more rigorous tests should be done to validate the indications from this work and establish the mechanisms responsible for copper losses.
6 ACKNOWLEDGEMENTS The authors would like to acknowledge and thank the Dewetia Latti and Greg Wilkie of Rio Tinto, Technology and Innovation as well as the management at KUCC for permission to publish the work contained in this paper. Also thanks for the significant contributions of the mineralogical analysis by Dr. Megan Becker, University of Cape Town and SEM photomicrographs by Prof. Jan Miller and Luis Roman, University of Utah. 7 REFERENCES [1] Babcock, RC, Ballantyne, G, and Phillips, C (1997): Summary of the geology of the Bingham District,
Utah. In: Geology and Ore Deposits of the Oquirrh and Wasatch Mountains, Utah, Society of Economic Geologists, October 1997.
[2] Triffett, B, Veloo, C, Adair, BJI, and Bradshaw, D (2008): An investigation of the factors affecting the recovery of molybdenite in the Kennecott Utah Copper bulk flotation circuit. Minerals Engineering (21): 832–840.
[3] Triffett, B, and Bradshaw, D (2008): The role of morphology and host rock lithology on the flotation behaviour of molybdenite at Kennecott Utah Copper. In: Gu, Y (editor): Proceedings of 9th International Congress for Applied Mineralogy (ICAM): 465–473.
[4] Ametov, I, Grano, SR, Zanin, M, Gredelj, S, Magnuson, R, Bolles, T, and Triffett, B (2008): In: Zuo, WD, Yao, SC, Liang, WF, Cheng, ZL, and Long, H (editors): Copper and Molybdenite Recovery in Plant and Batch Laboratory Cells in Porphyry Copper Rougher Flotation, Proceedings of XXIV International Mineral Processing Congress: 1129–1137.
76

[5] Zanin, M, Ametov, I, Grano, S, Zhou, L, and Skinner, W (2009): A study of mechanisms affecting molybdenite recovery in a bulk copper molybdenum flotation circuit. International Journal of Mineral Processing (93): 256–266.
[6] MacDonald, M, Ben Adair, BI, Bradshaw, D, Dunn, M, and Latti, D (2011): Learnings from five years of on-site MLA at Kennecott Utah Copper Corporation (myth busters through quantitative evidence). In: Broekmans, MATM (editor): Proceedings of 10th International Congress for Applied Mineralogy (ICAM): this volume.
[7] Dunn, M (2006): Internal Project for Kennecott Utah Copper Concentrator. Unpublished report.
TABLE 1: Mineral deportment by size for MZME3 and LSN ores (%). % in LSN MZME3
Chalcopyrite 1.2 1.0
Bornite 0.1 0.3
Covellite 0.1 0.1 Chalcocite 0.1 0.1 Other Cu sulphides 0.1 0.1 Pyrite 2.3 0.1 Molybdenite 0.0 0.2
Other sulphides 0.2 0.1
Quartz 21.6 20.6
Plagioclase 0.1 4.0
Orthoclase KAlSi3O8 7.0 38.1
Altered orthoclase 0.0 4.5
Muscovite/illite 0.1 0.1
Al-silicate 0.0 2.1
Biot/Phlog 11.9 24.5
Chlorite 0.1 2.4
Talc 1.3 0.1 Amphibole 11.3 0.1 Pyroxene 10.8 0.1
Olivine/serpentine 0.1 0.1 Andradite 18.3 0.1 Epidote 0.3 0.1 Other silicates 0.1 0.1
Apatite 0.6 1.1
Calcite 12.6 0.2
Other oxides 0.1 0.4
Other 0.1 0.1
TABLE 2: Mass distribution (wt%) by size for MZME3 and LSN ores after milling to obtain approximately 75% <150 μm.
MZME3 ore size fractions (microns) LSN ore size fractions (microns)
−300 +150 −150 +75 −75 +20 −20 −300 +150 −150 +75 −75 +20 −20
32.00 14.86 22.89 30.25 28.40 21.50 27.30 22.80
TABLE 3: Summary of production and copper recovery for the five LSN campaigns in 2007 with groupings of surveys (1–2) and (3–5).
Head grade
( %) Daily throughput
(tons) Feed >150 μm (%)Cu recovery
(%) Cu grade
(%) Tons Cu
(day)
Surveys 1, 2: mean 0.7 155,737.0 30.4 60.0 26.2 625.2
Surveys 3–5: mean 0.7 134,566.0 26.0 78.8 27.5 693.5
Differences 0.0 −21,171.0 −4.4 18.8 1.3 68.3
77

Figure 1: Reflected light photomicrographs of a) MZME3 and b) LSN ore (same scale).
Figure 2: Abundance (in wt%) of copper minerals per size fraction for an overall size distribution of 70% passing 106 microns in a) MZME3 ore and b) LSN ore, both after 12 min milling.
Figure 3: Distribution of magnesium minerals in a) MZME3 ore and b) LSN ore showing the high
proportion of amphiboles in the LSN ore, particularly in the -20 micron fraction.
0.00
0.40
0.80
1.20
1.60
-20 +20 -75 +75 -150 +150 -300
Mineral abundance (%)
Particle size fraction (microns)
-20 +20 -75 +75 -150 +150 -300
Particle size fraction (microns)
Biot/Phlog
Chlorite
Talc
Amphibole
Pyroxene
Olivine/Serpentine
a) b)
0.00
0.05
0.10
0.15
0.20
-20 +20 -75 +75 -150 +150 -300
Mineral abundance (%)
Particle size fraction (microns)
-20 +20 -75 +75 -150 +150 -300
Particle size fraction (microns)
Chalcopyrite
Bornite
Covellite
Chalcocite
a) b)
a)
200 μm
ccp born mo
b)
200 μm
ccp
py
78

Figure 4: Theoretical grade versus recovery curve for chalcopyrite per size fraction of a) MZME3 and b) LSN ore.
Figure 5: Size by size copper recovery from batch flotation tests of MZME3 and LSN ores.
Figure 6: Chalcopyrite recovery for LSN campaigns (surveys 1-2 standard conditions vs. 3-5 with improved conditions).
a) b)
0
20
40
60
80
100
0 20 40 60 80 10
Grade (%)
Recovery (%)
0 20 40 60 80 100
Recovery (%)
+150 -300
+75 -150
+20 -75
-20
+150 -300
+75 -150
+20 -75
-20
0
20
40
60
80
100
-20 +20 -75 +75 -150 +150 - 300
Copper Recovery (%)
Size Fraction (microns)
MZME3 ore
LSN ore
0
20
40
60
80
1 00
-2 0 + 20 -75 + 7 5 -15 0 + 150 - 3 00
Chalcopyrite recovery (%)
Partic le sixe fraction (microns)
STD Conditions Improved Conditions
79

Figure 7: Contribution of particle size to copper recovery on plant for LSN ore (surveys 1,2 vs 3,4,5)
Figure 8: Contribution of chalcopyrite losses to plant production in terms of liberation for MZME3 and LSN ore (surveys 1,2 and 3,4,5) from MLA data for three size fractions a) -20 microns, b) 20 – 75 microns and
c) 75 – 150 microns.
Figure 9: Scanning electron microscope images of a) chalcopyrite and b) ‘insol’ particle showing fine
particulates on the surfaces of minerals recovered from the tails samples during the plant surveys.
b) c)
a)
100 μm
b)
50 μm
0
25
50
75
100
0 5 10 15 20 25 30 35 40
Recovery (%)
% below 150 microns
STD Conditions Improved Conditions
a)
Locked Middling Liberated Locked Middling Liberated 0.0
4.0
8.0
12.0
Locked Middling Liberated
Contribution to Cu loss (%)
gLSN -With burner oil LSN - No burner oil Monzonite ore
80