The Role of Occupant Behavior in Achieving Net Zero … The Role of Occupant Behavior in Achieving...
101
PNNL-22824 Prepared for the U.S. Department of Energy under Contract DE-AC05-76RL01830 The Role of Occupant Behavior in Achieving Net Zero Energy: A Demonstration Project at Fort Carson KS Judd M Zalesny T Sanquist N Fernandez September 2013
Transcript of The Role of Occupant Behavior in Achieving Net Zero … The Role of Occupant Behavior in Achieving...

PNNL-22824
Prepared for the U.S. Department of Energy under Contract DE-AC05-76RL01830
The Role of Occupant Behavior in Achieving Net Zero Energy: A Demonstration Project at Fort Carson KS Judd M Zalesny T Sanquist N Fernandez September 2013


PNNL-22824
The Role of Occupant Behavior in Achieving Net Zero Energy: A Demonstration Project at Fort Carson KS Judd M Zalesny T Sanquist N Fernandez September 2013 Prepared for the U.S. General Services Administration under Department of Energy Contract DE-AC05-76RL01830 with Battelle Memorial Institute Pacific Northwest National Laboratory Richland, Washington 99352

iii
Summary
How occupants interact with their buildings needs to be a key consideration for all green building planning, design, operations and decision-making. Research on the performance of green buildings in recent years has placed greater emphasis on the need and opportunity to better understand the roles of occupants and the factors that shape their behavior, including default conditions, institutional frameworks, organizational culture, peer pressure and more. Understanding the relative impact of technology-based vs. occupant behavior-based strategies – and combinations of the two – is a key to learning how to make high performing green buildings commonplace.
These questions are especially critical in the Federal building context, where ambitious sustainability goals require pushing green building performance to exemplary levels. These goals include the requirement that all new Federal buildings be designed to achieve zero fossil fuel use by 2030 (Energy Independence and Security Act of 2007) and the Army’s Net Zero Installation program, whereby Army installations work to make entire bases so resource efficient that they will use net zero energy, water or waste by 2020.
Fort Carson in Colorado Springs, CO is one of only two Army bases currently pledged to achieve net zero energy, water and waste. Its ambitious goals, and over 50 LEED-rated green buildings, make it an ideal site for a demonstration project on how occupant behavior may be leveraged to help buildings achieve net zero energy performance.
This study, The Role of Occupant Behavior in Achieving Net Zero Energy: A Demonstration Project at Fort Carson, was sponsored by the U.S. General Services Administration’s (GSA’s) Office of Federal High-Performance Green Buildings (OFHPGB). The Office’s mission is to facilitate the greening of the Federal building portfolio, by conducting applied research and demonstrations, developing standards, guidance and tools, and disseminating information. The Pacific Northwest National Laboratory (PNNL) partnered with GSA, the Department of Defense (DOD) and Department of Energy (DOE) in conducting this demonstration project at five green buildings on the Fort Carson Army base.
The research focused on understanding the potential for institutional and behavioral change to enhance building performance. The research team identified specific occupant behaviors that had the potential to save energy in each building, defined strategies that might effectively support behavior change, and implemented a coordinated set of actions during a three-month intervention.
The intervention focused on changing two occupant behaviors that had the potential to save energy:
shutting down computers at night in the participating buildings, and
setting back thermostats 5-10 degrees at night during heating season in the two buildings with decentralized heating/cooling controls.
The behaviors were selected considering the specific context of each building, including the way occupants interacted with building features and estimates of the energy use impacts from changing different behaviors. Other behaviors (e.g., relying on natural light and task lighting instead of overhead
iv
lights) were also promoted but were not the focus of efforts to measure change and estimate energy savings.
The measure of success of this intervention was whether the groups targeted for behavior change modified their behavior as a result of it. The findings showed that many occupants changed their behavior during the study period, and differences in the degree of change by building helped point to factors that appeared to be most influential.
In the building showing the most dramatic change, just 8% of computers were shut down during the first week. This increased to 59% in week 6, which was the week of highest compliance based on computer network scans that verified whether assets were on or off. The maximum increase in computer shutdown compliance between the baseline week (week 1) and the week with the building’s highest levels of compliance ranged from a 13% increase to 36% increase, indicating that occupants of all the participating buildings took some action as a result of the intervention. Self-reported changes in the post-intervention survey indicated that between 23% and 32% more occupants (for the two buildings participating in this measure) turned back temperature settings on their workspace heating units each night. These results were encouraging for a three-month intervention period.
Figure ES-1.Percent of Computers Shut Down at Night by Building Based on Computer Network Scans (numbers represent compliance rates in first week, final week and the highest compliance week)
Changes in awareness and attitudes also suggest an overall positive reaction to the intervention. In surveys conducted prior to the intervention, most occupants initially reported having a high level of awareness and positive attitude about Fort Carson’s Net Zero Energy effort. However, fewer reported feeling a sense of personal responsibility to save energy in their building. This suggested that there may have been a disconnect between institutional goals such as achieving net zero energy use, and the beliefs of building occupants that they could contribute to achieving those goals through actions they take in their building.
5%‐1%
7% 8%
51%
59%
43%37%
24%
64%
18% 19%
28%
57%54%
9420 9447 9427 1118 1219
Week 1 Week 2 Week 3 Week 4 Week 5 Week 6
Week 7 Week 8 Week 9 Week 10 Week 11 Week 12

v
Providing limited, specific, and locally relevant information during the intervention appeared to help occupants understand how they could take action and have an impact in their own building. In the building with the most dramatic changes in behavior, changes included increased proportions of respondents who agreed that they:
have the skills to use energy saving technologies: from 65% to 90%,
feel personally responsible for reducing energy in their building: from 64% to 89% and,
believe reducing energy use in their building is important: from 76% to 92%.
This lends support to the idea that making conservation measures specific to the local context—and giving occupants the knowledge and ability to change—may help close the gap between big institutional objectives, like Net Zero Energy, and small, individual actions.
Findings from this study also support the idea that energy change efforts may be most effective if approached as a “high touch” activity through person-to-person communications. Specific factors that respondents said had the greatest influence on their energy conservation behavior were receiving:
instruction from an immediate supervisor
information on specific actions to take
feedback on performance from a local advocate for energy conservation1 and,
a letter from leadership encouraging occupants to take the specific conservation measures.
The building showing the greatest improvement during the intervention was one with an engaged local advocate who regularly shared information and feedback with occupants and their managers and suggested changes in behavior when actions were not being followed. In the buildings with less engaged energy advocates, supervisors who talked with occupants were influential in changing poor computer shutdown compliance rates within a week’s time.
Energy metering challenges and the dramatic occupancy changes in buildings occupied primarily by military personnel limited the research team’s ability to draw conclusions about the actual energy savings. Analysis of whole-building metering data available for one building suggested that the combined results of shutting down computers and setting back thermostats at night would have saved an estimated 2% of total annual energy use in that building.
The actual range of potential savings could vary widely by building and depends on differences in opportunities for change. Even the 2% savings estimated from one building in this intervention—which required about two hours of effort each week on the part of a local advocate over a 3-month period—may be meaningful in the context of a net zero energy target that requires squeezing out every potential percentage point of energy savings.
1 Building energy monitors are local, building-specific energy conservation advocates.

vi
As part of the baseline survey, this study also looked at occupant satisfaction with the features of their green buildings. Due to the transition of military personnel as part of their deployment cycle at the start of the study period, responses on satisfaction were primarily limited to civilians in two buildings. As a result, findings from the baseline analysis may not be generalizable to military personnel or buildings at Fort Carson or other bases. More than 80% of the respondents indicated they were generally satisfied with most personal workspace and buildings features. Eighty-three percent (83%) were satisfied with the overall building performance. Thermal comfort—often one of the greatest sources of occupant complaints—had satisfaction rates of 68%. This level of satisfaction is much higher than is typically found with building occupant surveys (e.g., 39% satisfaction in a study of 34,169 occupants in 215 buildings [Huizenga 2006]), and is likely due to the fact that most of the respondents were in buildings with direct occupant control over heating and cooling units.
Our findings from this project have several implications for programs to help reach net zero energy goals through sustained institutional and behavioral change at Fort Carson and other Army installations. These include:
Recognize that the institutional context must be understood to enable desired change in individual behavior.
Make desired behaviors specific and locally relevant. Awareness of institutional goals is not enough to lead to local actions.
Provide social reinforcement on a regular basis from known and trusted sources. An energy advocate can facilitate behavior change – if they are both required and equipped to maximize their effectiveness.
Equip tenants with knowledge and resources to implement behavior change. That includes securing leadership support and ensuring accountability for follow-through.
Specific recommendations that may help Fort Carson and the Army strengthen its Building Energy Monitor (BEM) program and enable change at the local level include:
Ensure that the BEMs, as local energy conservation advocates, are trained and have resources to facilitate energy behavior change in building occupants.
Measure energy conservation behavior and outcomes in new and existing buildings.
Provide regular information and feedback to building occupants on their performance.

vii
Acknowledgments
The authors of this study would like to thank Ken Sandler and Judith Heerwagen of the U.S. General Services Administration, who provided guidance, oversight, and support throughout the design and implementation of this study.
The support of several individuals at Fort Carson was instrumental to the successful execution of this project. Energy Program Coordinator Scott Clark was key to getting the BEMs assigned and trained and solicited input from them throughout the demonstration project. Scott also provided the research team with data on building energy performance. We would also like to acknowledge the five building energy monitors – Alice Doyle, Earl Ross, Hardy Louihis, Desmond Ross, and Henry Smith – who participated in the training and carried out BEM duties over the course of this demonstration project.
Mary Barber and Anneliesa Barta of the Sustainable Fort Carson Program were a tremendous help in engaging and securing the support of key personnel at Fort Carson, facilitating the distribution of occupant surveys, and developing marketing materials for the behavior change program.
Kevin Smith of the Fort Carson’s Network Enterprise Center worked late many evenings during the study period to scan the computer network and measure the number of computers that were shutdown at night. Several other members of the Fort Carson Department of Public Works provided prompt and timely responses to requests for information. All were very generous with their time and support of this effort.
Finally, we like to thank Jerry Dion of the Department of Energy’s Federal Energy Management Program (FEMP) and the FEMP Institutional Change for developing the research methodology used to guide this demonstration project.
Thanks to these and all others who participated in this research effort.

ix
Contents
Summary ........................................................................................................................................... iii
Acknowledgments .............................................................................................................................vii
1.0 Introduction ................................................................................................................................ 1
2.0 Purpose of Research ................................................................................................................... 3
2.1 Behavior: Why it Matters ................................................................................................... 3
2.2 State of Research on Behavior Change and Energy Reduction ......................................... 4
2.3 Relevance to Fort Carson and the Army ............................................................................ 5
2.4 Research Questions and Objectives ................................................................................... 6
2.5 Buildings Selected for the Demonstration Project ............................................................. 6
3.0 Methods ...................................................................................................................................... 9
3.1 Determine Goal .................................................................................................................. 9
3.2 Identify Context – Rules, Roles and Tools......................................................................... 9
3.3 Develop Action Plan ........................................................................................................ 12
3.4 Implement Plan ................................................................................................................ 14
3.5 Measure and Evaluate ...................................................................................................... 15
4.0 Findings .................................................................................................................................... 17
4.1 Occupant Interaction and Satisfaction with Building Features ........................................ 17
4.2 Changes in Behaviors and Attitudes ................................................................................ 20
4.2.1 Behavior Changes ................................................................................................. 20
4.2.2 Awareness and Attitude Changes .......................................................................... 24
4.3 Highest Impact Strategies for Behavior Change .............................................................. 27
4.4 Estimated Energy Savings Impact Intervention ............................................................... 33
4.4.1 Energy Savings Potential ...................................................................................... 33
4.4.2 Measurement Approach and Metering Challenges ............................................... 34
4.4.3 Estimated Savings Based on Actual Compliance in Building 1118 ...................... 35
5.0 Conclusions and Recommendations ......................................................................................... 41
5.1 Summary of Findings ....................................................................................................... 41
5.2 Implications for Institutional and Behavioral Change Programs ..................................... 42
5.3 Recommendations to Fort Carson and the Army ............................................................. 45
6.0 References ................................................................................................................................ 49
Appendix A – Group Interview Questions ..................................................................................... A.1
Appendix B – Baseline Survey Questions ...................................................................................... B.1
Appendix C – Building Energy Monitor Roles and Responsibilities ............................................. C.1
Appendix D – BEM Floor Check Form .......................................................................................... D.1
Appendix E – Intervention Evaluation Plan ................................................................................... E.1
Appendix F – Characteristics of Survey Respondents ..................................................................... F.1

x
Appendix G – Email Messages from Building Energy Monitors ................................................... G.1
Appendix H – Customized Posters for Civilian and Military Buildings......................................... H.1
Appendix I – Letter from Fort Carson Leadership to Building Occupants ...................................... I.1
Figures
1. Army Net Zero Energy Hierarchy .............................................................................................. 5
2. FEMP Institutional Change Continuous Improvement Cycle .................................................... 9
3. Frequency with Which Different Building Features are Adjusted by Occupants (baseline survey) ...................................................................................................................................... 18
4. How Well Informed Occupants Feel About Energy Saving Features of their Building (baseline survey) ....................................................................................................................... 18
5. Occupant Satisfaction with Different Personal Workspace or Building Features (baseline survey) ...................................................................................................................................... 19
6. Satisfaction with How Well Different Building Features Function to Create a Comfortable Work Environment (baseline survey) ....................................................................................... 20
7. Frequency with Which Occupants Reported Taking Different Energy Saving Actions at Work (post-intervention survey) ............................................................................................... 21
8. Change in Frequency with Which Occupants Took Different Actions during the Intervention (post-intervention survey) ......................................................................................................... 22
9. Frequency with Which Thermostats are Set Back in Work Area When Leaving for the Day at the End of the Intervention Compared to the Beginning (post-intervention survey) ............ 22
10. Percent of Computers Shut Down at Night by Building Based on Computer Network Scans (numbers represent first week, final week and highest compliance rates) ................................ 23
11. Change in Computer Shutdown Behavior by Building Based on Network Scans ................... 24
12. Change in Awareness and Attitudes about Energy Conservation in all Fort Carson Buildings (upper bar is baseline and lower bar is post-intervention) ........................................................ 25
13. Changes in Awareness and Attitudes around Energy Conservation in Building 1118 ............. 26
14. Changes in Awareness and Attitudes around Energy Conservation in Building 1219 ............. 27
15. Extent to Which Factors Influenced Energy Use Behavior during the Intervention for all Buildings (post-intervention survey) ........................................................................................ 28
16. Influence of “Instruction or Guidance from Immediate Supervisor to Take Energy Saving Actions” in Civilian Administration Buildings (post-intervention survey) .............................. 29
17. Influence of Personal Conversations with Peers about Opportunities to Save Energy ............. 30
18. Other Factors that Influence the Way Occupants Manage Energy (grouped responses to open-ended question) ................................................................................................................ 33
19. Hourly Comparison of Expected and Observed Weekday Electricity Savings in Building 1118 .......................................................................................................................................... 36
20. Hourly Natural Gas Savings Patterns in Building 1118 ........................................................... 37
21. Total Observed Energy Savings in Building 1118 between Baseline and Intervention Period 39

xi
Tables
1. Characteristics of Buildings in Fort Carson Demonstration Project ........................................... 7
2. Behavior Patterns that Affect Building Energy Performance, Basis for Change, and Priority . 11
3. Performance Objectives for Groups Targeted through the Intervention ................................... 13
4. Behavioral and Institutional Change Principles and Examples of Planned Intervention Strategies ................................................................................................................................... 14
5. Mapping of Actions Implemented by BEM for Each Building (shading indicates action was confirmed to have been implemented; if unknown, it was left blank) ...................................... 31
6. Estimates of Savings Potential from Computer Shutdown Assuming 100% Compliance by Occupants of Building 1118 ..................................................................................................... 34

1
1.0 Introduction
The U.S. General Services Administration’s (GSA) Office of Federal High-Performance Green Buildings is required under the Energy Security and Independence Act of 2007 (EISA 2007) to complete a demonstration project each year on green building features in federal buildings. The goal of these demonstration projects is to evaluate how green features, technologies, and approaches are working in practice (not just according to designed or modeled performance) to help make sure the federal government learns from its experiences in green building and applies those lessons to current and future programs.
The 2012 demonstration project focused on the Fort Carson Army base in Colorado Springs, Colorado, and was conducted in collaboration with the U.S. Department of Defense and the U.S. Department of Energy. Fort Carson was chosen because of its goals to achieve zero net energy, water and waste and the presence of a strong, ongoing sustainability program with which to partner. The demonstration focused on five green buildings and involved two major activities:
an evaluation of building performance and opportunities to optimize design in common types of military buildings, led by the National Renewable Energy Laboratory (NREL), and
an evaluation of the way occupants interact with green buildings and opportunities to optimize their behavior to further reduce energy use, led by Pacific Northwest National Laboratory (PNNL).
This report summarizes findings from the 18-month effort led by the PNNL to establish specific occupant behaviors that had the potential to save energy in the five green buildings, define strategies that might effectively support behavior change, implement a short-term change program, and evaluate its impacts. The five buildings studied as part of this demonstration included both typical administrative buildings and military support “Company Operations Facilities” (COFs—occupied exclusively by military personnel) with combined office and high-bay storage areas for military equipment. Many of the military personnel moved into the buildings during the study period while the civilians remained in their designated buildings throughout the period.
About Fort Carson
Fort Carson is home of the 4th Infantry Division, the 10th Special Forces Group, the 71st Ordnance Group (EOD), the 4th Engineer Battalion, the 759th Military Police Battalion, the 10th Combat Support Hospital, the 43rd Sustainment Brigade, MEDDAC (Evans Army Community Hospital), the 13th Air Support Operations Squadron of the United States Air Force, and other support services. The post also hosts units of the Army Reserve, Navy Reserve, and the Colorado Army National Guard.
As of 2013, the population of Fort Carson totaled nearly 30,000 with 24,000 military and 5,700 civilian personnel. Fort Carson’s footprint spans 215 square miles and includes about 900 buildings with nearly 13 million square feet of heated space.
Fort Carson has a well-established sustainability program with a strong emphasis on energy conservation, efficiency, and renewable energy.

3
2.0 Purpose of Research
2.1 Behavior: Why it Matters
Interest in behavior change reflects a growing recognition that technology solutions alone will not achieve energy conservation goals. While organizations often emphasize investments in physical upgrades and new technologies, the full potential of these technologies often cannot be achieved without accompanying behavioral and institutional change (Lutzenhiser 1993; Earhardt-Martinez and Laitner 2010). Even when technology upgrades, such as occupancy sensors on lights, can reduce exclusive reliance on the need for behavior change for certain end uses, budgets may constrain integration of technology upgrades into existing buildings, making human behavior the only means of conserving resources in some facilities. Furthermore, the practice of trying to design out the human element often has unforeseen consequences, such as creativity by building occupants to defeat or modify intended functionality (e.g., light sensors, thermostats). Occupant behavior can strongly influence building energy use. As shown by NREL in a study of zero energy homes1 in the San Diego area, variation in utility consumption and cost across homes was considerable (a factor of 50) for homes with photovoltaics, with the primary difference being homeowner choices about energy-intensive equipment and amenities (Farhar and Coburn 2006). Some homes with zero-energy capability actually consumed more electricity than conventional designs.
A focus on behavioral interventions can be useful in defining and executing the transferable actions and lessons learned to help fully realize the “behavioral wedge” of a broader set of strategies that can help reduce energy use and stabilize greenhouse gas emissions. Considerable analysis in the past several years suggests that the behavioral wedge, which can include actions such as reducing plug loads or minimizing trips, and efficiency actions such as equipment replacement, can reduce energy consumption in the range of 10–30% (Gardner and Stern 2008; Dietz et al. 2009). Longer-term, understanding of behavior can help to reduce potential divergences between modeled and actual building energy performance, which is frequently observed in practice (Heschong Mahone 2012).
However, a focus on individual behavior is insufficient to effect enduring change. It is also necessary to change institutional behavioral patterns and thinking—this is essentially the infrastructure in which occupant behavior occurs (Moezzi and Janda 2013). Institutional change refers to a holistic systems approach to achieve change by integrating technology, policy, and behavior change. This means combining energy conservation cognizance and action into daily routines and ways of doing business, such as using natural light rather than electrical light in office settings, to ensuring that the purchase of energy efficient products is accepted practice. Behavior change is enabled by changes in institutional roles (who is responsible for what), rules (procedures and methods for doing things), and tools (specific energy reduction mechanisms, such as efficient equipment/appliances) (DOE 2013). To achieve aggressive energy conservation goals, it is increasingly important to develop integrated strategies that link mission, organizational policies, and behavioral change tactics to motivate and support new ways of interacting with the building environment (Moezzi and Janda, 2013).
1 Zero energy homes combine energy-efficient construction and appliances with commercially available renewable energy systems, such as solar water heating and solar electricity, resulting in net zero energy consumption from the utility provider.

4
2.2 State of Research on Behavior Change and Energy Reduction
There have been several, recent comprehensive reviews of research concerning behavior change in energy reduction (Heschong Mahone 2012; Moezzi and Janda 2013; Earhardt-Martinez and Laitner 2010) covering a wide range of factors (e.g., variability in energy usage, occupant engagement, and the behavioral/social potential for reducing consumption) and theoretical and empirical work over a 40-year period. The general conclusion from this work is that energy-behavior change can be demonstrated, but the impact and persistence of the change are the result of complex, interacting factors (Moezzi and Janda 2013). Long-term behavioral persistence, shown in several studies (Allcott 2010; Staats et al. 2004), suggests social factors, such as knowledge of continued participation in an energy program (Schwartz et al. 2013) and reinforcement through social learning (Staats et al. 2004), as contributing factors.
One recent review concerning behavior and organizational factors (Malone et al. 2013) synthesized the complex findings in this area into eight basic principles associated with behavior change and energy reduction:
1. Social Network and Communications Principle: Institutions and people change because they see or hear of others (e.g., individuals, groups, institutions) behaving differently.
2. Multiple Motivations Principle: Institutions and people almost always change their ways of doing things for more than one reason.
3. Leadership Principle: Institutions and people change because the workplace rules change and leadership communicates their commitment in a visible way.
4. Commitment Principle: Institutions and people change when they have made definite commitments to change, especially when those commitments relate to future conditions.
5. Information and Feedback Principle: Institutions and people change because they receive actionable information and feedback.
6. Infrastructure Principle: Institutions and people change because a changed infrastructure makes new behaviors easy and/or desirable.
7. Social Empowerment Principle: Institutions and people change when they feel they can reach desirable social goals.
8. Continuous Change Principle: Institutional change is an iterative process and takes time.
The eight principles described above delineate key enablers for change in complex organizations. However, they need to be considered in aggregate. There is no single approach that can work in isolation. Instead, behavioral change in an institution occurs when these principles are used together at various points in time.
There is a tendency to rely on awareness programs as the primary change strategy for changing behavior, but information and awareness alone are insufficient to change behavior. Multiple interacting strategies applied over an extended period have the best chance of changing institutional and behavioral patterns (Gardner and Stern 2002). The importance of focusing on behavioral and organizational factors is further emphasized by results showing that energy usage continues to rise over time, beyond the level simply accounted for by population increase (Shui et al. 2010). Technical efficiency alone may slow the
5
rate of energy use, but by itself is insufficient to achieve performance goals associated with aggressive energy and carbon reduction policies such as net-zero energy (Harris et al. 2008).
An elaborated view of behavioral/institutional research is beginning to emerge, which focuses more on the complex interactions that engender and support energy consumption (Moezzi and Janda 2013). Simple views based on concepts such as habit or information deficits are giving way to an understanding that changing energy consumption needs to engage behavior and institutions at multiple levels, in multiple ways (Prins and Rayner 2007). There are precedents for this type of engagement in public health and recycling programs, wherein multiple communication methods, infrastructure modifications, incentives, etc., are applied over a broad range of actors: individuals at the consuming end, organizations, institutions and policies at the infrastructure end (Dietz and Stern 2002). Similarly, the view of energy consumption is changing from a focus on individuals—an “end of pipe” problem—to the interacting elements that require and support consumption, and the various interventions and policy levers that can be used to move toward energy reduction goals, including net-zero (Heschong Mahone 2012; Moezzi and Janda 2013).
2.3 Relevance to Fort Carson and the Army
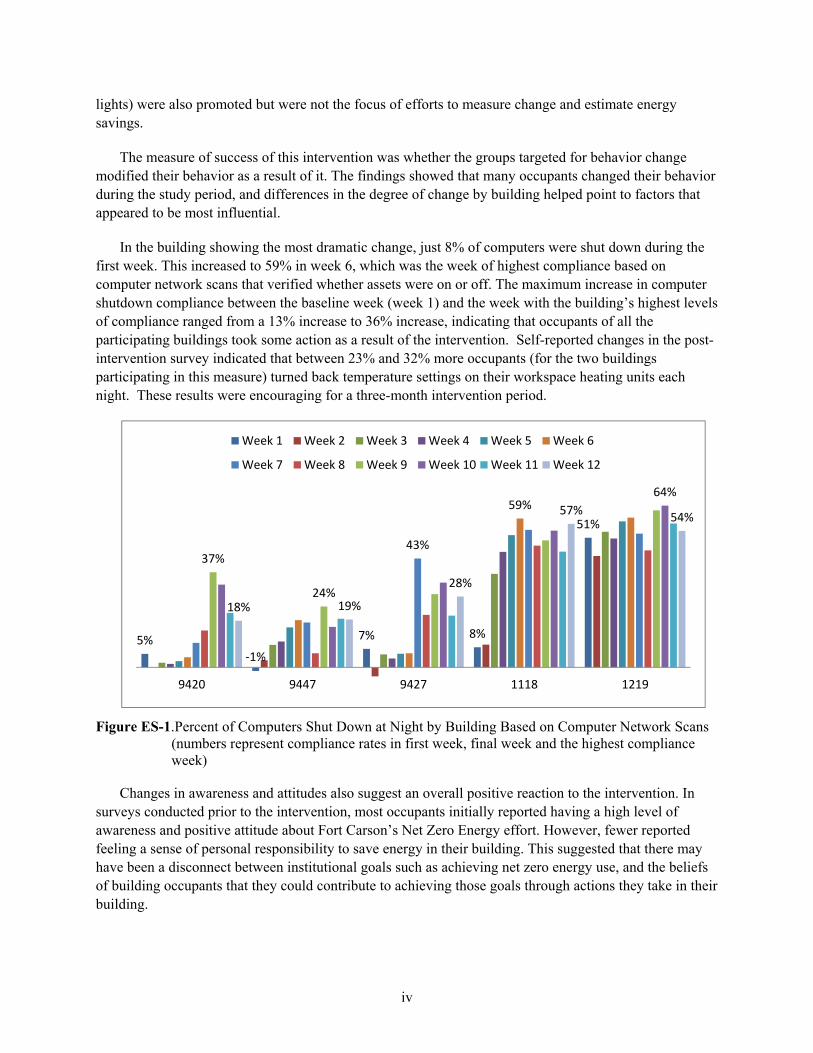
The importance of behavior-based energy reduction has several implications for the Army as a whole and Fort Carson, in particular, as a Net Zero Energy Installation1. First, energy use reduction is promoted as the most important element in moving toward net zero consumption (Figure 1). Although the Net Zero Initiative does not provide specific quantitative targets for each of these elements, reduction serves as the basis for the hierarchy of strategies. Implicit in this strategy are behavioral approaches that do not rely on new technology or generating capacity, but instead on reducing consumption. Thus, institutional and behaviorally based energy consumption represents a prime opportunity for demonstrating low/no-cost energy savings approaches that can reduce the need for additional technical efficiency measures or renewable generating capacity. This demonstration project aims to equip energy managers at Fort Carson and at other Army installations with practical lessons learned from a targeted effort to reduce energy use through institutional and behavioral change.
Prior research has shown that green building designs are subject to considerable variation in energy consumption, based on occupancy activities (Farhar and Coburn 2006). The Fort Carson demonstration project aims to provide further information concerning the interaction of green building features and occupant behavior on energy performance.
1 A Net Zero Energy Installation is an installation that produces as much energy on site as it uses, over the course of a year. To achieve this goal, installations must first implement aggressive conservation and efficiency efforts while benchmarking energy consumption to identify further opportunities. The next step is to utilize waste energy or to "re-purpose" energy, such as boiler stack exhaust. Co-generation recovers heat from the electricity generation process. The balance of energy needs then are reduced and can be met by renewable energy projects.
Figure 1. Army Net Zero Energy Hierarchy
6
Finally, Fort Carson is projecting a 21% increase in building square footage by 2015, with accompanying increases in energy usage, but at a lower rate due to technical efficiencies (Anderson et al. 2012). By understanding how to limit this demand through low or no-cost behavioral tactics, the need for additional generating capacity via renewables will be reduced. Net-zero that is achieved simply by vastly increasing renewable generating capacity fails to address the core problem of overconsumption.
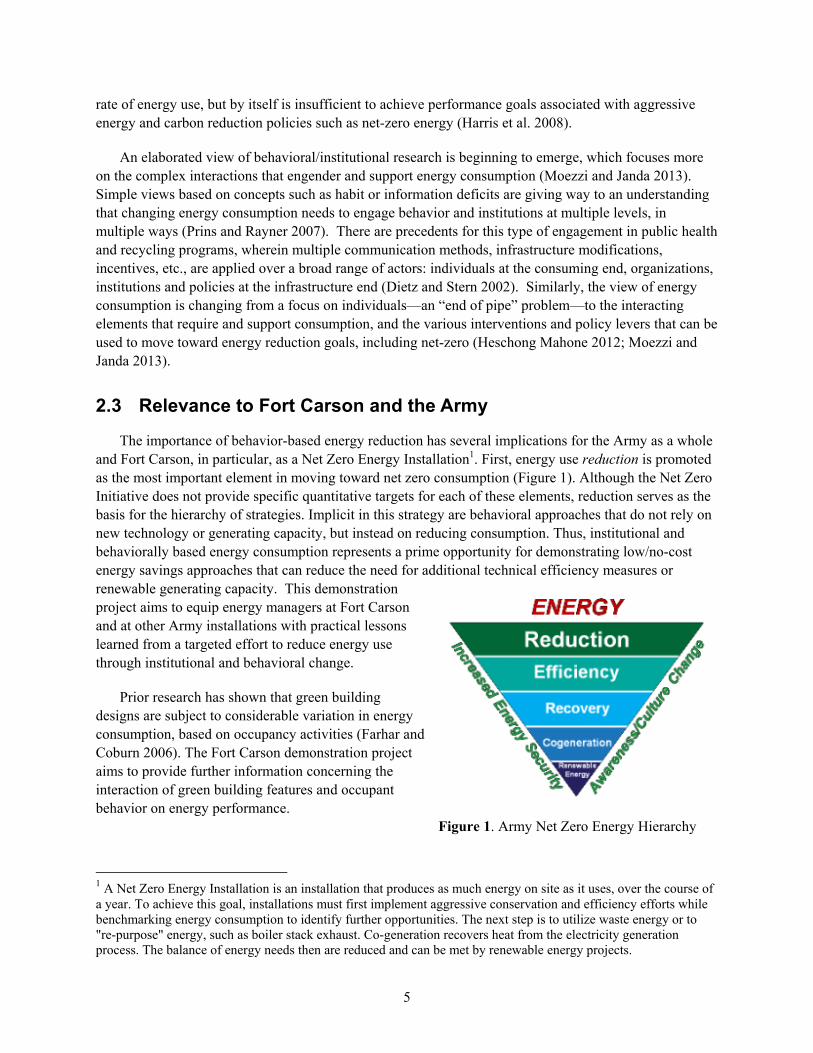
2.4 Research Questions and Objectives
The primary objectives of the behavior change demonstration project were to determine the extent to which green buildings at Fort Carson support the work performance, comfort, and well-being of occupants, and the extent to which occupants work with or against the green building design and operation features. This baseline understanding of occupant satisfaction and opportunities for improvement would inform potential behavioral interventions.
Another important objective of this research was to help understand which occupant behaviors could have the greatest impact on building energy use and to test different interventions to determine optimal ways to modify those behaviors for maximum long-term energy reduction. This supports the overarching goal of the GSA-Fort Carson Demonstration Project, which is to enable the federal government to learn from its experiences in green building and apply lessons learned to current and future programs.
2.5 Buildings Selected for the Demonstration Project
The research questions were addressed in a study of five green buildings at Fort Carson, which are either certified by the Leadership in Energy & Environmental Design (LEED) program or have some green building features. These included two administration buildings with predominantly civilian personnel, one administration building with military personnel, and two Company Operations Facilities (COFs), which are occupied by military personnel.
Table 1 summarizes key characteristics of each building and its occupants.
Key Research Questions
How do occupants of green buildings interact with building features?
How do occupants of green buildings perceive their work environment?
What behaviors have the greatest potential to save energy?
What approaches are most effective at promoting energy saving behaviors in buildings?

7
Table 1. Characteristics of Buildings in Fort Carson Demonstration Project
Building Number
Green Building
Certification Functions and Layout
Occupant Control of Building Features that Influence
Energy Use Type of
Occupants
Approximate Number of Occupants
1118 None, but renovated in 2007 with several green features
Administration building with both private offices and shared work spaces
Office lighting is manual and most common areas have occupancy sensors; heating and cooling is decentralized; each office and common area has wall-mounted units that occupants control; office spaces and conference rooms have operable windows.
Predominantly civilians, few military personnel supporting installation operations
160
1219 LEED Silver Existing Building
Administration building with both private offices and shared work spaces
Office lighting is manual and most common areas have occupancy sensors; heating and cooling is decentralized; each office and common area has wall-mounted units that occupants control; office spaces and conference rooms have operable windows.
Civilians and contractors, most working for the Department of Public Works
130
9420 LEED Platinum New Construction
Brigade Headquarters/ administration building with private offices, open work spaces, classrooms, and data center
All lighting on occupancy sensors; heating and cooling controls are centralized (no occupant control); no operable windows.
Military personnel from 4th Brigade Combat Team / 4th Infantry Division (4/4BCT)
250
9427 LEED Gold New Construction
Company Operations Facility with private and shared offices and high-bay storage areas
All lighting on occupancy sensors; heating and cooling controls are centralized (no occupant control); no operable windows.
Military personnel from the 4/4 BCT
75
9447 LEED Gold New Construction
Company Operations Facility with private and shared offices and high-bay storage areas
All lighting on occupancy sensors; heating and cooling controls are centralized (no occupant control); no operable windows.
Military personnel from the 4/4 BCT
75

9
3.0 Methods
The methodology for the Fort Carson demonstration project is based on the DOE-Federal Energy Management Program (FEMP) guidance for implementing institutional and behavioral change (DOE 2013) (Figure 2). This section describes the steps in this process and illustrates how it was applied at Fort Carson as it may inform the design of other energy conservation behavior change programs. At Fort Carson, the entire process was implemented over an 18-month project period.
3.1 Determine Goal
The first step in the change process is to establish the desired outcomes from the change effort, or intervention, and time frame for realizing those outcomes.
At Fort Carson, the focus was on individual behavior changes1 that might lead to energy conservation in five green buildings. The five buildings were selected for the analyses of both energy performance optimization opportunities by NREL and behavior change opportunities by PNNL, and were thought to represent typical building functions found on Army bases. The focus on energy conservation behavior was influenced by Fort Carson being a Net Zero Energy Installation with an interest in promoting well above average energy conservation, and synergies with NREL’s work that involved energy sub-metering in select buildings.
3.2 Identify Context – Rules, Roles and Tools
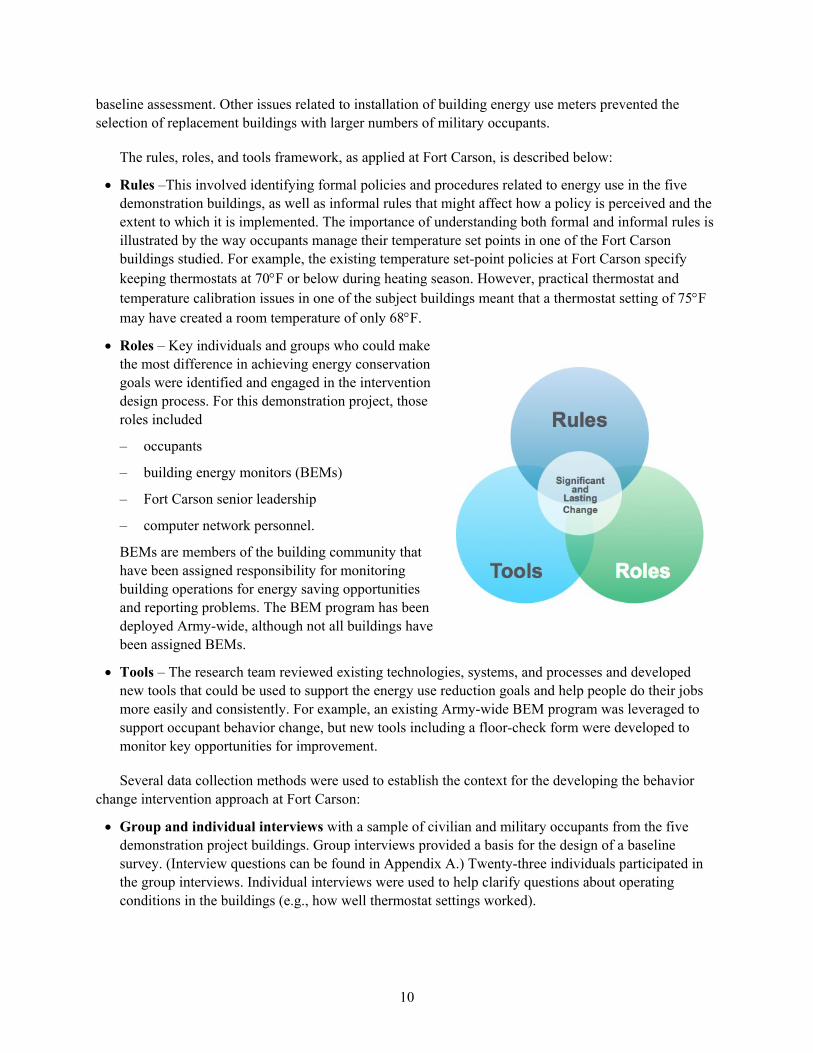
The next step is identifying the “rules, roles, and tools” (Malone et al. 2013) that shape the current context for energy conservation behavior, and understanding how they may influence success in driving toward the goal. This assessment ultimately shapes the design of the behavioral change intervention and is most critical to ensuring a successful outcome.
At Fort Carson, this phase of the process took about 40% of the time allocated for this project. A number of challenges with baseline data collection (e.g., getting survey responses, scheduling interviews during site visits), establishing metering connections, securing leadership support, and identifying personnel for key intervention support roles extended the “context assessment” and the subsequent intervention design period much longer than had been planned. Deployment of a large portion of the 4/4 BCT occurred between the time the buildings were selected for the project and data collection began, thereby reducing considerably the actual number of building occupants available to participate in the
1 Broader institutional changes are important for long-term sustained change: however, the short implementation period for the intervention allowed for only limited implementation of institutional changes as they often take more time to carry out.
Figure 2. FEMP Institutional Change Continuous Improvement Cycle
10
baseline assessment. Other issues related to installation of building energy use meters prevented the selection of replacement buildings with larger numbers of military occupants.
The rules, roles, and tools framework, as applied at Fort Carson, is described below:
Rules –This involved identifying formal policies and procedures related to energy use in the five demonstration buildings, as well as informal rules that might affect how a policy is perceived and the extent to which it is implemented. The importance of understanding both formal and informal rules is illustrated by the way occupants manage their temperature set points in one of the Fort Carson buildings studied. For example, the existing temperature set-point policies at Fort Carson specify keeping thermostats at 70F or below during heating season. However, practical thermostat and temperature calibration issues in one of the subject buildings meant that a thermostat setting of 75F may have created a room temperature of only 68F.
Roles – Key individuals and groups who could make the most difference in achieving energy conservation goals were identified and engaged in the intervention design process. For this demonstration project, those roles included
– occupants
– building energy monitors (BEMs)
– Fort Carson senior leadership
– computer network personnel.
BEMs are members of the building community that have been assigned responsibility for monitoring building operations for energy saving opportunities and reporting problems. The BEM program has been deployed Army-wide, although not all buildings have been assigned BEMs.
Tools – The research team reviewed existing technologies, systems, and processes and developed new tools that could be used to support the energy use reduction goals and help people do their jobs more easily and consistently. For example, an existing Army-wide BEM program was leveraged to support occupant behavior change, but new tools including a floor-check form were developed to monitor key opportunities for improvement.
Several data collection methods were used to establish the context for the developing the behavior change intervention approach at Fort Carson:
Group and individual interviews with a sample of civilian and military occupants from the five demonstration project buildings. Group interviews provided a basis for the design of a baseline survey. (Interview questions can be found in Appendix A.) Twenty-three individuals participated in the group interviews. Individual interviews were used to help clarify questions about operating conditions in the buildings (e.g., how well thermostat settings worked).

11
A baseline survey of occupants on satisfaction, attitudes, and behaviors in the five buildings. (Survey questions are in Appendix B.) Fifty-four individuals completed the baseline survey, the vast majority of whom came from the two predominantly civilian buildings.
Observation of occupant behavior and systems in place during site visits. All five buildings were visited at least once by the research team, which observed ancillary plug loads, thermostat settings, the types of lighting and shading available, and other factors. Observations were validated through follow-up interviews with Department of Public Works (DPW) and other personnel.
Partial sub-metering of energy end uses in one of the pilot buildings helped identify energy uses with the greatest potential for improvement in two similar administration buildings.1
Data collected through these methods was used to establish occupant behavior patterns related to energy use and which behaviors might be good candidates for change based on the need and opportunity for energy savings impact. Table 2 below illustrates how this methodology was used to identify target behaviors for the intervention.
Table 2. Behavior Patterns that Affect Building Energy Performance, Basis for Change, and Priority
Behavior Patterns How the Opportunity for Change was Identified
Relative Priority for Intervention
Plug Loads: Leave computers and monitors on at night and on weekends
Focus-group feedback that computers were left on Current policy requiring computers be left on at night Interviews suggested most people follow this policy Sub-metering data in building 1219 indicated higher than
expected nighttime plug loads Two computers/monitors in 1219 were measured; neither went
into sleep mode and each drew over 50 W in standby mode
High
HVAC(a): Occupants do not regularly turn back heating units at night in heating season (1219 and 1118 only)
Interviews and survey suggested units not adjusted regularly Energy use of wall-mounted heating units in different modes
was measured; modeled savings assuming all units set back 10F suggested potential ~3% reduction in energy use in 1219
High
HVAC: Use of thermostats, office heating units and other measures to control comfort vs. less energy-intensive methods
Survey suggests occupants in both 1219 and 1118 were inclined to use non-energy-intensive means of thermal comfort control (use shades, drink something cool/hot)
Measured energy use of wall-mounted heating/cooling units in 1219 suggested meaningful savings potential from setbacks
High
Lighting: Use of overhead lights when natural or task lighting may be sufficient
Survey indicated occupants actively manage overhead lighting in two of the buildings, but interviews and observations suggested task lights not widely used
Metered comparison of task lighting (21 W) to LED ceiling lights (40 W) in 1219 suggested savings potential; 1118 has fluorescent ceiling lights so even greater savings potential
Medium
Lighting: Lights left on when rooms unoccupied
Survey suggests many already turn lights off Observation during site visit (most were off)
Low
1 These data were not available prior to the intervention for any of the three military buildings. The lack of both sub-metering and baseline survey data limited the research team’s ability to establish with any certainty what end-use reduction opportunities would have the greatest impact in the buildings occupied primarily by military personnel.

12
Table 2. (contd)
Behavior Patterns How the Opportunity for Change was Identified
Relative Priority for Intervention
Plug Loads: Use of desktop computers when laptops may meet business needs
Survey results suggest 70/30 desktop/laptop ratio Observed during site visit
Low
Plug Loads: Use of energy-intensive appliances in office spaces
Interviews and survey results suggest policy against use of personal appliances effectively limits this
Only one building was observed to have much opportunity to remove appliances (9420)
Low
Plug Loads: Use of personal printers
Observation during site visit suggested limited opportunities in the military and civilian buildings
Interviews indicated most printers have been centralized but some opportunity for consolidation remains in 1118
Low
(a) HVAC = heating, ventilation, and air conditioning
Based on the survey and focus group results, interviews, site visit observations, and energy use measurements, the intervention was designed to focus on two key behaviors:
shutting down computers at night, and
setting back individual heating units at night (heating season only) in the two buildings with decentralized controls.
Other behaviors were reinforced as part of the intervention, including turning off lights in unoccupied rooms and using task and natural lighting instead of overhead lighting when possible.
3.3 Develop Action Plan
After assessing the rules, roles, and tools, the research team developed an action plan to define the target actions that different audiences are expected to take and the strategies that will be implemented to achieve the program goals.
At Fort Carson, specific performance objectives were defined for each of the key roles in the intervention; these are summarized in Table 3.

13
Table 3. Performance Objectives for Groups Targeted through the Intervention
Occupants
Shut down computers at night
Set back wall-mounted heating units 5–10F when leaving for the day or for extended periods during heating season (buildings 1219 and 1118 only)
Turn off overhead lights when leaving an office or conference room
Use task and natural lighting instead of overhead lights when adequate
Use non-energy-intensive methods of managing thermal comfort including: adjust window shades drink something hot/cold dress for the weather and wear layers (civilian occupants)
Use shared appliances in building, such as refrigerators and coffee makers. Limit use of nonessential appliances and space heaters (only applied to 9420 building)
Share energy saving ideas with BEMs and colleagues
Building Energy Monitors
Participate in BEM training
Conduct weekly floor checks with BEM checklist and share results with research team
Communicate with occupants (in person and via email) about energy saving behavior performance and opportunities for improvement
Submit work orders for operational problems that could be affecting energy use
Leadership
Participate in start-up and mid-project status briefings
Make sure qualified BEMs are assigned to the five pilot buildings and resourced for the pilot
Demonstrate support for the intervention by sending a letter to occupants of the demonstration buildings
Make sure managers of BEMs encourage follow-through on job duties
Computer Network Personnel
Authorize policy exemption in the five demonstration buildings to allow nighttime computer shutdown
Measure compliance with computer shutdown via evening network sweeps
In the two primarily civilian administration buildings (1219 and 1118), occupants of individual offices and shared workspaces had direct control of wall-mounted heating and cooling units. Occupants were asked to turn back the setting approximately 10F before leaving their offices for the day. This measure was expected to have the greatest potential impact on energy use in these two buildings based on modeled estimates. 1
Strategies to promote these energy saving behaviors were mapped to the eight principles of behavioral and institutional change discussed in Section 2.2 to make sure that most of the principles were being invoked through the intervention. The mapping is illustrated in Table 4.
1 The HVAC controls in the three military buildings were centralized; therefore this measure did not apply to occupants of those buildings

14
Table 4. Behavioral and Institutional Change Principles and Examples of Planned Intervention Strategies
Behavioral and Institutional Change
Principles Fort Carson Intervention Strategies
Social Network & Communications
Appoint locally recognized and respected member of the building community (the BEM) to advocate and monitor for energy conservation opportunities
Equip BEMs to send regular communications and engage occupants on specific actions they can take in their buildings
Provide information showing the actions undertaken by peers in neighboring buildings
Multiple Motivations Appeal to organizationally relevant topics in communications (security, cost-saving, and environmental interests)
Promote competition among buildings by comparing adoption rates for different occupant energy saving behaviors and actual building energy performance if data are available
Leadership Secure leadership commitment by briefing Garrison Commander and 4th Infantry Division Commander before the project start and again mid-intervention
Leadership sends letter to occupants conveying importance of their role in energy conservation and leadership commitment to conservation
Leadership asks BEM managers to provide for accountability and follow-through on BEM duties(a)
Commitment Did not employ
Information and Feedback
BEM shares results of floor checks and computer shutdown performance with occupants
Energy coordinator shares monthly building energy use with BEMs(a)
Infrastructure Work with chief of the computer network services department to authorize policy exemption in five demonstration buildings allowing nighttime computer shutdown
Establish recommended responsibilities and qualifications of BEMs (see Appendix C)
Develop simple form to facilitate BEM floor checks Provide training to BEMs on monitoring and promoting better energy
management in their buildings
Social Empowerment BEMs ask occupants for energy conservation ideas
Continuous Change Bring together BEMs to discuss lessons learned and modify tools or approach as necessary
(a) While these activities were part of the intervention design, they were not fully implemented due to different challenges encountered. For example, energy meter failures on some buildings limited distribution of building energy use reports.
Once strategies were defined, a detailed action plan was created that laid out key activities, responsible parties, and a timeline for rolling out the intervention.
3.4 Implement Plan
Once the strategies for promoting change and action plans have been defined, implementation should occur in a way that suits the organizational context and the people and roles being targeted to change.
The intervention was limited to a 12-week period from March 4 through May 24 of 2013. Throughout the intervention period, the research team tracked BEM engagement, monitored occupant compliance via

15
BEM floor check documentation (form is shown in Appendix D) and computer network scans, and drafted messages to be shared with occupants. An intervention period of six months would have enabled a more rigorous test of strategies and their impacts, including more institutional level changes that have the potential for greater impact than behavioral changes. However, the intervention launch was delayed several months primarily due to fluctuating occupancy in the military buildings,1 delays in scheduling meetings with senior leadership support for the intervention, and challenges associated with data collection to establish baseline performance.
3.5 Measure and Evaluate
The final step in the institutional change process—measurement and evaluation—is critical to establishing whether the actions implemented led to the desired energy savings.
A detailed evaluation plan was developed prior to the launch of the intervention at Fort Carson (Appendix E). The plan identified the specific behavioral change measures to be evaluated, who would collect the data, the timing and frequency of data collection, how the data would be recorded and shared with the research team, and the analytic methods that would be used to evaluate the effectiveness of the measure relative to the baseline performance.
The primary evaluation methods included the following:
Evaluation of data by computer network personnel, who would scan all computer assets that could be shut down without security risk two times each day (at noon and again after work hours) and compare the ratio of computers that signaled they were on
Self-reported changes in behavior, captured via the post-intervention survey
Post-intervention interviews with three of the five BEMs to understand what actions were implemented at the building level (two did not respond to the interview request)
Reviewing weekly floor check forms completed by the BEM to gauge general compliance levels during the intervention (e.g., lights were observed to be off in 80% of unoccupied rooms)
Analysis of whole-building and sub-metering data, as available.
While the research team initially planned to make direct comparisons of occupant responses to both the baseline survey and post-intervention survey, the low response rate to the baseline survey in three of the five buildings precluded this type of analysis. As a result, the post-intervention survey asked occupants to self-report whether they had changed specific behaviors during the previous three months and which factors most influenced any change in behavior.
1 4/4 BCT units were rotating between deployment and the reset/training phases of the Army Force Generation (ARFORGEN) cycle.

17
4.0 Findings
This section summarizes findings in support of each key research question:
How do occupants of green buildings interact with building features?
How do occupants of green buildings perceive their work environment?
What behaviors have the greatest potential to save energy?
What approaches are most effective at promoting energy saving behaviors in buildings?
The first two questions are addressed in Section 4.1 with findings from the baseline survey and supported by interviews, focus groups, and direct observation. The second two questions are addressed through the post-intervention survey and supporting methods.
Results from both surveys must be carefully interpreted in the context of which groups responded or did not respond. There were just 54 respondents to the baseline survey and 102 respondents to the post-intervention survey out of roughly 690 total occupants at the end of the intervention period.1 A large majority of respondents to both surveys were civilians (roughly 80%) from buildings 1118 and 1219. Because these two buildings had higher response rates to the post-intervention survey (24% and 35% respectively), they were the focus of the building-level analysis below.
As noted previously, many soldiers, who would eventually become occupants of the three military buildings throughout the intervention period, were just returning from deployment and on vacation at the time of the baseline survey. The fact that they may not have been engaged in the intervention from the beginning may have contributed to low numbers of post-intervention responses from military personnel.
More detail on the characteristics of respondents to the survey can be found in Appendix F.
4.1 Occupant Interaction and Satisfaction with Building Features
The baseline survey provided insights into the institutional context of how occupants used different green building features, their level of satisfaction with these features, and general awareness around energy use in buildings.
Building features that respondents to the baseline survey reported adjusting most often were window shades/blinds and overhead lights, followed by different mechanical heating and cooling controls (i.e., room air conditioning [AC] units, thermostats, and permanent heating/cooling units)2 (Figure 3). The fact that adjusting heating and cooling units to affect comfort was only a “regular” behavior for 9–10% of
1 Because the three military buildings were still being filled with new military occupants at the time of the baseline survey, the total number of potential survey respondents at that time could not be established. The post-intervention occupancy levels are believed to be approximately 690, so 102 respondents represents a response rate of 15% across all buildings. When the buildings were selected to be part of the demonstration project, the buildings were expected to be fully occupied at the time the baseline survey was implemented. 2 In buildings 1219 and 1118, “room AC unit” and “permanent heating/cooling unit” were likely interpreted to be the same thing as the wall-mounted units provided heating and cooling in offices. Temperature could be adjusted on both the heating/cooling fan unit and a thermostat on the wall.

18
occupants suggested an opportunity to save energy through a nighttime temperature setback intervention measure. Most workspaces were observed to have task lighting, while less than half of the respondents used desk or task lighting. Based on comments from interviewees, the design of the task lighting made it impractical to use.1
Figure 3. Frequency with Which Different Building Features are Adjusted by Occupants (baseline survey)
Only 52% of respondents to the baseline survey considered themselves informed on the energy saving
features in their building (Figure 4), which suggested opportunity for improvement, perhaps by making information on how building features can help save energy more locally relevant.
Figure 4. How Well Informed Occupants Feel About Energy Saving Features of their Building (baseline survey)
1 Task lighting in 1219 and 1118 was fluorescent lighting integrated into the back of the desk unit. To increase use of task lighting, the acquisition of adjustable LED desk lamps was considered but was not feasible as part of this intervention.
4%10%
24%17%
25%19% 14%
29%19%
26%
18% 31%25% 32% 42%
51%
50% 22%
48% 40% 42% 38% 28%
16%28%
42%
10% 12% 9% 11% 16%4%
0%
20%
40%
60%
80%
100%
Window blindsor shades
Light switch(overhead)
Room AC unit Thermostat Permanentheating/cooling
unit
Operablewindow
Desk/task light Portable fan
Can't adjust Never Occasionally Regularly
8%
17%23%
37%
15%
1=Not wellinformed
2 3 4 5=Very wellinformed

19
Baseline survey responses indicated that occupants are generally satisfied with most personal workspace and building features. More than 80% of the respondents were either satisfied with or indifferent to every feature but one: views of the outdoors, for which dissatisfaction was slightly higher (see Figure 5). Eighty-three percent (83%) of occupants were satisfied with the building overall. Even thermal comfort, which is often one of the greatest sources of occupant complaints, had satisfaction rates of 68%, which is much higher than typically found with building occupant surveys, and likely due to respondents having direct control over heating and cooling units. For comparison, a study which examined responses from 34,169 occupants in 215 buildings found that more occupants were dissatisfied (42%) with thermal comfort than satisfied (39%) (Huizenga 2006).
Figure 5. Occupant Satisfaction with Different Personal Workspace or Building Features (baseline survey)
Figure 6 below shows how satisfied occupants are with different building features in terms of how well they function to create a comfortable work environment.1 Overall, occupants had the lowest levels of dissatisfaction plus highest levels of satisfaction with some of the features that let them control natural light in their workspaces (i.e., window blinds and roller shades). Waterless urinals were the exception to the generally high satisfaction ratings with 29% expressing dissatisfaction. During group interviews, complaints focused on odors emanating from the urinals.
1 Respondents who did not have experience with each feature (about one-third of all) were excluded from this analysis.
4% 8%0% 2% 6% 2%
11%12%
13% 8% 6%4%
17% 10% 15%14% 12%
12%
47% 52% 54% 59%52% 58%
21% 19% 17% 18%25% 25%
0%
20%
40%
60%
80%
100%
Temperature Views of theoutdoors
Generalmaintenance
Air quality Visual comfort Overall withBuilding
Very Dissatisfied Dissatisfied Neutral Satisfied Very Satisfied

20
Figure 6. Satisfaction with How Well Different Building Features Function to Create a Comfortable Work Environment (baseline survey)
4.2 Changes in Behaviors and Attitudes
4.2.1 Behavior Changes
The measure of success of the intervention is whether the groups targeted for behavior change did in fact modify their behavior as a result of the intervention strategies, and whether any actions taken resulted in energy savings. As described below, the research team did find evidence that several of the intervention measures were effective.
In the post-intervention survey, occupants were asked how frequently they took each of the actions that were promoted as part of the intervention. Occupants were most likely to turn off their monitor and computer at night, followed by turning off lights when leaving a room. The action that occupants were least likely to take was “turning off overhead lights and using natural light or task lighting when adequate.” During interviews, some occupants of buildings 1219 and 1118 commented that task lighting was difficult to use because it was attached to the back of the desk furniture and could not be moved to areas where tasks were performed. This may have contributed to comparatively fewer people taking this action. A comparatively high percentage of respondents (23%) also reported never or rarely setting back thermostats at night, which was one of the primary intervention measures (Figure 7).
13%3% 6% 4% 7% 5% 6% 8% 8% 13%
0%
3%6%
4%10% 12% 10% 8% 11%
16%13%20%
17% 22%14% 14% 17% 18%
22%
18%
63% 57% 54% 48%52%
60%48% 44%
53% 39%
13% 17% 17% 22% 17%10%
19% 23%
6%13%
0%
20%
40%
60%
80%
100%
Exteriorshades
Windowblinds
Air vents Rollershades
Low flowfaucets
Operablewindows
Occupancysensors:lighting
Vacancysensors:lighting
Lowflow/dualflushtoilets
Waterlessurinals
Very Dissatisfied Dissatisfied Neutral Satisfied Very Satisfied

21
Figure 7. Frequency with Which Occupants Reported Taking Different Energy Saving Actions at Work (post-intervention survey)
To help gauge specific energy saving actions that were taken as a result of the intervention, occupants were also asked whether the frequency with which they took those actions had changed over the three-month demonstration period. As illustrated in Figure 8, there were reported increases in the frequency with which occupants took each of the actions being promoted to directly reduce building energy use. The greatest degree of change reported was for nighttime computer shutdown. Seventy-two percent (72%) of respondents reported shutting down their computers more at the end of the intervention period than at the start. This may be due to the relative ease of switching off a computer and because turning off computers typically only impacts the user whereas other energy reduction actions, such as setting back heating units, may affect others.
42%
42%
45%
46%
51%
68%
74%
88%
21%
20%
11%
28%
19%
20%
15%
5%
23%
15%
17%
19%
14%
3%
5%
4%
0% 20% 40% 60% 80% 100%
Drink something hot or cold manage my comfort
Set‐back thermostat in my work area when leavingfor day*
Turn off overhead lights and use a natural or tasklight when adequate
Dress in layers to manage my comfort
Use blinds to control the temperature in my office
Turn off lights when leaving a room
Turn off my computer at night
Turn off my monitor at night
Always Usually Sometimes Rarely Never
*Applies to 1118 and 1219 occupants only

22
Figure 8. Change in Frequency with Which Occupants Took Different Actions during the Intervention (post-intervention survey)
It is also noteworthy that while 42% reported always setting back thermostats, 27% of respondents indicated they took that action more frequently at the end of the intervention period than they did at the beginning. There was some difference in reported changes in this behavior by building: 32% of 1118 respondents reported adjusting the thermostat more compared to 23% of 1219 occupants (see Figure 9).
Figure 9. Frequency with Which Thermostats are Set Back in Work Area When Leaving for the Day at the End of the Intervention Compared to the Beginning (post-intervention survey)
Building 1118 respondents were just as likely as those in 1219 to turn off lights when leaving a room at the end of the intervention period. However building 1118 appears to have made the greatest change as
14%
14%
20%
24%
27%
29%
52%
72%
81%
81%
77%
74%
72%
70%
47%
27%
0% 20% 40% 60% 80% 100%
Dress in layers to manage my comfort
Drink something hot or cold manage my comfort
Use blinds to control the temperature in my office
Turn off overhead lights and use natural or task lightwhen adequate
Set‐back thermostat in my work area when leavingfor day*
Turn off lights when leaving a room
Turn off my monitor at night
Turn off my computer at night
I do it more frequently now About the same I do it less frequently now
32%
23%
0% 10% 20% 30% 40% 50% 60% 70% 80% 90% 100%
Bldg 1118
Bldg 1219
I do it more frequently now About the same I do it less frequently now
*Applies to 1118 and 1219 occupants only

23
a result of the intervention, with 33% reporting they turn off lights more frequently now than they did before, compared to 19% for the occupants of building 1219.1
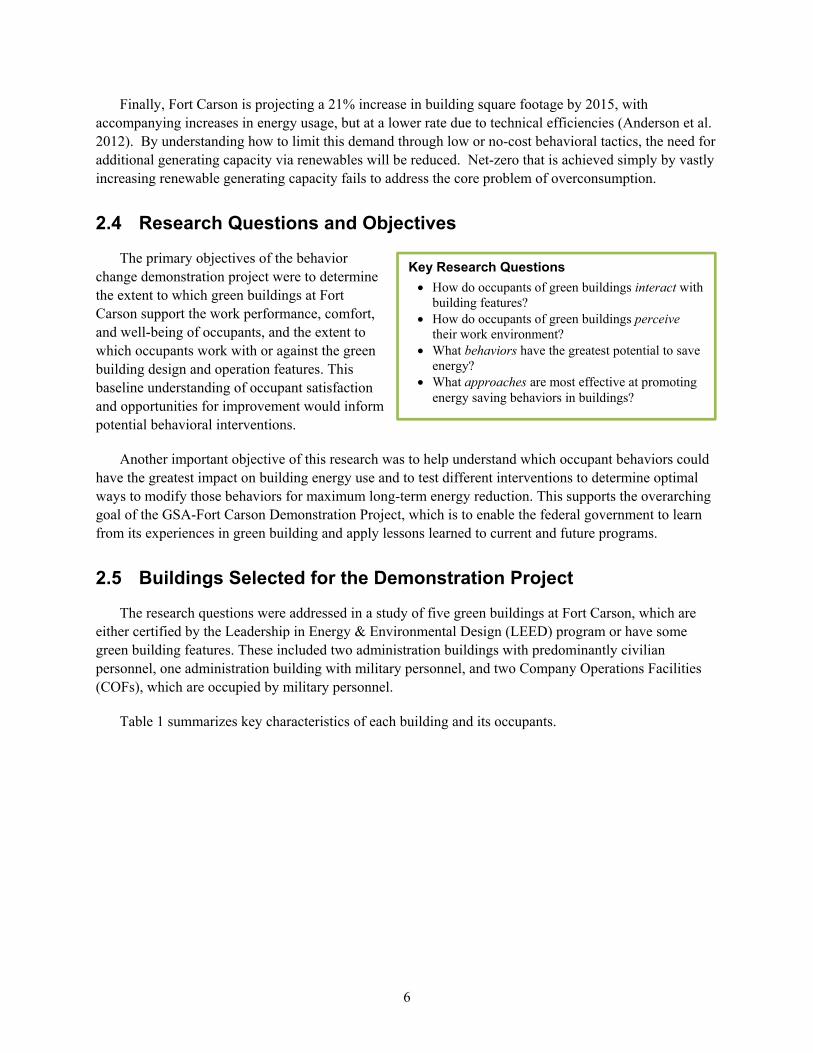
Weekly computer network scans provided a more comprehensive and accurate source of data on compliance with the nighttime computer shutdown measure by building. Because all network resources that were able to be shut down at night were scanned, this is a more reliable estimate of compliance than self-reported compliance via the post-intervention survey. Four of the five buildings started with computer shutdown compliance rates of 8% or lower, which reinforced that this was not a typical behavior for most occupants. The exception was building 1219, in which occupants were shutting down 51% of computer assets in Week 1 (see Figure 10). All five buildings improved from their starting point, although the timing of changes in behavior and degree of change observed by building varied. Buildings 1118 and 9447 showed improvement as early as Week 2. Two of the three military buildings notably did not show much change in behavior until midway through the intervention. Possible reasons for these differences are discussed below.
Figure 10. Percent of Computers Shut Down at Night by Building Based on Computer Network Scans (numbers represent first week, final week and highest compliance rates)
Figure 11 shows the difference in computer shutdown compliance rates between the first and last weeks of the intervention, which gives some indication of each building’s ability to sustain the change; the difference between the first week and the peak week of compliance conveys the maximum change in behavior observed in each building. The level of improvement between Week 1 and Week 12 ranged from 3% in building 1219 to 49% in building 1118. The maximum change between Week 1 and the week of peak compliance in each building observed ranged from 13% in building 1219 to 51% in building 1118. While the military buildings had lower total compliance levels than buildings 1219 and 1118, this figure shows that military buildings still showed a significant degree of change in a short period of time.
1 There were too few respondents to the post-intervention survey from the military buildings to include in any building-to-building comparisons; therefore only survey responses from buildings 1219 and 1118 are compared.
5%‐1%
7% 8%
51%
59%
43%37%
24%
64%
18% 19%
28%
57%54%
9420 9447 9427 1118 1219
Week 1 Week 2 Week 3 Week 4 Week 5 Week 6
Week 7 Week 8 Week 9 Week 10 Week 11 Week 12

24
Figure 11. Change in Computer Shutdown Behavior by Building Based on Network Scans
4.2.2 Awareness and Attitude Changes
A comparison of baseline and post-intervention survey results showed high levels of awareness (near 90%) and favorable attitudes of Fort Carson’s Net Zero Energy goals across both surveys, with little change (Figure 12). Eighty percent (80%) of the baseline survey respondents believed they have the right skills to save energy. This percentage increased after the intervention. However, almost one-third (31%) of respondents were ambivalent or even disagreed that they felt responsible for reducing energy in their own building before the intervention. This suggested that there was some disconnect between having the ability to affect energy use and feeling responsible to do something about it in their building. The proportion of those ambivalent or in disagreement dropped slightly to 23% in the post-intervention survey.
Overall, the change in occupant responses reflected a positive reaction to the interventions. There were noticeable changes in three attitudes between the baseline and post-intervention surveys:
The percentage of respondents who felt they had time to work on Fort Carson Net Zero Energy efforts increased from 84% to 89%.
The percentage of respondents who felt personally responsible for reducing energy use increased from 70% to 76%.
The percentage of respondents who believed reducing energy use in their building was important increased from 49% to 58%.
13%20% 21%
49%
3%
32%25%
36%
51%
13%
9420 9447 9427 1118 1219
Change from Week 1 to Week 12 Change Week 1 to Week of peak compliance

25
Figure 12. Change in Awareness and Attitudes about Energy Conservation in all Fort Carson Buildings (upper bar is baseline and lower bar is post-intervention)
The changes in awareness and attitudes varied by building due in part to differences in the way the
intervention measures were implemented by building, as discussed in Section 4.3. In building 1118 (see Figure 13), there were marked differences in the proportion of respondents before and after the intervention who either agree or strongly agree that
they have the skills to use energy saving technology at work, which increased from 65% to 90%
they feel personally responsible for reducing energy in their building, which increased from 64% to 89%
reducing energy use in their building is important, which increased from 76% to 92%
they have time to work on Fort Carson Net Zero Energy efforts, which increased from 41% to 67%.
Giving occupants the skills or ability to save energy in their local work environment was a key objective of many of the intervention strategies implemented. It appears that the intervention successfully drove at least some of that change. The change in proportion of occupants reporting they had time to work on net-zero energy efforts might suggest that energy saving behaviors may be perceived as too much work until people learn there are easy behaviors involved.
47%
45%
40%
42%
42%
45%
41%
45%
33%
33%
30%
21%
43%
43%
48%
46%
38%
45%
43%
44%
37%
43%
19%
37%
4%
8%
4%
8%
15%
7%
10%
7%
29%
17%
30%
22%
6%
1%
6%
1%
6%
2%
4%
1%
3%
17%
10%
2%
2%
1%
1%
2%
3%
2%
3%
4%
9%
0% 20% 40% 60% 80% 100%
Pre
Post
Pre
Post
Pre
Post
Pre
Post
Pre
Post
Pre
Post
Strongly Agree Agree Neither agree nor disagree Disagree Strongly Disagree
Aware of Ft. Carson Net Zero Energy goals
Have skills to use energy saving technologies correctly at work
Have time to work on Ft. Carson Net Zero Energy efforts
Feel personally responsible for reducing energy in my building
Believe reducing energy use in my building is important
Have positive attitude about Ft. Carson Net Zero Energy goals

26
Figure 13. Changes in Awareness and Attitudes around Energy Conservation in Building 1118
One notable difference between building1219 and 1118 in energy conservation awareness and attitudes over the intervention period is the perception of time available to work on Fort Carson Net Zero Energy efforts (see Figure 14). In fact there was a decrease (6%) in 1219 occupants who strongly agree that they have time to work on Net Zero Energy and a notable increase (6%) in those who strongly disagree that they have time. Follow-up discussions with personnel suggest this could be the result of 1219 occupants—most of whom work in the Department of Public Works—feeling they already do all they can as part of their daily job functions, and the fact that furloughs, rolled out during the intervention, squeezed their time even more.
35%
39%
29%
45%
24%
41%
29%
26%
29%
38%
29%
46%
47%
45%
53%
47%
41%
49%
12%
41%
35%
51%
47%
46%
6%
16%
12%
5%
24%
5%
35%
21%
35%
8%
18%
5%
12%
6%
3%
12%
5%
24%
8%
3%
6%
5%
3%
Pre
Post
Pre
Post
Pre
Post
Pre
Post
Pre
Post
Pre
Post
Building 1118Strongly Agree Agree Neither agree nor disagree Disagree Strongly Disagree
Aware of Ft. Carson Net Zero Energy goals
Have skills to use energy saving technologies correctly at work
Have time to work on Ft. Carson Net Zero Energy
effortsFeel personally responsible for reducing energy in my
building
Believe reducing energy use in my building is
important
Have positive attitude about Ft. Carson Net Zero
Energy goals

27
Figure 14. Changes in Awareness and Attitudes around Energy Conservation in Building 1219
Inadequate responses to either the pre- or post-intervention survey of building 9420 occupants (just 13 out of 250 occupants) prevented comparison of their energy conservation awareness and attitudes. However, what we know about building occupancy patterns of military personnel may provide insights to their likely level of awareness and attitudes about Net Zero Energy. Military personnel change assignments and physical locations regularly, unlike civilians who may work in the same location for many years. As a result, soldiers may not have the same level of personal connection - and therefore no perceived personal responsibility - to the locations in which they are temporarily assigned. This would likely make changing soldier attitudes more difficult and require different tactics from civilian occupants. As discussed in the following sections, the tactics for encouraging energy conservation behaviors in a military setting must take into account the transient nature of military occupants.
4.3 Highest Impact Strategies for Behavior Change
Responses to the post-intervention survey suggested that several factors had an influence on occupant behavior (see Figure 15).
62%
58%
46%
47%
54%
53%
33%
21%
38%
34%
50%
49%
35%
40%
42%
47%
38%
38%
17%
30%
35%
41%
35%
40%
4%
2%
7%
8%
9%
25%
21%
23%
18%
8%
7%
8%
17%
14%
2%
4%
2%
Pre
Post
Pre
Post
Pre
Post
Pre
Post
Pre
Post
Pre
Post
Building 1219
Strongly Agree Agree Neither agree nor disagree Disagree Strongly Disagree
Aware of Ft. Carson Net Zero Energy goals
Have skills to use energy saving technologies correctly at work
Have time to work Ft. Carson Net Zero Energy efforts
Feel personally responsible for reducing energy in my
building
Believe reducing energy use in my building is
important
Have positive attitude about Ft. Carson Net Zero
Energy goals
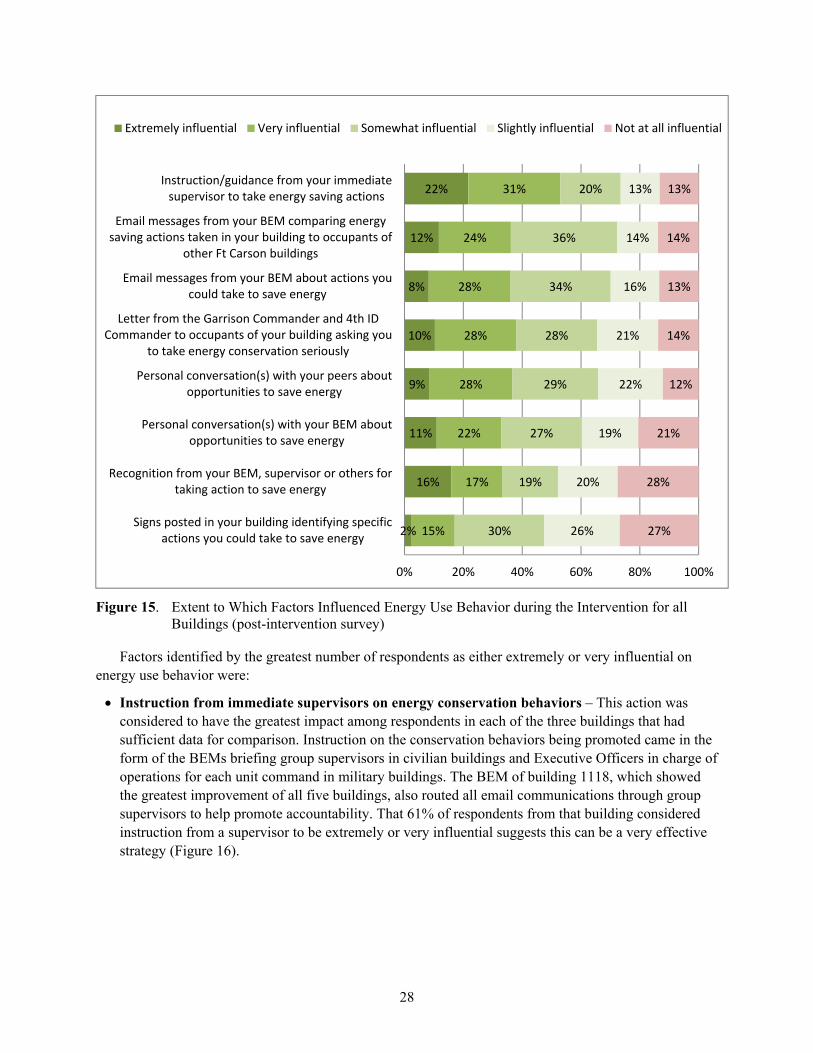
28
Figure 15. Extent to Which Factors Influenced Energy Use Behavior during the Intervention for all Buildings (post-intervention survey)
Factors identified by the greatest number of respondents as either extremely or very influential on energy use behavior were:
Instruction from immediate supervisors on energy conservation behaviors – This action was considered to have the greatest impact among respondents in each of the three buildings that had sufficient data for comparison. Instruction on the conservation behaviors being promoted came in the form of the BEMs briefing group supervisors in civilian buildings and Executive Officers in charge of operations for each unit command in military buildings. The BEM of building 1118, which showed the greatest improvement of all five buildings, also routed all email communications through group supervisors to help promote accountability. That 61% of respondents from that building considered instruction from a supervisor to be extremely or very influential suggests this can be a very effective strategy (Figure 16).
2%
16%
11%
9%
10%
8%
12%
22%
15%
17%
22%
28%
28%
28%
24%
31%
30%
19%
27%
29%
28%
34%
36%
20%
26%
20%
19%
22%
21%
16%
14%
13%
27%
28%
21%
12%
14%
13%
14%
13%
0% 20% 40% 60% 80% 100%
Signs posted in your building identifying specificactions you could take to save energy
Recognition from your BEM, supervisor or others fortaking action to save energy
Personal conversation(s) with your BEM aboutopportunities to save energy
Personal conversation(s) with your peers aboutopportunities to save energy
Letter from the Garrison Commander and 4th IDCommander to occupants of your building asking you
to take energy conservation seriously
Email messages from your BEM about actions youcould take to save energy
Email messages from your BEM comparing energysaving actions taken in your building to occupants of
other Ft Carson buildings
Instruction/guidance from your immediatesupervisor to take energy saving actions
Extremely influential Very influential Somewhat influential Slightly influential Not at all influential

29
Figure 16. Influence of “Instruction or Guidance from Immediate Supervisor to Take Energy Saving Actions” in Civilian Administration Buildings (post-intervention survey)
Email messages from BEMs to occupants – The four email messages sent from BEMs to occupants over the course of the intervention were considered extremely or very influential by 36% of respondents; another 50% found them somewhat or slightly influential, and just 14% indicated they had no impact on their behavior. The first email message provided only information on specific actions that occupants could take to improve building energy performance. The second email provided information on actions as well as a description of the results of floor checks (e.g., 70% of offices checked appeared to have lights off when unoccupied). The last two email messages also included a graph comparing nighttime computer shutdown compliance by building. (Email messages can be found in Appendix G). There was little difference of opinion on the effectiveness of messages that aimed to foster competition across buildings compared to those that just provided information on actions to taken. This may be because there was limited feedback provided during the short intervention period—just two email messages—or the feedback provided was limited to behaviors and not energy use impacts of those behaviors, due to limitations with metering.
Letter from senior leadership – A letter from Fort Carson leadership (see Appendix I) to occupants of the demonstration buildings was distributed by at least three BEMs during the first week of the intervention. It could not be confirmed whether the letter was distributed in the two military buildings. Thirty-eight percent of all respondents found this extremely or very influential.
Conversations with peers – This is not a factor the research team directly managed as part of the intervention. However the periodic email communications, posters, surveys, and the presence of an energy monitor in the building may have helped foster a dialogue that may not have occurred before the intervention. That this was extremely or very influential for 37% of all respondents—and more important than direct conversations with BEMs—reinforces the importance of the social networking principle to successful interventions. If communications can help to foster dialogue among occupants about energy conservation, this may be helpful. Differences between the two civilian buildings suggest that conversations with peers had greater influence in 1118 (see Figure 17). The BEM of that building did report talking with supervisors about opportunities for improvement when they were identified (e.g., when lights were consistently being left on during the lunch hour when no one was present), which may have been more likely to foster a dialogue than email alone.
18%
14%
42%
22%
15%
22%
9%
22%
15%
14%
Bldg 1118
Bldg 1219
Extremely influential Very influential Somewhat influential Slightly influential Not at all influential

30
Figure 17. Influence of Personal Conversations with Peers about Opportunities to Save Energy
As illustrated in Figure 15, the least influential intervention factors were signs posted in buildings1 and recognition from others.2
Comparing actions taken by BEMs in each building to observed weekly changes in computer shutdown compliance was used to help evaluate the effect of specific actions on behavior. Table 5 illustrates that three of the BEMs were fairly engaged while two did not appear to follow through on many of the BEM duties.
Based on this comparison, the BEM email messages to occupants and/or the letter from leadership appear to have had some immediate impact on computer shutdown behavior. Compliance rates in three buildings (1118, 1219, and 9447) showed increases in compliance in Week 2 and again in Week 3 after the BEMs of these three buildings sent the first two emails to occupants. Building 1118 peaked in Week 7 after the third email to occupants comparing nighttime shutdown compliance in all five buildings. The BEMs in two of the military buildings (9420 and 9427) did not participate in the intervention after the initial training and it appears they did not distribute the email messages to occupants. There was no change in compliance rates in those two buildings during the first three weeks, probably because they had not received information on the desired changes in behavior.
Performance data validated that getting an occupant’s supervisor engaged coincided with changes in behavior. The two military buildings with inactive BEMs did not begin showing much improvement until Week 7. This happened the week after the email comparing building computer shutdown compliance across buildings was sent out. During that week posters were finally placed throughout the military buildings and the energy conservation actions were discussed with Executive Officers during staff meetings. (The posters are shown in Appendix H). It appears that the data showing military buildings underperforming relative to the civilian buildings may have prompted BEMs or others to talk with Executive Officers and hang posters, which in turn led to an uptick in compliance. It also suggests that compliance and accountability become more relevant for military personnel once higher ranking personnel are also engaged. There was also some confusion about the policy requiring users to leave computers on at night among some of the military building occupants. Although the policy had been waived for the five pilot buildings and was supposed to have been communicated to building occupants,
1 This may be driven more by the fact that signs may not have been posted in all buildings. 2 Post-intervention interviews with BEMs indicate that little direct recognition of occupant conservation efforts was provided.
15%
3%
39%
19%
24%
31%
12%
36%
9%
11%
Bldg 1118
Bldg 1219
Extremely influential Very influential Somewhat influential Slightly influential Not at all influential

31
some had not received the message from someone they considered a trustworthy authority, and until that message was provided by supervisors or others in their chain of command, they continued in old behavior patterns.
Finally, the status briefing provided in Week 8 by the demonstration project research team to two senior leaders of military and garrison operations and the final BEM email to occupants that week also appeared to increase compliance rates. Three buildings showed peak compliance in the following two weeks. An action taken by the computer network personnel asking people to leave computers on over the weekend for updates may have had lingering effect, as compliance in the following week was lower. This may illustrate that three months does not provide sufficient time to allow people to form new energy use habits.
Table 5. Mapping of Actions Implemented by BEM for Each Building (shading indicates action was confirmed to have been implemented; if unknown, it was left blank)
Week Intervention Activity
Actions Implemented by Building? Computer Shutdown Impacts
Observed? 1219 1118 9420 9427 9447
Pre-interven-tion
Participation in BEM training
1 Letter from Leadership distributed
BEM sends Email #1 to occupants
Posters emailed to occupants
Floor checks completed
2 Floor checks completed Beginning of uptick: 9447, 1118, 1219
3 BEM sends Email #2 to occupants
Posters placed throughout building and emailed to occupants
4 Floor checks completed
5 BEM sends Email #3 to occupants
Floor checks completed
6 BEM status check with project team Peak week: 1118
Posters sent again to BEMs requesting they be hung, along with computer shutdown results by building
Floor checks completed
7 Posters placed throughout military buildings
Peak week: 9427
Other action: Republished Fragmentary Order directing computer shutdown
Beginning of higher compliance rates: 9420
Other action: Leadership talked with Executive Officers about intervention action
Floor checks completed

32
Table 5. (contd)
Week Intervention Activity
Actions Implemented by Building? Computer Shutdown Impacts
Observed? 1219 1118 9420 9427 9447
8 BEM sends Email #4 to occupants
Status briefing with Garrison and 4-4 leadership
Other action: Post-wide email sent notifying people that network personnel approve of computer shutdown
Floor checks completed
9 Floor checks completed Peak week: 9420, 9447
10 Floor checks completed Peak week: 1219
11 Floor checks completed
Other action: Computer network personnel emailed notice to leave computers on over weekend for upgrade
12 Post-intervention survey distributed to occupants
Shutdown rates lower in 4 of 5 buildings
Other Actions / week not specified
BEM talked with occupants about specific energy saving actions
BEM emailed notice to remove private appliances (e.g., coffee makers)
When occupants were asked an open-ended question regarding what other factors influenced how they managed energy, 57% of the comments related to personal interest and awareness (e.g., “I try my best to save energy not only at home but also at the office”) (see Figure 18). This seems to reinforce the idea that energy conservation at the office can depend a lot on the personal opinions and interests of individuals. Encouraging conservation behaviors at both work and home as part of such interventions may be important to help build this awareness. Others indicated that the support for the Army’s sustainable operation goals, for example to reduce costs and make Fort Carson a Net Zero installation, was also a driver.

33
Figure 18. Other Factors that Influence the Way Occupants Manage Energy (grouped responses to open-ended question)
4.4 Estimated Energy Savings Impact Intervention
4.4.1 Energy Savings Potential
During the intervention design, estimates of potential energy savings were made for each of the measures to compare their impact if implemented by all building occupants. Data were not available to establish estimates for each building, so decisions to select the two targeted intervention behaviors were informed by limited measurements of equipment energy use and simulated to estimate the building-level impact.
For the computer shutdown measure, energy use measurements were taken for two typical computer models found at Fort Carson: a laptop and a desktop, plus monitors. The computers were estimated to draw approximately 3 watts continuously if they went into sleep mode overnight and continued to draw over 50 watts if they stayed in standby mode and continued to run overnight.1 These values comport with manufacturer’s estimated energy use for these models of computers and monitors.
The estimates of potential savings if all occupants shut down their computers at night are presented in Table 6 below, using building 1118 energy use to illustrate the savings impact. The range of potential savings varies significantly based on whether computers go into sleep mode or not, but at a minimum are assumed to save 0.5% of electricity use and at most about 10% of electricity use in this particular building. It should be emphasized that the percent savings achieved depends on other electricity uses in the particular building being studied; therefore these estimates should not be assumed to be representative of potential savings levels in other buildings.
1 The computer energy management settings of all computers in the demonstration buildings could not be determined. While taking measurements at Fort Carson both computers stayed in standby mode overnight. The intervention measure was selected considering that at least some portion of computers were likely not going into sleep mode and for those that were in sleep mode, at least 3 watts could be saved, which could be meaningful over a large number of users. This measure was not intended to be a substitute for using sleep mode settings.
7% 7% 7%21%
57%
Feedback / Evidenceof impact
Policy guidance Directly relates to myjob
Desire to help Armymeet goals (NZE, cost
savings)
Personal interest /awareness
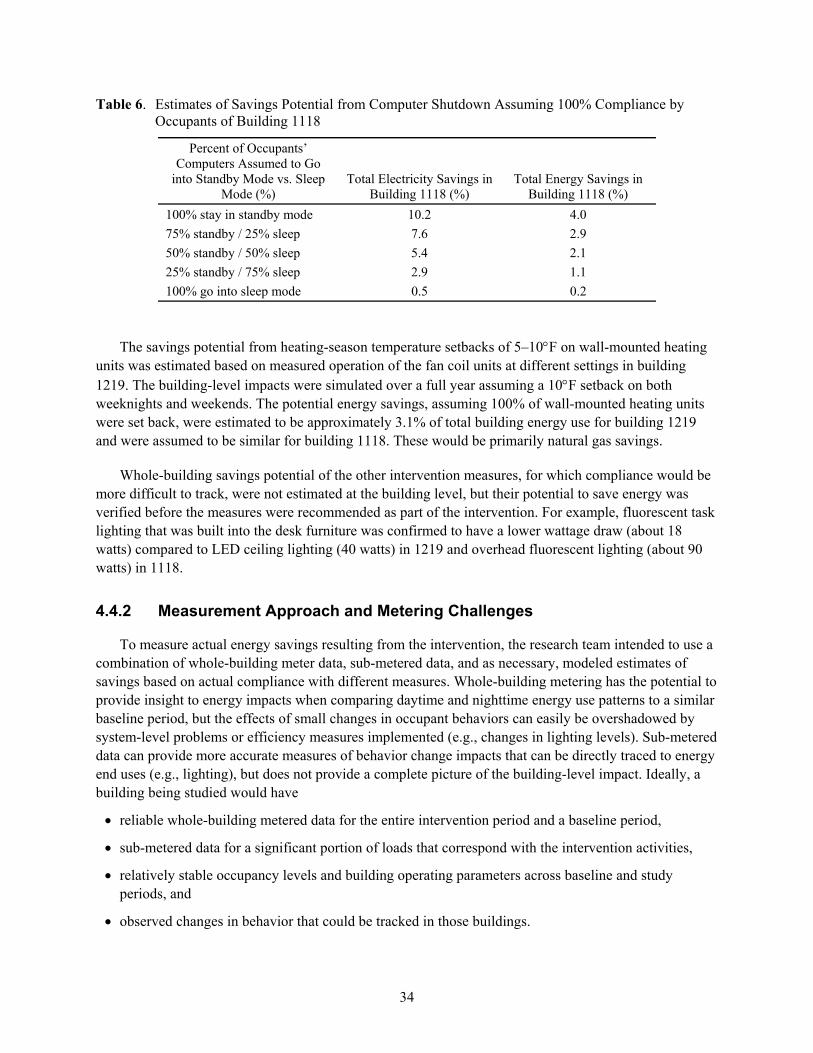
34
Table 6. Estimates of Savings Potential from Computer Shutdown Assuming 100% Compliance by Occupants of Building 1118
Percent of Occupants’ Computers Assumed to Go
into Standby Mode vs. Sleep Mode (%)
Total Electricity Savings in Building 1118 (%)
Total Energy Savings in Building 1118 (%)
100% stay in standby mode 10.2 4.0
75% standby / 25% sleep 7.6 2.9
50% standby / 50% sleep 5.4 2.1
25% standby / 75% sleep 2.9 1.1
100% go into sleep mode 0.5 0.2
The savings potential from heating-season temperature setbacks of 5–10F on wall-mounted heating units was estimated based on measured operation of the fan coil units at different settings in building 1219. The building-level impacts were simulated over a full year assuming a 10F setback on both weeknights and weekends. The potential energy savings, assuming 100% of wall-mounted heating units were set back, were estimated to be approximately 3.1% of total building energy use for building 1219 and were assumed to be similar for building 1118. These would be primarily natural gas savings.
Whole-building savings potential of the other intervention measures, for which compliance would be more difficult to track, were not estimated at the building level, but their potential to save energy was verified before the measures were recommended as part of the intervention. For example, fluorescent task lighting that was built into the desk furniture was confirmed to have a lower wattage draw (about 18 watts) compared to LED ceiling lighting (40 watts) in 1219 and overhead fluorescent lighting (about 90 watts) in 1118.
4.4.2 Measurement Approach and Metering Challenges
To measure actual energy savings resulting from the intervention, the research team intended to use a combination of whole-building meter data, sub-metered data, and as necessary, modeled estimates of savings based on actual compliance with different measures. Whole-building metering has the potential to provide insight to energy impacts when comparing daytime and nighttime energy use patterns to a similar baseline period, but the effects of small changes in occupant behaviors can easily be overshadowed by system-level problems or efficiency measures implemented (e.g., changes in lighting levels). Sub-metered data can provide more accurate measures of behavior change impacts that can be directly traced to energy end uses (e.g., lighting), but does not provide a complete picture of the building-level impact. Ideally, a building being studied would have
reliable whole-building metered data for the entire intervention period and a baseline period,
sub-metered data for a significant portion of loads that correspond with the intervention activities,
relatively stable occupancy levels and building operating parameters across baseline and study periods, and
observed changes in behavior that could be tracked in those buildings.

35
None of the buildings examined in this study had all of these measurement elements. Sub-metered data were available for a portion of buildings 1219 and 9420, but readings from sub-meters in 1219 failed to be transmitted to the data management system for several weeks during the intervention, which limited the research team’s ability to do much comparative analysis. Building 9420 did have functioning sub-meters but this was one of the buildings with limited BEM involvement, and as a result, occupants in this building were not believed to have changed behavior significantly. Even though up to one-third of computers were shut off in building 9420 during one week, sub-metering of plug loads only included a few circuits and was not extensive enough to draw conclusions about impacts from this change. Furthermore, neither building 1219 nor 9420 had functioning whole-building gas meters during the intervention. The meters were connected but were not tracking properly according to the Fort Carson energy program coordinator. The whole-building electric meter in 1219 also failed to record accurate interval data due to a server problem during the study period.
Whole-building metered data were available for building 1118 for most of the intervention period. The meter was not recording during Weeks 1 and 2, but recorded data correctly for Weeks 3 through 12. Because this was also the building in which occupants made the most dramatic changes in behavior, this represented the best opportunity to identify real energy savings impacts that might be attributed to the intervention.
4.4.3 Estimated Savings Based on Actual Compliance in Building 1118
While it is difficult to discern the impact of individual energy conservation behaviors using only whole-building metered data, the research team was able to establish probable savings levels from the intervention by comparing weather-corrected energy use during most of the study period (mid-March through May 2013) with energy use in a previous baseline period (September to early November 2012).1 For the analysis of changes in electricity use, savings identified were believed to be the result of four measures:
Measure 1: De-lamping of hallways (independent of intervention)2
Measure 2: Nighttime and weekend computer shutdown (intervention measure)
Measure 3: Nighttime setback of heating units3 (intervention measure)
Measure 4: Turning off overhead lights and using natural or task lighting (intervention measure)
Measures 1 and 2 were expected to have a larger contribution toward electricity savings than Measures 3 and 4. It was also difficult to approximate expected savings for Measures 3 and 4 because these behaviors were not tracked, unlike computer shutdown compliance. To verify that observed savings from the intervention measures were consistent with expectations, an estimate of savings from Measure 1 (yellow area in Figure 19) was subtracted from the overall observed savings, and then the remainder of
1 The meter stopped providing readable data from early November through mid-March; therefore the most recent data available was used and weather-corrected to provide a basis for comparison. 2 It was discovered after the intervention that several hallway lighting fixtures were de-lamped in 1118 during the first of week of the intervention, independent of this project. The research team isolated the impact of the de-lamping from intervention-driven electricity savings. 3 Electricity was only affected by change in use of the fan; reduced heating loads are captured as gas savings.

36
the observed savings (green area in Figure 19), which should all be from intervention measures, was compared to the expected savings from Measure 2.
Estimated savings from Measure 1 were created using information from the Fort Carson energy coordinator about the scale of the de-lamping effort (55 32-watt fluorescent bulbs were removed for a total of 1.76 kW) and assumptions about lighting use in 1118 (i.e., 100% of hallway building lights were modeled to be “ON” from 6 a.m. to 5 p.m., with 10% of lights remaining “ON” after hours for emergency lighting).
Estimates for Measure 2 were bounded by the two scenarios in the dashed lines. Computer network sweeps suggest the intervention is responsible for an average of 86 additional computers being shut down each night in building 1118, some of which were assumed to go into sleep mode. The exact percentage of computers expected to go into standby versus sleep mode could not be established (the two tested did not go into sleep mode), but it is assumed that some would. Two scenarios were considered to provide a possible range of impact: one assumed that 25% of computers would have stayed in standby mode and one assumed that 50% of computers would have stayed in standby mode. This range provides the basis for the two dashed-line estimates in Figure 19. Computers in sleep mode were assumed to draw 3 watts of energy; when completely shut off, they save just 2.5 watts of energy. Computers with monitors in standby mode are assumed to continue drawing 50 watts overnight.
Figure 19. Hourly Comparison of Expected and Observed Weekday Electricity Savings in Building 1118
Total estimated and observed electricity savings, averaged across the entire study period, are listed below:
Total Observed Savings: 12.56 kW (21.4% of raw baseline electricity consumption)
Estimated Measure 1 Savings (from calculation): 0.74 kW (1.3% of raw baseline electricity consumption)
Estimated Measure 2 Savings (from calculation): 0.89–1.64 kW (1.5%–2.8% of raw baseline electricity consumption)
0
5
10
15
20
0 1 2 3 4 5 6 7 8 9 10 11 12 13 14 15 16 17 18 19 20 21 22 23
Electricity Deman
d Savings (kW
)
Estimated Savings from De‐lamping
Observed Savings Not From De‐Lamping
Total Observed Savings (Weather‐Corrected)
Expected Savings From Computer Shutdown (50% Standby Assumption)
Hour of DayHour of Day

37
Remainder of observed savings, including “persistent savings”1 from Measure 2, and effects from Measures 3 and 4: 10.18–10.93 kW (17.8%–19.2% of baseline electricity consumption)
The total observed electricity savings from the intervention should be higher than the expected savings from nighttime and weekend computer shutdown (Measure 2) alone. However, actual energy savings not attributable to the de-lamping are many times higher than the expected effect from the computer shutdown. Given that the other two measures were not expected to have as large an impact on electricity savings, the level of additional savings observed remains unexplained. It was considered that the longer and presumably brighter days in the spring (study period) may have contributed to more of the lights being turned off, however nearby Denver, CO has about 10% more average sunshine hours in the spring study period versus the fall baseline period (a monthly weighted average of 255 versus 281 hours). This may have contributed to a small increase in the manual use of lighting in the baseline period, but the difference in sunshine is not large enough to be considered a major factor in the observed drop in electricity consumption.
The analysis of gas savings in building 1118 was used to estimate the impact of occupants turning back office heating units at night during the heating season. Models of occupied and unoccupied baseline operation generated from the measured baseline data were used to predict baseline building natural gas consumption at each hour during the study period for which there was valid metered data. The predicted baseline consumption for each hour used the study period’s outdoor air temperatures. This weather-normalized version of the baseline data was compared with raw average hourly natural gas consumption data during the study period. Figure 20 shows the hourly savings in the study period in percentage terms, for both weekdays and weekends. Most savings were achieved during HVAC setback hours, so this is believed to be the biggest contributor. According to the Fort Carson energy program coordinator, no other energy conservation measures that would affect gas usage were known to be implemented between the baseline and intervention study periods.
Figure 20. Hourly Natural Gas Savings Patterns in Building 1118
1 The computer shutdown savings estimates assume that people start arriving at work between 6 and 9 a.m. and leave between 4 and 5 p.m., but that all occupants are at work during the heart of the work day from 9 a.m.–4 p.m. This is not necessarily true and may help to account for some of the unexplained savings during the work day. It is possible that some people may power down their computers one evening and not come in the following work day due to sickness, travel, or vacation. Thus their power-down computer savings would persist through at least the following work day, and perhaps longer.
‐60%
‐40%
‐20%
0%
20%
40%
0 1 2 3 4 5 6 7 8 9 10 11 12 13 14 15 16 17 18 19 20 21 22 23
Gas Savings
Weekday Savings Weekend Savings

38
Overall, there was an average 4.8% decrease in natural gas consumption during all unoccupied hours when comparing the weather-corrected natural gas use in the baseline period to actual natural gas use during the study period. However this was more than offset by an average 35.6% increase in consumption during occupied hours compared to the baseline period. There are two likely factors at play in the increased consumption during occupied hours. First, there was dramatically lower electricity consumption in the study period, and this may have contributed to generally higher demands for natural gas to compensate for lost internal heat gain. Second, lower nighttime setback may have contributed to a rebound effect in natural gas consumption when the building became occupied again. On its own, increased consumption during the rebound period would only be expected to be a fraction of the total amount saved in the overnight period. The total increase in gas consumption averaged across the entire study period was 12%, suggesting a fairly large increase in heating demand at comparable temperatures to account for the overall increase.
Assuming that the overall increase in natural gas consumption compared to the baseline period is due to an increase in heating demand, it is still likely that the natural gas consumption was lower in the study period than it would have been without the heating setback measure. There is unfortunately no way to empirically validate this assumption, given the change in internal loads from the baseline to the study period. An attempt at quantifying the expected savings from the heating-unit setback uses modeling results from NREL EnergyPlus simulations of the impact of a similar measure on other buildings on the Fort Carson base. NREL modeled two scenarios for building 1219, which has a heating system similar to that in 1118: a first with full setback of heating units, plus keeping ventilation off at night (4.9% total building energy savings) and a second that only kept ventilation off at night (1.8% total building energy savings). In building 1118, there is not an option to stop ventilation at night on the heating unit, so the research team made the assumption that the 1.8% savings modeled from the night ventilation reduction could be subtracted from the savings from the first scenario to estimate the impact of the full night setback alone. This methodology estimated a 3.1% annual building energy savings from a full setback alone. However, in building 1118, only 32% of survey respondents indicated compliance with the setback measure. As a rough approximation of expected savings at building 1118, we multiplied the 3.1% expected savings from full setback by 32% to arrive at an expected annual building energy savings of 1.0% for this measure as it was implemented.
The total combined electricity and gas savings in 1118 between the baseline period and intervention period were estimated to be 8.9%, with 2% of the building’s total energy savings estimated to come from the computer shutdown and heating setback measures, and some portion of the remaining 6.3% of unaccounted-for savings potentially coming from occupant lighting control measures (see Figure 21).
To summarize, the observed savings in electricity were several times higher than what was expected and what could be accounted for from the observed energy measures that were implemented. We do not have an explanation for why the savings are so high. The high electricity savings coincided with higher natural gas demand in the heating season, which made it difficult to identify natural gas savings through measured natural gas consumption data. Nevertheless, based on the specifics of the implementation of the heating setback measure and modeling of its expected performance, we believe that there are some small natural gas savings compared to what would otherwise have been used.

39
Figure 21. Total Observed Energy Savings in Building 1118 between Baseline and Intervention Period
1.0%1.0%0.6%
6.3%
0%
2%
4%
6%
8%
10%
12%
Remainder of Savings:UnexplainedDe‐lamping
Computer Shut‐Off
Setback of Heating Units
Total Observed Energy Savings: 8.9%
41
5.0 Conclusions and Recommendations
This section presents the major conclusions and interpretations of the findings from the Fort Carson intervention study. There are three parts to this section: a summary of findings from our research, implications for deploying programmatic approaches to energy conservation and behavioral change, and specific recommendations for Fort Carson and the Army.
5.1 Summary of Findings
Through this study, the research team aimed to apply a focused, methodical approach to encouraging behavior change for energy conservation—leveraging guidance developed by DOE-FEMP on Institutional Change—and to gauge what impact such a program would have on actual behavior. This involved
understanding the local context in which behavior change would occur to support energy conservation (i.e., the people with the potential to save energy, and the rules and tools that influence their behavior),
defining behaviors with the greatest potential to save energy and leveraging proven strategies to promote change,
implementing a coordinated program of activities over a three-month pilot period, and
evaluating which behaviors changed, what supported the change, and what impact the change had on building energy use.
Findings from this study suggest that over a very short period of time the audiences targeted did change some behaviors that support energy conservation. Occupants in all five buildings in the demonstration project showed higher levels of compliance with the computer shutdown measure over their baseline levels, increasing from 13% to 51% between Week 1 and the peak week of compliance in each building. Behaviors were most likely to change when there was an engaged advocate for energy conservation providing information on specific energy saving actions and feedback on performance at the building level, and also when people in leadership and supervisory positions reinforced the importance of taking these actions.
Despite several challenges to getting reliable data to evaluate the impact of these behavioral changes, analysis of metered data from one of the buildings studied (1118) suggests that the intervention contributed to a reduction in energy use of at least 2% after just three months. This is based on assumptions that approximately one-third of the occupants complied with the nighttime temperature setback measure and about half of the occupants of Building 1118 started shutting down their computers at night as a result of this behavior change program. Higher levels of compliance may have been achieved over a longer intervention program that would have allowed time for the team to adapt to different challenges that were encountered. To provide a sense of the maximum savings potential from applying two targeted behaviors—nighttime computer shutdown and temperature setbacks on heating units—in this particular building, if 100% of occupants had complied with these measures, energy savings may

42
have ranged from 3 to 7%.1 It is important to consider, however, that this is a single building with unique features and energy saving opportunities; the actual percentage of energy saved in other buildings could vary dramatically depending on the building’s baseline.
5.2 Implications for Institutional and Behavioral Change Programs
The overall framework for conducting this study was to provide GSA with actionable guidance for implementing behavioral change to complement the operational and technical aspects of Federal green buildings. In general, following a methodical approach to behavior change as was laid out in Section 3.0 can be a useful mechanism for making sure that actions are defined around well-understood principles for behavior and institutional change. It is recognized that most organizations lack the resources to take advantage of every opportunity for institutional or behavioral change as a full-blown intervention. Fortunately, this research does not suggest that organizations must have dedicated teams of behavioral scientists at every building to foster change at the building level. It does suggest, however, that having an engaged, trained and resourced advocate at the building level can be effective. Many of the elements of an effective change program can likely be centralized in the organization and disseminated to a network of implementers on the ground. Implementation at the ground level does not necessarily require more than a few hours per week.
Findings from this demonstration project at Fort Carson lend support to the idea that behavior change efforts will be more successful if several key elements are in place, as discussed below.
Understand the institutional context in which behavior takes place
The existing social science literature and the findings from this study reinforce the importance of addressing the entire context in which individual behavior takes place in order to effectively foster change. While individual behavior is known to be an important for the implementation of many energy reduction approaches, the numerous institutional factors that may inhibit action or reinforce inaction (e.g., policy of leaving computers on at night) are less frequently recognized. The harmonization of policies (rules), communications (tools), and communicators (roles) involves considerable coordination by change agents to make sure that the desired individual behavior (e.g., computers off at night) is enabled by appropriate policies, enabled through communications of those policies, and reinforced by trusted and authoritative communicators.
In this study, when the rules, roles, and tools were aligned and reinforced, higher rates of behavior change were observed. When they were not harmonized, behavior was less likely to change. The slower rates of change in computer shutdown behavior in the military buildings compared to the primarily civilian buildings, partially due to conflicting messages received by individuals about the exception to this policy, is a prime example of this. Although the policy requiring users to leave computers on had been waived for the five pilot buildings and the waiver was supposed to have been communicated to building occupants, occupants of some buildings had not received the message from a trustworthy authority and, until that message was provided, continued in old behavior patterns.
1 As noted above, actual energy savings would depend on the proportion of computers that went into sleep mode versus standby mode overnight.
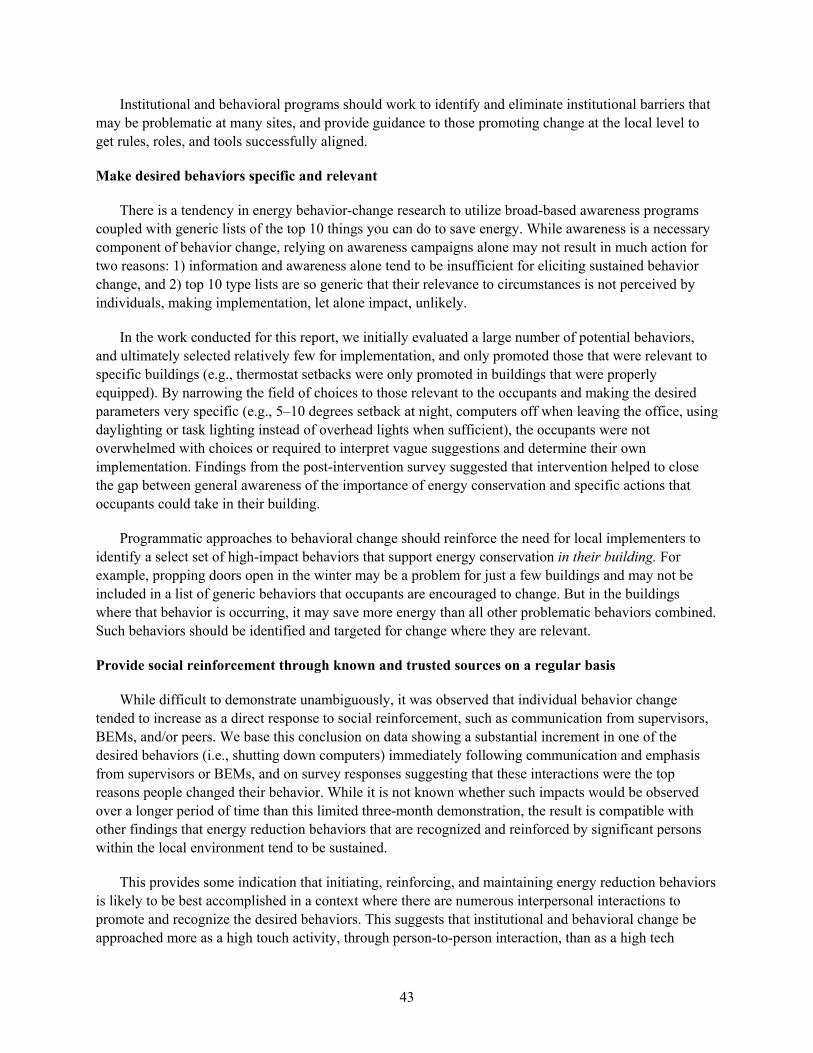
43
Institutional and behavioral programs should work to identify and eliminate institutional barriers that may be problematic at many sites, and provide guidance to those promoting change at the local level to get rules, roles, and tools successfully aligned.
Make desired behaviors specific and relevant
There is a tendency in energy behavior-change research to utilize broad-based awareness programs coupled with generic lists of the top 10 things you can do to save energy. While awareness is a necessary component of behavior change, relying on awareness campaigns alone may not result in much action for two reasons: 1) information and awareness alone tend to be insufficient for eliciting sustained behavior change, and 2) top 10 type lists are so generic that their relevance to circumstances is not perceived by individuals, making implementation, let alone impact, unlikely.
In the work conducted for this report, we initially evaluated a large number of potential behaviors, and ultimately selected relatively few for implementation, and only promoted those that were relevant to specific buildings (e.g., thermostat setbacks were only promoted in buildings that were properly equipped). By narrowing the field of choices to those relevant to the occupants and making the desired parameters very specific (e.g., 5–10 degrees setback at night, computers off when leaving the office, using daylighting or task lighting instead of overhead lights when sufficient), the occupants were not overwhelmed with choices or required to interpret vague suggestions and determine their own implementation. Findings from the post-intervention survey suggested that intervention helped to close the gap between general awareness of the importance of energy conservation and specific actions that occupants could take in their building.
Programmatic approaches to behavioral change should reinforce the need for local implementers to identify a select set of high-impact behaviors that support energy conservation in their building. For example, propping doors open in the winter may be a problem for just a few buildings and may not be included in a list of generic behaviors that occupants are encouraged to change. But in the buildings where that behavior is occurring, it may save more energy than all other problematic behaviors combined. Such behaviors should be identified and targeted for change where they are relevant.
Provide social reinforcement through known and trusted sources on a regular basis
While difficult to demonstrate unambiguously, it was observed that individual behavior change tended to increase as a direct response to social reinforcement, such as communication from supervisors, BEMs, and/or peers. We base this conclusion on data showing a substantial increment in one of the desired behaviors (i.e., shutting down computers) immediately following communication and emphasis from supervisors or BEMs, and on survey responses suggesting that these interactions were the top reasons people changed their behavior. While it is not known whether such impacts would be observed over a longer period of time than this limited three-month demonstration, the result is compatible with other findings that energy reduction behaviors that are recognized and reinforced by significant persons within the local environment tend to be sustained.
This provides some indication that initiating, reinforcing, and maintaining energy reduction behaviors is likely to be best accomplished in a context where there are numerous interpersonal interactions to promote and recognize the desired behaviors. This suggests that institutional and behavioral change be approached more as a high touch activity, through person-to-person interaction, than as a high tech

44
activity. The prevailing physical, technical, and economic approaches to energy reduction focus on technical efficiencies, feedback devices (such as dashboards), and relatively small financial savings. The high touch approach involves the general philosophy that people will change because they want to please others with whom they regularly interact (Gwande 2013, White 1983).
This reinforces the importance of having advocates for energy conservation at the local or building level—people who can observe behaviors and engage in dialogue around them—in order to foster change. As the landlordfor the civilian federal government, GSA might encourage building tenants to identify energy conservation advocates in each building or complex of buildings who are recognized and trusted by their fellow occupants.
Equip tenants with knowledge and resources to implement behavior change
Energy advocates working at the building or site level can be instrumental in promoting change, but they need knowledge and access to resources to carry out their responsibilities efficiently. Based on our experience at Fort Carson, each of the BEMs required about two hours per week to carry out their duties. During the design and implementation phases, however, quite a bit of coordination was required on the part of the research team and personnel operating at the installation level in the energy and sustainability programs.
In GSA buildings, the tenant organizations can play a critical role in fostering energy conservation behavior if they are well equipped to do so. The types of resources made available to BEMs as part of the Fort Carson project (e.g., email messages to occupants, floor check forms, training materials) could be packaged by GSA or other agencies at a program level, and disseminated with guidance on how to adapt the resources for local use.
Based on the findings of this project, some general principles that should be considered for incorporation into the GSA support process for building tenancy and operation include:
Work with the tenant organizations to help define the operating and social reinforcement process. This requires an understanding of the kinds of tasks occupants will perform, and general issues related to the organizational culture (e.g., autonomous, centrally controlled). Ideally this process can define a means for linking energy consumption to business processes and the individual worker and group behaviors that carry out those business processes. Knowledge of the small-group (e.g., 10–50 individuals) structure and process can be used to identify potential candidate individuals to adopt a role similar to the BEMs in the Fort Carson intervention.
Leadership of the organization and work group levels need to be committed to the social reinforcement process for energy reduction, and demonstrate it through active participation and periodic acknowledgement.
A responsible person at the building or work group level must be accountable, knowledgeable, and properly resourced to observe how energy is being used, identify opportunities for conservation, and engage occupants and others in resource conservation behaviors.
Accountability requires that encouraging others to conserve energy is part of someone’s job, not an add-on responsibility for an already overworked individual. While energy monitoring and social reinforcement imply dedicated time, our observations suggest that the commitment is not excessive—generally less than two hours per week for a properly supported individual.
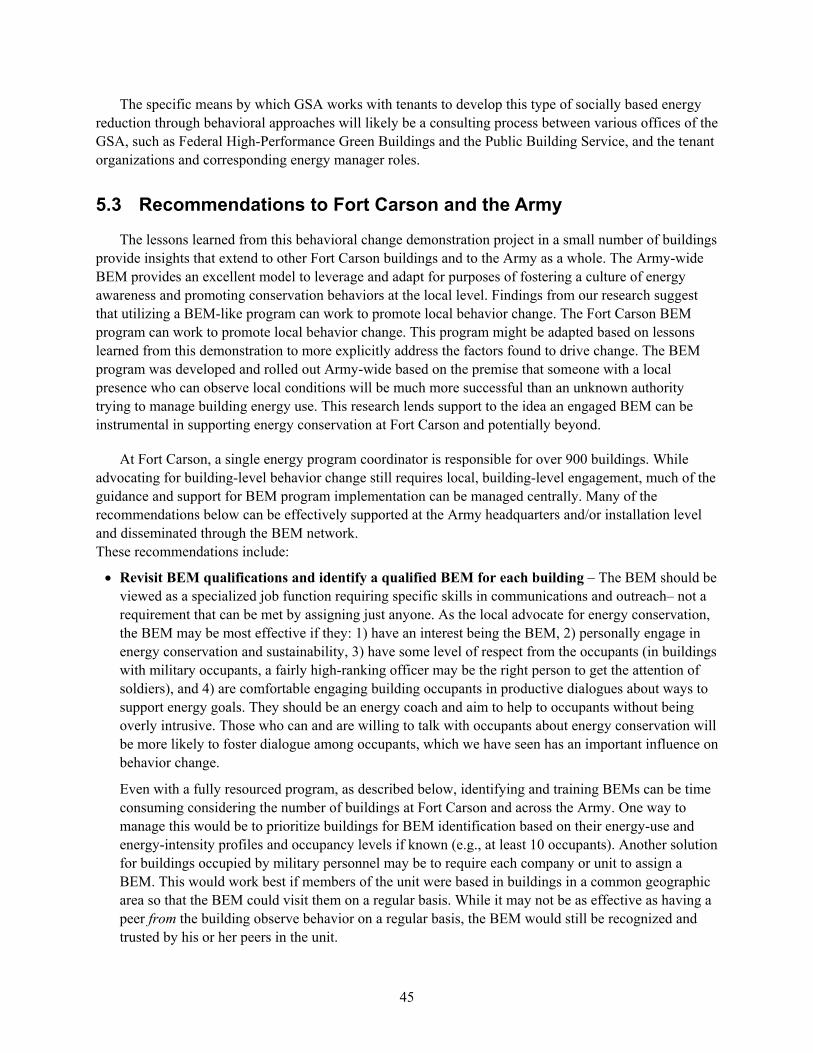
45
The specific means by which GSA works with tenants to develop this type of socially based energy reduction through behavioral approaches will likely be a consulting process between various offices of the GSA, such as Federal High-Performance Green Buildings and the Public Building Service, and the tenant organizations and corresponding energy manager roles.
5.3 Recommendations to Fort Carson and the Army
The lessons learned from this behavioral change demonstration project in a small number of buildings provide insights that extend to other Fort Carson buildings and to the Army as a whole. The Army-wide BEM provides an excellent model to leverage and adapt for purposes of fostering a culture of energy awareness and promoting conservation behaviors at the local level. Findings from our research suggest that utilizing a BEM-like program can work to promote local behavior change. The Fort Carson BEM program can work to promote local behavior change. This program might be adapted based on lessons learned from this demonstration to more explicitly address the factors found to drive change. The BEM program was developed and rolled out Army-wide based on the premise that someone with a local presence who can observe local conditions will be much more successful than an unknown authority trying to manage building energy use. This research lends support to the idea an engaged BEM can be instrumental in supporting energy conservation at Fort Carson and potentially beyond.
At Fort Carson, a single energy program coordinator is responsible for over 900 buildings. While advocating for building-level behavior change still requires local, building-level engagement, much of the guidance and support for BEM program implementation can be managed centrally. Many of the recommendations below can be effectively supported at the Army headquarters and/or installation level and disseminated through the BEM network. These recommendations include:
Revisit BEM qualifications and identify a qualified BEM for each building – The BEM should be viewed as a specialized job function requiring specific skills in communications and outreach– not a requirement that can be met by assigning just anyone. As the local advocate for energy conservation, the BEM may be most effective if they: 1) have an interest being the BEM, 2) personally engage in energy conservation and sustainability, 3) have some level of respect from the occupants (in buildings with military occupants, a fairly high-ranking officer may be the right person to get the attention of soldiers), and 4) are comfortable engaging building occupants in productive dialogues about ways to support energy goals. They should be an energy coach and aim to help to occupants without being overly intrusive. Those who can and are willing to talk with occupants about energy conservation will be more likely to foster dialogue among occupants, which we have seen has an important influence on behavior change.
Even with a fully resourced program, as described below, identifying and training BEMs can be time consuming considering the number of buildings at Fort Carson and across the Army. One way to manage this would be to prioritize buildings for BEM identification based on their energy-use and energy-intensity profiles and occupancy levels if known (e.g., at least 10 occupants). Another solution for buildings occupied by military personnel may be to require each company or unit to assign a BEM. This would work best if members of the unit were based in buildings in a common geographic area so that the BEM could visit them on a regular basis. While it may not be as effective as having a peer from the building observe behavior on a regular basis, the BEM would still be recognized and trusted by his or her peers in the unit.

46
Resource the position – The BEM position does not require substantial time, once the BEM is familiar with their duties. However, it should not be assigned to people already 100% committed to other duties. Establish an expectation for a time commitment from the BEM to carry out their duties—perhaps two hours per week once the BEM has identified building-level conservation opportunities—and make sure that supervisors of the BEMs understand and support this time commitment.
Create accountability and incentive structures – In addition to ensuring that BEMs have the time to carry out their duties, supervisors of BEMs must establish clear expectations for BEM duties and ensure they are completed. Because it is difficult for a single installation energy manager who may rarely visit the facility to effectively track several BEMs, it is important to involve the BEM’s supervisor. The BEM’s supervisor should work with the BEM to determine what energy use behaviors are problematic in their building, generate ideas for changing those behaviors, and what changes have been observed during floor checks. Good performance should be rewarded or recognized. For example, an installation-level program recognizing the “BEM of the month” could be implemented.
Provide BEMs ongoing training on behavior change – While checking the physical elements of the building for possible impacts on energy performance (e.g., looking for good seals around windows and doors) BEM training must also explicitly address how humans influence building energy use. For example, BEMs should learn how to identify the energy saving behaviors that may be impacting energy use, as well as effective ways to change those behaviors, including how to effectively engage occupants and motivate change. Training should clearly convey to the BEM their role in the building as it relates to occupants, the building manager and others. The training should be continual. Bring BEMs together quarterly or twice a year to provide a refresher, roll out new resources, and allow BEMs to share successes and lessons learned.
Provide BEMs with a toolkit that can be adapted locally – BEMs need a set of simple tools to effectively engage occupants and understand how the building and its occupants are performing. A lengthy handbook distributed on training day will likely not be reviewed again. Keep the toolkit fresh and distribute material to BEMs on a regular basis, perhaps monthly or quarterly. Training should focus on how to use the tools and how to make them locally relevant. Examples of some electronic resources that may help BEMs to be more effective include
– monthly building energy performance reports (one-page summary)
– a list of energy use behaviors that are commonly seen on installations, which BEMs could use for reference in identifying priority opportunities for improvement
– a floor-check template
– generic email messages or ideas for topics to address, which the BEM can tailor based on their building’s characteristics and performance
– a short template for developing a “conservation behavior-change plan.”
Make new occupant orientation conversation about conservation a requirement – Military installations are in a constant state of flux with soldiers coming and going as they prepare for and return from deployment. This frequent turnover of personnel can affect the operating tempo of buildings and poses a challenge to fostering a culture of energy conservation that can be sustained over time. From the day a new occupant sets foot in a building, they begin to establish patterns and

47
habits that will stick with them throughout their tenure in the building. A key function of the BEM should be to orient new occupants to the building in a way that is personal, brief, and timely. A five-minute conversation with a new occupant about their role in energy conservation behaviors will likely have much greater impact than referencing a building handbook with details that are superfluous to occupants. For example, for buildings with occupant control of heating/cooling units, the BEM might establish expectations for heating season setbacks and cooling season temperature increases, as appropriate.
Institutionalize measurement and feedback on performance – Build measurement of building energy performance and the impact of specific behaviors at the end-use level into regular feedback to occupants. There are building meter connection and meter data management challenges that must be addressed to make this data readily accessible and some supporting analytics required to make the data informative. To the extent that these challenges can be addressed, people at the end-use level will benefit from seeing the impact of their actions (or failure to act) on energy use in their building. Also, if there are behaviors that may be worth promoting installation-wide (e.g., nighttime computer shutdown), it may be helpful to institutionalize a process for measuring compliance with such measures and making sure that the information is fed back to occupants through the BEMs.
49
6.0 References
Anderson K, J Cale, J Daveis, J Giraldez, R Hunsberger, L Lisell, J Macknick, D Martin, R Robichaud and G Tomberlin. 2012. Targeting Net Zero Energy, Water, and Waste at Fort Carson: Assessment and Recommendations. NREL/TP-7A40-55279. National Renewable Energy Laboratory, Golden, Colorado.
Allcott H. Social norms and energy conservation, J. Public Econ. (2011), doi: 10.1016/j.jpubeco.2011.03.003
DOE – U.S. Department of Energy, Federal Energy Management Program. 2013. “Institutional Change for Sustainability” website. Accessed June 2013 at http://www1.eere.energy.gov/femp/program/institutional_change.html.
Dietz T, GT Gardner, J Gilligan, PC Stern and MP Vandenbergh. 2009. Household actions can provide a behavioral wedge to rapidly reduce US carbon emissions. Proceedings of the National Academy of Sciences. 106(44):18452–18456.
Dietz T and PC Stern, (eds.). 2002. New Tools for Environmental Protection: Education, Information and Voluntary Measures. National Academies Press, Washington, D.C.
Earhardt-Martinez K and JA Laitner. 2010. People-Centered Initiatives for Increasing Energy Savings. American Council for an Energy Efficient Economy, Washington, DC. (e-book, http://www.aceee.org/people-centered-energy-savings, retrieved September 3, 2012)
EISA 2007 – Energy Independence and Security Act of 2007. 42 USC 17001. Public Law No. 110-140.
Farhar B and TA Coburn. 2006. New Market Paradigm for Zero-Energy Homes: The Comparative San Diego Case Study. NREL Technical Report NREL/TP-550-38304-01. National Renewable Energy Laboratory, Golden, Colorado. http://www.nrel.gov/docs/fy07osti/38304-01.pdf, http://www.nrel.gov/docs/fy07osti/38304-02.pdf.
Gardner GT and PC Stern. 2002. Environmental Problems and Human Behavior. Pearson Custom Publishing, Boston, Massachusetts.
Gardner GT and PC Stern. 2008. The short list: The most effective actions U.S. households can take to curb climate change. Environment Magazine 50(5): 12–24.
Gwande, A. Slow Ideas. The New Yorker. July 29, 2013. Accessed August 2013 at http://www.newyorker.com/reporting/2013/07/29/130729fa_fact_gawande.
Heschong Mahone Group, Inc. 2012. The Road to ZNE: Mapping Pathways to ZNE Buildings in California. Gold River, California. Sponsored by Pacific Gas and Electric Company, San Francisco, California. www.energydataweb.com/cpucFiles/pdaDocs/899/Road%20to%20ZNE%20FINAL%20Report_withAppendices.pdf

50
Huizenga C, S Abbaszadeh, L Zagreus and E Arens. 2006. Air Quality and Thermal Comfort in Office Buildings: Results of a Large Indoor Environmental Quality Survey. Proceedings of Healthy Buildings 2006, Vol. III, pp. 393–397. Lisbon, Portugal, June 2006. http://escholarship.org/uc/item/7897g2f8
Harris J, R Diamond, M Iyer, C Payne, C Blumstein and H-P Siderius. 2008. Towards a Sustainable Energy Balance: Progressive Efficiency and the Return of Energy Conservation. Energy Efficiency 1:175–188.
Lutzenhiser L. 1993. Social and Behavioral Aspects of Energy Use. Annual Review of Energy and the Environment 18: 247–289.
Malone EL, R Diamond, AK Wolfe, T, Sanquist, C Payne and J Dion. 2013. Implementing Sustainability: the Behavioral-Institutional Dimension. Sustain. Issue 28 – Spring/Summer, pp. 28–32.
Moezzi M and KB Janda. 2013. Redirecting research about energy and people: from “if only” to “social potential.” ECEEE Summer Study Proceedings 1-379-13:205–216.
Prins G and S Rayner. 2007. Time to ditch Kyoto. Nature 449:973–975.
Schwartz D, B Fischoff, T Krishnamurti and F Sowell. (2013, in press). The Hawthorne effect and energy awareness. Proceedings of the National Academy of Sciences. www.pnas.org/cgi/doi/10.1073/pnas.1301687110
Shui B, H Orr, T Sanquist and H Dowlatabadi. 2010. Total Energy Use and Related CO2 Emissions of American Household Consumption, 1997-2007. ACEEE Summer Study on Buildings 7-310–7-321.
Staats H, P Harland and HAM Wilke. 2004. Effecting durable change. A team approach to improve environmental behavior in the household. Environment and Behavior. 36(3):341–367.
White, LT, BA Curbow, MA Constanzo, and TF Pettigrew. 1983. Social Psychological Approaches to Promoting Lifestyle and Device-Oriented Conservation Behaviors. In Advances in Consumer Research 10: 636-640. Eds. RP Bagozzi and AM Tybout, Ann Abor, MI : Association for Consumer Research.

Appendix A –
Group Interview Questions
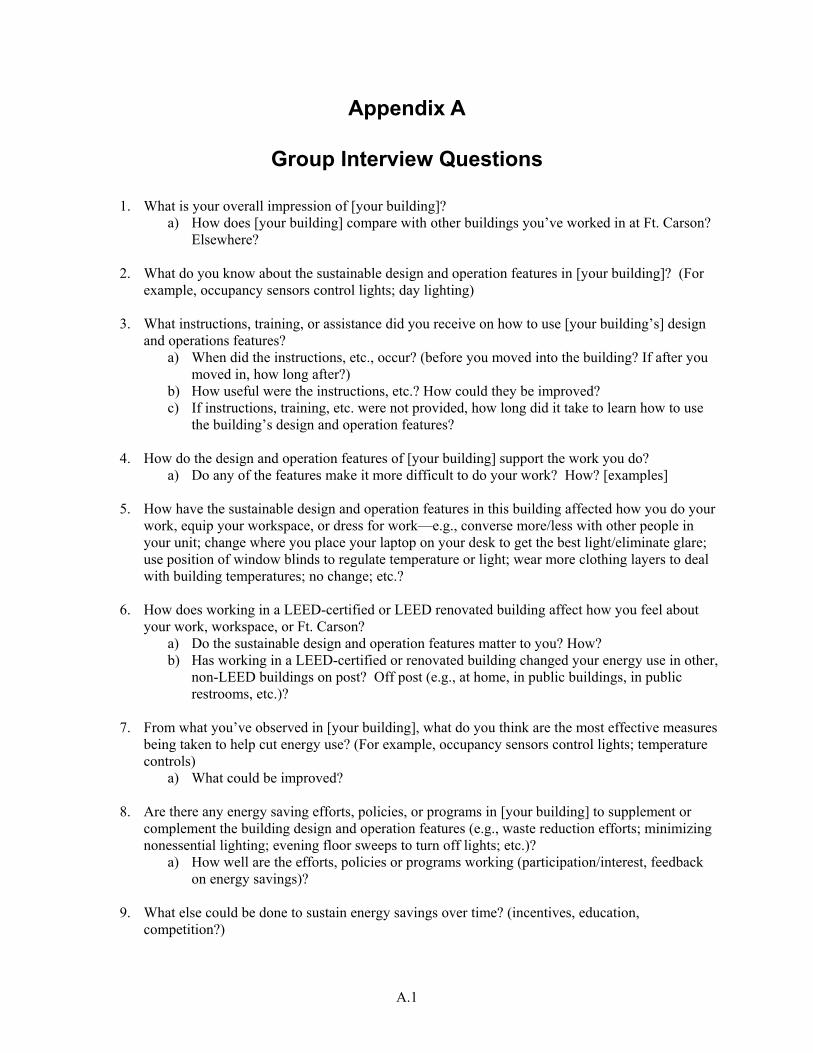
A.1
Appendix A
Group Interview Questions
1. What is your overall impression of [your building]? a) How does [your building] compare with other buildings you’ve worked in at Ft. Carson?
Elsewhere?
2. What do you know about the sustainable design and operation features in [your building]? (For example, occupancy sensors control lights; day lighting)
3. What instructions, training, or assistance did you receive on how to use [your building’s] design and operations features?
a) When did the instructions, etc., occur? (before you moved into the building? If after you moved in, how long after?)
b) How useful were the instructions, etc.? How could they be improved? c) If instructions, training, etc. were not provided, how long did it take to learn how to use
the building’s design and operation features?
4. How do the design and operation features of [your building] support the work you do? a) Do any of the features make it more difficult to do your work? How? [examples]
5. How have the sustainable design and operation features in this building affected how you do your
work, equip your workspace, or dress for work—e.g., converse more/less with other people in your unit; change where you place your laptop on your desk to get the best light/eliminate glare; use position of window blinds to regulate temperature or light; wear more clothing layers to deal with building temperatures; no change; etc.?
6. How does working in a LEED-certified or LEED renovated building affect how you feel about your work, workspace, or Ft. Carson?
a) Do the sustainable design and operation features matter to you? How? b) Has working in a LEED-certified or renovated building changed your energy use in other,
non-LEED buildings on post? Off post (e.g., at home, in public buildings, in public restrooms, etc.)?
7. From what you’ve observed in [your building], what do you think are the most effective measures
being taken to help cut energy use? (For example, occupancy sensors control lights; temperature controls)
a) What could be improved?
8. Are there any energy saving efforts, policies, or programs in [your building] to supplement or complement the building design and operation features (e.g., waste reduction efforts; minimizing nonessential lighting; evening floor sweeps to turn off lights; etc.)?
a) How well are the efforts, policies or programs working (participation/interest, feedback on energy savings)?
9. What else could be done to sustain energy savings over time? (incentives, education,
competition?)

A.2
10. How would you describe the culture within [your building] (e.g., what about the values, norms, work habits/preferences, etc., distinguishes the people in [your building] from the people in other buildings)?
a) Which, if any, of the sustainability design and operation features in [your building] best fit or match the culture (e.g., how much does having greater, less or no control over building features [e.g., lighting, temperature, privacy] matter)?
b) Has the culture affected how people are reacting to or using the design and operation features?
11. Would specific feedback about energy use help you reduce your energy use? (For example,
“Your floor/business unit/group used this amount of electricity last month and this month the amount increased 3%.”)
a) What feedback would you like to receive? b) What time period should it cover? c) How often would you want it delivered to you? d) Is it better to have it in a place you can “go” see it when you need it? (Website,
dashboard, large screens at entrance etc.)

Appendix B –
Baseline Survey Questions

B.1
Baseline Survey Questions
Energy Use at Ft. Carson, CO
Q1.1 This section requests a little information about you that will be used to better understand your experiences with your building, workspaces, and energy use.
Q1.2 How would you describe the work you do?
Administrative support Technical Professional Managerial/supervisory Driver Vehicle Maintenance Other (please describe) ____________________ Q1.3 Are you:
Male Female Q1.4 What is your age?
______ Years
Q1.5 What building do you usually work in?
1118 (Garrison Command HQ) 1219 (DPW) 9420 (4-4 BCT HQ) 9427 (COF) 9447 (COF) Other (please describe) ____________________ Q1.6 What is your position at Ft. Carson?
Soldier-Officer Soldier-Enlisted Civilian-Manager Civilian-Non-Manager Contractor Q1.7 Military personnel: What unit are you assigned to?
Q1.8 Civilian personnel: What organization do you work for?

B.2
Q1.9 Where do you live?
On-post Barracks On-post Housing Off post Q1.10 How long have you worked at Ft. Carson?
______ Years ______ Months
Q1.11 Do you anticipate leaving Ft. Carson within the next two years?
Yes No Don't know Q1.12 If yes, check all that apply:
Permanent change of station (PCS) Leave military service Change jobs Follow family member/spouse moving Other (please describe) ____________________ Q2.1 This section asks about the physical features and environment of your workspace and your satisfaction or discomfort with them.
Q2.2 Do you have a permanent workspace on post?
Yes No Q2.3 How long have you been working at your present workspace?
______ Years ______ Months
Q2.4 In a typical week, how many hours do you spend in your workspace?
______ Hours
Q2.5 Which of the following best describes your personal workspace or the type of space you usually work in at Ft. Carson?
Enclosed office, private Enclosed office, shared with other people Cubicles with high partitions (about 5’ or more high) Cubicles with low partitions (lower than 5’ high)

B.3
Workspace in open office with no partitions (just desks) Other (please describe) ____________________ Q2.6 Where is your workspace located?
Basement 1st floor 2nd floor 3rd floor 4th floor 5th floor Q2.7 Are you near a window (within 15 feet)?
Yes No Q2.8 Are you near heating/cooling vents (within 15 feet)?
Yes No Q2.9 Which of the following electronics, including personally owned, are in your personal workspace? Check all that apply.
laptop desktop computer desk phone coffee maker fan space heater radio Smart phone docking station personal desk lamp electric clock other (please describe) ____________________ Q2.10 How often do you recharge your cell/smart phone, iPod, or other personal portable electronic communications equipment at work?
Daily Occasionally Never N/A (Not Applicable) Q2.11 Which of the following building features do you adjust in your workspace? Check all that apply.
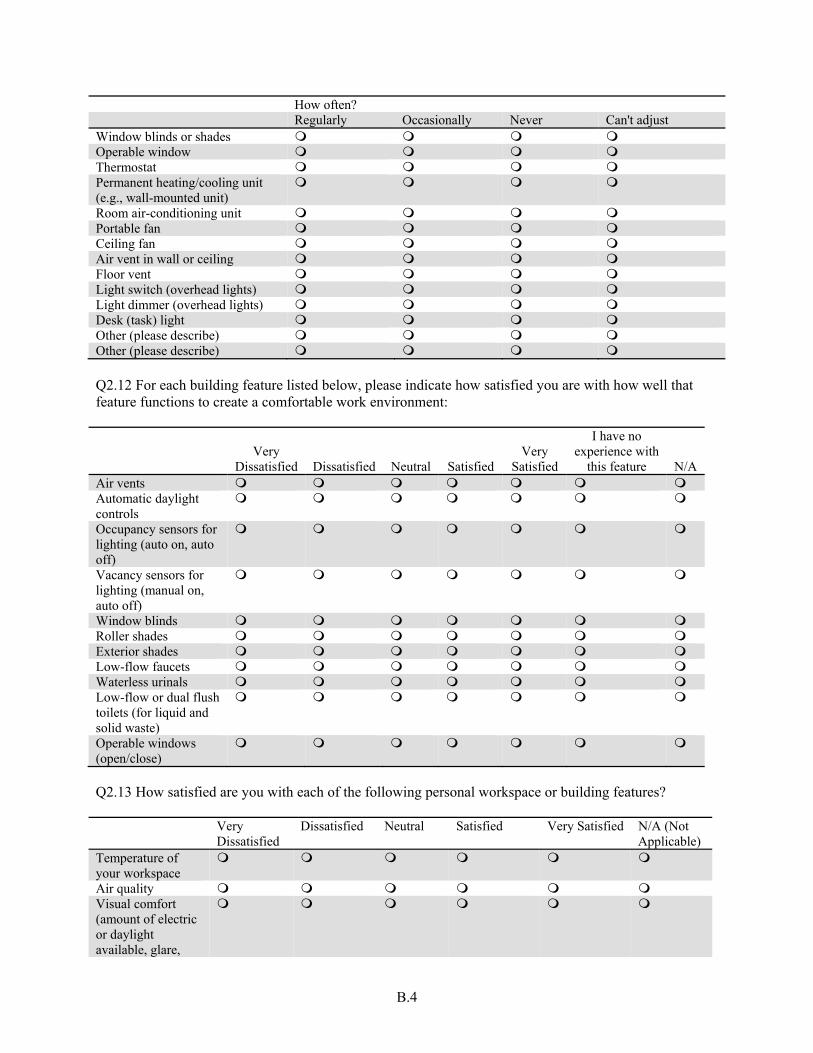
B.4
How often? Regularly Occasionally Never Can't adjust Window blinds or shades Operable window Thermostat Permanent heating/cooling unit (e.g., wall-mounted unit)
Room air-conditioning unit Portable fan Ceiling fan Air vent in wall or ceiling Floor vent Light switch (overhead lights) Light dimmer (overhead lights) Desk (task) light Other (please describe) Other (please describe) Q2.12 For each building feature listed below, please indicate how satisfied you are with how well that feature functions to create a comfortable work environment:
Very
Dissatisfied Dissatisfied Neutral Satisfied Very
Satisfied
I have no experience with
this feature N/A Air vents Automatic daylight controls
Occupancy sensors for lighting (auto on, auto off)
Vacancy sensors for lighting (manual on, auto off)
Window blinds Roller shades Exterior shades Low-flow faucets Waterless urinals Low-flow or dual flush toilets (for liquid and solid waste)
Operable windows (open/close)
Q2.13 How satisfied are you with each of the following personal workspace or building features? Very
Dissatisfied Dissatisfied Neutral Satisfied Very Satisfied N/A (Not
Applicable) Temperature of your workspace
Air quality Visual comfort (amount of electric or daylight available, glare,

B.5
reflections, contrast) Views of the outdoors from your workspace
General maintenance of the building
Q2.14 Please indicate why you are dissatisfied with the temperature of your workspace by checking all the reasons that apply:
Too hot much of the time Too hot in the summer Too hot in the winter Too cold much of the time Too cold in the summer Too cold in the winter Other (please describe) ____________________ Q2.15 Please indicate why you are dissatisfied with air quality by checking all the reasons that apply:
Stuffy/stale air Cleanliness Odors Other (please describe) ____________________ Q2.16 Please indicate why you are dissatisfied with visual comfort by checking all the reasons that apply:
Not enough daylight most of the day Too much daylight most of the day Not enough overhead light in my workspace Too much overhead light in my workspace Not enough overhead light in the office overall Too much overhead light in the office overall Electric lighting is unattractive No task lighting Reflections in/glare on the computer screen Daylight glare from windows Other (please describe) ____________________ Q2.17 Please indicate why you are dissatisfied with the general maintenance of the building by checking all the reasons that apply:
Dust visible on surfaces Spills/stains Dirty floors Trash cans not emptied overnight
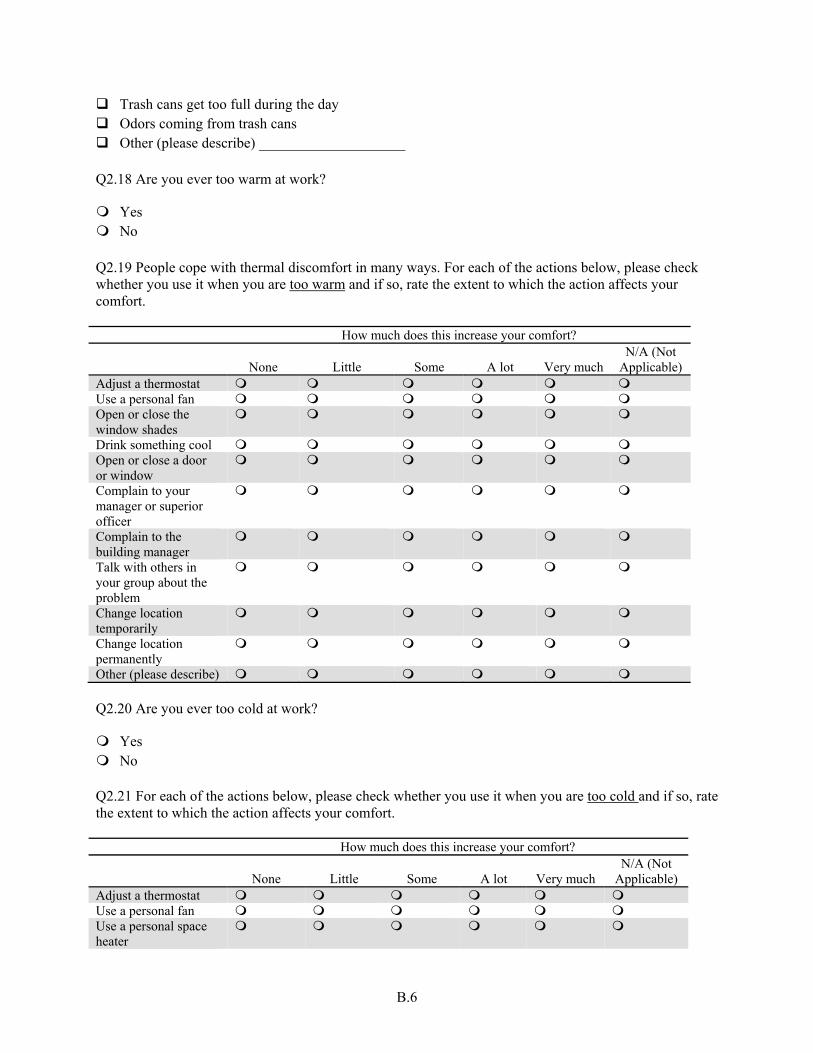
B.6
Trash cans get too full during the day Odors coming from trash cans Other (please describe) ____________________ Q2.18 Are you ever too warm at work?
Yes No Q2.19 People cope with thermal discomfort in many ways. For each of the actions below, please check whether you use it when you are too warm and if so, rate the extent to which the action affects your comfort.
How much does this increase your comfort?
None Little Some A lot Very much N/A (Not
Applicable) Adjust a thermostat Use a personal fan Open or close the window shades
Drink something cool Open or close a door or window
Complain to your manager or superior officer
Complain to the building manager
Talk with others in your group about the problem
Change location temporarily
Change location permanently
Other (please describe) Q2.20 Are you ever too cold at work?
Yes No
Q2.21 For each of the actions below, please check whether you use it when you are too cold and if so, rate the extent to which the action affects your comfort.
How much does this increase your comfort?
None Little Some A lot Very much N/A (Not
Applicable) Adjust a thermostat Use a personal fan Use a personal space heater

B.7
Open or close the window shades
Drink something hot Open or close a door or window
Complain to your manager or superior officer
Complain to the building manager
Talk with others in your group about the problem
Change location temporarily
Change location permanently
Other (please describe) Q2.22 Do you ever experience discomfort from glare or sunlight from windows? Yes No Q2.23 For each of the actions below, please check whether you use it when you experience lighting discomfort from glare or sunlight from windows and if so, rate the extent to which the action affects your comfort. How much does this increase your comfort?
None Little Some A lot Very much N/A (Not
Applicable) Close the window shades/blinds
Complain to your manager or superior officer
Complain to the building manager
Talk with others in your group about the problem
Change position in your workspace
Change location temporarily Change location permanently Other (please describe) Q2.24 Do you ever experience discomfort from too much or not enough light from ceiling lights?
Yes No Q2.25 For each of the actions below, please check whether you use it when you experience lighting discomfort from glare or too much/not enough light from ceiling, and if so, rate the extent to which the action affects your comfort.

B.8
How much does this increase your comfort?
None Little Some A lot Very much
N/A (Not Applicable)
Turn ceiling lights off Use a desk (task) lamp Complain to your manager or superior officer
Complain to the building manager
Talk with others in your group about the problem
Change position in your workspace
Change location temporarily
Change location permanently
Cover up lighting sensor
Remove or alter light fixture above your workspace
Other (please describe) Q2.26 Do you ever experience discomfort with air quality (e.g., stuffiness, odors)?
Yes No Q2.27 For each of the actions below, please check whether you use it when you experience discomfort with air quality (e.g., stuffiness, odors) and if so, rate the extent to which the action affects your comfort. How much does this increase your comfort?
None Little Some A lot Very much N/A (Not
Applicable) Use a personal fan Open a window Open a door to the outdoors
Open a door to a corridor Step outside Complain to your manager or superior officer
Complain to the building manager
Talk with others in your group about the problem
Change location temporarily
Change location permanently
Other (please describe)

B.9
Q2.28 All things considered, how satisfied are you with your personal workspace?
Very Dissatisfied Dissatisfied Neutral Satisfied Very Satisfied Q2.29 All things considered, how satisfied are you with the building overall?
Very Dissatisfied Dissatisfied Neutral Satisfied Very Satisfied Q2.30 To what extent does the quality of your building’s interior environment influence your ability to work effectively?
1 2 3 4 5
Strongly interferes with
my work
Strongly enhances my
work
Q3.1 The following questions ask about energy efficiency and energy use in your building. If you don’t work in a permanent location, please answer about the building where you work most frequently.
Q3.2 Considering energy use, in your opinion how efficiently is this building performing?
1 2 3 4 5
Not at all energy
efficient
Very energy efficient
Q3.3 How well informed do you feel about using the energy saving design features in your building?
1 2 3 4 5
Not well informed
Very well informed

B.10
Q3.4 What do you do differently at work as a result of information or training you have received about sustainable behaviors and practices at Ft. Carson?
Q3.5 What do you differently at home as a result of information or training you have received about sustainable behaviors and practices at Ft. Carson? Q3.6 Should energy reduction be a top priority at Ft. Carson at this time?
Yes No Don't know Q3.7 For each of the following features or technologies in your building, please indicate how much experience you have with them and how much training/education you have received to operate them. Experience With Training Received
None A
little Some Consider
able
A great deal N/A None
A little Some
Considerable
A great deal N/A
Automatic day-lighting controls
Programmable temperature controls
Automatic window-darkening technologies
Automatic window controls (to open/close)
Vacancy sensors (manual on; automatic off)
Occupancy sensors (automatic on; automatic off)
Green roofs (rooftop garden)
Other (please describe)
Q4.1 This section asks about your engagement with and perceptions about Ft. Carson’s sustainability and Net Zero Energy efforts.
Q4.2 I am aware that Fort Carson is an Army Net Zero Installation.
Yes No Don't know

B.11
Q4.3 What actions do you take to support Net Zero and sustainability? (Ex: telework, car/van pool, ride a bike to work, walk to meetings, buy things made with recycled materials, buy local or organic food)
Q4.4 Where do you get information about sustainability initiatives or policy at Ft. Carson? Check all that apply.
Do not access or receive information about sustainability initiatives or policy at Ft. Carson Ft. Carson Facebook page Ft. Carson website Email Notices posted in my building Ft. Carson Mountaineer Ft. Carson Annual Sustainability Report My manager/supervisor/commanding officer Department/Unit meetings My colleagues and/or coworkers Ft. Carson policy letters Other (please describe) ____________________ Q4.5 My chain of command considers Ft. Carson’s Net Zero Energy goals important.
Strongly Disagree Disagree Neither Agree nor Disagree Agree Strongly Agree Don't know N/A (Not Applicable) Q4.6 For each of the statements below about your personal views, rate the extent to which you agree or disagree.
Strongly Disagree Disagree
Neither Agree nor Disagree Agree
Strongly Agree
Don't Know
I am aware of Ft. Carson’s Net Zero Energy goals.
I have a positive attitude about Ft. Carson’s Net Zero Energy goals.
I have the skills and abilities to use energy saving technologies correctly at work.
I have time available to work on Ft. Carson’s Net Zero Energy efforts.

B.12
I feel personally responsible for reducing energy use in my building/ department/unit.
I believe reducing the amount of energy used in my building is important.
Q4.7 For each of the statements below about your group/unit, rate the extent to which you agree or disagree.
Strongly Disagree Disagree
Neither Agree nor Disagree Agree
Strongly Agree
Don't Know
My group/unit is aware of Ft. Carson’s Net Zero Energy goals.
My group/unit has a positive attitude about Ft. Carson’s Net Zero Energy goals.
My group/unit has the skills and abilities to use energy saving technologies correctly at work.
My group/unit has sufficient time available to work on Ft. Carson’s Net Zero Energy efforts.
My group/unit feels responsible for reducing energy use in my building/ department/ unit.
My group/unit believes reducing the amount of energy used in my building is important.
My group/unit thinks I should use less energy in our building.

B.13
Q4.8 For each of the statements below about your group/unit, rate the extent to which you agree or disagree.
Strongly Disagree Disagree
Neither Agree nor Disagree Agree
Strongly Agree Don't Know
My group/unit has clear, measurable energy reduction goals.
My group/unit has the resources it needs to reach its energy reduction goals.
My group/unit has the appropriate mix of skills and abilities to reach its energy reduction goals.
Q4.9 For each of the statements below about your manager/superior officer, rate the extent to which you agree or disagree.
Strongly Disagree Disagree
Neither Agree nor Disagree Agree
Strongly Agree
Don't Know
My manager/superior officer has a positive attitude about Ft. Carson’s Net Zero Energy goals.
My manager/superior officer takes energy reduction seriously.
My manager/superior officer leads by personal example to reduce energy use.
My manager/superior officer aligns the department’s resources and processes to support Ft. Carson’s Net Zero Energy goals.
My manager/superior officer expects me to use less energy in my building.
Q4.10 There has been too much emphasis on sustainability at Ft. Carson.
Strongly Disagree Disagree Neither Agree nor Disagree Agree Strongly Agree Don't know
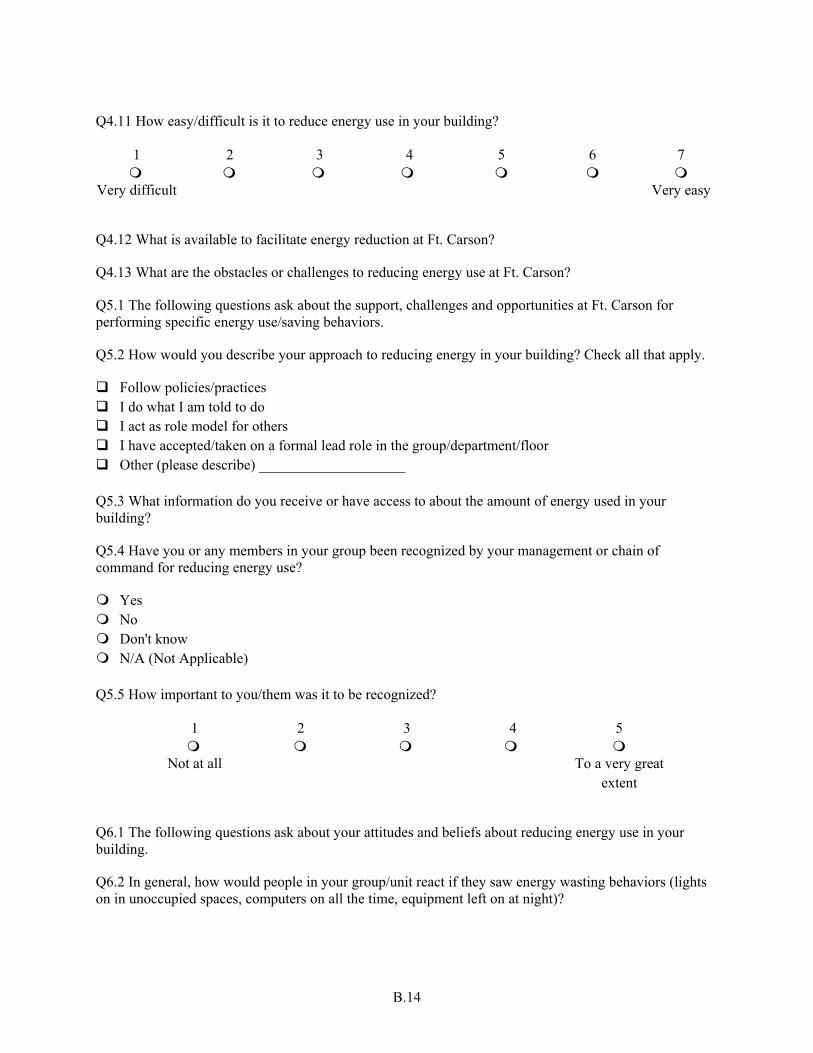
B.14
Q4.11 How easy/difficult is it to reduce energy use in your building?
1 2 3 4 5 6 7
Very difficult Very easy
Q4.12 What is available to facilitate energy reduction at Ft. Carson?
Q4.13 What are the obstacles or challenges to reducing energy use at Ft. Carson?
Q5.1 The following questions ask about the support, challenges and opportunities at Ft. Carson for performing specific energy use/saving behaviors.
Q5.2 How would you describe your approach to reducing energy in your building? Check all that apply.
Follow policies/practices I do what I am told to do I act as role model for others I have accepted/taken on a formal lead role in the group/department/floor Other (please describe) ____________________ Q5.3 What information do you receive or have access to about the amount of energy used in your building?
Q5.4 Have you or any members in your group been recognized by your management or chain of command for reducing energy use?
Yes No Don't know N/A (Not Applicable) Q5.5 How important to you/them was it to be recognized?
1 2 3 4 5
Not at all To a very great extent
Q6.1 The following questions ask about your attitudes and beliefs about reducing energy use in your building.
Q6.2 In general, how would people in your group/unit react if they saw energy wasting behaviors (lights on in unoccupied spaces, computers on all the time, equipment left on at night)?

B.15
Q6.3 The following questions ask about your attitudes and beliefs about reducing energy use in your building.
Definitely
False Probably
False Neither True nor
False Probably True Definitely
True Most of the people I know at Ft. Carson try to reduce energy use in their buildings.
I am confident that if I wanted to I could reduce how much energy I use in my building.
Others expect me to use less energy in my building.
Q6.4 I will make an effort to use less energy in my building.
1 2 3 4 5
Definitely will Definitely will not
Q6.5 What would motivate you to use less energy in your building?

Appendix C –
Building Energy Monitor Roles and Responsibilities

C.1
Building Energy Monitor Roles and Responsibilities
1. What will the Building Energy Monitor (BEM) do?
The BEM’s primary responsibility is to help the Installation Energy Manager achieve an energy efficient installation while maintaining the mission and quality of life. Team efforts are important in achieving this goal. Some of the BEM responsibilities are listed below:
serving as the building point of contact for energy and water resource matters
performing floor checks for problems with building systems that could affect energy use (e.g., heating, cooling, and lighting systems) and for occupant compliance with energy saving guidance (e.g., computer shut down)
initiating work orders for problems identified with building systems and making sure repairs are followed up on in a timely manner
monitoring building energy performance by reviewing monthly energy use data, as available
recommending energy saving changes to your building’s operating procedures
working with occupants on behavior change for energy savings, including implementing specific actions and communicating results.
These responsibilities are covered in more detail in the BEM Handbook and training package.
BEMs supporting the building energy use behavior change intervention in the five pilot buildings will conduct regular building/office checks to make sure that computers, monitors and lights are turned off when offices are left for the day, and that individual office thermostats are set back to a predetermined level below the comfort zone. For buildings with central thermostats, the BEM will work with the facility manager to experiment with lower winter heating settings to determine impact on occupant comfort, as well as nighttime setbacks. Individual building checklists will be provided for this purpose.
The BEM will also act as a “social facilitator” of behaviors that can reduce energy use, by engaging occupants in discussion about the program on a casual basis, complimenting them when they have performed the desired behavior, providing reminders when appropriate, and addressing any problems that may occur. The BEM will also send weekly email messages to building occupants conveying the status of behavior changes, such as what percentage of occupants turned off their computers.
2. How often will the BEM do the periodic checks?
It is recommended that floor checks be performed at least once per week. The more frequently the office checks are performed, the more accurate the data will be.
3. Who does the BEM report to?
The BEM will report to their direct supervisor in the building for which they are responsible, and will provide the checklists and any other communication to the Repair & Utility section of DPW.
4. Desirable characteristics of a BEM
A person taking on the BEM role should have the following characteristics:

C.2
a fundamental interest and commitment to sustainability, energy efficiency and conservation
familiarity with building energy and water systems is desirable, but can be obtained through training.
comfortable engaging building occupants in productive dialogues about ways they can support Fort Carson’s Net Zero Energy goals. The BEM should be an “energy coach” and aim to help occupants without being overly intrusive.
have some level of technical respect from the occupants.
must be able to dedicate two hours per week on average to these responsibilities.

Appendix D –
BEM Floor Check Form

D.1
Building Energy Monitor Checklist for Buildings 1219 and 1118
Date: Building: Number of Occupants: BEM:
Please record estimated percentages and action codes for each floor. Common space includes open office areas, conference rooms, etc.
Floor % Thermostat set back % Monitors off
% Overhead Lights off in unoccupied offices
% Task lights or natural light used instead of overhead
1 – Office space
1 – Common space
2 – Office space
2 – Common space
3 – Office space
3 – Common space
Other observed energy saving practices (note locations)
Other observed energy wasting practices (note locations)
Occupant reports (note type, location)
Physical problems observed (e.g., lighting sensors not working, water leaks, window seals broken, etc.). Note location.
NO = notified occupant WO = called in work order CA = took corrective action

D.2
Instructions for BEM Checklist for Buildings 1219 and 1118
The BEM checklist is used to record your observations of energy saving or energy wasting practices seen during your periodic building walkthroughs, either during end of day or during daily operation. Capturing these practices will require both: e.g., making sure that computer monitors are off after people go home is best done through an end-of-day walkthrough, as is making sure that lights are off, although you can also observe this during the day to determine whether people are leaving lights on in unoccupied offices. Common spaces include conference rooms, open office areas, kitchens, and other space used by multiple occupants.
Because your buildings are fairly large with many private office and common spaces, the best way to use the checklist is to estimate percentages of energy saving or energy wasting practices by making selective observations on each floor during a walkthrough at the end of the day. For example, you might walk through the first floor, and check the thermostats in 10 offices. If the thermostats are set back in 8 of the 10 offices, you would enter “80%” in the appropriate cell on the checklist. A similar procedure would be applied to computer monitors. Note that while computers should also be shut down at night, it will be the network checks (NECs) responsibility to monitor this and share results with the BEMs.
Other observations can be made on a casual basis during the hours that offices are occupied, such as the number or percentage of occupants you see using task lighting or natural light rather than overhead lighting, or the percentage of unoccupied spaces with lights on or off. Practices such as closing window coverings to reduce heat from sunlight can be noted in the rows at the bottom of the form. In addition to observing occupant behavior, you should include any physical aspects of the building that may require attention, such as sensors that aren’t functioning properly, plumbing issues, and poor window or door seals.
For any problems observed, please note any action you have taken, such as notifying occupants or calling in work orders, by using the action codes at the bottom of the form. We do not expect you to capture all energy saving and energy wasting practices; our goal is to get a general sense of the degree to which these things are done.
Floor checks should be completed twice per week. However, if you believe it would be helpful to track certain energy saving behaviors more frequently (e.g., those that occupants are not complying with very well), you may want to do more frequent checks temporarily.
Please email or fax completed checklist each week to: Scott Clark, Energy Program Coordinator, [email protected] or Fax: 719-xxx-xxxx

Appendix E –
Intervention Evaluation Plan
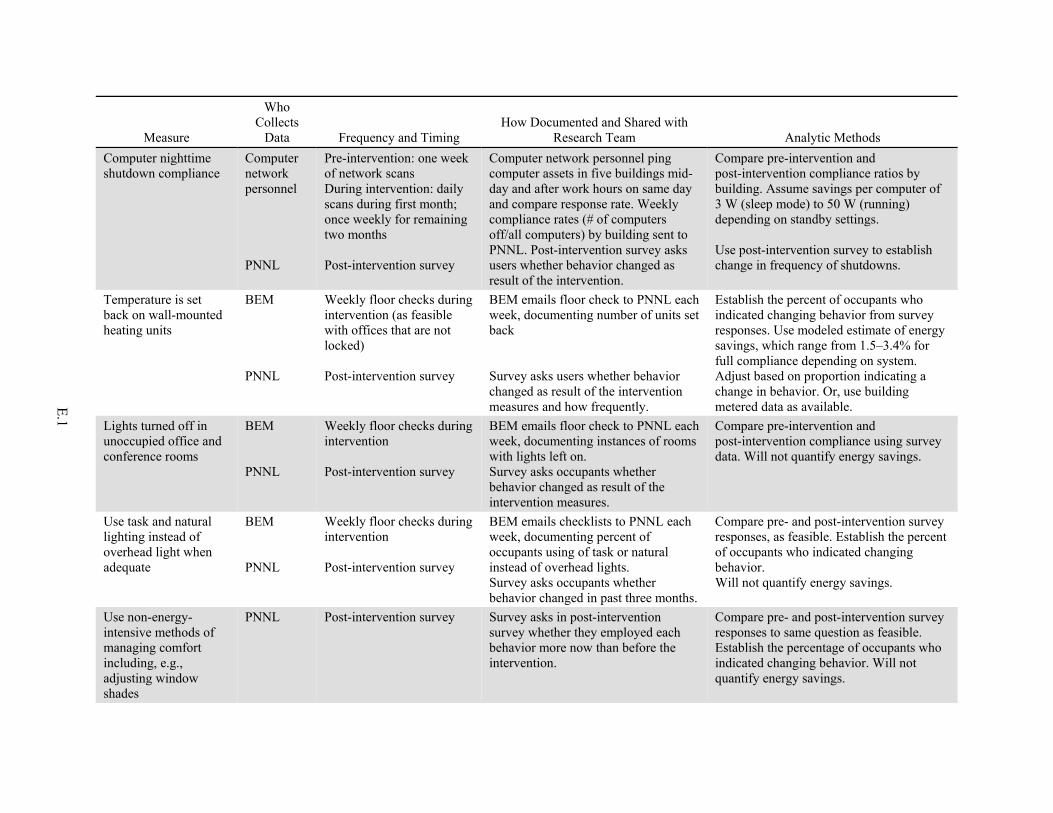
E.1
Measure
Who Collects
Data Frequency and Timing How Documented and Shared with
Research Team Analytic Methods
Computer nighttime shutdown compliance
Computer network personnel PNNL
Pre-intervention: one week of network scans During intervention: daily scans during first month; once weekly for remaining two months Post-intervention survey
Computer network personnel ping computer assets in five buildings mid-day and after work hours on same day and compare response rate. Weekly compliance rates (# of computers off/all computers) by building sent to PNNL. Post-intervention survey asks users whether behavior changed as result of the intervention.
Compare pre-intervention and post-intervention compliance ratios by building. Assume savings per computer of 3 W (sleep mode) to 50 W (running) depending on standby settings. Use post-intervention survey to establish change in frequency of shutdowns.
Temperature is set back on wall-mounted heating units
BEM PNNL
Weekly floor checks during intervention (as feasible with offices that are not locked) Post-intervention survey
BEM emails floor check to PNNL each week, documenting number of units set back Survey asks users whether behavior changed as result of the intervention measures and how frequently.
Establish the percent of occupants who indicated changing behavior from survey responses. Use modeled estimate of energy savings, which range from 1.5–3.4% for full compliance depending on system. Adjust based on proportion indicating a change in behavior. Or, use building metered data as available.
Lights turned off in unoccupied office and conference rooms
BEM PNNL
Weekly floor checks during intervention Post-intervention survey
BEM emails floor check to PNNL each week, documenting instances of rooms with lights left on. Survey asks occupants whether behavior changed as result of the intervention measures.
Compare pre-intervention and post-intervention compliance using survey data. Will not quantify energy savings.
Use task and natural lighting instead of overhead light when adequate
BEM PNNL
Weekly floor checks during intervention Post-intervention survey
BEM emails checklists to PNNL each week, documenting percent of occupants using of task or natural instead of overhead lights. Survey asks occupants whether behavior changed in past three months.
Compare pre- and post-intervention survey responses, as feasible. Establish the percent of occupants who indicated changing behavior. Will not quantify energy savings.
Use non-energy-intensive methods of managing comfort including, e.g., adjusting window shades
PNNL Post-intervention survey Survey asks in post-intervention survey whether they employed each behavior more now than before the intervention.
Compare pre- and post-intervention survey responses to same question as feasible. Establish the percentage of occupants who indicated changing behavior. Will not quantify energy savings.

E.2
Measure
Who Collects
Data Frequency and Timing How Documented and Shared with
Research Team Analytic Methods
Energy saving ideas submitted by occupants
BEM
During intervention Written, verbal correspondence with occupants
BEM emails floor check form to PNNL each week documenting number and nature of ideas submitted.
N/A
Impact of posters and other direct communications on occupant behavior
PNNL Post-intervention survey Survey asks occupants whether they received the communication and asks them to rate the extent to which the referenced communication influenced their behavior.
Impact of BEM correspondence (emails) to occupants on occupant behavior
PNNL Post-intervention survey Survey asks occupants whether they received the specific communication and asks them to rate the extent to which the referenced communication influenced their behavior.
Impact of communications from Ft. Carson Leadership on occupant behavior
PNNL Post-intervention survey Survey asks occupants whether they saw the specific communication and asks them to rate the extent to which the referenced communication influenced their behavior.
BEM follow-through and feedback on role
PNNL Post-intervention interviews with BEMs
Floor checks submitted, Fort Carson Energy Manager follow-up with BEMs, end of project debrief interview
N/A
Appendix F –
Characteristics of Survey Respondents
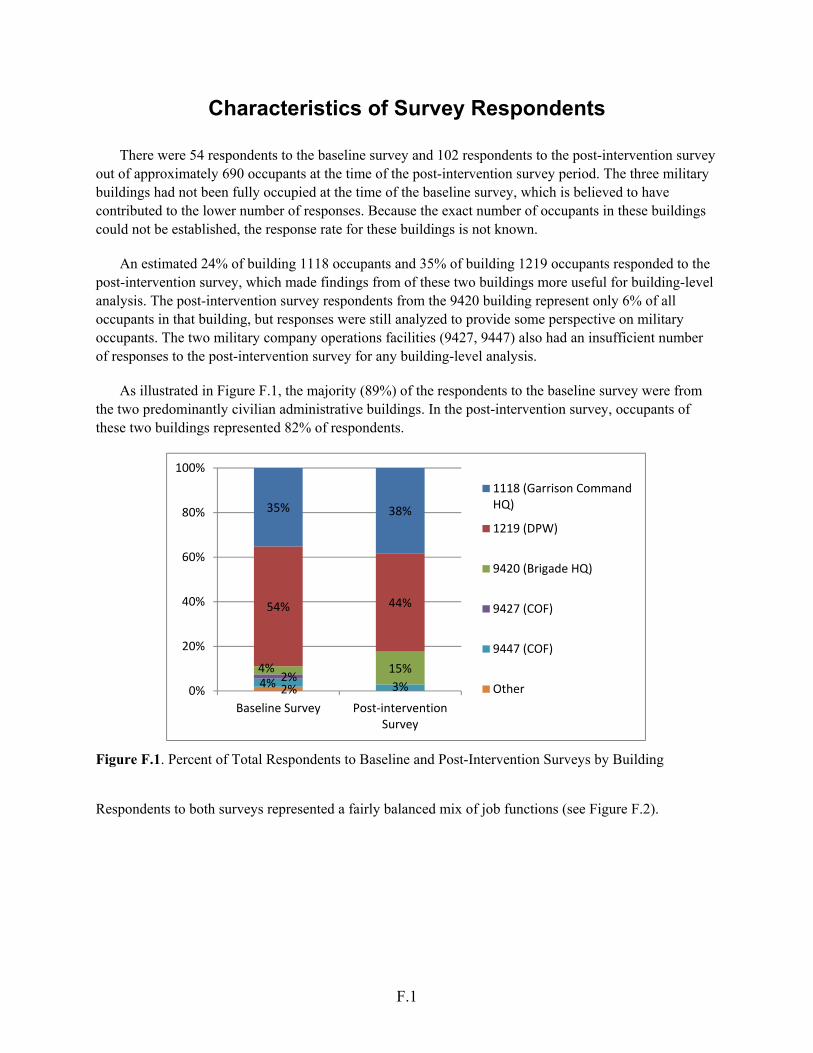
F.1
Characteristics of Survey Respondents
There were 54 respondents to the baseline survey and 102 respondents to the post-intervention survey out of approximately 690 occupants at the time of the post-intervention survey period. The three military buildings had not been fully occupied at the time of the baseline survey, which is believed to have contributed to the lower number of responses. Because the exact number of occupants in these buildings could not be established, the response rate for these buildings is not known.
An estimated 24% of building 1118 occupants and 35% of building 1219 occupants responded to the post-intervention survey, which made findings from of these two buildings more useful for building-level analysis. The post-intervention survey respondents from the 9420 building represent only 6% of all occupants in that building, but responses were still analyzed to provide some perspective on military occupants. The two military company operations facilities (9427, 9447) also had an insufficient number of responses to the post-intervention survey for any building-level analysis.
As illustrated in Figure F.1, the majority (89%) of the respondents to the baseline survey were from the two predominantly civilian administrative buildings. In the post-intervention survey, occupants of these two buildings represented 82% of respondents.
Figure F.1. Percent of Total Respondents to Baseline and Post-Intervention Surveys by Building
Respondents to both surveys represented a fairly balanced mix of job functions (see Figure F.2).
2%4% 3%2%
4% 15%
54% 44%
35% 38%
0%
20%
40%
60%
80%
100%
Baseline Survey Post‐interventionSurvey
1118 (Garrison CommandHQ)
1219 (DPW)
9420 (Brigade HQ)
9427 (COF)
9447 (COF)
Other
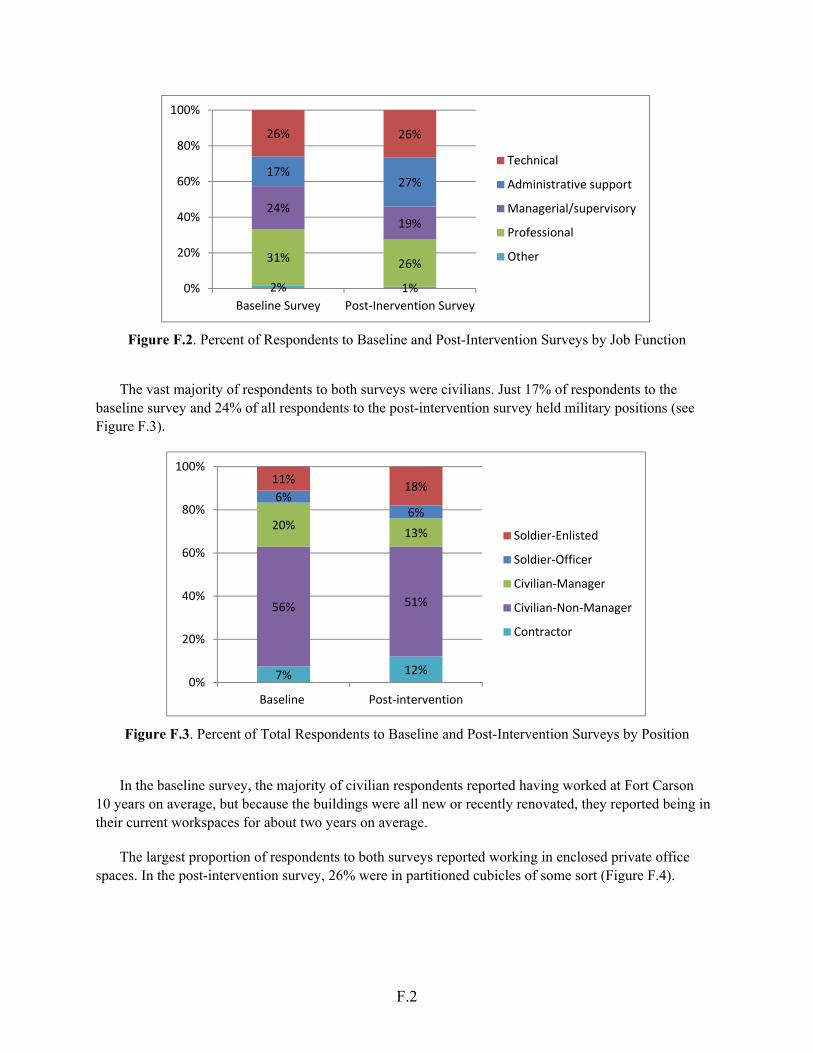
F.2
Figure F.2. Percent of Respondents to Baseline and Post-Intervention Surveys by Job Function
The vast majority of respondents to both surveys were civilians. Just 17% of respondents to the
baseline survey and 24% of all respondents to the post-intervention survey held military positions (see Figure F.3).
Figure F.3. Percent of Total Respondents to Baseline and Post-Intervention Surveys by Position
In the baseline survey, the majority of civilian respondents reported having worked at Fort Carson
10 years on average, but because the buildings were all new or recently renovated, they reported being in their current workspaces for about two years on average.
The largest proportion of respondents to both surveys reported working in enclosed private office spaces. In the post-intervention survey, 26% were in partitioned cubicles of some sort (Figure F.4).
2% 1%
31% 26%
24%19%
17%27%
26% 26%
0%
20%
40%
60%
80%
100%
Baseline Survey Post‐Inervention Survey
Technical
Administrative support
Managerial/supervisory
Professional
Other
7% 12%
56% 51%
20%13%
6%6%
11%18%
0%
20%
40%
60%
80%
100%
Baseline Post‐intervention
Soldier‐Enlisted
Soldier‐Officer
Civilian‐Manager
Civilian‐Non‐Manager
Contractor

F.3
Figure F.4. Percent of Total Respondents to Baseline and Post-Intervention Surveys by Type of Workspace
2% 4%4%11%
21%14%
9%15%
66% 56%
0%
20%
40%
60%
80%
100%
Baseline Post‐Intervention
Enclosed office, private
Cubicles with high partitions (≥5’)
Enclosed office, sharedwith other people
Cubicles with low partitions (<5’)
Workspace in open officewith no partitions

Appendix G –
Email Messages from Building Energy Monitors

G.1
Email Messages from Building Energy Monitors
Week 1 Email
Dear Building [XXXX] Occupants,
This note is to introduce myself, [INSERT NAME], as your Building Energy Monitor (BEM). As a BEM, I support Ft. Carson’s energy conservation program by inspecting our building and by working with you—the occupants of [Building #XXX]—to find ways to save energy.
Energy conservation is a growing priority at Fort Carson as our budgets tighten. Did you know that the energy utility bills cost [insert $ from training slides] per year for our building? As you saw from the email sent by [the Garrison Commander or General Commanding of the 4th Infantry Division] this week, our leaders are committed to reducing these costs, as well as the impact energy use has on our mission readiness and the environment.
How can you help? Start with five simple things:
1. Shut down your computers every night. This is approved by the NEC as a pilot.
2. [For 1219 and 1118 buildings] Turn back your wall-mounted heating units 5 to 10 degrees each night.
[For 9420, 9427, 9447] Use shared appliances and eliminate personal refrigerators, printers, scanners, and space heaters in your workspace.
3. Find ways to manage your comfort without increasing energy use. For example, use your window shades, drink something hot or cold, and dress in layers.
4. Turn off overhead lights when leaving an office or conference room.
5. Use task lights or natural light instead of overhead lights when possible.
Over the next three months, we will be monitoring energy use in our building and tracking how well our occupants follow through with these five actions. The NEC will support this effort by scanning the network each week for computers that are left on at night. I will share feedback with you every few weeks on our performance and any lessons learned. I also encourage you to let me know of energy issues that you are aware of and suggest ideas for energy conservation.
We all want to make sure Ft. Carson achieves its energy objectives—I will appreciate your help in making this happen.
Sincerely,
[BEM Name] [Building] Week 3 Email
Dear Occupants of Buildings 1219 and 1118:

G.2
We are now entering the third week of the three-month period of engaging occupants to help Ft. Carson achieve its energy reduction goals. We appreciate all you are doing to help with this effort. Congratulations to the occupants of Bldg. 1219, which leads the pack in turning off computers during off-hours. Network checks from the NEC indicate that computers in 1219 were shut down 46% of the time during the first two-week period; computers in 1118 were shut down just 13% of the time during this period.
We also saw from floor checks that overhead lights were off in nearly 100% of the unoccupied offices checked in Bldg. 1118, and in some cases overhead lights are being shut off when task or natural light is adequate. In Bldg. 1219, overhead lights were off in just 20–50% of unoccupied offices checked.
Finally, thermostats were set back in nearly 100% of the workspaces checked in 1118. In 1219, just 5% of the work spaces checked had turned back thermostats at night.
This is a great start, but there is obviously some room for improvement. Please consider setting up “reminders to self” for turning off computers and setting back thermostats when you leave at night; we know this is not something you may be accustomed to doing in the past, but this action does make a difference, and we encourage you to make it a habit. Continue to work with us, your Building Energy Monitors (BEMs), on creative approaches to reducing energy usage.
We’ll be providing an update on progress again in two weeks. Can you help us improve our energy reducing actions before then?
Thank you,
[BEM Name] [Building]
Dear Occupants of Buildings 9420, 9427, and 9447,
We are now entering the third week of the three-month period of engaging occupants to help Ft. Carson achieve its energy reduction goals. We appreciate all you are doing to help with this effort.
During floor checks, we observed that occupants of the BBHQ (9420) are turning off overhead lights in unoccupied offices, including overriding lighting sensors when leaving. An estimated 80% of unoccupied offices had lights off, while just 30% of unoccupied shared spaces had lights off.
NEC network checks showed computers were shut down by occupants of these three buildings just 2–4% of the time during this first two-week period. For comparison, occupants of 1219 shut down their computers 46% of the time during the same period. Computer monitors were shut off in the evenings about 10% of time in the BBHQ.
This is a good start with lighting, but there is obviously some room for improvement. Please consider setting up “reminders to self” for turning off computers, monitors, and lights when you leave at night; we know this is not something you may be accustomed to doing in the past, but this action does make a difference, and we encourage you to make it a habit. Continue to work with us, your Building Energy Monitors (BEMs), on creative approaches to reducing energy usage.

G.3
We’ll be providing an update on progress again in two weeks. Can you help us improve our energy reducing actions before then?
Thank you,
[BEM Name] [Building] Week 5 Email
Dear Occupants of Buildings 9420, 9427, 9447, 1219, and 1118:
We are now in the fifth week of the 12-week effort of engaging building occupants to help Ft. Carson achieve its energy reduction goals.
Congratulations to the occupants of Bldg 1118, which has shown the greatest improvement in turning off computers during off-hours! Occupants of 1118 shut down their computers 46% of the time during the last week of March, up from 8% during the first week of March—way to go!! They are catching up with building 1219 occupants who are shutting down computers 49% of the time on average. But please don’t stop there: another 50% savings could be reached if the rest of the occupants turned off their machines.
The three buildings in the 4th BCT are lagging behind. Occupants of two of the 4th BCT buildings have not increased computer shutdown behavior at all. Occupants of 9447 showed a slight improvement. We would like to understand what the barriers to change might be here and would appreciate your input and ideas. Surely the occupants of these buildings can catch up to—and maybe exceed—the levels of 1118 and 1219.

G.4
Shutting down your computer at night is approved by the NEC is one simple thing you can do each day. But there are other ways you can help Fort Carson save energy, save money, and make a difference:
1. Turn off overhead lights when leaving an office or conference room.
2. Use task lights and natural light instead of overhead lighting.
3. Turn back heating units 5 to 10 degrees at the end of the day, if you have a wall-mounted heating unit in your work space.
4. Use window shades and dress in layers to help control your comfort.
5. Use shared refrigerators and coffee makers. Unplug private nonessential appliances and space heaters.
Make energy conservation a habit; consider setting up “reminders to self” for turning off computers, monitors, and lights you leave at night. As your Building Energy Monitors (BEMs), we thank you for your efforts and encourage you to share your creative approaches to reducing energy use at Fort Carson.
Thank you,
[BEM Name] [Building] Week 8 Email
Dear Occupants of Buildings 9420, 9427, 9447, 1219, and 1118:
We have just four weeks left in the pilot project to test how much energy building occupants can help save in Fort Carson buildings!
Efforts to shut down computers at night are taking hold in all five buildings. Occupants of the three 4th BCT buildings have shown a recent improvement with 21% of computers being shut down last week in 9447. The Garrison HQ and DPW buildings had the highest compliance rates a few weeks ago, reaching 59%, but both have lost ground in April.
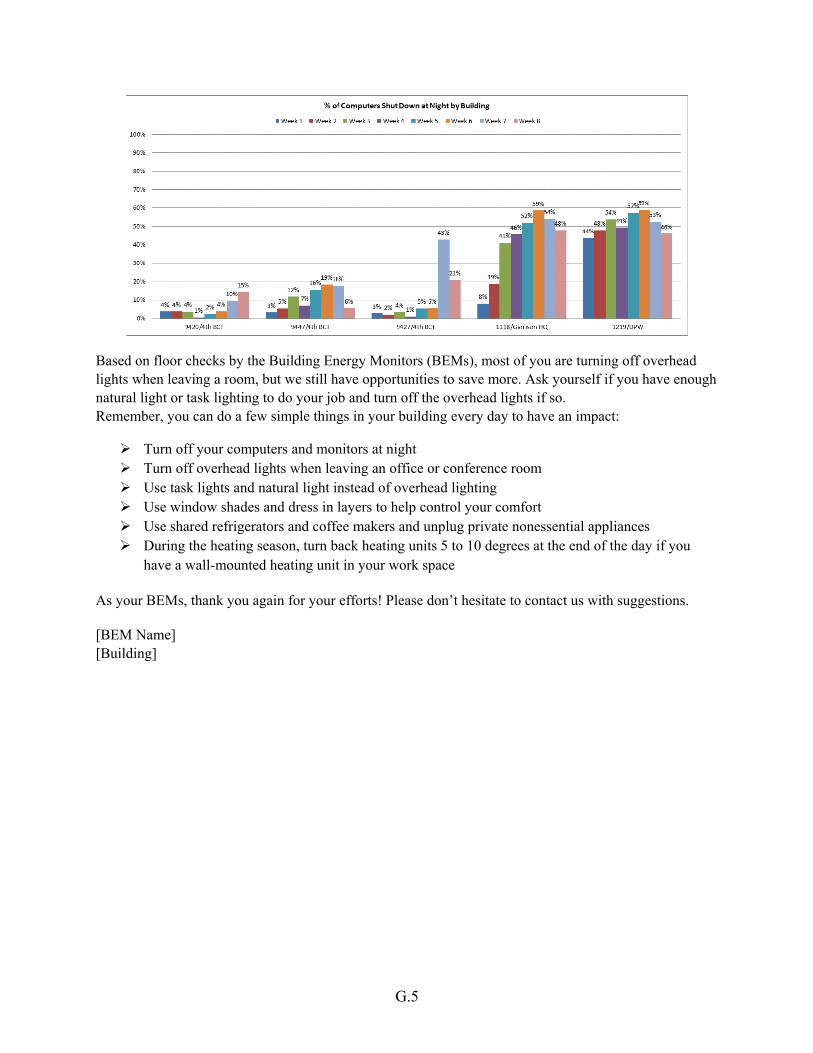
G.5
Based on floor checks by the Building Energy Monitors (BEMs), most of you are turning off overhead lights when leaving a room, but we still have opportunities to save more. Ask yourself if you have enough natural light or task lighting to do your job and turn off the overhead lights if so. Remember, you can do a few simple things in your building every day to have an impact:
Turn off your computers and monitors at night Turn off overhead lights when leaving an office or conference room Use task lights and natural light instead of overhead lighting Use window shades and dress in layers to help control your comfort Use shared refrigerators and coffee makers and unplug private nonessential appliances During the heating season, turn back heating units 5 to 10 degrees at the end of the day if you
have a wall-mounted heating unit in your work space
As your BEMs, thank you again for your efforts! Please don’t hesitate to contact us with suggestions.
[BEM Name] [Building]

Appendix H –
Customized Posters for Civilian and Military Buildings

H.1
Customized Posters for Civilian and Military Buildings
Building 1118 Poster
Building 1219 Poster

H.2

H.3
Buildings 9420, 9427, and 9447 Poster

Appendix I –
Letter from Fort Carson Leadership to Building Occupants

I.1
Letter from Fort Carson Leadership to Building Occupants
Dear Occupants of Building XXXX,
We are writing to request your support of an effort to help save energy in Fort Carson buildings. Because of our strong commitment to Net Zero Energy at Fort Carson, we were invited to collaborate with the General Services Administration on a project to examine your role in reducing building energy use. Your building is one of five at Fort Carson participating in this project.
Energy stewardship is not ancillary to our mission; it is essential to forging readiness. We firmly believe that it enhances our ability to project power, operate in the austere environments, and protect our forces. Our dependence on energy to support our operations has greatly increased, as has the cost of energy. Yet our budgets have tightened dramatically and will continue to do so. If we do not adapt to the reduced availability of energy resources, our ability to project force, sustain our daily operations, and ensure training readiness will be severely impaired.
Energy stewardship must start right here at home, with you. As part of this project on energy saving behavior, I'd like you to do six simple things to become better energy stewards in your buildings:
Shut down your computers and monitors each night. NEC is working to ensure we can do this without security risk during this project.
Turn back heating units when leaving at night. (send to 1219 and 1118 buildings only) Use non-energy-intensive ways to manage your comfort (e.g., drinking something warm). Turn off lights when leaving an office or conference room. Maximize use of task lights and natural light and turn off overhead lights as much as possible. Eliminate personal refrigerators, space heaters, coffee pots, and other small appliances that only
service one or two persons. Use those provided for you in common spaces.
Your Building Energy Monitor (BEM), XXX XXX, will play an important role in this effort to help Fort Carson personnel become leaders in energy stewardship. I've asked your BEMs to observe and track how many of these energy saving practices actually occur and communicate with you on a regular basis about your building's performance. I'll be tracking this as well and will follow up in three months to share with you what we've learned from this project.
Please support your Building Energy Monitor (BEM) and help your co-workers to become better energy stewards support by sharing energy saving ideas that you have.
Thank you for helping Fort Carson to achieve to our Net Zero Energy goals.
Colonel David Grosso Major General Joseph Anderson Garrison Commander Commanding General 4th Infantry Division