THE ROLE OF OATP TRANSPORTERS IN THE ACTIVE … · Tiivistelmä Referat Abstract Active transport...
78
THE ROLE OF OATP TRANSPORTERS IN THE ACTIVE UPTAKE OF DRUGS INTO HEPATOCYTES Helinä Kahma University of Helsinki Faculty of Pharmacy Division of Biopharmaceutics and Pharmacokinetics January 2014
-
Upload
trinhkhanh -
Category
Documents
-
view
214 -
download
0
Transcript of THE ROLE OF OATP TRANSPORTERS IN THE ACTIVE … · Tiivistelmä Referat Abstract Active transport...

THE ROLE OF OATP TRANSPORTERS IN THE ACTIVE UPTAKE OF DRUGS
INTO HEPATOCYTES
Helinä Kahma
University of Helsinki
Faculty of Pharmacy
Division of Biopharmaceutics and
Pharmacokinetics
January 2014
HELSINGIN YLIOPISTO HELSINGFORS UNIVERSITETUNIVERSITY OF HELSINKI
Tiedekunta Fakultet Faculty
Faculty of Pharmacy Osasto Sektion Department
Division of Biopharmaceutics and Pharmacokinetics
TekijäFörfattareAuthor Helinä Kahma Työn nimi Arbetets titelTitle
The role of OATP transporters in the active uptake of drugs into hepatocytes Oppiaine LäroämneSubject Biopharmaceutics and Pharmacokinetics Työn laji Arbetets artLevel
Master’s thesis Aika DatumMonth and year
January 2014 Sivumäärä SidoantalNumber of pages 67
Tiivistelmä Referat Abstract
Active transport processes in the basolateral (sinusoidal) membrane of hepatocytes have an important role in the hepatic clearance and overall disposition for several types of drugs. Organic anion transporting polypeptides (OATPs) expressed in the sinusoidal membrane have been shown to mediate the sodium-independent hepatic uptake of broad range of drugs and they have been associated with clinically relevant drug-drug interactions (DDIs) and genetic polymorphisms. The literature review focuses on sinusoidal OATP transporters and on the pharmacokinetic effects of OATP-mediated hepatic uptake. In addition, current methods to investigate the interactions between drugs and transporters are discussed, with the emphasis on methods applicable to study uptake transporters. The aim of the experimental part of the master’s thesis was to determine if two clinically used drugs, entacapone and fluvastatin, are actively transported from blood into rat and human hepatocytes, and to assess the role of OATP transporters in the hepatic uptake of the drugs in comparison with known OATP substrates, estrone 3-sulfate (E3S) and taurocholic acid and broad OATP inhibitor rifamycin SV. The uptake kinetics of compounds of interest were determined in freshly isolated and cryopreserved rat hepatocytes and in cryopreserved human hepatocytes using the oil-spin method. Uptake clearances (CLuptake) via active uptake (CLactive) and passive diffusion (Pdiff) were calculated from the initial uptake data over a 1 - 200 µM and 1 - 50 µM concentration range for entacapone and fluvastatin, respectively. The half-maximal inhibitor concentration (IC50) of E3S uptake transport was determined for entacapone in a competitive uptake experiment over a 10 – 400 µM concentration range. Fluvastatin uptake showed active saturable transport kinetics in rat hepatocytes with a Km value of 6 µM, whereas entacapone uptake in rat hepatocytes was somewhat linear and did not inhibit E3S uptake at clinically significant concentrations, with an IC50 value of 240 µM. Significantly lower hepatic uptake of taurocholate and entacapone was observed between rat and human hepatocytes, indicating species differences in hepatic uptake processes, although cryopreservation may have had an effect on the noticed difference. The results suggest that murine Oatp transporters do not have a significant contribution to hepatic uptake of entacapone. However, this should be confirmed with future studies with more repetitions and a reliable quantification method. AvainsanatNyckelordKeywords
Hepatic uptake, OATP, fluvastatin, entacapone
SäilytyspaikkaFörvaringställeWhere deposited Department of Biopharmaceutics and Pharmacokinetics
Muita tietojaÖvriga uppgifter Additional information
Supervisors: Timo Korjamo, Marjo Yliperttula
HELSINGIN YLIOPISTO HELSINGFORS UNIVERSITETUNIVERSITY OF HELSINKI
Tiedekunta Fakultet Faculty
Farmasian tiedekunta Osasto Sektion Department
Biofarmasian ja farmakokinetiikan osasto
TekijäFörfattareAuthor Helinä Kahma Työn nimi Arbetets titelTitle
OATP-kuljetinproteiinien rooli lääkeaineiden aktiivisessa soluunotossa maksasoluihin. Oppiaine LäroämneSubject Biofarmasia ja farmakokinetiikka Työn laji Arbetets artLevel
Pro gradu Aika DatumMonth and year
Marraskuu 2013 Sivumäärä SidoantalNumber of pages 67
Tiivistelmä ReferatAbstract Maksasolujen basolateraalisen (sinusoidaalisen) solukalvon aktiivisilla kuljetusmekanismeilla on suuri vaikutus monien lääkeaineiden maksapuhdistumaan sekä laajemmin farmakokineettisiin jakautumis- ja eliminaatiovaiheisiin. Sinusoidaalikalvolla ilmentyvien orgaanisia anioneita kuljettavien polypeptidien (engl. organic anion transporting polypeptides, OATP) on huomattu kuljettavan maksasoluihin laajasti erityyppisiä lääkeaineita. Monien kliinisesti merkittävien lääke-lääkeyhteisvaikutusten on havaittu liittyvän OATP-kuljetinproteiinien estyneeseen tai rajoittuneeseen toimintaan. Samoin useat geneettiset polymorfismit vaikuttavat OATP-substraattien farmakokinetiikkaan, tehoon ja toksisuuteen. Kirjallisuuskatsauksessa tarkastellaan sinusoidaalisten OATP-kuljetinproteiinien vaikutusta lääkkeiden farmakokinetiikkaan sekä tarjolla olevia menetelmiä kuljetinproteiinien tutkimiseen lääkekehityksessä. Erikoistyön tavoitteena oli selvittää, onko fluvastatiinin ja entakaponin soluunotto aktiivista rotan ja ihmisen maksasoluissa, sekä arvioida OATP-kuljetinproteiinien merkitystä näiden lääkkeiden maksasoluunotossa. Lääkeaineiden soluunottokinetiikkaa tutkittiin tuoreissa eristetyissä rotan maksasoluissa sekä pakastetuissa rotan ja ihmisen maksasoluissa käyttäen öljyn läpi -sentrifugointimenetelmää. Soluunoton alkunopeus määritettiin entakaponi-pitoisuuksilla 1 -200 µM ja fluvastatiinipitoisuuksilla 1 - 50 µM. Määritetyistä arvoista arvioitiin aktiivisen (CLactive) ja passiivisen (Pdiff) mekanismin osuudet lääkeaineiden soluunotossa. Lisäksi rotan Oatp-kuljetinproteiinien merkitystä entakaponin soluunottoon tutkittiin pitoisuusalueella 10- 400 µM kilpailevassa soluunottokokeessa Oatp-substraatti estroni-3-sulfaatin kanssa. Fluvastatiinin soluunotto rotan maksasoluihin oli saturoituvaa, ja laskennallinen Km-arvo oli 6 µM. Sitä vastoin entakaponin soluunotto oli lineaarista tutkitulla pitoisuusalueella, eikä estroni-3-sulfaatin soluunotto estynyt kliinisesti merkittävillä entakaponipitoisuuksilla IC50-arvon (puolet maksimaalisesta inhibitiopitoisuudesta) ollessa 240 µM. Entakaponin soluunotto oli huomattavasti alhaisempaa ja hitaampaa ihmisen maksasoluissa verrattuna rotan maksasoluihin, mikä viittaa lajien välisiin eroihin soluuottomekanismeissa. Havainto voi kuitenkin selittyä tuoreiden ja pakastettujen solujen välisillä eroilla. Kokonaisuudessaan tulokset viittaavat siihen, että entakaponi ei ole fluvastatiinin tavoin rotan Oatp-kuljetinproteiinien substraatti. Tulosten luotettavuus tulisi kuitenkin vahvistaa uusissa kokeissa käyttäen rinnakkaisia määrityksiä ja luotettavaa menetelmää näytteiden lääkeainepitoisuuksien määrittämiseksi. AvainsanatNyckelordKeywords
Aktiivinen soluunotto, maksasolu, OATP, fluvastatiini, entakaponi SäilytyspaikkaFörvaringställeWhere deposited Biofarmasian ja farmakokinetiikan osasto
Muita tietojaÖvriga uppgifter Additional information
Ohjaajat: Timo Korjamo, Marjo Yliperttula

TABLE OF CONTENTS
1 INTRODUCTION ..................................................................................................... 1
2 ACTIVE TRANSPORT IN THE LIVER .................................................................. 2
2.1 Liver Function and Drug Metabolism ................................................................ 2
2.2 Structure of the Liver Parenchyma .................................................................... 3
2.3 Hepatocyte Membrane Transporters .................................................................. 4
2.4 Organic Anion Transporting Polypeptides ......................................................... 6
3 PHARMACOKINETIC EFFECTS OF HEPATIC OATP TRANSPORTERS ........ 9
3.1 Saturable Transport and Hepatic Drug Clearance .............................................. 9
3.2 Drug-Drug Interactions .................................................................................... 10
3.3 Pharmacogenetics and Interindividual Variability ........................................... 11
4 METHODS FOR EVALUATION OF DRUG INTERACTIONS WITH UPTAKE
TRANSPORTERS ................................................................................................... 13
4.1 OATP Transporters in Drug Development ...................................................... 13
4.2 Membrane Based Assays ................................................................................. 15
4.3 Cell Based Assays ............................................................................................ 16
4.3.1 Common Cell Models ............................................................................... 16
4.3.2 Uptake Assays ........................................................................................... 17
4.3.3 Cytotoxicity Assay .................................................................................... 20
4.3.4 Transcellular Transport Assays ................................................................ 20
4.4 In Silico Methods ............................................................................................. 22
4.4.1 Computational Modeling .......................................................................... 22
4.4.2 Pharmacokinetic Models ........................................................................... 23
4.5 Intact Organ and in Vivo Models ..................................................................... 24
4.5.1 Genetic and Chemical Knockout Models ................................................. 25
4.5.2 Imaging ..................................................................................................... 26
5 AIM OF THE STUDY ............................................................................................ 28
6 MATERIALS AND METHODS ............................................................................ 28
6.1 Drugs and Chemicals ....................................................................................... 28
6.1.1 Entacapone and Fluvastatin ...................................................................... 28
7.1.2 Model Substrates ....................................................................................... 29
7.1.3 Control Compounds .................................................................................. 29
7.1.4 Hepatocyte Medium .................................................................................. 29
7.2 Hepatocytes ...................................................................................................... 30
7.3 Cellular Uptake Experiments ........................................................................... 31
7.4 Sample Preparation .......................................................................................... 32
7.4.1 Sample Preparation for Liquid Scintillation Analysis .............................. 32
7.4.2 Sample Preparation for UPLC/MS Analysis ............................................ 33
7.5 Quantification and Metabolite Screening......................................................... 33
7.5.1 Quantification of Radiolabeled Samples .................................................. 33
7.5.2 Quantification of Non-Radiolabeled Samples .......................................... 33
7.5.3 Fluvastatin Metabolite Screening ............................................................. 34
7.6 Data Analysis ................................................................................................... 34
7 RESULTS ................................................................................................................ 35
7.1 Cell Viability and Non-Specific Binding ......................................................... 35
7.2 Kinetic Evaluation of Taurocholate, Fluvastatin and Entacapone Uptake ...... 36
7.3 Fluvastatin Metabolism .................................................................................... 41
7.4 Inhibition Studies ............................................................................................. 42
8 DISCUSSION .......................................................................................................... 45
8.1 Uptake Kinetics of Taurocholate and Estrone 3-Sulfate .................................. 45
8.2 Fluvastatin Uptake and Metabolism................................................................. 47
8.3 Uptake Kinetics of Entacapone ........................................................................ 50
8.4 Use of Non-Radiolabeled Compounds in the Oil-Spin Method ...................... 51
9 CONCLUSIONS ..................................................................................................... 52
REFERENCES ............................................................................................................... 53

APPENDICES
APPENDIX 1 Summary of Nonlinear Regression Analysis of Taurocholate and
Fluvastatin Uptake
APPENDIX 2 Summary of Nonlinear Regression Analysis of E3S Inhibition by
Rifamycin and Entacapone
APPENDIX 3 Peak Areas of Fluvastatin and its Metabolites in UPLC/MS Analysis

ABBREVIATIONS
ABC ATP-binding cassette
ATP Adenosine triphosphate
AUC Area under the plasma concentration-time curve
BCRP Breast cancer resistant protein
BSEP Bile salt export pump
Cmax Maximun plasma concentration
CLint Intrinsic clearance for metabolism and/or biliary excretion
CLint,all Overall hepatic clearance
CLuptake Hepatic uptake clearance
COMT Catechol O-methyltransferase
CYP Cytochrome P450
DDI Drug-drug interaction
EMA European medicines agency
E3S Estrone 3-sulfate
FDA United States Food and drug administration
HEPES 4-(2-hydroxyethyl)-piperazine-1-ethanesulfonic acid
ICT International transporter consortium
IC50 Half maximal inhibitory concentration
KHB Krebs-Henseleit buffer
Km Michaelis-Menten constant
LLC-PK1 Pig kidney proximal tubule epithelial cell line
MATE Multidrug and toxin extrusion transporter
MDCK Madin-Darby canine kidney cell line
MRP Multidrug resistance-associated protein
MS Mass spectrometry
NTCP Na+-taurocholate co-transporting polypeptide
OAT Organic anion transporter
OATP Organic anion transporting polypeptide
OCT Organic cation transporter
OST Organic solute transporter

Pdiff Passive hepatic uptake clearance
P-gp P-glycoprotein
QTOF Quadrupole time-of-flight
SLC Solute carrier
Tris base Tris(hydroxymethyl)aminomethane
t1/2 Elimination half-life
UPLC Ultra performance liquid chromatography
V Hepatic uptake rate
Vmax Maximum hepatic uptake rate
1
1 INTRODUCTION
Cell membrane transporters have a significant role in drug elimination by the liver. For
several types of drugs, the active transport of the compound through the basolateral
membrane of hepatocytes has been demonstrated to be not only an important
determinant of the hepatic clearance of drugs but also the rate-limiting step for drug
disposition as a whole (Simonson et al. 2004; Shitara et al. 2006; Maeda et al. 2011).
Consequently, the inhibition or induction of hepatic transporters may cause a notable
change in drug concentration in the liver and plasma and result in inefficacy or
increased toxicity. Also drug-drug interactions and inter-individual variability in the
expression and functionality of hepatic transporters may similarly affect safety and
efficacy of drugs.
Given the importance of transporters on pharmacokinetics, efficacy and toxicity of
drugs, there has been a lot of interest in developing effective models for evaluating
drug-transporter interactions. Characterization of a compound as a transporter substrate
or inhibitor early in the drug development process aids in the selection of dosing
regimen and may lead to the design and conduct of drug-drug interaction studies, or
evaluation of the outcomes of possible genetic polymorphisms (Giacomini et al. 2010).
The objective of the literature review of this master’s thesis is to consider the
pharmacokinetic effects of active transport on the basolateral membrane of hepatocytes,
and to provide an overview of the available methods of studying drug-transporter
interactions. The focus is on hepatic organic anion transporting polypeptide (OATP)
transporters OATP1B1 and -1B3 which have shown to be involved in the hepatic uptake
of an increasing number of clinically used drugs.
The hepatic uptake two drugs, fluvastatin and entacapone, is further examined in the
experimental part. Hepatic uptake is a prerequisite for the pharmacologic effect of
antihyperlipidemic HMG-CoA reductase inhibitors such as fluvastatin and the main
route of elimination for most of statins including fluvastatin is via the bile after
metabolism by the liver (Dansette et al. 2000; Schachter 2005). Thus, inhibition or

2
altered activity of active hepatic uptake of statins may be a major mechanism of reduced
efficacy and toxic effects such as myopathy. Similar to fluvastatin, catechol O-
methyltransferase (COMT) inhibitor entacapone used in the treatment of Parkinson’s
disease is considered a high clearance drug with significant first-pass metabolism and it
appears to be eliminated mainly via biliary excretion (Wikberg et al. 1993; Heikkinen et
al. 2001). OATPs have been identified to have a significant contribution for hepatic
uptake of fluvastatin (Noe et al. 2007; Greupink et al. 2011). However, no published
data about hepatic transport mechanisms of entacapone are available and role of hepatic
uptake transporters on entacapone pharmacokinetics is unclear. In the present study, the
role of OATPs in the sinusoidal uptake of entacapone is evaluated in comparison with
fluvastatin and known substrates of OATP-mediated transport.
2 ACTIVE TRANSPORT IN THE LIVER
2.1 Liver Function and Drug Metabolism
The liver is responsible for the majority of drug metabolism in the body due to a very
high concentration of most of the drug metabolizing enzymes and a unique blood supply
from the digestive organs (Murray et al. 1988; de Waziers et al. 1990; Lakehal et al.
1999). Majority of the blood leaving the digestive system passes through the hepatic
portal vein and is then delivered to the liver parenchyma where the contents of the blood
are processed before being passed on to other parts of the body (Vollmar and Menger
2009). The functions of the liver include metabolism, storage and synthesis of glucose
and lipids, synthesis and degradation of proteins and glycoproteins, as well as
metabolism and degradation of several hormones and xenobiotics, such as drugs
(Jungermann and Kietzmann 1996). Accordingly, the essential role of the liver is to
regulate the entry of nutrients and xenobiotics into the body.
The purpose of hepatic drug metabolism is to facilitate the excretion of drugs in urine or
bile by chemical modification to more water soluble forms. Hepatic metabolism process
can be divided into three phases, where phase I consists of mainly oxidation, reduction

3
and hydrolysis reactions catalyzed by cytochrome P450 enzymes (CYPs), followed by
further enzymatic conjugation reactions with charged species such as glutathione,
sulfate, glycine, or glucuronic acid in phase II, and finally excretion of metabolites out
of the cells in phase III (Ishikawa 1992; Roberts et al. 2002; Nakata et al. 2006).
2.2 Structure of the Liver Parenchyma
The liver is formed by parenchymal cells, i.e. hepatocytes, and nonparenchymal cells,
including sinusoidal endothelial cells, phagocytic Kupffer cells, hepatic stellate cells,
and intrahepatic lymphocytes (Ishibashi et al. 2009). Hepatocytes constitute almost 80 %
of the total volume of the liver and perform the majority of the organ’s metabolic
functions (Blouin et al. 1977; Ishibashi et al. 2009). The parenchyma is composed of
structural units referred to as lobules, roughly hexagonal prisms with portal tracts - each
with a portal venule, a hepatic arteriole and a bile duct - at each of the corners (Figure 1)
(Ishibashi et al. 2009). Blood from the portal tracts flows through small sinusoids lining
single layers of hepatocytes, and into the central vein that forms the hub of the lobule.
Bile flows the opposite way from small bile canaliculi running between hepatocytes to
the interlobular bile ducts of the portal tracts. Each layer of hepatocytes is thus
separated by either a sinusoid or a bile canaliculus. The interconnecting layers of
hepatocytes radiate from the central vein to the periphery forming the six-sided shape of
the lobule.
Hepatic elimination process involves the uptake of xenobiotics from the sinusoidal
blood into hepatocytes where enzymatic metabolism occurs, followed by excretion
either into bile or back into sinusoidal blood with subsequent elimination by other
organs, such as kidney (Kusuhara and Sugiyama 2010). The specialized structure of
hepatocytes enables the flux of substrates through the hepatobiliary system. Hepatocytes
are highly polarized epithelial cells with three distinct membrane domains (Hubbard et
al. 1983). The basal domain, characterized by irregular microvilli, is a large surface
facing the space between porous sinusoidal endothelial cells and hepatocytes, known as
the space of Disse or perisinusoidal space (Hubbard et al. 1983; Jungermann and
Kietzmann 1996).

4
Figure 1. Lobular structure of the liver. The hepatocytes in a liver lobule form a series
of irregular plates arranged in hexagonal prisms. (Martini and Nath 2011).
Also called the sinusoidal membrane, the basal surface is specialized for exchange of
solutes with plasma in the perisinusoidal space. The lateral domain is a smooth surface
contiguous to a neighboring lateral membrane and it bears several types of junctional
elements, such as tight junctions, desmosomes, and gap junctions (Hubbard et al. 1983).
Separated from the lateral membrane by tight junctions, the apical membrane is a small
microvillous area known as canalicular membrane. The canalicular membrane is
specialized for bile secretion into bile canaliculi via numerous efflux transporters. The
canalicular membranes of adjacent hepatocytes form the walls of the bile canaculi.
2.3 Hepatocyte Membrane Transporters
The highly fenestrated membrane of sinusoidal endothelial cells allows passage of
substances carried in the blood into the perisinusoidal space, from where they can be
taken up into hepatocytes through the sinusoidal membrane (Fraser et al. 1978; Braet
and Wisse 2002; Geraud et al. 2012). Small lipophilic molecules may pass the
5
membrane by simple or facilitated diffusion (FDA 2000). However, the exchange of
some lipophilic and various amphipathic and polar substances is actively facilitated
against electrochemical potential gradient by several membrane bound transport
proteins. The majority of basolateral uptake transporters belong to the gene superfamily
of solute carriers (SLC), including the Na+-taurocholate co-transporting polypeptide
(NTCP), organic anion transporting polypeptides (OATPs), and organic anion and
cation transporters (OATs, OCTs) (Figure 2) (Faber et al. 2003; Chandra and Brouwer
2004).
Figure 2. Membrane transporters in human hepatocytes. Basolateral influx transporters
(black) transport drugs from sinusoidal blood into hepatocytes where they are
metabolized. Efflux transporters (grey) pump the metabolites either into bile or back
into blood (Fahrmayr et al. 2010).
Efflux transporters belonging to the adenosine triphosphate (ATP) binding cassette
(ABC) superfamily are mainly expressed on the canalicular membrane, including ABCB
family members P-glycoprotein (P-gp), and bile salt export pump (BSEP), the ABCC
family member multidrug resistance associated protein 2 (MRP2), and the ABCG family
member breast cancer resistant protein (BCRP) (Figure 2) (Faber et al. 2003; Chandra
6
and Brouwer 2004). Also multidrug and toxin extrusion transporter (MATE1), a non-
ABC transporter that uses the proton gradient as a driving force, has been identified in
the canalicular membrane (Otsuka et al. 2005). A variety of MRPs and a non-ABC
transporter, heteromeric organic solute transporter (OST) OSTα-OSTβ, are also
expressed in the basolateral membrane pumping metabolites back into sinusoidal blood
(Faber et al. 2003; Ballatori et al. 2005). Consequently, the substrate specificity of
efflux pumps in the canalicular and basolateral membrane direct the way drug
metabolites are excreted, i.e. via the bile or via the urine.
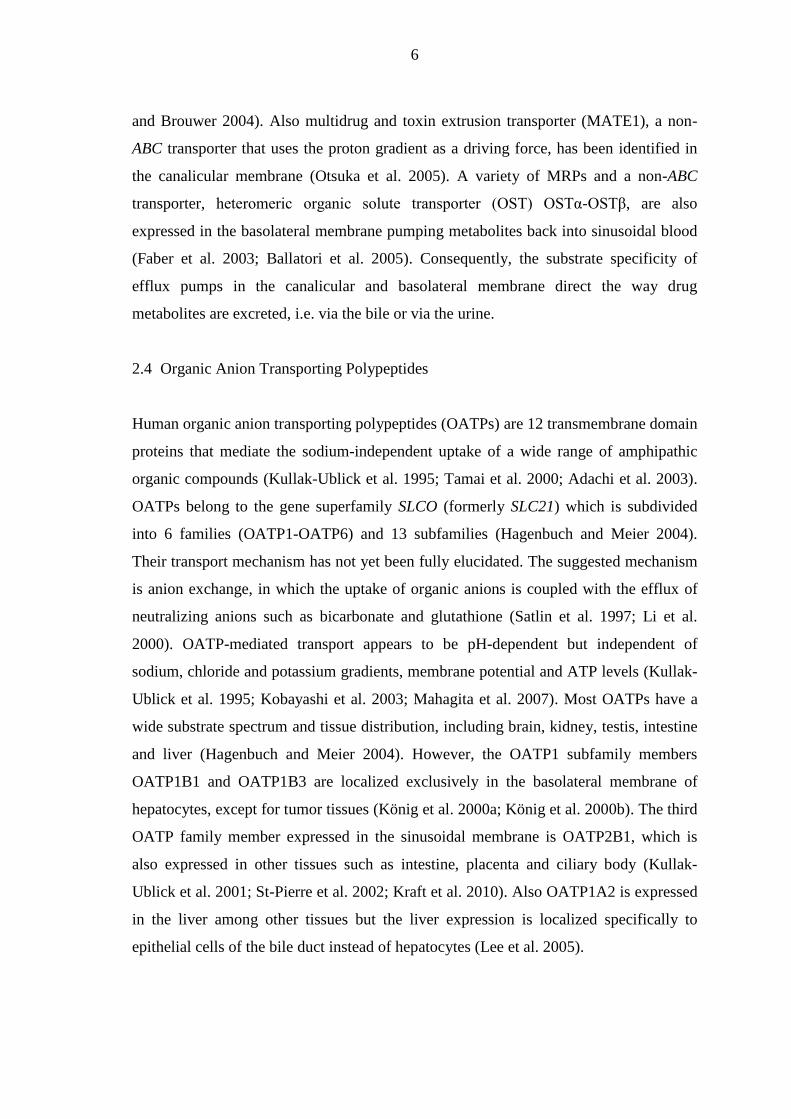
2.4 Organic Anion Transporting Polypeptides
Human organic anion transporting polypeptides (OATPs) are 12 transmembrane domain
proteins that mediate the sodium-independent uptake of a wide range of amphipathic
organic compounds (Kullak-Ublick et al. 1995; Tamai et al. 2000; Adachi et al. 2003).
OATPs belong to the gene superfamily SLCO (formerly SLC21) which is subdivided
into 6 families (OATP1-OATP6) and 13 subfamilies (Hagenbuch and Meier 2004).
Their transport mechanism has not yet been fully elucidated. The suggested mechanism
is anion exchange, in which the uptake of organic anions is coupled with the efflux of
neutralizing anions such as bicarbonate and glutathione (Satlin et al. 1997; Li et al.
2000). OATP-mediated transport appears to be pH-dependent but independent of
sodium, chloride and potassium gradients, membrane potential and ATP levels (Kullak-
Ublick et al. 1995; Kobayashi et al. 2003; Mahagita et al. 2007). Most OATPs have a
wide substrate spectrum and tissue distribution, including brain, kidney, testis, intestine
and liver (Hagenbuch and Meier 2004). However, the OATP1 subfamily members
OATP1B1 and OATP1B3 are localized exclusively in the basolateral membrane of
hepatocytes, except for tumor tissues (König et al. 2000a; König et al. 2000b). The third
OATP family member expressed in the sinusoidal membrane is OATP2B1, which is
also expressed in other tissues such as intestine, placenta and ciliary body (Kullak-
Ublick et al. 2001; St-Pierre et al. 2002; Kraft et al. 2010). Also OATP1A2 is expressed
in the liver among other tissues but the liver expression is localized specifically to
epithelial cells of the bile duct instead of hepatocytes (Lee et al. 2005).
7
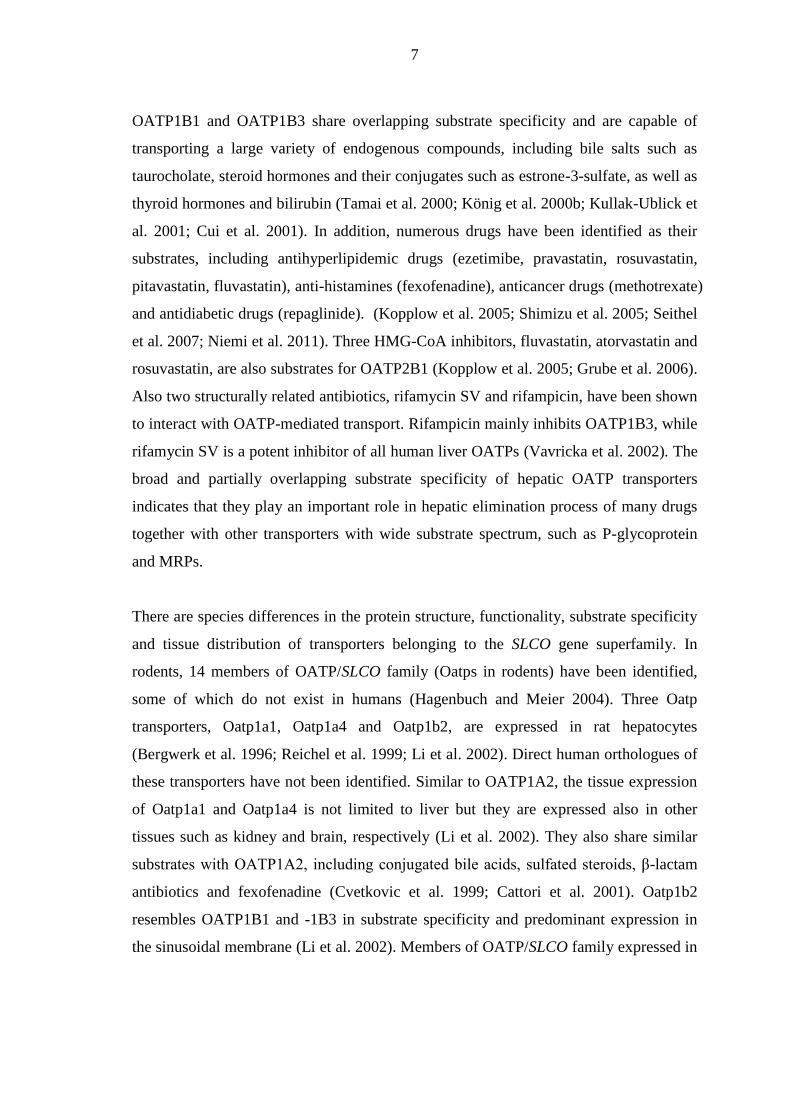
OATP1B1 and OATP1B3 share overlapping substrate specificity and are capable of
transporting a large variety of endogenous compounds, including bile salts such as
taurocholate, steroid hormones and their conjugates such as estrone-3-sulfate, as well as
thyroid hormones and bilirubin (Tamai et al. 2000; König et al. 2000b; Kullak-Ublick et
al. 2001; Cui et al. 2001). In addition, numerous drugs have been identified as their
substrates, including antihyperlipidemic drugs (ezetimibe, pravastatin, rosuvastatin,
pitavastatin, fluvastatin), anti-histamines (fexofenadine), anticancer drugs (methotrexate)
and antidiabetic drugs (repaglinide). (Kopplow et al. 2005; Shimizu et al. 2005; Seithel
et al. 2007; Niemi et al. 2011). Three HMG-CoA inhibitors, fluvastatin, atorvastatin and
rosuvastatin, are also substrates for OATP2B1 (Kopplow et al. 2005; Grube et al. 2006).
Also two structurally related antibiotics, rifamycin SV and rifampicin, have been shown
to interact with OATP-mediated transport. Rifampicin mainly inhibits OATP1B3, while
rifamycin SV is a potent inhibitor of all human liver OATPs (Vavricka et al. 2002). The
broad and partially overlapping substrate specificity of hepatic OATP transporters
indicates that they play an important role in hepatic elimination process of many drugs
together with other transporters with wide substrate spectrum, such as P-glycoprotein
and MRPs.
There are species differences in the protein structure, functionality, substrate specificity
and tissue distribution of transporters belonging to the SLCO gene superfamily. In
rodents, 14 members of OATP/SLCO family (Oatps in rodents) have been identified,
some of which do not exist in humans (Hagenbuch and Meier 2004). Three Oatp
transporters, Oatp1a1, Oatp1a4 and Oatp1b2, are expressed in rat hepatocytes
(Bergwerk et al. 1996; Reichel et al. 1999; Li et al. 2002). Direct human orthologues of
these transporters have not been identified. Similar to OATP1A2, the tissue expression
of Oatp1a1 and Oatp1a4 is not limited to liver but they are expressed also in other
tissues such as kidney and brain, respectively (Li et al. 2002). They also share similar
substrates with OATP1A2, including conjugated bile acids, sulfated steroids, β-lactam
antibiotics and fexofenadine (Cvetkovic et al. 1999; Cattori et al. 2001). Oatp1b2
resembles OATP1B1 and -1B3 in substrate specificity and predominant expression in
the sinusoidal membrane (Li et al. 2002). Members of OATP/SLCO family expressed in
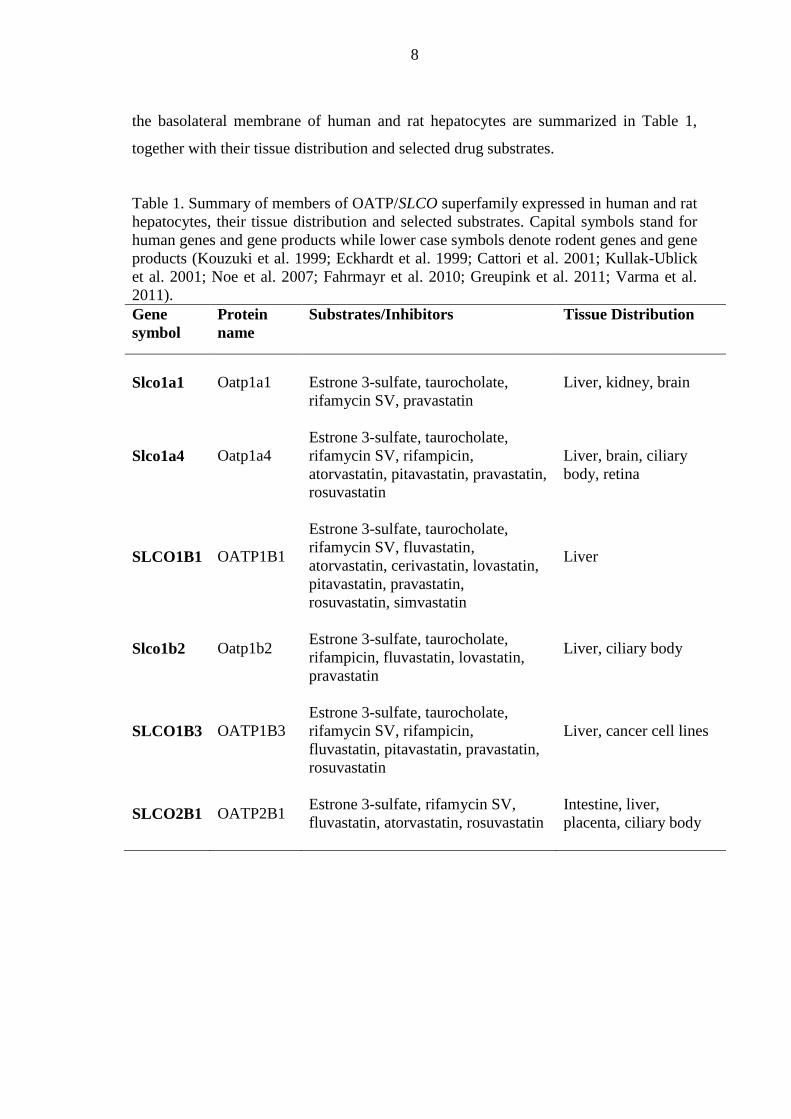
8
the basolateral membrane of human and rat hepatocytes are summarized in Table 1,
together with their tissue distribution and selected drug substrates.
Table 1. Summary of members of OATP/SLCO superfamily expressed in human and rat
hepatocytes, their tissue distribution and selected substrates. Capital symbols stand for
human genes and gene products while lower case symbols denote rodent genes and gene
products (Kouzuki et al. 1999; Eckhardt et al. 1999; Cattori et al. 2001; Kullak-Ublick
et al. 2001; Noe et al. 2007; Fahrmayr et al. 2010; Greupink et al. 2011; Varma et al.
2011).
Gene
symbol
Protein
name
Substrates/Inhibitors Tissue Distribution
Slco1a1 Oatp1a1
Estrone 3-sulfate, taurocholate,
rifamycin SV, pravastatin
Liver, kidney, brain
Slco1a4 Oatp1a4
Estrone 3-sulfate, taurocholate,
rifamycin SV, rifampicin,
atorvastatin, pitavastatin, pravastatin,
rosuvastatin
Liver, brain, ciliary
body, retina
SLCO1B1 OATP1B1
Estrone 3-sulfate, taurocholate,
rifamycin SV, fluvastatin,
atorvastatin, cerivastatin, lovastatin,
pitavastatin, pravastatin,
rosuvastatin, simvastatin
Liver
Slco1b2 Oatp1b2
Estrone 3-sulfate, taurocholate,
rifampicin, fluvastatin, lovastatin,
pravastatin
Liver, ciliary body
SLCO1B3 OATP1B3
Estrone 3-sulfate, taurocholate,
rifamycin SV, rifampicin,
fluvastatin, pitavastatin, pravastatin,
rosuvastatin
Liver, cancer cell lines
SLCO2B1 OATP2B1
Estrone 3-sulfate, rifamycin SV,
fluvastatin, atorvastatin, rosuvastatin
Intestine, liver,
placenta, ciliary body

9
3 PHARMACOKINETIC EFFECTS OF HEPATIC OATP TRANSPORTERS
3.1 Saturable Transport and Hepatic Drug Clearance
The transport capacity of the membrane transporters is limited. The transport process is
saturable when the rate of transport ceases to increase in direct proportion to substrate
concentration and approaches an upper limit (Rowland and Tozer 2011). Active,
saturable transport follows Michaelis-Menten kinetics, where the rate of transport
approaches a maximum, Vmax, by the relationship:
Equation 1
in which Km is the Michaelis-Menten constant and S is the substrate concentration at the
transporter binding site. At substrate concentrations well below Km, rate of transport and
substrate concentration vary in direct proportion and the transport kinetics is linear.
However, at concentrations above Km, the kinetics become nonlinear and show
saturability as the transport rate approaches the value of Vmax. Nonlinearity of saturable
transport processes in drug elimination can be problematic since it may cause unwanted
drug accumulation with increasing doses.
Cooperation of uptake and efflux transporters in transcellular transport of drugs and
their metabolites has an essential role in the hepatic elimination process and may have a
major impact on the systemic clearance and exposure of many drugs (Zamek-
Gliszczynski et al. 2006; Nies et al. 2008). In addition to transporter-mediated pathways,
drug transport across the hepatic membranes occurs also by passive diffusion. The
importance of transporters in the hepatic clearance depends on the contribution of both
the transporter-mediated pathways and the passive processes. The permeation clearance
of unbound drugs for influx across sinusoidal membrane is comprised of transporter-
mediated uptake clearance (PSinf,act) and passive diffusional clearance (PSdiff) (Shitara et
al. 2013). The overall hepatic clearance (CLint,all) consists of permeation clearances of
unbound drugs for uptake and efflux across the sinusoidal membrane (PSinf and PSeff,
10
respectively) and the intrinsic clearance for metabolism and/or biliary excretion (CLint)
(Equation 2).
Equation 2
For highly permeable drugs, neither active uptake nor efflux is the rate-limiting step in
the overall hepatic clearance (Giacomini et al. 2010). However, most anionic drugs, as
well as some hydrophilic organic cationic and zwitterionic drugs have poor membrane
permeability (FDA 2000). For these drugs, membrane permeation is mainly dependent
on active processes and uptake or efflux clearances can be rate-determining in some
cases (Giacomini et al. 2010). Active hepatic uptake becomes the rate-determining
process of the overall hepatic clearance when sinusoidal efflux clearance is negligible
and CLint is much larger than passive diffusional clearance (Shitara et al. 2013).
3.2 Drug-Drug Interactions
Due to the wide substrate specificity of OATP transporters, many simultaneously
administered drugs compete of the same transporter binding sites causing saturation of
transport capacity and inhibition of drug uptake. In addition, not all OATP inhibitors are
OATP substrates but inhibit the uptake via other mechanisms. OATP-mediated drug-
drug interactions (DDIs) may be clinically significant when OATP-mediated uptake is
the rate-determining process of the overall hepatic clearance. This has been reported to
be the case for many statins, such as atorvastatin, pravastatin and rosuvastatin. In a
clinical study by Maeda et al. (2011), the oral coadministration of OATP1 inhibitor
rifampicin increased the AUC (area under the plasma concentration-time curve) of
atorvastatin, while coadministration of CYP3A4 inhibitor itraconazole did not change
the plasma exposure of atorvastatin, although atorvastatin is metabolized by CYP3A4.
The effects were similar for pravastatin, which is only minimally metabolized in the
liver. Simonson et al. (2004) have published similar results for rosuvastatin when
coadministered with immunosupressant cyclosporine, another OATP1 inhibitor. The
AUC and maximum plasma concentration (Cmax) values for rosuvastatin were increased
significantly in heart transplant recipients on an antirejection regimen including

11
cyclosporine. In addition to rifampicin and cyclosporine, also antidiabetic drug
repaglinide and macrolide antibiotics clarithromycin, erythromycin and roxithromycin
have been shown to inhibit the OATP1B1 and -1B3-mediated uptake of pravastatin in in
vitro studies (Jacobson 2004; Seithel et al. 2007; Bachmakov et al. 2008). Antidiabetic
drug rosiglitazone, on the other hand, has been found to stimulate pravastatin uptake in
vitro (Bachmakov et al. 2008). This finding suggests that also drug-induced stimulation
of OATP1 mediated transport could cause alterations in drug plasma concentrations.
Elevated statin plasma concentrations caused by OATP-mediated DDIs increase the risk
for statin-induced side effects, such as myopathy and rhabdomyolysis (Thompson et al.
2003; Generaux et al. 2011). Moreover, the uptake of statins into hepatocytes is
essential for their inhibitory action of microsomal HMG-CoA reductase (Dansette et al.
2000). Thus, reduced hepatic uptake of statins may also lead to decreased drug efficacy.
Knowledge on the drug-drug interactions of the third basolateral SLCO transporter
OATP2B1 is much more partial than for OATP1B1 and -1B3 (Fahrmayr et al. 2010).
Only a few drugs have been identified as OATP2B1 substrates compared to OATP1B1
and -1B3 (Tamai et al. 2000; Kopplow et al. 2005; Grube et al. 2006). One in vitro
study by Noe et al. (2007) showed that gemfibrozil, fibrate used to treat
hypercholesterolemia, inhibited OATP2B1-mediated uptake at high concentrations.
Overall, inhibition of OATP-mediated hepatic uptake may have a substantial effect on
drug disposition, safety and efficacy together with other causes of drug interactions,
such as inhibition or induction of metabolizing enzymes. The clinical relevance of
OATP1 inhibition depends on the contribution of OATPs to the total hepatic clearance
and overall drug disposition of substrate drugs (Shitara et al. 2013). OATP1 substrates
can be also substrates of other transporters and transporters may have multiple binding
sites, which makes the estimation of the transporter contribution more complex.
3.3 Pharmacogenetics and Interindividual Variability
Apart from drug-drug interactions, also genetic polymorphisms in OATPs affect the
pharmacokinetics of substrate drugs causing interindividual variability in drug response
12
and safety. Similar to DDIs, altered activity of OATP transporters caused by genetic
variations can result in undesirable systemic exposure of substrate drugs which may
lead to drug accumulation and organ toxicity (Giacomini et al. 2013). Over 40 single-
nucleotide polymorphisms (SNPs) have been identified in the SLCO1B1 gene coding
OATP1B1 (Tirona et al. 2001; Fahrmayr et al. 2010). The effect of genetic variations on
the OATP1B1-mediated transport of HMG-CoA reductase inhibitors has been
investigated in numerous studies both in vitro and in vivo (Kameyama et al. 2005;
Pasanen et al. 2006; Deng et al. 2008; Rodrigues et al. 2011). Significant interindividual
differences in plasma concentrations have been reported for statins such as atorvastatin,
simvastatin and pravastatin (Niemi et al. 2004; Pasanen et al. 2006; Niemi et al. 2006;
Deng et al. 2008). Niemi et al. demonstrated also that reduced uptake of pravastatin in
patients expressing mutated OATP1B1 proteins caused significantly lower
pharmacological effect on cholesterol synthesis (Niemi et al. 2005). Decreased hepatic
uptake and elevated plasma concentrations caused by OATP1B1 polymorphisms have
been reported also for several other drugs than statins, such as ezetimibe, repaglinide,
lopinavir and methotrexate (Oswald et al. 2008; Kalliokoski et al. 2008; Hartkoorn et al.
2010; Ramsey et al. 2012).
Polymorphisms in the genes coding OATP1B3 and OATP2B1 have not been as
comprehensively studied (Fahrmayr et al. 2010; Schwarz et al. 2011). Recent study by
Nies et al. (2013) suggests that the expression of OATP1B3 and OATP2B1 is not
significantly influenced by genetic variants but interindividual variability of these
transporters is caused by non-genetic factors. In addition to genotype, number of other
factors such as gender, age, disease state or the regulation of transporter expression may
be causes of interindividual variability in transporter action. In the study by Nies et al.
(2013), liver condition cholestasis resulted in reduced OATP1B1 and -1B3 expression
levels in liver. Also a gender-related difference in pharmacokinetics of pravastatin has
been reported in a study that compared the effects of OATP1B1 polymorphism on
pharmacokinetics of pravastatin (Niemi et al. 2006). However, the current data about
non-genetic factors in interindividual variability of OATP transporters is scarce and
further studies are needed. Also the significance of polymorphisms in SLCO1B3 and
SLCO2B1 genes remains unclear and needs to be further elucidated.
13
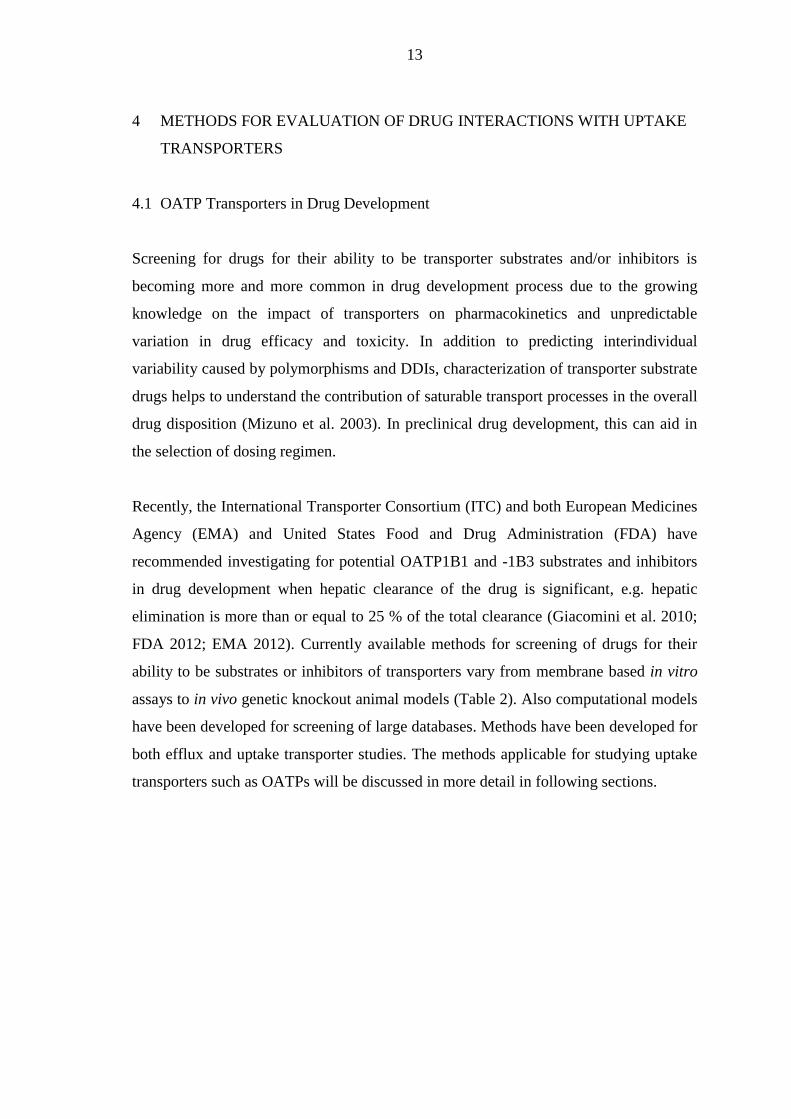
4 METHODS FOR EVALUATION OF DRUG INTERACTIONS WITH UPTAKE
TRANSPORTERS
4.1 OATP Transporters in Drug Development
Screening for drugs for their ability to be transporter substrates and/or inhibitors is
becoming more and more common in drug development process due to the growing
knowledge on the impact of transporters on pharmacokinetics and unpredictable
variation in drug efficacy and toxicity. In addition to predicting interindividual
variability caused by polymorphisms and DDIs, characterization of transporter substrate
drugs helps to understand the contribution of saturable transport processes in the overall
drug disposition (Mizuno et al. 2003). In preclinical drug development, this can aid in
the selection of dosing regimen.
Recently, the International Transporter Consortium (ITC) and both European Medicines
Agency (EMA) and United States Food and Drug Administration (FDA) have
recommended investigating for potential OATP1B1 and -1B3 substrates and inhibitors
in drug development when hepatic clearance of the drug is significant, e.g. hepatic
elimination is more than or equal to 25 % of the total clearance (Giacomini et al. 2010;
FDA 2012; EMA 2012). Currently available methods for screening of drugs for their
ability to be substrates or inhibitors of transporters vary from membrane based in vitro
assays to in vivo genetic knockout animal models (Table 2). Also computational models
have been developed for screening of large databases. Methods have been developed for
both efflux and uptake transporter studies. The methods applicable for studying uptake
transporters such as OATPs will be discussed in more detail in following sections.
14
Table 2. Methods used for evaluation of drug-transporter interactions.
Method Type Application in Drug Development
In vitro methods
Membrane based assays
Membrane vesicular transport assay
Screening of substrates/inhibitors of
uptake/efflux transporters
ATPase assay
Evaluation of transport function of
efflux transporters
Photolabeling assay
Evaluation of binding sites and
affinities of efflux transporters
Cell based assays
Uptake assay
Screening of substrates/inhibitors of
uptake/efflux transporters
Cytotoxicity assay
Screening of inhibitors of
uptake/efflux transporters
Transcellular transport assay
Evaluation of vectorial transport
function of efflux and uptake
transporters, permeation studies
In silico methods
Computational models
Prediction of substrate and inhibitor
binding to uptake/efflux transporters
Pharmacokinetic models
Calculation of kinetic parameters,
in vitro/in vivo extrapolation of
pharmacokinetic data
Ex situ methods
Isolated organ models
Prediction of in vivo transporter
binding and contribution to drug
disposition
In vivo methods
Genetic/chemical knockout models
Evaluation of physiological function
of transporters and contribution to
drug disposition
Imaging
Visualization of transporter function
in vivo, qualitative and quantitative
evaluation of transporter function

15
4.2 Membrane Based Assays
Membrane based assays have been mainly used to characterize substrates and inhibitors
of ATP-dependent ABC efflux pumps (Jedlitschky et al. 1997; Kis et al. 2009; Heredi-
Szabo et al. 2013). Only one membrane based assay, the membrane vesicular transport
assay, can be used to identify substrates and inhibitors of uptake transporters. In the
assay, membrane vesicles expressing transporters of interest with substrate binding site
facing outwards are incubated in a buffer mixture containing the drug (Meier et al.
1984). Substrates of the transporter are taken up into the vesicles and rapid filtration is
used to separate the vesicles from the incubation solution. The test compound trapped
inside the vesicles is retained on the filter and the transported molecules can be
quantified by liquid chromatography / mass spectrometry (LC/MS), fluorescence
detector or liquid scintillation counting. The membrane vesicles can be prepared from
different sources such as transporter transfected or over-expressed cells and different
tissue samples. NTCP function and substrates have been studied using rat liver
sinusoidal membrane vesicles (Meier et al. 1984; Koopen et al. 1997). Since NTCP is a
sodium dependent transporter, the assessment of NTCP activity is based on the
difference of drug accumulation in the presence and absence of sodium. OATPs,
however, are Na+-independent transporters which makes the method inapplicable for
screening of OATP substrates.
The membrane vesicular transport assay has the advantage of being relatively easy to
conduct and feasible for high-throughput screening (Giacomini et al. 2010). It is an
effective method to determine transporter functions and to define detailed kinetic
analyses for substrate or inhibitor interaction. Its disadvantage is that highly lipophilic
compounds may have non-specific binding to lipid membranes or high passive diffusion
which may cause false negative results (Xia et al. 2007). In addition, membrane vesicles
obtained from tissue samples may be problematic if they are not purified and contain
many varied transporters. This may limit their usefulness for evaluating the interaction
of a particular transporter with a given compound.
16
4.3 Cell Based Assays
Cell based assays are often more labor intensive and time consuming than membrane
based assays but they may provide more comprehensive information about drug-
transporter interactions due to intact cell structure and function. Cell based assay
systems can be used for transporter substrate and inhibitor screening, assessment of
transport mechanisms and transporter-mediated DDIs, and for determining the rate-
limiting step in trans-epithelial transport.
4.3.1 Common Cell Models
Array of cell based systems used in the transporter interaction studies include primary
cells, sandwich-cultured primary hepatocytes, polarized cell lines without recombinant
transporters, single- and multiple transfected cell lines and Xenopus laevis oocytes.
Primary cells isolated from intact tissue express the full spectrum of transporters present
in a particular tissue. They are useful in investigation of the mechanistic interplay
between uptake and efflux transporters and metabolism, as well as clinically relevant
drug interactions (Soars et al. 2009). However, the polarization of the cells is quickly
lost after isolation and the expression and localization of transporters may change over
time in cell cultures (LeCluyse et al. 1996; Yang et al. 2012). The polarity of primary
hepatocytes can be regenerated when cells are cultured in a sandwich configuration
between two layers of collagen gel (LeCluyse et al. 1994; Liu et al. 1999). Sandwich-
cultured hepatocytes can be used to estimate both hepatic uptake and efflux of drugs
and in vivo biliary clearance.
Immortalized polarized cell lines are used to study vectorial transport and they enable
the measuring of flux of substrates in two directions (apical to basolateral and vice versa)
(Giacomini et al. 2010). They are standard methods to evaluate intestinal absorption and
blood-brain barrier permeation. Some of the most used cell lines are human colon
epithelial cancer cell line Caco-2, Madin-Darby canine kidney cell line (MDCK) and
pig kidney proximal tubule epithelial cell line (LLC-PK1). Caco-2 cells express a large
variety of transporters specific for intestinal epithelium while endogenous expression

17
level of transporters is low in MDCK and LLC-PK1 cells (Goh et al. 2002; Ahlin et al.
2009). MDCK and LLC-PK1 cells are often transfected with a single or multiple
recombinant transporters. Recombinant transporter cell lines can be used for
quantitative drug transport studies and to investigate transporter polymorphisms and
species differences in transporter function. Several recombinant MDCK cell lines
expressing OATP transporters have been developed, including OATP1B1 and MRP2
double transfected cells and OATP1B1, OATP1B3, OATP2B1 and MRP2 quadruple-
transfected cells (Kopplow et al. 2005; Matsushima et al. 2005). Although the
endogenous expression level of MDCK and LLC-PK1 cells is low, the contribution of
the endogenous transporters should also be taken into account when using transfected
cell lines (Goh et al. 2002).
Xenopus laevis oocytes are also widely used for transporter studies (Xia et al. 2007).
Transporter mRNA or cDNA can be microinjected into oocytes and the cells perform
the translation and post-translational modification which leads to appropriate transporter
expression on the cell membrane (Sigel and Minier 2005). Oocytes have low
endogenous transporter expression which makes them a good system for characterizing
transporter substrates and inhibitors and determining kinetic analyses for drug-
transporter interactions (Sobczak et al. 2010). Similar to single- or multiple transfected
mammalian cells, they can also be used to study transporter polymorphisms and species
differences of transporters (Xia et al. 2007). However, disadvantage of oocytes is a
rather short expression turnaround time of a transporter. In addition, oocyte systems are
only suitable for medium throughput screening due to the arduous microinjection
method.
4.3.2 Uptake Assays
The involvement of a given influx transporter in drug uptake can be assessed using
uptake assays. In uptake assays, the amount of test compound accumulated in the
transporter-expressing cell is measured and the relative contribution of transporter is
assessed comparing the uptake into control cells (Xia et al. 2007; Soars et al. 2009).
Either isolated cells in suspension or cells seeded in 96-well tissue culture plates can be
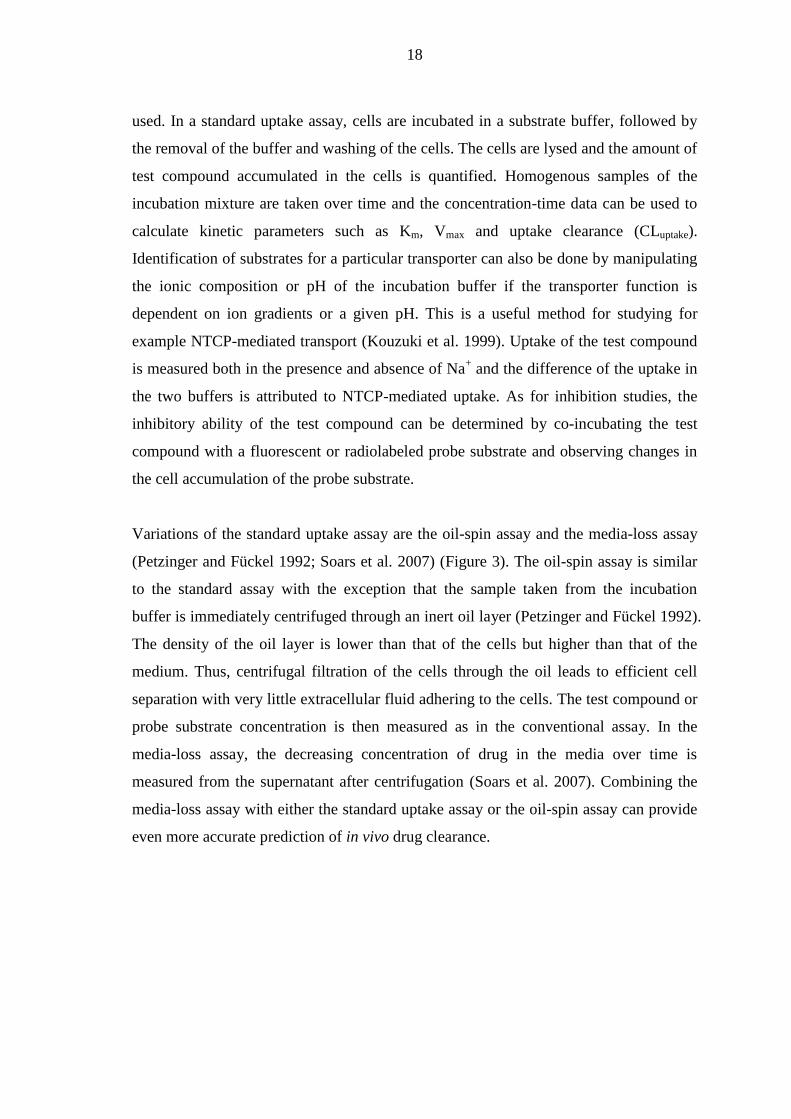
18
used. In a standard uptake assay, cells are incubated in a substrate buffer, followed by
the removal of the buffer and washing of the cells. The cells are lysed and the amount of
test compound accumulated in the cells is quantified. Homogenous samples of the
incubation mixture are taken over time and the concentration-time data can be used to
calculate kinetic parameters such as Km, Vmax and uptake clearance (CLuptake).
Identification of substrates for a particular transporter can also be done by manipulating
the ionic composition or pH of the incubation buffer if the transporter function is
dependent on ion gradients or a given pH. This is a useful method for studying for
example NTCP-mediated transport (Kouzuki et al. 1999). Uptake of the test compound
is measured both in the presence and absence of Na+ and the difference of the uptake in
the two buffers is attributed to NTCP-mediated uptake. As for inhibition studies, the
inhibitory ability of the test compound can be determined by co-incubating the test
compound with a fluorescent or radiolabeled probe substrate and observing changes in
the cell accumulation of the probe substrate.
Variations of the standard uptake assay are the oil-spin assay and the media-loss assay
(Petzinger and Fückel 1992; Soars et al. 2007) (Figure 3). The oil-spin assay is similar
to the standard assay with the exception that the sample taken from the incubation
buffer is immediately centrifuged through an inert oil layer (Petzinger and Fückel 1992).
The density of the oil layer is lower than that of the cells but higher than that of the
medium. Thus, centrifugal filtration of the cells through the oil leads to efficient cell
separation with very little extracellular fluid adhering to the cells. The test compound or
probe substrate concentration is then measured as in the conventional assay. In the
media-loss assay, the decreasing concentration of drug in the media over time is
measured from the supernatant after centrifugation (Soars et al. 2007). Combining the
media-loss assay with either the standard uptake assay or the oil-spin assay can provide
even more accurate prediction of in vivo drug clearance.

19
Figure 3. Different uptake assay formats. Media-loss assay and oil-spin assay differ
from the standard assay in a way cells are separated from the incubation buffer.
Sampling is followed by rapid centrifugation and the formed supernatant and cell pellets
are further analyzed (Soars et al. 2009).
Human cryopreserved hepatocytes are a good cell model to study hepatic drug uptake
since they express all the endogenous hepatic transporters. There can, however, be large
interbatch differences in the uptake activities of cryopreserved hepatocytes (Shitara et al.
2003). Another downside is their high price. For this reason, also cryopreserved rat
hepatocytes are widely used in uptake studies, together with transporter expressing cells
such as MDCK cells, human embryonic kidney 293 (HEK293) cells and Xenopus laevis
oocytes.
Uptake assays require multiple steps for washing or centrifuging, sample collection,
transferring and processing. Thus, uptake assays have rather low throughput, especially
if no fluorescent or radiolabeled substrates are used. One way to enhance the throughput
is to use scintillation proximity assay (SPA) technology where transporter expressing
cells are directly grown in Cytostar-T scintillating microplates (Bonge et al. 2000).
Uptake of radiolabeled transporter substrates is measured in real time in a microplate
scintillation counter as radioisotopes are transported into proximity with the scintillation
plate base. The method has been used for transporter inhibitor identification using
radiolabeled substrates of for example OATP1B1, OAT3 and OCT1 (Lohmann et al.
2007).
20
4.3.3 Cytotoxicity Assay
Another method for identifying transporter substrates and inhibitors is to measure the
accumulation of cytotoxic compounds in cells. In the cytotoxicity assay, cytotoxic
transporter substrates can be identified by comparing the IC50 (the concentration that
inhibits the cell growth by 50 %) in control cells and cells expressing the transporter
(Xia et al. 2007). Inhibitors of uptake transporters can be indirectly identified by their
ability to decrease the cytotoxic effects of a known substrate, while inhibitors of efflux
pumps can be identified by observing potential increase in the cytotoxicity (Xia et al.
2007; Kis et al. 2009; Ding et al. 2011). Cytotoxicity assays are applicable for high
throughput screening of transporter substrates but it is only usable for cytotoxic
compounds. Inhibitor studies only give indirect results and the results are best to
confirm with other methods.
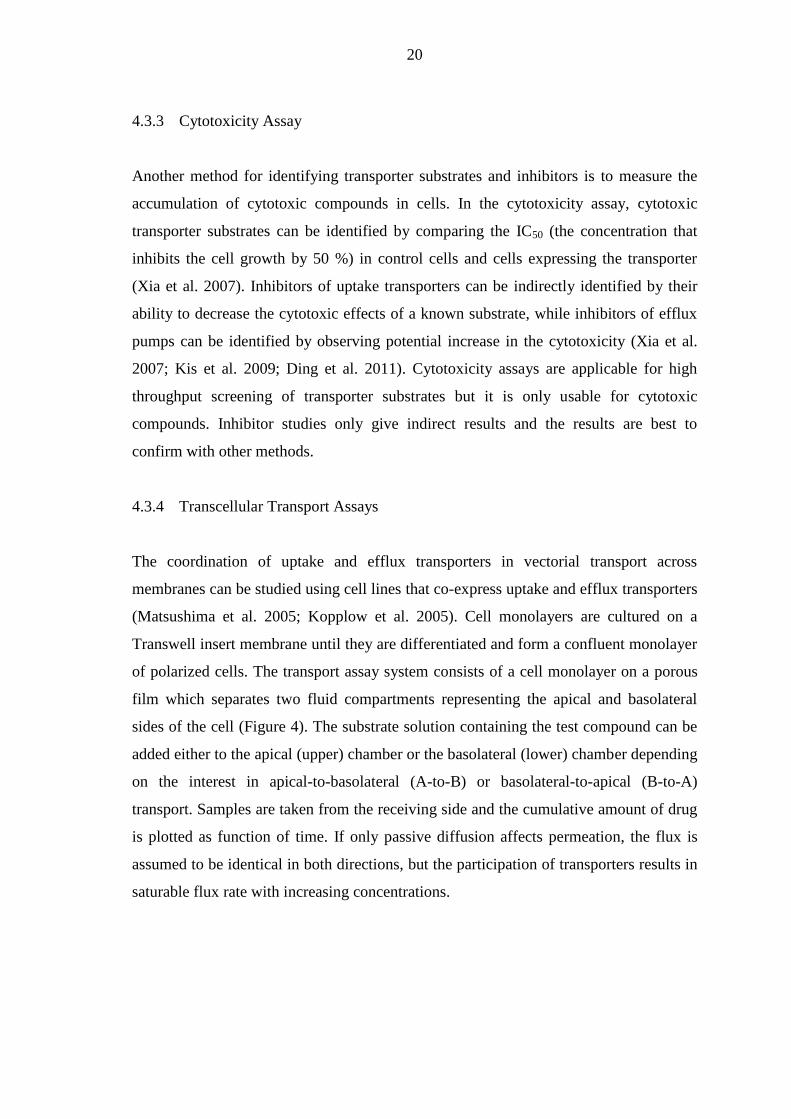
4.3.4 Transcellular Transport Assays
The coordination of uptake and efflux transporters in vectorial transport across
membranes can be studied using cell lines that co-express uptake and efflux transporters
(Matsushima et al. 2005; Kopplow et al. 2005). Cell monolayers are cultured on a
Transwell insert membrane until they are differentiated and form a confluent monolayer
of polarized cells. The transport assay system consists of a cell monolayer on a porous
film which separates two fluid compartments representing the apical and basolateral
sides of the cell (Figure 4). The substrate solution containing the test compound can be
added either to the apical (upper) chamber or the basolateral (lower) chamber depending
on the interest in apical-to-basolateral (A-to-B) or basolateral-to-apical (B-to-A)
transport. Samples are taken from the receiving side and the cumulative amount of drug
is plotted as function of time. If only passive diffusion affects permeation, the flux is
assumed to be identical in both directions, but the participation of transporters results in
saturable flux rate with increasing concentrations.
21
Figure 4. Transwell system used in transport assays. Upper chamber represents the
apical side and lower chamber represents the basolateral side (Xia et al. 2007).
Double or multiple transfected cell lines can be used to demonstrate the contribution of
an individual transporter to hepatic excretion. For example, the vectorial transport of
OATP1B1 and OATP1B3 substrate olmesartan was studied using three different
doubly- transfected MDCKII cell lines (Matsushima et al. 2005). The efflux transporter
MRP2 responsible for the hepatic excretion of olmesartan was identified conducting
transport assays in OATP1B3/MRP2, OATP1B3/P-gp and OATP1B3/BCRP double
transfectants. Caco-2 cell monolayers are also used to investigate uptake and efflux
transporter function using specific transporter inhibitors or probe substrates. However,
transporter studies using Caco-2 cells may be non-specific due to the expression of
multiple transporters in Caco-2 cells (Ahlin et al. 2009). There is also heterogeneity in
transporter expression between different Caco-2 cell lines (Hayeshi et al. 2008). A
novel approach to study the function of a particular transporter is to silence the
expression of transporter genes by chemically synthesized RNA interference molecules
(Yue et al. 2009). This method may enable the selective knock-down of endogenous
transporter genes in mammalian cell lines.
Transport studies with transfected cell lines may not be good for predicting in vivo drug
disposition and clearance due to the lack of endogenous variety of uptake and efflux
transporters and metabolizing enzymes. Drugs may be substrates of multiple uptake and
efflux transporters in intact organs and therefore transfected cells might not provide
22
knowledge on the complete mechanism for trans-cellular transport (Bartholome et al.
2007). Even Caco-2 cells that express multiple intestinal transporters vary in the
transporter expression profile compared with primary intestinal epithelial cells
(Taipalensuu et al. 2001). However, transport studies with Caco-2 cells provide a rather
good method for prediction of drug intestinal permeability.
4.4 In Silico Methods
In silico modeling can be used in the early drug discovery and development phases as
high-throughput methods to screen lead molecules for their potential to be transporter
inhibitors and substrates. Together with in vitro methods, they aid in choosing
compounds that have favorable characteristics for further development. In the
preclinical phase, pharmacokinetic modeling is used to predict pharmacokinetics in
humans and relationships between saturable active and passive transport can be
examined in detail.
4.4.1 Computational Modeling
Computational modeling methods fill the gap between in vitro transporter properties
and the knowledge on structural mechanisms of transporters on atomic level. They offer
tools to predict ligand- and inhibitor-binding to transporters and to screen large
databases for possible transporter substrates. In silico methods can be divided into
structure-based approaches and substrate-based techniques (Chang and Swaan 2006).
Structure-based models, such as homology or comparative modeling, are used to
generate three-dimensional models of transporters based on available crystallographic
data of appropriate template proteins. Homology and comparative models are based on
the mutual sequence similarity of a template protein and the target protein. The model is
usually constructed by applying the structural information of a template protein in the
generation of a three dimensional structure of the target protein.
Substrate-based models, such as pharmacophore and 3D-QSAR (quantitative structure-
activity relationship) modeling, are used to describe transporter protein’s structural
23
requirements for substrate or inhibitor interaction by correlating the biological activity
of substrates and inhibitors with their molecular characteristics (Chang and Swaan
2006). Pharmacophore models can give information about the binding or inhibition
process and help in designing more compounds interacting with transporters. They are
also useful for large database screening to identify new transporter ligands. 3D-QSAR
models can be used to assist the design of more potent transporter inhibitors or
substrates with higher affinity. Pharmacophore and 3D-QSAR models have been
generated for transporters such as P-gp, OCTs, OATs and PEPT1 (Biegel et al. 2005;
Diao et al. 2010; Broccatelli et al. 2011; Duan et al. 2012). High throughput screening
based on computational models is cost-effective and may help to reduce experimental
efforts in the early phases of drug development. Downside of computational models is
that most models can only be used to screen inhibitors, not substrates.
4.4.2 Pharmacokinetic Models
Pharmacokinetic models are widely used tools to describe and predict the processes of
drug disposition in vivo using data gathered from in vitro studies. Models can be divided
into empirical and mechanistic based on their approach (Yu and Wilson 2010).
Empirical models describe relationships between drug exposure and effect without
consideration of the underlying mechanisms. Mechanistic models, on the other hand,
are based on these physiological mechanisms and they can be used to describe the
interplay of multiple processes that affect drug disposition in different tissues. A model
describing hepatic clearance can be used for simultaneous assessment of uptake, passive
diffusion, intracellular binding, and metabolism using data gathered from experimental
in vitro assays. Simple two-compartment models have been generated to study the
hepatic uptake kinetics and metabolism of OATP substrates (Poirier et al. 2008;
Menochet et al. 2012a). They enable the analysis of the whole in vitro data set in one
step and can be used to quantify time-dependent nonlinearities of transporter uptake that
are important in determining kinetic parameters of transporter substrates. A two-
compartment model has also been used to study interspecies and interindividual
differences between uptake of OATP substrates in rat and human hepatocytes
(Menochet et al. 2012b).

24
Physiologically based pharmacokinetic (PBPK) modeling is a mechanistically based
approach that integrates drug-dependent and human physiology-dependent parameters
(Yu and Wilson 2010). PBPK models describe the body by incorporating parameters
corresponding to tissue and organ volumes, blood-flow rates, drug transporters and
metabolizing enzymes. Drug-dependent parameters include molecular weight, solubility,
particle size, pKa, logP and plasma protein binding. The in vivo pharmacokinetic profile
of a compound can be simulated for different species by using species dependent
parameters available in the literature. In addition to providing predictions of human
pharmacokinetics, PBPK models are also useful tools for predicting the relative
importance of uptake and efflux transporters in the drug disposition, as well as
transporter-mediated drug-drug interactions in vivo. For example, the effects of changes
in OATP1B1 activity on systemic and hepatic exposure of pravastatin has been
simulated using a PBPK model that includes blood, liver and peripheral organs
(Watanabe et al. 2009). Also a PBPK model to predict DDIs of pravastatin caused by
OATP1B1 inhibitors, cyclosporine, gemfibrozil and rifampicin has been recently
established (Varma et al. 2012).
Overall, PBPK modeling has been shown to be a powerful tool to extrapolate animal
pharmacokinetic data to humans. Compared to allometric approach, in which body
weight of different animal species is used to extrapolate pharmacokinetic parameters to
humans, PBPK modeling has proven to be produce more precise predictions of human
pharmacokinetics (Kirman et al. 2003; Strougo et al. 2012). Both EMA and FDA
recommend the use of PBPK models in the prediction of transporter-mediated drug-
drug interactions (FDA 2012; EMA 2012). The limitation of PBPK modeling is that it
requires intense resources to generate the data on the various parameters described in
the models.
4.5 Intact Organ and in Vivo Models
Models utilizing intact organs or live animals provide information about physiological
functions and effects of transporters and are used as tools to predict pharmacokinetics of
drugs in humans. Compared to in vitro methods, isolated organs or in vivo models allow

25
a more accurate determination of transporter contribution in absorption, hepatic
elimination, renal excretion and brain penetration. Isolated and perfused organs are a
good tool to study transporter function in a given tissue because the concentration of the
drug in the organ can be controlled and the effect of other organs is eliminated (Xia et al.
2007). By using specific transporter inhibitors, contribution of a given transporter to the
pharmacokinetic profile can be assessed. For example, contribution of Oatp transporters
in hepatic clearance of digoxin and atorvastatin has been examined in rat liver perfusion
studies using rifampicin and rifamycin as selective Oatp inhibitors (Lau et al. 2004; Lau
et al. 2006; Weiss et al. 2008). In live animals, the conventional method to study drug
pharmacokinetics and distribution is to collect blood, urine and tissue samples after the
administration of radiolabeled or non-labeled drug (Jaisue et al. 2010; van de Steeg et al.
2011). The amount of accumulated drug in the samples can then be analyzed. In order to
get a pharmacokinetic profile, samples are taken or animals are sacrificed at different
time points.
4.5.1 Genetic and Chemical Knockout Models
Genetic knockout mice and naturally-occurring transporter-deficient animals are widely
used to investigate the physiological function of a specific targeted transporter. Genetic
knockout mice are generated by disrupting the endogenous transporter gene while
natural mutant animals have a spontaneous mutation in a transporter gene. Spontaneous
mutations of P-gp and Mrp2 genes have been identified in subpopulations of mice, rats
and dogs (Buchler et al. 1996; Lankas et al. 1997; Mizukami et al. 2012). Genetic
knockout of numerous different uptake and efflux transporter genes has been used to
investigate the physiological contribution of transporters on drug absorption, tissue
distribution and elimination (Xia et al. 2007; Giacomini et al. 2010). Recently, studies
on Oatp1 (Slco1a/1b-/-) knockout mice have been used to investigate the impact of
Oatp1 transporters on in vivo disposition of anticancer drugs paclitaxel and
methotrexate and antihistamine fexofenadine (van de Steeg et al. 2010; van de Steeg et
al. 2011). Also humanized transgenic mice expressing human OATP1B1, OATP1B3
and OATP1A2 transporters instead of endogenous Oatp1a and -1b transporters have
been generated (van de Steeg et al. 2009). Van de Steeg et al. have studied the

26
pharmacokinetics of methotrexate and paclitaxel also in the humanized transgenic mice
(van de Steeg et al. 2013).
Limitations of knockout and mutant models include species, strain, sex, diet and
housing condition differences which have to be taken into consideration when
interpreting data and extrapolating findings across species (Giacomini et al. 2010).
Strain and gender differences in transporter expression have been reported and there are
definitive species differences in transporter expression, function, substrate affinity and
interplay between transporters and metabolizing enzymes (Merino et al. 2005; Li et al.
2008). Humanized transporter animal models can at least partly help in translation of
preclinical in vivo data to the clinical phase. Another problem in both knockout models
and humanized transporter animal models is that deletion or addition of one transporter
may cause changes in the expression of other transporters or enzymes and in the
physiology of the animal (Lam et al. 2005; van de Steeg et al. 2010). These potential
changes have to be taken into consideration when pharmacokinetics or toxic effects of
drugs are assessed.
Also chemical knockout of transporters using transporter inhibitors can be used to
evaluate transporter function in drug disposition. Mice or rats are treated with a
selective transporter inhibitor and the pharmacokinetics of test compounds are
investigated in the presence of the inhibitor. Selective uptake inhibitors are available for
P-gp and BCRP but so far no specific inhibitors for uptake transporters have been
identified (Allen et al. 2002; Shepard et al. 2003). Chemical and genetic knockout
models can also be combined. The selection of appropriate dose of the inhibitor is
important in order to achieve inhibitory effect in vivo. The specificity of the transporter
inhibitor is also important and the limitation of chemical knockout models is that it may
be hard to find inhibitors that inhibit specifically only one type of transporters.
4.5.2 Imaging
Imaging techniques are used to visualize transporter functions in vivo and to
qualitatively and quantitatively evaluate the role of transporters in humans. Positron
27
emission tomography (PET) and single photon emission computed tomography (SPECT)
are non-invasive methods that can be used for accurate measurement of
pharmacokinetic end points in animals and humans by detecting radioactivity emitted
by radiolabeled tracers (Fischman et al. 2002). Utilization of genetic knockout mice and
specific transporter inhibitors in imaging studies can help to evaluate the impact of a
given transporter. For example, PET has been used to evaluate hepatobiliary transport
of OATP1B1 and OATP1B3 substrates in humans with or without OATP1 inhibitor
rifampicin administration (Takashima et al. 2012). Using rifampicin-treated mice and
genetic knockout mice unable to express the uptake transporters Oatp1a/1b or Mrp2, the
hepatic uptake and biliary efflux of was recently studied using SPECT imaging (Neyt et
al. 2013). The study showed that the hepatic uptake and efflux of (99m)Tc-mebrofenin
was impaired in Slco1a/1b and Abcc2 knockout mice, respectively. Rifampicin
administration had similar effect on hepatic uptake and efflux. The results demonstrated
that hepatic uptake and biliary efflux can be quantified simultaneously in vivo using
imaging techniques. Also species differences in drug transport can be studied using
imaging techniques. The whole-body distribution and OATP1B3/Oatp1 mediated
hepatic transport of antihypertensive drug telmisartan in humans and rats have been
studied by Shimizu et al (2012).
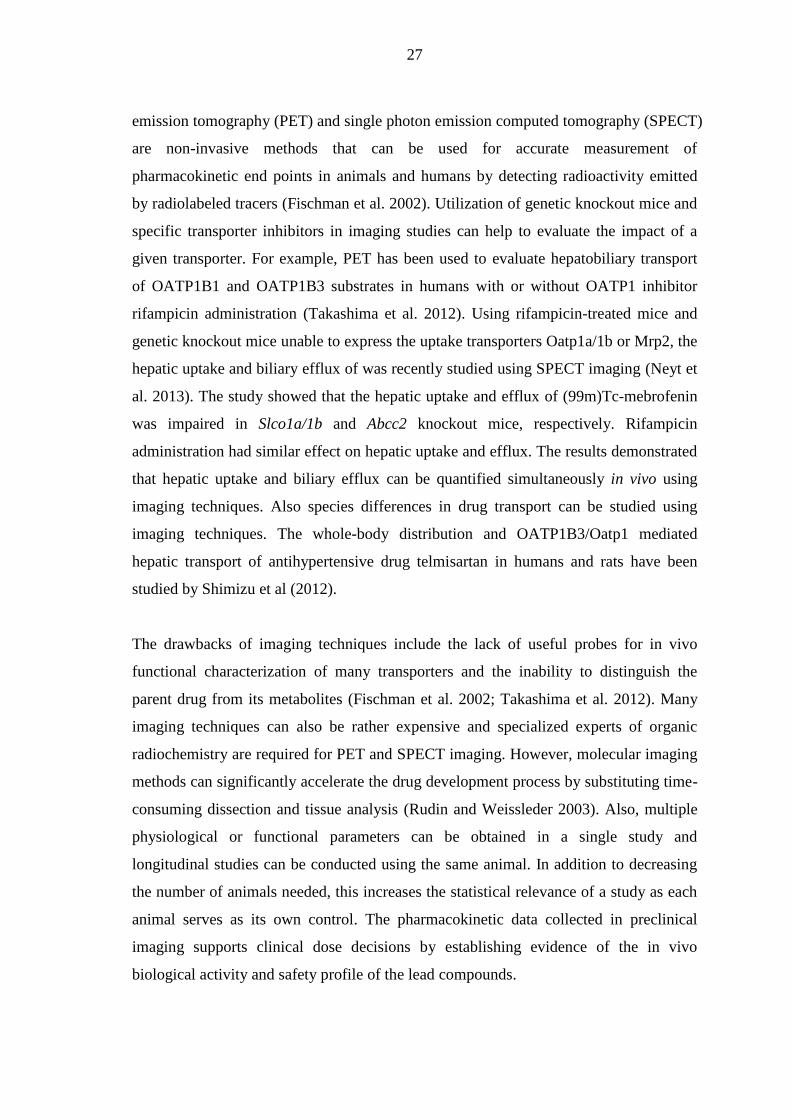
The drawbacks of imaging techniques include the lack of useful probes for in vivo
functional characterization of many transporters and the inability to distinguish the
parent drug from its metabolites (Fischman et al. 2002; Takashima et al. 2012). Many
imaging techniques can also be rather expensive and specialized experts of organic
radiochemistry are required for PET and SPECT imaging. However, molecular imaging
methods can significantly accelerate the drug development process by substituting time-
consuming dissection and tissue analysis (Rudin and Weissleder 2003). Also, multiple
physiological or functional parameters can be obtained in a single study and
longitudinal studies can be conducted using the same animal. In addition to decreasing
the number of animals needed, this increases the statistical relevance of a study as each
animal serves as its own control. The pharmacokinetic data collected in preclinical
imaging supports clinical dose decisions by establishing evidence of the in vivo
biological activity and safety profile of the lead compounds.
28
5 AIM OF THE STUDY
The aim of the experimental part of the master’s thesis was to determine if entacapone
and fluvastatin are actively transported from blood into rat and human hepatocytes
through the sinusoidal membrane, and to assess the role of OATP transporters in the
hepatic uptake of the drugs of interest.
6 MATERIALS AND METHODS
6.1 Drugs and Chemicals
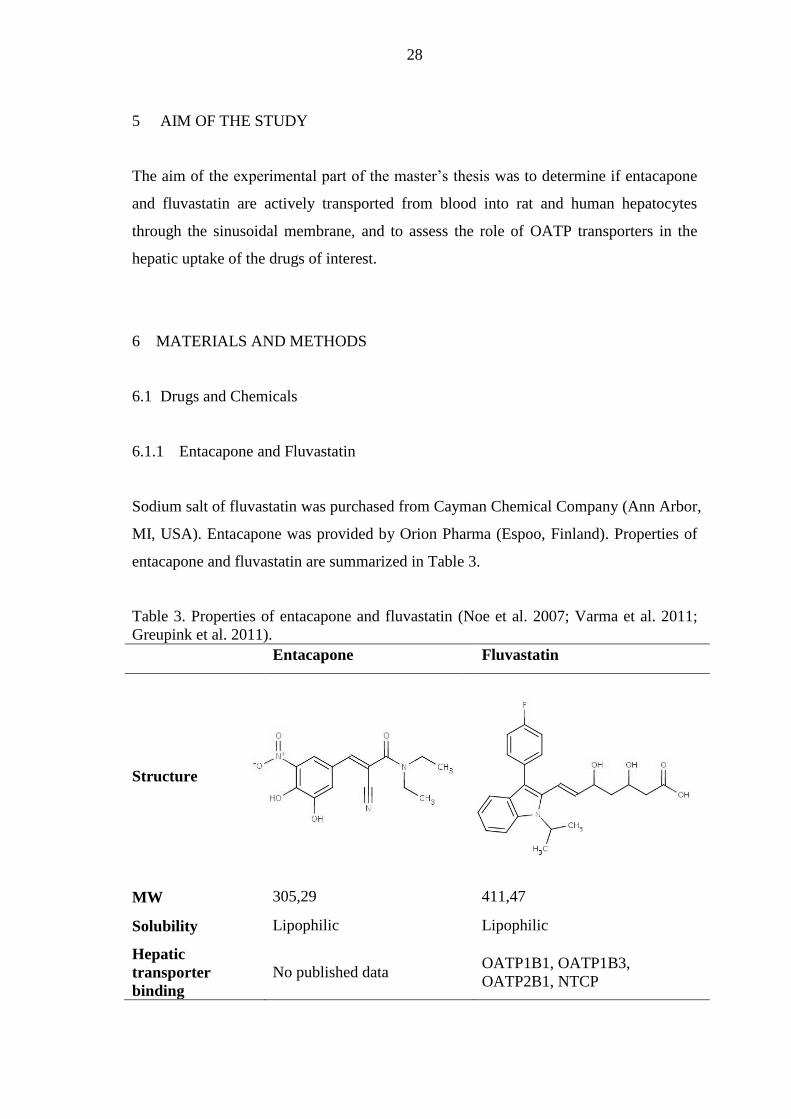
6.1.1 Entacapone and Fluvastatin
Sodium salt of fluvastatin was purchased from Cayman Chemical Company (Ann Arbor,
MI, USA). Entacapone was provided by Orion Pharma (Espoo, Finland). Properties of
entacapone and fluvastatin are summarized in Table 3.
Table 3. Properties of entacapone and fluvastatin (Noe et al. 2007; Varma et al. 2011;
Greupink et al. 2011).
Entacapone Fluvastatin
Structure
MW 305,29 411,47
Solubility Lipophilic Lipophilic
Hepatic
transporter
binding
No published data OATP1B1, OATP1B3,
OATP2B1, NTCP
29
Uptake studies with entacapone were performed with concentration range of 1 - 400 µM.
Fluvastatin was used in the uptake studies with a concentration range of 1 - 50 µM.
Substrate solutions were prepared in Krebs-Henseleit buffer (KHB), unless Na+ -free
choline buffer was used in the experiment, in which case corresponding buffer was used
in substrate solutions.
7.1.2 Model Substrates
Taurocholic acid (taurocholate) and estrone 3-sulfate (E3S) were used as model
substrates of Oatp1 and Ntcp transporters. For quantification purposes, model substrate
solutions contained 1 % (V/V) of 3H-labeled model substrate. E3S was used in
competitive studies together with non-radiolabeled compounds. Estrone 3-sulfate
sodium salt and taurocholic acid sodium salt hydrate were purchased from Sigma-
Aldrich (Buchs, Switzerland), whereas [3H]-estrone-3-sulfate ammonium salt with a
specific activity of 57,3 Ci/mmol and [3H]-taurocholic acid with a specific activity of 5
Ci/mmol were purchased from Perkin Elmer (Waltham, MA, USA).
7.1.3 Control Compounds
Sodium salt of rifamycin SV was used in the experiments as a broad Oatp1 inhibitor in
order to rule out the effect of Oatp1-mediated active transport on the uptake of the
investigated compounds. Highly lipophilic β-blocker (±)-propranolol hydrochloride was
used as a control compound for passive transcellular permeation. [3H]-inulin (specific
activity 0,25 µCi/ml) was used as a non-permeable control compound. As a
polysaccharide with high molecular weight, inulin does not pass through most cell
membranes (Middleton 1977; Duff et al. 2002). Rifamycin, propranolol hydrochloride
and [3H]-inulin were purchased from Sigma-Aldrich (Buchs, Switzerland).
7.1.4 Hepatocyte Medium
Krebs-Henseleit buffer (KHB) was used to maintain hepatocyte viability during the
uptake experiments. KHB was prepared in Milli-Q water, and it consisted of 142 mM
30
sodium chloride, 1,20 mM anhydrous magnesium sulfate, 0,96 mM potassium
phosphate monobasic, 4,83 mM potassium chloride, 5 mM D-glucose, 1,53 mM
calcium chloride dehydrate and 12,5 mM 4-(2-hydroxyethyl)-piperazine-1-
ethanesulfonic acid (HEPES), all from Sigma-Aldrich (Buchs, Switzerland), and 23,8
mM sodium bicarbonate (J.T. Baker, Phillipsburg, NJ, USA). pH was adjusted to 7,4 by
using 2 M sodium hydroxide (Reagena, Toivala, Finland). Solution was sterilized by
filtration using a Nalgene bottle top filter with 0,2 µm pore size (Apogent Technologies,
Rochester, NY, USA).
Na+ -free choline buffer was used instead of KHB in one experiment in order to rule out
the effect of Na+ -dependent active transport. The composition of choline buffer was the
same as that of Krebs-Henseleit buffer except that sodium chloride and sodium
bicarbonate were replaced by choline chloride (Fluka Biochemika, Buchs, Switzerland)
and tris(hydroxymethyl)aminomethane (Tris base) (Sigma-Aldrich, Buchs,
Switzerland), respectively.
7.2 Hepatocytes
To evaluate the difference in uptake kinetics between murine and human hepatocytes,
both rat and human hepatocytes were used in the study. Due to limited availability of
freshly isolated hepatocytes, part of the experiments with rat hepatocytes were
conducted using cryopreserved cells, as were all of the experiments with human
hepatocytes.
The cryopreserved cells used in the study were pooled male Wistar rat hepatocytes and
human hepatocytes from one female donor. Both rat and human hepatocytes were
purchased from Celsis IVT (Baltimore, MD, USA). Before the experiments,
cryopreserved cells were thawed in 37 °C water bath long enough to melt the solution
and mixed with pre-warmed thawing medium (InVitroGRO™ HT, Celsis IVT, USA).
After centrifugation at 600 rpm for 5 minutes (Heraeus Megafuge 1.0, Thermo Fisher
Scientific, USA) and removal of the supernatant, hepatocytes were diluted to pre-
warmed KHB to a density of 2 x 10⁶ cells/ml. Hepatocytes were calculated and viability

31
was determined microscopically (Olympus CK40-F200, Tokyo, Japan) by eosin Y
staining using a hemocytometer. Cell suspension was stored on ice until needed, and the
uptake studies were conducted in a time period no longer than 2 hours after the
hepatocytes were thawed.
Fresh rat hepatocytes were isolated from eight-week-old male Wistar rats (HanTac:WH
strain, Taconic Europe, Denmark) by a two-step in situ collagenase perfusion method
(Berry and Friend 1969). Cell viability was determined by eosin Y staining. Liver
perfusion and cell isolation of the freshly isolated hepatocytes was conducted by
qualified personnel. Isolated cells were diluted to a density of 2 x 10⁶ cells/ml with cold
KHB and stored on ice until needed. Uptake studies were conducted no longer than 4
hours after the liver perfusions.
7.3 Cellular Uptake Experiments
To characterize the uptake kinetics of the compounds of interest, uptake experiments
were performed using the oil-spin method (Yabe et al. 2011). Substrate associated with
the hepatocytes was measured after separation from free substrate by a rapid
centrifugation of the substrate solution over an inert silicone/mineral oil layer covering
an alkaline solution layer (Figure 5).
Figure 5. Flow chart of hepatocyte uptake assay using the oil-spin method (Xia et al.
2007).

32
Prior to the start of the assays, the hepatocyte solutions were preincubated on an orbital
shaker (Heidolph Titramax 100, Schwabach, Germany) at 37 °C for 15 minutes. The
uptake assay was initiated by adding equal volume of hepatocyte solution to prewarmed
substrate solution. The reaction mixture was incubated at 37 °C on a thermoblock (700
rpm) (Eppendorf Thermomixer Comfort, Hamburg, Germany). In each experiment,
incubations were carried out in triplicate. To determine intracellular and extracellular
concentrations, 100 µl aliquots of the reaction mixture were pipetted into
microcentrifuge tubes containing 100 µl 2 M NaOH covered by 100 µl of silicone-
mineral oil (BD Gentest, San Jose, CA, USA). At designated time points (30, 90, and
180 s), the reaction was terminated by centrifuging the samples at 14 000 rpm for 30
seconds in a tabletop microcentrifuge (Eppendorf MiniSpin Plus, Hamburg, Germany).
After separation of cells from the media, the tubes were kept on ice before freezing at
-20 ºC. For normalization of the uptake activity, 100 µl of each reaction mixture was
added to 100 µl of NaOH without oil filtration in order to measure the total radioactivity
in 100 µl of each reaction mixture. Samples were stored at -20 ºC before sample
preparation.
Uptake experiments for the non-radiolabelled substrate solutions of fluvastatin and
entacapone were performed as described for radiolabelled compounds, with the
exception that 5 M ammonium acetate solution was used as the bottom layer instead of
sodium hydroxide.
7.4 Sample Preparation
7.4.1 Sample Preparation for Liquid Scintillation Analysis
Frozen microcentrifuge tubes were cut in the center of the oil layer and the bottom
halves containing the cell pellets were placed into scintillation vials. After cutting, cell
samples were allowed to sit in room temperature for 1-2 hours in order to let NaOH
dissolve the hepatocytes, followed by the addition of 100 µl of 2 M hydrogen chloride
(Reagena, Toivala, Finland) to neutralize the samples. Scintillation cocktail (Ecoscint A,
National Diagnostics, Atlanta, GA, USA) was then added to the vials and cell
33
suspension was pipetted out of the microcentrifuge tubes and mixed with the
scintillation cocktail by vortex and manual pipetting.
For measurement of extracellular substrate concentration, top halves of the
microcentrifuge tubes containing the supernatant were collected into scintillation vials.
Supernatant samples were pipetted out of microcentrifuge tubes inside the vials and
mixed with scintillation cocktail.
7.4.2 Sample Preparation for UPLC/MS Analysis
Non-radiolabelled samples of fluvastatin and entacapone were prepared for ultra
performace liquid chromatography / mass spectrometry (UPLC/MS) analysis. Aliquots
were pipetted from the upper supernatant samples, pipetted into eppendorfs and diluted
with methanol. Microcentrifuge tubes were then cut as previously described, after which
bottom samples were pipetted into eppendorfs. Samples were precipitated with 100 µl
of methanol (J.T. Baker, Phillipsburg, NJ, USA) and centrifuged at 14 000 rpm for 5
minutes. The supernatants were pipetted into UPLC vials.
7.5 Quantification and Metabolite Screening
7.5.1 Quantification of Radiolabeled Samples
Radiolabelled samples were analyzed using a liquid scintillation counter (Perkin Elmer
Wallac 1414, Waltham, MA, USA). Quantification was performed by first calculating
the average radioactivity (decays per minute, DPM) per pmole of model substrate in
100 µl of reaction mixture, and comparing this value to the radioactivity of each sample.
7.5.2 Quantification of Non-Radiolabeled Samples
Non-radiolabeled samples were analyzed using Waters Acquity UPLC system (Milford,
MA, USA) coupled to Sciex API 4000 triple quadrupole MS detector (Foster City, CA,
USA). For entacapone samples, separation was accomplished with a 2,1 x 50 mm

34
UPLC BEH C18 column (Waters, Milford, MA, USA). For fluvastatin samples,
separation was done with a 2,1 x 100 mm Purospher Star Hibar C18 column (Merck,
Darmstadt, Germany). Chromatographic conditions for both compounds are
summarized in Table 5.
Table 5. Chromatographic conditions for entacapone and fluvastatin.
Entacapone Fluvastatin
Mobile Phase A 0,1 % Formic acid, pH 3 0,1 % Formic acid, pH 3
Mobile Phase B Acetronitrile Acetonitrile/Methanol
50:50 (V/V)
Column
Temperature (°C)
55 50
Flow Rate (µl/min) 800 400
Gradient Run 95-10 % B in 3 min,
hold 0,5 min, then to 95 %
B over 0,1 min
30 % A 70 % B
The quantification of the test compounds in the samples was performed by comparing
the samples’ peak areas to a calibration curve plotted with a set of external standards.
Fluvastatin standard curve ranged from 10 nM to 10 µM. Entacapone standard curve
ranged from 10 nM to 50 µM.
7.5.3 Fluvastatin Metabolite Screening
The presence of main metabolites of fluvastatin in cell and supernatant samples was
investigated in UPLC/MS/MS analysis using the same devices and chromatographic
conditions as for fluvastatin quantification. The concentration of metabolites in the
samples was not quantified.
7.6 Data Analysis
The initial uptake velocity (V) of test compounds was determined from the slope of the
plot of substrate amount in hepatocytes versus time. Initial uptake velocity values were
used to calculate hepatic uptake clearance (CLuptake) by dividing by substrate

35
concentration in the reaction mixture. Passive uptake rate (Pdiff), Michaelis-Menten
constant (Km) and maximum uptake rate (Vmax) were calculated by simultaneous fitting
of all time and concentration points using nonlinear regression in GraphPad Prism
(GraphPad Sofware, San Diego, CA, USA) by using the following equation:
Equation 3
where S is the substrate concentration in the reaction mixture. Total uptake clearance
(CLuptake) included both the active (CLactive) and passive component (Pdiff). The saturable
active hepatic uptake was estimated by Vmax/Km and the contribution of saturable uptake
of the total uptake by using equation 4:
The contribution of active hepatic uptake (%) =
Equation 4
The inhibitor concentration that corresponds to the 50% of the maximum inhibition of
E3S uptake transport (IC50) was determined for rifamycin SV and entacapone by fitting
the uptake clearance data to the following equation (5) using nonlinear regression in
GraphPad Prism.
(
) Equation 5
7 RESULTS
7.1 Cell Viability and Non-Specific Binding
The viability of cell suspensions used in the experiments ranged from 93 % to 79 % for
freshly isolated rat hepatocytes, from 82 % to 68 % for cryopreserved rat hepatocytes
and from 82 % to 72 % for cryopreserved human hepatocytes. After the experiments,

36
the viability of the cells had decreased to an average of 54 % with no significant
difference between freshly isolated or cryopreserved hepatocytes.
The integrity of the cells and non-specific binding to cell membranes was investigated
with an oil-spin assay using cryopreserved rat hepatocytes and 1 µl/ml [3H]-inulin. Low
amount of radioactivity was detected in the samples but the amount did not significantly
change over time which indicates that inulin seemed to bind to the cells to a small
degree without accumulation into the cells (Table 6).
Table 6. Radiolabeled inulin in cell samples expressed as a percentage of the
radioactivity in the reaction mixture. Cryopreserved rat hepatocytes were incubated with
1 µl/ml [3H]-inulin at 3 different time points under 3 minutes.
Time (s) Percentage of inulin in cell samples
Sample 1 Sample 2 Sample 3 avg ± std
30 0,03 0,18 0,03 0,08 ± 0,09
90 0,03 0,04 0,20 0,09 ± 0,10
180 0,14 0,03 0,03 0,07 ± 0,07
7.2 Kinetic Evaluation of Taurocholate, Fluvastatin and Entacapone Uptake
A time-dependent increase in intracellular concentration and a concentration-dependent
increase in uptake rate was observed for all the compounds investigated. The uptake
rates of the investigated compounds mainly showed a decrease after 90 second time
point, as is shown for taurocholate in Table 8.
Table 8. Uptake rate of sodium taurocholate in freshly isolated rat hepatocytes
calculated using time intervals from 30 seconds up to either 90 or 180 seconds. Values
are represented as means of triplicate samples ± standard deviation. N = 1
Taurocholate
concentration (µM)
V (pmol/min/106 cells),
30 s - 90 s
V (pmol/min/106 cells),
30 s - 180 s 1 109 ± 42,7 30,0 ± 10,1
10 501 ± 247 299 ± 102
25 888 ± 720 496 ± 200
50 923 ± 1110 932 ± 497
100 1470 ± 1240 1660 ± 961
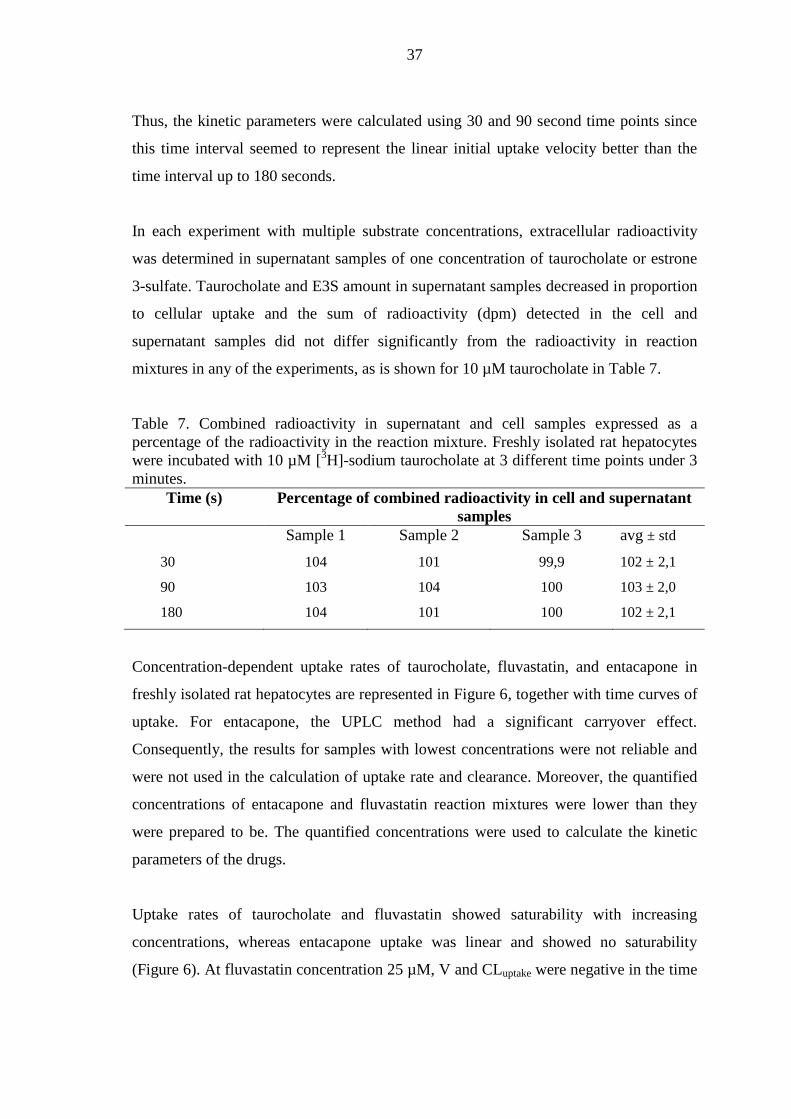
37
Thus, the kinetic parameters were calculated using 30 and 90 second time points since
this time interval seemed to represent the linear initial uptake velocity better than the
time interval up to 180 seconds.
In each experiment with multiple substrate concentrations, extracellular radioactivity
was determined in supernatant samples of one concentration of taurocholate or estrone
3-sulfate. Taurocholate and E3S amount in supernatant samples decreased in proportion
to cellular uptake and the sum of radioactivity (dpm) detected in the cell and
supernatant samples did not differ significantly from the radioactivity in reaction
mixtures in any of the experiments, as is shown for 10 µM taurocholate in Table 7.
Table 7. Combined radioactivity in supernatant and cell samples expressed as a
percentage of the radioactivity in the reaction mixture. Freshly isolated rat hepatocytes
were incubated with 10 µM [3H]-sodium taurocholate at 3 different time points under 3
minutes.
Time (s) Percentage of combined radioactivity in cell and supernatant
samples
Sample 1 Sample 2 Sample 3 avg ± std
30 104 101 99,9 102 ± 2,1
90 103 104 100 103 ± 2,0
180 104 101 100 102 ± 2,1
Concentration-dependent uptake rates of taurocholate, fluvastatin, and entacapone in
freshly isolated rat hepatocytes are represented in Figure 6, together with time curves of
uptake. For entacapone, the UPLC method had a significant carryover effect.
Consequently, the results for samples with lowest concentrations were not reliable and
were not used in the calculation of uptake rate and clearance. Moreover, the quantified
concentrations of entacapone and fluvastatin reaction mixtures were lower than they
were prepared to be. The quantified concentrations were used to calculate the kinetic
parameters of the drugs.
Uptake rates of taurocholate and fluvastatin showed saturability with increasing
concentrations, whereas entacapone uptake was linear and showed no saturability
(Figure 6). At fluvastatin concentration 25 µM, V and CLuptake were negative in the time

38
interval up to 90 seconds. This data point was removed from nonlinear regression
analysis in order to get reliable results. The uptake rates and clearances of taurocholate,
fluvastatin and entacapone at different concentrations are summarized in Table 9.
Figure 6. The uptake of sodium taurocholate (A,B), fluvastatin (C,D) and entacapone
(E,F) into freshly isolated rat hepatocytes. The initial uptake rates (B,D,F) are calculated
using 30 second and 90 second time points. Values are represented as means of
triplicate samples ± standard deviation. N = 1

39
Table 9. Initial uptake rate and uptake clearance of taurocholate, fluvastatin and
entacapone in freshly isolated rat hepatocytes. Values are represented as means of
triplicate samples ± standard deviation. The quantified concentrations of entacapone and
fluvastatin solutions are presented in parentheses. N = 1
C
(µM)
V
(pmol/min/106 cells)
CLuptake
(µl/min/106 cells)
Taurocholate
1 109 ± 42,7 109 ± 42,7
10 501 ± 247 50,1 ± 24,7
25 888 ± 720 35,5 ± 20,6
50 923 ± 1110 18,5 ± 22,0
100 1470 ± 1240 14,7 ± 12,4
Fluvastatin
1 (0,5) 101 ± 37,0 217 ± 79,2
5 (2) 305 ± 100 176 ± 57,8
10 (4) 500 ± 76,9 128 ± 19,6
25 (9) -173 ± 326 -19,1 ± 35,8
50 (17) 533 ± 635 30,8 ± 36,7
Entacapone
1 (0,3) < LOQ < LOQ
3 (0,7) < LOQ < LOQ
10 (3) 546 ± 280 172 ± 88,2
50 (30) 620 ± 990 24,7 ± 39,4
100 (80) 1060 ± 578 17,5 ± 9,49
200 (160) 4340 ± 1500 26,8 ± 9,25
The uptake clearance of taurocholate differed in freshly isolated and cryopreserved rat
hepatocytes. Uptake clearance was lower in cryopreserved hepatocytes with every
concentration tested, while the relative decrease in clearance with increasing
concentrations was larger in freshly isolated hepatocytes (Table 10). The uptake of
taurocholate and entacapone was also investigated in cryopreserved human hepatocytes.
The uptake clearance of both compounds was lower in human hepatocytes compared to
freshly isolated rat hepatocytes (Table 10). For entacapone, the difference was more
drastic. In rat hepatocytes, entacapone uptake clearance decreased somewhat linearily

40
with increasing concentrations, while in human hepatocytes uptake clearance seemed to
stay at a constantly low level in the concentration range of 10 – 100 µM.
Table 10. Uptake clearance of taurocholate and entacapone in freshly isolated and
cryopreserved rat hepatocytes and cryopreserved human hepatocytes. Values are
represented as means of triplicate samples ± standard deviation. N = 1, *Quantified C =
3 µM, 30 µM, 80 µM **Quantified C = 5 µM, 26 µM, 70 µM
CLuptake in
freshly isolated
rat hepatocytes
(µl/min/1e6 cells)
CLuptake in
cryopreserved
rat hepatocytes
(µl/min/1e6 cells)
CLuptake in
cryopreserved
human hepatocytes
(µl/min/1e6 cells)
Taurocholate
1 µM 109 ± 42,7 27,9 ± 0,29 64,6 ± 8,74
10 µM 50,1 ± 24,7 23,9 ± 25,8 12,7 ± 8,91
25 µM 35,5 ± 20,6 17,9 ± 3,83 --
50 µM 18,5 ± 22,0 -- 4,01 ± 7,83
100 µM 14,7 ± 12,4 1,32 ± 0,44 --
Entacapone
10 µM 172 ± 88,2* -- 5,08 ± 5,67**
50 µM 24,7 ± 39,4* -- 3,11 ± 1,61**
100 µM 17,5 ± 9,49* -- 2,21 ± 1,75**
The Michaelis-Menten constant (Km) was higher for taurocholate compared to
fluvastatin, being 24 µM and 6 µM, respectively (Table 11). Also maximum uptake rate
(Vmax) and passive uptake rate (Pdiff) were lower for fluvastatin. The saturable
components for taurocholate and fluvastatin uptake were 82 % and 94 % of the total
uptake, respectively.
Table 11. Kinetic parameters for the hepatic uptake of taurocholate and fluvastatin in
freshly isolated rat hepatocytes. Values represent the mean of triplicate samples and
with standard error presented in parentheses. N = 1
Km
µM
Vmax
pmol/min/
106 cells
Pdiff
µl/min/
106 cells
Vmax/Km
µl/min/
106cells
Taurocholate 24,49 (39,60) 1778 (793,7) 15,92 (446,5) 72,60
Fluvastatin 5,82 (2,006) 1171 (114,6) 11,77 (57,84) 201,3
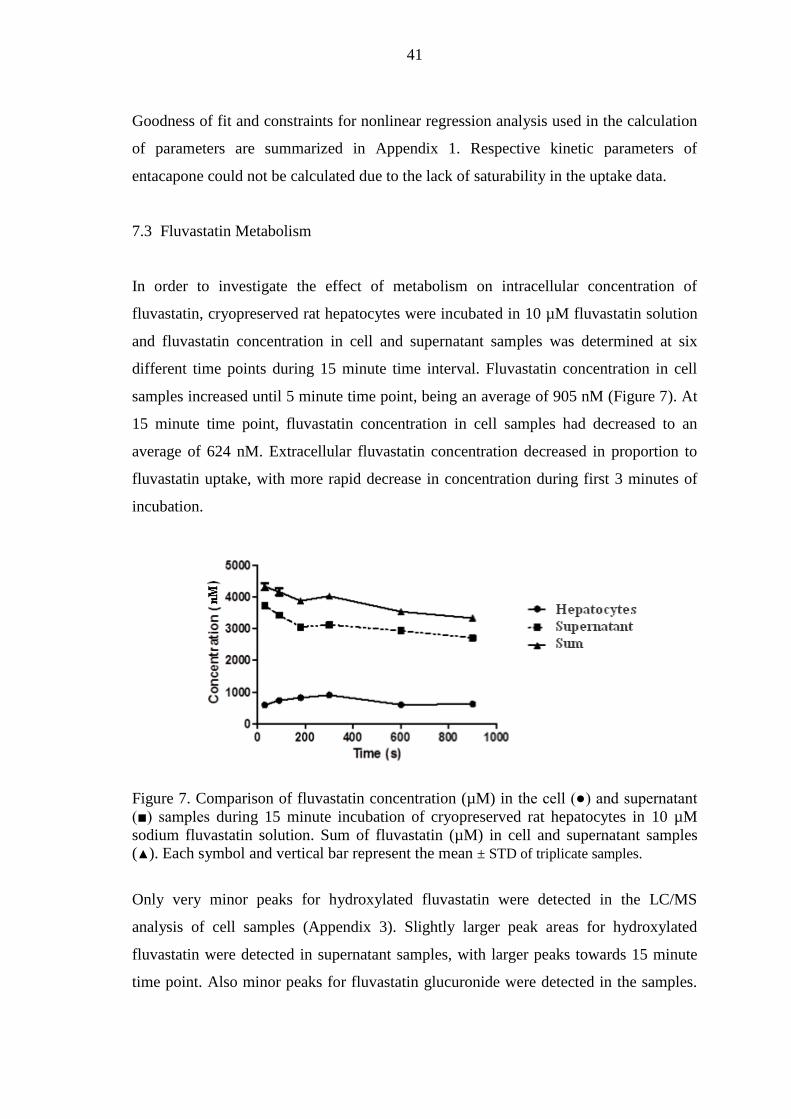
41
Goodness of fit and constraints for nonlinear regression analysis used in the calculation
of parameters are summarized in Appendix 1. Respective kinetic parameters of
entacapone could not be calculated due to the lack of saturability in the uptake data.
7.3 Fluvastatin Metabolism
In order to investigate the effect of metabolism on intracellular concentration of
fluvastatin, cryopreserved rat hepatocytes were incubated in 10 µM fluvastatin solution
and fluvastatin concentration in cell and supernatant samples was determined at six
different time points during 15 minute time interval. Fluvastatin concentration in cell
samples increased until 5 minute time point, being an average of 905 nM (Figure 7). At
15 minute time point, fluvastatin concentration in cell samples had decreased to an
average of 624 nM. Extracellular fluvastatin concentration decreased in proportion to
fluvastatin uptake, with more rapid decrease in concentration during first 3 minutes of
incubation.
Figure 7. Comparison of fluvastatin concentration (µM) in the cell (●) and supernatant
(■) samples during 15 minute incubation of cryopreserved rat hepatocytes in 10 µM
sodium fluvastatin solution. Sum of fluvastatin (µM) in cell and supernatant samples
(▲). Each symbol and vertical bar represent the mean ± STD of triplicate samples.
Only very minor peaks for hydroxylated fluvastatin were detected in the LC/MS
analysis of cell samples (Appendix 3). Slightly larger peak areas for hydroxylated
fluvastatin were detected in supernatant samples, with larger peaks towards 15 minute
time point. Also minor peaks for fluvastatin glucuronide were detected in the samples.
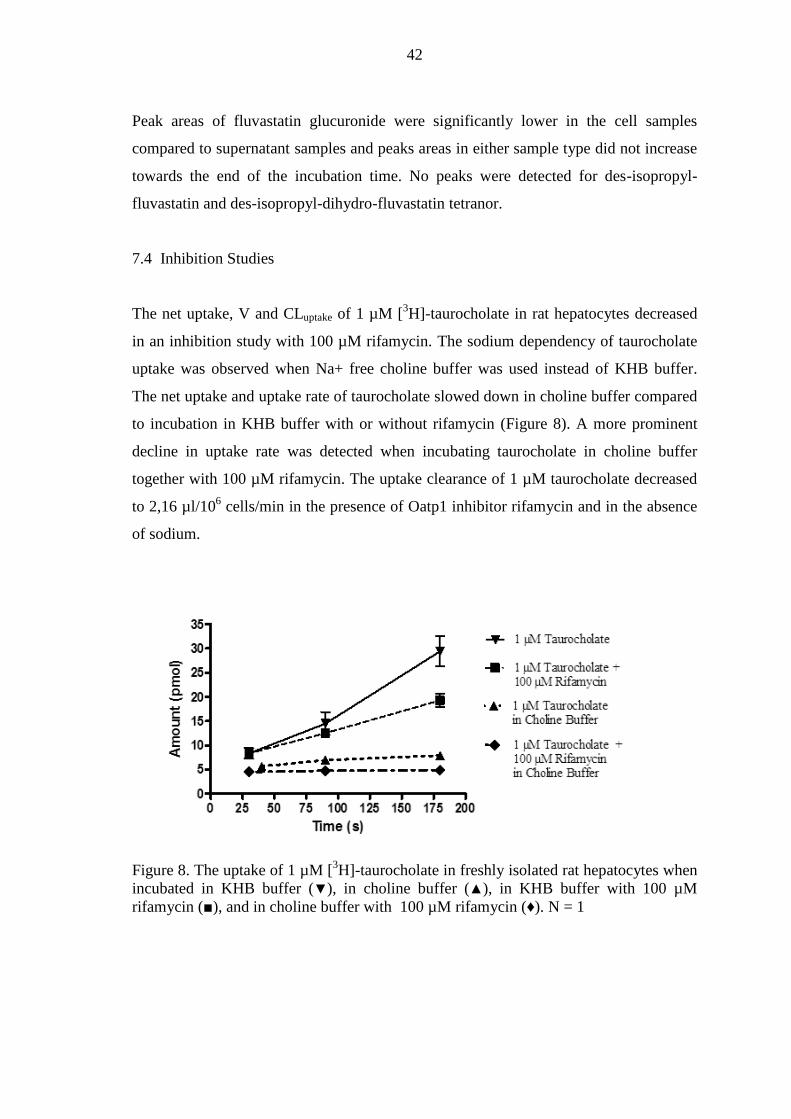
42
Peak areas of fluvastatin glucuronide were significantly lower in the cell samples
compared to supernatant samples and peaks areas in either sample type did not increase
towards the end of the incubation time. No peaks were detected for des-isopropyl-
fluvastatin and des-isopropyl-dihydro-fluvastatin tetranor.
7.4 Inhibition Studies
The net uptake, V and CLuptake of 1 µM [3H]-taurocholate in rat hepatocytes decreased
in an inhibition study with 100 µM rifamycin. The sodium dependency of taurocholate
uptake was observed when Na+ free choline buffer was used instead of KHB buffer.
The net uptake and uptake rate of taurocholate slowed down in choline buffer compared
to incubation in KHB buffer with or without rifamycin (Figure 8). A more prominent
decline in uptake rate was detected when incubating taurocholate in choline buffer
together with 100 µM rifamycin. The uptake clearance of 1 µM taurocholate decreased
to 2,16 µl/106 cells/min in the presence of Oatp1 inhibitor rifamycin and in the absence
of sodium.
Figure 8. The uptake of 1 µM [
3H]-taurocholate in freshly isolated rat hepatocytes when
incubated in KHB buffer (▼), in choline buffer (▲), in KHB buffer with 100 µM
rifamycin (■), and in choline buffer with 100 µM rifamycin (♦). N = 1
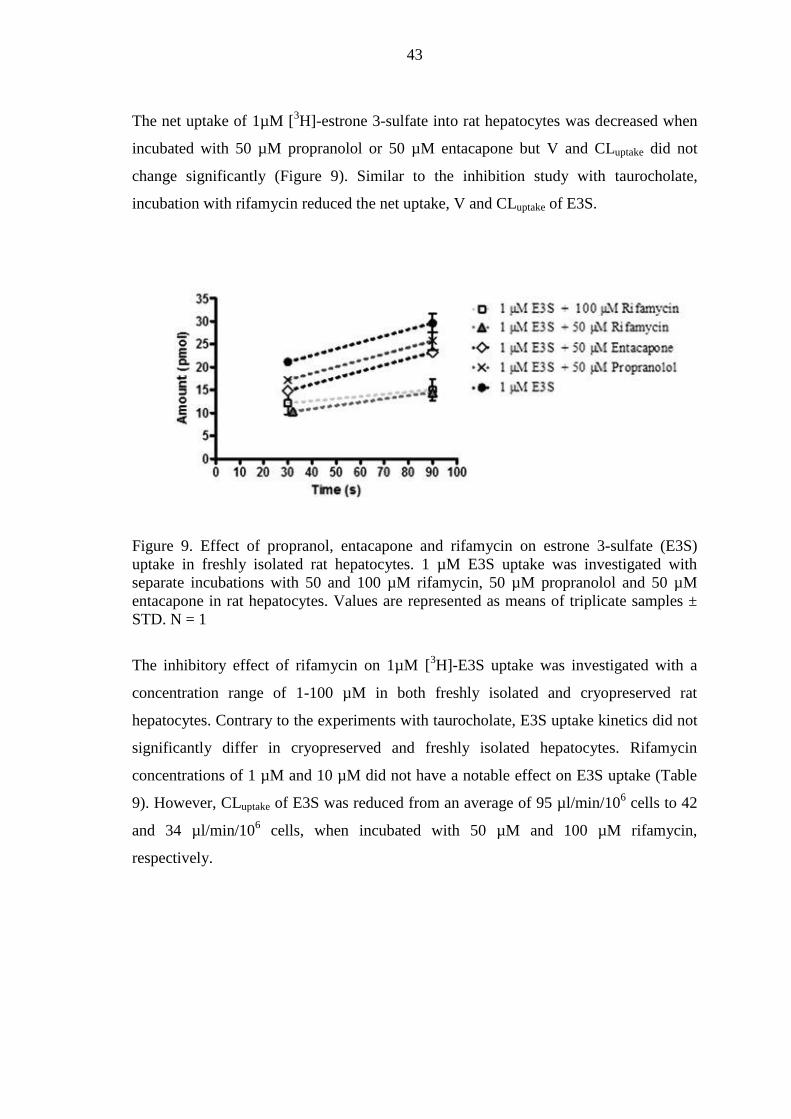
43
The net uptake of 1µM [3H]-estrone 3-sulfate into rat hepatocytes was decreased when
incubated with 50 µM propranolol or 50 µM entacapone but V and CLuptake did not
change significantly (Figure 9). Similar to the inhibition study with taurocholate,
incubation with rifamycin reduced the net uptake, V and CLuptake of E3S.
Figure 9. Effect of propranol, entacapone and rifamycin on estrone 3-sulfate (E3S)
uptake in freshly isolated rat hepatocytes. 1 µM E3S uptake was investigated with
separate incubations with 50 and 100 µM rifamycin, 50 µM propranolol and 50 µM
entacapone in rat hepatocytes. Values are represented as means of triplicate samples ±
STD. N = 1
The inhibitory effect of rifamycin on 1µM [3H]-E3S uptake was investigated with a
concentration range of 1-100 µM in both freshly isolated and cryopreserved rat
hepatocytes. Contrary to the experiments with taurocholate, E3S uptake kinetics did not
significantly differ in cryopreserved and freshly isolated hepatocytes. Rifamycin
concentrations of 1 µM and 10 µM did not have a notable effect on E3S uptake (Table
9). However, CLuptake of E3S was reduced from an average of 95 µl/min/106 cells to 42
and 34 µl/min/106 cells, when incubated with 50 µM and 100 µM rifamycin,
respectively.
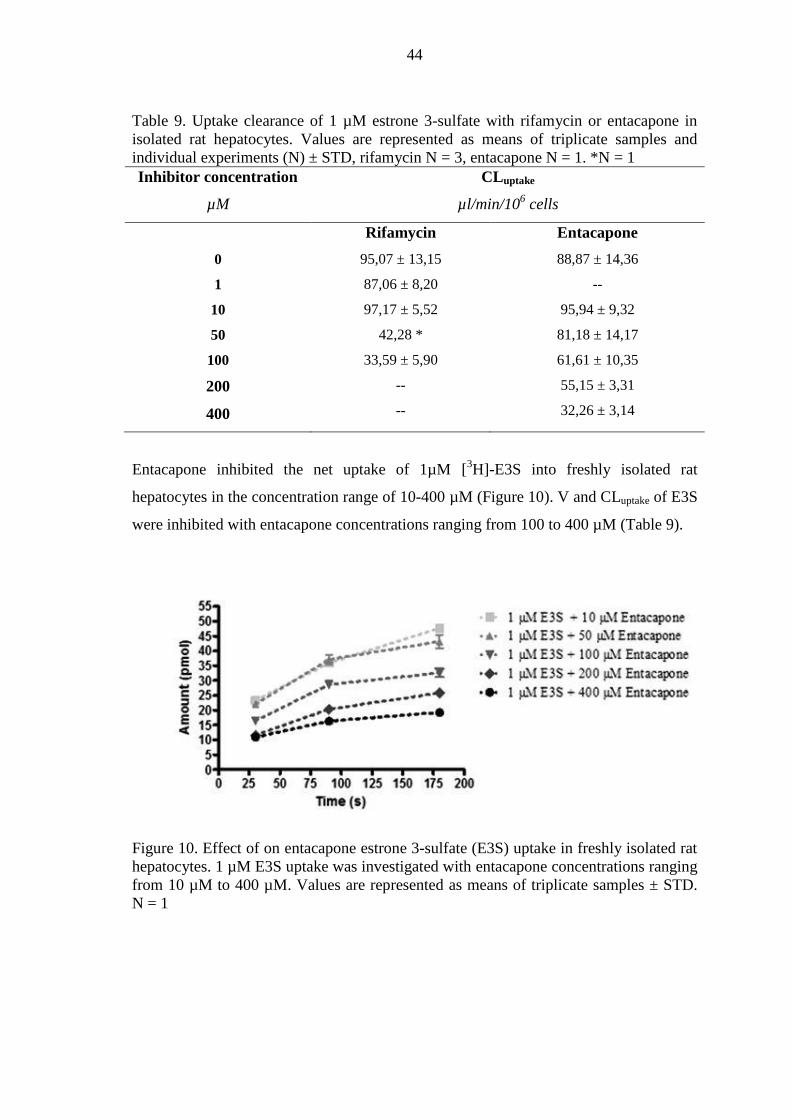
44
Table 9. Uptake clearance of 1 µM estrone 3-sulfate with rifamycin or entacapone in
isolated rat hepatocytes. Values are represented as means of triplicate samples and
individual experiments (N) ± STD, rifamycin N = 3, entacapone N = 1. *N = 1
Inhibitor concentration
µM
CLuptake
µl/min/106 cells
Rifamycin Entacapone
0
1
10
50
100
200
400
95,07 ± 13,15
87,06 ± 8,20
97,17 ± 5,52
42,28 *
33,59 ± 5,90
--
--
88,87 ± 14,36
--
95,94 ± 9,32
81,18 ± 14,17
61,61 ± 10,35
55,15 ± 3,31
32,26 ± 3,14
Entacapone inhibited the net uptake of 1µM [3H]-E3S into freshly isolated rat
hepatocytes in the concentration range of 10-400 µM (Figure 10). V and CLuptake of E3S
were inhibited with entacapone concentrations ranging from 100 to 400 µM (Table 9).
Figure 10. Effect of on entacapone estrone 3-sulfate (E3S) uptake in freshly isolated rat
hepatocytes. 1 µM E3S uptake was investigated with entacapone concentrations ranging
from 10 µM to 400 µM. Values are represented as means of triplicate samples ± STD.
N = 1

45
The 50% inhibitory concentration (IC50) values of rifamycin and entacapone for uptake
of [3H]-estrone 3-sulfate in rat hepatocytes were 62 and 237 µM, respectively.
Goodness of fit and constraints for nonlinear regression analysis used in the calculation
of IC50 values are summarized in Appendix 2. The inhibitory effects of rifamycin and
entacapone on saturable uptake clearance of E3S in rat hepatocytes are shown in Figure
11.
Figure 11. Comparison of the inhibition of 1 µM [3H]-estrone 3-sulfate uptake clearance
by rifamycin (lower curve) and entacapone (upper curve) in isolated rat hepatocytes.
Rifamycin concentration range was 1 to 100 µM and entacapone concentration range
was 10 to 400 µM. Each symbol and vertical bar represent the mean ± STD of triplicate
samples and individual experiments (N) ± STD, rifamycin N = 3, entacapone N = 1
8 DISCUSSION
8.1 Uptake Kinetics of Taurocholate and Estrone 3-Sulfate
Taurocholate uptake kinetics observed in the study is in concord with the knowledge of
the active transporter-mediated hepatic uptake process of taurocholate. The decrease in
uptake rate after 90 second time point is similar to the observation of a previous study
using the oil-spin method where uptake rate of taurocholate was determined at 15
second intervals through the initial 120 seconds of incubation (Edmondson et al. 1985).
Hepatic uptake of taurocholate has been shown to be mediated by sodium-dependent

46
manner by murine Ntcp and human NTCP transporters, as well as sodium-independent
manner by murine and human organic anion transporters including Oatp1a1, Oatp1a4,
Oatp1b2, OATP1B1 and OATP1B3 (Kullak-Ublick et al. 1995; Kouzuki et al. 1999;
Eckhardt et al. 1999; Cattori et al. 2001). Incubation in Na+ free buffer appeared to
cause a larger decrease in taurocholate uptake in rat hepatocytes compared to incubation
with Oatp1 inhibitor rifamycin SV which indicates that sodium-dependent transport
processes are mainly responsible of hepatic uptake of taurocholate. This finding is in
accordance with previous data (Edmondson et al. 1985; Sandker et al. 1994).
The Km value of 24 µM calculated for taurocholate is in good agreement to the results in
other studies using freshly isolated and primary cultured rat hepatocytes in which Km for
taurocholate varied between 17 to 24 (Edmondson et al. 1985; Sandker et al. 1994;
Kouzuki et al. 1998). The lower V and CLuptake of taurocholate in cryopreserved rat and
human hepatocytes compared to freshly isolated rat hepatocytes indicates that
taurocholate uptake was less efficient in cryopreserved rat and human cells. Houle et al.
(2003) have studied the effect of cryopreservation on taurocholate uptake in rat
hepatocytes and found no significant difference in taurocholate uptake between freshly
isolated and cryopreserved cells. The difference observed in the present study may be
caused by slight difference in cell viability between freshly isolated and cryopreserved
cells and by the fact that no Percoll centrifugation was performed in order to remove
dead cells when cell viability of the cryopreserved cells was lower than 85 %, as was
done in the study by Houle et al. (2003). The lower hepatic uptake of taurocholate in
cryopreserved human hepatocytes is in accordance with previous studies using both
freshly isolated rat and human hepatocytes and cryopreserved human hepatocytes,
indicating that there are species differences in the active transport mechanisms of bile
acids (Sandker et al. 1994; Kouzuki et al. 1998; Shitara et al. 2003).
The inhibitory effect of rifamycin SV on taurocholate and estrone 3-sulfate uptake in rat
hepatocytes supports previous data about inhibition potency of rifamycin SV on murine
Oatp and Ntcp transporters. High concentration (100 µM) of rifamycin SV has been
reported to inhibit both sodium-dependent and sodium-independent taurocholate uptake
in short-term cultured rat hepatocytes, whereas low concentration (10 µM) only

47
inhibited sodium independent taurocholate uptake (Fattinger et al. 2000). Rifamycin SV
was shown to inhibit Ntcp, Oatp1a1 and Oatp1a4-mediated transport of taurocholate in
Xenopus laevis oocytes. However, in a study using Oatp1b2 knockout mice, rifamycin
SV did not exhibit significant liver uptake by Oatp1b2 (Chen et al. 2008). At rifamycin
SV concentration of 100 µM, CLuptake of taurocholate and estrone 3-sulfate were
decreased by 32 % and 65 %, respectively. The relatively higher inhibition of E3S
uptake by 100 µM rifamycin compared to that of taurocholate suggests that sodium-
independent transport plays a more prominent role in hepatic uptake of E3S compared
to that of taurocholate. This finding is in agreement with the knowledge that E3S is
transported by all hepatic Oatp/OATP transporters but not Ntcp/NTCP (Cattori et al.
2001; Kullak-Ublick et al. 2001).
8.2 Fluvastatin Uptake and Metabolism
Previously, hepatic uptake of fluvastatin has been shown to be mediated by OATP2B1,
OATP1B1, OATP1B3 and NTCP (Kopplow et al. 2005; Noe et al. 2007; Greupink et al.
2011; Varma et al. 2011). Unlike for simvastatin and pravastatin, genetic
polymorphisms in the gene coding OATP1B1 have not been reported to result in
decreased hepatic uptake of fluvastatin, suggesting that other transporters or passive
diffusion are mainly responsible for the uptake (Niemi et al. 2006; Pasanen et al. 2006).
This was confirmed in a study using double-transfected MDCKII cells expressing
MRP2 together with OATP1B1, OATP1B3, or OATP2B1 (Kopplow et al. 2005). Km
value for fluvastatin in MRP2-OATP2B1-expressing cells was significantly lower
compared to MRP2-OATP1B1 and MRP2-OATP1B1-expressing cells, being 0,7, 2,4
and 7,0, respectively. Lipophilic fluvastatin is also taken up into cells by passive
diffusion but passive uptake has been reported to constitute only one tenth of the total
uptake in primary cultured rat hepatocytes incubated at 4 °C and 37 °C (Ohtawa et al.
1999). Consistent with this data, hepatic uptake has been reported to be the rate-
determining process in the overall hepatic elimination of fluvastatin in rats (Watanabe et
al. 2010).
48
In the present study, fluvastatin uptake by murine transporters was investigated using
freshly isolated rat hepatocytes. Saturable uptake kinetics with increasing concentration
observed indicate active transport mechanism in hepatic uptake of fluvastatin in rats,
which supports previous data by Ohtawa et al. (1999). Intracellular fluvastatin
concentration seemed to reach a rather high value already at 30 second time point, after
which uptake velocity appeared to slow down (Figure 6C). The apparent decrease in
uptake rate might have been a result from rapid non-specific binding of lipophilic
fluvastatin onto cell membranes but previous data about fluvastatin uptake kinetics do
not support this hypothesis. In an uptake study using plated freshly isolated human
hepatocytes, the uptake of fluvastatin was linear up to approximately 1 minute (Noe et
al. 2007). The linearity of fluvastatin uptake up to 90 seconds of incubation in rat
hepatocytes should be studied in future in order to confirm the reliability of the
calculated kinetic parameters. The negative V and CLuptake observed at fluvastatin
concentration of 25 µM were most likely caused by error in pipetting. Otherwise,
deviation in concentrations of triplicate samples was small.
The calculated Km (5,8 µM) for fluvastatin is slightly higher compared to the Km of
fluvastatin (2,3 µM) in a study using MRP2-OATP1B1/1B3/2B1 quadruple-transfected
MDCKII cells and significantly lower compared to Km of fluvastatin (37,6 µM) in
primary cultured rat hepatocytes (Ohtawa et al. 1999; Kopplow et al. 2005). Passive
diffusion comprised approximately 6 % of the total fluvastatin uptake which is less than
in primary cultured rat hepatocytes. The higher Km and Pdiff for fluvastatin in primary
cultured hepatocytes may have been caused by decreased expression of uptake
transporters (Yang et al. 2012). Lower Km for fluvastatin in transfected cells expressing
human OATPs suggest that sodium-independent saturable transport plays a more
prominent role in hepatic uptake of fluvastatin in humans compared to rats. However,
transfected cell models cannot always predict the uptake behavior in freshly isolated
hepatocytes as the full spectrum of endogenous transporters is not expressed (Noe et al.
2007). Further studies comparing fluvastatin uptake into isolated rat and human
hepatocytes are needed to get a full view of inter-species differences in the hepatic
uptake of fluvastatin. In addition, the Km for fluvastatin was calculated based on data
49
from only one experiment. The reliability of the results should be confirmed by future
research.
Fluvastatin is rapidly and completely metabolized after absorption primarily by
CYP2C9 and to a lesser extent by CYP3A4, CYP2C8 and CYP2D6 in the liver, the
elimination half-life (t1/2) being 0,7 to 0,8 hours (Dain et al. 1993; Scripture and Pieper
2001). The main metabolites are two hydroxylated metabolites, 5-hydroxy-fluvastatin
and 6-hydroxy-fluvastatin, and N-des-isopropyl-fluvastatin, which are excreted in the
bile (Dain et al. 1993). Minor amounts of N-des-isopropyl-dihydro-fluvastatin tetranor,
as well as glucuronide and sulfate conjugates of the main metabolites are also excreted
in the urine. In the present study, the effect of rapid hepatic metabolism on the
intracellular and extracellular concentration of fluvastatin in cryopreserved rat
hepatocytes was investigated. The observed decrease in fluvastatin concentration in cell
samples and in the sum of cell and supernatant samples indicates rather fast metabolism,
which is in agreement with the human metabolism data. The maximum intracellular
concentration decreased by 31 % in ten minutes. Such a high rate of metabolism has an
effect on intracellular fluvastatin concentration already in 90 second incubation time
used in the uptake experiments, which might lead to smaller perceived values of V and
CLuptake.
The presence of hydroxylated fluvastatin and fluvastatin glucuronide in cell and
supernatant samples was confirmed in UPLC/MS analysis although the peak areas were
very small compared to those of fluvastatin (Appendix 3). Direct comparison of
metabolite and fluvastatin concentrations cannot be made using the peak areas. The lack
of signal for major metabolite N-des-isopropyl-fluvastatin in the samples was surprising.
It may be due to inter-species differences in fluvastatin metabolism or the used
detection method of UPLC analysis. Quadrupole time-of-flight (QTOF) mass
spectrometer would have enabled detection of metabolites with higher sensitivity and
greater accuracy compared to of triple quadrupole MS (Zhang et al. 2000; Lacorte and
Fernandez-Alba 2006).
50
8.3 Uptake Kinetics of Entacapone
The lack of saturability in the uptake kinetics of entacapone indicates that hepatic
uptake of entacapone is not predominantly mediated by active transport mechanisms in
the concentration range of 3 – 160 µM. Entacapone is slightly lipophilic at pH 7,5, with
an apparent octanol-water partition coefficient (logPapp) value of 0,8 (Forsberg et al.
2005). The linear uptake kinetics is in agreement with lipophilicity, suggesting that
entacapone is taken up into hepatocytes by passive diffusion. In a comparative
experiment with passively permeating propranolol and Oatp inhibitor rifamycin, the net
uptake and CLuptake of E3S in freshly isolated rat hepatocytes was almost identical when
incubated with 50 µM entacapone or 50 µM propranolol, whereas incubation with 50
µM rifamycin decreased the net uptake and CLuptake of E3S significantly. Entacapone
did not seem to inhibit E3S uptake in low concentrations, the half maximal inhibitory
concentration (IC50) being 237 µM. Altogether, entacapone did not seem to share same
active transport mechanisms with E3S in rat hepatocytes to a significant degree. The
results suggest that Oatp transporters do not play a major role in the hepatic uptake of
entacapone in rats, although some inhibition of E3S uptake was observed at higher
concentrations.
However, the significant difference between the net uptake, V and CLuptake of
entacapone between freshly isolated rat and cryopreserved human hepatocytes indicates
that either hepatic uptake is inefficient due to lesser active uptake or more potent efflux
or intracellular metabolism is much more rapid in human hepatocytes. Similar to
fluvastatin, entacapone is rapidly metabolized in the human liver, t1/2 being only 0,4 -
0,7 hours (Heikkinen et al. 2001). Species difference in biotransformation of entacapone
between rats and humans has been reported but no published data about intrinsic
clearance for metabolism in rats is available (Wikberg et al. 1993). Also the effect of
cryopreservation on transporter function may contribute to the observed difference in
intracellular drug concentration if active transport is responsible of entacapone uptake.
If the species difference in intracellular entacapone concentration results from hepatic
uptake rather than metabolism, the contribution of passive diffusion to the total hepatic
uptake of entacapone may be smaller than the results from uptake experiments in rat
51
hepatocytes suggest. The significant carryover effect in the UPLC method of
entacapone prevented the reliable quantification of low intracellular concentrations,
which limited the data used in Km and IC50 calculations. Also more repetitions of the
uptake assays would have been needed to improve the reliability of the results. The role
of passive diffusion and active transport on hepatic uptake of entacapone should be
further studied in the future using both 4 °C and 37 °C incubation conditions and more
repetitions.
8.4 Use of Non-Radiolabeled Compounds in the Oil-Spin Method
Uptake experiments using the oil-spin method are usually performed using radio-
labeled compounds in order to enhance the rather low throughput of the method (Soars
et al. 2009). In the present study, radiolabeled fluvastatin and entacapone were not
available and intracellular concentrations of the drugs was determined using the oil-spin
method adapted to non-radiolabeled compounds developed by Paine et al. (2008).
Compared to experiments with radiolabeled compounds, quantification of samples with
UPLC/MS analysis added more steps to the sample preparation process as lysed cells
had to be extracted from the UPLC samples. Since cell samples had to be pipetted out of
the original microcentrifuge tubes and precipitated in methanol, it is possible that part of
the drug remained in the original tubes or in the lower ammonium acetate phase after
methanol precipitation. It is also possible that cells in the reaction mixture samples were
not properly lysed with the addition of methanol. This could be the reason why the
quantified concentrations of reaction mixtures were lower than they were prepared to be.
If the quantified concentrations did not reflect the actual concentrations of the reaction
mixtures, the calculated CLuptake values for fluvastatin and entacapone should be lower.
In addition to sample preparation, the finding of a good LC/MS method for
quantification of samples can be problematic, as was seen for UPLC method of
entacapone. Altogether, the oil-spin assay using non-radiolabeled substrates is a
strenuous method that is clearly not useful in the early phases of drug discovery and
development where higher throughput methods for screening of drug-transporter
interactions are needed.

52
9 CONCLUSIONS
In conclusion, by comparing the uptake kinetics of fluvastatin and entacapone on the
uptake of taurocholic acid and estrone 3-sulfate in freshly isolated rat hepatocytes and
cryopreserved rat and human hepatocytes, fluvastatin uptake showed active saturable
transport kinetics with rapid metabolism in rat hepatocytes, whereas entacapone uptake
in rat hepatocytes appeared to be linear and did not seem to inhibit active transport
mechanisms of E3S at clinically significant concentrations. Significantly lower hepatic
uptake of taurocholate and entacapone was observed between rat and human
hepatocytes, although cryopreservation may have had an effect on the noticed difference.
The overall results of the study suggest that Oatp transporters do not play a significant
role in hepatic uptake of entacapone. However, the reliability of the results is
questionable due to lack of parallel experiments and problems in the quantification of
samples by UPLC/MS analysis. Further studies are needed to elucidate the role of active
and passive processes in the hepatic uptake of entacapone. Knowledge about the
substrates of Oatp transporters helps to assess drug disposition in humans and to explain
drug interactions and interindividual variability in drug pharmacokinetics, efficacy and
toxicity.

53
REFERENCES
Adachi H, Suzuki T, Abe M, Asano N, Mizutamari H, Tanemoto M, Nishio T,
Onogawa T, Toyohara T, Kasai S, Satoh F, Suzuki M, Tokui T, Unno M, Shimosegawa
T, Matsuno S, Ito S, Abe T: Molecular characterization of human and rat organic anion
transporter OATP-D. Am J Physiol Renal Physiol 285: F1188-97, 2003
Ahlin G, Hilgendorf C, Karlsson J, Szigyarto CA, Uhlen M, Artursson P: Endogenous
gene and protein expression of drug-transporting proteins in cell lines routinely used in
drug discovery programs. Drug Metab Dispos 37: 2275-2283, 2009
Allen JD, van Loevezijn A, Lakhai JM, van der Valk M, van Tellingen O, Reid G,
Schellens JH, Koomen GJ, Schinkel AH: Potent and specific inhibition of the breast
cancer resistance protein multidrug transporter in vitro and in mouse intestine by a
novel analogue of fumitremorgin C. Mol Cancer Ther 1: 417-425, 2002
Bachmakov I, Glaeser H, Fromm MF, Konig J: Interaction of oral antidiabetic drugs
with hepatic uptake transporters: focus on organic anion transporting polypeptides and
organic cation transporter 1. Diabetes 57: 1463-1469, 2008
Ballatori N, Christian WV, Lee JY, Dawson PA, Soroka CJ, Boyer JL, Madejczyk MS,
Li N: OSTalpha-OSTbeta: a major basolateral bile acid and steroid transporter in human
intestinal, renal, and biliary epithelia. Hepatology 42: 1270-1279, 2005
Bartholome K, Rius M, Letschert K, Keller D, Timmer J, Keppler D: Data-based
mathematical modeling of vectorial transport across double-transfected polarized cells.
Drug Metab Dispos 35: 1476-1481, 2007
Bergwerk AJ, Shi X, Ford AC, Kanai N, Jacquemin E, Burk RD, Bai S, Novikoff PM,
Stieger B, Meier PJ, Schuster VL, Wolkoff AW: Immunologic distribution of an
organic anion transport protein in rat liver and kidney. Am J Physiol 271: G231-8, 1996
Berry MN,Friend DS: High-yield preparation of isolated rat liver parenchymal cells: a
biochemical and fine structural study. J Cell Biol 43: 506-520, 1969
Biegel A, Gebauer S, Hartrodt B, Brandsch M, Neubert K, Thondorf I: Three-
dimensional quantitative structure-activity relationship analyses of beta-lactam
antibiotics and tripeptides as substrates of the mammalian H+/peptide cotransporter
PEPT1. J Med Chem 48: 4410-4419, 2005
Blouin A, Bolender RP, Weibel ER: Distribution of organelles and membranes between
hepatocytes and nonhepatocytes in the rat liver parenchyma. A stereological study. J
Cell Biol 72: 441-455, 1977
Bonge H, Hallen S, Fryklund J, Sjostrom JE: Cytostar-T scintillating microplate assay
for measurement of sodium-dependent bile acid uptake in transfected HEK-293 cells.
Anal Biochem 282: 94-101, 2000

54
Braet F,Wisse E: Structural and functional aspects of liver sinusoidal endothelial cell
fenestrae: a review. Comp Hepatol 1: 1, 2002
Broccatelli F, Carosati E, Neri A, Frosini M, Goracci L, Oprea TI, Cruciani G: A novel
approach for predicting P-glycoprotein (ABCB1) inhibition using molecular interaction
fields. J Med Chem 54: 1740-1751, 2011
Buchler M, Konig J, Brom M, Kartenbeck J, Spring H, Horie T, Keppler D: cDNA
cloning of the hepatocyte canalicular isoform of the multidrug resistance protein, cMrp,
reveals a novel conjugate export pump deficient in hyperbilirubinemic mutant rats. J
Biol Chem 271: 15091-15098, 1996
Cattori V, van Montfoort JE, Stieger B, Landmann L, Meijer DK, Winterhalter KH,
Meier PJ, Hagenbuch B: Localization of organic anion transporting polypeptide 4
(Oatp4) in rat liver and comparison of its substrate specificity with Oatp1, Oatp2 and
Oatp3. Pflugers Arch 443: 188-195, 2001
Chandra P,Brouwer KL: The complexities of hepatic drug transport: current knowledge
and emerging concepts. Pharm Res 21: 719-735, 2004
Chang C,Swaan PW: Computational approaches to modeling drug transporters. Eur J
Pharm Sci 27: 411-424, 2006
Chen C, Stock JL, Liu X, Shi J, Van Deusen JW, DiMattia DA, Dullea RG, de Morais
SM: Utility of a novel Oatp1b2 knockout mouse model for evaluating the role of
Oatp1b2 in the hepatic uptake of model compounds. Drug Metab Dispos 36: 1840-1845,
2008
Cui Y, Konig J, Leier I, Buchholz U, Keppler D: Hepatic uptake of bilirubin and its
conjugates by the human organic anion transporter SLC21A6. J Biol Chem 276: 9626-
9630, 2001
Cvetkovic M, Leake B, Fromm MF, Wilkinson GR, Kim RB: OATP and P-
glycoprotein transporters mediate the cellular uptake and excretion of fexofenadine.
Drug Metab Dispos 27: 866-871, 1999
Dain JG, Fu E, Gorski J, Nicoletti J, Scallen TJ: Biotransformation of fluvastatin
sodium in humans. Drug Metab Dispos 21: 567-572, 1993
Dansette PM, Jaoen M, Pons C: HMG-CoA reductase activity in human liver
microsomes: comparative inhibition by statins. Exp Toxicol Pathol 52: 145-148, 2000
de Waziers I, Cugnenc PH, Yang CS, Leroux JP, Beaune PH: Cytochrome P 450
isoenzymes, epoxide hydrolase and glutathione transferases in rat and human hepatic
and extrahepatic tissues. J Pharmacol Exp Ther 253: 387-394, 1990
Deng JW, Song IS, Shin HJ, Yeo CW, Cho DY, Shon JH, Shin JG: The effect of
SLCO1B1*15 on the disposition of pravastatin and pitavastatin is substrate dependent:
55
the contribution of transporting activity changes by SLCO1B1*15. Pharmacogenet
Genomics 18: 424-433, 2008
Diao L, Ekins S, Polli JE: Quantitative structure activity relationship for inhibition of
human organic cation/carnitine transporter. Mol Pharm 7: 2120-2131, 2010
Ding PR, Tiwari AK, Ohnuma S, Lee JW, An X, Dai CL, Lu QS, Singh S, Yang DH,
Talele TT, Ambudkar SV, Chen ZS: The phosphodiesterase-5 inhibitor vardenafil is a
potent inhibitor of ABCB1/P-glycoprotein transporter. PLoS One 6: e19329, 2011
Duan P, Li S, Ai N, Hu L, Welsh WJ, You G: Potent inhibitors of human organic anion
transporters 1 and 3 from clinical drug libraries: discovery and molecular
characterization. Mol Pharm 9: 3340-3346, 2012
Duff T, Carter S, Feldman G, McEwan G, Pfaller W, Rhodes P, Ryan M, Hawksworth
G: Transepithelial resistance and inulin permeability as endpoints in in vitro
nephrotoxicity testing. Altern Lab Anim 30 Suppl 2: 53-59, 2002
Eckhardt U, Schroeder A, Stieger B, Hochli M, Landmann L, Tynes R, Meier PJ,
Hagenbuch B: Polyspecific substrate uptake by the hepatic organic anion transporter
Oatp1 in stably transfected CHO cells. Am J Physiol 276: G1037-42, 1999
EMA: Guideline on the Investigation of Drug Interactions 21.6.2012. European
Medicines Agency 2012. Searched from the Internet 13.10.2013:
http://www.ema.europa.eu/docs/en_GB/document_library/Scientific_guideline/2012/07/
WC500129606.pdf
Edmondson JW, Miller BA, Lumeng L: Effect of glucagon on hepatic taurocholate
uptake: relationship to membrane potential. Am J Physiol 249: G427-33, 1985
Faber KN, Muller M, Jansen PL: Drug transport proteins in the liver. Adv Drug Deliv
Rev 55: 107-124, 2003
Fahrmayr C, Fromm MF, Konig J: Hepatic OATP and OCT uptake transporters: their
role for drug-drug interactions and pharmacogenetic aspects. Drug Metab Rev 42: 380-
401, 2010
Fattinger K, Cattori V, Hagenbuch B, Meier PJ, Stieger B: Rifamycin SV and
rifampicin exhibit differential inhibition of the hepatic rat organic anion transporting
polypeptides, Oatp1 and Oatp2. Hepatology 32: 82-86, 2000
FDA: Guidance for Industry. Waiver of In Vivo Bioavailability and Bioequivalence
Studies for Immediate-Release Solid Oral Dosage Forms Based on a Biopharmaceutics
Classification System. US Food and Drug Administration 2000. Searched from the
Internet 8.10.2013:
http://www.fda.gov/downloads/Drugs/GuidanceComplianceRegulatoryInformation/Gui
dances/UCM070246.pdf.

56
FDA: Guidance for Industry. Drug Interaction Studies — Study Design, Data Analysis,
Implications for Dosing, and Labeling Recommendations.17.2.2012. US Food and Drug
Admistration 2012. Searched from the Internet 13.10.2013:
http://www.fda.gov/downloads/Drugs/GuidanceComplianceRegulatoryInformation/Gui
dances/UCM292362.pdf?utm_source=fdaSearch&utm_medium=website&utm_term=dr
aft%20february%202012%20drug%20interaction&utm_content=2
Fischman AJ, Alpert NM, Rubin RH: Pharmacokinetic imaging: a noninvasive method
for determining drug distribution and action. Clin Pharmacokinet 41: 581-602, 2002
Forsberg MM, Huotari M, Savolainen J, Mannisto PT: The role of physicochemical
properties of entacapone and tolcapone on their efficacy during local intrastriatal
administration. Eur J Pharm Sci 24: 503-511, 2005
Fraser R, Bosanquet AG, Day WA: Filtration of chylomicrons by the liver may
influence cholesterol metabolism and atherosclerosis. Atherosclerosis 29: 113-123,
1978
Generaux GT, Bonomo FM, Johnson M, Doan KM: Impact of SLCO1B1 (OATP1B1)
and ABCG2 (BCRP) genetic polymorphisms and inhibition on LDL-C lowering and
myopathy of statins. Xenobiotica 41: 639-651, 2011
Geraud C, Evdokimov K, Straub BK, Peitsch WK, Demory A, Dorflinger Y,
Schledzewski K, Schmieder A, Schemmer P, Augustin HG, Schirmacher P, Goerdt S:
Unique cell type-specific junctional complexes in vascular endothelium of human and
rat liver sinusoids. PLoS One 7: e34206, 2012
Giacomini KM, Huang SM, Tweedie DJ, Benet LZ, Brouwer KL, Chu X, Dahlin A,
Evers R, Fischer V, Hillgren KM, Hoffmaster KA, Ishikawa T, Keppler D, Kim RB,
Lee CA, Niemi M, Polli JW, Sugiyama Y, Swaan PW, Ware JA, Wright SH, Yee SW,
Zamek-Gliszczynski MJ, Zhang L: Membrane transporters in drug development. Nat
Rev Drug Discov 9: 215-236, 2010
Giacomini KM, Balimane PV, Cho SK, Eadon M, Edeki T, Hillgren KM, Huang SM,
Sugiyama Y, Weitz D, Wen Y, Xia CQ, Yee SW, Zimdahl H, Niemi M, International
Transporter Consortium: International Transporter Consortium commentary on
clinically important transporter polymorphisms. Clin Pharmacol Ther 94: 23-26, 2013
Goh LB, Spears KJ, Yao D, Ayrton A, Morgan P, Roland Wolf C, Friedberg T:
Endogenous drug transporters in in vitro and in vivo models for the prediction of drug
disposition in man. Biochem Pharmacol 64: 1569-1578, 2002
Greupink R, Dillen L, Monshouwer M, Huisman MT, Russel FG: Interaction of
fluvastatin with the liver-specific Na+ -dependent taurocholate cotransporting
polypeptide (NTCP). Eur J Pharm Sci 44: 487-496, 2011
Grube M, Kock K, Oswald S, Draber K, Meissner K, Eckel L, Bohm M, Felix SB,
Vogelgesang S, Jedlitschky G, Siegmund W, Warzok R, Kroemer HK: Organic anion

57
transporting polypeptide 2B1 is a high-affinity transporter for atorvastatin and is
expressed in the human heart. Clin Pharmacol Ther 80: 607-620, 2006
Hagenbuch B,Meier PJ: Organic anion transporting polypeptides of the OATP/ SLC21
family: phylogenetic classification as OATP/ SLCO superfamily, new nomenclature
and molecular/functional properties. Pflugers Arch 447: 653-665, 2004
Hartkoorn RC, Kwan WS, Shallcross V, Chaikan A, Liptrott N, Egan D, Sora ES,
James CE, Gibbons S, Bray PG, Back DJ, Khoo SH, Owen A: HIV protease inhibitors
are substrates for OATP1A2, OATP1B1 and OATP1B3 and lopinavir plasma
concentrations are influenced by SLCO1B1 polymorphisms. Pharmacogenet Genomics
20: 112-120, 2010
Hayeshi R, Hilgendorf C, Artursson P, Augustijns P, Brodin B, Dehertogh P, Fisher K,
Fossati L, Hovenkamp E, Korjamo T, Masungi C, Maubon N, Mols R, Mullertz A,
Monkkonen J, O'Driscoll C, Oppers-Tiemissen HM, Ragnarsson EG, Rooseboom M,
Ungell AL: Comparison of drug transporter gene expression and functionality in Caco-2
cells from 10 different laboratories. Eur J Pharm Sci 35: 383-396, 2008
Heikkinen H, Saraheimo M, Antila S, Ottoila P, Pentikainen PJ: Pharmacokinetics of
entacapone, a peripherally acting catechol-O-methyltransferase inhibitor, in man. A
study using a stable isotope techique. Eur J Clin Pharmacol 56: 821-826, 2001
Heredi-Szabo K, Palm JE, Andersson TB, Pal A, Mehn D, Fekete Z, Beery E, Jakab KT,
Jani M, Krajcsi P: A P-gp vesicular transport inhibition assay - optimization and
validation for drug-drug interaction testing. Eur J Pharm Sci 49: 773-781, 2013
Houle R, Raoul J, Levesque JF, Pang KS, Nicoll-Griffith DA, Silva JM: Retention of
transporter activities in cryopreserved, isolated rat hepatocytes. Drug Metab Dispos 31:
447-451, 2003
Hubbard AL, Wall DA, Ma A: Isolation of rat hepatocyte plasma membranes. I.
Presence of the three major domains. J Cell Biol 96: 217-229, 1983
Ishibashi H, Nakamura M, Komori A, Migita K, Shimoda S: Liver architecture, cell
function, and disease. Semin Immunopathol 31: 399-409, 2009
Ishikawa T: The ATP-dependent glutathione S-conjugate export pump. Trends Biochem
Sci 17: 463-468, 1992
Jacobson TA: Comparative pharmacokinetic interaction profiles of pravastatin,
simvastatin, and atorvastatin when coadministered with cytochrome P450 inhibitors.
Am J Cardiol 94: 1140-1146, 2004
Jaisue S, Gerber JP, Davey AK: Pharmacokinetics of fexofenadine following LPS
administration to rats. Xenobiotica 40: 743-750, 2010
58
Jedlitschky G, Leier I, Buchholz U, Hummel-Eisenbeiss J, Burchell B, Keppler D:
ATP-dependent transport of bilirubin glucuronides by the multidrug resistance protein
MRP1 and its hepatocyte canalicular isoform MRP2. Biochem J 327 ( Pt 1): 305-310,
1997
Jungermann K,Kietzmann T: Zonation of parenchymal and nonparenchymal
metabolism in liver. Annu Rev Nutr 16: 179-203, 1996
Kalliokoski A, Neuvonen M, Neuvonen PJ, Niemi M: The effect of SLCO1B1
polymorphism on repaglinide pharmacokinetics persists over a wide dose range. Br J
Clin Pharmacol 66: 818-825, 2008
Kameyama Y, Yamashita K, Kobayashi K, Hosokawa M, Chiba K: Functional
characterization of SLCO1B1 (OATP-C) variants, SLCO1B1*5, SLCO1B1*15 and
SLCO1B1*15+C1007G, by using transient expression systems of HeLa and HEK293
cells. Pharmacogenet Genomics 15: 513-522, 2005
Kirman CR, Sweeney LM, Meek ME, Gargas ML: Assessing the dose-dependency of
allometric scaling performance using physiologically based pharmacokinetic modeling.
Regul Toxicol Pharmacol 38: 345-367, 2003
Kis E, Nagy T, Jani M, Molnar E, Janossy J, Ujhellyi O, Nemet K, Heredi-Szabo K,
Krajcsi P: Leflunomide and its metabolite A771726 are high affinity substrates of
BCRP: implications for drug resistance. Ann Rheum Dis 68: 1201-1207, 2009
Kobayashi D, Nozawa T, Imai K, Nezu J, Tsuji A, Tamai I: Involvement of human
organic anion transporting polypeptide OATP-B (SLC21A9) in pH-dependent transport
across intestinal apical membrane. J Pharmacol Exp Ther 306: 703-708, 2003
König J, Cui Y, Nies AT, Keppler D: A novel human organic anion transporting
polypeptide localized to the basolateral hepatocyte membrane. Am J Physiol
Gastrointest Liver Physiol 278: G156-64, 2000a
König J, Cui Y, Nies AT, Keppler D: Localization and genomic organization of a new
hepatocellular organic anion transporting polypeptide. J Biol Chem 275: 23161-23168,
2000b
Koopen NR, Wolters H, Muller M, Schippers IJ, Havinga R, Roelofsen H, Vonk RJ,
Stieger B, Meier PJ, Kuipers F: Hepatic bile salt flux does not modulate level and
activity of the sinusoidal Na+-taurocholate cotransporter (ntcp) in rats. J Hepatol 27:
699-706, 1997
Kopplow K, Letschert K, Konig J, Walter B, Keppler D: Human hepatobiliary transport
of organic anions analyzed by quadruple-transfected cells. Mol Pharmacol 68: 1031-
1038, 2005

59
Kopplow K, Letschert K, Konig J, Walter B, Keppler D: Human hepatobiliary transport
of organic anions analyzed by quadruple-transfected cells. Mol Pharmacol 68: 1031-
1038, 2005
Kouzuki H, Suzuki H, Ito K, Ohashi R, Sugiyama Y: Contribution of sodium
taurocholate co-transporting polypeptide to the uptake of its possible substrates into rat
hepatocytes. J Pharmacol Exp Ther 286: 1043-1050, 1998
Kouzuki H, Suzuki H, Ito K, Ohashi R, Sugiyama Y: Contribution of organic anion
transporting polypeptide to uptake of its possible substrates into rat hepatocytes. J
Pharmacol Exp Ther 288: 627-634, 1999
Kraft ME, Glaeser H, Mandery K, Konig J, Auge D, Fromm MF, Schlotzer-Schrehardt
U, Welge-Lussen U, Kruse FE, Zolk O: The prostaglandin transporter OATP2A1 is
expressed in human ocular tissues and transports the antiglaucoma prostanoid
latanoprost. Invest Ophthalmol Vis Sci 51: 2504-2511, 2010
Kullak-Ublick GA, Hagenbuch B, Stieger B, Schteingart CD, Hofmann AF, Wolkoff
AW, Meier PJ: Molecular and functional characterization of an organic anion
transporting polypeptide cloned from human liver. Gastroenterology 109: 1274-1282,
1995
Kullak-Ublick GA, Ismair MG, Stieger B, Landmann L, Huber R, Pizzagalli F,
Fattinger K, Meier PJ, Hagenbuch B: Organic anion-transporting polypeptide B
(OATP-B) and its functional comparison with three other OATPs of human liver.
Gastroenterology 120: 525-533, 2001
Kusuhara H,Sugiyama Y: Pharmacokinetic modeling of the hepatobiliary transport
mediated by cooperation of uptake and efflux transporters. Drug Metab Rev 42: 539-
550, 2010
Lacorte S,Fernandez-Alba AR: Time of flight mass spectrometry applied to the liquid
chromatographic analysis of pesticides in water and food. Mass Spectrom Rev 25: 866-
880, 2006
Lakehal F, Wendum D, Barbu V, Becquemont L, Poupon R, Balladur P, Hannoun L,
Ballet F, Beaune PH, Housset C: Phase I and phase II drug-metabolizing enzymes are
expressed and heterogeneously distributed in the biliary epithelium. Hepatology 30:
1498-1506, 1999
Lam P, Wang R, Ling V: Bile acid transport in sister of P-glycoprotein (ABCB11)
knockout mice. Biochemistry 44: 12598-12605, 2005
Lankas GR, Cartwright ME, Umbenhauer D: P-glycoprotein deficiency in a
subpopulation of CF-1 mice enhances avermectin-induced neurotoxicity. Toxicol Appl
Pharmacol 143: 357-365, 1997

60
Lau YY, Wu CY, Okochi H, Benet LZ: Ex situ inhibition of hepatic uptake and efflux
significantly changes metabolism: hepatic enzyme-transporter interplay. J Pharmacol
Exp Ther 308: 1040-1045, 2004
Lau YY, Okochi H, Huang Y, Benet LZ: Multiple transporters affect the disposition of
atorvastatin and its two active hydroxy metabolites: application of in vitro and ex situ
systems. J Pharmacol Exp Ther 316: 762-771, 2006
LeCluyse EL, Bullock P, Parkinson A: Strategies for restoration and maintenance of
normal hepatic structure and function in long-term cultures of rat hepatocytes. Adv
Drug Deliv Rev 22: 133-186, 1996
LeCluyse EL, Audus KL, Hochman JH: Formation of extensive canalicular networks by
rat hepatocytes cultured in collagen-sandwich configuration. Am J Physiol 266: C1764-
74, 1994
Lee W, Glaeser H, Smith LH, Roberts RL, Moeckel GW, Gervasini G, Leake BF, Kim
RB: Polymorphisms in human organic anion-transporting polypeptide 1A2 (OATP1A2):
implications for altered drug disposition and central nervous system drug entry. J Biol
Chem 280: 9610-9617, 2005
Li L, Meier PJ, Ballatori N: Oatp2 mediates bidirectional organic solute transport: a role
for intracellular glutathione. Mol Pharmacol 58: 335-340, 2000
Li M, Yuan H, Li N, Song G, Zheng Y, Baratta M, Hua F, Thurston A, Wang J, Lai Y:
Identification of interspecies difference in efflux transporters of hepatocytes from dog,
rat, monkey and human. Eur J Pharm Sci 35: 114-126, 2008
Li N, Hartley DP, Cherrington NJ, Klaassen CD: Tissue expression, ontogeny, and
inducibility of rat organic anion transporting polypeptide 4. J Pharmacol Exp Ther 301:
551-560, 2002
Liu X, LeCluyse EL, Brouwer KR, Gan LS, Lemasters JJ, Stieger B, Meier PJ, Brouwer
KL: Biliary excretion in primary rat hepatocytes cultured in a collagen-sandwich
configuration. Am J Physiol 277: G12-21, 1999
Lohmann C, Gelius B, Danielsson J, Skoging-Nyberg U, Hollnack E, Dudley A,
Wahlberg J, Hoogstraate J, Gustavsson L: Scintillation proximity assay for measuring
uptake by the human drug transporters hOCT1, hOAT3, and hOATP1B1. Anal
Biochem 366: 117-125, 2007
Maeda K, Ikeda Y, Fujita T, Yoshida K, Azuma Y, Haruyama Y, Yamane N, Kumagai
Y, Sugiyama Y: Identification of the rate-determining process in the hepatic clearance
of atorvastatin in a clinical cassette microdosing study. Clin Pharmacol Ther 90: 575-
581, 2011

61
Mahagita C, Grassl SM, Piyachaturawat P, Ballatori N: Human organic anion
transporter 1B1 and 1B3 function as bidirectional carriers and do not mediate GSH-bile
acid cotransport. Am J Physiol Gastrointest Liver Physiol 293: G271-8, 2007
Martini F,Nath JL: Fundamentals of Anatomy & Physiology. 9th. Benjamin Cummings,
San Francisco, CA, USA 2011
Matsushima S, Maeda K, Kondo C, Hirano M, Sasaki M, Suzuki H, Sugiyama Y:
Identification of the hepatic efflux transporters of organic anions using double-
transfected Madin-Darby canine kidney II cells expressing human organic anion-
transporting polypeptide 1B1 (OATP1B1)/multidrug resistance-associated protein 2,
OATP1B1/multidrug resistance 1, and OATP1B1/breast cancer resistance protein. J
Pharmacol Exp Ther 314: 1059-1067, 2005
Meier PJ, St Meier-Abt A, Barrett C, Boyer JL: Mechanisms of taurocholate transport
in canalicular and basolateral rat liver plasma membrane vesicles. Evidence for an
electrogenic canalicular organic anion carrier. J Biol Chem 259: 10614-10622, 1984
Menochet K, Kenworthy KE, Houston JB, Galetin A: Simultaneous assessment of
uptake and metabolism in rat hepatocytes: a comprehensive mechanistic model. J
Pharmacol Exp Ther 341: 2-15, 2012a
Menochet K, Kenworthy KE, Houston JB, Galetin A: Use of mechanistic modeling to
assess interindividual variability and interspecies differences in active uptake in human
and rat hepatocytes. Drug Metab Dispos 40: 1744-1756, 2012b
Merino G, van Herwaarden AE, Wagenaar E, Jonker JW, Schinkel AH: Sex-dependent
expression and activity of the ATP-binding cassette transporter breast cancer resistance
protein (BCRP/ABCG2) in liver. Mol Pharmacol 67: 1765-1771, 2005
Middleton E: The molecular configuration of inulin: implications for ultrafiltration
theory and glomerular permeability. J Membr Biol 34: 93-101, 1977
Mizukami K, Chang HS, Yabuki A, Kawamichi T, Hossain MA, Rahman MM, Uddin
MM, Yamato O: Rapid genotyping assays for the 4-base pair deletion of canine
MDR1/ABCB1 gene and low frequency of the mutant allele in Border Collie dogs. J
Vet Diagn Invest 24: 127-134, 2012
Mizuno N, Niwa T, Yotsumoto Y, Sugiyama Y: Impact of drug transporter studies on
drug discovery and development. Pharmacol Rev 55: 425-461, 2003
Murray GI, Barnes TS, Sewell HF, Ewen SW, Melvin WT, Burke MD: The
immunocytochemical localisation and distribution of cytochrome P-450 in normal
human hepatic and extrahepatic tissues with a monoclonal antibody to human
cytochrome P-450. Br J Clin Pharmacol 25: 465-475, 1988
62
Nakata K, Tanaka Y, Nakano T, Adachi T, Tanaka H, Kaminuma T, Ishikawa T:
Nuclear receptor-mediated transcriptional regulation in Phase I, II, and III xenobiotic
metabolizing systems. Drug Metab Pharmacokinet 21: 437-457, 2006
Neyt S, Huisman MT, Vanhove C, De Man H, Vliegen M, Moerman L, Dumolyn C,
Mannens G, De Vos F: In vivo visualization and quantification of (Disturbed) Oatp-
mediated hepatic uptake and Mrp2-mediated biliary excretion of 99mTc-mebrofenin in
mice. J Nucl Med 54: 624-630, 2013
Niemi M, Schaeffeler E, Lang T, Fromm MF, Neuvonen M, Kyrklund C, Backman JT,
Kerb R, Schwab M, Neuvonen PJ, Eichelbaum M, Kivisto KT: High plasma pravastatin
concentrations are associated with single nucleotide polymorphisms and haplotypes of
organic anion transporting polypeptide-C (OATP-C, SLCO1B1). Pharmacogenetics 14:
429-440, 2004
Niemi M, Neuvonen PJ, Hofmann U, Backman JT, Schwab M, Lutjohann D, von
Bergmann K, Eichelbaum M, Kivisto KT: Acute effects of pravastatin on cholesterol
synthesis are associated with SLCO1B1 (encoding OATP1B1) haplotype *17.
Pharmacogenet Genomics 15: 303-309, 2005
Niemi M, Pasanen MK, Neuvonen PJ: SLCO1B1 polymorphism and sex affect the
pharmacokinetics of pravastatin but not fluvastatin. Clin Pharmacol Ther 80: 356-366,
2006
Niemi M, Pasanen MK, Neuvonen PJ: Organic anion transporting polypeptide 1B1: a
genetically polymorphic transporter of major importance for hepatic drug uptake.
Pharmacol Rev 63: 157-181, 2011
Nies AT, Schwab M, Keppler D: Interplay of conjugating enzymes with OATP uptake
transporters and ABCC/MRP efflux pumps in the elimination of drugs. Expert Opin
Drug Metab Toxicol 4: 545-568, 2008
Nies AT, Niemi M, Burk O, Winter S, Zanger UM, Stieger B, Schwab M, Schaeffeler E:
Genetics is a major determinant of expression of the human hepatic uptake transporter
OATP1B1, but not of OATP1B3 and OATP2B1. Genome Med 5: 1, 2013
Noe J, Portmann R, Brun ME, Funk C: Substrate-dependent drug-drug interactions
between gemfibrozil, fluvastatin and other organic anion-transporting peptide (OATP)
substrates on OATP1B1, OATP2B1, and OATP1B3. Drug Metab Dispos 35: 1308-
1314, 2007
Ohtawa M, Masuda N, Akasaka I, Nakashima A, Ochiai K, Moriyasu M: Cellular
uptake of fluvastatin, an inhibitor of HMG-CoA reductase, by rat cultured hepatocytes
and human aortic endothelial cells. Br J Clin Pharmacol 47: 383-389, 1999
Oswald S, Konig J, Lutjohann D, Giessmann T, Kroemer HK, Rimmbach C, Rosskopf
D, Fromm MF, Siegmund W: Disposition of ezetimibe is influenced by polymorphisms
of the hepatic uptake carrier OATP1B1. Pharmacogenet Genomics 18: 559-568, 2008
63
Otsuka M, Matsumoto T, Morimoto R, Arioka S, Omote H, Moriyama Y: A human
transporter protein that mediates the final excretion step for toxic organic cations. Proc
Natl Acad Sci U S A 102: 17923-17928, 2005
Paine SW, Parker AJ, Gardiner P, Webborn PJ, Riley RJ: Prediction of the
pharmacokinetics of atorvastatin, cerivastatin, and indomethacin using kinetic models
applied to isolated rat hepatocytes. Drug Metab Dispos 36: 1365-1374, 2008
Pasanen MK, Neuvonen M, Neuvonen PJ, Niemi M: SLCO1B1 polymorphism
markedly affects the pharmacokinetics of simvastatin acid. Pharmacogenet Genomics
16: 873-879, 2006
Petzinger E,Fückel D: Evidence for a saturable, energy-dependent and carrier-mediated
uptake of oral antidiabetics into rat hepatocytes. Eur J Pharmacol 213: 381-391, 1992
Poirier A, Lave T, Portmann R, Brun ME, Senner F, Kansy M, Grimm HP, Funk C:
Design, data analysis, and simulation of in vitro drug transport kinetic experiments
using a mechanistic in vitro model. Drug Metab Dispos 36: 2434-2444, 2008
Ramsey LB, Bruun GH, Yang W, Trevino LR, Vattathil S, Scheet P, Cheng C, Rosner
GL, Giacomini KM, Fan Y, Sparreboom A, Mikkelsen TS, Corydon TJ, Pui CH, Evans
WE, Relling MV: Rare versus common variants in pharmacogenetics: SLCO1B1
variation and methotrexate disposition. Genome Res 22: 1-8, 2012
Reichel C, Gao B, Van Montfoort J, Cattori V, Rahner C, Hagenbuch B, Stieger B,
Kamisako T, Meier PJ: Localization and function of the organic anion-transporting
polypeptide Oatp2 in rat liver. Gastroenterology 117: 688-695, 1999
Roberts MS, Magnusson BM, Burczynski FJ, Weiss M: Enterohepatic circulation:
physiological, pharmacokinetic and clinical implications. Clin Pharmacokinet 41: 751-
790, 2002
Rodrigues AC, Perin PM, Purim SG, Silbiger VN, Genvigir FD, Willrich MA, Arazi SS,
Luchessi AD, Hirata MH, Bernik MM, Dorea EL, Santos C, Faludi AA, Bertolami MC,
Salas A, Freire A, Lareu MV, Phillips C, Porras-Hurtado L, Fondevila M, Carracedo A,
Hirata RD: Pharmacogenetics of OATP Transporters Reveals That SLCO1B1
c.388A>G Variant Is Determinant of Increased Atorvastatin Response. Int J Mol Sci 12:
5815-5827, 2011
Rowland M,Tozer TN: Clinical pharmacokinetics and pharmacodynamics: concepts and
applications. 4th. Lippincott Williams & Wilkins, Baltimore, MD, USA 2011
Rudin M,Weissleder R: Molecular imaging in drug discovery and development. Nat
Rev Drug Discov 2: 123-131, 2003
Sandker GW, Weert B, Olinga P, Wolters H, Slooff MJ, Meijer DK, Groothuis GM:
Characterization of transport in isolated human hepatocytes. A study with the bile acid

64
taurocholic acid, the uncharged ouabain and the organic cations vecuronium and
rocuronium. Biochem Pharmacol 47: 2193-2200, 1994
Satlin LM, Amin V, Wolkoff AW: Organic anion transporting polypeptide mediates
organic anion/HCO3- exchange. J Biol Chem 272: 26340-26345, 1997
Schachter M: Chemical, pharmacokinetic and pharmacodynamic properties of statins:
an update. Fundam Clin Pharmacol 19: 117-125, 2005
Schwarz UI, Meyer zu Schwabedissen HE, Tirona RG, Suzuki A, Leake BF, Mokrab Y,
Mizuguchi K, Ho RH, Kim RB: Identification of novel functional organic anion-
transporting polypeptide 1B3 polymorphisms and assessment of substrate specificity.
Pharmacogenet Genomics 21: 103-114, 2011
Scripture CD,Pieper JA: Clinical pharmacokinetics of fluvastatin. Clin Pharmacokinet
40: 263-281, 2001
Seithel A, Eberl S, Singer K, Auge D, Heinkele G, Wolf NB, Dorje F, Fromm MF,
Konig J: The influence of macrolide antibiotics on the uptake of organic anions and
drugs mediated by OATP1B1 and OATP1B3. Drug Metab Dispos 35: 779-786, 2007
Seithel A, Eberl S, Singer K, Auge D, Heinkele G, Wolf NB, Dorje F, Fromm MF,
Konig J: The influence of macrolide antibiotics on the uptake of organic anions and
drugs mediated by OATP1B1 and OATP1B3. Drug Metab Dispos 35: 779-786, 2007
Shepard RL, Cao J, Starling JJ, Dantzig AH: Modulation of P-glycoprotein but not
MRP1- or BCRP-mediated drug resistance by LY335979. Int J Cancer 103: 121-125,
2003
Shimizu K, Takashima T, Yamane T, Sasaki M, Kageyama H, Hashizume Y, Maeda K,
Sugiyama Y, Watanabe Y, Senda M: Whole-body distribution and radiation dosimetry
of [11C]telmisartan as a biomarker for hepatic organic anion transporting polypeptide
(OATP) 1B3. Nucl Med Biol 39: 847-853, 2012
Shimizu M, Fuse K, Okudaira K, Nishigaki R, Maeda K, Kusuhara H, Sugiyama Y:
Contribution of OATP (organic anion-transporting polypeptide) family transporters to
the hepatic uptake of fexofenadine in humans. Drug Metab Dispos 33: 1477-1481, 2005
Shitara Y, Li AP, Kato Y, Lu C, Ito K, Itoh T, Sugiyama Y: Function of uptake
transporters for taurocholate and estradiol 17beta-D-glucuronide in cryopreserved
human hepatocytes. Drug Metab Pharmacokinet 18: 33-41, 2003
Shitara Y, Horie T, Sugiyama Y: Transporters as a determinant of drug clearance and
tissue distribution. Eur J Pharm Sci 27: 425-446, 2006
Shitara Y, Maeda K, Ikejiri K, Yoshida K, Horie T, Sugiyama Y: Clinical significance
of organic anion transporting polypeptides (OATPs) in drug disposition: their roles in
hepatic clearance and intestinal absorption. Biopharm Drug Dispos 34: 45-78, 2013
65
Sigel E,Minier F: The Xenopus oocyte: system for the study of functional expression
and modulation of proteins. Mol Nutr Food Res 49: 228-234, 2005
Simonson SG, Raza A, Martin PD, Mitchell PD, Jarcho JA, Brown CD, Windass AS,
Schneck DW: Rosuvastatin pharmacokinetics in heart transplant recipients administered
an antirejection regimen including cyclosporine. Clin Pharmacol Ther 76: 167-177,
2004
Soars MG, Webborn PJH, Riley RJ: Impact of hepatic uptake transporters on
pharmacokinetics and drug-drug interactions: use of assays and models for decision
making in the pharmaceutical industry. Mol Pharm 6: 1662-1677, 2009
Soars MG, Grime K, Sproston JL, Webborn PJ, Riley RJ: Use of hepatocytes to assess
the contribution of hepatic uptake to clearance in vivo. Drug Metab Dispos 35: 859-865,
2007
Sobczak K, Bangel-Ruland N, Leier G, Weber WM: Endogenous transport systems in
the Xenopus laevis oocyte plasma membrane. Methods 51: 183-189, 2010
St-Pierre MV, Hagenbuch B, Ugele B, Meier PJ, Stallmach T: Characterization of an
organic anion-transporting polypeptide (OATP-B) in human placenta. J Clin Endocrinol
Metab 87: 1856-1863, 2002
Strougo A, Eissing T, Yassen A, Willmann S, Danhof M, Freijer J: First dose in
children: physiological insights into pharmacokinetic scaling approaches and their
implications in paediatric drug development. J Pharmacokinet Pharmacodyn 39: 195-
203, 2012
Taipalensuu J, Tornblom H, Lindberg G, Einarsson C, Sjoqvist F, Melhus H, Garberg P,
Sjostrom B, Lundgren B, Artursson P: Correlation of gene expression of ten drug efflux
proteins of the ATP-binding cassette transporter family in normal human jejunum and
in human intestinal epithelial Caco-2 cell monolayers. J Pharmacol Exp Ther 299: 164-
170, 2001
Takashima T, Kitamura S, Wada Y, Tanaka M, Shigihara Y, Ishii H, Ijuin R, Shiomi S,
Nakae T, Watanabe Y, Cui Y, Doi H, Suzuki M, Maeda K, Kusuhara H, Sugiyama Y,
Watanabe Y: PET imaging-based evaluation of hepatobiliary transport in humans with
(15R)-11C-TIC-Me. J Nucl Med 53: 741-748, 2012
Tamai I, Nezu J, Uchino H, Sai Y, Oku A, Shimane M, Tsuji A: Molecular
identification and characterization of novel members of the human organic anion
transporter (OATP) family. Biochem Biophys Res Commun 273: 251-260, 2000
Thompson PD, Clarkson P, Karas RH: Statin-associated myopathy. JAMA 289: 1681-
1690, 2003

66
Tirona RG, Leake BF, Merino G, Kim RB: Polymorphisms in OATP-C: identification
of multiple allelic variants associated with altered transport activity among European-
and African-Americans. J Biol Chem 276: 35669-35675, 2001
van de Steeg E, van der Kruijssen CM, Wagenaar E, Burggraaff JE, Mesman E,
Kenworthy KE, Schinkel AH: Methotrexate pharmacokinetics in transgenic mice with
liver-specific expression of human organic anion-transporting polypeptide 1B1
(SLCO1B1). Drug Metab Dispos 37: 277-281, 2009
van de Steeg E, Wagenaar E, van der Kruijssen CM, Burggraaff JE, de Waart DR,
Elferink RP, Kenworthy KE, Schinkel AH: Organic anion transporting polypeptide
1a/1b-knockout mice provide insights into hepatic handling of bilirubin, bile acids, and
drugs. J Clin Invest 120: 2942-2952, 2010
van de Steeg E, van Esch A, Wagenaar E, van der Kruijssen CM, van Tellingen O,
Kenworthy KE, Schinkel AH: High impact of Oatp1a/1b transporters on in vivo
disposition of the hydrophobic anticancer drug paclitaxel. Clin Cancer Res 17: 294-301,
2011
van de Steeg E, van Esch A, Wagenaar E, Kenworthy KE, Schinkel AH: Influence of
human OATP1B1, OATP1B3, and OATP1A2 on the pharmacokinetics of methotrexate
and paclitaxel in humanized transgenic mice. Clin Cancer Res 19: 821-832, 2013
Varma MV, Rotter CJ, Chupka J, Whalen KM, Duignan DB, Feng B, Litchfield J,
Goosen TC, El-Kattan AF: pH-sensitive interaction of HMG-CoA reductase inhibitors
(statins) with organic anion transporting polypeptide 2B1. Mol Pharm 8: 1303-1313,
2011
Varma MV, Lai Y, Feng B, Litchfield J, Goosen TC, Bergman A: Physiologically based
modeling of pravastatin transporter-mediated hepatobiliary disposition and drug-drug
interactions. Pharm Res 29: 2860-2873, 2012
Vavricka SR, Van Montfoort J, Ha HR, Meier PJ, Fattinger K: Interactions of rifamycin
SV and rifampicin with organic anion uptake systems of human liver. Hepatology 36:
164-172, 2002
Vollmar B,Menger MD: The hepatic microcirculation: mechanistic contributions and
therapeutic targets in liver injury and repair. Physiol Rev 89: 1269-1339, 2009
Watanabe T, Kusuhara H, Maeda K, Shitara Y, Sugiyama Y: Physiologically based
pharmacokinetic modeling to predict transporter-mediated clearance and distribution of
pravastatin in humans. J Pharmacol Exp Ther 328: 652-662, 2009
Watanabe T, Kusuhara H, Maeda K, Kanamaru H, Saito Y, Hu Z, Sugiyama Y:
Investigation of the rate-determining process in the hepatic elimination of HMG-CoA
reductase inhibitors in rats and humans. Drug Metab Dispos 38: 215-222, 2010

67
Weiss M, Hung DY, Poenicke K, Roberts MS: Kinetic analysis of saturable hepatic
uptake of digoxin and its inhibition by rifampicin. Eur J Pharm Sci 34: 345-350, 2008
Wikberg T, Vuorela A, Ottoila P, Taskinen J: Identification of major metabolites of the
catechol-O-methyltransferase inhibitor entacapone in rats and humans. Drug Metab
Dispos 21: 81-92, 1993
Xia CQ, Milton MN, Gan LS: Evaluation of drug-transporter interactions using in vitro
and in vivo models. Curr Drug Metab 8: 341-363, 2007
Yabe Y, Galetin A, Houston JB: Kinetic characterization of rat hepatic uptake of 16
actively transported drugs. Drug Metab Dispos 39: 1808-1814, 2011
Yang Q, Doshi U, Li N, Li AP: Effects of culture duration on gene expression of P450
isoforms, uptake and efflux transporters in primary hepatocytes cultured in the absence
and presence of interleukin-6: implications for experimental design for the evaluation of
downregulatory effects of biotherapeutics. Curr Drug Metab 13: 938-946, 2012
Yu XQ,Wilson AG: The role of pharmacokinetic and
pharmacokinetic/pharmacodynamic modeling in drug discovery and development.
Future Med Chem 2: 923-928, 2010
Yue W, Abe K, Brouwer KL: Knocking down breast cancer resistance protein (Bcrp) by
adenoviral vector-mediated RNA interference (RNAi) in sandwich-cultured rat
hepatocytes: a novel tool to assess the contribution of Bcrp to drug biliary excretion.
Mol Pharm 6: 134-143, 2009
Zamek-Gliszczynski MJ, Hoffmaster KA, Nezasa K, Tallman MN, Brouwer KL:
Integration of hepatic drug transporters and phase II metabolizing enzymes:
mechanisms of hepatic excretion of sulfate, glucuronide, and glutathione metabolites.
Eur J Pharm Sci 27: 447-486, 2006
Zhang N, Fountain ST, Bi H, Rossi DT: Quantification and rapid metabolite
identification in drug discovery using API time-of-flight LC/MS. Anal Chem 72: 800-
806, 2000
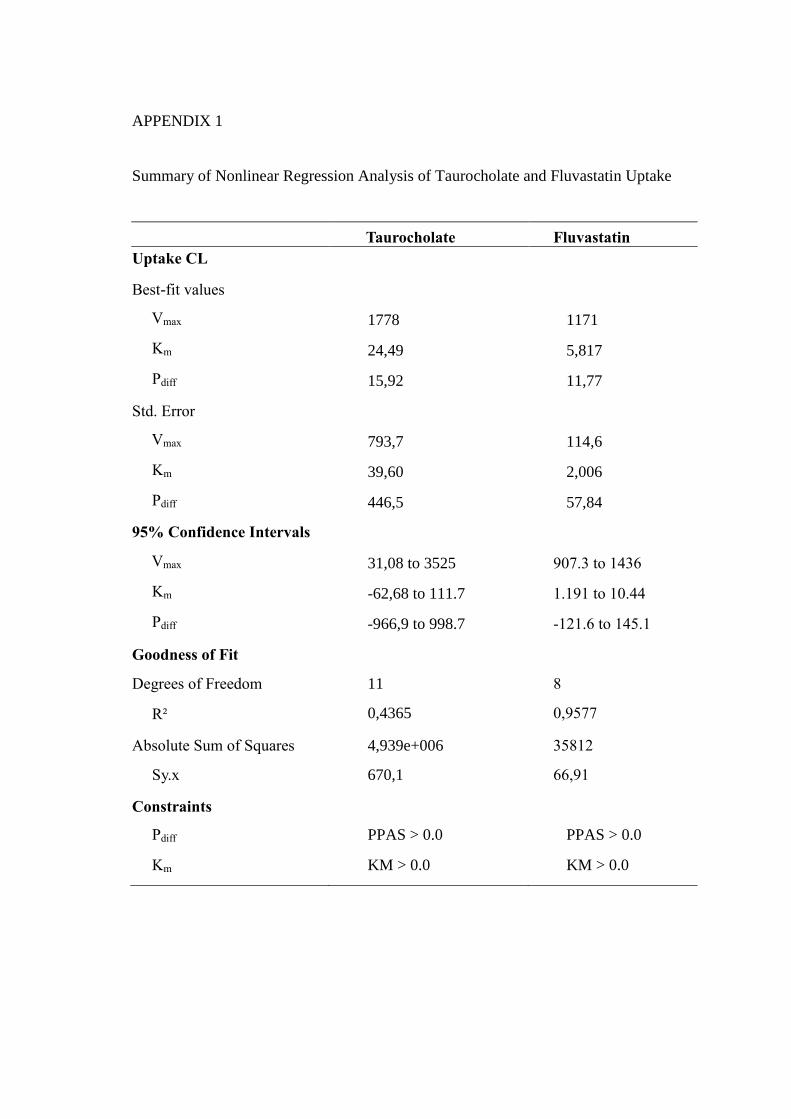
APPENDIX 1
Summary of Nonlinear Regression Analysis of Taurocholate and Fluvastatin Uptake
Taurocholate Fluvastatin
Uptake CL
Best-fit values
Vmax 1778 1171
Km 24,49 5,817
Pdiff 15,92 11,77
Std. Error
Vmax 793,7 114,6
Km 39,60 2,006
Pdiff 446,5 57,84
95% Confidence Intervals
Vmax 31,08 to 3525 907.3 to 1436
Km -62,68 to 111.7 1.191 to 10.44
Pdiff -966,9 to 998.7 -121.6 to 145.1
Goodness of Fit
Degrees of Freedom 11 8
R² 0,4365 0,9577
Absolute Sum of Squares 4,939e+006 35812
Sy.x 670,1 66,91
Constraints
Pdiff PPAS > 0.0 PPAS > 0.0
Km KM > 0.0 KM > 0.0

APPENDIX 2
Summary of Nonlinear Regression Analysis of E3S Inhibition by Rifamycin and
Entacapone
Rifamycin Entacapone
Best-fit values
Bottom 1,00 x 10-07
1,00 x 10-07
Top 95,14 94,43
IC50 61,84 237,1
Std. Error
Bottom 54,84 29,01
Top 5,336 4,776
IC50 83,06 160,9
95% Confidence
Intervals
Bottom 0,0 to 126,5 0,0 to 92,32
Top 82,84 to 189,7 79,24 to 138,5
IC50 0,0 to 253,4 0,0 to 749,1
Goodness of Fit
Degrees of Freedom 8 3
R² 0,8341 0,9594
Absolute Sum of Squares 1263 116.3
Sy.x 12,57 6,227
Constraints
BOTTOM BOTTOM > 0.0 BOTTOM > 0.0
TOP
TOP >
1,500*BOTTOM
TOP >
1,500*BOTTOM
IC50 IC50 > 0.0 IC50 > 0.0
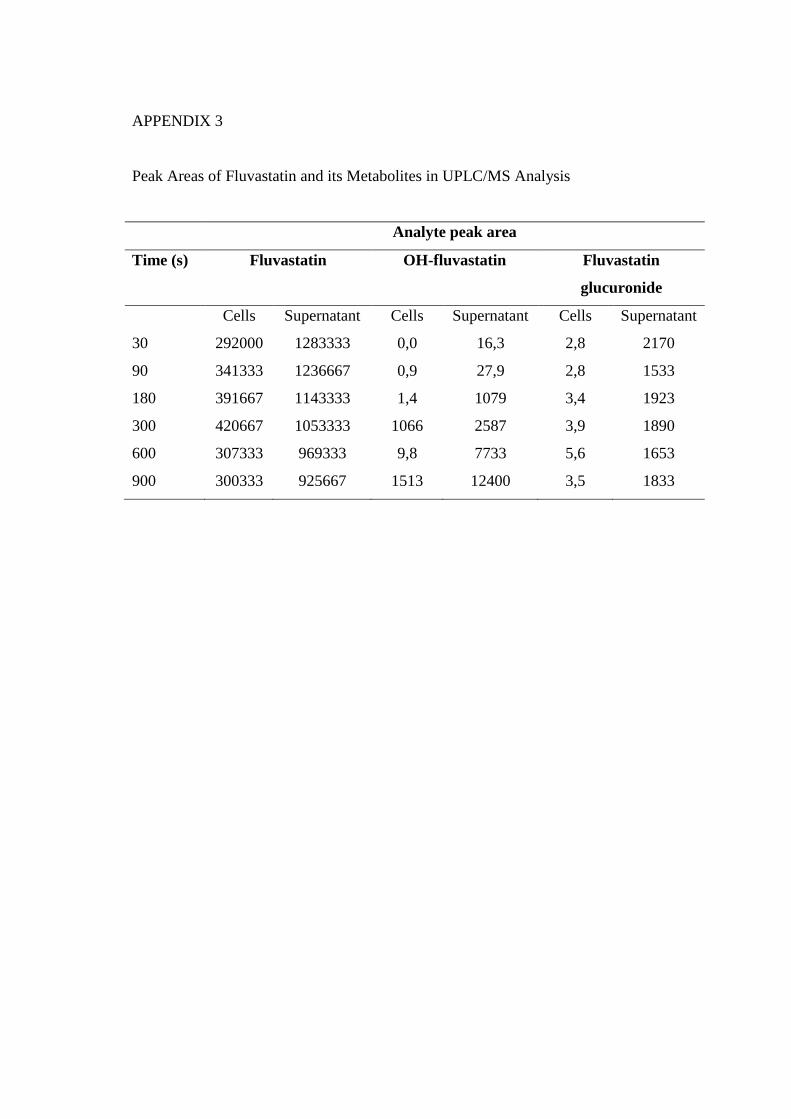
APPENDIX 3
Peak Areas of Fluvastatin and its Metabolites in UPLC/MS Analysis
Analyte peak area
Time (s) Fluvastatin OH-fluvastatin Fluvastatin
glucuronide
Cells Supernatant Cells Supernatant Cells Supernatant
30 292000 1283333 0,0 16,3 2,8 2170
90 341333 1236667 0,9 27,9 2,8 1533
180 391667 1143333 1,4 1079 3,4 1923
300 420667 1053333 1066 2587 3,9 1890
600 307333 969333 9,8 7733 5,6 1653
900 300333 925667 1513 12400 3,5 1833


![Anti-Infectives - AscellaHealth hcl meropenem [inj] methenamine hippurate methenamine mandelate methylene blue ... EDROPHONIUM CHLORIDE entacapone ...](https://static.fdocuments.in/doc/165x107/5ab0bac97f8b9ac3348b8587/anti-infectives-ascellahealth-hcl-meropenem-inj-methenamine-hippurate-methenamine.jpg)