
THE ROLE OF NUCLEAR POWER IN THE FUTURE ENERGY SYSTEM … · The role of nuclear power in the...
137
Lappeenranta University of Technology School of Technology Energy Technology Jarkko Ahokas THE ROLE OF NUCLEAR POWER IN THE FUTURE ENERGY SYSTEM Examiners: Professor Juhani Hyvärinen D.Sc. (Tech.) Kristiina Söderholm Instructors: M.Sc. (Tech.) Ville Lestinen D.Sc. (Tech.) Kristiina Söderholm
-
Upload
nguyenhuong -
Category
Documents
-
view
213 -
download
0
Transcript of THE ROLE OF NUCLEAR POWER IN THE FUTURE ENERGY SYSTEM … · The role of nuclear power in the...

Lappeenranta University of Technology
School of Technology
Energy Technology
Jarkko Ahokas
THE ROLE OF NUCLEAR POWER IN THE FUTURE
ENERGY SYSTEM
Examiners: Professor Juhani Hyvärinen
D.Sc. (Tech.) Kristiina Söderholm
Instructors: M.Sc. (Tech.) Ville Lestinen
D.Sc. (Tech.) Kristiina Söderholm

ABSTRACT
Lappeenranta University of Technology
LUT School of Technology
Master's Degree Programme in Energy Technology
Jarkko Ahokas
The role of nuclear power in the future energy system
Master's Thesis
2015
131 pages, 36 figures, 13 tables and 1 appendix
Examiners: Professor Juhani Hyvärinen
D.Sc. (Tech.) Kristiina Söderholm
Keywords: nuclear power, energy system model, grid balancing, Nordic energy system,
carbon emissions, energy security
Currently widely accepted consensus is that greenhouse gas emissions produced by the
mankind have to be reduced in order to avoid further global warming. The European
Union has set a variety of CO2 reduction and renewable generation targets for its
member states. The current energy system in the Nordic countries is one of the most
carbon free in the world, but the aim is to achieve a fully carbon neutral energy system.
The objective of this thesis is to consider the role of nuclear power in the future energy
system. Nuclear power is a low carbon energy technology because it produces virtually
no air pollutants during operation. In this respect, nuclear power is suitable for a carbon
free energy system. In this master's thesis, the basic characteristics of nuclear power are
presented and compared to fossil fuelled and renewable generation. Nordic energy
systems and different scenarios in 2050 are modelled. Using models and information
about the basic characteristics of nuclear power, an opinion is formed about its role in
the future energy system in Nordic countries.
The model shows that it is possible to form a carbon free Nordic energy system. Nordic
countries benefit from large hydropower capacity which helps to offset fluctuating
nature of wind power. Biomass fuelled generation and nuclear power provide stable and
predictable electricity throughout the year. Nuclear power offers better energy security
and security of supply than fossil fuelled generation and it is competitive with other low
carbon technologies.

TIIVISTELMÄ
Lappeenrannan teknillinen yliopisto
Teknillinen tiedekunta
Energiatekniikan koulutusohjelma
Jarkko Ahokas
Ydinvoiman rooli tulevaisuuden energiajärjestelmässä
Diplomityö
2015
131 sivua, 36 kuvaa, 13 taulukkoa ja 1 liite
Tarkastajat: Professori Juhani Hyvärinen
TkT Kristiina Söderholm
Hakusanat: ydinvoima, energiajärjestelmämalli, sähköverkon säätö, Pohjoismainen
energiajärjestelmä, hiilipäästöt, energiaturvallisuus
Kirjoitushetkellä yleisesti hyväksytty mielipide on, että ihmiskunnan tuottamia
kasvihuonekaasupäästöjä on vähennettävä globaalin ilmaston lämpenemisen
hillitsemiseksi. Euroopan Unioni on asettanut jäsenmailleen erilaisia CO2 päästöjen
vähennystavoitteita sekä uusiutuvan energiankäytön tavoitteita. Pohjoismainen
energiajärjestelmä on jo yksi maailman hiilivapaimmista, mutta tavoitteena on täysin
hiilineutraali energiajärjestelmä.
Tämän diplomityön tavoitteena on pohtia ydinvoiman roolia tulevaisuuden
energiajärjestelmässä. Ydinvoima ei tuota juuri ollenkaan ilmasaasteita ja sen elinkaaren
hiilipäästöt ovat matalat. Näiltä osin ydinvoima sopii hiilivapaaseen
energiajärjestelmään. Tässä diplomityössä esitellään ydinvoiman perusominaisuudet ja
verrataan niitä fossiilisiin ja uusiutuviin energiantuotantomuotoihin. Myös
Pohjoismainen energiajärjestelmä ja erilaiset skenaariot vuonna 2050 mallinnetaan.
Mallin ja ydinvoiman perusominaisuuksien pohjalta muodostetaan näkemys
ydinvoiman roolista Pohjoismaisessa energiajärjestelmässä tulevaisuudessa.
Malli osoittaa, että on mahdollista rakentaa hiilivapaa Pohjoismainen
energiajärjestelmä. Pohjoismaat voivat käyttää hyväkseen suurta vesivoimakapasiteettia,
joka auttaa tasapainottamaan tuulivoiman tuotantovaihtelua. Biomassaan pohjautuva
sähköntuotanto sekä ydinvoima tarjoavat vakaata ja ennustettavaa sähköntuotantoa
ympäri vuoden. Verrattuna fossiilisiin tuotantomuotoihin, ydinvoima parantaa
energiaturvallisuutta sekä polttoaineen toimitusvarmuutta. Ydinvoima on myös
kustannuksiltaan kilpailukykyinen verrattuna muihin vähäpäästöisiin teknologioihin.

Acknowledgements
The future of energy production and the compositions of energy systems are
exceedingly interesting. Nuclear energy has fascinated me from the beginning of my
energy technology studies at Lappeenranta University of Technology and I was lucky
that Fortum Oyj offered me the opportunity to do my thesis in the field of nuclear
energy. Doing this master's thesis with the aforementioned topic has offered me an
opportunity to learn greatly from nuclear energy and power professionals.
I want to thank Kristiina Söderholm for giving me the opportunity to work for the
summer in 2014 at Fortum and later for enabling me to do my master's thesis. Together
with my other instructor Ville Lestinen, they provided a really interesting topic for my
master's thesis. Their guidance and experience were invaluable. Input from my
instructors and Petra Lundström further helped me to form relevant scenarios for my
model. The Nuclear Development Unit offered me good learning experience and
interesting discussions. Comments and input from numerous people working at Fortum
helped in making this thesis. I want to thank my supervisor, Professor Juhani
Hyvärinen, for his guidance and comments on my thesis. Without him, I am sure that
my thesis would have even more room for improvement.
Finally I would like to thank my friends and family for their support and encouragement
over the years.
Espoo, April 2015
Jarkko Ahokas

TABLE OF CONTENTS
Abbreviations 1
1 Introduction 2 1.1 Background ............................................................................................... 2 1.2 Objective of the thesis ............................................................................... 3 1.3 Scope of the thesis ..................................................................................... 3
1.4 Methodology ............................................................................................. 4
2 Basic characteristics of nuclear power 6 2.1 Technologies ............................................................................................. 7
2.1.1 Reactor technologies in use ........................................................... 8 2.1.2 Future reactor technologies ......................................................... 12
2.2 Energy security and security of supply ................................................... 18
2.2.1 The role of nuclear energy in improving energy security ........... 21 2.2.2 Resources .................................................................................... 25
2.2.3 Resource efficiency and energy density ...................................... 27 2.3 Emissions ................................................................................................. 28 2.4 Predictability and stability of nuclear generation .................................... 33
2.4.1 Grid inertia .................................................................................. 36
2.5 Flexibility of nuclear power plants .......................................................... 37
3 Future energy system 42 3.1 Balancing and stabilising the energy grid ............................................... 46
3.2 Smart grid ................................................................................................ 48 3.2.1 Supply side .................................................................................. 49
3.2.2 Demand side ................................................................................ 51 3.2.3 Electricity network ...................................................................... 53
3.3 Energy storages ....................................................................................... 53
3.3.1 Electricity storages ...................................................................... 58 3.3.2 Thermal energy storages ............................................................. 60
3.4 Combined Heat and Power as part of the energy system ........................ 61
3.4.1 Nuclear cogeneration .................................................................. 64
4 Energy system model 67 4.1 Model overview ....................................................................................... 67 4.2 Generation mix in the future energy system ........................................... 68
4.3 Wind power ............................................................................................. 71 4.4 Hydroelectric power ................................................................................ 73 4.5 Nuclear generation .................................................................................. 74
4.6 Combined Heat and Power ...................................................................... 75 4.7 Flexible fossil generation ........................................................................ 75

5 Scenarios analysed with the model 77 5.1 Base scenario ........................................................................................... 79 5.2 2013 scenario ........................................................................................... 79
5.3 Similar scenario ....................................................................................... 80 5.4 Storage scenario ...................................................................................... 80 5.5 Low Hydro scenario ................................................................................ 81
6 Results and Analyses 82 6.1 Results of different scenarios .................................................................. 83
6.1.1 Base scenario ............................................................................... 83 6.1.2 2013 scenario .............................................................................. 88 6.1.3 Similar scenario ........................................................................... 90
6.1.4 Storage scenario .......................................................................... 94 6.1.5 Low Hydro scenario .................................................................. 101
6.2 Specific situations and sensitivity analyses ........................................... 107
6.2.1 Zero wind situation ................................................................... 107 6.2.2 System without nuclear power .................................................. 111 6.2.3 Emission comparisons ............................................................... 115
7 Conclusions 117 7.1 Scenario summaries and conclusions .................................................... 117
7.1.1 Base scenario ............................................................................. 117 7.1.2 Similar scenario ......................................................................... 118
7.1.3 Storage scenario ........................................................................ 119 7.1.4 Low Hydro scenario .................................................................. 120
7.2 Future research ...................................................................................... 120
8 Summary 122
References 125
Appendix 1. The generalised Supply and Demand Index 131

1
ABBREVIATIONS
All the abbreviations used in this thesis are explained when they first appear. Most
important and often used abbreviations are listed here.
CHP: Combined heat and power. Cogeneration of electricity and heat for end
users in the same power plant.
CNS: Carbon-Neutral Scenario. Energy scenario found in the NETP. The Base
scenario in the thesis is based on this.
IEA: International Energy Agency. An autonomous organisation providing
authoritative statistics, analysis and recommendations. It has 29 member
countries.
NETP: Nordic Energy Technology Perspectives. A publication by the IEA which
provides pathways to a carbon neutral energy future.
PSH: Pumped-storage hydropower. Hydroelectric energy storage which stores
energy in the form of gravitational potential energy of water.

2
1 INTRODUCTION
1.1 Background
The currently, widely accepted consensus is that greenhouse gas emissions produced by
mankind have to be reduced in order to avoid further global warming. The energy sector
has an important role in reducing these emissions, especially carbon dioxide emissions.
Globally, fossil fuels dominate the energy sector and they are likely to do so in the
foreseeable future. Emerging economies, such as China and India, are unlikely to
abandon fossil fuelled energy generation anytime soon. In more advanced economies, a
transition to different low carbon technologies, such as renewables, is being encouraged
and even demanded. The European Union has set CO2 reduction and renewable
generation targets for its member states.
The energy system in the Nordic countries as a whole is already one of the most carbon
free in the world. Currently the CO2 emissions produced by Nordic electricity
generation are approximately 100 grams of CO2 per kWh of electricity while the global
average is around 550 gCO2/kWh and the EU average 430 gCO2/kWh. The majority of
the CO2 emissions in the Nordic power sector come from coal, peat and natural gas
power plants in Finland and Denmark. Finland generated around 46 % and Denmark
33% of the 67 million tonnes of CO2 that the Nordic power sector generated in 2010.
Norway, Sweden and Iceland generate less CO2 emissions as they utilize more
renewables and nuclear power (in Sweden). In this thesis, Iceland is omitted from the
Nordic energy system as it is isolated from the Nordic power grid. (IEA, 2013)
The overall share of renewables in Nordic power generation was around 60% in 2010
and various IEA scenarios estimate that the share of renewables will increase to 80% by
2050. In this thesis, the Nordic energy sector is assumed to be carbon free by 2050 and
this is achieved with using nuclear power together with a large share of renewables.
Nordic countries have ambitious targets for decarbonising their energy systems and all
the Nordic countries are listed among the top 20 economies in the world. The Nordic

3
region is a valuable and interesting region to study in regards to future, carbon free
energy systems in an advanced economy.
Nuclear power is a low carbon technology used globally. Before the accident in
Fukushima Daiichi nuclear power plant in 2011, interest in nuclear power was
increasing as concerns were displayed over greenhouse gas emissions from the power
sector and the security of energy supply. The accident impacted the public acceptance of
nuclear power and had an effect on nuclear policies in several countries. The nuclear
industry also suffered from the financial and economic crisis of 2008-2009 which
reduced the financing capabilities. However, currently the global situation for nuclear
energy is improving and the number of constructions commencing are on the rise again.
(IEA, 2015)
1.2 Objective of the thesis
The objective of this thesis is to consider the role of nuclear power in the future energy
system. In this thesis, the basic characteristics of nuclear power are presented. The role
of nuclear power in the future is considered, especially in the Nordic region, and a
Nordic, carbon free energy system is modelled with different scenarios. The model and
literature is used to determine the power generation mix in the Nordic energy system in
2050.
The model is also used to analyse the roles of different electricity generation sources,
including nuclear power, in the future Nordic energy system. Rudimentary emission and
cost comparisons between different generation sources are also carried out with the
model.
1.3 Scope of the thesis
This thesis presents different characteristics and properties of nuclear power which
affect the energy system of a nation or region in regards to energy security, resource
supply, emissions and power grid management. Commonly used and most promising

4
future reactor technologies are presented, but technical details are not in the scope of
this thesis. A future energy system and its different elements are also presented.
Electricity prices, market mechanisms or detailed production and construction costs of
the generation fleet are not considered in the thesis. The energy system in the thesis
includes only the power sector. Transport, building and industry sectors are omitted
from the thesis and the heat sector is considered to the extent of its electricity generation
from combined power and heat. Of course, all these sectors have an impact on the
Nordic electricity consumption which is included in the model. The model assumes that
Nordic countries have perfect grid connections between them, thus making the Nordic
region a solitary entity. Connections to the rest of Europe and Russia are not modelled,
but they are assumed to be adequate as the Nordic countries on the whole become net
exporters of electricity in the Base scenario of the model.
The different scenarios presented in the thesis are not forecasts, rather they present
alternative targets and avenues for a carbon free energy system. Generation mixes used
in the thesis are either based on the literature or they are chosen somewhat arbitrarily to
construct and study different carbon free energy systems. Future scenarios are set for the
year 2050 following the various IEA scenarios and targets found in the Nordic Energy
Technology Perspectives 2014. (IEA, 2013)
1.4 Methodology
The future energy system is modelled in different scenarios which are set to happen in
2050. Electricity consumption and generation is modelled over the whole year in one
hour increments. The model uses a Nordic load profile from 2013 which is scaled up to
correspond to the assumed load in 2050. Different electricity generation sources are
added to the model and the model calculates the generation mix and the differences
between the consumption and generation of electricity.
Different scenarios have different generation mixes and some of the scenarios even have
energy storages. The model results and the roles of the different elements in the model

5
are analysed. Using the information about the basic characteristics of nuclear power and
the model, the significance of nuclear power in the future energy system is shown.

6
2 BASIC CHARACTERISTICS OF NUCLEAR POWER
The compositions of electrical energy systems across the world are different, partly
because the availability of assorted fuel and energy sources differ from region to region
and partly because some regions are more technologically advanced than others. For
example, in Africa there were only 2 operating nuclear reactors at the time of writing
this thesis, while in Europe the number of operational reactors was 186 (PRIS, 2015).
Figure 1 shows the world's electricity generation by source for the year 2012. The clear
majority of the world's electricity is currently generated by fossil fuels and their share
was 68% in 2012. The share of nuclear power in the world's electricity generation was
11% in 2012. The share of nuclear power in electricity production was 26.7% in the EU
member states (Eurostat, 2015). At the end of the year 2013, there were a total of 434
commercial nuclear reactors operating and their total capacity reaching 371.1 GWe
(IAEA, 2014a).
Figure 1. World electricity generation by source in 2012. (chart formed from the data in IEA,
2014e)
About 82% of operating reactors in the 2013 were light water reactors (PWR & BWR),
11% were heavy water reactors (PHWR), 3.4% were light water cooled, graphite
41 %
22 %
16 %
11 %
5 % 5 %
Coal
Natural gas
Hydro
Nuclear
Oil
Other renewables
7
moderated reactors (LWGR/RBMK) and 3.4% were gas cooled reactors (GCR/AGR).
Two of the operating reactors were liquid metal cooled fast reactors (FR). Light water
reactors are clearly the most prevalent and the best known of all the reactor
technologies. (IAEA, 2014a)
There were four new connections to national electricity grids in 2013: Hongyanhe 1&2
(1000 MWe) and Yangjiang 1 (1000 MWe) in China and Kudankulam 1 (917 MWe) in
India. The construction of ten new reactors started in 2013: four in the United States,
three in China and one each in the Republic of Korea, the United Arab Emirates and
Belarus. The number of new construction starts dropped from 10 in 2013 to 3 in 2014.
72 reactors were under construction internationally at the beginning of 2014 and at the
time of writing this thesis, 65 reactors were under construction. (IAEA, 2014a; PRIS,
2015)
2.1 Technologies
The majority of operating nuclear reactors are Generation II (Gen II) light water
reactors, but a transition to Generation III (Gen III) and Generation III+ (Gen III+)
reactors is underway. Of the 72 reactors under construction, thirty of them are Gen III
reactors. China has announced that as of now it will build only Gen III reactors but of
course more advanced future reactor designs are not ruled out. (IEA, 2014a)
Gen II reactors were built from the 1960s to the 1990s. Individual Gen II reactors can
greatly differ from each other, even if they nominally represent the same reactor design.
Gen III reactors are designed to better withstand severe accidents and external hazards,
and they have better performance and longer operating lifetimes. Individual power
plants using Gen III reactors of the same design are built to be as similar as possible.
This allows for a greater degree of standardisation lowering the construction costs and
times of new reactors (Goldberg, S. & Rosner, R., 2011).
Generation IV (Gen IV) reactors are future reactors currently being designed. Some of
the Gen IV reactor concepts have been demonstrated in the past. For example, an
8
experimental molten salt reactor was constructed and operated in 1960s and Russia has
80 reactor-years' experience of using lead-cooled fast reactor technology (Rosenthal
M.W, 2009; WNA, 2015). Gen IV reactors are supposedly safer, and they utilize
nuclear fuel more efficiently, produce less radioactive waste and are commercially
profitable. The Generation IV International Forum (GIF) lists six Gen IV reactors in its
website that it has chosen to focus its research and development on. These reactors
include a Gas cooled Fast Reactor (GFR), Lead cooled Fast Reactor (LFR), Molten Salt
Reactor (MSR), Supercritical Water-cooled Reactor (SCWR), Sodium-cooled Fast
Reactor (SFR) and Very High Temperature Reactor (VHTR). GIF anticipates that the
first commercial Gen IV reactors will be deployed in the 2030s. (GIF, 2015)
2.1.1 Reactor technologies in use
2.1.1.1 Light water reactors
Clear majority of reactors currently operating and under construction are light water
reactors (LWR). Light water reactors use light water (i.e. normal water) as both coolant
and moderator. These reactors use low enrichment uranium as fuel. Typically the
enrichment is 3-5 w% of uranium isotope U-235 and rest of the uranium is isotope U-
238. Light water reactors need to be shut down for refuelling. Light water reactors can
be divided into two main categories: pressurised water reactors (PWR) and boiling
water reactors (BWR).
Pressurised water reactors were originally designed for nuclear submarines and were
later commercialized and made into large-sized reactors for electricity generation. The
first nuclear-powered submarine was launched in 1955 and the first prototype PWR for
electricity generation was made in 1957 in the United States. The first commercial PWR
began operation in the United States in 1961. It had a capacity of 185 MWe. (Oka et al.,
2014)
Figure 2 presents a typical pressurised water reactor and its water-steam loops. In a
PWR, the reactor core heats the water circulating in primary loop. The pressure of the

9
water is so high that it does not boil in the primary loop. Primary loop water flows to a
steam generator where it transfers its heat to the water circulating in the secondary loop.
This water boils and the resulting steam a rotates turbine and generates electricity. After
the turbine, the steam condenses back to water. The tertiary loop transfers the remaining
heat to the final heat sink, which may be seawater or a cooling tower.
Figure 2. Pressurised water reactor. (NRC, 2012)
In a boiling water reactor, the water in the primary loop is pressurised less than in
PWRs. The primary water boils as it traverses through the reactor core. The resulting
steam is dried in the upper parts of the pressure vessel and lead to a turbine-generator.
After the turbine, the steam is condensed back into water and the remaining heat is
transferred to a heat sink located in the secondary loop. In BWRs, the turbine is a part of
primary loop and thus also some parts and areas inside the turbine building have to be
protected against radiation. Figure 3 presents typical boiling water reactor.

10
Figure 3. Boiling water reactor. (NRC, 2012)
At the time of writing this thesis, 282 of operating commercial nuclear reactors are
pressurised water reactors and 80 are boiling water reactors. The corresponding figures
for reactors under construction are 54 and 4. It would also seem that light water reactors
will remain the most important and predominant reactor types in the near future. (PRIS,
2015)
2.1.1.2 Other reactor types
There are options other than light water for cooling and moderation, such as using
heavy water, gas and graphite. Reactors using these materials as a coolant or moderator
are not as popular as reactors using light water.
Heavy water (D2O) can be used as both coolant and moderator. Deuterium (D2) has a
lower tendency to capture neutrons than hydrogen has, meaning that heavy water
absorbs less neutrons than light water. This allows a heavy water reactor to use natural
uranium as its fuel because a lower concentration of the fissile uranium isotope is
needed in the fuel. Natural uranium contains 0.7% uranium isotope U-235. However,

11
using heavy water as a moderator increases the size of the reactor core when compared
to light water reactors because more heavy water is required in order to moderate the
neutrons. The fuel of a heavy water reactor is easier and cheaper to fabricate than that of
an LWR, but heavy water is considerably more expensive than light water. Heavy water
reactors are pressurised water reactors (PHWR) and their development began in the
1950s in Canada. Canadian PHWRs are called CANDUs and nowadays CANDU
reactors and their derivatives are operated in Canada, China, India, Argentina, Romania,
Pakistan and the Republic of Korea. Generally speaking CANDU reactors operate like
pressurised water reactors but CANDU reactors can be refuelled without the need to
shut down the reactor. At the time of writing this thesis, there are 49 commercially
operating pressurised heavy water reactors and four under construction. (PRIS, 2015;
WNA, 2015)
The light water cooled, graphite moderated reactor was designed in the Soviet Union in
1970s. The design of the RBMK (high-power channel reactor) is inherited from a
reactor designed principally for plutonium production. Original RBMK design had
several shortcomings and it was the design involved in the Chernobyl disaster. The
control rod design and the reactor's positive void coefficient negatively affected the
reactor safety and were partially responsible for Chernobyl disaster. After the disaster, a
number of significant design changes were made to the remaining RBMK reactors.
RBMK reactors are a type of boiling water reactors which can be refuelled while the
reactor is operating. At the time of writing there are 15 light water cooled, graphite
moderated reactors operating and none are being constructed (PRIS, 2015).
The United Kingdom has developed a second generation gas cooled reactor called the
AGR (Advanced Gas cooled Reactor). The AGR uses carbon dioxide as a coolant and
graphite as a moderator. The AGR was developed from the earlier, gas cooled graphite
moderated reactor called Magnox. Gas cooled, graphite moderated reactors are only
used in the UK and at the time of writing, there are 14 AGRs and one Magnox reactor
operating. There are no AGRs being built at the time of writing and this reactor type is
only significant in the UK. (WNA, 2015)

12
2.1.2 Future reactor technologies
2.1.2.1 Water cooled reactors under construction
Most of the reactors under construction are light water reactors and of those, the clear
majority are pressurised water reactors (PRIS, 2015). Some of the more modern water
cooled reactors under construction are listed here.
In China, there are advanced pressurised water reactors under construction such as
AP1000 and EPR designs. China also continues the development of CAP-1400 and
CAP-1700 designs. These reactors are large scale versions of the AP1000. Research and
development work on a Chinese supercritical water cooled reactor (SCWR) is still
ongoing. There are two advanced boiling water reactors (ABWRs) under construction in
Japan. Hitachi-GE Nuclear Energy has developed 600 and 900 MWe versions of the
ABWR and Toshiba Corporation has modified the ABWR design to satisfy US and EU
requirements. (IAEA, 2014a)
At the time of writing, there are four evolutionary 700 MWe PHWRs under
construction in India. In addition, India is constructing a prototype of fast breeder
reactor (PRIS, 2015).
In the Republic of Korea, an APR-1400 reactor's construction is progressing according
to plan. Two APR-1400 reactors are also being constructed in The United Arab
Emirates. The design certification process for the APR-1400 is in progress with the
NRC, after which the design can be deployed in the US. There are also four AP1000
reactors under construction in the US and the NRC continues reviewing US-APWR
reactor design certification. A design certification review of the US EPR reactor has
been halted at the request of AREVA. In the Russian Federation, the construction of
two VVER-1000 and five VVER-1200 reactors is being continued. In the Russian
Federation the construction of a small modular KLT-40S reactor is also progressing.
(IAEA, 2014a; WNA, 2015; WNN, 2015)

13
2.1.2.2 Water cooled reactors at an advanced stage of development
AREVA, a French multinational energy group, continues to market the 1600+ MWe
EPR. In addition to its EPR design, AREVA is developing a 1100+ MWe ATMEA1
PWR together with Japanese Mitsubishi Heavy Industries and a 1250+ MWe KERENA
BWR with Germany's E.ON. The first ATMEA1 reactor is planned to be deployed in
Turkey. (IAEA, 2014a)
In Russia and Japan, research and development of SCWR designs which use
supercritical water as a neutron moderator and coolant, is underway. In India, the
Bhabha Atomic Research Centre is developing a 300 MWe advanced heavy water
reactor which will use LEU (low-enriched uranium) and thorium MOX (mixed oxide)
fuel. (IAEA, 2014a)
The Canadian Nuclear Safety Commission (CNSC) completed its third and final pre-
licensing review for an Enhanced CANDU 6 (EC6) reactor. The EC6 is a CANDU
reactor with a number of safety enhancements in order to meet the latest Canadian and
international safety standards. The Canadian energy corporation Candu Energy Inc. has
also completed the development of an advanced CANDU reactor called the ACR-1000.
This reactor design utilizes very high component standardization and slightly enriched
uranium to compensate for the use of light water as the primary coolant opposed to the
usage of heavy water. The ACR-1000 has completed two out of three phases of its pre-
licensing review. Candu Energy Inc. is also co-operating with international partners to
develop variants of the EC6 design in order to utilize advanced fuels such as
reprocessed uranium, MOX and thorium fuel. (IAEA, 2014a)
2.1.2.3 Fast reactors
Fast reactors have no need for a moderator as they use fast neutrons to produce nuclear
fissions. Fast reactors and their related fuel cycles have an important role for the long
term sustainability of nuclear power. Fast reactors can achieve a positive breeding ratio
and also re-use the fissile materials obtained from the spent fuel from fast reactors.
These factors allow the full utilization of the energy potential of uranium and thorium

14
and thus guaranteeing the adequacy of energy supply for thousands of years.
Furthermore fast reactors greatly enhance the sustainability of nuclear power as they
reduce high level and long lived radioactive waste. (IAEA, 2014a)
The most mature fast reactor technology is the sodium cooled fast reactor called SFR.
This technology has 350 reactor years of experience acquired through different
experimental, prototype and demonstration reactors. SFRs have been studied and built
in a number of IAEA states, such as China France, Germany, India, Japan, Russia, the
United Kingdom and the United States of America. SFR technology has successfully
demonstrated that breeding new fuel through the fast reactor fuel cycle is feasible while
thermal efficiency reaches 43-45%. Indispensable experience in the decommissioning of
several SFRs has also been acquired. (IAEA, 2014a)
At the time of writing there are two SFRs in commercial power operation: BN-600 and
BN-800 in the Russian Federation. BN-800 started up in mid-2014 while BN-600 has
been supplying electricity to the grid since 1980. Two experimental or test SFRs are
operating: the China Experimental Fast Reactor (CEFR) and the Fast Breeder Test
Reactor (FBTR) in India. Two fast reactors are also under construction (PRIS, 2014). In
the Russian Federation, additional experience has been gathered with fast reactors using
heavy liquid metals as a coolant. These were 155 MWth reactors used in seven
submarines and used lead-bismuth eutectic as a coolant. At the time of writing, four
different types of fast reactors are being developed internationally: a sodium cooled fast
reactor, ta lead cooled fast reactor, a gas cooled fast reactor and a molten salt fast
reactor1. (IAEA, 2014a)
1 MSFR is being developed by the National Centre for Scientific Research (CNRS, France) and is
supported by the Euratom. Euratom is an international organization which develops and distributes
nuclear energy to its member states. MSFR is a reactor concept based on the thorium fuel cycle and its
liquid fuel is also used as a coolant. (Merle-Lucotte et al., 2013)

15
2.1.2.4 Gas cooled reactors
The United Kingdom has operated commercial gas cooled reactors for several decades
and valuable experience has been acquired in order to develop future high temperature
gas cooled reactors (HTGR). In HTGRs, fuel consists of coated particles, the gas outlet
temperature is over 750 °C and the coolant is helium instead of CO2. (IAEA, 2014a)
In China, the construction of an HTR-PM (High Temperature Reactor-Pebble Bed
Module) reactor started in December 2012. The HTR-PM power plant has two reactors
and the plant is expected to be in operation by the end of 2017. China is also developing
fuel manufacturing technology for GCRs and a new fuel fabrication plant began its
operation in 2013.
HTGRs are being developed in number of IAEA member states. The development of
the Russian-US Gas Turbine-Modular Helium Reactor (GT-MHR) continues. This
reactor is designed to dispose of weapons-grade plutonium by using it for electricity
production and process heat applications. HTGRs are also being studied in Japan, where
a 30 MWth High Temperature Engineering Test Reactor is undergoing regulatory
review. The IAEA has two ongoing HTGR research projects and the European
Commission is engaged in the Advanced High Temperature Reactors for Cogeneration
of Heat and Electricity R&D project, which aims to expand European HTGR
technology to support nuclear cogeneration. (IAEA, 2014a)
2.1.2.5 Small modular reactors
Small modular reactors, or SMRs, are reactors with an electric power output of less than
300 MWe and their design is based on modularity. The IAEA classification of the term
SMR means both small and medium reactors. The IAEA defines a small reactor as
having an electric output of less than 300 MWe and a medium reactor as having an
electric output between 300 and 700 MWe (IAEA, 2014b). In this master's thesis, the
term SMR refers to small modular reactors with an electric output of less than 300
MWe and thus, excludes medium reactors and small, non-modular reactors.

16
Modularity means that a single reactor unit can be grouped with other similar modules
to form a larger nuclear power plant (Zhitao, L. & Jihong, F., 2013). Standardized
reactor units and serial production are essential features of small modular reactors.
Ready reactor modules are transported from the factory to plant site for installation.
Many SMR designs incorporate integral primary loops, where all the primary
components are inside a single pressure vessel. This eliminates large pipe penetrations
through the pressure vessel wall and enhances safety as large breaks and loss of coolant
accidents are less probable. Small modular reactors are being developed in a number of
countries and based on many different reactor technologies. The most advanced and
mature SMRs utilize light water technology, but gas and metal cooled SMRs are also
under development.
CAREM-25 is a prototype of an integral pressurised SMR with an electric output of 25
MWe. Construction of the CAREM-25 reactor began early in 2014 in Argentina. Once
the prototype proves the CAREM design, a larger CAREM reactor (about 100 MWe)
will be constructed in Argentina. (WNA, 2015)
The Russian Federation is developing SMRs that are based on the light water reactors
used in nuclear ships and submarines. KLT-40 reactors have been used as nuclear
propulsion for a few decades in Russian icebreakers. Considerable experience from
these reactors has helped in constructing and developing more advanced versions of the
reactor. The most mature Russian SMR design is the KLT-40S reactor which is
currently being built. The KLT-40S power plant is a floating nuclear power plant with
two KLT-40S reactors, which have an electric output 35 MWe each. The KLT-40S
reactor is not a truly integral PWR as its steam generators are located outside the
pressure vessel. The KLT-40S power plant is meant for the cogeneration of electricity
and heat. (ARIS, 2014)
Another fairly mature Russian light water SMR is the ABV reactor, which has many
design versions. ABV reactors have lower electric outputs than the KLT-40S, as their
electric output is between 4 and 18 MWe. The ABV has an integral primary loop and is

17
designed to be factory produced. The ABV power plant is a floating nuclear power plant
and is suitable for cogeneration of heat and electricity. (WNA 2015). The Russian
Federation is also developing a small modular fast reactor called the SVBR-100. This
reactor uses lead-bismuth (Pb-Bi) eutectic as a coolant and a pilot facility is supposed to
be in operation by 2019 (WNA, 2015). The electric output of the SVBR-100 is 100
MWe and it will be factory built. The Russian Federation has some experience with
operating prototype Pb-Bi cooled fast reactors which were installed in a few
submarines. The SVBR-100 fulfils the GIF's main requirements for a Gen IV reactor
system (Zrodnikov et al., 2011).
The most advanced SMR designs in the US are all light water reactors. The NuScale
reactor is an integrated PWR with an electric output of 45 MWe. The NuScale power
plant consists of a maximum of 12 separate NuScale reactor modules. The modules are
factory built and then transported to the plant site. The US Department of Energy has
financed the NuScale project. The energy company NuScale Power LLC expects to
submit design certification application for the NRC late in 2016 and the first NuScale
unit would be under construction in 2020. (WNA, 2015)
Babcock & Wilcox and Bechtel Corporation announced in 2009 that they would
develop the mPower reactor, which is an integrated PWR with an electric output of 180
MWe. It would be factory built and originally B&W anticipated that the reactor would
be able to obtain its construction permit in 2018 and the first two reactors would be in
commercial operation in 2020. However, the development of the mPower reactor has
slowed down as B&W announced that it would cut back funding on the project having
failed to find customers or investors. (WNA, 2014; WNN, 2014)
The third light water SMR under development in the US is the HI-SMUR reactor, which
is being developed by the energy company Holtec International. Holtec especially
advertises its 160 MWe version of the HI-SMUR reactor, also known as the SMR-160.
The HI-SMUR is not a truly integral PWR because its steam generator and control rod
drives are outside the pressure vessel. Holtec expects to submit a design certification

18
application in 2016. Westinghouse Electric Company started its own SMR project in
2012 but has since halted the research and development work as the company assessed
that the prospects for multiple deployment of SMRs are inadequate. (WNA 2015).
2.2 Energy security and security of supply
Security of energy supply and the continuous availability of energy at an affordable
price is invaluable for society. Security of the electricity supply is indispensable as
electricity is used all around us. It not only provides essential services for production,
communication and trade but is also invaluable in maintaining basic human needs such
as heating, ventilation and food and water supply. Electric motors and pumps are used
everywhere. Activities such as food production, transportation, storage and distribution
on the present scale would be nigh impossible without electricity.
The International Energy Agency defines energy security as "the uninterrupted
availability of energy sources at an affordable price" (IEA, 2014c). Energy security and
the security of the energy supply is the energy system's ability to withstand unique and
unforeseeable events that threaten the physical integrity of energy flows and the
functioning of the energy system. These events may lead to brownouts or blackouts,
which in turn have a serious disruptive effect on society as electricity is used to supply
basic human needs. These events may also lead to discontinuous energy price rises
which are independent of economic fundamentals.
Security of supply is especially important in the power sector. Electric storage
technologies have their own challenges and these storages are yet to be widely utilized
with the exception being pumped-storage hydropower. Of course, pumped-storage
hydropower can only be utilized near large bodies of water. According to the IEA, there
is 140 GW of large scale electricity storage capacity installed and connected to the
electricity grids worldwide and around 99% of this is pumped-storage hydropower.
Generally speaking, electricity is still deemed as non-storable on an industrial scale, but

19
this may change in the future to some extent. Research and development of large scale2
energy storage is underway with some already in the demonstration and deployment
phase. More about energy storages can be found in chapter 3.3. The need to balance
supply and demand in power markets and inelastic nature of demand for electricity
require close coordination between suppliers and the operators of electricity
transmission grids. (NEA, 2010; IEA, 2014b)
The energy security of a nation can be assessed through external and internal factors.
External factors include geopolitics, access to primary fuels, safety and adequacy of
international infrastructures, international climate policy and unanticipated resource
exhaustion. Internal factors include national energy infrastructures (e.g. grid,
transportation), operational reliability, adequacy of market design as well as the
regulation and adequacy of generation capacity. Nuclear power has, in particular
regarding external factors, clear advantages for enhancing energy security compared to
other non-renewable sources of energy. Renewables have good energy security ratings
in respect of fuel supply because wind, solar and hydropower do not use fuel in
traditional sense. As such, their electricity output is not in any way dependent on
imported fuels or neighbouring countries. Of course, production from these sources is
dependent on weather conditions and the production and consumption of electricity
might not match. There really is no electricity generation from solar or wind power on a
calm winter night and thermal power plants, hydropower or energy storage are needed.
(NEA, 2010)
The generalized Simplified Supply and Demand Index (SSDI) is an indicator of the
security of supply for a defined region. The SSDI includes major underlying supply-side
and demand-side factors. This indicator incorporates following aspects of the security of
supply:
2 Different flow battery technologies up to 10 MW capacity. Pumped hydropower and CAES storage can
have capacities ranging from 100 MW to 1 GW and these technologies are already mature. (Sandia, 2013;
IEA, 2014b)

20
import dependency and diversification of fuel and energy supply,
resource and carbon intensity, measuring the efficiency of resource use and
system adequacy, "technical capability of energy system to maintain adequate
supply and transport under a wide range of operational conditions" (NEA, 2010).
The SSDI is normalised to range from 0 to 100, where 0 indicates and extremely low
security of supply and 100 an extremely high level of security. Here it is based on the
generalized SSDI but adapted to work with only the IEA Energy Statistics. The basic
structure and principles of the SSDI are presented in Appendix 1. Figure 4 shows the
evolution of the SSDI for selected OECD countries. (NEA, 2010)
Figure 4. The evolution of the SSDI in selected OECD countries from 1970 to 2006. (NEA,
2010)
From the Figure 4, one can see changes in the trend when important policy changes
have been implemented. For example, the United Kingdom's switch from coal to gas
and the introduction of nuclear programmes in Finland, France, and the United States
improve the value of the SSDI. Generally, the improvement in the SSDI coincides with
the introduction of nuclear power and decreases often relate to increases in imports.

21
Figure 5 presents only the contribution of nuclear power to the SSDI and clearly shows
its great effect on enhancing the SSDI scores. Contrary to fossil fuel technologies,
nuclear energy has low sensitivity to the variations in the price of its fuel i.e. uranium.
Nuclear energy is a competitive power generation source with a high energetic density.
More reasons why nuclear energy improves energy security and thus also contributes to
better SSDI scores are presented in the following chapter. (NEA, 2010)
Figure 5. The contribution of the nuclear power to the SSDI. (NEA, 2010)
In 2007, the contribution of nuclear power to the SSDI was more than 12 points (about
30% of the overall SSDI score) in France, 11 (21 %) points in Sweden, 9 points (26%)
in Finland, and 6 points (17%) in Japan and Korea. Nuclear power significantly
enhances a nation's security of energy supply. (NEA, 2010)
2.2.1 The role of nuclear energy in improving energy security
The security of the energy supply can be divided into external and internal dimensions,
seen in Figure 6. Nuclear power improves both of these dimensions.

22
Figure 6. Dimensions of energy supply security. (NEA, 2010)
The external dimension refers to the aspects of security of energy supply, which are not
under the direct control of the country in question. Geopolitical risk refers to the
geographical location of the primary fuel sources. Different primary fuels have different
levels of geopolitical risk due to the distribution of fuel sources or deposits. Production
of the fuels and their consumption are often physically far apart and take place in
countries and regions with different political situations, cultures, histories and values
(NEA, 2010). Geopolitical risks depend on relations between producer and consumer
countries. All imported fuels are exposed to geopolitical disturbances in the countries
which produce these fuels and the risks of disturbances occurring are naturally lower if
the particular primary fuel sources are present in a number of countries. The safety and
adequacy of international infrastructures have a somewhat similar effect on the security
of energy supply and the risks linked to international infrastructures can be alleviated
the same way: by having a number of fuel producing countries. If, for example, the
safety of the infrastructure between producer and consumer countries is compromised,
another producer country can circumvent this problem by providing an alternative fuel
source. Moreover, the global nuclear fuel supply chain has yet to experience a serious

23
disruption and nuclear power involves long lead times allowing the nuclear industry to
have ample time to anticipate and respond to changes in uranium demand. (IEA, 2014e)
Internationally traded oil and gas have a relatively few sources and countries of origin.
Political instability there, or in the countries through which the fuel is transported, is a
constant risk to energy security and thus, also a major economic vulnerability (WNA,
2015). Fossil fuels are also subject to regional price disparities and volatility (IAEA,
2014a). Coal supplies are geographically more diverse than oil and gas supplies and
hence less uncertain to acquire. Raw uranium supply and uranium fuel processing and
manufacturing services are multiply redundant. Uranium resources are available from
more diverse sources than fossil fuels, both geographically and politically. This lessens
the political risk of acquiring uranium and gives it a very high rating in respect to
energy security. There are also numerous nuclear fuel fabricators and thus, nuclear
power plant operators are not restricted to acquire the fuel just from the original plant
suppliers. Nuclear energy also benefits from the very high energy density of uranium
fuel. Uranium, oil and coal fuelled power plants in regard to their fuel consumption are
compared in Table 1.
Table 1. How much of a specific fuel a 1000 MWe power plant requires annually.
(EURELECTRIC, 2003)
Fuel Amount [t]
Lignite 7 600 000
Hard coal 2 000 000
Oil 1 290 000
Gas (combined cycle) 920 000
Nuclear 20

24
Table 1 shows how much fuel a power plant with electrical capacity of 1000 MWe
requires annually. The amounts presented are estimates and depend, for example, on
quality of fuels. Table 1, however, gives an idea of just how much more coal, lignite,
oil, and gas are required when compared to uranium and supports the idea that uranium
is more affordable fuel to stockpile. In the table, the fuel consumption in a power plant
with a generation capacity of 1000 MWe and 6600 full load hours per annum is
compared. A nuclear power plant with a generation capacity of 1000 MW uses 20
tonnes of fabricated uranium fuel, while a coal power plant with the same generation
capacity uses 100 000 times more coal. (EURELECTRIC, 2003)
The relatively small volume of nuclear fuel required to run a reactor makes it easier to
establish strategic inventories, even if the overall trend in recent years has been towards
supply security based on diverse and reliable markets for uranium and fuel supply
services. Still, nuclear fuel and uranium offer the option of keeping relatively low cost
strategic inventories for countries and utilities that consider these important (IAEA,
2012).
The cost of uranium is a small fraction of the total cost of nuclear power generation and
so it is a more affordable fuel to stockpile than fossil fuels or coal. Also fuel price
spikes have a much less severe economic impact for nuclear generation than fossil
generation. As generating costs for nuclear are less sensitive to changes in fuel costs,
nuclear generation provides stability in wholesale electricity costs. According to the
IEA (2014e), a 50% increase in nuclear fuel costs will only increase the levelized cost
of electricity3 by 5%. Equivalent rises in gas prices push up the generating cost of a
combined-cycle gas turbine by around one-third.
The oil crises of the early 1970s showed that electricity generation's dependency on
imported fuels is a real problem. For example, France increased its nuclear generating
3 The levelized cost of electricity (LCOE) represents the per-kilowatthour cost (in real currency) of
building and operating a generating plant over an assumed life and duty cycle. (EIA, 2014)

25
capacity significantly since the late 1970s and nowadays over 75% of France's
electricity generation is based on nuclear power. This enhances energy security and
security of supply and can also be seen in the Figure 4. (WNA, 2015)
The internal dimension of the security of energy supply is affected greatly by a
country's government, policies and legislation. Governments can influence the adequacy
of generation capacity by providing incentives for the private sector to install facilities
domestically for the production, transport, conversion and consumption of energy.
Important elements to the enhance internal dimension of energy security include
regulatory stability, market organisation, governmental and policy support for low
carbon energy sources, such as nuclear, and fiscal coherence (NEA, 2010). These
elements affect all sources of electricity generation but especially nuclear energy, which
generally has to have political support for construction. Operational reliability naturally
affects energy security as utilities and consumers expect that power plants produce their
promised capacity. Nuclear power, especially in Finland, has been reliable in this
regard. Nuclear power plants are not subject to unreliable weather or climate conditions,
unlike renewable generation. The operational reliability of nuclear energy is discussed
in chapter 2.4.
2.2.2 Resources
Renewables and nuclear energy have one significant common feature: when using
nuclear and renewable energy, mankind is not depleting resources useful for other
purposes. These sources of electricity generation give access to virtually limitless
resources of energy with negligible opportunity cost. Other fuels used for energy
production, such as oil, wood or coal, also have other uses. There are visions of a time
when fossil carbon-based fuels will be too valuable to burn on the present scale, not to
mention the desire to move to a CO2-free from of energy production in order to mitigate
climate change. (WNA, 2015)
In total, there were about 5.9 million tonnes of known recoverable uranium resources
worldwide in 2013. Reasonably assured resources plus inferred resources of uranium

26
come to total of 7.635 million tonnes. Current uranium usage is about 66 000 tU/yr,
meaning that the world's present measured uranium resources (5.9 Mt) in the cost
category around 1.5 times of present spot prices are enough to last for about 90 years
when used in conventional reactors. Higher uranium prices and further exploration will
yield further resources as present ones are used up. The amount of known resources
which are economically extractable is directly proportional to the price of mineral
commodity. Based on the analogies with other metal minerals, when a price of the metal
mineral doubles from present levels, about a tenfold increase in measured economic
resources could be expected. This is due to increased exploration and the
reclassification of resources regarding what is economically extractable. Figure 7
presents how recoverable uranium resources are distributed in the world. (WNA, 2015)
Figure 7. Known recoverable uranium resources in 2013. (data from WNA, 2015)

27
Current estimates that cover all conventional resources (uranium as the main product or
a major by-product), including those not yet economic or properly quantified, consider
that there is 200 years' supply of uranium at today's consumption rate. These reserves
are estimated without considering the technological factor. Widespread use of the fast
breeder reactors could increase uranium utilization 50-fold or more. Also non-
conventional uranium resources, such as phosphate/phosphorite deposits (up to 22 Mt of
uranium), black shales (5.2 Mt U) and seawater (up to 4 000 Mt U), are omitted from
previous estimates. Most non-conventional resources are uneconomic to extract in the
foreseeable future but research into extracting these resources is ongoing. (WNA, 2015)
The aforementioned uranium supplies and their consumption rates are estimated for
present nuclear reactors and their fuel cycles. With fast reactors and advanced fuel
cycles that recycle nuclear fuel, known conventional resources are estimated to be able
to last over 3 000 years and with non-conventional resources over 21 000 years.
Advanced fuel cycles have also the benefit of reducing the volumes of high-level
radioactive waste. Advanced cycles have the ability to consume, or burn, the heavy
long-lived isotopes (minor actinides or transuranics) formed in nuclear fuel during
irradiation in the reactor. Minor actinides and a few long-lived fission products
dominate the activity present in the spent fuel in the longer timescales. Thus, burning
these minor actinides and long-lived fission products can significantly reduce the long-
lived component of high-level waste. (IEA, 2010a)
2.2.3 Resource efficiency and energy density
Resource efficiency means maximizing the use of resource and in this case, nuclear fuel
i.e. uranium. Measuring different aspects of resource use, such as the carbon or land
footprint, is a key tool of defining resource efficiency. Nuclear energy's carbon
emissions are discussed further in the chapter 2.3.
One way to compare resource efficiency for different electricity generation technologies
is to compare the energy densities of the fuels used. The energy density is the quantity
of fuel used to produce a given amount of energy. The energy density influences the

28
fuel extraction activities, transport requirements and quantities of environmental
releases and waste, thus determining to a large measure the magnitude of environmental
impacts. Table 2 presents how much heat energy one kilogram of a specific fuel can
generate. Uranium fuel used in LWRs has a 3 to 5 % concentration of uranium-235. In
the Table 2, 1kg of pure uranium-235 is compared to coal and mineral oil. One kilogram
of natural uranium with a concentration of uranium-235 of about 0.7 % enables the
generation of 45 000 kWh of electricity, a much higher amount than coal or oil enables.
(ENS, 2015)
Table 2. How much heat is generated by one kilogram of fuel. (ENS, 2015)
Fuel [1 kg] Heat generated [kWh]
coal 8
mineral oil 12
uranium-235 24 000 000
Table 2 shows the extraordinarily high energy density of uranium-235 relative to fossil
fuels and as shown previously in Table 1, this directly affects how much fuel a power
plant requires annually.
2.3 Emissions
Greenhouse gases emitted by a nuclear energy system are not limited only to carbon
dioxide, but also other greenhouse gases. However, there is lack of data available on the
other greenhouse gases, so here the analysis is limited to the emission of CO2 (Storm
van Leeuwen, 2012). Nuclear power generation does not directly emit greenhouse gas
emissions or other air pollutants during operation and generally produces very low
emissions over its full life cycle. Assessing the greenhouse gas emissions of nuclear
power includes the whole nuclear process chain: mining the uranium, milling it, the

29
treatment and enrichment of the uranium, fuel fabrication, construction of the nuclear
power station and finally dismantling and disposal operations (Princiotta et al., 2011).
According to the IEA's World Energy Outlook 2014, the greenhouse-gas emissions
intensity4 is currently about 15 grams of CO2-eq per kilowatt-hour for nuclear energy.
This figure is comparable to that of wind, solar and hydropower. Sovacool (2008)
screens 103 lifecycle studies of greenhouse gas-equivalent emissions for nuclear power
plants. He omits studies done before 1998, studies not available in the public domain or
not published in English, studies relying on unpublished data and studies utilizing
secondary sources. This leaves 19 lifecycle studies and according to these, the range of
emissions for nuclear energy over the lifetime of a plant is from 1,4g of carbon dioxide
equivalent per kWh to 288g CO2-eq/kWh. The mean value in the Sovacool study was
66g CO2-eq/kWh for nuclear energy. The wide disparity comes from the different
scopes and assumptions these 19 studies used. Some studies included just one or two
parts of the nuclear fuel cycle and others provided explicit details even for
subcomponents of the fuel cycle. The highest lifetime greenhouse gas emission
estimates for nuclear fuel cycle are not universally accepted. In his article, Sovacool
mentions another study consisting of numerous lifecycle studies and in this study the
range of 2-77g CO2-eq/kWh was most common. Estimates above 40g CO2-eq/kWh
were in the minority. Overall, there is no universally accepted value for greenhouse gas
emissions associated with the nuclear lifecycle. Nuclear energy raises a lot of opinions
especially regarding to its eco-friendliness. Both sides of the nuclear debate attempt to
make nuclear energy look cleaner or dirtier than it really is. (IEA, 2014e; Sovacool, B.,
2008)
In this thesis, the lifecycle carbon emission estimate for nuclear energy is 15g CO2-
eq/kWh (IEA, 2014e). The IEA's value puts nuclear energy carbon emissions on the
same level as the emissions from renewables. It is important to remember that nuclear
4 The amount of CO2-equivalent (CO2-eq) emissions per kilowatt-hour. (IEA, 2014e)

30
energy's emissions during operation are virtually non-existent and the high value of 66g
CO2-eq/kWh comes from different technologies and work phases associated with the
nuclear process chain, mainly isotope enrichment during fuel manufacturing. These
technologies and work phases and their carbon emissions are evaluated differently in
different studies. It is likely that the technologies involved in the nuclear energy
lifecycle will further develop and their carbon and energy intensities and use of
electricity will decrease. This in turn will lower the lifecycle carbon emission estimate
for nuclear energy. In Table 3 lifecycle carbon emissions for different technologies are
presented. Table 3's contents are modified from the original source by combining
different configurations and biomass fuels. These values are later used in the model to
compare emissions in different scenarios and with two different values for nuclear
energy lifetime emissions.

31
Table 3. Lifecycle carbon emission estimates for different electricity generation technologies.
(modified from Sovacool, B., 2008; IEA, 2014e)
Technology Capacity/configuration/fuel Estimated carbon dioxide emissions
[gCO2-eq/kWh]
Coal Various generator types
with/without scrubbing 960-1 050
Heavy oil Various generator and turbine
types 778
Fuel cell Hydrogen from gas reforming 664
Natural gas Various combined cycle
turbines 443
Biomass Various fuels and
configurations 14-41
Geothermal 80 MW, hot dry rock 38
Solar photovoltaic Polycrystalline silicone 32
Nuclear (IEA value) Various reactor types 15
Solar thermal 80 MW, parabolic trough 13
Hydroelectric 300 kW run-of-
river/hydroelectric 3.1 MW
reservoir
13/10
Biogas Anaerobic digestion 11
Wind 1.5 MW onshore/2.5 MW
offshore 11/9
Studies show different values for each generation technology, but the common trend is
that nuclear power has significantly lower CO2 emissions than fossil fuels. At the time
of writing, nuclear power is the world's second-largest source of low carbon electricity
after hydropower and in OECD countries it is the largest source of low carbon
electricity (IEA, 2014e). It should be noted that as nuclear power does not directly emit

32
greenhouse gases, it has the potential to have even lower CO2 emissions in the future
when technologies involved in the lifecycle emissions improve. A shift from an
electricity intensive gaseous diffusion uranium enrichment process to a centrifuge
enrichment process has lowered the electricity requirements in uranium enrichment
considerably. Laser enrichment technologies will also lower the electricity requirements
of uranium enrichment, and together with the increased share of electricity that is based
on low or non-carbon fuels, reduces emissions of nuclear life cycle. (IAEA, 2012)
Extended lifetimes for nuclear power plants further reduce the emissions per kilowatt-
hour associated with construction and the future's increased fuel burnups mean reduced
emissions per kilowatt-hour associated with uranium mining and fuel manufacturing.
Improvements in nuclear fuels and reactors allow better utilization and unit capability
factors. Future energy production will be more efficient and together with extended
lifetimes for nuclear power plants will reduce the need to build new facilities. (IAEA,
2012; IAEA, 2014a)
Germany offers a fine example how an aggressive energy policy aimed at reducing CO2
emissions and the phasing out of nuclear energy really impacts the CO2 emission levels
in the power sector. Germany adopted an energy policy called Energiewende in 2010-
2011 and the aim of the policy is to fully decarbonise the power sector by 2050 while
also phasing out nuclear power by 2022. One goal is to achieve a 55 % reduction in
greenhouse gas emissions by 2030 compared to 1990 levels. Nuclear energy's share in
the power generation mix has decreased from 29.5 % in 2000 to 15.4 % in 2013. The
share of renewables has increased from 6.6 to 23.9 % over the same period. The decline
of nuclear generation is offset by the increase in renewable generation. (Agora, 2014)
Even though Germany has increased the share of renewables in its power generation
mix, the CO2 emissions from the German power generation sector have been on the rise
since 2009. The market conditions in Germany have resulted in coal-fired power plants
pushing gas plants out of the market thus increasing CO2 emissions from the power
sector. Coal and CO2 emission prices have decreased while simultaneously gas prices

33
have increased. In 2013, lignite fired generation reached its highest level since 1990.
Nuclear phase-out does not itself entail an increase in CO2 emissions as long as the
nuclear generation is replaced with renewables. The simultaneous increase in fossil
fuelled generation has increased the overall CO2 emissions from the German power
sector. As it stands, renewables alone cannot produce all the electricity that the German
market requires. Operating nuclear power plants produces virtually no CO2 emissions
and the nuclear generation would help the German power sector to achieve the desired
reductions in CO2 emission levels. However, the German energy policy, Energiewende,
aims to phase out nuclear power and thus some other measures are needed in order to
meet the government's climate targets. (Agora, 2014)
According to the publication by Agora Energiewende (2014), from 2013 to 2030 lignite
generation will need to drop by 62% and coal fired generation by 80%. This would
result a generation mix of 55% renewables, 22% gas and 19% coal (lignite and hard
coal) in 2030. Consumption of natural gas in the power sector would increase from the
2013 levels but this increase will be offset by the decreased use of gas in the end-use
sector which uses more gas than the power sector. The Agora publication did not
consider the balance between consumption and production, which is one of the main
reasons why fossil fuels are still used in Germany. Renewable generation cannot
guarantee its production and timing of production; high demand for electricity may very
well take place when there is no wind and the weather is cloudy. Whether the
aforementioned shares of gas and coal can satisfy the electricity demand at all times is
uncertain. Increasing the share of renewable generation may very well require building
more fossil fuelled backup or peak power plants as nuclear power is phased out. This in
turn is not in line with the aspirations and targets to reduce the carbon emissions from
the power sector.
2.4 Predictability and stability of nuclear generation
Nuclear power plants have traditionally been reliable sources of electricity generation.
This reliability can be measured and compared with other generation sources by using

34
the capacity factor. The capacity factor for a power plant describes the ratio of actual
power generated to its maximum potential generation. The U.S Energy Information
Administration (EIA, 2014) has published tables of monthly capacity factors for
different fossil and non-fossil fuel and technology combinations in the United States.
These factors are presented in Figure 8.
Figure 8. Monthly capacity factors for select fuels and technologies in the United States. (EIA,
2014)
According to the EIA data and Figure 8, nuclear power has the highest average capacity
factor, meaning that the US nuclear fleet offers reliable energy to the national grid.
Utilities and consumers generally, and not just in the US, can trust that nuclear power
plants produce the promised capacity of electricity.
The IAEA Power Reactor Information System (PRIS, 2014) reports a global average
unit capability factor of 76.3% over the period of 2011to 2013. This factor includes all
reactors that were in commercial operation during this period. In Finland this factor was
93.4% over the same period. The unit capability factor is the ratio of the available
energy generation over a specified time period to the uninterrupted production at full
35
power over the same period. The available energy generation is the energy that could
have been produced considering only limitations within the control of plant
management. Uninterrupted energy generation is the energy that could be produced if a
particular unit were operated continuously at full power. The unit capability factor
reflects the effectiveness of plant programs and practises and more or less describes the
same thing as the capacity factor mentioned previously. Simply put, Finland's nuclear
power plants in 2011 to 2013 produced 93.4% of their theoretical maximum energy. In
Finland, the majority of nuclear power plants' downtimes are due to planned annual
maintenance and refuelling periods. Refuelling and maintenance are scheduled in the
early and late summer because the demand for energy in Finland is generally lower
during the summer. Generally most shutdowns are planned and as they can be foreseen,
shutdowns are scheduled to take place when demand is expected to be lower than
normal. Unplanned shutdowns are a minority of all the shutdowns and shutdowns which
do occur, mainly for refuelling work, are relatively short. Nuclear power plants generate
electricity in a predictable manner at stable prices and their availability is known in
advance. (PRIS, 2015)
Nuclear power plants have long operating lifetimes, typically 40-60 years. They can
generate electricity continuously for extended periods before going offline for refuelling
and maintenance. Nuclear power plants help maintain grid frequency as their generating
capacity is available, adjustable and predictable for the majority of the time.
Some of the grid management services that the nuclear power offers to the power grid
include:
primary and secondary frequency control,
predictable and controllable availability and
rotating inertia.
Primary frequency control means that the power plants monitor the frequency on the
grid and immediately adapt their level of generation if the frequency alters from the

36
defined value. The purpose of primary frequency control is to keep the frequency stable
at the desired value. Some deviation remains after primary frequency control and this
deviation can be corrected with secondary frequency control. Secondary frequency
control calculates the average frequency deviation over a period of time. For example,
the grid operator can send a digital signal to the power plant to modify its power level in
order to take into account the balance of electricity exchanges with other grids.
Frequency control and the flexibility of nuclear power plants is discussed later in
chapter 2.5. (NEA, 2011)
2.4.1 Grid inertia
Power grid frequency measures the balance between consumption and generation. For
example, in the Nordic countries the frequency of the power grid is 50 Hz and if the
frequency drops below this value, the overall electricity consumption is greater than
generation. Power grid inertia is one parameter the synchronized operation of the grid is
based on and it determines the immediate frequency response. This inertia is introduced
to the power grid by the rotating masses of synchronous generators and turbines which
are connected to the grid. These components will inject or absorb kinetic energy into or
from the grid to counteract the frequency deviation from the predetermined frequency
value. If the overall inertia in the power grid is low, the grid frequency reacts nervously
to sudden changes in generation and load patterns. To put it simply, inertia is the grid's
resistance to change. (Tielens, P. & Van Hertem, D., 2012)
Basically all thermal power plants, whether they are fossil, nuclear or biomass fuelled,
introduce rotating inertia to the power grid as their synchronous machines, generators
and turbines, are connected to the grid directly. However, wind turbines and solar panels
have practically no inertia. Even though wind turbines have kinetic energy stored in the
blades and the generator, they are generally equipped with doubly fed induction
generators or full converter synchronous generators and these electrically decouple the
generator from the grid. Thus wind and solar power do not produce any inertia for the
power grid. (Tielens, P. & Van Hertem, D., 2012)

37
Nuclear power plants are generally large units with large generators and turbines and
thus they introduce large rotating masses to the power grid. This increases the overall
kinetic energy and inertia in the power grid and in turn the grid's resilience to abrupt
changes in generation and load patterns, stabilising the grid. (Päivinen, 2012)
The large unit sizes of nuclear power plants also have a downside in regards to grid
management. If a large generator would unexpectedly drop from the grid, the frequency
of the grid would also suddenly and temporarily drop. The frequency of the grid has set
limits in regards to minimum and maximum frequency values and these values together
with the total amount of connected synchronous rotating mass (i.e. turbines and
generators) limit the maximum unit size of the power plants. (Päivinen, 2012)
Overall nuclear power plants offer large amounts of inertia and kinetic energy to the
power grid which in turn improves system's fault tolerance in regards to other thermal
power plants and their possible failures. However, if a nuclear power plant experiences
a fault which drops the unit from the power grid, the grid loses a substantial amount of
kinetic energy and inertia. As a result, the frequency of the grid drops more than if a
smaller sized unit would drop from the power grid.
Fingrid Oyj, the enterprise responsible for managing the Finland's nationwide high-
voltage grid, is prepared for the grid connection of the Olkiluoto 3 nuclear power plant.
Olkiluoto 3 is a nuclear power plant under construction with a net electrical capacity ca.
1 600 MW and once it is finished, it's generator will be the largest in the Nordic energy
system. A large unit like this will increase the inertia in the power grid and if the unit
works as intended, the overall fault tolerance of the power grid will increase. At the
time of writing, the Nordic energy system can accept a unit with a capacity of 1 650
MW at most. (Haarla, 2013)
2.5 Flexibility of nuclear power plants
Traditionally nuclear power plants have been considered as base-load sources of
electricity. This is due to nuclear power being a technology with high fixed costs and

38
low variable costs, so the most profitable way to run a nuclear power plant is with close
to full capacity as long as prices are stable. Response to variations in electricity demand
is traditionally left to power plants with low fixed cost and high variable costs, such as
gas plants or fossil fuel plants. Still, nuclear power plants offer valuable grid
management services and they can also operate in load following mode.
In some countries, such as France, the share of nuclear power in the national electricity
generation mix has become so large that utilities have to be able to operate some nuclear
reactors in a load following mode. A nation's electricity demand changes daily and
seasonally and electricity generation has to be able to follow these changes. In France,
more than 75% of the nation's electricity is generated by nuclear power plants and
remaining 25% is generated by various sources, not all of which can be operated in a
load-following mode. Furthermore, nuclear capacity in France exceeds the base-load
needs during certain periods during which it is necessary to reduce the overall nuclear
load. (Lokhov, A., 2011)
Another reason for a load following operation mode with nuclear power plants is due to
the large scale deployment of intermittent electricity sources like wind or photovoltaic
power. Several OECD countries have a growing share of renewable electricity sources
which has introduced significant and irregular variation in the available power supply.
This has made balancing the national electricity supply and demand more difficult.
As the share of renewables increases and the share of fossil fuelled generation decreases
in the future energy system, the need for manoeuvrable and load following nuclear
power plants increases. In Germany, the deployment of large amounts of variable
renewable generation with heavy government induced subsidies has repeatedly led to
prices below the marginal cost of nuclear power, including several instances of negative
prices and prices that were lower than the variable costs of nuclear power plants.
Nuclear power plants have the lowest variable costs among the large scale established
power sources and German utilities have started operating their nuclear power plants in
load following mode. The French and the German experiences have shown that nuclear

39
power has the technical capability to engage in load following modes of operation.
Table 4 presents the load following ability of four different power plant technologies.
Maximum ramp rates in MW per minute are calculated from the ramp rate in
percentages per minute by using capacities in parentheses. The capacities chosen are
quite typical values for these generation technologies. (Lokhov, A., 2011; NEA, 2011)
Table 4. The load following ability of different power plants in comparison. (NEA, 2012)
Technology Start-up time Maximal
change in 30 sec
Maximum ramp rate
[%/min]
Maximum ramp rate [MW/min]
Open cycle gas turbine
(200 MW)
10-20 min 20-30 % 20 40
Combined cycle gas turbine
(580 MW)
30-60 min 10-20 % 5-10 29-58
Coal plant
(600 MW) 1-10 hours 5-10 % 1-5 6-30
Nuclear power plant
(1 200 MW)
2 hours - 2 days up to 5 % 1-5 12-60
When comparing just the ramp rates, nuclear power's short-term load following
capabilities are comparable to those of coal-fired power plants but somewhat below
combined cycle gas turbine plants. Open cycle gas turbines clearly have the best load
following capabilities in regards to start-up time, maximal change in 30 seconds and the
relative maximum ramp rate, but they have very high variable costs limiting their use to
cover the most extreme demand peaks. Furthermore, as can be seen from the absolute
maximum ramp rate [MW/min], nuclear power plants can offer the same amount of
adjustable capacity. The start-up time is a non-issue when the nuclear power plant is
already running. Nuclear power has the longest start-up time, but when the respective
40
generating capacities are taken into account, nuclear power can offer as much or more
adjustable capacity than gas turbines but with a much lower relative change in power
level. One percent of rated power in a nuclear power plant is much more than one
percent in a gas turbine. (NEA, 2012)
According to the NEA (2011), most of the currently operating nuclear power plants
were designed to have strong manoeuvring capabilities. One of the key features for the
load following capabilities of the plant is the existence of an accurate core monitoring
system. It is important to accurately evaluate the difference between the maximal local
power density in the core and its safety limit. Rapid and precise power distribution
measurements provide significant margin for manoeuvring. (Lokhov, A., 2011)
Generally speaking, four types of nuclear power plant manoeuvring or operating modes
are used:
base-load generation mode;
primary and the secondary frequency control and
load following mode.
In the base-load generation mode, a power plant generates electricity at constant power,
usually at the maximum rated power, during almost the whole cycle. Primary and
secondary frequency control depends on the current grid demand; the power demand
can never be exactly estimated in advance and thus power plants have to monitor the
frequency of the grid and adapt their level of generation to maintain the desired value.
Primary frequency control is for short term adjustment of electricity production (a time
frame of about 2 to 30 seconds) and secondary frequency control is for longer
timeframes (from several seconds to several minutes). Finally, nuclear power plants
operating in a load following mode follow a variable load program which has one or
two power changes per period of 24 hours. (NEA, 2011)
The European Utilities' Requirements (EUR) was founded in 1991 by five European
utilities and it covers a broad range of conditions for a nuclear power plant to operate

41
efficiently and safely. The EUR has explicit requirements for modern reactors
concerning their manoeuvrability capabilities and in particular the EUR requires that
modern plants are able to operate in load following modes. According to the EUR
requirements, a nuclear power plant must be capable of a minimum daily load cycling
between 50% and 100% of its rated power Pr, with a rate of change of electric output of
3-5% Pr/min (Lokhov, A., 2011; NEA, 2011)
According to the final report made by technical consulting company ÅF Consult (2012),
EPR reactors have the following manoeuvrability features:
power decreasing rates of 5% per minute in the power range of 100% 60%
and back to 100% rated power, in daily use
changing power levels from 100% to 25% at a rate of 5%/minute and from 25%
to 60% at a rate of 2.5%/minute.
It is reported that the reactors designed by Mitsubishi, Toshiba and GE-Hitachi have
similar capabilities. Nuclear power plants usually generate power at their rated power
level, so possible grid balancing with nuclear power would first consist of decreasing
the power levels when there is an oversupply of energy. Of course, after the initial
power level decreases the nuclear power plant can be readjusted to its previous power
levels if needed. (ÅF, 2012)
Economically, using nuclear power for base-load generation is the most profitable
operation mode, but the demand for electricity fluctuates throughout the day and there
has to be some way to answer this demand. In the future energy system, nuclear power
might be needed to stabilise the grid. Modern and future nuclear power plants have the
manoeuvring capabilities to do so.
42
3 FUTURE ENERGY SYSTEM
According to the current, generally accepted view, one of the biggest challenges for the
energy sector is climate change mitigation. Thenergy sector's solutions for mitigating
climate change include the efficient use and production of energy from CO2-free
sources of electricity generation and carbon capture and storage (CCS). As was shown
in Table 3, nuclear power and renewables have the lowest CO2 emission per kWh of
energy and thus a transition to an energy system consisting mainly of these generation
sources is essential in order to mitigate climate change.
Current trends are unsustainable in relation to the environment, energy security and
economic development. Continuing dependence on fossil fuels drives up both CO2
emissions and the price of fossil fuels. Using a combination of existing and new
technologies, it is possible to halve global energy-related CO2 emissions by 2050.
According to the International Energy Agency (2010), the greatest potential for
reducing CO2 emissions over the period to 2050 comes from increasing energy
efficiency. The second-largest source for emissions reductions is decarbonising the
power sector, and thus the transition to an energy system dominated by renewable
generation, together with nuclear power, will be essential. Currently, OECD countries
strive to reduce their greenhouse gas emissions. Electricity sectors generally have
limited exposure to international competition and together with their stationary nature,
they are frequently called upon to generate a major share of these emission reductions
(NEA, 2012; IEA, 2010)
Globally, the current energy system is based on large, centralised generation using
mainly fossil fuels. The future low carbon energy system will have greater diversity of
technologies and fuels, and more renewables especially will be used (IEA, 2012a). In
addition to renewables, nuclear power will be a major contributor to the decarbonisation
of the electricity supply (IEA, 2010). This, however, presents new challenges. For
example, renewable energy output has a tendency to fluctuate depending on the
weather. Today's energy system uses mainly hydropower and fossil fuelled power plants

43
as regulating power to stabilise the power grid and to meet the supply and demand
challenges. In this master's thesis, a future energy system is envisaged to be carbon free
and thus, the share of fossil fuel dependent energy generation is significantly lower, or
zero, in the future energy system. Decarbonising the energy system requires alternative
grid stabilising methods and technologies. Increased volumes of variable and
intermittent production from wind and solar will highlight issues related to regulating
power. In Nordic countries, the large share of hydropower will help the transition and
will become increasingly valuable in regulating electricity systems in these countries
and Northern Europe in general (IEA, 2013).
The level of nuclear growth envisaged will not require major technological
breakthroughs. The possible obstacles for rapid, short to medium term, nuclear growth
are primarily policy-related, industrial and financial. If nuclear capacity is to grow in the
2020s and beyond, the global industrial capacity to construct nuclear power plants will
need to double by 2020. This requires significant investments over the next few years
and the prerequisite for these investments is a clear indication that sufficient orders are
on the horizon. Nuclear growth also requires increased human resources. Utilities,
regulators, governments and other stakeholders will need more nuclear specialists,
highly qualified scientists, engineers and skilled crafts-people. In addition to industry
recruitment and training programs, universities and governments also have a vital role
to play in the development of available human resources. (IEA, 2010)
The Nordic countries have set their ambitions and energy targets on a Carbon-Neutral
Scenario (CNS), in which CO2 emissions in the region are reduced by 85% by 2050
compared to emission levels in 1990. Within this strategy, some Nordic countries would
achieve a carbon-neutral energy system by 2050 (IEA, 2013). In this master's thesis, the
energy system covers electricity and combined power and heat generation. The Nordic
energy system in the thesis consists of Denmark, Finland, Norway and Sweden and is
considered to be carbon free by 2050. The energy system in this scenario consists of
renewable energy generation and nuclear power. Nordic electricity generation is
currently dominated by traditional renewables i.e. hydropower, especially in Norway,
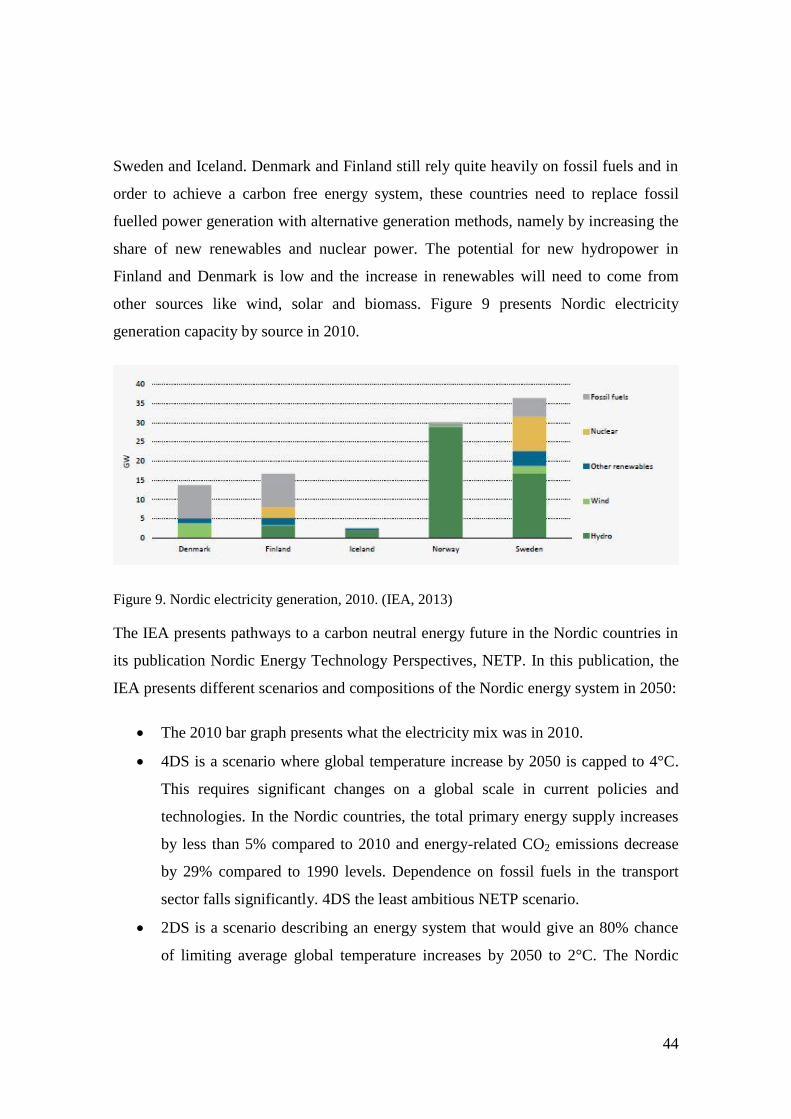
44
Sweden and Iceland. Denmark and Finland still rely quite heavily on fossil fuels and in
order to achieve a carbon free energy system, these countries need to replace fossil
fuelled power generation with alternative generation methods, namely by increasing the
share of new renewables and nuclear power. The potential for new hydropower in
Finland and Denmark is low and the increase in renewables will need to come from
other sources like wind, solar and biomass. Figure 9 presents Nordic electricity
generation capacity by source in 2010.
Figure 9. Nordic electricity generation, 2010. (IEA, 2013)
The IEA presents pathways to a carbon neutral energy future in the Nordic countries in
its publication Nordic Energy Technology Perspectives, NETP. In this publication, the
IEA presents different scenarios and compositions of the Nordic energy system in 2050:
The 2010 bar graph presents what the electricity mix was in 2010.
4DS is a scenario where global temperature increase by 2050 is capped to 4°C.
This requires significant changes on a global scale in current policies and
technologies. In the Nordic countries, the total primary energy supply increases
by less than 5% compared to 2010 and energy-related CO2 emissions decrease
by 29% compared to 1990 levels. Dependence on fossil fuels in the transport
sector falls significantly. 4DS the least ambitious NETP scenario.
2DS is a scenario describing an energy system that would give an 80% chance
of limiting average global temperature increases by 2050 to 2°C. The Nordic

45
2DS scenario not only transforms the energy sector but also the greenhouse gas
emissions in non-energy sectors are reduced.
CNS means a Carbon-Neutral Scenario. In this vision Nordic CO2 emissions are
reduced 85% by 2050 compared to 1990 levels and international carbon credits
are used to offset the remaining 15%. The total primary energy supply decreases
by 15% compared to 2010. In addition to transforming the energy system also
the non-energy sectors, such as transportation, need to invest in low carbon
technologies. These other sectors are not considered in this thesis. In the CNS
the Nordic energy system would achieve carbon neutrality by 2050.
CNBS means a Carbon-Neutral high Bioenergy Scenario. As the name suggests,
in this scenario the use of biomass is higher than in other scenarios. The CNBS
makes optimistic assumptions about the availability and import costs of biofuels.
The transport sector does not use oil in 2050 and the use of biomass and waste in
the buildings and construction sectors is higher than in the CNS.
CNES means Carbon-Neutral high Electricity Scenario. In this scenario,
increased electrification and grid integration throughout the Nordic region and
between the Nordic and Central European grids are assumed. Net electricity
generation is assumed to be 45% higher than in 2010 and electricity generation
capacity 50% higher than in 2010. Grid interconnections with Central Europe,
Russia and the Nordic countries are facilitated by assuming an additional 11
transmission projects to be built. This would double the number of transmission
lines currently available.
Figure 10 presents the Nordic electricity generation mix in 2050 in different IEA
scenarios. The Base scenario and composition of the energy system in this thesis is
based on the IEA's Carbon-Neutral Scenario, CNS.

46
Figure 10. The Nordic electricity generation mix in 2050. (IEA, 2013)
As can be seen from Figure 10, almost 80% of the electricity is generated with
renewables and about 20% with nuclear. These shares are indicative and different
scenarios and their electricity generation mixes are explained and analysed in chapters 5
and 6.
3.1 Balancing and stabilising the energy grid
The demand for electricity fluctuates throughout the day, week, and season and the
demand cannot be evaluated accurately in advance. Fluctuation stems from the natural
rhythm of the day; during typical office hours the electricity demand in households is
lower than in the evenings and vice versa in the workplace. Generally the electricity
demand is lowest during the night. Electricity demand is also greatly dependant on
outside weather because heating demand is naturally higher during cold periods and
respectively cooling demand is higher during warmer periods. Still, electricity demand
is unique from day to day and hard to estimate accurately.
Electricity generators need to react to these load changes. Traditionally, this is achieved
with load following plants and peaking power plants, which include hydroelectric, gas
turbine or steam turbine power plants. Load following power plants operate at higher
output levels during the day and evening when the electricity demand is greatest and
they curtail their output during the night. Peaking power plants operate during the times

47
of peak demand. These plants have fast start-up times and their duration of operation
varies greatly throughout the year.
In the future energy system, most of the electricity is generated with CO2-free sources
of generation i.e. with intermittent renewable electricity generation and nuclear energy.
The possibility to use natural gas, coal or fossil fuelled power plants to balance the
power grid is diminished. As an alternative to these, the future energy system uses
renewable generation suitable for regulating power (hydro), smart grids, load following
nuclear power plants and energy storages to balance the power grid and to meet the
challenges of constantly fluctuating electricity demand.
Economically it would be wisest to use hydropower plants as load following or peaking
power plants. Hydropower is an excellent source of electricity for balancing the
electrical grid as its start-up time is only a few minutes (ÅF Consult, 2012). In some
countries, however, there is no hydropower available and other renewable generation
sources are not suitable for load following as their power output fluctuates depending on
the current weather. Moreover, even hydropower is not immune to weather changes.
Norway, Denmark, Sweden, Finland, Estonia, Latvia and Lithuania form a common
NordPool Spot electric market. History has shown that in dry years the Nordic countries
have become more dependent on thermal and imported power even though Norway has
large hydropower reservoirs. These reservoirs are lower or depleted during dry periods
and electricity producers have to use more expensive sources of electricity.
In the case of Finland, most of its hydropower plants are run-of-river power plants.
These power plants have limited water basins and thus their manoeuvring and adjusting
capabilities are limited. The run-of-river plants are capable of high power grid control
only for a few hours at time. After long nonstop power adjusting these hydropower
plants need to wait for their water basins to fill up. With appropriate flow rates and
adequate production need forecasts, the run-of-river hydropower plants are capable of
continuous adjustment corresponding to the demand. In Finland, balancing of the
electricity grid is mainly done with hydropower, but there problems due to periods of

48
abundant and very small flows in the rivers due to the small size of the water basins. In
Finland, water right permits determine the minimum and maximum water levels
permitted in the hydropower plant's basin. Hydropower utilities voluntarily restrict the
variations in the water levels more strictly than the regulatory limits require, especially
in the summer holiday season. This limits the available hydropower available for grid
balancing. According to the IEA's Nordic Energy Technology Perspectives (2013),
around 60% of the Nordic hydropower capacity in 2050 can be considered dispatchable.
Nuclear power and energy storages at least offer alternative grid balancing methods.
(ÅF Consult, 2012)
3.2 Smart grid
According to the European Technology Platform's (ETP) SmartGrids document (2010)
a smart grid is an electricity network that intelligently integrates the actions of all users
connected to it, including generators and consumers, in order to efficiently deliver
sustainable, economic and secure electricity supplies. With the introduction of modern
information and communication technologies into the power system, the whole power
system becomes intelligent and this so-called smart grid would be able to manage
supply and demand efficiently (Knab et al., 2009). With smart grids, the flow of
electricity from utilities to consumers becomes a two-way conversation as opposed to
the one-way conversation that is in use today. A smart grid would incorporate
intelligent monitoring, control, communication and self-healing technologies.
According to the ETP (2010), the purpose of the smart grid is to:
better facilitate the connection and operation of generators of all sizes and
technologies,
allow consumers to play a part in optimizing the operation of the system,
provide consumers with greater information and choice of supply,
significantly reduce the environmental impact of the whole electricity supply
system
deliver enhanced levels of reliability and security of supply.
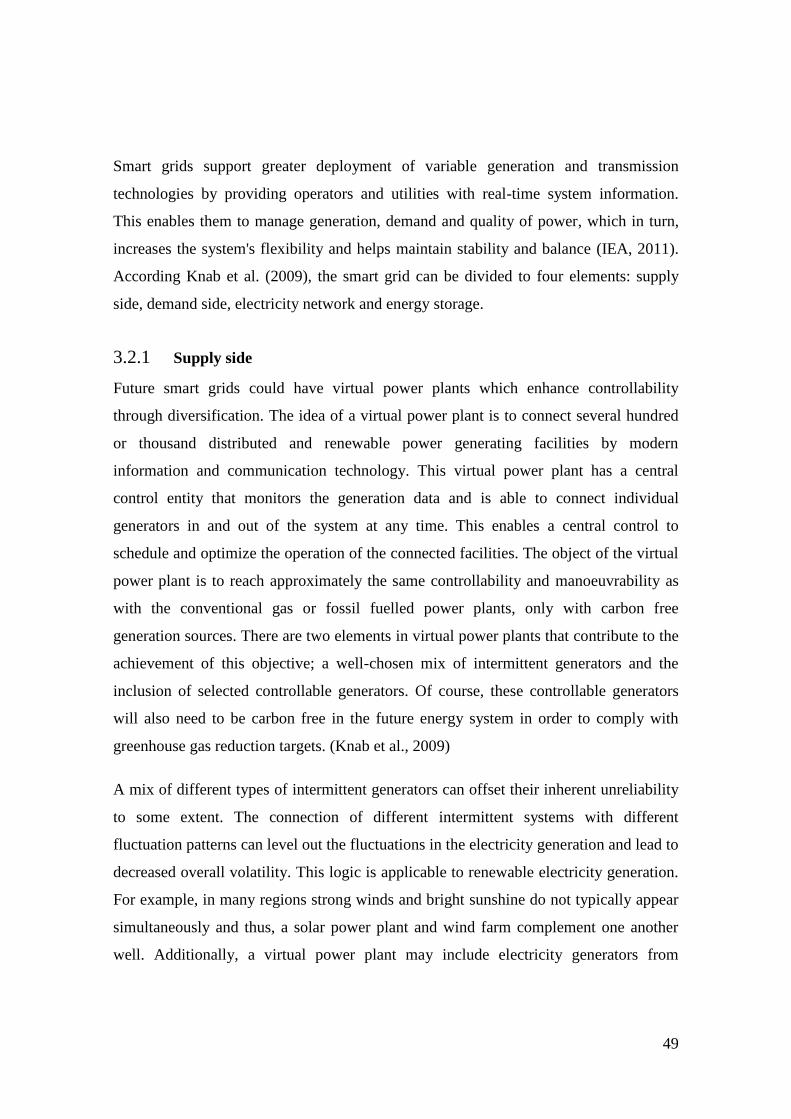
49
Smart grids support greater deployment of variable generation and transmission
technologies by providing operators and utilities with real-time system information.
This enables them to manage generation, demand and quality of power, which in turn,
increases the system's flexibility and helps maintain stability and balance (IEA, 2011).
According Knab et al. (2009), the smart grid can be divided to four elements: supply
side, demand side, electricity network and energy storage.
3.2.1 Supply side
Future smart grids could have virtual power plants which enhance controllability
through diversification. The idea of a virtual power plant is to connect several hundred
or thousand distributed and renewable power generating facilities by modern
information and communication technology. This virtual power plant has a central
control entity that monitors the generation data and is able to connect individual
generators in and out of the system at any time. This enables a central control to
schedule and optimize the operation of the connected facilities. The object of the virtual
power plant is to reach approximately the same controllability and manoeuvrability as
with the conventional gas or fossil fuelled power plants, only with carbon free
generation sources. There are two elements in virtual power plants that contribute to the
achievement of this objective; a well-chosen mix of intermittent generators and the
inclusion of selected controllable generators. Of course, these controllable generators
will also need to be carbon free in the future energy system in order to comply with
greenhouse gas reduction targets. (Knab et al., 2009)
A mix of different types of intermittent generators can offset their inherent unreliability
to some extent. The connection of different intermittent systems with different
fluctuation patterns can level out the fluctuations in the electricity generation and lead to
decreased overall volatility. This logic is applicable to renewable electricity generation.
For example, in many regions strong winds and bright sunshine do not typically appear
simultaneously and thus, a solar power plant and wind farm complement one another
well. Additionally, a virtual power plant may include electricity generators from

50
different regions with different weather conditions to help offset volatility. However,
there has to be some generation that can be fully controllable and flexible in case
weather conditions simply do not support electricity generation from solar or wind
power. (Knab et al., 2009)
The inclusion of selected controllable generators in the virtual power plant can
compensate the remaining unreliability. These fully controllable renewable power plants
could, for example, be pumped hydro facilities or biogas plants. Nuclear power plants
can also offer controllability and grid stabilising services while being a CO2 free
electricity source. The introduction of distributed CHP facilities may challenge the grid
operator. Most distributed CHP facilities in Central Europe are run in heat-led operation
mode meaning that the operator's need for heat defines the power output. Distributed
generation is operated to the benefit of its owner and this often disregards overall
system efficiency and reliability. All in all, changes in the distributed CHP plants'
operating mode may occur irregularly and spontaneously from the overall system's point
of view. When several distributed CHP facilities are integrated into one system, the
virtual power plant, the control entity of the system is able and legitimated to shut down
certain facilities in case of oversupply. In addition to distributed CHPs in the virtual
power plant, the integration of fully controllable renewable sources and manoeuvrable
nuclear power plants may compensate the remaining unreliability in the system. (Knab
et al., 2009)
In Finland, and the other Nordic countries, CHP plants do not bring same challenges to
the grid operators as described above. Finland has one of the world's most efficient and
extensive CHP industries and district heating networks. Extraction and condensing CHP
plants can be very flexible with their production of electricity and heat, especially when
coupled with heat storages (EURELECTRIC, 2014a). The demand for heat and
electricity generally go hand in hand in Finland. Many CHP plants in Finland provide
heat and electricity directly for industry, particularly for the forest industry, and their
fuel inputs (often forestry by-product) and energy demand are strongly correlated with
the economic situation. In 2011, the share of CHP in the industry total heat production

51
was 2011 and 75% of district heat produced was cogenerated. Overall, CHP production
in Finland has proven to work well. (CODE2, 2014)
Controllability has substantial value in the power market. The power facility can
contribute more to the system's stability the more controllable it is and provide
regulating energy source. (Knab et al., 2009)
3.2.2 Demand side
The idea behind demand side management (DSM) is to actively influence power
consumption and reach a certain degree of controllability on the demand side of the
energy system. DSM is based on the underlying assumption that consumers in principle
have some flexibility in how and when they use electricity. The consumer may be
willing to change his habits when given both incentives and the ability to manage power
consumption. The main objectives of the DSM are:
reduction of demand peaks when power consumption comes close to its limits of
availability,
load shifting from times of high consumption to times of low consumption and
load shifting from periods of low generation to periods of high generation from
volatile sources like wind and solar power. (IEA, 2008; Knab et al., 2009)
Demand Side Management can be differentiated into indirect and direct load control,
both of which help to achieve the main objectives listed above.
Indirect load control has incentives that are given to consumers in order to shift their
electricity demand according to the energy system's requirements. Consumers still keep
full control over their individual efficiency patterns. Consumers' behaviour can be
influenced the most efficiently by using price signals. This allows balancing supply and
demand with economic market forces. When there is oversupply in the system,
consumer prices would drop and thus giving the incentive to shift flexible loads.
Oversupply could be the result of heavy winds or bright sun shine increasing the

52
electricity production from renewable generation sources. Respectively, when electricity
is in great demand, consumer prices would be increased and consumers would shift
their flexible loads to periods of lower electricity prices. (Knab et al., 2009)
Load shifting, or indirect load control, using price signals could be automated to a
certain extent. Some devices could process price signals automatically and react to them
according to the owner's preferences. For example, a washing machine could be
preloaded and programmed to receive and process price signals and it would
autonomously decide when to start the wash cycle. Of course the wash cycle could not
be postponed indefinitely and some kind of deadline would have to be programmed,
but load shifting offers some leeway in regards to costs. Load shifting is already used
for example for controlling water storage heaters. In some countries night tariff
electricity is cheaper than during the day and water is heated during the night. There are
future visions where domestic appliances and home electronics could be capable of
communicating with each other, or even in the whole neighbourhood, and coordinate
consumption. There are of course some inflexible electrical loads such as general
heating for a household. During cold periods there really is no load shifting potential in
households using electricity for their heating. Living comfort would decrease
considerably if the heating, lighting or cooling need would be determined solely on
price of electricity. (Knab et al., 2009)
In direct control, the consumer transfers control over some devices to his utility or grid
operator. The consumer would sign up for a demand side management program to allow
the utility to switch off or limit power consumption for some devices like pool pumps,
water heaters or air conditioning. Direct load control is a more effective way for utilities
to influence demand and consumers might be willing to accept a loss of control over
some devices for compensation such as cheaper prices or bonuses. According to Knab et
al. (2009), industrial refrigerated warehouses could be a strong candidate for direct load
control. These warehouses have several well-suited characteristics: they are energy-
intensive facilities, the number of processes performed in these facilities is limited and
well understood and most refrigerated warehouses are not sensitive to short-term (2 to 4

53
hours) decreases in power and thus direct control management would not be disruptive
to facility operations. Refrigerated warehouses could have a load reduction potential of
up to 30% by introducing direct control management, meaning that the warehouses
could be allowed to warm up when electricity is expensive and when the electricity
price is cheaper they are cooled again. (IEA, 2008; Knab et al., 2009)
3.2.3 Electricity network
Controlling the power flow and linking supply and demand effectively are key factors in
the smart grid. In the alternating current (AC) grid, the power flows along the
transmission lines from generation surplus areas to load surplus areas. There are
generally multiple paths between areas, especially in meshed grids. Electricity usually
flows through the lines which have the least reactance to resist the flow. Reactance is a
function of the length of a line and thus reactance values typically differ for different
lines. The way electricity power is distributed over the network depends on the pattern
of generation and load, and the reactance values on the paths between these. For
example, power flowing from off-shore wind farms in the northern Germany to load
excess areas in the south may not take a direct path, but in part could also flow to the
west and east and through neighbouring countries before arriving in the south. This kind
of parallel flow is undesirable as the electricity traverses over the country's borders and
this may introduce unnecessary political or infrastructural risk to energy security.
Parallel flow can be reduced by operating network control devices, such as phase-
shifting transformers and flexible AC transmission system devices. Some of these
devices modify the composite reactance of a path and since the reactance of the path can
be changed, it is possible to change the power flow patterns. Linking geographically
separated supply and demand effectively is essential in future smart grids and network
control devices can become important elements of the smart grid. (Knab et al., 2009)
3.3 Energy storages
Energy storage is capable of absorbing energy and storing it for a period of time before
releasing it to supply energy or power services. Energy storage technologies can bridge

54
temporal gaps between energy supply and demand. Energy storage can be implemented
on large and small scales in distributed or centralised manners. Energy storage can store
electricity or thermal energy and serve as generator or consumer of energy.
Energy storage technologies include a large set of centralised and distributed designs
and energy storage is a technology that can support the decarbonisation of the energy
system (IEA, 2014b). Large-scale energy storage is generally regarded as an option for
providing additional flexibility for balancing the power grid and for facilitating the
integration of intermittent renewables. As stated before, the supply and demand in the
power supply needs to match at every given moment. Energy storage eases this
constraint. In periods of oversupply, storage devices artificially create additional
demand and during periods of high demand, they act as energy suppliers. However, the
cost of energy storage should be included in the intermittent generation cost estimates,
especially if the energy system does not have any other elements to offset the
fluctuating nature of wind or solar power and energy storage is required in order for the
system to work. According to F. & M. Genoese (2013), the role of energy storage in the
future energy system is debated as the economic viability of large-scale energy storage
technologies is uncertain due to their high capital cost and decreasing price spread
between peak and off-peak hours in recent years. However, the situation could be
reversed in the future when more intermittent renewables enter into the system.
According to the International Energy Agency (2014b), large-scale thermal storage
technologies are competitive for answering heating and cooling demand in many
regions. The IEA deems also some smaller-scale electric battery systems as cost
competitive or nearly competitive in remote communities and off-grid applications.
Table 5 presents the conversion efficiencies of some different types of energy storage
which vary depending on source. The storage technologies in Table 5 have different
uses in regards to their discharge times (Figure 11) and they are at different stages of
development and deployment (Figure 12). (IEA, 2014b)

55
Table 5. Conversion efficiencies of some forms of energy storages. (Ibrahim et al., 2007; IEA,
2014b)
Technology Conversion efficiency
(Ibrahim et al., 2007)
Conversion efficiency
(IEA, 2014b)
Pumped-Storage Hydropower
(PSH)
65-80 % 50-85 %
Compressed Air Energy Storage, underground
(CAES)
70 % 27-70 %
Small-Scale Compressed Air Energy
Storage
(SSCAES)5
50 % -
Flow Battery Energy Storage
(FBES)
75 % -
Flywheel Energy Storage
(FES)
85% instantaneously
78% after 5h
45% after 24h
(friction losses)
90-95 %
Superconducting Magnetic Energy
Storage
(SMES)
95% instantaneous
efficiency 90-95 %
Supercapacitors 95% 90-95 %
Electrochemical batteries
(Li-Ion, NaS, lead-acid)
- 75-95%
5 SSCAES conversion efficiency when the system uses an electric compressor which can be turned into a
generator during retrieval. The SSCAES system here has pressure of up to 300 bars compared to CAES
which has a pressure of up to 100 bars. (Ibrahim et al., 2007)

56
Energy storage can be differentiated on the basis of storing and discharging times and
the capacity of the storage. Figure 11 presents the discharge time at rated power for
different forms of storage. Also the storage applications are shown.
Figure 11. Discharge times of different forms of storage. (Sandia, 2013)
Electricity and thermal storage exists at many levels of development; from the early
R&D stages to mature, deployed technologies. Figure 12 visualises this in respect to
their associated initial capital investment requirements and technology risk versus their
current phase of development (IEA, 2014b).

57
Figure 12. Maturity of energy storage technologies and their related capital requirements and
technology risks. (IEA, 2014b)
IEA (2014b) estimates that 310 GW of additional grid-connected electric storage
capacity would be needed in the United States, Europe, China and India, in order to
support the electricity sector's decarbonisation. In addition to grid-connected electric
storage, thermal and off-grid electric storage offers significant potential.
Energy storage in general helps to facilitate the effective utilization of intermittent
renewable energy sources, and can enhance grid reliability, increase end-use sector
electrification (e.g. transport sector) and reduce the need for increased peak generation
capacity. However, storages require additional infrastructure and space, some of the
energy is lost in round trip inefficiencies and some energy storage technologies are still
cost prohibitive, such as thermochemical energy storage and electrochemical capacitors.
The United States Department of Energy has identified four key barriers that should be
explored to promote the widespread deployment of energy storage:

58
Cost competitive energy storage systems. The total cost of storage systems (all
the subsystem components, installation, etc.) need to be cost competitive with
other options available to utilities.
Validated performance and safety. For example, significant uncertainties exist
over the usable life of batteries and the length of time that a form of storage can
generate revenue.
Equitable regulatory environment. Consistent pricing or market plan for grid
storage does not exist.
Industry acceptance. System operators have limited experience in using storage
resources. (DOE, 2013)
3.3.1 Electricity storages
High-power electric storage technologies, such as electrochemical batteries, capacitors,
flywheels, superconducting magnetic energy storages (SMES) etc., aim at supplying the
electricity system with large amounts of power on short notice. These forms of storage
are applicable for fast-response voltage and power quality management, but only for a
short time, up to a few seconds or minutes. Fast response times make these types of
electric storage ideal for regulating network stability i.e. load levelling and for this
purpose their short uptime is not a problem. Electric storage is suitable for intra-hour
regulating of the electric network and can be used to introduce more load or energy to
the network. In some cases these types of electric storage can respond more quickly or
cheaply to the changes in network power balance than more traditional regulating power
plants, for example when gas or steam turbines are shutdown and they need to be cold
started. Moreover, larger storage projects with these technologies are under
consideration. SMES with a capacity of 5 000 to 10 000 MWh would require very large
coils, several 100 meters in diameter, in order to generate the required electromagnetic
forces. This would of course mean that they would have to be installed underground to
limit infrastructure costs.

59
High-power storage devices are used to react to abrupt demand peaks or power drops to
ensure the stability of the grid and uninterrupted power supply. High-power storage can
be used to maintain the voltage level during the start of the emergency generators
(bridging power). For example, the start-up time of an open cycle gas turbine is between
10 to 20 minutes meaning that CAES or pumped-storage hydropower could be used
during this time as these both have long enough discharge times (up to some hours) and
power ratings (100 MWe to 1 GWe). (IEA, 2008; Ibrahim et al., 2007)
Electric storage technologies can be divided roughly into two size categories. Pumped-
storage hydropower (PSH) and CAES can have sizes over 100 MWe, while fuel cells,
electrochemical batteries and flow batteries are in the range of few kW to 10 MW.
Discharge rates of PSH, CAES and flow batteries are measured in hours while other
forms of electric storage have significantly shorter discharge rates at their rated power.
Generally, storing and discharging electricity over longer time periods sacrifices
efficiency and response times. High-energy storage is used in daily cycles for economic
gain and it shifts some electricity production. PSH plants can also be used for short term
storage and balancing if the rated power is large enough in relation to the energy storage
capacity. (IEA, 2008; Gimeno-Gutiérrez & Lacal-Arántegui, 2013)
Li-Ion batteries are perharps the most interesting electrochemical battery technology as
it has higher energy density than many other electrochemical batteries, short response
times in the order of 20 milliseconds and their round trip efficiency is high (85-95%).
Li-Ion batteries have become a popular choice for electric vehicle and aerospace
applications and interest in demonstrating the battery's potential to perform utility
functions has increased. Li-Ion batteries can provide, for example, peak shaving,
photovoltaic smoothing and time shifting services for the grid in respect to renewables.
Li-Ion batteries have disadvantages as well. The expected lifetime of a battery is related
to the cycling depth of discharge, meaning that Li-Ion batteries should not be used in
applications if full discharge is required. Over discharging or overcharging can result in
thermally unstable metal oxide electrodes and the battery is subject to thermal runaway
if left unchecked. Li-Ion batteries have high production costs and they are sensitive to

60
over temperature, overcharging and internal pressure build-up. (DOE, 2013; Carnegie et
al., 2013)
When the capital costs of the energy storages is taken into account, pumped hydropower
and compressed air energy storage are the cheapest methods per charge/discharge cycle.
The problem for these storage technologies is that they need to be installed at specific
sites. The biggest storage batteries are built from the best-known technologies, i.e. Li-
Ion, lead-acid and Ni-Cd. However, batteries generally have limited depth of discharge.
Flywheels are deemed to be suitable for power quality systems or for short maintenance
of power because they have limited energy storage time due to their high frictional
losses. Flow battery is a rechargeable electrochemical battery which has two chemical
components dissolved in liquids. Liquids are stored in tanks and these tanks are
separated from one another by a membrane. Flow batteries have a slow discharge rate,
can be used in energy management and have lower replacement costs, since only the
tanks have to be refilled. Other batteries need to have the whole system replaced. Flow
batteries have lower energy density than electrochemical batteries and their design is
complicated and not mature for commercial scale development. (DOE, 2013; IEA,
2008)
3.3.2 Thermal energy storages
Thermal energy storage uses stored energy for heating or cooling purposes. These forms
of thermal storage can be grouped by storage temperature: low, medium and high.
Thermal storage technologies are suited for both the supply and demand side portion of
the energy system. According to the International Energy Agency (2014b), heating and
cooling requirements represent 45% of the total energy use in buildings and demand
side energy storage can represent significant value to the energy system. Some thermal
energy storage technologies have already been deployed to a significant extent in
electricity and heat networks, such as in UTES systems (Underground Thermal Energy
Storage) and ice storage systems for residential cooling. Research and development of
thermal energy storage is primarily focused on cost efficiency for high-density storage,

61
including thermochemical processes and phase-change material development. Thermal
storage facilities reduce the operation of peak load boilers and help to avoid costly
restarting processes. (IEA, 2014b)
In Finland, there are a number of short-term thermal storage solutions in use and their
energy efficiency in short-term operation is over 90%. For example, in Oulu there is a
rock cave, which has been modified for thermal energy storage for the district heating
system. Previously this cave was a stockpile for liquid fuel. Thermal energy storage is
especially relevant in the case of Combined Heat and Power (CHP). Many of these CHP
plants prioritise heat demand in their production and the production of electricity
depends on the production of heat. Heat storage brings flexibility to the CHP systems.
(ÅF, 2012)
3.4 Combined Heat and Power as part of the energy system
Combined Heat and Power (CHP) or cogeneration, is an energy generation process that
transforms primary energy into both thermal and electrical energy. Thermal energy is
used in heat applications such as district heating or as process heat for industry and the
generated electricity is used locally or fed into the grid. District heating systems
commonly distribute heat as pressurised water while the industrial process heat is
usually distributed and used as low-pressure steam. Figure 13 presents a traditional
condensing power plant and a condensing power plant with two different CHP
technologies: back pressure and extraction. (EURELECTRIC, 2014a)
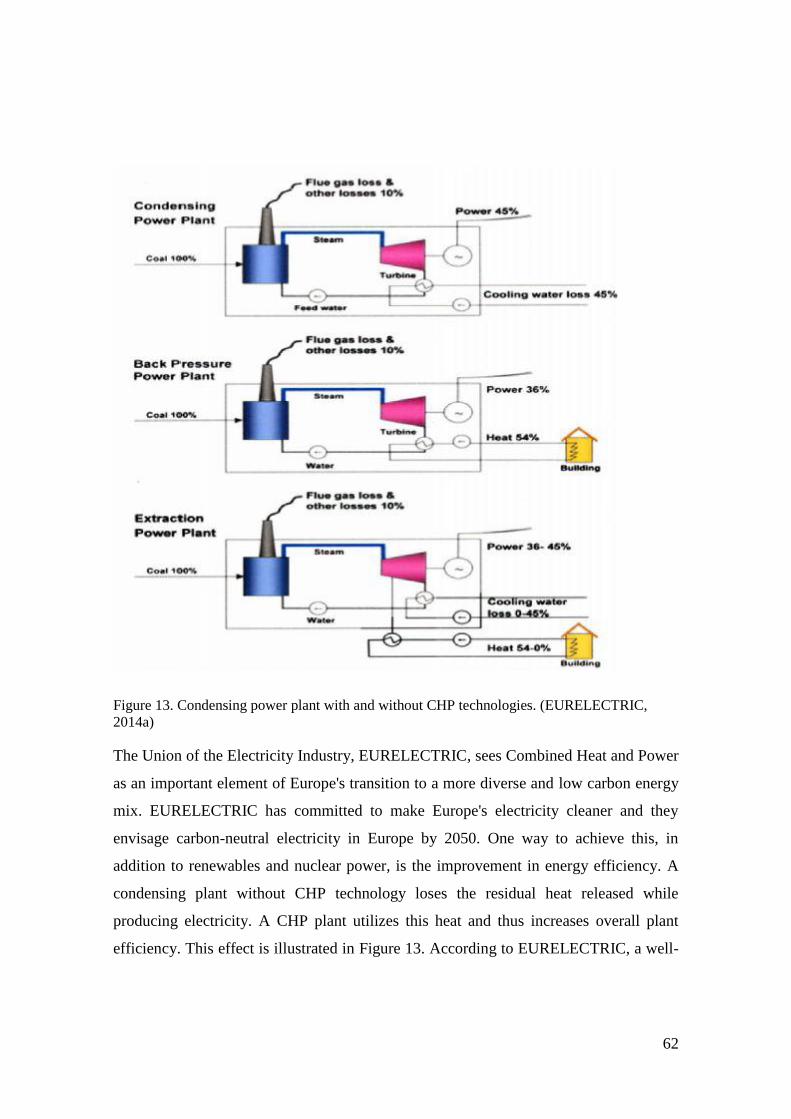
62
Figure 13. Condensing power plant with and without CHP technologies. (EURELECTRIC,
2014a)
The Union of the Electricity Industry, EURELECTRIC, sees Combined Heat and Power
as an important element of Europe's transition to a more diverse and low carbon energy
mix. EURELECTRIC has committed to make Europe's electricity cleaner and they
envisage carbon-neutral electricity in Europe by 2050. One way to achieve this, in
addition to renewables and nuclear power, is the improvement in energy efficiency. A
condensing plant without CHP technology loses the residual heat released while
producing electricity. A CHP plant utilizes this heat and thus increases overall plant
efficiency. This effect is illustrated in Figure 13. According to EURELECTRIC, a well-

63
designed CHP plant can achieve up to 90% efficiency in suitable applications, which is
a major improvement in efficiency when compared to the separate production of
electricity and heat. High efficiency saves primary energy and contributes to low carbon
dioxide emissions. (EURELECTRIC, 2014a)
CHP plants usually operate as base-load plants and electrical power generation depends
largely on the demand for heat or steam. Back pressure CHP plants have a fixed ratio
between heat and electricity production, meaning that if the heat or electricity output has
to be adjusted, the other's production is also changed. An extraction CHP plant is more
flexible as the ratio between heat and electricity can vary significantly. Many CHP
plants are able to generate electricity regardless of heat demand by using additional
cooling. The largest district heating systems have amounts of large water storage which
act as heat storage or batteries. When combined with thermal energy storage, CHP
provides flexibility to the power system. (ÅF, 2012; EURELECTRIC, 2014a)
Thermal energy storage can increase the operational flexibility of CHP plants by
enabling the decoupling of the heat demand and the requirements of the electricity.
Together with electric storage in CHP facilities, thermal storage could enable higher
levels of participation in balancing power markets. In the context of district heating, the
thermal storage stores heat in the form of hot water in tanks. These tanks are either
atmospheric storage systems or pressurised systems and they have heat storage
capacities of 10 MWh up to 2 GWh per load cycle. Atmospheric storage facilities have
comparatively lower investment costs than pressurised ones, but pressurised storage
technologies show a 30% to 40% higher specific storage capacity per volume, meaning
that they store more heat in the same volume than atmospheric systems. (IEA, 2014b)
In Finland, CHP district heating contributed 21% of electricity generation in 2011 and
about half of the heat required in housing for the entire country. CHP in industry
contributed 15% of Finland's electricity generation in 2011. With CHP generation, it is
possible to use variety of fuels. The main fuels used in CHP generation in Finland are
coal, peat and gas. In the future CO2-free energy system, CHP will use renewable

64
energy sources or possibly nuclear cogeneration. Biomass CHP for district heating is an
excellent option for increasing the share of renewable heating in cities. (ÅF, 2012;
EURELECTRIC, 2014a)
3.4.1 Nuclear cogeneration
Carlsson et al. (2011) evaluate the economic viability of small nuclear reactors in future
European cogeneration markets. CHP reactors can support the European Union's low
carbon society goals. The European heat market is very large and so is the potential for
nuclear cogeneration. In 2010, approximately 30% of the heat demand for industrial
applications was provided by cogeneration and the remainder by boilers and burners.
Small nuclear reactors supporting cogeneration may be suited to support existing
process heat markets as the smaller sizes of the reactors align well with the capacity
requirements of process industries.
There has been interest in small and medium sized reactors as these reactors have
simpler designs and more affordable economics. In the future energy system with more
small scale and intermittent renewable generation, small and medium reactors have the
potential to become important aspects of the energy system. These reactors may be
better suited for flexible generation or even cogeneration needed to balance renewable
power generation. The market potential for small and medium sized reactors is
promising but varies between EU member states. (Carlsson et al., 2011)
Industrial applications require a wide range of thermal energy; from low (<100 °C) and
moderate temperatures (100-400 °C) to very high temperatures (>1000 °C). Relatively
small sized reactors (<300 MWth) have the capability of supporting processes in 200-
550 °C temperature range. Some examples of applicable industrial processes or
industries suitable for nuclear cogeneration are:
The chemical industry produces a wide array of end products and thus, requires
a wide range of temperatures. Chemical companies in big clusters typically use
fossil fuelled CHP for part of their heat supply. For example, ethylene

65
production is a very energy intensive process that appears suitable for nuclear
cogeneration.
Refineries are a major consumer of heat and steam. Most of the processes
require process heat with temperatures below 550 °C (hydrogen production by
steam methane reforming excluded). At the time of writing, refineries primarily
use oil and gas for heat and electricity production. Heat not provided through
recycling comes from fossil cogeneration plants, but carbon-free nuclear
cogeneration is a feasible alternative.
Biomass drying and torrefaction6 uses process heat in the temperature range of
200-300 °C. Processed biomass can either be used as fuel (co-fired with coal) or
to produce synthetic transportation fuel. The temperature range is well suited for
nuclear cogeneration. (Carlsson et al., 2011)
Nuclear cogeneration, similar to traditional nuclear generation, requires large upfront
capital investment. This makes it suitable for industries and processes with continuous
and high (in volume) heat demand. In addition to the processes listed above, district
heating with nuclear cogeneration could be attractive in the future. Nowadays, the
majority of nuclear power plants focus on generating electricity in base-load operating
mode and the residual heat is wasted. According to Carlsson et al. (2011), cogenerating
nuclear reactors may be competitive against coal- and gas-fuelled CHP plants,
particularly if carbon constraints and fuel uncertainties continue driving up costs in
these markets in the future. Small reactors have no carbon emissions from operations
and fuel cost increases have low impact. Carlsson et al. omitted CHP plants using
renewables (e.g. biomass) from their study and compared nuclear cogeneration only
against fossil-fuelled CHP plants. (Carlsson et al., 2011)
6 Torrefaction is a thermal process used to produce high-grade solid biofuels. Solid biomass is heated to a
temperature of approx. 250-350 °C. Heating is done in the absence of oxygen (or drastically lower levels
of oxygen) and the torrefaction process leads to a loss of moisture and partial loss of the volatile matter in
the biomass. The biomass material becomes brittle and easy to grind. (IEA, 2012b)

66
There is some experience of operating nuclear district heating and extracting process
steam. In Switzerland, residential buildings and industries near nuclear power plants of
Mühleberg, Beznau 1 & 2, Leibstadt and Gösgen utilise the heat produced in these
plants (Schmidiger, 2013). The Beznau power plant makes 80 MW of heat available to
industries and homes with over a 130 km long network serving 11 towns. The potential
energy reaches up to 2.5 PJ/yr. In Russia, several reactors supply district heating (a total
of over 11 PJ/yr). Commercial nuclear reactors in the Leningrad II site will provide 9.17
PJ/yr. of district heating once their operation begins (due in 2018). (WNA, 2015)
Studies and previous experiences show that nuclear cogeneration is a feasible option for
district heating and generating process heat for industries. Utilization of nuclear
cogeneration depends on whether other cogenerating plants using fossil fuel are
abandoned. Industries and households will need heat in the future also. Nuclear and
renewable CHP generation could replace fossil fuelled CHP.

67
4 ENERGY SYSTEM MODEL
4.1 Model overview
The future energy system in the Nordic countries in 2050 is studied and analysed by
constructing a basic model representing the energy system in the Nordic countries. The
model is based on Olli Paukkeri's model which studied the German energy system in the
future with 50%, 80% and 100% shares of renewables and the role of energy storage in
each case (Paukkeri, 2013). The energy system in this thesis is different and also
contains nuclear power so some modifications had to be made.
The model uses real 2013 Nordic load data from Nord Pool Spot. Every hour of the year
has a load value, i.e. how much electricity was consumed in any given hour in the
Nordic countries in 2013 and the model has 8 760 rows, one for every hour of the year.
According to the data from Nord Pool Spot, the load in Nordic countries in 2013 was
about 380 TWh while the IEA estimates that the Nordic countries will have a combined
load of between 430 and 450 TWh in 2050, depending on scenario (Nord Pool Spot,
2013; IEA, 2013). The 2013 load data is scaled up by a factor of 1.13 to achieve the
anticipated load in 2050 presented in NETP. The load demand is then satisfied with
different types of electricity generation in a particular order. This order depends on
short-run marginal costs for different types of generation in today's market but it also
depends on the adjustability of the electricity generation sources. The scenarios
analysed with the model and different types of generation used are explained in the
following chapters. The model logic is illustrated in Figure 14.

68
Figure 14. Illustration of model logic.
The Nordic grid connections between Denmark, Finland, Norway and Sweden are
considered to be more than adequate in 2050, meaning that Nordic countries and their
electricity grid is considered as a single unit. International grid connections, possible
heat storage and the geographic distribution of wind generation are not directly analysed
in the model. In all future scenarios, both the IEA's and the ones analysed in the model,
growth in electricity generation outpaces electricity demand in the Nordic countries,
implying a rise in the net exports from the Nordic region.
4.2 Generation mix in the future energy system
The generation mix used in the model is based on the IEA's scenarios found in their
publication Nordic Energy Technology Perspectives, NETP. Figure 10 shows different
IEA scenarios found in this publication and the Base scenario in the model is based on
the CNS scenario. As mentioned before, the future energy system in this thesis contains
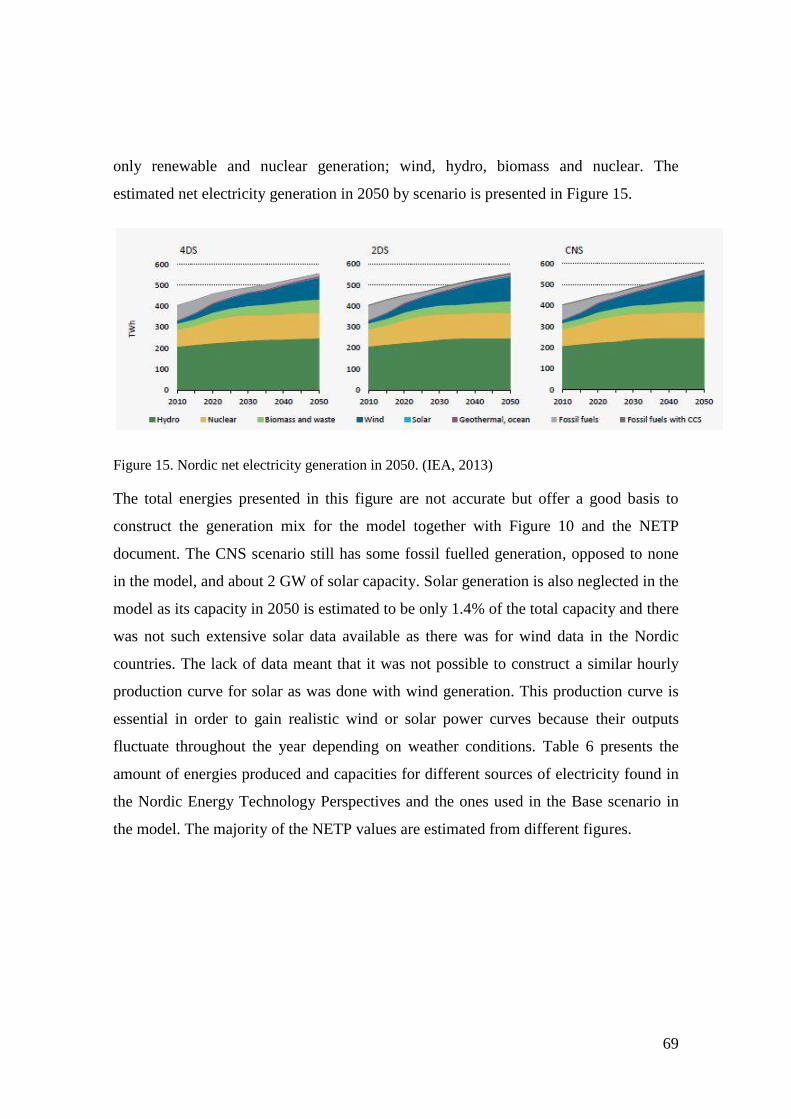
69
only renewable and nuclear generation; wind, hydro, biomass and nuclear. The
estimated net electricity generation in 2050 by scenario is presented in Figure 15.
Figure 15. Nordic net electricity generation in 2050. (IEA, 2013)
The total energies presented in this figure are not accurate but offer a good basis to
construct the generation mix for the model together with Figure 10 and the NETP
document. The CNS scenario still has some fossil fuelled generation, opposed to none
in the model, and about 2 GW of solar capacity. Solar generation is also neglected in the
model as its capacity in 2050 is estimated to be only 1.4% of the total capacity and there
was not such extensive solar data available as there was for wind data in the Nordic
countries. The lack of data meant that it was not possible to construct a similar hourly
production curve for solar as was done with wind generation. This production curve is
essential in order to gain realistic wind or solar power curves because their outputs
fluctuate throughout the year depending on weather conditions. Table 6 presents the
amount of energies produced and capacities for different sources of electricity found in
the Nordic Energy Technology Perspectives and the ones used in the Base scenario in
the model. The majority of the NETP values are estimated from different figures.

70
Table 6. Capacities and corresponding energies and shares for different electricity generation
sources. (IEA, 2013)
Base scenario in the model Nordic Energy Technology
Perspectives
Electricity source
Share of
total
energy
Net
electricity
generation
[TWh]
Capacity
[GW]
Share of
total
energy
Net
electricity
generation
[TWh]
Capacity
[GW]
Wind 26 % 131 40 23 % 130 40
Hydro 38 % 193 65 41 % 230 60
Nuclear 24 % 122 16 23 % 120 16
Biomass 12 % 60 12 11 % 50 12
Other 0 % 0 0 2 % 20 14
Total 100 % 506 133 100 % 550 142
The base model was constructed by choosing capacities and peak load hours for
different electricity generation sources. Net electricity generation is the product of peak
load hour and capacity. Capacities are based on the Nordic Energy Technology
Perspectives and the peak load hours are either estimated or based on the literature.
Details of the each generation source are explained later in the thesis. The goal was to
obtain shares of different electricity generation sources close to those presented in the
NETP. The shares and electricity generation estimates are not exactly similar to those of
the NETP due to real-life limitations such as including realistic values for peak load
hours and the estimated share of dispatchable hydropower generation. As mentioned
before, the NETP also still has some fossil generation present in its scenarios and no
fossil fuelled generation is present in the 2050 scenarios in the model. Overall, the
generation mix in the Base scenario is fairly close to the generation mix presented in the
NETP even though overall electricity generation is lower.

71
4.3 Wind power
Hourly output data in 2013 for the Nordic wind power was extracted from various
sources. Danish wind production data was obtained from the website of the state owned
public enterprise Energinet.dk (Energinet, 2014). Installed wind power capacities at the
beginning and the end of 2013 were obtained from Danish Energy Agency (DEA,
2014). Swedish hourly wind data was obtained from the Svenska Kraftnät's website.
Svenska Kraftnät is a state-owned public utility and one of its main tasks is managing
the national grid of Sweden (Svenska, 2014). Installed wind power capacities in
Sweden were obtained from the website of Swedish Wind Energy, which is a trade
association for companies working with wind power (SWE, 2014). Norwegian hourly
wind data was obtained from the website of Norwegian Water Resources and Energy
Directorate (NVE, 2014). Installed wind power capacities were obtained from the IEA
Wind website (IEA Wind, 2014). No hourly data for wind power production in Finland
was found. The Finnish wind power profile for the year 2013 was constructed by
downloading monthly production data from the ENTSO-E website and dividing the
monthly production by number of hours in the given month (ENTSO-E, 2014). This
method gives a rough wind production profile for Finland over the year 2013 as the
profile is unrealistic and linear between the months. However, Finland's share of the
total Nordic wind production in 2013 was only about 3%, so the method described does
not produce too much error in the overall Nordic wind profile. Installed capacities were
obtained from the VTT Technical Research Centre of Finland wind energy statistics
website (VTT, 2014).
Installed capacities at the beginning and end of 2013 were linearly interpolated in order
to calculate the installed capacity for every hour of the year. Peak load hours were
calculated by dividing the hourly generation by the hourly installed capacity. The peak
load hours for Sweden, Denmark and Norway were close to each other as their values
were between 2 446 and 2 472 hours. Finnish wind power had 2 160 peak load hours in
2013. The Nordic wind profile in 2013 was finally obtained by summing the hourly
installed capacities and hourly production data of all the Nordic countries over the year

72
2013. The Nordic wind profile had 2 448 peak load hours and a nominal capacity of
10.45 GW.
These values are for 2013 and the peak load hours need to be modified for the year 2050
in order to take into account better windmills and turbines, larger wind farms and the
possibly larger share of offshore wind power. The combined Nordic wind profile has 2
448 peak load hours but this profile also contains the data from older wind farms. In this
thesis, it is assumed that in 2050, all the onshore wind power in the Nordic countries
will have been refurbished or newly built and they will have 2 600 peak load hours.
This estimation is supported by analysing the Swedish wind data, which shows that the
newer wind farms with capacities over 2 MW had an average of 2 614 peak load hours
in 2012 (Vindstat, 2014). The source did not have data for the full year for 2013.7 The
European wind resources map shows that all the Nordic countries have sites with good
onshore wind conditions (AWS Truepower, 2012).
Offshore wind power usually has much better peak load hours than onshore wind
power. Offshore wind conditions are fairly similar in Nordic countries. Each country
has access to potential offshore wind farm sites with similar wind speed conditions as
can be seen from the European wind resources map (AWS Truepower, 2012).
According to Danish Energy Agency (2014), good wind conditions at the chosen sites
allow offshore wind farms to produce for around 4 000 full-load hours a year. Germany
also has similar offshore wind conditions as the Nordic countries have. Alpha Ventus, a
German offshore wind farm with a 60 MW capacity, had 4 450 peak load hours in its
first full year of operation in 2011 (Alpha Ventus, 2012). In this thesis, it is estimated
that Nordic offshore wind farms will have 4 500 peak load hours in 2050. This
estimation is realistic considering the data from the Alpha Ventus wind farm and the
better windmills and turbines of the future. Larger rotors increase the sweep area which
7 This wind data shows the monthly production of Swedish wind turbines in the period of January 2002 to
April of 2013 and the rated power of these turbines. Peak load hours in 2012 for the turbines with the
power of 2MW or greater were calculated. Turbines with missing production data in 2012 were omitted.

73
in turn boosts the energy yields. Taller towers and increasing the size of the blades
allow a turbine to capture more wind, especially at low wind speeds. Advancements in
gearboxes, wind predictions (direction, speed, duration) and programming have the
potential to improve the reliability of windmills and turbines and prevent them from
breaking at higher wind speeds. (EWEA, 2015; EERE, 2015)
At the end of July 2014, about 26% of the Danish wind turbines were offshore turbines
(DEA, 2014). In 2020, an additional 1 500 MW of offshore wind capacity will be
connected to the grid in Denmark. This would bring the share of offshore wind power to
44% if no new onshore wind power is installed. However, this is unlikely. In the Base
scenario of this thesis, the share of offshore wind power in the Nordic countries in 2050
is estimated to be 35%. This value is generally used in the scenarios set to happen in
2050 except for the Similar scenario which uses a lower value of 22%. This lower value
is used in order to have a same share of wind power generation from the total generation
in 2050 as it was in 2013. For the 2013 scenario, the share of offshore wind power was
not needed because the data from 2013 provided real value for peak load hours (2 448
peak load hours). Offshore wind power is more expensive to build and maintain but it
also has better power generating values due to better wind conditions than onshore wind
power.
The peak load hours for the Nordic wind power production in 2050 were calculated by
combining estimated peak load hours and shares of onshore and offshore wind power.
With the exception being the Similar scenario, Nordic wind power has 3 265 peak load
hours in the scenarios set to happen in 2050. This is 817 hours more than in 2013 and
0.0933 peak load hours were added per hour to the Nordic wind profile. The Similar
scenario has 3 018 peak load hours.
4.4 Hydroelectric power
Nordic electricity generation is dominated by hydropower as can be seen from Figure 9
and Figure 20. In 2013, there was about 50.2 GW of hydroelectric power capacity in the
Nordic countries, the majority of which was in Norway. This capacity generated 203

74
TWh of energy in 2013, equivalent to 53% of the overall power generation. In the
model, a portion of the total hydroelectric power capacity is dispatchable and the
remaining portion non-dispatchable. Some of the Nordic hydropower plants are run-of-
river plants with limited water basins and these types of hydropower plants have limited
manoeuvring and adjusting capabilities. According to the NETP, around 35 GW of the
60 GW of hydropower capacity in the Nordic countries in 2050 could be considered
dispatchable (IEA, 2013). In the Base scenario, 50% of the hydropower capacity in
2050 is considered dispatchable.
Dispatchable hydropower is the flexible element in the model and it responds to the
possible electricity deficits with no other limitations than the maximum capacity it has.
The peak load hours of dispatchable hydropower are calculated in the model. The non-
dispatchable portion of the hydroelectric power produces electricity evenly over the
year and its peak load hours are set to 5 500 in the Base scenario. According to the
IEA's Hydropower Technology Roadmap (2012), the average capacity factor of a
hydropower plant is 50%, equivalent of 4 380 full load hours per year. However, load
factors of individual hydropower plants range from 23% to 95%. In this thesis, it is
estimated that Nordic hydropower in 2050 has 5 500 peak load hours which equals a
higher than average load factor of 63%.
4.5 Nuclear generation
At the time of writing, only Finland and Sweden of the Nordic countries have nuclear
generation; 2.7 GW and 9.5 GW respectively (WNA, 2015). It is unlikely that Norway
or Denmark will build nuclear power generation in the future. The IEA estimates in the
Nordic Energy Technology Perspectives (2013) that the capacity for nuclear generation
in Sweden will remain the same in 2050 as it is at the time of writing but they anticipate
that Finland's nuclear generating capacity will rise from the current level to 6.4 GW.
These same assumptions are used in this thesis and in the Base scenario, meaning that in
2050 Nordic nuclear generating capacity is estimated to be 15.9 GW. Operating licenses
for existing nuclear power plants in Finland and Sweden end before 2050. This
75
naturally means that in order to preserve the same level of nuclear generation capacity
in Sweden as it is today, new nuclear power plants will need to be build. The same is
true for Finland where one new nuclear power plant, Olkiluoto 3, is already under
construction.
Peak load hours in 2013 were 7 050 and they were calculated from the Nordic Market
Report (2014). Finland's nuclear power plants had much better peak load hours in 2013,
at over 8 000, but as the Oskarshamn 2 unit in Sweden has been offline due to
modernization and refurbishment, this lowers the overall peak load hours of Nordic
nuclear power generation. In the model, peak load hours for Nordic nuclear power
generation are set to 7 700. Peak load hours of 8 000 or more would not be too
unrealistic. In the Base scenario, nuclear power produces energy evenly throughout the
year and nuclear power generation is split evenly over the hours of the year.
4.6 Combined Heat and Power
In the model, all the CHP generation is estimated to be biomass fuelled in 2050. Fossil
fuelled CHP is non-existent in 2050, but is present in the 2013 scenario and it is
modelled together with biomass CHP. Combined Heat and Power are assumed to follow
the heat demand in the Nordic countries and CHP is not flexible in the model. CHP
plants feeding different industries are assumed to run evenly throughout the year while
district heating is used mainly only in the winter months. Therefore, it is assumed that
CHP produces double the amount of energy in winter compared to summer. This
essentially means that some of the CHP plants are shutdown during the summer.
According to the Nordic Market Report (2014), the Nordic countries had 15.2 GW of
CHP capacity (5,2 GW industrial) in 2013.
4.7 Flexible fossil generation
According to the IEA's NETP (2013), there would be 8 GW of operational gas capacity
in 2050, but it would be used only at a low load and full hours to provide additional
flexibility. In this thesis it is envisaged that in 2050 there will be no fossil generation in

76
the Nordic countries. Flexibility in the Base model is provided by dispatchable
hydroelectric power. In 2013 there was 12.1 GW of non-CHP thermal power generation
(NMR, 2014). This value is used in the 2013 scenario as the flexible fossil generation
capacity. Peak load hours for this capacity are calculated in the model. Deficits after
dispatchable hydropower were fulfilled by flexible fossil generation in the 2013
scenario.

77
5 SCENARIOS ANALYSED WITH THE MODEL
Some basic scenarios were constructed with the model and they are presented in the
following chapter. General observations and results are presented in chapter 6. Table 7
presents installed capacities and shares out of total energy for different electricity
generation sources. For electricity storage, the installed capacities and number of hours
in which they are used are listed. These hours are called deficit hours in this thesis.
Consumed energy is deducted from the generated energy and if the result is negative,
energy storage is assumed to be available. The amount of energy used from the storage
is small compared to the total energy generated in the Nordic energy system, around 0.8
TWh out of 435 TWh in the Storage scenario and 14 TWh out of 474 TWh in the Low
Hydro scenario. Storage is not used as a daily source of energy, instead it is used in the
hours when the total energy generated is not enough to satisfy the consumption of the
energy. Still, the importance of storage in these specific scenarios should not be
underestimated even if the share out of the total generated electricity is small because it
has an important role in the hours it is needed. After all, society requires that its
electricity demand is satisfied every hour of the year.
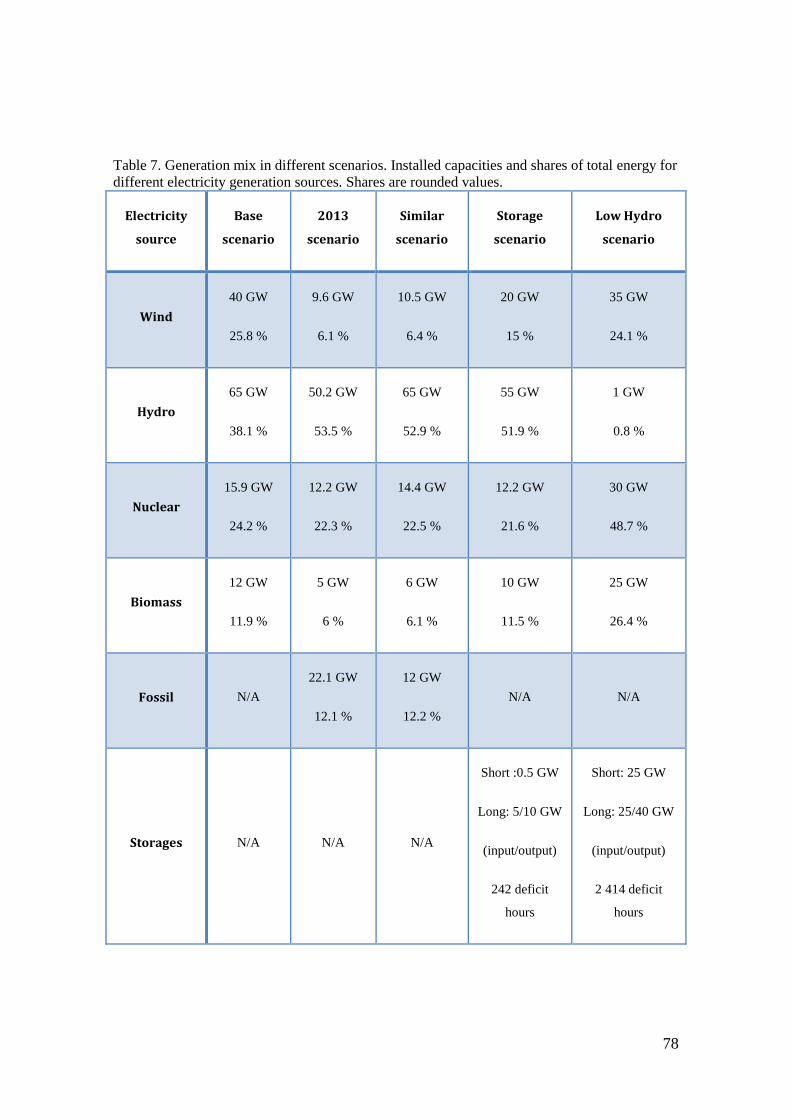
78
Table 7. Generation mix in different scenarios. Installed capacities and shares of total energy for
different electricity generation sources. Shares are rounded values.
Electricity
source
Base
scenario
2013
scenario
Similar
scenario
Storage
scenario
Low Hydro
scenario
Wind
40 GW
25.8 %
9.6 GW
6.1 %
10.5 GW
6.4 %
20 GW
15 %
35 GW
24.1 %
Hydro
65 GW
38.1 %
50.2 GW
53.5 %
65 GW
52.9 %
55 GW
51.9 %
1 GW
0.8 %
Nuclear
15.9 GW
24.2 %
12.2 GW
22.3 %
14.4 GW
22.5 %
12.2 GW
21.6 %
30 GW
48.7 %
Biomass
12 GW
11.9 %
5 GW
6 %
6 GW
6.1 %
10 GW
11.5 %
25 GW
26.4 %
Fossil N/A
22.1 GW
12.1 %
12 GW
12.2 %
N/A N/A
Storages N/A N/A N/A
Short :0.5 GW
Long: 5/10 GW
(input/output)
242 deficit
hours
Short: 25 GW
Long: 25/40 GW
(input/output)
2 414 deficit
hours

79
5.1 Base scenario
As mentioned before, the Base scenario in the model is based on the IEA's CNS
scenario found in the Nordic Energy Technology Perspectives. In this Base scenario, the
Nordic energy system has about 76 % renewable generation and 24 % nuclear and the
whole system is carbon free. The only intermittent element in the system is the large
share of wind power. A portion of hydropower is considered non-dispatchable and acts
as a base load power source in the system. The total energy of the nuclear power is
divided evenly throughout the year reflecting its role as a base load power source in the
energy system. There is, however, the possibility to use nuclear power as a flexible
power source, but this is not analysed in the Base scenario. Combined Heat and Power,
or CHP, is assumed to generate 100 % more energy in winter months (November to
April) than in summer months. Energy from CHP is divided evenly over hours of the
year. The energy generated by CHP in the model is electricity; heat energy or heat flows
in the energy system are not modelled. Finally the remaining hydropower is
dispatchable and is the only flexible form of power generation in the Base scenario.
Dispatchable hydropower is used when there is an energy deficit in the system and it
has no flexibility limitations. Hydropower plants have low 8warm and
9hot start-up
times ranging from seconds to 1-2 minutes and their power change rate (MW/min) is
high.
5.2 2013 scenario
The model was also used to recreate the Nordic energy system in 2013 in order to
compare the results of the model to the known real-life situation in 2013. This scenario
is called the 2013 scenario in the model and it also includes fossil fuel power
generation. The scenario was constructed in order to assess whether the model gives
realistic outputs or not. Capacities for different electricity generation sources were
8 warm start-up = from standby to production
9 hot start-up = turbine is already rotating

80
obtained from the Nordic Market Report (2014) and the peak load hours were calculated
from the same report.
5.3 Similar scenario
In this scenario, the energy system in 2050 has about the same shares for different
electricity generation sources as in 2013. Only now, the total energy produced in 2050
is in line with the IEA predictions and close to 500 TWh. The shares are obtained by
choosing such capacities for different electricity generation sources that they produce
the predetermined shares of the total energy production. Peak load hours are same as in
other scenarios happening in 2050, except for wind power. The Similar scenario uses 3
018 peak load hours for wind power which is lower than in other scenarios set to
happen in 2050. This is due to an assumed lower share of offshore wind power in this
scenario and this assumption is made in order to keep the wind power's share of the total
generation the same as it was in 2013. However, these shares may not be in line with the
predictions for the future. For example, wind power capacity is only 0.9 GW more than
in 2013. It is highly unlikely that the future energy system in 2050 is the one presented
in the Similar scenario. However, the purpose of this scenario was to show how much
an energy system with the current generation mix would produce greenhouse gas
emissions in 2050 when compared to an energy system with no fossil generation i.e. the
system found in the Base scenario.
5.4 Storage scenario
In this scenario, the Nordic energy system has electric storages connected to the grid. In
the Base scenario the energy system produces a surplus of energy which could be
exported. In the Storage scenario, some of the power generation capacity is replaced
with electric storage. In this scenario, how much potential power generating capacity is
saved by using electric storage is analysed and from which electricity generating
sources this capacity is saved from. The capacity values are chosen and are not strictly
based on any scenario or situation in any country. The capacities of different electricity
generation sources are estimated in such a way that the overall energy production

81
together with electricity storage can answer to the demands of consumption but the
surplus of energy is not as high as the IEA estimates or what it is in the Base scenario.
The IEA estimates that the Nordic countries will be net exporters of electricity in 2050
and the Base scenario was constructed accordingly. In the Storage scenario the Nordic
energy system is more optimised to the consumption of the Nordic countries and does
not generate as much surplus as in the Base scenario.
5.5 Low Hydro scenario
The energy system in this scenario is not strictly based on any real life country, region
or any IEA scenario. However, the model uses real data for the Nordic electricity load
and thus, also this scenario uses the Nordic load pattern. This means that the largest
loads are in the winter months.
The Nordic energy system has significant amounts of hydropower generation available
and it has the largest impact on the Nordic energy system. In this scenario, the share of
hydropower compared to other generation sources is insignificant. The generation mix
and shares of different generation sources are chosen and just one possible combination.
The Low Hydro scenario includes electricity generation from wind, nuclear and
biomass. Hourly balancing and flexibility is ensured by incorporating energy storage
into the energy system. The shares and capacities for different generation sources and
storage are selected in such a way that there are no deficits in the system after energy
storage. The total electricity generated in this scenario is in line with other scenarios
happening in 2050.

82
6 RESULTS AND ANALYSES
This chapter presents the results and analyses of the different scenarios modelled in the
thesis. As the model essentially simulates the hourly power balance in the Nordic
system, we can obtain hourly and monthly generation profiles. The model returned
generation mixes for each scenario and the produced and consumed energies. Generally,
nuclear generation works as a base load in the scenarios. It provides energy evenly
throughout the year and, together with other electricity generation sources, replaces the
fossil generation used currently. Nuclear power is well suited for systems with large
shares of intermittent power generation (e.g. wind power) as it ensures that there is a
certain amount of base load capacity available throughout the year regardless of weather
conditions.
Inputs and outputs on the model are same for every scenario and they are marked in the
model. Of course, the values of these inputs and outputs vary depending on the selected
scenario. Table 8 gathers some of the inputs and outputs from the model which are used
to calculate hourly consumed and produced energies for different scenarios. The
numbers inside the red rectangle are outputs and the other numbers are inputs. Wind
assumptions for the 2013 scenario differ from the assumptions made in other scenarios
because the model uses real life data from the year 2013. The most important outputs in
the model are hourly generation and consumption profiles. The generation mix, the total
energies and possible deficit hours are all results of these hourly calculations. As there
are 8 760 hours in the year, it is not reasonable to present these outputs here.
In short, most of the capacities and peak load hours are inputs in the model and these
are used to calculate hourly consumption and generation profiles. This hourly data is in
turn used to form the generation mix and total energies in the system.
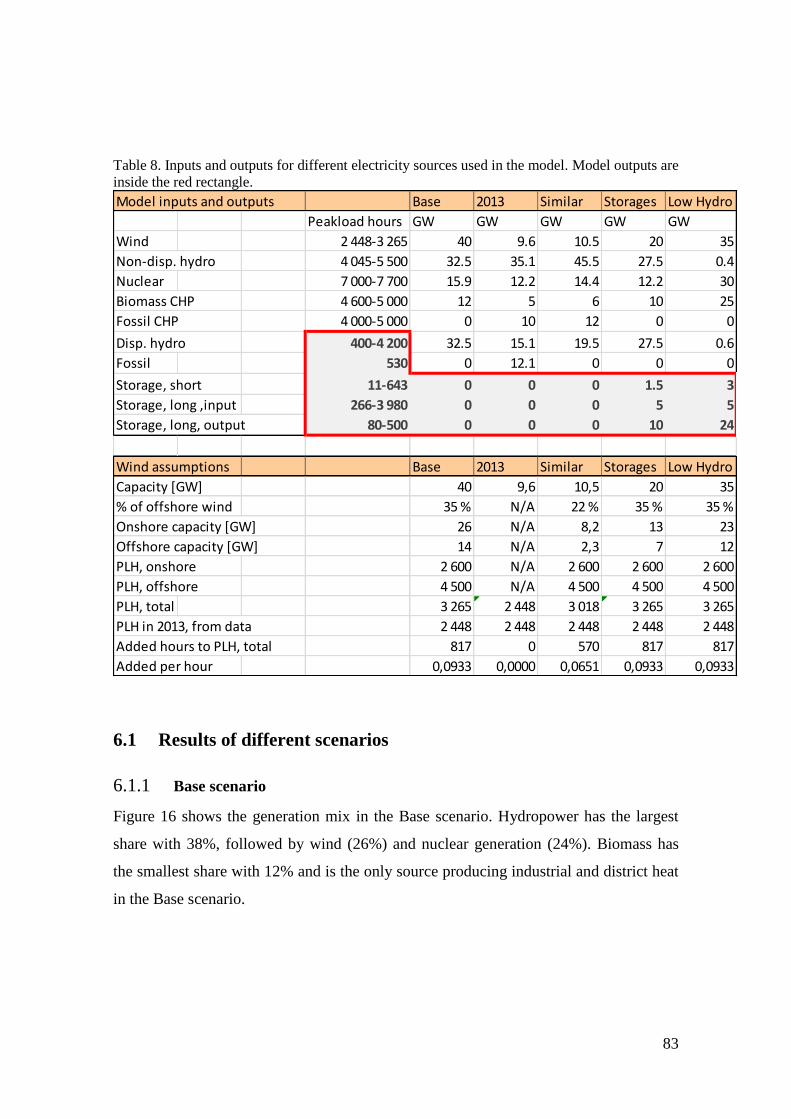
83
Table 8. Inputs and outputs for different electricity sources used in the model. Model outputs are
inside the red rectangle.
6.1 Results of different scenarios
6.1.1 Base scenario
Figure 16 shows the generation mix in the Base scenario. Hydropower has the largest
share with 38%, followed by wind (26%) and nuclear generation (24%). Biomass has
the smallest share with 12% and is the only source producing industrial and district heat
in the Base scenario.
Model inputs and outputs Base 2013 Similar Storages Low Hydro
Peakload hours GW GW GW GW GW
Wind 2 448-3 265 40 9.6 10.5 20 35
Non-disp. hydro 4 045-5 500 32.5 35.1 45.5 27.5 0.4
Nuclear 7 000-7 700 15.9 12.2 14.4 12.2 30
Biomass CHP 4 600-5 000 12 5 6 10 25
Fossil CHP 4 000-5 000 0 10 12 0 0
Disp. hydro 400-4 200 32.5 15.1 19.5 27.5 0.6
Fossil 530 0 12.1 0 0 0
Storage, short 11-643 0 0 0 1.5 3
Storage, long ,input 266-3 980 0 0 0 5 5
Storage, long, output 80-500 0 0 0 10 24
Wind assumptions Base 2013 Similar Storages Low Hydro
Capacity [GW] 40 9,6 10,5 20 35
% of offshore wind 35 % N/A 22 % 35 % 35 %
Onshore capacity [GW] 26 N/A 8,2 13 23
Offshore capacity [GW] 14 N/A 2,3 7 12
PLH, onshore 2 600 N/A 2 600 2 600 2 600
PLH, offshore 4 500 N/A 4 500 4 500 4 500
PLH, total 3 265 2 448 3 018 3 265 3 265
PLH in 2013, from data 2 448 2 448 2 448 2 448 2 448
Added hours to PLH, total 817 0 570 817 817
Added per hour 0,0933 0,0000 0,0651 0,0933 0,0933

84
Figure 16. Generation mix in the Base scenario in 2050.
The maximum deficit in the system after wind and base load power sources is about 25
GWh in 16.1.2013 hr. 08-09. The IEA estimates that about 60% of the Nordic
hydropower will be dispatchable in 2050. In the model, this value is set to 50% meaning
that dispatchable hydropower has a capacity of 32.5 GW. This capacity is enough to
fulfil the largest energy deficit in the year. Figure 17 shows the load, dispatchable
hydropower and wind generation in a two week period in January.

85
Figure 17. Load, dispatchable hydropower and wind generation in 10.1-24.1.2050 according to
the model.
As Figure 17 shows, the dispatchable hydropower follows the demands of the load and
wind generation. The load and hydropower curves are similar in shape. The largest
deficit of 25 GWh is in hour 369 of the year. The wind generation is low in that hour so
the hydropower has to fulfil the load demand. In turn, when the wind generation is
better, the need for dispatchable hydropower is reduced. This can be seen for example in
hours 217 to 247 and 467 to 507. Overall, Figure 17 shows how dispatchable
hydropower works in the model. It compensates for possible deficits which essentially
are the combined results of load and wind generation profiles. Other generation sources
produce electricity evenly throughout the year. The total generation curve is not shown
in the figure because most of it would overlap the load curve. When dispatchable
hydropower is not used for generation, there is either an energy surplus in the system or
the generation and consumption of electricity are in balance. Figure 18 shows the first
week of June, when there is virtually no dispatchable hydropower generation and the

86
energy system produces more energy than the Nordic countries consume. Hours 3 777
to 3 780 show less than 1 GWh of dispatchable hydropower generation each.
Figure 18. Load, dispatchable hydro and total generation in 1.6-7.6.2050 according to the
model.
In the Base scenario for the 2050, the overall electricity generation increases by 30%
from 384 TWh to 506 TWh and the generating capacity with about 30 GW. These
values are on the same scale as presented in the IEA's Nordic Energy Technology
Perspectives. In the Base scenario, the constructed future energy system has a
generation surplus of 76 TWh. The IEA estimates that, depending on scenario, the
Nordic countries will have a combined net electricity exports between 40 TWh and 100
TWh (IEA, 2013).
In Europe, intermittent wind and solar power are becoming more popular and it is
intended that fossil fuelled power generation will be abandoned in many countries, thus
the need for regulating power capacity will increase. The large hydropower capacity in
the Nordic system is valuable as it can help to regulate the electricity systems in

87
Northern and Central Europe. Even if overproduction of electricity takes place at the
same time in the Nordic countries as well as in Northern and Central Europe, the
problem can be alleviated by using energy storage or large dispatchable hydropower
capacity in the Nordic countries. Norway has great realisable potential for pumped-
storage hydropower (13.3 TWh) and Sweden has potential for 3.1 TWh (Gimeno-
Gutiérrez & Lacal-Arántegui, 2013). And as Figure 19 shows, the Nordic energy system
has overproduction in most of the months, even in winter. Thus, it seems that the Nordic
energy system in the future could produce more energy than it consumes and the surplus
energy could be sold to the European market. For example, the regulating power from
the Nordic energy system could help the German electricity system which is anticipated
to have a major shares of wind and solar power but relatively small shares of
hydropower capacity in the future (Paukkeri, 2013).
The monthly generation profile for the Base scenario is presented in Figure 19. The
black line represents the load in Nordic countries. The different electricity generation
sources are, from bottom to top, in the same order as in the model.
Figure 19. The generation mix and load month to month in the Base scenario.

88
As can be seen from the figure, wind generation and dispatchable hydropower are the
only intermittent electricity generation sources. Non-dispatchable hydro, nuclear and
CHP generation have no hourly variation. Nuclear generation and non-dispatchable
hydro provide the base load to the energy system. The combined heat and power has
twice the generation in winter than in the summer. The Nordic countries have more load
in the winter months and therefore dispatchable hydropower is needed to compensate
for deficits. Figure 19 shows only one year and wind generation differs from year to
year. Still, only a fraction of the potential dispatchable hydro is used and it is safe to
assume that even with no wind generation in one month, the load demand in the Nordic
countries could be fulfilled. Of course this holds true only when other electricity
generation sources such as nuclear and biomass are present in the system.
6.1.2 2013 scenario
The 2013 scenario was constructed in order to assess whether the outputs of the model
can be trusted or not. If the 2013 scenario gives somewhat similar results as the known
real-life situation was in 2013, the model can be considered to work with sufficient
accuracy. Figure 20 shows the power generation mixes in 2013.
Figure 20. Comparison between generation by source in 2013 (left) and the results of the model
(right). (NordREG, 2014)

89
The diagram on the left represents the real-life situation in 2013 and it is obtained from
the publication the Nordic Market Report 2014 by Nordic Energy Regulators. The
diagram on the right represents the results obtained from the model by using known
capacities in 2013 (NordREG, 2014). The diagrams are almost identical, apart from
relatively minor differences with hydro (2 TWh), nuclear (1 TWh) and fossil (1 TWh)
generations.
The fossil fuel power generation in the model consists of fossil CHP and flexible fossil
generation. Fossil CHP is considered together with biomass CHP and the energy is
divided evenly between the hours of the year. Flexible fossil generation is the last
electricity generation source in the model and it is used only when there are energy
deficits in the system. If there is an energy deficit in the energy system after base load
power sources are utilised, it is first fulfilled by utilising dispatchable hydropower and
after that flexible fossil power. This results in only 6.3 TWh of flexible fossil energy
over the year with peak load hours of 521h. Overall the amount of fossil generation
seems realistic and close to the real 2013 situation, but almost all the fossil energy is
generated with CHP in the model and only a miniscule amount with flexible fossil
generation. This model somewhat differs from the real life, but overall the amount of
energy produced by fossil fuelled generation is in line with the statistics from 2013.
In the 2013 scenario, the capacity of dispatchable hydropower is about 15 GW. If the
energy deficit in any given hour of the year is more than that, flexible fossil generation
is used to attempt to fulfil the deficit. The system has 12 GW of flexible fossil
generation. Overall, dispatchable hydro and flexible fossil generation handle the load
requirements well; there are only a total of 81 deficit hours in 2013. These can be
handled with imports from e.g. Russia. The model gives fairly good results for 2013,
but in real-life situations in 2013 there were even more hours in the year when imports
were needed. Figure 21 shows load, dispatchable hydropower and flexible fossil
generation in January 2013.

90
Figure 21. Curves for load, dispatchable hydropower and flexible fossil generation in January
2013.
Figure 21 shows how the balancing elements of the constructed energy system work. If
the capacity of dispatchable hydropower is enough to fulfil the deficit, no flexible fossil
generation is needed. In instances when hydropower does not generate enough
electricity, flexible fossil steps in and tries to answer the load demand. Both of these
electricity generation sources have a maximum capacity and if the deficit in any given
hour exceeds the sum of these capacities, imports to the energy system are needed.
These hours can be observed in figure 24; when both dispatchable hydro and flexible
fossil curves have straight horizontal lines in the same hours, they are at their maximum
capacities.
6.1.3 Similar scenario
This scenario has a similar generation mix in regards to percentages as the 2013
scenario and the real-life situation in 2013. As the Similar scenario happens in 2050, the
amounts of produced energies are of course different from those produced in 2013. The

91
total amount of produced energy is about 493 TWh and is in line with the IEA
predictions. In the Base scenario and the IEA scenarios presented in the NETP
publication, fossil fuelled generation is either non-existent or its share of total energy
production is small. Figure 22 shows a comparison between the real-life generation mix
in 2013 and the generation mix in the Similar scenario.
Figure 22. Generation mix in 2013(left) and a similarly structured energy system in 2050
(right). (NordREG, 2014)
As can be seen from the figure above, the shares of different electricity generation
sources in 2013 and in the Similar scenario are almost identical but the produced
energies are different. In the Similar scenario, fossil fuelled generation produces 60
TWh of energy compared to none in the Base scenario (Figure 16).
The energy system in the Similar scenario works in the same way as in other year 2050
scenarios. Dispatchable hydropower functions as a flexible element in the energy
system. As in the Base scenario, dispatchable hydropower's generation greatly depends
on the load and the wind generation. Other generation sources function as base load
power sources in the system and thus the need for dispatchable hydropower in any
given hour is in practice determined by the load and wind power generation.
Table 3 presents carbon dioxide equivalent emissions per kWh of produced energy from
different sources. These values are used here to evaluate how much carbon dioxide-
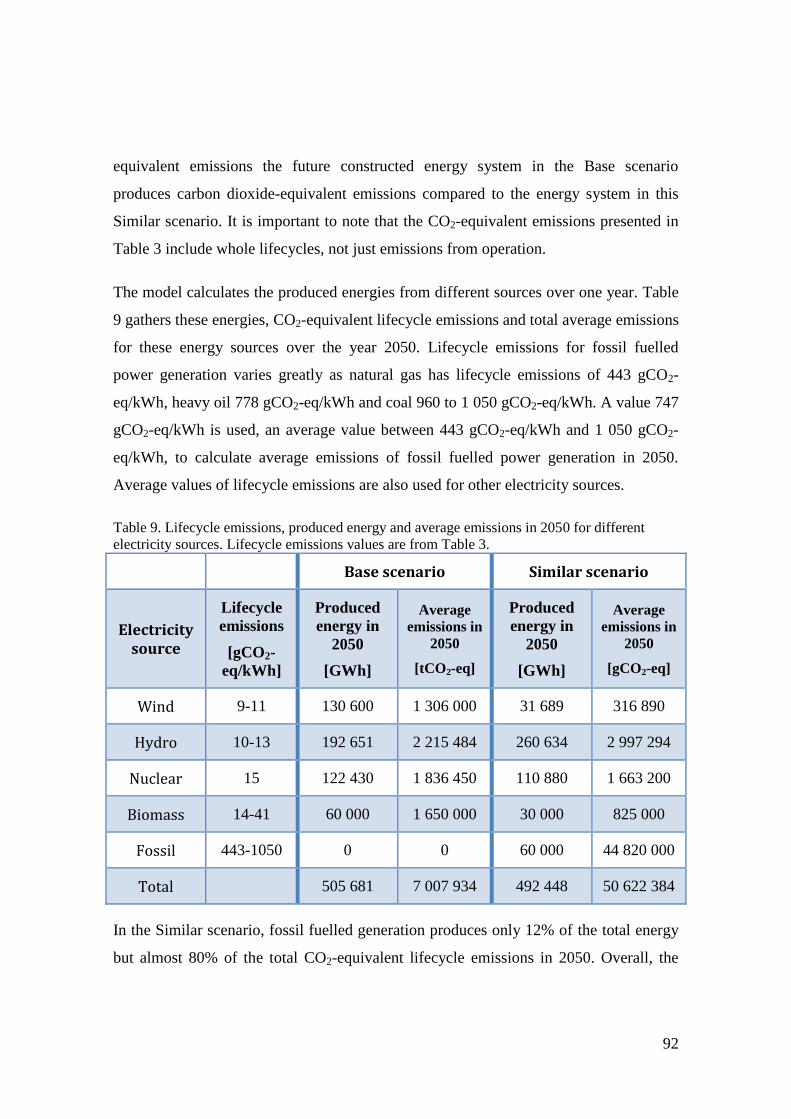
92
equivalent emissions the future constructed energy system in the Base scenario
produces carbon dioxide-equivalent emissions compared to the energy system in this
Similar scenario. It is important to note that the CO2-equivalent emissions presented in
Table 3 include whole lifecycles, not just emissions from operation.
The model calculates the produced energies from different sources over one year. Table
9 gathers these energies, CO2-equivalent lifecycle emissions and total average emissions
for these energy sources over the year 2050. Lifecycle emissions for fossil fuelled
power generation varies greatly as natural gas has lifecycle emissions of 443 gCO2-
eq/kWh, heavy oil 778 gCO2-eq/kWh and coal 960 to 1 050 gCO2-eq/kWh. A value 747
gCO2-eq/kWh is used, an average value between 443 gCO2-eq/kWh and 1 050 gCO2-
eq/kWh, to calculate average emissions of fossil fuelled power generation in 2050.
Average values of lifecycle emissions are also used for other electricity sources.
Table 9. Lifecycle emissions, produced energy and average emissions in 2050 for different
electricity sources. Lifecycle emissions values are from Table 3.
Base scenario Similar scenario
Electricity source
Lifecycle
emissions
[gCO2-
eq/kWh]
Produced
energy in
2050
[GWh]
Average
emissions in
2050
[tCO2-eq]
Produced
energy in
2050
[GWh]
Average
emissions in
2050
[gCO2-eq]
Wind 9-11 130 600 1 306 000 31 689 316 890
Hydro 10-13 192 651 2 215 484 260 634 2 997 294
Nuclear 15 122 430 1 836 450 110 880 1 663 200
Biomass 14-41 60 000 1 650 000 30 000 825 000
Fossil 443-1050 0 0 60 000 44 820 000
Total 505 681 7 007 934 492 448 50 622 384
In the Similar scenario, fossil fuelled generation produces only 12% of the total energy
but almost 80% of the total CO2-equivalent lifecycle emissions in 2050. Overall, the

93
energy system in the Similar scenario produces over four times as much CO2-equivalent
emissions than the energy system in the Base scenario.
The IEA estimates that the greenhouse gas emissions intensity for nuclear power is
currently about 15 gCO2-eq/kWh (IEA, 2014e). This value is used in Table 9. In his
study, Sovacool (2008) used a lifecycle emission value of 66 gCO2-eq/kWh for nuclear
energy (Sovacool, B., 2008). With this value the average emissions in 2050 for nuclear
power would rise from around 1 840 000 tCO2-eq/kWh to 8 080 000 tCO2-eq/kWh in
Base scenario and from 1 660 000 tCO2-eq/kWh to 7 320 000 tCO2-eq/kWh in Similar
scenario. The IEA value for nuclear lifetime emissions sets the nuclear energy
emissions in 2050 to the same levels as the emissions from renewables. Figure 23
presents average emissions in 2050 with different lifecycle emission values for nuclear
and fossil power. Using a higher nuclear lifecycle emissions value of 66 gCO2-eq/kWh
still shows the benefits of replacing fossil power with a combination of nuclear and
renewables.
Figure 23. Average carbon dioxide-equivalent lifetime emissions calculated for one year. All the
different cases have around same total energy produced, 500 TWh. Cases a), c), e) and f) use the
value 15 gCO2-eq/kWh for nuclear power while cases b) and d) use the value 66 gCO2-eq/kWh.
As Figure 23 clearly shows, carbon dioxide-equivalent emissions are drastically smaller
in the Base scenario compared to the Similar scenario, even if all the fossil fuel used in
the Similar scenario is natural gas. The future energy system in the Base scenario not
only has lower emissions from greenhouse gases and other air pollutants but it also has

94
some monetary benefits as CO2-equivalent emissions are likely even more heavily
charged and taxed in the future than they are today.
6.1.4 Storage scenario
In the Base scenario and in the IEA scenarios, the Nordic countries become net
exporters of electricity by 2050. In the Storage scenario, the goal was to construct an
energy system which produces just about the same amount of electricity that the Nordic
countries consume but at the same time there would be no deficit hours during the year.
The constructed energy system is also self-sufficient and does not depend on energy
imports from other countries e.g. Russia. In order to ensure that there are no deficits,
energy storage is introduced to the system. The storage input and output capacities were
chosen by finding the values which bring the hourly production-consumption balance in
every hour of the year to zero or positive i.e. the system does not have any deficits.
In the Storage scenario, the capacity of all the different electricity generation sources
have been decreased from the values used in the Base scenario. The energy system has
short term storage with 1.5 GW capacity and a size of 7.5 GWh and long term storage
with 5 GW input capacity, 10 GW output capacity and 2000 GWh storage size. The
capacity values for the different electricity generation sources are somewhat arbitrarily
chosen. They are not based on any IEA scenarios but can be deemed to be realistic.
Overall, the capacities of different electricity sources are lower than in the Base scenario
but higher or the same as in 2013.
The amount of nuclear generating capacity was kept same as in 2013 but the capacity is
of course renewed in 2050. This differs from the Base scenario in which it was assumed
that nuclear generating capacity would increase in Finland compared to present levels.
Hydropower capacity is about 5 GW more than in 2013 reaching 55 GW. It is safe to
assume that Nordic hydropower will continue to be the most important element in the
Nordic energy system but its capacity additions are lower than in the Base scenario as
there is no need for as much electricity generation as in the Base scenario. Biomass
fuelled CHP capacity is 10 GW which is 3 GW more than in 2013, but at the same time

95
it is 2 GW less than in the Base scenario. This is again due to the lower energy
requirements in the Storage scenario compared to the Base scenario. In 2013, there was
15 GW of CHP (biomass + fossil) capacity in Nordic countries. In Storage scenario,
biomass CHP capacity is set to 10 GW but an assumption is made that some of the new
nuclear generating capacity is providing district heat. The wind power capacity is 20
GW which is double the 2013 capacity. This follows the trend and desire of increasing
the share of renewables in the generation mix compared to the shares in the present day.
The wind power capacity is lower than in the Base scenario as the whole energy system
is designed to produce less energy. 20 GW was the result of keeping the nuclear
generating capacity at the same level as in 2013, having an adequate amount of CHP
capacity present in the system and wanting the energy system to produce just about the
same amount of energy as it consumes. Figure 24 shows the generation mix in the
Storage scenario.
Figure 24. Generation mix in the Storage scenario. Energy storage not included.

96
Overall, the generating capacity in the Storage scenario is 97 GW while in 2013 it was
99 GW because the energy system in 2013 still includes fossil fuelled generation. Still,
the energy system in the Storage scenario produces about 51 TWh more electricity due
to an increase of 42 TWh in wind production and 29 TWh in hydro production.
Electricity consumption in the Storage scenario is 430 TWh and the system produces
435 TWh of electricity. Without storage there would be 242 deficit hours during the
year.
Table 10 shows the capacity values for different electricity sources in the Base and the
Storage scenarios. In the Storage scenario, the total generating capacity is 36 GW and
the produced electricity is 71 TWh less than in the Base scenario. Hydropower in the
Storage scenario produces more energy than hydropower in the Base scenario. Because
electricity generation from wind, nuclear and biomass is lower, dispatchable
hydropower has to produce more energy.
Table 10. Capacities and corresponding energies and shares for different electricity generation
sources in Base and Storage scenarios.
Base scenario Storage scenario
Electricity source
Share of
total
energy
Net
electricity
generation
[TWh]
Capacity
[GW]
Share of
total
energy
Net
electricity
generation
[TWh]
Capacity
[GW]
Wind 26 % 131 40 15 % 65 20
Hydro 38 % 193 65 52 % 226 55
Nuclear 24 % 122 16 22 % 94 12
Biomass 12 % 60 12 11 % 50 10
Other 0 % 0 0 0 % 0 0
Total 100 % 506 133 100 % 435 97

97
The Nordic load is concentrated in the winter months. The system has noticeable
deficits only at the start of the year as can be seen in Figure 25. In the figure, the hourly
power balance was calculated by subtracting the hourly Nordic load from the hourly
Nordic production.
Figure 25. Hourly system balance before introduction of electric storage.
Towards the middle and end of the year, the Nordic energy system produces more
energy than the Nordic countries consume. This surplus of energy can be stored in
energy storage and used at the start of the year, namely in January and February,
shifting the produced energy up to 6 months to match the consumption. As the Nordic
energy system has deficit hours at the start of the year, the long term storage level also
has to be adequate at the start of the year. The worst case scenario would of course be if
all gas in power-to-gas storage is depleted at the start of the year.
Storage capacities and the storage level at the start of the year are a result of testing in
the model. The minimum long term storage output capacity and the required storage
level at the start of the year was found by following the requirement that no deficit
hours can be left in the system after introduction of storages. Basically the value for the
output capacity was set in the model and then by changing this value together with the
storage level value at the start of the year, a solution was found. Figure 26 presents the

98
sum of hourly deficits with different values for long term storage output capacity and
with different storage levels at the start of the year. Short term storage capacity was set
to 1.5 GW and the long term storage input capacity to 5 GW.
Figure 26. Long term storage output capacity optimisation with different storage levels at the
start of the year.
The bars represent different values for long term storage output capacity. First, the long
term storage level at the start of the year was set to 1 200 GWh and the sum of hourly
deficits was calculated with different long term output capacity values. The same
process was carried out with different values for storage levels at the start of the year.
The sum of hourly deficits was more than zero regardless of the value of the long term
output capacity until the long term storage level at the start of the year was set to 1 350
GWh. With this value, 10 GW of long term output capacity is needed so that the sum of
hourly deficits is zero. More accurately, 1319 GWh was determined to be the point
when the sum of hourly deficits reaches zero.

99
Figure 26 does not show anything about the short term storage capacity or levels.
During the long term storage's optimisation it was noted that the short term storage's
effect on the sum of hourly deficits is much lower than the long term storage's. If there
was no short term storage capacity, 1 331 GWh of energy would be needed at the start
of the year in long term storage. With 1 GW of short term storage, the long term storage
level at the start of the year has to be 1 322 GWh in order to have no deficits in the
system. A value of 2 000 GWh is used in the model as both the storage energy level at
the start of the year and as the maximum energy capacity for long term storage. Even
though the model shows that the short term storage is not as important for balancing the
Nordic energy system as the long term storage, the short term storage capacity was set
to 1.5 GW. The short term storage energy storing capacity was restricted by the
following rule: for every GW of short term electrical capacity, an energy storage size of
5 GWh is allowed (Paukkeri, 2013). This means that the short term energy storage in
the Storage scenario has 7.5 GWh of energy storing capacity.
Pumped-storage hydropower can be used for either short term or long term storage and
balancing purposes. PSHs with large reservoirs and storage volumes together with low
installed electrical capacity will lead to slow changes in water levels in the lower and
upper reservoirs. Small reservoirs with large installed electrical capacity in turn will
lead to a more rapid changes in water levels and the pumped-storage hydropower
becomes more responsive. Currently in Norway, seasonal pumping is used between
very large reservoirs instead of daily or weekly cycle. (Gimeno-Gutiérrez & Lacal-
Arántegui, 2013)
Existing PSH energy storage capacity in Norway is reported to be 11 TWh but the
pumping/generation capability is limited by the installed electrical capacity of the
pumps and turbines. Norwegian water reservoirs for hydropower are very large and also
connected to other conventional hydropower generators, not just PSHs and their
infrastructure. In 2010, Norway had a pumped-storage hydropower capacity of 1 326
MW and Sweden 99 MW while Finland had zero PSH capacity. In 2010 the Nordic
countries had 1.4 GW of long term pumped-storage hydropower capacity while the

100
requirement in 2050 according to the model is 10 GW of long term storage output
capacity. Long term storage electrical capacity can be increased by increasing the
pumping capacity in Norwegian hydro reservoirs and PSH stations and the possibility of
power-to-gas storage also exists. (Gimeno-Gutiérrez & Lacal-Arántegui, 2013)
In the Storage scenario an assumption is made that the installed electrical capacity in
Norwegian pumped-storage hydropower stations is better than it is currently and the
PSH energy capacity can be better utilized. The required level of long term storage
capacity is achieved by 2050. In the model, long term storage has a 2 TWh maximum
storage capacity. According to Gimeno-Gutiérrez & Lacal-Arántegui (2013), Norway
has realisable PSH potential for a total of 13.3 TWh and Sweden 3.1 TWh. An assumed
2 TWh of maximum long term energy storage capacity and the same amount of stored
energy at the start of the year are therefore plausible. Now, the storage level of 2 000
GWh at the start of the year may seem large but as Figure 26 presents, the Nordic
energy system produces more energy than it consumes at the middle and end of the
year and this energy is stored in the long term energy storage sites. The dourly long
term storage level is presented in Figure 27.
Figure 27. Hourly long term storage level in the Storage scenario.

101
According to the model, the long term storage is at maximum energy levels at the end of
the year thus providing the necessary energy at the start of the next year. Stored energy
is generally used from January to March, specifically from hour 282 to 1 763. Of
course, this result is based on the consumption of only one year and can somewhat vary
from year to year but it is clear that energy storage is needed in winter months and
during summer the storage facilities are recharged, so to speak.
6.1.5 Low Hydro scenario
The purpose of this scenario was to construct a carbon free energy system without a
large amount of hydropower to see if a system containing only wind, biomass and
nuclear power together with energy storage can form a working energy system and to
see whether hourly balancing can be achieved with other elements of the system.
Balancing elements could consist of energy storage or Demand Side Management in the
form of load shifting or indirect control. In the model, hourly balancing in the Low
Hydro scenario is done with short and long term energy storage. This scenario
resembles the Storage scenario, but as opposed to it, the Low Hydro scenario does not
have a large amount of hydropower capacity available. This in turn highlights the
importance of energy storage in hourly balancing because the energy flows to and from
the energy storage facilities are an order of magnitude higher than in the Storage
scenario.
The capacities for different electricity generation sources are arbitrarily chosen. Wind
power capacity was set to 35 GW which is 5 GW lower than in the Base scenario and
15 GW higher than in the Storage scenario. The biomass fuelled capacity was set to 25
GW which is the highest in any scenario. The nuclear generating capacity was set to 30
GW. In this scenario, hydropower has only 1 GW capacity. The total generating
capacity in the Low Hydro scenario is 91 GW and the total amount of energy generated
474 TWh. The selected electricity generation mix is presented in Figure 28.

102
Figure 28. Electricity generation mix in the Low Hydro scenario. Storage not included.
The storage sizes are optimized in the same way as in the Storage scenario i.e. minimum
levels for short term storage capacity and long term storage capacities (input and output
energy) are found by keeping some of these capacities constant while altering the values
for the rest. The solution is found when none of the capacities can be decreased without
causing a deficit in the system.
Four variables affect whether the system has a deficit after storage or not: electrical
capacity of short term storage, electrical input capacity of long term storage, electrical
output capacity of long term storage and energy capacity of long term storage i.e. long
term storage size. First, the long term storage size was set to 11 TWh and the minimum
capacity levels for short and long term storages were found without causing a deficit in

103
the system. Basically, the short and long term storage capacity values were changed
until there was no deficit in the system. It was found that 43 GW of short term storage
capacity, 14 GW of long term storage input capacity and 24 GW of long term output
capacity were needed in order to have no deficits in the system while the long term
storage size is 11 TWh. This was the first result. Next, a new set of capacity values were
acquired by increasing the size of the long term storage. Table 11 presents the short and
long term storage capacity optimisation with different long term storage sizes. Each row
in the table results in a zero deficit in the system.
Table 11. Short and long term storages' capacities with different long term storage sizes. Every
set of values/rows result in zero deficit in the system.
Long term storage size
[TWh]
Short term storage capacity
[GW]
Long term storage input capacity [GW]
Long term storage output capacity [GW]
11 43 14 24
11.5 23 14 24
12 10 11 24
12.5 5 7 24
13 3 5 24
13.5 1 4 24
Table 10 clearly shows that the long term storage output capacity has a distinct
minimum value of 24 GW while the minimum values for short term storage capacity
and long term storage input capacity depend on the size of the long term storage. Once
this had been determined it was only a matter of selecting the preferred size of the long
term storage. For reference, the German natural gas grid has 220 TWh capacity at the
time of writing (GTI, 2015). In Great Britain, the existing gas storage capacity is 4 727
mcm (million cubic meters) equalling to around 51.2 TWh and new storage projects are

104
planned and some under construction (Le Fevre, 2013). If the long term storage in the
Low Hydro scenario is power-to-gas, each value for long term storage size is possible.
The United Kingdom is a good example for this scenario as the UK's electricity
generation mix had only 1% of hydropower in 2010 and the total electricity generation
in 2010 was at the same level as in the Nordic countries in 2013, 378 TWh and 380
TWh respectively (NordREG, 2014). The United Kingdom also plans to increase the
share of renewables, especially wind power, considerably to about 30% in 2020 from
8% in 2010 and the UK nuclear industry has announced ambitions to construct up to 16
GW of new nuclear capacity. This would mean that renewables and nuclear power
would have a significant share of the UK's electricity generation mix, just the same as
Low Hydro scenario. However, fossil fuelled power still remains an important element
in the United Kingdom's energy system. Thus the Low Hydro scenario is not strictly
based on the UK as the scenario does not have any fossil fuelled power, not even fossil
power equipped with CCS technologies. (IEA, 2012c)
The long term storage size of 13 TWh was selected. This is also the amount of stored
energy at the start of the year. Table 11 presents minimum values required in order to
have no deficits in the system. The short term storage capacity is 3 GW, the short term
storage size is 15 GWh, the long term storage input capacity is 5 GW and long term
storage output capacity is 24 GW. With these values, the long term storage has at its
lowest point of the year about 41 GWh of stored energy remaining. Figure 29 presents
the hourly long term storage level.

105
Figure 29. Hourly long term storage level in the Low Hydro scenario.
Figure 28 shows the long term storage level throughout the year. The long term storage
level is at its lowest on the night between 15 and 16 of March. The lowest amount of
energy stored is about 41 GWh and the general trend for the long term storage's level
after this point is upwards. The short term storage level varies much more rapidly as it
responds to deficits before the long term storage and the figure for the short term
storage level over the whole year is too congested to present. Figure 29 shows the
energy balance of the system after all the electricity generation from different sources,
long term storage output and short term storage output in January.

106
Figure 30. Storage outputs and system balance after generation in January.
Figure 29 clearly shows how the energy storages balance the system. When the energy
balance after generation is positive, energy storage outputs are zero. If there are deficits
in the system and the balance after generation is negative, energy storage is used to
offset the deficit. This is how the energy system in this scenario is balanced throughout
the year.
The Low Hydro scenario shows that a carbon free energy system can work without a
large amount of hydropower. The Low Hydro scenario has three electricity generation
sources, of which nuclear power produces the most energy per installed capacity. For
the system to work without a large amount of hydropower, an abundance of generating
capacity is required to ensure that enough electricity is generated even in the hours with
most demand or using energy storages to balance the difference between electricity
generation and demand. The ability to use load following nuclear power plants is not
modelled in this thesis but these have been used successfully at least in France. As it
stands, the Low Hydro scenario uses energy storages which are the only flexible
element in the Low Hydro scenario. If biomass or nuclear power were also somewhat

107
flexible, they would improve the functionality of the system and naturally the overall
flexibility.
6.2 Specific situations and sensitivity analyses
Constructed scenarios provide basic outputs of the energy system such as produced
energy, consumed energy and generation mix in the system. These factors help to form
a basic picture of the energy system. In this chapter, some specific situations are
constructed and analysed in order to better understand how important each electricity
generation source in the chosen future energy system are. The role of nuclear power is
especially considered including; whether the chosen future energy system could
function without nuclear power, how it would be replaced and what the effects of
nuclear energy's possible dismissal would be on the energy system.
6.2.1 Zero wind situation
Wind generation is the fastest growing source of electricity production in the envisioned
future energy system. It is also the only intermittent electricity source in the system and
it has the second largest share of total energy production. Feasibility of the constructed
future energy system can be somewhat analysed by examining how the system behaves
regarding some extreme cases related to wind generation.
The wind power in the model is based on real-life wind data from 2013 and there are no
windless hours in the Nordic region in 2013. This is understandable as the region is
fairly large. Still, wind power cannot be considered an entirely reliable source of
electricity as its output is highly dependent on weather conditions. One way to analyse
the feasibility of the envisioned future energy system with large share of wind power is
to set the wind power production to zero in some hours of the year and analyse whether
the system can handle such a situation i.e. are the remaining electricity generation
sources capable of responding to the situation. This is a highly unlikely and extreme
situation, but if the system can handle such a scenario, then it can be deduced that the

108
system can also handle smaller disturbances regarding smaller than anticipated wind
generation.
The largest need for dispatchable hydropower in scenarios occurring in 2050 is in hour
369 of the year which is January 16 at 8 to 9. Figure 31 shows the power balance curve
in that hour in the Base scenario when the wind blows according to the real-life data.
The curve starts at a negative load value and each different electricity generation source
adds energy to the system until the balance reaches zero after dispatchable hydropower.
The dispatchable hydropower needed in this particular hour is 25.40 GWh.
Figure 31. Hour 369 in the energy system in the Base scenario.
The next step is to set the wind generation in hour 369 to zero and see if the other
elements in the system can still bring the balance to zero. The result is presented in the
Figure 32.

109
Figure 32. Hour 369 in the energy system with zero wind generation.
Even if there is no wind generation when the energy system has the largest deficit, the
remaining generation sources bring the balance to zero. Dispatchable hydropower has
32.5 GW of capacity in the Base scenario and as can be seen in Figure 32, the largest
deficit even without wind generation is 31.81 GWh. Even though the dispatchable
hydropower is the last generation source that brings the balance to zero, other sources
are equally important. If there were no nuclear generation or biomass fuelled generation,
the hydropower capacity in the Nordic countries could not answer to the demands of the
load by themselves. One could argue that this could be avoided by adding even more
hydropower. However, in the Base scenario the total hydropower capacity in 2050 is set
to 65 GW, which is already more than the IEA estimates. Figure 33 shows the power
balance curves when there is no nuclear or CHP generation in a zero wind situation. In
both of these cases, the energy system does not reach zero and there is more
consumption of energy than there is production.

110
Figure 33. The power balance in hour 369 when there is no nuclear generation (red) and no
CHP generation (green).
The zero wind generation in hour 369 is highly unlikely, but it shows that nuclear
generation has an important role as a base load source of energy. Some of the nuclear
power capacity could be replaced by biomass fuelled generation but from the energy
security point of view, it would be better to have a few alternative electricity generation
sources. In the Base scenario, nuclear energy produces over 122 TWh of energy in a
year which is about one quarter of the total energy produced. If nuclear power was
removed from the system, it would require around 25 GW of additional biomass fuelled
capacity with peak load hours of 5 000 to produce the same amount of energy as in the
Base scenario. This would bring the biomass fuelled generating capacity to 37GW and
the strain on the biomass production and transportation system would be greatly
increased.

111
6.2.2 System without nuclear power
Next we set the nuclear power production to zero over the whole year. In order to
achieve the same levels of production as with the nuclear power in the system, the
capacities of other electricity generation sources need to be raised. As mentioned before,
the hydropower capacity in the Base scenario is already higher than anticipated by the
IEA and thus the hydropower capacity remains at 65 GW. Wind power has large
potential in the Nordic and it is currently a popular and trending source of electricity. If
the biomass and hydropower capacities remain the same as in the Base scenario and
there is no nuclear of fossil generation, the capacity of wind power would have to be 73
GW, 33 GW more than in the Base scenario in order to produce the same amount of
energy, which is about 506 TWh. As mentioned before, biomass fuelled generating
capacity would be 37 GW if it was solely responsible for replacing the nuclear
generating capacity from the Base scenario.
Of course some kind of combination of biomass and wind power capacity increases
would be responsible for replacing the missing energy production from nuclear
generation. For example, a system with 65 GW of hydropower, 55 GW of wind power
and 26 GW of biomass fuelled generation would produce 505 TWh of energy, about the
same as the system in the Base scenario. When compared to the Base scenario, 15 GW
of additional wind power capacity and 14 GW of biomass fuelled generating capacity is
needed to replace 15.9 GW of nuclear generation.
The cost of different generation sources are naturally different. The U.S Energy
Information Administration (EIA, 2013) lists estimates of power plant capital and
operating costs. Table 12 gathers nominal capacities, capital costs and operating costs
for nuclear, wind and biomass power plants. Listed capital costs exclude financing-
related costs such as fees and interest during construction and can also be referred to as
overnight costs as if the construction project was completed overnight. Fixed operation
and maintenance (O&M) expenses exclude the owner's costs such as insurance fees,

112
property taxes and asset management fees. Variable O&M expenses include major
maintenance costs.
Table 12. Capital cost, fixed O&M cost and variable O&M cost of different technologies with a
certain nominal capacity. (data from EIA, 2013)
Technology
Nominal capacity
[kW]
Capital cost
[$/kW]
Fixed O&M
[$/kW-yr]
Variable O&M
[$/MWh]
Advanced nuclear
2 234 000 5 530 93.28 2.14
Wind, onshore
100 000 2 213 39.55 0
Wind, offshore
400 000 6 230 74.00 0
Biomass, BFB10
50 000 4 114 105.63 5.26
Biomass, CC11
20 000 8 180 356.07 17.49
Using the information presented in the Table 12, capital and operating costs of 15.9 GW
for nuclear power is compared to capital and operating costs of 15 GW of wind and 14
GW of biomass power. Table 12 presents cost values for certain nominal capacities. For
example 15.9 GW of nuclear power equals 7.1 nuclear power plants with a nominal
capacities of 2.234 GW each. As one cannot build 7.1 nuclear power plants, this value is
rounded to lowest whole number which is 7. This is acceptable because the constructed
energy system produces more energy than it consumes so 7 instead of 8 power plants is
enough. Same logic is applied to the other technologies. It is important to remember that
both the wind power and biomass capacity is needed to replace nuclear power. The
10 Bubbling Fluidized Bed
11 Combined Cycle

113
results are presented in Table 13. In the calculations it is assumed that the offshore wind
power capacity is 35 % of the total wind power capacity.
Table 13. Capital and O&M costs of nuclear power in the model and corresponding values for
wind and biomass capacity replacing it. The cost values are changed from United States dollars
to euros with an exchange value of 1 $ equals to 0.883 €.
Technology
(capacity)
Number of units with nominal capacity
Total capacity
[GW]
Total capital cost
[€]
Total O&M cost per year
[€]
Advanced nuclear
(2 234 MW)
7 15.6 76.36 bn. 1.29 bn.
Wind, onshore
(100 MW) 97 9.7 18.95 bn. 0.34 bn.
Wind, offshore
(400 MW) 13 5.2 28.61 bn. 0.34 bn.
Biomass, BFB12
(50 MW) 280 14.0 50.86 bn. 1.31 bn.
Biomass, CC13
(20 MW) 700 14.0 101.12 bn. 4.40 bn.
Figure 30 presents the total capital cost and O&M costs of the technologies presented in
Table 13. Onshore and offshore wind power costs are summed together with different
biomass technologies. Also the cases where nuclear generation is replaced with an
additional 33 GW of wind power and 24.5 GW of biomass are included in the figure.
The capacity values in the figure are the capacity additions required to the system in
12 Bubbling Fluidized Bed
13 Combined Cycle

114
order to produce about the same amount of energy as the Base scenario's system
produces, but without nuclear power.
Figure 34. Total capital cost and O&M costs in one year of different technology combinations.
Figure 30 and Table 13 clearly show that in order to produce the same amount of total
energy in the system of about 505 TWh, constructing and operating nuclear power is
cheaper than constructing enough wind and biomass power. Constructing and operating
biomass power plants are much more expensive than wind power plants but as the last
bar in the Figure 34 shows, nuclear power is still the cheapest option when comparing
purely total capital costs and operation & maintenance costs.
The challenge with nuclear power is the large unit sizes which require substantial initial
investments compared to other generation sources. This can change if and when SMRs
are made widely commercially available. SMRs have smaller unit sizes and can be

115
deployed in increments which respectively lowers the initial investments and capital
costs.
If the goal is to produce the same amount of energy without nuclear power that the
energy system in the Base scenario produces, some substantial additional investments
would be needed. Also the large amount of renewable energy may prove to be
problematic in respect of grid regulation. For example, wind power does not produce
any necessary inertia for the electric grid unlike the nuclear power.
6.2.3 Emission comparisons
Some greenhouse gas emission comparisons were made in chapter 6.1.3 between the
Base and Similar scenarios. Here, the emission comparisons are extended to include
also the Storage and Low Hydro scenarios as well as a case, where nuclear energy in the
Base scenario is replaced by fossil fuelled power generation. For nuclear energy, the
IEA's lifetime emission value of 15 gCO2-eq/kWh was used (IEA, 2014e). Emissions of
the energy systems in different scenarios were calculated using the values found in
Table 3. These values are lifetime emission values and here they are multiplied by the
energies generated from different sources during one year. Figure 35 shows the
emission comparisons between different scenarios.
Figure 35. Carbon dioxide equivalent lifetime emissions calculated over one year. All the
different cases have about the same total energy produced, which is 500 TWh.
116
The results are predictable; energy systems containing fossil fuelled power generate
much more CO2 equivalent emissions than the systems with no fossil fuelled power.
The last graph exceeds the scale as its emissions are over 90 million tonnes. The
Storage and the Low Hydro scenarios use energy storages which are not visible in
Figure 35. The Base scenario has around 7 010 000 t of total CO2 equivalent emissions,
the Storage scenario 6 040 000 t and the Low Hydro scenario around 8 090 000 t. If the
CO2 equivalent lifetime emissions related to the energy storages were also considered,
the Base scenario would most likely have the lowest total CO2 equivalent lifetime
emissions over the year 2050.
Nuclear energy produces relatively little greenhouse gas emissions and combined with
its reliability (high capacity factors) and favourable costs shown in Figure 34, nuclear
energy is an attractive option for low carbon power generation.

117
7 CONCLUSIONS
7.1 Scenario summaries and conclusions
All the future scenarios constructed in the model have working energy systems where
there are no deficits after all the different elements of the systems have made their
contributions. Conclusions regarding the different future scenarios and the roles of
different elements within these systems are presented in this chapter. A broad general
conclusion from the scenarios is that nuclear power provides stable and affordable base
load generation for the energy system without direct greenhouse gas emissions. Nuclear
power generally has high capacity factors and peak load hours and its high stable
electricity output helps to offset the intermittent profile of wind power. Nordic
hydropower is an excellent electricity generation source and the main element which
balances the fluctuating nature of wind power in the model, but most of the potential
hydropower capacity has already been built, at least in Finland, Denmark and Sweden.
7.1.1 Base scenario
The energy system in this scenario has four electricity generation sources: wind, hydro,
nuclear and biomass. The energy system is based on the IEA's CNS scenario, which
estimates that the Nordic countries will become net exporters of energy in the future.
Wind power is the only intermittent electricity source in the scenario as its electricity
output depends on the weather conditions. A portion of the hydropower is dispatchable
and is the only flexible electricity source in the Base scenario. The role of hydropower
is to offset the possible hourly deficits in the system. Nuclear and biomass provide the
base load to the system and their outputs are stable throughout the year. Biomass also
provides heat in the form of CHP production.
In chapter 6.2.2 the Base scenario's generation mix was modified to exclude nuclear
power and replace it with wind and biomass generation. Nuclear power can of course be
replaced by other electricity generation sources than the ones presented in this scenario,
but these were selected as the objective was to create a carbon free energy system using

118
renewables. Increasing the hydropower capacity was not an option as it was deemed that
it already was at least close to its maximum capacity at 65 GW while the IEA estimates
that there will be around 60 GW of hydropower capacity in the Nordic countries in 2050
(IEA, 2013). As chapter 6.2.2 showed, replacing nuclear power with wind and biomass
is not a trivial matter. Nuclear power generates more energy per installed capacity than
wind or biomass and is also cheaper to construct.
In chapter 6.2.1 a situation with zero generation from wind power was studied. The
Base system could handle this with dispatchable hydropower but as soon as yet another
generation source was removed, the system had deficits. This is an unrealistic situation,
but shows that all the different electricity generation sources serve a purpose in the
constructed energy system; they provide base load energy to the grid. Consumers
demand a certain amount of electricity and the energy system has to provide that.
The Base scenario and the modified Base scenario show that the nuclear power has an
important role as a base load providing generation source in the future energy system. It
provides the most energy per installed capacity and produces hardly any air pollutants
during its operation. As the Nordic countries have aspirations to achieve a carbon free
energy system in the future, nuclear energy can offer a significant contribution towards
this target.
7.1.2 Similar scenario
The energy system in this scenario has a similar generation mix in 2050 as the real life
Nordic energy system had in 2013 but the overall electricity generation and
consumption was scaled up to the levels that IEA anticipates in their Nordic Energy
Technology Perspectives publication. It is highly unlikely that the future energy system
will be the one described in this scenario. The purpose of this scenario was to show how
the Base scenario's energy system compares to the current one scaled up to 2050 in
regards to emissions of CO2 equivalent air pollutants. The Base scenario's energy
system performs favourably in this comparison. Figure 23 shows the CO2 equivalent
lifetime emissions calculated over one year in the Base and Similar scenarios. The Base

119
scenario has significantly lower emission levels. Values for the lifetime emission per
kWh of produced energy vary greatly depending on the source. Using the IEA lifetime
emission value for nuclear energy shows that the nuclear energy's lifetime emissions
calculated over the year 2050 are at the same level as wind, biomass and hydropower.
The Similar scenario shows that if the aim is to replace fossil fuelled generation with
low carbon technologies, nuclear energy is a viable option.. Nuclear energy provides
large-scale low carbon electricity at stable production costs and its electricity generation
is not dependant on the weather conditions.
7.1.3 Storage scenario
In this scenario, the Nordic energy system utilizes energy storage and this in turn allows
lower capacity values for different electricity generation sources. The total energy
produced in this scenario is less than in the Base scenario and the Nordic countries are
neither importers nor exporters of energy in the Storage scenario. The energy system is
more optimised to produce just the amount of energy that the consumers demand. The
total generating capacity is 36 GW less than in the Base scenario but the Storage
scenario has the following storage capacities: 1.5 GW short term, 5 GW long term input
and 10 GW long term output. These storages values ensure that the energy system has
no deficits during the year.
The energy system in this scenario still has a large amount of hydropower capacity
which handles the majority of hourly flexibility needs of the grid. Wind power is the
only intermittent generation source in the system while nuclear and biomass provide
base load power. This scenario was constructed in order to demonstrate that hydro,
wind, nuclear, biomass and energy storage can form a functioning energy system. The
introduction of energy storage lowers the amount of installed generating capacity and
also somewhat enhances the reliability of the grid; if some generating capacity were to
suddenly drop from the grid, the stored energy could temporarily replace it.

120
7.1.4 Low Hydro scenario
The Low Hydro scenario was constructed in order to demonstrate that the carbon free
energy system can function without a large amount of hydropower. The Nordic
countries benefit from the large amount of Norwegian hydropower available as
hydropower is an excellent generation source for balancing and controlling the electric
grid. If the energy system has large amount of hydropower capacity, the challenges that
arise from large shares of intermittent renewable generation, such as wind and solar, are
more easily mitigated. Also when water levels are adequate, hydropower is generally
one of the cheapest sources of electricity generation.
In the Low Hydro scenario, the capacity of hydropower was only 1 GW meaning that
the balancing and flexibility needs of the grid had to be satisfied with energy storage.
Wind, nuclear and biomass capacity values were chosen to generate around 500 TWh of
energy over the year, which is at the same level as in the Base scenario. If the energy
system had surplus energy in any given hour that energy was stored in long and short
term storage facilities. Energy stored in these facilities was utilized in the hours when
electricity generation from wind, nuclear and biomass was not enough to satisfy the
demand. The constructed energy system has no deficit hours during the year and shows
that a carbon free energy system can function without hydropower. Nuclear energy has
an important role in this system as it produces almost 49% of the total energy while its
generating capacity is only 33% of the total capacity connected to the grid. Replacing
this much nuclear generating capacity with other low carbon technologies, such as
wind, biomass and solar, would require significant investments.
7.2 Future research
The model constructed for this thesis is quite simple and has relatively few elements.
Smart grids, advanced supply side management, demand side management, electricity
trade with neighbouring countries and load following with nuclear power plants are just
some of the possible elements in the future energy system which are not directly
modelled here. In this thesis, only the power sector is considered. In the future energy

121
system, transport, heat, building and industry sectors are interlinked and they will
communicate with each other.
A wider variety of electricity generation sources could be added to the model and be
further separated and modelled individually, for example different rows for Swedish and
Finnish nuclear generation could be included. Load following nuclear power plants and
SMRs could be modelled as now the nuclear power in the model provides just base load
power to the grid.
The model does not take economic factors in to account. Capital and O&M costs
between nuclear, wind and biomass are briefly studied in the theory section of this
thesis, but not in the model itself. Electricity prices and market models affect how
different electricity generation sources and power plants are run. Taking these factors
into account, the generation mixes and merit order could be somewhat different.
Profitability and total costs of the future energy system would also be interesting topics
for future research.

122
8 SUMMARY
Currently environmentally friendly power generation and reduction of greenhouse gases
are popular and widely adopted targets. For example, The European Union has set
different CO2 emissions reduction and renewable generation targets for its member
states. The current energy system in place in the Nordic countries is already one of the
most carbon free globally, but there is room for improvement. Nordic countries have set
their ambitions and energy targets at CO2 emissions in the Nordic region being reduced
by 85% by 2050 compared to emission levels in 1990. In this thesis, the energy systems
of 2050 in different scenarios are 100% carbon free. In the Base scenario, the majority
of the energy is produced with renewables (hydro, wind, biomass) and around 24% by
nuclear power.
Nuclear power seems to have many attractive properties in regards to carbon free
energy system aspirations. Nuclear power is a proven technology and future reactor
designs promise even safer, more efficient and versatile reactors. During operation,
nuclear power plants have practically zero air pollutant emissions and their lifecycle
emissions are also much lower than emissions of fossil fuelled power plants. According
to some literature sources, lifecycle CO2 emissions of nuclear power plants are at the
same level as those of renewable generation. Construction and investment costs for new
nuclear are competitive with other low carbon technologies. The challenge with nuclear
power are the large unit sizes which require substantial initial investments compared to
other generation sources. Small modular reactors can alleviate this problem as they have
smaller unit sizes and can be deployed in increments.
Nuclear power enhances energy security because the uranium resources and fuel are
available from many different sources, both geographically and politically. Using
current nuclear technology, conventional uranium resources are expected to last up to
200 years at today's consumption rate. Nuclear power has clear advantages when
comparing its energy security to fossil fuelled power plants. Especially oil and natural
gas have limited supply sources. The oil crises of 1970s showed that it is important to

123
have various fuel supply sources and dependency on imported fuels from only a few
sources is a real problem. In addition to nuclear power's more diverse fuel supply
sources, nuclear energy also benefits from the very high energy density of uranium fuel.
Uranium fuel is much easier to stockpile than say, coal or oil.
Traditionally nuclear power has been a reliable form of electricity generation. Generally
nuclear power plants have high capacity factors, at least when compared to other low
carbon technologies. Most shutdowns are planned well in advance and generally they
are scheduled to take place when demand is expected to be lower than normal. Nuclear
power is a predictable and stable form of generation and this is emphasized when
compared to intermittent low carbon generation, namely wind and solar power.
Nuclear power offers grid management services which traditionally are not offered by
wind or solar power. These include primary and secondary frequency control,
predictable and controllable availability and rotating inertia. All of these are needed in
order to have a functioning energy system making an energy system with 100% share of
renewables hard to realise. As of now, these grid management services are performed
by fossil fuelled generation, nuclear generation and hydropower. The Nordic countries
are in the fortunate position that they can utilize the vast hydropower capacity of
Norway. Hydropower is an excellent form of power generation for regulating power and
for grid balancing purposes, but there is natural limit for hydropower capacity. As future
energy systems abandon the use of fossil fuelled generation, nuclear power can replace
it as a low carbon technology while maintaining grid stability.
The model and scenarios in this thesis show that it is possible to form a functioning,
100% carbon free energy system by combining GHG-free renewables and nuclear
energy. Wind power has large share of the total produced energy, but its generation
profile fluctuates. Production from wind turbines is highly dependent on the prevailing
weather conditions. The Nordic countries utilize a large hydropower capacity which
offers both stable electricity output and flexibility to the grid. Dispatchable hydropower
works as the major stabilising element in most of the scenarios. In the Low Hydro

124
scenario, this flexibility and stabilisation is achieved by using energy storage. Nuclear
power produces electricity evenly and predictably throughout the year. Biomass fuelled
CHP also produces electricity and heat evenly throughout the year. Their roles are
equally as important as hydropower is; however wind and hydropower capacities
cannot satisfy the consumption demand by themselves. Out of these generation sources,
nuclear power produces the most energy per installed capacity.

125
REFERENCES
Agora, 2014. The German Energiewende and its Climate Paradox. Agora
Energiewende. 038/04-A-2014/EN. Available at: http://www.agora-
energiewende.org/service/publications/
Carnegie et al., 2013. Utility Scale Energy Storage Systems. State Utility Forecasting
Group. Available at:
http://www.purdue.edu/discoverypark/energy/assets/pdfs/SUFG/publications/SUFG%2
0Energy%20Storage%20Report.pdf
CODE2, 2014.. D5.1 -Final Cogeneration Roadmap Member State: Finland.
Cogeneration Observatory and Dissemination Europe. Available at: http://www.code2-
project.eu/wp-content/uploads/Code-2-D5-1-Final-non-pilot-Roadmap-
Finland_final.pdf
DOE, 2013. Grid Energy Storage. U.S. Department of Energy. Available at:
http://energy.gov/sites/prod/files/2013/12/f5/Grid%20Energy%20Storage%20December
%202013.pdf
EERE, 2015. The Office of Energy Efficiency and Renewable Energy. U.S. Department
of Energy. [web page] [Accessed 23.3.2015] Available at:
http://energy.gov/eere/wind/wind-program
EIA, 2014. U.S. Energy Information Administration. [web page]. [Accessed 5.2.2015].
Available at: http://www.eia.gov/todayinenergy/detail.cfm?id=14611
ENS, 2015. European Nuclear Society. [web page]. [Accessed 5.2.2015.] Available at:
http://www.euronuclear.org/info/encyclopedia/f/fuelcomparison.htm
EURELECTRIC, 2003. Efficiency in Electricity Generation. Brussels: Union of the
Electricity Industry. Available at:
http://www.eurelectric.org/Download/Download.aspx?DocumentID=13549
http://www.code2-project.eu/wp-content/uploads/Code-2-D5-1-Final-non-pilot-Roadmap-Finland_final.pdf
http://www.code2-project.eu/wp-content/uploads/Code-2-D5-1-Final-non-pilot-Roadmap-Finland_final.pdf

126
Eurostat, 2015. Eurostat. Statistical of the European Union. [web page]. [Accessed
9.3.2015]. Available at: http://ec.europa.eu/eurostat/web/main/home
EWEA, 2015. European Wind Energy Association. [web page] [Accessed 23.3.2015]
Available at: http://www.ewea.org/
GIF, 2015. Generation IV International Forum. [web page]. [Accessed 4.2.2015].
Available at: https://www.gen-4.org/gif/jcms/c_9260/public
Goldberg, S. & Rosner, R., 2011. Nuclear Reactors: Generation to Generation.
American Academy of Arts and Sciences. ISBN 0-87724-090-6.
GTI, 2015. Germany Trade & Invest. [web page]. [Accessed 25.2.2015]. Available at:
http://www.gtai.de/GTAI/Navigation/EN/Invest/Industries/Smarter-business/Smart-
energy/power-to-gas,did=547396.html
Haarla, L., 2013. Sähköjärjestelmä antaa raamit voimalaitoksen koolle. Fingrid
Käyttövarmuuspäivä, December 2., Helsinki, Finland.
IAEA, 2012. Climate Change and Nuclear Power 2012. Vienna: International Atomic
Energy Agency (IAEA).
IAEA, 2014a. Nuclear Technology Review. Vienna: International Atomic Energy
Agency (IAEA).
IAEA, 2014b. Advances in Small Modular Reactor Technology Developments. Vienna:
International Atomic Energy Agency (IAEA). Available at:
http://www.iaea.org/NuclearPower/SMR/
Ibrahim et al., 2007. Energy storage systems - Characteristics and comparisons.
Renewable & Sustainable Energy Reviews, Volume 12, Issue 5, p. 1221-1250.

127
IEA, 2008. Integration of Demand Side Management, Distributed Generation,
Renewable Energy Sources and Energy Storages. IEA Demand-Side Management
Programme. Task XVII. Available at: http://www.ieadsm.org/Publications.aspx?ID=18
IEA, 2010a. Technology Roadmap: Nuclear Energy. OECD/IEA. Paris: IEA
Publishing. License: [http://www.iea.org/t&c/termsandconditions/]
IEA, 2010b. Energy Technology Perspectives 2010. OECD/IEA. Paris: IEA Publishing.
ISBN 978-92-64-08597-8. License: [http://www.iea.org/t&c/termsandconditions/]
IEA, 2012a. Energy Technology Perspectives 2012. OECD/IEA. Paris: IEA Publishing.
ISBN 978-92-64-17488-7. License: [http://www.iea.org/t&c/termsandconditions/]
IEA, 2012b. Status overview of torrefaction technologies. OECD/IEA. IEA Bioenergy
Task 32 report. December 2012, Enschede, Netherlands. Available at:
http://www.ieabcc.nl/publications/IEA_Bioenergy_T32_Torrefaction_review.pdf
IEA, 2012c. Energy Policies of IEA Countries - The United Kingdom 2012 Review.
OECD/IEA. Paris: IEA Publishing. ISBN 978-92-64-17086-5 License:
[http://www.iea.org/t&c/termsandconditions/]
IEA, 2013. Nordic Energy Technology Perspectives. OECD/IEA. Paris: IEA
Publishing. ISBN 978-82-92874-24-0. License:
[http://www.iea.org/t&c/termsandconditions/]
IEA, 2014a. Tracking Clean Energy Progress 2014. OECD/IEA. Paris: IEA Publishing.
License: [http://www.iea.org/t&c/termsandconditions/]
IEA, 2014b. Technology Roadmap: Energy Storage. OECD/IEA. Paris: IEA Publishing.
License: [http://www.iea.org/t&c/termsandconditions/]
IEA, 2014c. Energy Supply Security - Emergency Response of IEA Countries 2014.
OECD/IEA. Paris: IEA Publishing. License:
[http://www.iea.org/t&c/termsandconditions/]
128
IEA, 2014e. World Energy Outlook 2014. OECD/IEA. Paris: IEA Publishing. ISBN
978-92-64-20805-6. License: [http://www.iea.org/t&c/termsandconditions/]
IEA, 2015. Technology Roadmap: Nuclear Energy. OECD/IEA. Paris: IEA Publishing.
License: [http://www.iea.org/t&c/termsandconditions/]
Knab et al., 2009. Smart Grid: The Central Nervous System for Power Supply - New
Paradigms, New Challenges, New Services. Berlin: Technische Universität Berlin (TU
Berlin). Scientific Series of the Innovation Centre Energy, Volume 2. ISBN 978-3-
7983-2216-5. Available at: http://ssrn.com/abstract=1531655
Le Fevre, C., 2013. Gas storage in Great Britain. The Oxford Institute for Energy
Studies. University of Oxford. ISBN 978-1-907555-65-7
Lokhov, A., 2011. Load-following with nuclear power plants. OECD Nuclear Energy
Agency. NEA News 2011, No. 29.2.
Merle-Lucotte et al., 2013. Recommendations for a demonstrator of Molten Salt Fast
Reactor. Fast Reactor International Conference 2013, Paris, France. Available at:
http://www.iaea.org/NuclearPower/Downloadable/Meetings/2013/2013-03-04-03-07-
CF-NPTD/T1.5/T1.5.merlelucotte.pdf
NEA, 2010. The Security of Energy Supply and the Contribution of Nuclear Energy.
OECD Nuclear Energy Agency. ISBN 978-92-64-09634-9
NEA, 2011. Technical and Economic Aspects of Load Following with Nuclear Power
Plants. OECD Nuclear Energy Agency.
NEA, 2012. Nuclear Energy and Renewables - System Effects in Low carbon
Electricity Systems. OECD Nuclear Energy Agency. ISBN 978-92-64-18851-8.
NordREG, 2014. Nordic Market Report 2014. Nordic Energy Regulators. Available at:
http://www.nordicenergyregulators.org/publications/

129
NRC, 2012. United States Nuclear Regulatory Commission. [web page]. [Accessed
28.1.2015]. Available at: http://www.nrc.gov/reading-rm/basic-ref/teachers.html
Oka et al., 2014. Nuclear Reactor Design. Tokyo: The University of Tokyo. ISBN 978-
4-431-54898-0 (eBook).
Päivinen, R., 2012. Tuotantorakenteen muutos haaste sähköjärjestelmälle. Fingrid
Käyttövarmuuspäivä, December 3., Helsinki, Finland.
Princiotta et al., 2011. Global Climate Change - The Technology Challenge. Advances
in Global Change Research, Volume 38. Springer. e-ISBN 978-90-781-3153-2
PRIS, 2015. Power Reactor Information System, IAEA. [web page]. [Accessed
4.2.2015]. Available at: http://www.iaea.org/pris/home.aspx
Rosenthal M.W, 2009. An account of Oak Ridge National Laboratory’s thirteen nuclear
reactors. Oak Ridge: Oak Ridge National Laboratory. ORNL/TM- 2009/181. [web
document] [accessed 13.3.2015] Available at:
http://info.ornl.gov/sites/publications/files/Pub20808.pdf
Sandia, 2013. DOE/EPRI 2013 Electricity Storage Handbook in Collaboration with
NRECA. Albuquerque: Sandia National Laboratories. Available at:
http://energystorage.org/system/files/resources/sand2013-5131.pdf
Sovacool, B., 2008. Valuing the greenhouse gas emissions from nuclear power: A
critical survey. Energy Policy 2008, Volume 36, p. 2950-2963.
Storm van Leeuwen, J. W., 2012. Nuclear power, energy security and CO2 emission.
Cedata Consultancy. [web document]. [Accessed 28.1.2015]. Available at:
http://www.stormsmith.nl/reports.html
Tielens, P. & Van Hertem, D., 2012. Grid Inertia and Frequency Control in Power
Systems with High Penetration of Renewables. Young Researchers Symposium in
Electrical Power Engineering edition 6, April 16 -17, Delft, The Netherlands.

130
WNA, 2015. World Nuclear Association. [web page]. [Accessed 28.1.2015]. Available
at: http://www.world-nuclear.org/
WNN, 2014. World Nuclear News. [online news article]. [Accessed 16.2.2015].
Available at: http://www.world-nuclear-news.org/C-Funding-for-mPower-reduced-
1404141.html
WNN, 2015. World Nuclear News. [online news article]. [Accessed 16.3.2015].
Available at: http://www.world-nuclear-news.org/RS-US-EPR-plans-suspended-
0603157.html
Zhitao, L. & Jihong, F., 2013. Technology readiness assessment of Small Modular
Reactor (SMR) designs. Progress in Nuclear Energy 2014, Volume 70, p. 20-28.
Zrodnikov et al., 2011. SVBR-100 module-type fast reactor of the IV generation for
regional power industry. Journal of Nuclear Materials 2011, Volume 415, p. 237-244.
ÅF, 2012. Mistä lisäjoustoa sähköjärjestelmään - loppuraportti. [web report]. ÅF-
Consult Ltd. Available at: http://energia.fi/en/node/2146

131
APPENDIX 1. THE GENERALISED SUPPLY AND DEMAND
INDEX
Figure A1. The basic structure of the SSDI.
The Simplified Supply and Demand Index in this thesis is from the Nuclear Energy Agency's
(NEA) publications. The SSDI has three weighted contributions: energy demand, energy
infrastructure and energy supply. Each of these contributions have different weights based on
the perceived vulnerability to a nation's energy security. The given weights take into account:
the degree of diversity and supply origin of different energy carriers in the nation
the efficiency of energy consumption
the state of the electricity generation infrastructure.