French Military Victories? Jonathan Douglas Museums, Libraries & Archives Council.

The Role of Museums, Libraries, Archives and Local Area Agreements
Final Report, April 2009
DC Research Ltd

Museums, Libraries and Archives Council Grosvenor House 14 Bennetts Hill Birmingham B2 5RS
www.mla.gov.uk © MLA 2009 Leading strategically, we promote best practice in museums, libraries and archives, to inspire innovative, integrated and sustainable services for all. DC Research Ltd is an economics, evaluation and research consultancy practice, operating across the UK from bases in the Midlands and the North West. For more information please visit: www.dcresearch.co.uk A CIP catalogue record of this publication is available from the British Library ISBN Select text and type NUMBER here MLA is not responsible for views expressed by consultants or those cited from other sources.

CONTENTS
Executive Summary 1
1 Introduction 5
2 Approach and Method for the Research 8
3. Recognition of the MLA Sector in Key Local Strategies 10
4. MLA Sector Involvement in LAA / LSP Structures 14
5. Recognition of MLA Contribution to LAA Priorities 21
6. Barriers, Challenges and Potential Solutions 30
7. Conclusions 33
Appendix 1: List of Consultees 38
Appendix 2: Survey Results 40

The Role of Museums, Libraries, Archives and Local Area Agreements
1
Executive Summary
Aims of Research
The Museums, Libraries and Archives (MLA) Council commissioned DC Research in late 2008 to carry out a research study into the role of the MLA sector in Local Area Agreements (LAAs). The aim of the study was to assess the place of the MLA sector, and where relevant the wider cultural sector, in the 2008 LAAs and to identify the contribution of the sector to the outcomes of these LAAs.
The key questions to be addressed were:
� What does the uptake of National Indicators 9 and 10 mean in terms of the sector’s position within LAAs?
� To what extent is the sector, if not directly represented in LAAs through the inclusion of National Indicators 9, 10 and 110, contributing to the delivery of other priority outcomes in LAAs? Is it doing so in a way that effectively embeds it in local delivery frameworks?
� What barriers exist to effective sectoral engagement with LAAs?
Background
In mid-2008 upper tier (i.e. unitary and county) Local Authorities in England negotiated new Local Area Agreements with their respective Government Offices. LAAs set out the priorities for a local area agreed between central government and a local area. LAAs are, in effect, delivery plans for an area’s Sustainable Community Strategy (SCS) over the three years 2008 to 2011.
LAAs provide the basis for monitoring performance against The New Performance Framework for Local Authorities and Local Authority Partnerships: Single Set of National Indicators. Museums, libraries and archives contribute to a range of the outcomes represented by these National Indicators (NIs) through the services they deliver. Of particular interest are the three NIs that are specifically relevant to this study:
� NI 9: Use of public libraries
� NI 10: Visits to museums or galleries
� NI 110: Young people's participation in positive activities.
Recognition of MLA in Key Local Strategies
A desk-based review of evidence involved carrying out an analysis of key documents (namely the Local Area Agreement and Sustainable Community Strategy) for each Local Authority area to consider the extent to which the key national indicators (NI9, NI10, and (where relevant) NI110) are adopted in LAAs, as well as considering the wider role, scale of involvement, and level of engagement of the MLA/cultural sector in LAA/SCS/LSP mechanisms and structures:

The Role of Museums, Libraries, Archives and Local Area Agreements
2
� Libraries: 9 Local Authorities have NI9 as one of their 35 key indicators, and an additional 11 Authorities explicitly include NI9 within their LAA but not as one of the 35 key indicators. Therefore, a total of 20 (13%) of LAAs explicitly refer to NI9 in their LAA. Beyond the inclusion of indicators, 43 areas (29%) make reference in their LAA and/or SCS to activities and/or delivery of library services, whilst 57 areas (38%) have an aim, strategic objective or priority that is about, or encompasses libraries.
� Museums: 2 Local Authorities have NI10 as one of their 35 key indicators, and an additional 5 authorities explicitly include NI10 within their LAA but not as one of the 35 key indicators. Therefore, a total of 7 (4.7%) of LAAs explicitly refer to NI10 in their LAA. Beyond the inclusion of indicators, 18 areas (12%) make reference in their LAA and/or SCS to activities and/or delivery of museums services, whilst 30 areas (20%) have an aim, strategic objective or priority that is about, or encompasses museums.
� Compared to museums and libraries, archives are not well represented within LAAs/SCSs. Nevertheless, a total of 25 areas (16.7%) make at least one reference to archives within their LAA and/or SCS.
MLA Sector Involvement in LSP / LAA Structures
Regarding involvement in partnership processes, two thirds of the survey respondents reported some sector involvement in LAA / LSP structures, although engagement ranged from formal thematic cultural partnerships, through cultural forums sitting outside the LSP that link into formal thematic groups (such as Children & Young People, Safer and / or Stronger), to MLA/culture as a cross cutting theme. In terms of other LSP thematic groups, the MLA sector was most strongly represented on Stronger Communities and Children & Young People thematic groups.
Organisational profile was a key factor supporting sector involvement as strong LSP engagement tended to follow on from high profile for the sector in the Local Authority. The other key factor was sector credibility, with LAA managers reporting that they needed to be confident as to the case being made, and the capability of the sector to deliver – a key confidence factor in those areas that selected NI9 (and NI10).
In those areas that were less well engaged in partnership processes, the sector tended to not be regarded as a key priority, and was less able to demonstrate or evidence sector contribution to priorities. As a result there tended to be a lack of profile for the MLA sector and culture more widely, and a paucity of cultural advocates around the key decision making tables.
Libraries tended to be better integrated than museums in LAA processes and thematic groups. This is a result of the mandatory presence of a libraries service in every upper tier Local Authority, a higher number of library facilities (and natural footfall), and the delivery of a broader range of services to communities in comparison to museums. Museums tended to be engaged with LAA processes at a comparatively later stage, with a number of consultees reporting the selection of the 35 National Indicators as a ‘fait accompli’ by the time they were consulted.

The Role of Museums, Libraries, Archives and Local Area Agreements
3
MLA Contribution to LAA Priorities
In terms of MLA sector contribution to LAA priorities, three quarters of survey respondents felt the sector is recognised as contributing towards local priorities and/or outcomes, with Children & Young People and Stronger Communities being the themes with the greatest recognised sector contribution. Furthermore, two thirds feel that the sector’s contribution towards National Indicators is recognised. It is interesting to note that LAA lead officer views of the contribution of the sector to LAA priorities is higher than that of sector representatives themselves.
Barriers and challenges to the recognition of sector contribution to LAA priorities mirror those of partnership engagement – namely, lower levels of priority and profile for the sector (and culture more generally) amongst key local decision makers, barriers in evidencing impact, and issues in terms of advocacy and the lack of a champion for the sector at key decision making forums.
In terms of the local selection of National Indicators, sector involvement in the early thematic consultations was regarded as critical, with museums in particular typically only engaging with this process after key decisions had been made (and therefore limiting the scope for the inclusion of NI10). Nevertheless, many respondents reported that no consideration was given to the inclusion of NI9 and NI10 (58% and 79% respectively). A number of areas made a tactical decision not to select these indicators, preferring to use either related NI’s (typically NI110) or rely on local indicators along with evidence showing sector contribution to wider priorities. Nevertheless, not being engaged in these initial LAA discussions compromised the ability of the sector to exert influence on partnership priorities.
NI110 was advocated over the more cultural specific National Indicators by a number of areas, as it was viewed as a better partnership indicator (i.e. less Local Authority led), and represented a useful way, in the absence of a generic cultural indicator, of avoiding the need to make a choice between cultural sector services. NI110 is a useful indicator for the sector in making links between schools, young people and culture, and provides the sector with the ability to balance profile and collaborative opportunities of both museums and libraries, albeit at the risk of narrowing the potential target group.
Of those areas that selected NI9 or NI10, the key selection success factors were often driven by the LSP rather than the sector influencing partnership decision makers. There is little evidence to suggest that any area included NI9 or NI10 into their LAA solely as a result of sector advocacy - strategic decisions about inclusion were often made at an early stage in the selection process and did not waver.
There is evidence that the sector is beginning to use LAA terminology and frameworks in business planning processes. This includes making the links between sector activity and LAA priorities, with front line staff understanding the LAA priority led approach (which is seen as being more accessible than previous target/indicator regimes). This enables the sector to better engage with LAA processes in advocating and evidencing the role and contribution of museums, libraries and archives.
Barriers, Challenges and Success Factors to MLA Engagement with LAAs
The key barriers and challenges, and the successful engagement factors for the sector in terms of LAA and partnership processes can be summarised as follows:

The Role of Museums, Libraries, Archives and Local Area Agreements
4
Successful engagement factors
� A well established ‘ethos’ of culture, valued by key senior partners
� Strong evidence and advocacy skills of professionals
� Ability to identify good practice and turn it into marketable evidence
� A focus on engagement via approaches designed to support community cohesion/development
� The ability to develop more collaborative approaches
� Reputation for, and ability to, deliver
� The level of influence of cultural partnership/key cultural partners
Barriers and challenges
� Budgetary pressure
� Lack of appreciation of the sector offer
� Lack of clear tangible evidence about impact sector services has on LAA priorities
� Lack of cultural champion at executive level
� Perceptions that sector lacks strong commitment to achieving priorities other than its own
� Changing skill sets of modern sector professionals
Solutions and Improvement Support
Potential solutions in terms of support to the sector should focus on advocacy, improving the evidence base in terms of the impact of the sector on wider LAA priorities in local areas, and training and staff development to ensure sector professionals are well equipped to operate in what is a dynamic and competitive modern partnership arena.
Solutions can be targeted at distinct groups as follows:
� MLA sector services whose LAA has selected NI9 / NI10
� MLA sector services well embedded in LSPs, that need to continue to demonstrated contributions to wider LAA agendas
� MLA sector services that are not well engaged in LAA processes
Determining which of the above groups should be prioritised over the short to medium term is not straightforward. There currently seems to be a focus primarily towards supporting those that have selected NI9 and/or NI10 as one of the priority indicators within their LAA – with the underpinning rationale for this relating to the need to show success by 2011 for these specific areas to help to enhance the achievement and contribution of the sector to LAA priorities.
However, given that the wider contributions of the sector to other LAA priorities has been emphasised during this study by many of the areas visited, there is also merit in offering support between now and 2011 to those areas that are well embedded in LSPs, and that need to continue to demonstrate contributions to wider LAA priorities. Helping these areas will ensure that the contributions of the sector to wider LAA agendas and priorities is evidenced and advocated for, and as such helps to show the role and contribution of the sector beyond NI9/NI10. Providing support to this group within the sector would help to ensure that the evidence of impact, advocacy and training/staff development issues highlighted align to LAA partner agendas irrespective of which precise cultural indicators are included in the future.

The Role of Museums, Libraries, Archives and Local Area Agreements
5
1 Introduction
1.1 The Museums, Libraries and Archives (MLA) Council commissioned DC Research in November 2008 to carry out a research study into the role of the MLA sector in Local Area Agreements (LAAs). The aim of the study was to assess the place of the MLA sector, and where relevant the wider cultural sector, in the 2008 LAAs and to identify the contribution of the sector to the outcomes of these LAAs. The findings of the study will help to inform a programme of improvement support that MLA will be putting in place for museums, libraries and archives.
1.2 The aim of the study, as outlined in the original project brief, was to undertake research into the inclusion of the museum, library and archive sector and its contribution to the delivery of outcomes for communities in the 2008 LAAs. The questions to be addressed were:
� What does the uptake of National Indicators 9 and 10 mean in terms of the sector’s position within LAAs?
� To what extent is the sector, if not directly represented in LAAs through the inclusion of National Indicators 9, 10 and 110, contributing to the delivery of other priority outcomes in LAAs? Is it doing so in a way that effectively embeds it in local delivery frameworks?
� What barriers exist to effective sectoral engagement with LAAs?
1.3 This final report (produced in early April 2009) is structured as follows:
� The remainder of this section (Section 1) provides a brief summary of the relevant policy context for this study in terms of Local Area Agreements and Sustainable Community Strategies.
� Section 2 provides an overview of the approach and methodology adopted for the study.
� Section 3 presents the findings of the desk research for the study, focusing on the review of the Local Area Agreements (LAAs) and Sustainable Community Strategies (SCSs) carried out to assess the scale of recognition of the MLA sector within these key documents.
� Section 4 considers the extent to which the MLA sector is involved in LAA and Local Strategic Partnership (LSP) structures generally, and also assesses which LAA themes the sector is better involved with, as well as comparing strategic and delivery level involvement.
� Section 5 focuses on the level of recognition of the sector in terms of its contribution to LAA (and SCS) priorities, covering the inclusion of MLA specific national indicators in LAAs, but also the contributions of the sector to wider LAA delivery.
� Section 6 provides an overview of both the key barriers that exist to effective sectoral engagement with LAAs and also presents some of the key steps that both LAA representatives and sector professionals believe are required to address these barriers.
� Finally, Section 7 provides a summary of the findings of the study, and the recommendations of the research about the types of support and target groups for such support, based on these findings.
The Role of Museums, Libraries, Archives and Local Area Agreements
6
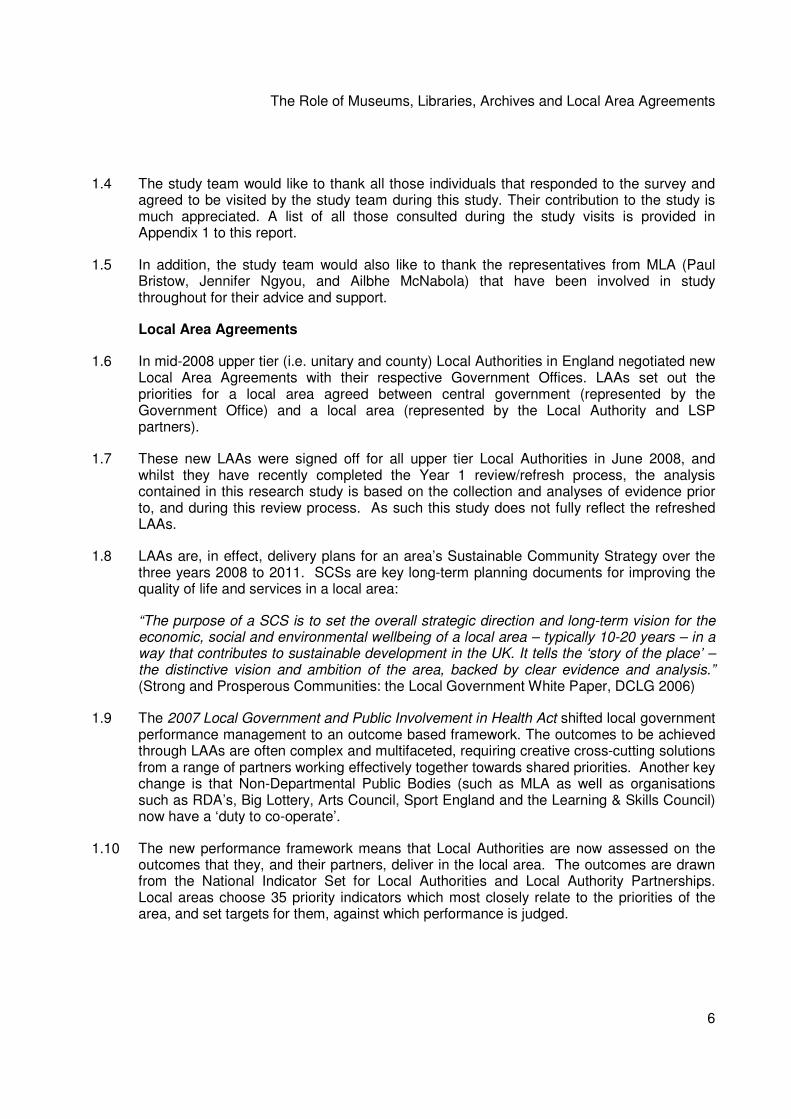
1.4 The study team would like to thank all those individuals that responded to the survey and agreed to be visited by the study team during this study. Their contribution to the study is much appreciated. A list of all those consulted during the study visits is provided in Appendix 1 to this report.
1.5 In addition, the study team would also like to thank the representatives from MLA (Paul Bristow, Jennifer Ngyou, and Ailbhe McNabola) that have been involved in study throughout for their advice and support.
Local Area Agreements
1.6 In mid-2008 upper tier (i.e. unitary and county) Local Authorities in England negotiated new Local Area Agreements with their respective Government Offices. LAAs set out the priorities for a local area agreed between central government (represented by the Government Office) and a local area (represented by the Local Authority and LSP partners).
1.7 These new LAAs were signed off for all upper tier Local Authorities in June 2008, and whilst they have recently completed the Year 1 review/refresh process, the analysis contained in this research study is based on the collection and analyses of evidence prior to, and during this review process. As such this study does not fully reflect the refreshed LAAs.
1.8 LAAs are, in effect, delivery plans for an area’s Sustainable Community Strategy over the three years 2008 to 2011. SCSs are key long-term planning documents for improving the quality of life and services in a local area:
“The purpose of a SCS is to set the overall strategic direction and long-term vision for the economic, social and environmental wellbeing of a local area – typically 10-20 years – in a way that contributes to sustainable development in the UK. It tells the ‘story of the place’ – the distinctive vision and ambition of the area, backed by clear evidence and analysis.” (Strong and Prosperous Communities: the Local Government White Paper, DCLG 2006)
1.9 The 2007 Local Government and Public Involvement in Health Act shifted local government performance management to an outcome based framework. The outcomes to be achieved through LAAs are often complex and multifaceted, requiring creative cross-cutting solutions from a range of partners working effectively together towards shared priorities. Another key change is that Non-Departmental Public Bodies (such as MLA as well as organisations such as RDA’s, Big Lottery, Arts Council, Sport England and the Learning & Skills Council) now have a ‘duty to co-operate’.
1.10 The new performance framework means that Local Authorities are now assessed on the outcomes that they, and their partners, deliver in the local area. The outcomes are drawn from the National Indicator Set for Local Authorities and Local Authority Partnerships. Local areas choose 35 priority indicators which most closely relate to the priorities of the area, and set targets for them, against which performance is judged.

The Role of Museums, Libraries, Archives and Local Area Agreements
7
1.11 Local Area Agreements provide the basis for monitoring performance against The New Performance Framework for Local Authorities and Local Authority Partnerships: Single Set of National Indicators. Museums, libraries and archives contribute to a range of the outcomes represented by these National Indicators (NIs) through the services they deliver. Of particular interest are three specific NIs that are specifically relevant to this study:
� NI 9: Use of public libraries
� NI 10: Visits to museums or galleries
� NI 110: Young people's participation in positive activities.
1.12 Whilst these three NIs are given due consideration throughout this study, the research seeks to develop a more detailed and more rounded understanding of the role of the MLA sector in all aspects of LAAs, including, but not limited to these three NIs.
Terminology
Please note, for simplicity, throughout this report we use the following terms:
� MLA sector – to mean the museums, libraries and archives services collectively, and any reference to ‘the sector’ means the MLA sector
� MLA – to mean the organisation – i.e. the Museums, Libraries and Archives Council
� LAA – Local Area Agreement
� SCS – Sustainable Community Strategy
� LSP – Local Strategic Partnership
� NIs – National Indicators.

The Role of Museums, Libraries, Archives and Local Area Agreements
8
2 Approach and Method for the Research
2.1 The approach and method adopted for this study is summarised in the figure below. The approach was a four stage approach, covering early inception and scoping work; desk based review and assessment; consultations and visits to a sample of Local Authority areas; and reporting and presenting the findings at various stages of the study.Figure 2.1: Approach and Methodology – Summary of Process
2.2 Stage 1 was carried out during December 2008 and January 2009 and involved meeting with MLA to agree the scope and method for the study, a preliminary review of the key documents, and face to face consultations with representatives from key sectoral representative organisations (i.e. Society of Chief Librarians; Association of Chief Archivists in Local Government; Museums Association; and the Renaissance hub museums).
2.3 Stage 2 involved carrying out a detailed review of the key documentation (namely the 2008 Local Area Agreement and the most recently available Sustainable Community Strategy) for each Local Authority area.
Inception Meeting
Stage 2 – Desk Based Review and Assessment
Stage 1 - Inception and Scoping Work
Scoping of Existing Evidence
Consultations with key
sector groups
Detailed evidence
review
Web based survey of all
150 LAA
Stage 3 – Consultations and Visits
Visit to 18 LAA areas
Stage 4 – Reporting and Presenting
Scoping Report
Final Report Draft Final Report
Present Draft Report

The Role of Museums, Libraries, Archives and Local Area Agreements
9
2.4 Stage 2 also involved a survey of key individuals (i.e. LAA lead officers1/key partners and sector professionals from museums, libraries and archives) within all the Local Authority areas that signed off a Local Area Agreement in 2008. This was a web-based survey, which was distributed by a variety of means (direct emails; emails via professional associations; postings on bulletin boards; press releases on key organisation websites and so on). A total of 225 replies were received from a mix of both LAA representatives and sector representatives, and Table 2.1 below summarises the responses by type of respondent.
Table 2.1: Which of the following best describes your role?
Frequency Count
MLA/cultural sector professional 67.6% 152
LAA lead officer (or equivalent) 27.1% 61 LAA partner organization 5.3% 12 Source: DC Research Survey, n=225
2.5 In addition, an assessment of replies by Local Authority area has confirmed that at least one reply have been received from more than 100 of the 150 areas that signed off a Local Area Agreement in 2008. Therefore, in terms of geographic coverage of survey replies, this equates to around two-thirds of all Local Area Agreement areas.
2.6 Stage 3 involved the study team visiting a sample of Local Authority areas to meet with key sector and LAA representatives to carry out face to face consultations (using a combination of both one-to-one and group discussion sessions). The table below summarises the locations that were selected, whilst Appendix 1 lists the individuals that have been consulted during the visits.
Table 2.2: List of Local Authority Areas Visited
� Barnsley* � Birmingham � Cheshire � Staffordshire � Derby* � Derbyshire* � Gateshead � Greenwich* � Hartlepool*
� Herefordshire* � Manchester � Reading* � Rutland* � Sheffield � Swindon � Thurrock* � York
Note: those marked * have selected NI9 and/or NI10 as one of their key LAA National Indicators. The only Local Authority that has selected NI9/NI10 that was not involved in the visits was West Berkshire who were approached but declined to participate in this study.
1 The designation of ‘LAA lead officers’ relates to those local authority officers that are involved in/have corporate responsibility for the Local Area Agreement in their local authority area.

The Role of Museums, Libraries, Archives and Local Area Agreements
10
3. Recognition of the MLA Sector in Key Local Strategies
3.1 This section provides the first element of the analysis for the research study by looking at the extent to which the MLA sector is explicitly recognised in Local Area Agreement (LAA) and Sustainable Community Strategy (SCS) documents in the areas that signed off their LAA in mid-2008.
3.2 This has been achieved by carrying out a review of the key documentation (namely the 2008 Local Area Agreement and the most recently available Sustainable Community Strategy) for each of the 150 Local Authority areas.
3.3 The original source for many of the LAAs used in the analysis was the IDeA website (http://www.idea.gov.uk/idk/core/page.do?pageId=8399555), but an issue that came to light in the scoping work was that the abstracts/copies of LAAs available via the IDeA website were very much focused on the key indicators that had been selected in the 2008 LAAs. As such, some of the wider contextual information for these LAAs was not available from this source. The study team has therefore sourced (where available) the complete LAA documents for each of the 150 Local Authority areas, alongside the most recent (complete) Sustainable Community Strategy. Whilst there are some Community Strategies that are from earlier years, the majority are from 2007 or 2008. Therefore, they either directly relate to, or were produced in parallel to the development of, the 2008 LAAs.
3.4 Considered alongside the findings from the surveys and visits, this document review helps to provide a detailed understanding of the role and position of the MLA sector in the 2008 LAAs.
3.5 The desk-based detailed evidence review involved carrying out a thorough document review to consider the extent to which the key national indicators (NI9, NI10, and (where relevant) NI110) are adopted in LAAs, as well as considering the wider role, scale of involvement, and level of engagement of the MLA/cultural sector in LAA/SCS/LSP mechanisms and structures.
3.6 Given the scale of document to be reviewed (in excess of 300, many of which are substantial in size) the document review carried out contextual analysis focusing on key terms, namely the following four terms:
� Librar
� Museum
� Archiv
� Cultur2.
2 Whilst ‘cultur’ was originally planned to be included in the analysis, the term is used in a multiplicity of ways throughout
LAAs and SCSs often in very general terms unrelated to culture in the context of this study. As such, any assessment would not provide any useful evidence for this study, and has not been included in this report.
The Role of Museums, Libraries, Archives and Local Area Agreements
11
3.7 These terms were used to capture all references in both LAAs and SCSs to each of these terms (e.g. searching for librar captures library, libraries, librarian, librarians etc.). The identification of these terms in either document (LAA or SCS) for each Local Authority is then categorised under one of the following headings:
� National indicator – where the document (LAA/SCS) identifies a National Indicator (i.e. NI9 or NI 10)
� Other indicator – where the document (LAA/SCS) identifies any other indicator/measure related to the above terms
� Activity/delivery – where the document (LAA/SCS) identifies any activity or service delivery related to the above terms
� Aim/strategic objective – where the document (LAA/SCS) identifies any higher level aims and/or strategic objectives related to the above terms
� Other reference – where the document (LAA/SCS) identifies any other reference (not captured above) related to the above terms.
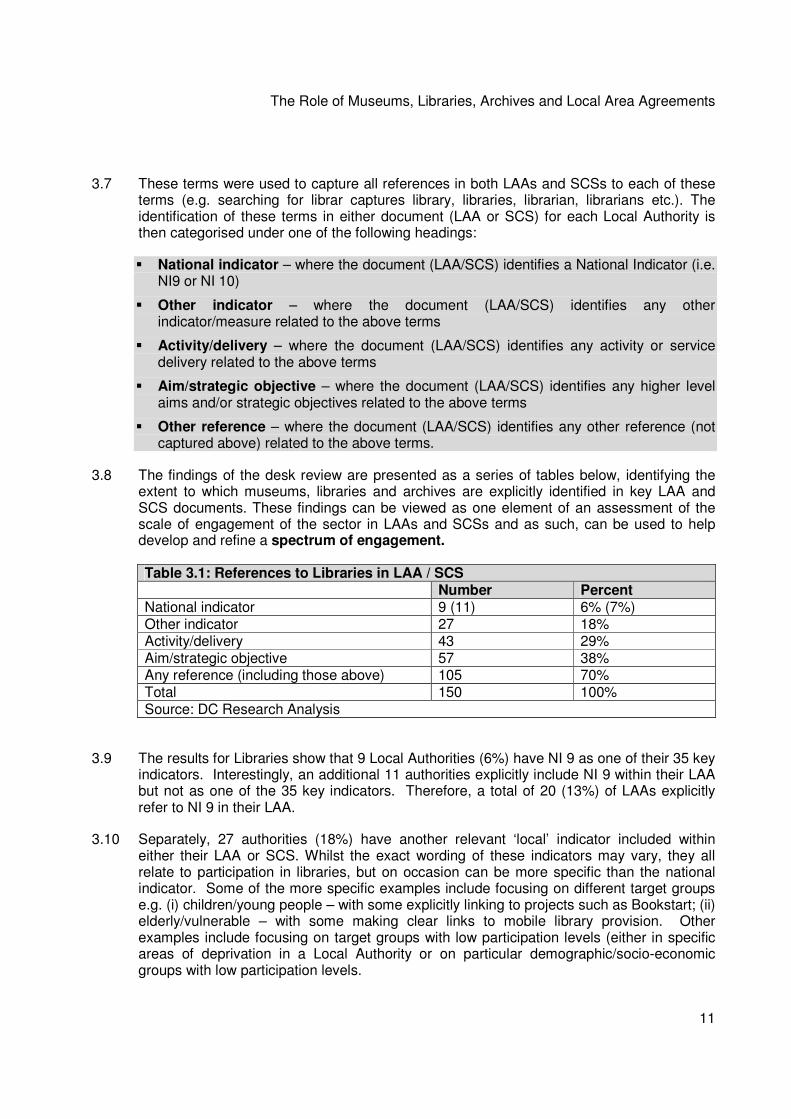
3.8 The findings of the desk review are presented as a series of tables below, identifying the extent to which museums, libraries and archives are explicitly identified in key LAA and SCS documents. These findings can be viewed as one element of an assessment of the scale of engagement of the sector in LAAs and SCSs and as such, can be used to help develop and refine a spectrum of engagement.
Table 3.1: References to Libraries in LAA / SCS Number Percent National indicator 9 (11) 6% (7%) Other indicator 27 18% Activity/delivery 43 29% Aim/strategic objective 57 38% Any reference (including those above) 105 70% Total 150 100% Source: DC Research Analysis
3.9 The results for Libraries show that 9 Local Authorities (6%) have NI 9 as one of their 35 key indicators. Interestingly, an additional 11 authorities explicitly include NI 9 within their LAA but not as one of the 35 key indicators. Therefore, a total of 20 (13%) of LAAs explicitly refer to NI 9 in their LAA.
3.10 Separately, 27 authorities (18%) have another relevant ‘local’ indicator included within either their LAA or SCS. Whilst the exact wording of these indicators may vary, they all relate to participation in libraries, but on occasion can be more specific than the national indicator. Some of the more specific examples include focusing on different target groups e.g. (i) children/young people – with some explicitly linking to projects such as Bookstart; (ii) elderly/vulnerable – with some making clear links to mobile library provision. Other examples include focusing on target groups with low participation levels (either in specific areas of deprivation in a Local Authority or on particular demographic/socio-economic groups with low participation levels.
The Role of Museums, Libraries, Archives and Local Area Agreements
12
3.11 On other occasions, participation in libraries is encompassed in a wider local indicator that captures participation in culture (which also includes museums and archives) and can also include arts and/or sports as well.
3.12 Beyond the inclusion of indicators, 43 areas (29%) make reference in their LAA and/or SCS to activities and/or delivery of library services, whilst 57 areas (38%) have an aim, strategic objective or priority that is about, or encompasses, libraries.
3.13 To provide an overall picture, a total of 105 areas (70%) make at least one reference to libraries (including all the above references) within their LAA and/or SCS. This makes libraries the most explicitly recognised service within the MLA sector in LAAs/SCSs.
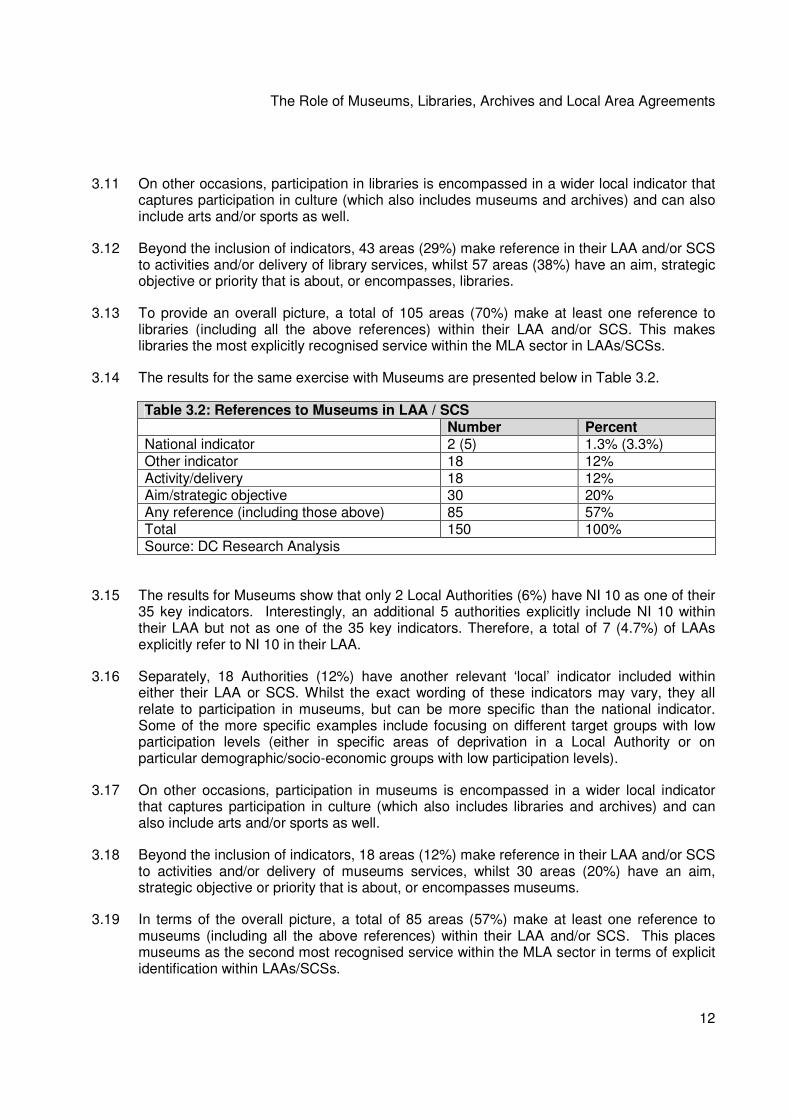
3.14 The results for the same exercise with Museums are presented below in Table 3.2.
Table 3.2: References to Museums in LAA / SCS Number Percent National indicator 2 (5) 1.3% (3.3%) Other indicator 18 12% Activity/delivery 18 12% Aim/strategic objective 30 20% Any reference (including those above) 85 57% Total 150 100% Source: DC Research Analysis
3.15 The results for Museums show that only 2 Local Authorities (6%) have NI 10 as one of their 35 key indicators. Interestingly, an additional 5 authorities explicitly include NI 10 within their LAA but not as one of the 35 key indicators. Therefore, a total of 7 (4.7%) of LAAs explicitly refer to NI 10 in their LAA.
3.16 Separately, 18 Authorities (12%) have another relevant ‘local’ indicator included within either their LAA or SCS. Whilst the exact wording of these indicators may vary, they all relate to participation in museums, but can be more specific than the national indicator. Some of the more specific examples include focusing on different target groups with low participation levels (either in specific areas of deprivation in a Local Authority or on particular demographic/socio-economic groups with low participation levels).
3.17 On other occasions, participation in museums is encompassed in a wider local indicator that captures participation in culture (which also includes libraries and archives) and can also include arts and/or sports as well.
3.18 Beyond the inclusion of indicators, 18 areas (12%) make reference in their LAA and/or SCS to activities and/or delivery of museums services, whilst 30 areas (20%) have an aim, strategic objective or priority that is about, or encompasses museums.
3.19 In terms of the overall picture, a total of 85 areas (57%) make at least one reference to museums (including all the above references) within their LAA and/or SCS. This places museums as the second most recognised service within the MLA sector in terms of explicit identification within LAAs/SCSs.

The Role of Museums, Libraries, Archives and Local Area Agreements
13
3.20 Finally, the results for the same exercise with Archives are presented below in Table 3.3.
Table 3.3: References to Archives in LAA / SCS Number Percent
National indicator N/A - Other indicator 1 0.7% Activity/delivery 2 1.3% Aim/strategic objective 4 2.7% Any reference (including those above) 25 16.7% Total 150 100% Source: DC Research Analysis
3.21 Across the analysis, the results for Archives (as was expected based on previous consultations and the early scoping work) are substantially lower than for the other two services within the MLA sector. Archives does not have its own specific National Indicator, and out of all LAAs/SCSs reviewed, only one includes a ‘local’ indicator that explicitly encompasses Archives (namely Nottinghamshire, which has a local cultural enrichment indicator - “a composite measure of active participation and quality of experience in: arts, libraries, archives, museums and galleries and conservation and green-space, for all age groups”).
3.22 Beyond the inclusion of indicators, only 2 areas (1.3%) make an explicit reference in their LAA and/or SCS to activities and/or delivery of archives services, whilst 4 areas (2.7%) have an aim, strategic objective or priority that encompasses archives.
3.23 In terms of the overall picture, a total of 25 areas (16.7%) make at least one reference to archives (including all the above references) within their LAA and/or SCS. Compared to museums and libraries, archives are not well represented within LAAs/SCSs.

The Role of Museums, Libraries, Archives and Local Area Agreements
14
4. MLA Sector Involvement in LAA / LSP Structures
4.1 This section considers the extent to which the MLA sector is involved in LAA and LSP structures generally, and assesses which LAA themes the sector is most involved with, as well as comparing strategic and delivery level involvement. The analysis presented is based on evidence from both the survey and from consultation visits, and includes evidence provided from both LAA and MLA sector perspectives.
Involvement in LAA / LSP Structures
Table 4.1: Is the Cultural/MLA sector represented in LAA and LSP structures in your area? Frequency Count
Yes 66.5% 135
No 24.1% 49 Don't know 9.4% 19
Source: DC Research survey, n=203
4.2 Table 4.1 provides a summary view on sectoral representation, highlighting that around two-thirds of respondents view the sector as being represented in LAA and/or LSP structures in their area. The consultations explored in more detail the mechanisms for this engagement, suggesting that there are number of different models of engagement for the sector in LAA and LSP structures. Whilst these varied across areas that engaged with the study, it is useful to set out the more common approaches.
4.3 First, some of the consultation areas had a Cultural Partnership sitting inside a thematic LSP structure. This is where a cross organisational Cultural Partnership exists as one of a number of LSP thematic groups, and this typically would be replicated in the LAA / SCS structure, where an MLA priority indicator (typically NI9) sits alongside other related indicators.
This approach can be typified by Derby City, where ‘Cultural City’ is one of five themes both in the LSP and the LAA. It is important to note that in this approach, MLA services are placed alongside wider cultural (i.e. arts) and leisure activities and indicators, typically NI8 and NI11, but also in some cases NI’s 6, 7 and 57. This means that sector services must influence and make the case for inclusion against wider culture & leisure interests.
Another example is Derbyshire. Culture was perceived to have been crowded out as a crossing theme for LAA1, and this led to a partnership desire for a higher degree of specificity in LAA2, which resulted in the creation of a cultural theme group as part of the LSP structure. The Derbyshire Culture Theme group began the LAA2 process by focussing on priorities as opposed to indicators. Delivering services in rural communities was a key priority for the partnership, which enabled the inclusion of NI9 (mirroring the persuasive rationale used by other LAAs (such as Herefordshire and West Berkshire) covering remote rural areas).

The Role of Museums, Libraries, Archives and Local Area Agreements
15
Other areas where there was a formal cultural partnership/theme group within the LSP structures included: Barnsley (Cultural Consortium), Birmingham (Birmingham Cultural Partnership), Hartlepool (Culture, Leisure and Community Learning Partnership), Cheshire (Cultivate), York (York@Large) and Rutland (Rutland Culture Theme Group).
4.4 Whilst the existence of a Cultural Partnership or theme in the LSP is advantageous, there is still a level of influencing required at such forums to effectively make the case for the inclusion of museums and libraries indicators, and also the contribution MLA services make to wider leisure, culture, health and community cohesion priorities.
For example, in Hartlepool, culture and leisure has been a key theme and priority for the area since the development of the first community strategy. This involved culture and leisure having not only its own thematic partnership, but also being a priority (throughout the various iterations of Community Strategies and Local Area Agreements over recent years) of equal standing to the other priorities. Various factors are thought by consultees to have contributed to this, including the local and maritime history of the town and the key role this has played in the Borough’s approach to regeneration.
Cultural partners in Birmingham successfully lobbied vigorously for the Cultural Partnership to be a thematic partnership in the 2008 LAA (having previously not been included). As a result of its inclusion, there are high expectations in terms of delivery, although there are no sector specific national indicators included in the LAA (with the exception of sport), with the partnership developing local composite cultural indicators to operate in parallel with evidenced contribution to wider priorities. The composite indicators were also useful in helping to mitigate against the feeling that the selection of any of the sector specific indicators was highly unlikely and inclusive cultural indicators would be strategically more effective for the Partnership and for the profile of cultural organisations within the LAA and the city.
4.5 Second, other consultation areas have a Cultural Partnership that functions, but is not a formal LSP thematic group (which may be a more typical arrangement than a formal Cultural LSP theme). Most consultees (both the LAA lead officers and the sector professionals) highlighted reporting mechanisms that feed directly from the cultural group into a formal thematic group, although both the strength and the direction of such links can vary.
4.6 Typically these links are into Economic Regeneration, Safer and/or Stronger Communities, and Children and Young People’s themes, and tend to mirror the organisational position of cultural services in the relevant Local Authority.
4.7 One challenge identified with culture being linked to, or represented on, a non-culture LAA/LSP theme group is that the sector can get lost amongst bigger and more pressing priorities. For example, if culture is included within a ‘fourth block’ group (which for previous LAAs typically covered economy and environment agendas), the recognition of culture can be difficult to get across.
4.8 Third, there are areas where culture (including museums and libraries) is articulated as a ‘cross cutting theme’ across the LSP structure. This has the advantage of perhaps best capturing the contribution that museums and libraries can make to a range of priorities across themes, but there is the perennial danger of specific cultural priorities being lost through a lack of thematic ownership.

The Role of Museums, Libraries, Archives and Local Area Agreements
16
One solution to this cross cutting issue is the approach taken by Swindon, where there is a partnership scrutiny group alongside the partnership executive, of which the Director of the Swindon Cultural Partnership is a member. Recently aligned with the Council’s own statutory overview and scrutiny functions, this approach allows the Swindon Partnership to ensure cross cutting themes are not lost in either partnership or delivery terms.
4.9 Table 4.2 (based on the survey replies) sets out the range of LAA / LSP groups that have sector representation. It is clear that there is a wide spread of representation, and (specific culture groups aside) it is the Stronger Communities, Children and Young People, and Adult Health and Well Being themes that are most commonly reported. These links were typically confirmed during the consultation visits as the strongest, and (perhaps more encouragingly) both Table 4.2 and the findings from the visits suggests that the sector is typically engaged across a number of theme groups.
Table 4.2: Which of the following groups within LAA and LSP structures in your area is the Cultural/MLA sector represented on? Frequency Count
Stronger Communities (or equivalent) 36.7% 36 Safer Communities (or equivalent) 14.3% 14
Children and Young People (or equivalent) 25.5% 25 Adult Health and Well being (or equivalent) 27.6% 27
Tackling Exclusion and Promoting Equality (or equivalent) 9.2% 9 Local Economy (or equivalent) 20.4% 20 Environmental Sustainability (or equivalent) 2.0% 2
Executive group (or similar) 13.3% 13 Culture specific ‘theme’ group 41.8% 41
Other (please specify) 17.3% 17
Source: DC Research survey, n=98, multiple response.
4.10 The thematic areas with the weakest links were typically identified as Health in the consultation visits, although this is often compensated by strong links with health via sport and leisure (in areas where MLA services sit alongside sport/leisure in a cultural ‘basket’). Put simply, many areas do not, or at best struggle to, make the case for the health and well being benefits of libraries and museums. Other theme areas where the sector was not strongly represented included environmental sustainability (confirmed in both the survey results and the visits) and tackling exclusion and promoting equality.
4.11 MLA sector engagement with themes can also be influenced by the organisational position of the MLA services. Leaving aside those LAAs/LSPs with a dedicated Cultural Theme, where cultural services are part of a larger department or directorate, thematic links will typically be replicated along these lines. For example if libraries form part of a larger Children’s Services department, the links will be strongest with the Children & Young People’s theme. Other strong links noted were with Economic Development and Regeneration (particularly where the cultural offer, including museums, linked to visitor markets), and Safer & Stronger (with an emphasis on the Stronger element).

The Role of Museums, Libraries, Archives and Local Area Agreements
17
4.12 Table 4.3 assesses the depth of involvement of the sector at both the strategic and thematic levels. This shows that the sector tends to have a ‘moderate’ involvement as both a key strategic partner in terms of the Sustainable Community Strategy, and as a key delivery partner for the Children & Young People (or equivalent) theme. Beyond this, sector involvement as a key partner tends to be ‘minor’.
Table 4.4: How involved is the Cultural/MLA sector as each of the following Major Moderate Minor Not at
all
As a key strategic partner in the LAA 14.3% 27.6% 42.9% 15.2% As a key strategic partner in the Community Strategy
12.5% 42.3% 40.4% 4.8%
As a key strategic partner of the LSP generally 11.5% 29.8% 47.1% 11.5% As a key delivery partner in the Stronger Communities (or equivalent) theme
14.6% 33.0% 41.7% 10.7%
As a key delivery partner in the Safer Communities (or equivalent) theme
4.9% 20.6% 51.0% 23.5%
As a key delivery partner in the Children and Young People (or equivalent) theme
9.8% 40.2% 38.2% 11.8%
As a key delivery partner in the Adult Health and Well Being (or equivalent) theme
12.7% 34.3% 37.3% 15.7%
As a key delivery partner in the Tackling Exclusion and Promoting Equality (or equivalent) theme
7.1% 31.6% 42.9% 18.4%
As a key delivery partner in the Local Economy (or equivalent) theme
4.9% 30.1% 45.6% 19.4%
As a key delivery partner in the Environmental Sustainability (or equivalent) theme
0.0% 12.0% 53.0% 35.0%
Source: DC Research survey, 98<n<106, multiple response
4.13 One interesting dimension to the results presented above, is that when they are cross-tabulated against the category of respondent (i.e. either an MLA sector professional or an LAA lead officer/key partner) some divergences appear.
4.14 Most notably in terms of the responses where the contribution of the sector is identified as ‘major’, the proportion of LAA lead officers who state this always exceeds the proportion of sector professionals. This can be by as much as 20% of a difference, and is never less than 10%. A similar pattern emerges when the moderate category is reviewed, with LAA partners again providing more positive responses, and not surprisingly, the pattern is reversed in the minor category with sector professionals’ responses outweighing those of LAA lead officers.
4.15 This finding could be due to a number of factors/reasons, including the potential for the sector to be more pessimistic about how well its contribution and role is recognised, or conversely for LAA officers to be more optimistic about the role and contribution.

The Role of Museums, Libraries, Archives and Local Area Agreements
18
4.16 Interestingly, it may also add weight to the suggestion that arose in some of the consultation visits, that LAA lead officers are better able to see the wider LAA linkages and contributions that the MLA sector (or any other sector) can make to LAA and SCS priorities than sector professionals who may have a more service-centric view of the world. This issue is revisited in Sections 6 and 7 of this report.
Comparing the recognition of Libraries and Museums
4.17 It is useful to assess the relative recognition of the two MLA services with dedicated NI’s. In broad terms, libraries tend to be better integrated with LAA processes and also with thematic groups in comparison to museums. Ceteris paribus, this is to be expected, as libraries have a greater number of facilities, and also a larger footfall in Local Authority areas in direct comparison to museums. Furthermore, whilst the organisational position will change, every unitary and upper tier Authority has a libraries service, whilst not all have a museums service, or indeed museums themselves.
4.18 This alone would lead to a higher likelihood that libraries would be positioned more prominently in terms of SCS / LAA / LSP processes. However area consultations have highlighted further factors that contribute to differences in this relative positioning:
� Recent restructuring and budgetary pressures: On balance libraries as a service in many areas have faced sustained budgetary pressure and restructuring that has forced constant ‘case making’ and a strong neighbourhoods and communities focus. This has helped to focus provision and the development of evidence of contribution to other priorities ahead of the new Performance Framework/NI set and new partnership processes. Arguably, museums and museums services have not faced these challenges to the same degree.
� Community facing provision: Related to the point above, many libraries services have better embraced the need to evidence the mechanisms whereby their activities contribute to other outcomes. Again, museums have faced less past pressure to evidence such contributions.
4.19 Put simply, libraries have been forced to deliver, either directly or indirectly, a broader range of services to communities, and evidence their contribution to a range of different agendas, and whilst museums and museums services have also faced significant pressures, they have not had to evidence contribution to other agendas, as part of making a case for resources, to the same degree. This has contributed, in part, to better relative engagement in LSP processes and higher prominence in terms of SCS and LAAs for libraries.
4.20 A number of museums consultees reported that LAA decisions had been made prior to their involvement (“it was a fait accompli”). Nevertheless, the process has now raised awareness in the service generally about LSPs and the LAA process, with a number having begun to consider LAA contribution in their business planning processes (e.g. York).
4.21 On balance, many consultees (both from an LAA and an MLA sector perspective) felt that of the two, the libraries service tended to have a higher profile, and more senior leadership in Local Authority structures, a position that naturally translates into partnership influence. Museums tended to have higher organisation profile where Authorities had a dedicated culture department.

The Role of Museums, Libraries, Archives and Local Area Agreements
19
Factors Supporting Sector Involvement
4.22 In understanding the levels of recognition and engagement with LAA and SCS themes, the organisational profile of MLA services, and more widely of cultural services, is crucial. In most cases where the MLA sector is well engaged, this corresponds with a strong council profile for these services, with chief officers, LSP directors, locally elected members, and on occasion chief executives, being either from a sector background, or strong advocates for the sector. In one case, this factor pulled the libraries service into the LAA and SCS (including the inclusion of NI9 in the LAA) where otherwise the service would not have been directly considered.
4.23 It is important to note that the issue of organisational profile tends to be relative, as the consultations have highlighted both libraries and museums services being placed a range of different structural models. Examples include:
� Libraries: Children’s Services, Culture, Regeneration, Housing, Communities, Neighbourhood Services, Environmental Services
� Museums: Regeneration, Neighbourhood Services, Culture, Environmental Services.
4.24 Another crucial factor for the ability of the sector and its services to influence priorities is political profile. This is crucial for the sector, as poor performance or structural change (such as the closure of facilities) will not create the same issues for senior politicians and officers as crises in Health or Children’s Services (exemplified by the quote that “the Chief Executive will not get sacked if museums fail”). Nevertheless, the consultation visits highlighted a number of examples where the services of the MLA sector were either politically important and / or sensitive, and this has benefits in terms of influence and wider advocacy.
Rutland, Hartlepool and Reading represent examples where culture was well established as a political and organisational priority, and this significantly benefited the sector in advocating the inclusion of cultural related indicators (including NI8 and NI11 as well as NI9 and NI10).
For example, Rutland has a Culture & Leisure LSP Theme Group, which is independently chaired, and the Local Authority is represented by both the Culture & Leisure portfolio holder and the Head of Culture (who provides advocacy for each MLA service to the LSP). This Theme Group is responsible for a suite of related NI’s: 8, 9, 10, 11, 57 and 110.
Through a significant capital focussed modernisation programme, Greenwich is developing three service centres in Eltham, Greenwich and Woolwich, where libraries are seen as being central to pulling together a wide range of community focussed provision (and NI9 was selected as a reflection of libraries critical role in this key development).
Looking forward, it is therefore critical that the sector works to maintain and enhance its position on the local political agenda.

The Role of Museums, Libraries, Archives and Local Area Agreements
20
4.25 A number of LAA lead officers in areas where the sector was well embedded in the LSP and the LAA cited credibility as being a crucial factor. Officers in LAA management roles have to be confident in the case that is made, and the ability of partners to deliver, to then advocate their service in having a role/being a priority to the partnership executive and / or board. If the rationale for inclusion and ability to deliver across priorities is not regarded as being credible, the LAA lead officers are much less likely to argue the sector’s case in high profile forums. This constitutes a critical factor in understanding levels of partnership engagement, and also a key element in securing NI9 and/or NI10 in LAAs.
4.26 A track record of delivery is of equal importance in establishing partnership credibility. For example, Thurrock Partnership has NI9 as one of its 35 key LAA indicators, which was built on a successful cultural LPSA target and also culture related targets in its first LAA. Thurrock Cultural Forum felt that libraries would benefit from NI9 being included as it would build upon the service achieving all 10 national library standards, and balance the service against other elements that had previously benefited from stretching and ambitious targets. As a consequence, securing NI9’s place among the 35 indicators was not regarded as being difficult.
Challenges to Sector Involvement
4.27 For those areas that have not been as successful in getting recognised by and/or involved in LAA and LSP structures, a range of challenges, issues and barriers were identified in both the survey results and the visits.
4.28 The most common engagement barriers/the sector faced were identified as being:
� The fact that the sector is not regarded as a key priority (especially when compared to health, crime, the economy etc).
� The sector not being able to demonstrate and evidence its role/contribution to the key priorities.
� Key stakeholder’s lack of appreciation of the contribution that the MLA services can make to their priorities and agendas.
� A lack of representation, with there being very few cultural advocates round the key decision-making tables.
� A lack of profile of the both the MLA sector in particular, and culture more widely.
� Issues and concerns from LAA partners about the ‘cultural’ NI’s – with common perceptions about ‘poor indicator(s)’ and ‘poor measurement’ not helping when trying to get partners to accept and appreciate the contribution of the MLA sector.

The Role of Museums, Libraries, Archives and Local Area Agreements
21
5. Recognition of MLA Contribution to LAA Priorities
5.1 This section focuses on the recognition of the MLA sector in terms of its contribution to LAA (and SCS) priorities. As with the previous report section, it is based on evidence from both the survey and from consultation visits, and analyses evidence from both LAA and MLA sector perspectives.
5.2 Tables 5.1 to 5.4 set sector recognition in its formal context. Tables 5.1 and 5.2 shows how well the sector is recognised in terms of locally defined LAA priorities and / or outcomes.
Table 5.1: Is the Cultural/MLA Sector recognised as contributing to local priorities and/or outcomes of the LAA in your local area? Frequency Count
Yes 74.5% 117
No 14.0% 22 Don't Know 11.5% 18
Source: DC Research Survey, n=157
Table 5.2: Which themes do the local priorities that the Cultural/MLA Sector contributes towards sit within? Frequency Count
Stronger Communities (or equivalent) 67.3% 68
Safer Communities (or equivalent) 32.7% 33 Children and Young People (or equivalent) 59.4% 60
Adult Health and Well being (or equivalent) 49.5% 50 Tackling Exclusion and Promoting Equality (or equivalent) 30.7% 31 Local Economy (or equivalent) 43.6% 44
Environmental Sustainability (or equivalent) 12.9% 13 Other 20.8% 21
Source: DC Research Survey, n=101, multiple response
5.3 Nearly three quarters of respondents feel the sector is recognised as contributing towards local priorities and / or outcomes. These priorities sit within a range of themes, with Stronger Communities and Children and Young people having the highest levels of recognition, and Environmental Sustainability the lowest.
5.4 When the results about contribution are cross-tabulated against type of respondent, the divergence first discussed in Section 4 is once again present. LAA lead officers (85%) are typically more likely to state that the sector is recognised as contributing to local priorities and outcomes than the sector itself is (70%).
5.5 Tables 5.3 and 5.4 present the results about recognition of the sector’s contribution to National Indicators.

The Role of Museums, Libraries, Archives and Local Area Agreements
22
Table 5.3: Is the Cultural/MLA Sector recognised as contributing to National Indicators and/or outcomes of the LAA in your local area? Frequency Count
Yes 63.3% 88
No 17.3% 24 Don't know 19.4% 27 Source: DC Research survey, n=139
Table 5.4: Which themes do the National Indicators and/or outcomes that the Cultural/MLA Sector contributes towards sit within? (Please tick all that apply): Frequency Count
Stronger Communities (or equivalent) 66.2% 51 Safer Communities (or equivalent) 31.2% 24
Children and Young People (or equivalent) 53.2% 41 Adult Health and Well being (or equivalent) 44.2% 34
Tackling Exclusion and Promoting Equality (or equivalent) 24.7% 19
Local Economy (or equivalent) 29.9% 23
Environmental Sustainability (or equivalent) 9.1% 7 Other (please specify) 26.0% 20 Source: DC Research Survey, n=101, multiple response
5.6 Just under two-thirds of respondents feel the sector is recognised as contribution towards National Indicators and / or outcomes (which is lower than the responses for local priorities and outcomes). Again, these priorities sit within a range of themes, although there is a stronger concentration sitting within Stronger Communities (66%), Children and Young people (53%) and Adult Health and Well Being (44%). Similar to the local priorities position, Environmental Sustainability has the lowest response.
5.7 When the results about contribution to National Indicators are cross-tabulated against type of respondent, the level of divergence is once again evident – and to a greater extent than it is with local priorities. LAA lead officers (77%) are typically more likely to state that the sector is recognised as contributing to National Indicators and outcomes than the sector itself is (54%).
5.8 In terms of the contribution of the cultural sector (in this case culture is taken in its broadest sense and includes leisure, sport, and arts as well as MLA services specifically) to specific indicators, respondents to the survey mentioned 51 different National Indicators, with 24 of them being mentioned more than once:
� The most commonly mentioned were the cultural indicators (including sport) i.e. NI8 (10%), NI9 (10%), NI10 (6%), and NI11 (16%), along with NI110 - young people’s participation in positive activities (9%). Of particular note here, is that more respondents identified NI110 than NI10.
� These were followed by NI1 (5%), NI6 (6%) and NI7 (3%) – emphasising the contribution to ‘stronger communities’ priorities.

The Role of Museums, Libraries, Archives and Local Area Agreements
23
� Beyond this mention was also made of NI5, NI57, NI141, NI55, NI120, NI136, NI139 and NI161 by at least three respondents.
5.9 The key factors identified as to why the sector does not contribute to National Indicators in LAAs mirrors those factors listed as the challenges and barriers faced by the sector in getting into LSP and LAA structures, being primarily about:
� Culture not being seen as a priority compared to other issues
� The barriers and challenges in being able to evidence the impact of MLA services upon key priorities
� The low profile of culture, and the lack of a champion, especially at the local strategic level and also the national level in terms of lobbying.
Selecting the National Indicators
5.10 When discussing the process by which priority National Indicators were selected during LAA development, many consultees highlighted a thematic consultation process where priorities for the LAA were discussed at thematic partnership/LAA meetings ahead of the selection of the 35 indicators. This represented both a crucial stage in the LAA process, and a useful barometer as to how engaged the MLA services were in the process.
5.11 These consultations, which ranged from thematic workshops to strategic conferences, involved partners as well as key service providers from Local Authorities, and it is fair to conclude that those areas where the sector is well engaged with partnership processes were involved. In a number of areas, there was partial engagement - for example one LSP (which did select NI9) had engaged with libraries at this thematic stage, but museums only became cogent of the process (and indeed its importance) at a much later stage in the process, at which point the scope to make the case for inclusion of NI10 was limited.
5.12 This process did lead to a situation that developed in a number of areas where NI9 or NI10 (more commonly NI9) was considered for inclusion and did make it onto the ‘long list’ of NI’s being considered. However, when the list was pared down to 35, NI9 and NI10 were excluded, with the common reasons linking back to (and reinforcing) some of the earlier challenges – primarily a lack of appreciation of the contribution of culture to LAA priorities from other partners, and also challenges relating to the views and perceptions about the MLA National Indicators and measures themselves.
5.13 The survey asked those that had included NI9 and NI10 to indicate how challenging it was to do so:
� In areas that had included NI9, nearly three quarters (71%) reported that it was either not at all challenging (24%), or slightly challenging (48%) to get this NI included in their LAA.
� In areas that had included NI10, again just less than three quarters reported that it was either not at all challenging (14%), or slightly challenging (57%) to get this NI included in their LAA.
5.14 The most commonly identified key factors that helped in getting NI9 or NI10 (or other participation in libraries/museums measures) included in the LAA were:

The Role of Museums, Libraries, Archives and Local Area Agreements
24
� The existence of a good understanding and recognition of the contribution of culture to wider LAA priorities by other partners
� The level of influence of key cultural partnership/partners in LAA development and LSP structures more generally
� The sustained lobbying of, and engagement with, key LAA stakeholders
� An awareness from partners of the specific contribution that libraries can make to access to services priorities generally (especially in rural areas)
� Strong performance of museums in the local area, and the status and importance afforded to the museum in the local area.
5.15 However 58% and 79% of respondents to the survey stated that no consideration was given to including NI9 and NI10 respectively. This supports the conclusion (developed in Section 7) that little sector based lobbying or case making was successful for either indicator – strategic decisions about inclusion were often made at an early stage in the selection process and did not waver.
5.16 The main reasons identified for the lack of success in getting NI9 or NI10 included in the LAA were:
� That NI 9 is not regarded as a partnership based target – i.e. it is seen as only being about a service delivered solely by the Local Authority and is therefore a Local Authority responsibility only.
� That there are too many other higher priorities than libraries – especially in areas of deprivation, but also more broadly across all authorities.
� That due to the current good (or even very good) performance regarding NI 9/participation in libraries, that it is neither a local priority in terms of addressing poor performance, nor is it an indicator upon which much improvement could be achieved.
� That there were some strong concerns about the indicators themselves and their measurement – in terms of the specificity of what is measured, who is surveyed, the structure of the survey, the lack of a comparable baseline, and the sample size used.
� The level of provision of museums – in that some areas had none, or perhaps only one museum in the area, and therefore it was not considered to be of sufficient profile and importance.
5.17 There are a number of examples where the services and partnerships took an early tactical decision not to advocate for the inclusion of NI9 or NI10 (focussing instead on the contribution to other priorities), and it is crucial that that such decisions are seen as representing the best interests of the services in that particular partnership dynamic. Nevertheless, not being engaged in such discussions at all significantly weakens the ability of the sector and its services to exert any influence at all on partnership priorities and their contribution to such priorities.
5.18 From a service provision perspective, some consultees felt that their NI had to be in the LAA to secure the future of their service, despite many openly arguing that their NI, and NI9 in particular, was regarded as having specific methodological weaknesses (an issue that is explored in detail below). This approach is a tactical response to fear of the implications, or perceived implications, of the consequences for the service of being seen to be outside the LAA.

The Role of Museums, Libraries, Archives and Local Area Agreements
25
5.19 Other consultees felt from the outset that their service would not be able to make the case for inclusion in terms of strategic arguments, and tactically choose to engage with partnership and LAA processes from a supportive perspective, advocating the contributions their service made to other priorities and indicators.
5.20 In some areas the drive for the inclusion of either (or both services) has been driven from the LSP itself. For example, the consultations have highlighted the following examples:
� Local Authority A: The library service made a case for inclusion that was based on the service growing as it opened new libraries. The partnership worked with the service to broaden its case highlighting the wider benefits that increased library use would entail, as well as improving the evidence of wider contribution. Without this support and encouragement NI9 would not have been included in the LAA, but there was a clear will to have NI9 in the LAA from the outset.
� Local Authority B: The LAA has a range of cultural indicators embedded in its LAA, which is a legacy of culture (including museums and libraries as well as arts participation) being a valued priority of both the Leader of the Council and its Chief Executive. Whilst it is likely that this authority is at the very least in the top quartile, if not decile, for these indicators, thereby making service improvement challenging, the inclusion of these indicators are clearly seen to reflect both political and partnership priorities.
� Local Authority C & D: Developing an argument about engagement with wider services was crucial in NI9 being embedded in these LAAs which cover rural areas. In making the case along these lines, the support of the voluntary and community sector is crucial - especially in a two tier area.
5.21 Whilst a key factor in the inclusion of MLA indicators in LAAs is a strong track record of MLA sector based (and wider cultural) achievement, there is a degree of nervousness around the ability to improve. Table 5.1 highlights which of these services are in the top quartile in respect of 2007 baseline performance. It is important to understand the relative 2007 performance of these areas in context to appreciate the potential scope for improvement over the 2008-2011 LAA period.

The Role of Museums, Libraries, Archives and Local Area Agreements
26
Table 5.5: Relative NI Baseline Performance Position National Indicator
1st Quartile 2nd Quartile 3rd Quartile 4th Quartile
NI9 Rutland Greenwich
Hartlepool, Herefordshire,
Derby, Thurrock, Reading
Derbyshire, West Berks,
Swindon, Barnsley
NI10 Rutland Hartlepool Source: DC Research analysis based on NI Baseline Performance
5.22 In contrast to libraries (where provision is more homogenous), some of the consultation visits identified that a strong Local Authority controlled museums service is regarded as an essential prerequisite ahead of considering the inclusion of NI10. Essentially LSPs need to be confident that they have sufficient influence (through the Local Authority control of museums) to be able to influence local strategy/delivery and thus performance.
NI110: Positive Activities for Young People
5.23 A number of areas have selected NI110, regarding it as both a better indicator in its own right, and also as a suitable mechanism by which both museums and libraries are able to make the links between schools and young people and culture. These areas include a mix of those whose sector partners made the case for either or both of NI9 and NI10, and also those that made an early decision not to consider their inclusion. Tactically, many of areas felt NI110 enabled them to ensure both services were engaged, as realistically, most LAAs would not accommodate both NI9 and NI10, and the inclusion of one carries the danger of diminishing the voice of the other. This view was shared across the sector in those areas that originally made the case for NI9 and / or NI10, and those that focussed on NI110 from the outset.
In areas where Children’s Trusts have been established, there is the potential to create strong links with the sector through the use of NI110. Staffordshire felt that by reinforcing these linkages, NI110 provided much better scope to influence partnership direction and enhance the work of the sector in the LSP and LAA.
5.24 Whilst a focus on NI110 in isolation carries the risk of narrowing the articulation of the contribution of the sector to target groups3, it does offer many services a viable alternative that can balance the profile (and scope for collaboration) of both museums and libraries. NI110 was also perceived as a broader partnership indicator, whilst NI9 and NI10 were considered by some consultees to be ‘council led’ and/or related to a council led service (especially NI9) that was not about partnership delivery in the true ethos of LAAs.
3 This potential isolation can be resolved in part with the inclusion of other NIs with wider target groups (e.g. volunteering).

The Role of Museums, Libraries, Archives and Local Area Agreements
27
Business/Action Planning
5.25 There is evidence that the sector is beginning to use LAA terminology and approach in business planning processes. This includes making the links between sector activity and LAA priorities, with front line staff understanding the LAA priority led approach (which is seen as being more accessible than previous target / indicator regimes). This suggests that a holistic approach in providing support to the sector is likely to be well received.
Derbyshire is devolving some responsibility for NI9 down to local libraries through library action plans. This is possible as both NI9, and other related indicators, are accessible to staff in ways that previous performance regimes (such as BVPIs) were not.
5.26 Another example is the approach highlighted during the visit to Gateshead where A Planning Framework has been implemented by Tyne and Wear Museums. The framework includes a Corporate Priorities/Outcomes planning grid that “is designed to allow any project or activity – however small or large - to articulate its aims and objectives so that they focus on the outcomes for audiences, rather than solely on outputs...This planning grid achieves this by linking the Corporate Plan to outcomes”. (A Planning Framework for Tyne and Wear Museums, North East Regional Museums Hub/Tyne and Wear Museums, 2008, p.2). This framework can be used to show the contribution of projects to a range of outcomes - including LAA priorities.
5.27 In two tier areas it is particularly important to develop the persuasive rationale to convince district and borough authorities of the importance of libraries if a strong case for NI9 is to be successful. In a partnership context other authorities often argue against NI9, regarding it as a County Council sole function. Where counties have been successful in this regard, this argument has been played out, and the case made for the delivery of wider priorities through libraries, even in cases where the achievement of NI9 is exclusively about Local Authority performance.
5.28 In each region Government Offices were key players in the LAA negotiation process, and in a number of cases had to be convinced as to the rationale behind the inclusion of MLA sector NIs (a factor due in part of the comparative success of key Government departments such as the Home Office and DCSF in developing their approach in addition to the profile of these departmental agendas). It is important to respond to the perception sometimes held (in both some lower tier districts and boroughs and some Government Offices) that libraries are “something you do anyway”.
NI 9 and 10: Methodological issues
5.29 Those areas that have selected NI9 and/or NI10 welcome the support (including the boosted Active People Survey sample) being provided by MLA. However, it should be noted that most areas with these indicators have set targets along the lines of a statistical improvement, and with the boosted sample this equates to an improvement of 3%. Those areas that do not have a boosted sample would need to achieve around a 6% improvement for it to be measurable.

The Role of Museums, Libraries, Archives and Local Area Agreements
28
5.30 Another area of anomaly specific to NI9 relates to residents understanding and acknowledging that they have used libraries when surveyed as part of the Active People Survey. There is strong concern that many respondents will not realise that they have used services provided by their library (including virtual and remote services), and some areas are beginning to consider profile raising tactics to mitigate against this risk.
5.31 One NI9 library service has asked all staff to finish every face to face or telephone inquiry with “Thank you for using your library service”, and it is likely that mobile library services will be increasingly visible. More generally, it is clear that libraries and museums services that have selected NI9/NI10 in their LAA will devote energy to promoting recognition of their service. Library consultees gave a range of examples as to how this may happen in practice (an example is shown in Figure 5.1).
Figure 5.1: Improving Libraries Perceptions – Thurrock’s Mobile Library
Source: Thurrock Council
5.32 It was also suggested that concerns with measurement of these indicators (NI9 and NI10) particularly undermined the sector’s case for inclusion in the largest Core Cities, as consumption of their range of arts, museums and libraries facilities has a much wider footprint than their geographic administrative boundary area. As such, neighbouring areas may benefit from residents consuming provision in the Core Cities boundaries, either as it is their place of work, or as visitors.

The Role of Museums, Libraries, Archives and Local Area Agreements
29
This is best highlighted in the comparison of the NI10 baseline data between Birmingham and Solihull. Neither Authority has selected NI10 as one of its 35 indicators, but Birmingham has a baseline of 44.2% of local residents having accessed museums services in the past 12 months, and Solihull 53.2%. Birmingham has a substantial and diverse range of museums facilities, whereas Solihull does not have a significant museums service presence.
5.33 Larger cities will focus on targeting improvement in the most disadvantaged areas, whilst much of the cultural offer of such cities tends to be consumed by visitors and in-commuters. Therefore it is perceived to be much more useful in such cases to have local indicators that capture cultural visitors separately from indicators/measurement aimed at capturing improvements in participation for particular groups of residents in the Local Authority area.
5.34 Despite these issues with underpinning indicator methodology, it has been encouraging that in some areas consultees are reporting that front line staff now have a better understanding of the rationale behind the NI indicator set and its scope for focus, and more importantly, the ways in which their work contributes to a range of priorities and outcomes. Put simply, staff are able to grasp the contribution of their work to the NI set as it is much more accessible than the raft of indicators and performance measures that preceded it.
The main message around NI inclusion is that there is little evidence to suggest that any area included these indicators in their LAA solely as a result of sector advocacy. In every case where the sector has included NI9 and/or NI10, there was very a clear partnership will for inclusion, typically as a result of either strong political will or encouragement by senior officers in the Local Authority.
This is reinforced by the consultations with those LAA areas that did not include sector indicators - there are only a handful of examples where an indicator (NI9) made it through to a ‘long list’ ahead of finalisation of the 35 priority indicators. This supports the conclusion that those areas that selected sector NI’s did so on the back of strong political and senior partner support (and in some cases a well established track record) from the outset.

The Role of Museums, Libraries, Archives and Local Area Agreements
30
6. Barriers, Challenges and Potential Solutions
6.1 This section considers the most commonly cited barriers and challenges to the effective engagement of the MLA sector with LAAs. It is based on evidence from both the survey and the consultation visits.
Barriers and Challenges
6.2 Budgetary pressure remains a fundamental area of pressure across the sector, which has become leaner in each successive year in a need to show value. Whilst felt in all areas, there is a concern amongst some of the Local Authority areas that have selected NI9 and NI10 that cuts are being sought at the same time as inclusion of their service as an LAA priority. Indeed lobbying to such areas in this regard was often cited as one way in which MLA could support the sector, as this help to mitigate against the performance of NI9 and NI10 areas suffering.
6.3 A lack of appreciation of what the sector can offer was one of the most common issues mentioned by the sector itself. In addition, from both LAA and sector respondents, the lack of access to clear, tangible evidence about the impact that MLA sector services have on LAA priorities is a barrier. It is also felt that convincing chief executives and local politicians is one of the key challenges to be addressed.
6.4 The lack of a cultural champion at the executive level within LSP or LAA structures and delivery mechanisms is seen by the sector as a significant barrier. This is due in part to the lack of a single lead organisation/champion/service at the local level (comparable to PCTs on health, for instance). This issue is made more challenging by the feeling that museum professionals in particular are no longer senior enough to be invited to major strategic policy area discussions, compounded by a lack of awareness in some senior management in the MLA sector about the importance of partnership and the need to effectively engage in the LAA agenda.
6.5 This barrier is further reinforced by perceptions by LSP/LAA consultees that, in some instances, the sector lacks any strong commitment to achieving priorities other than its own. This was emphasised by those that noted that the sector/its representatives can be seen as ‘single issue’ players not able to/willing to consider the bigger picture.
6.6 Another barrier mentioned by a number of both LAA and sector consultees was the changing skill sets required of modern sector professionals. The sector operates in a competitive, political, and performance driven partnership arena, and this demands increased case-making, engagement, influencing and managerial skills in addition to traditional professional skills. This was seen as vital by the more engaged areas consulted. A linked issue relates to the demands that such partnership working can have on the capacity of individuals, and the potential for these aspects to not be fully realised or fulfilled due to the limited capacity within the sector.
6.7 Beyond this, the most common challenges/barriers related to issues and concerns around the cultural indicators in the set of National Indicators - the precise issues with the indicators were summarised in Sections 4 and 5. The consultations did also highlight that there are other indicators that seem to suffer from similar concerns – including some

The Role of Museums, Libraries, Archives and Local Area Agreements
31
that that were selected by more LAAs than NI9 and NI10. Insofar as the concerns exist, whether they are based on misperceptions or not, this is a challenge that needs to be addressed in order for LAA partners to be able to seriously consider these indicators for inclusion in future LAAs.
There is a general feeling that the marketing and advocacy of MLA services could be far better and that overcoming this challenge would help to address a number of the barriers listed above. In part this is dependent on the confidence of the sector and its services and in the sector being proactive and communicating its activities in its locality – an issue that is particularly acute for museums services.
Potential Solutions
6.8 The most commonly identified key steps that would help to address the barriers are discussed below. First, it is important to emphasise that many of the suggestions from the survey replies, and from the consultations carried out during the visits emphasised two key steps: (i) Advocacy and (ii) Evidence of Impact. These issues were strongly emphasised throughout by both sector professionals and LAA lead officers and partners. In addition, issues around training and staff development are noted as these were also given sufficient mention from both the visits and the survey results.
6.9 The list of steps outlined below summarises many of the examples proposed, many of which fall under the general headings of either advocacy or evidence of impact. A more considered reflection on these suggestions is outlined in Section 7 of this report, which identifies the specific groups that may benefit from these solutions, and the types of support that would help each particular group.
ADVOCACY
6.10 In terms of advocacy, the potential solutions touch upon what could be done, and also some of the specific routes through which such advocacy may be most effective. The key activities identified were:
� A need to create innovative ways of promoting engagement of partners, other than simply attendance at meetings.
� A need to increase the visibility and awareness of the cultural sector in contributing to a range of wider outcomes.
� A need for better PR nationally to show how culture can be the driving force behind other initiatives.
� Calls for cultural champions/advocates at the highest level(s) – locally and nationally.
6.11 The potential routes and mechanisms through which to deliver this advocacy were also noted, alongside some key factors around the type of advocacy:
� Briefings by the Cultural Director (or equivalent) to appropriate decision-makers (such as Barnsley, where the Interim Head of Culture gave briefings to each of the other eight delivery partnerships of the LSP).

The Role of Museums, Libraries, Archives and Local Area Agreements
32
� The need for more advocacy to be based on practical examples and achievements, and that such examples need to show HOW it was achieved, and TO WHOM the examples are relevant. As such, this is a call for more specific and less generalist evidence and advocacy.
� Effective networking (although these calls were proposed with a concern that effective routes of such networking – e.g. one-to-one meetings with key stakeholders – is time and resource intensive).
EVIDENCE OF IMPACT
6.12 The issues around evidence of impact related to the ability of the MLA sector to be able to show clearly and convincingly to key partners evidence of the contribution of the impact that sector can have on a wide range of LAA priorities and agendas. The precise issues identified were:
� A need to make more of the connection between MLA sector services and other priorities like education, health, reducing crime through MLA sector projects
� Calls for there to be a constant stream of evidence of impact in key Local Authority journals
� Suggestion that exercises involving mapping the contribution which culture can make to other LAA priorities and then seeking to shape cultural activities around these priorities would help
� The need to ensure that whatever evidence is provided/developed uses strong performance indicators and evaluation methods that are recognised by LAAs
� Issues with the measurement of, and with, the relevant MLA sector indicators themselves in the National Indicator set led to some suggestions for a review of the cultural National Indicators (and the methods of collection, sampling etc.). However, as this is highly unlikely to take place prior to 2011, it is important that the sector is supported in developing a better understanding of, and working effectively within, the current framework.
TRAINING/STAFF DEVELOPMENT
6.13 Finally, in terms of the issues surrounding training and staff development, these were based on an acknowledgement from within the sector about such a need. These calls from without the sector for training and staff development (and for lessons to be learned within the sector) led to a number of suggestions, including:
� Training and awareness raising amongst professionals in the MLA/cultural sector and amongst LAA partners about the potential for the MLA/cultural sector to achieve priorities other than their own
� Developing a more coherent set of priorities for "culture" that are seen to support partners' major concerns
� Developing more self-awareness amongst professionals in the sector
� Training to ensure that professionals in the sector appreciate wider agendas and that they can see beyond their own service boundaries and issues.
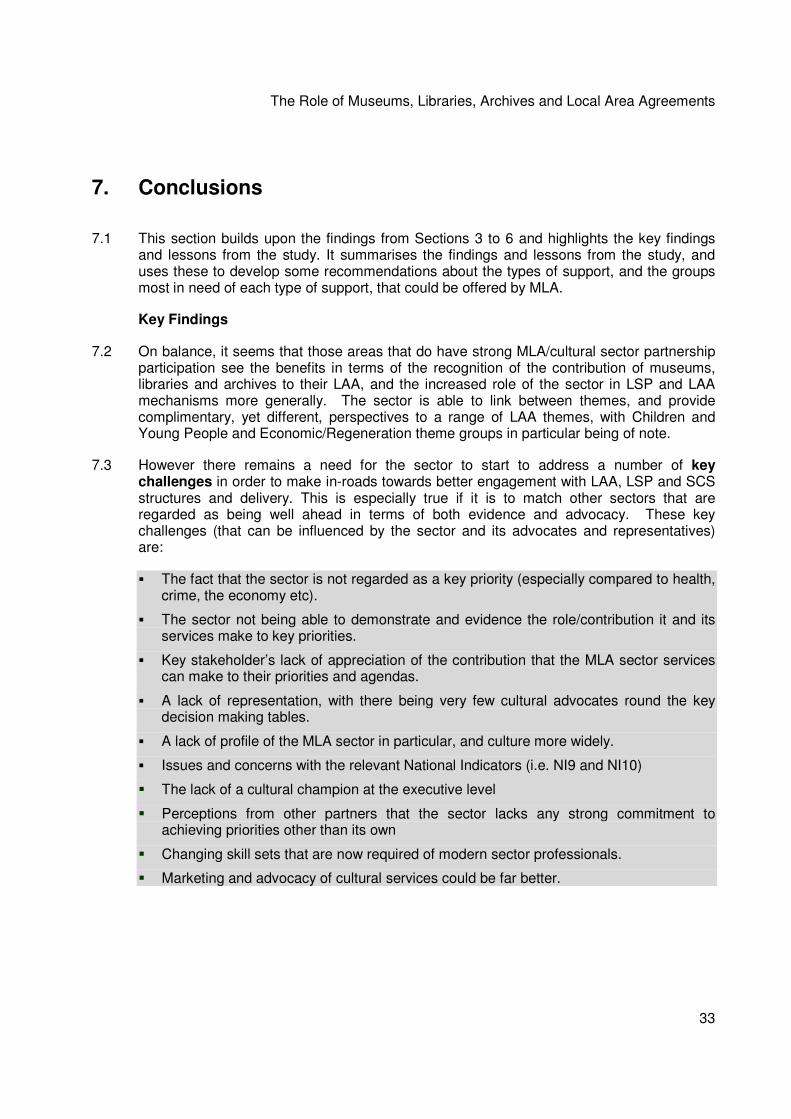
The Role of Museums, Libraries, Archives and Local Area Agreements
33
7. Conclusions
7.1 This section builds upon the findings from Sections 3 to 6 and highlights the key findings and lessons from the study. It summarises the findings and lessons from the study, and uses these to develop some recommendations about the types of support, and the groups most in need of each type of support, that could be offered by MLA.
Key Findings
7.2 On balance, it seems that those areas that do have strong MLA/cultural sector partnership participation see the benefits in terms of the recognition of the contribution of museums, libraries and archives to their LAA, and the increased role of the sector in LSP and LAA mechanisms more generally. The sector is able to link between themes, and provide complimentary, yet different, perspectives to a range of LAA themes, with Children and Young People and Economic/Regeneration theme groups in particular being of note.
7.3 However there remains a need for the sector to start to address a number of key challenges in order to make in-roads towards better engagement with LAA, LSP and SCS structures and delivery. This is especially true if it is to match other sectors that are regarded as being well ahead in terms of both evidence and advocacy. These key challenges (that can be influenced by the sector and its advocates and representatives) are:
� The fact that the sector is not regarded as a key priority (especially compared to health, crime, the economy etc).
� The sector not being able to demonstrate and evidence the role/contribution it and its services make to key priorities.
� Key stakeholder’s lack of appreciation of the contribution that the MLA sector services can make to their priorities and agendas.
� A lack of representation, with there being very few cultural advocates round the key decision making tables.
� A lack of profile of the MLA sector in particular, and culture more widely.
� Issues and concerns with the relevant National Indicators (i.e. NI9 and NI10)
� The lack of a cultural champion at the executive level
� Perceptions from other partners that the sector lacks any strong commitment to achieving priorities other than its own
� Changing skill sets that are now required of modern sector professionals.
� Marketing and advocacy of cultural services could be far better.

The Role of Museums, Libraries, Archives and Local Area Agreements
34
7.4 In terms of the role of MLA in providing help and support to address and help to mitigate these challenges, it may be that there are some discreet groupings of the sector that may help. As such, it is likely that MLA will need to tailor support (i.e. by offering different types and different scales of support):
� To services in those areas where the LAA includes NI9 and / or NI10
� To services that are well embedded in LSPs, and need to continue to demonstrated their wider contributions to LAA priorities
� To services that are not well engaged in LAA processes.
7.5 There are of course lessons for the third grouping (those that are not well engaged) from the successes to date of those in the first two groupings. The key factors in successful engagement that have been identified in this study include:
� A well established local ‘ethos’ of culture that is valued by key partners at the senior level.
� Strong evidence and advocacy skills in sector professionals.
� Ability to identify good practice and turn it into marketable evidence.
� A focus on engagement through approaches designed to support cohesion, confidence building, well being and community development.
� Ability to expand the sector offer and its engagement mechanisms, and to develop more collaborative approaches to delivery.
� Reputation for, and ability to, deliver.
� Other partners having a good understanding and recognition of the contribution of culture to wider LAA priorities.
� The level of influence of key cultural partnership/partners in LAA development and LSP structures more generally.
� The sustained lobbying of, and engagement with, key LAA stakeholders.
� An awareness from partners of the specific contribution that museums, libraries and archives can make to particular agendas (e.g. access to services priorities).
� Strong performance of the service (museums, libraries and archives) in the local area, and the status and importance afforded to the services.
General Lessons and Issues
7.6 In addition to the above, there are also a number of lessons and issues that may need to be borne in mind as a wider context for the recommendations about the type of support that may be required.
7.7 One lesson is the realisation that LAA inclusion is increasingly important. This underpins the approach taken by those MLA services that have NI9 or NI10 in their LAA, and those that have striven to ensure their service is seen as contributing to other key priorities. In short, and despite understandable concerns about the mechanics of the indicators used, it is much better for a service to be seen as LAA integrated than not.

The Role of Museums, Libraries, Archives and Local Area Agreements
35
7.8 Some consultees felt that, in general terms, culture (excluding sport) still suffers from elitist perceptions, in contrast to sport, who have successfully promoted a strong ‘sport for all’ ethos. Whilst this perception is likely to be, at best, frustrating for sector professionals it remains both a valid message and an issue that is clearly still not fully addressed. Indeed, it links to the arguments around the acceptance of ‘sport=health and well being’ arguments in comparison to culture.
7.9 All the areas consulted were advocates of the wider contribution of the sector and its services to other priorities, but one consultee (in a NI9 area) did caution against this – advocating that the sector is often not assertive enough – and if too much emphasis is placed on the contribution to a wide range of other priorities and indicators this can place the sector on the back foot in advocacy terms.
7.10 Finally, there was a consensus amongst LAA leads, and the more partnership focused sector professionals (typically with a wider ‘cultural’ brief that encompassed arts and sports in addition to the MLA services), that there is a need to focus efforts on making the case for 2011, specifically in terms of being well prepared to negotiate, with strong and credible evidence and a clear delivery and planning focus.
Issues and Recommendations for MLA
7.11 Giving due consideration to all of the above, there are a number of useful lessons for MLA to consider as it refocuses its role in relation to Local Government support. Central to this role are the mechanisms by which MLA engages with LSPs in the LAA process moving forwards, and it will be important for MLA to clarify its own role as a NDPB and a partner under the ‘Duty to Cooperate’.
7.12 MLA is viewed by many LAA partners on the ground as one of a range of organisations that sent lobbying letters and supporting documentation to senior officers (and politicians) ahead of NI selection for LAAs. These were numerous in terms of quantity, but regarded as ineffectual in terms of influence, as they were passed directly to sector professionals to note or action.
7.13 A number of consultees made direct comparisons between the approach taken by the sector and that by sport. Sport took a simple message (sport=health) and focussed on embedding this across all partners. In comparison, the sector (and MLA) produced a range of messages that lacked clarity and impact.
7.14 Those areas that selected NI9 and/or NI10 often felt that MLA had a low profile in the LAA process prior to the selection of the 35 indicators, after which more interest and support was forthcoming (e.g. Culture & Sport Improvement Toolkit), although some areas still feel that the additional support they expected as a result of selecting these indicators is yet to be fully realised.

The Role of Museums, Libraries, Archives and Local Area Agreements
36
7.15 Moving forwards, there are two specific areas where MLA needs to clarify its role:
� MLA has to clearly communicate its reengineered role (following reorganisation) with regard to support to LSPs and LAA development, and develop guidance as to its NDPB role under the ‘duty to cooperate’.
� MLA also needs to enhance GO relationships at the regional level, in addition to those developed at the department level (DCMS), to better convince those officers negotiating LAA’s on behalf of the Government of the role and contribution of the sector.
7.16 Additionally, MLA needs to be clear across the whole sector as to what support in terms of LSP and LAA processes can reasonably expected by, and delivered to:
� Services whose LSP has selected NI9 and / or NI10
� Services who are well embedded in LSPs, and that need to continue to demonstrate their contributions to wider LAA priorities
� Services that are not well engaged in LAA processes.
7.17 There is a clear role for MLA in supporting the capacity and the capability of the sector in terms of evidencing performance and contribution to LAA priorities. It is likely that the type of support required for each of these above groupings will vary, but will be drawn from the following core set of support needs.
7.18 Determining which of the above groups should be prioritised over the short to medium term is not straightforward. There currently seems to be a focus primarily towards supporting those areas that have selected NI9 and/or NI10 as one of the priority indicators within their LAA – with the underpinning rationale for this relating to the need to show success by 2011 for those specific areas that have selected NI9/NI10 to help to enhance the achievement and contribution of the sector to LAA priorities.
7.19 However, given that the wider contributions of the sector to other LAA priorities has been emphasised during this study by many of the areas visited, there is also merit in offering support between now and 2011 to those areas that are well embedded in LSPs, and that need to continue to demonstrate their contributions to wider LAA priorities. Helping these areas will ensure that the contributions of the sector to wider LAA agendas and priorities is evidenced and advocated for, and as such helps to show the role and contribution of the sector beyond NI9/NI10. Given the potential for the NIs themselves to change by 2011, reinforced by some of the concerns from LAA partners about NI9/NI10 currently, providing support to this group within the sector would help to ensure that the evidence of impact, advocacy and training/staff development issues highlighted fit to LAA partner agendas irrespective of which precise cultural indicators are included in the future.
7.20 As such, it will be a decision for MLA as to whether support offered is strongly directed towards only those areas that have selected NI9/NI10, or whether wider support is also offered to other authorities falling in the other groups noted above. The summary of support presented below makes no judgement on the groups that should receive priority, but seeks to identify the types of support that are most called for.

The Role of Museums, Libraries, Archives and Local Area Agreements
37
7.21 In summary, the table below identifies the key areas of where MLA could offer improvement support to help enhance the capacity and capability of the MLA sector to better engage with LAA development and delivery. The table is split into three main areas, aligned to the potential solutions discussed in Section 6 of this report, namely (i) Advocacy and (ii) Evidence of Impact. These issues were strongly emphasised throughout by both sector professionals and LAA lead officers and partners. In addition, issues around (iii) training and staff development are noted as these were also given prominent mention throughout this research study.
Table 7.1: MLA role in supporting the capacity and the capability of the sector to engage in LAA processes
MLA where NI9/ NI10 are in LAA
MLA well embedded in LAA/LSP
MLA not well engaged in LAA/ LSP
ADVOCACY Develop innovative ways of promoting engagement X X XX
Increase the visibility and awareness of the cultural sector
X X XX
Provide better PR nationally X X X
Have cultural champions / advocates at the highest level
X X XX
EVIDENCE OF IMPACT Make more of the connection to LAA priorities (through MLA projects)
XX XX X
Evidence of impact in key Local Authority journals XX X X
Map the contribution culture can make to LAA priorities and shape cultural activities around these priorities
XX XX X
Ensure that evidence is provided using methods and approaches recognised by LAAs
XX XX X
Support for sector in developing a better understanding of, and working effectively within, the current NI framework.
X XX XX
TRAINING/STAFF DEVELOPMENT
Awareness raising amongst sector professionals and LAA partners in the potential of culture to achieve other priorities
X XX XX
Develop more coherent set of priorities for "culture" that are seen to support partners' major concerns
X X X
Develop self-awareness amongst professionals in the sector
X XX
Ensure that professionals in the sector appreciate wider agendas and can see beyond their own service boundaries and issues.
X X XX
(Note: the “X’s” refer to the relative importance of this type of support within each group/across all groups. As such, XX = high priority for this group; X = moderate priority for this group. The table does not make any judgement on the groups that should receive priority, but seeks to identify the types of support that are most called for).
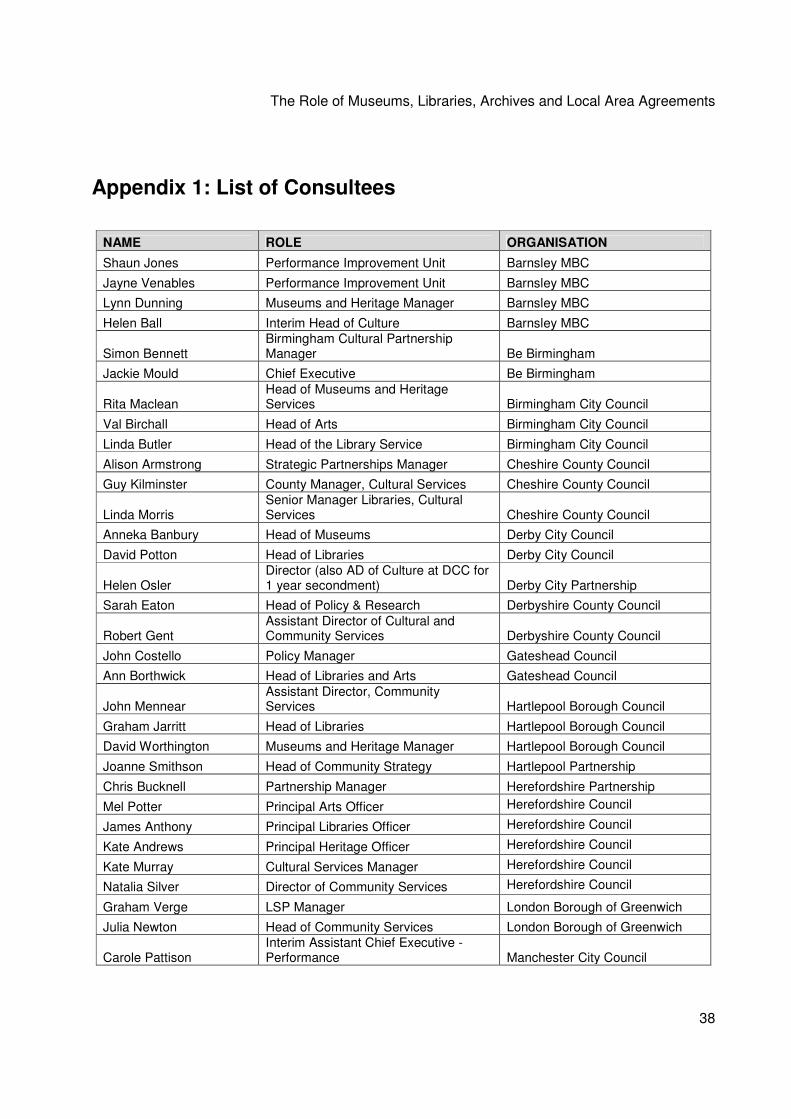
The Role of Museums, Libraries, Archives and Local Area Agreements
38
Appendix 1: List of Consultees
NAME ROLE ORGANISATION
Shaun Jones Performance Improvement Unit Barnsley MBC
Jayne Venables Performance Improvement Unit Barnsley MBC
Lynn Dunning Museums and Heritage Manager Barnsley MBC
Helen Ball Interim Head of Culture Barnsley MBC
Simon Bennett Birmingham Cultural Partnership Manager Be Birmingham
Jackie Mould Chief Executive Be Birmingham
Rita Maclean Head of Museums and Heritage Services Birmingham City Council
Val Birchall Head of Arts Birmingham City Council
Linda Butler Head of the Library Service Birmingham City Council
Alison Armstrong Strategic Partnerships Manager Cheshire County Council
Guy Kilminster County Manager, Cultural Services Cheshire County Council
Linda Morris Senior Manager Libraries, Cultural Services Cheshire County Council
Anneka Banbury Head of Museums Derby City Council
David Potton Head of Libraries Derby City Council
Helen Osler Director (also AD of Culture at DCC for 1 year secondment) Derby City Partnership
Sarah Eaton Head of Policy & Research Derbyshire County Council
Robert Gent Assistant Director of Cultural and Community Services Derbyshire County Council
John Costello Policy Manager Gateshead Council
Ann Borthwick Head of Libraries and Arts Gateshead Council
John Mennear Assistant Director, Community Services Hartlepool Borough Council
Graham Jarritt Head of Libraries Hartlepool Borough Council
David Worthington Museums and Heritage Manager Hartlepool Borough Council
Joanne Smithson Head of Community Strategy Hartlepool Partnership
Chris Bucknell Partnership Manager Herefordshire Partnership
Mel Potter Principal Arts Officer Herefordshire Council
James Anthony Principal Libraries Officer Herefordshire Council
Kate Andrews Principal Heritage Officer Herefordshire Council
Kate Murray Cultural Services Manager Herefordshire Council
Natalia Silver Director of Community Services Herefordshire Council
Graham Verge LSP Manager London Borough of Greenwich
Julia Newton Head of Community Services London Borough of Greenwich
Carole Pattison Interim Assistant Chief Executive - Performance Manchester City Council

The Role of Museums, Libraries, Archives and Local Area Agreements
39
NAME ROLE ORGANISATION
Neil MacInnes Head of Service Improvement, Libraries and Theatres Department Manchester City Council
Zoe Hanim Head of Policy, Performance and Community Reading Borough Council
Amur Dave Head of Culture Reading Borough Council
Robert Clayton Acting Head of Culture Rutland County Council
Barbara Langham LSP Officer Rutland County Council
Janice Maskort Head of Libraries Sheffield City Council
David Hewitt City Performance Officer, Corporate Policy Unit Sheffield City Council
Thea Randall County Archivist Staffordshire County Council
Janene Cox Assistant Director- Culture and Libraries Staffordshire County Council
Helen Riley LAA Sponsor Staffordshire County Council
Kate Whitworth Head of Staffordshire Arts and Museum Service Staffordshire County Council
Allyson Jordon Head of Library Service Swindon Borough Council
Stuart Webb Lydiard Manager Swindon Borough Council
Dr Mike Pringle Director Swindon Cultural Partnership
Alison Chamberlain Partnership Development Manager Swindon Partnership
Catherine Sackey LSP Programme Manager Thurrock Council
Simon Black Head of Community Services Thurrock Council
Ann Halliday Library Services Manager Thurrock Council
Jackie Reynolds Head of Corporate Affairs Tyne and Wear Museums
Helen White Senior Manager Tyne and Wear Museums
Clare Skinner County Archivist Wiltshire & Swindon History Centre
Fiona Williams Head of Libraries and Heritage York City Council
Nigel Burchell Head of Strategic Partnerships York City Council
Janet Barnes Chief Executive York Museums Trust

The Role of Museums, Libraries, Archives and Local Area Agreements
40
Appendix 2: Survey Results
Which of the following best describes your role?
Frequency Count
MLA/cultural sector professional 67.6% 152
LAA lead officer (or equivalent) 27.1% 61
LAA partner organisation 5.3% 12
Source: DC Research survey, n=225
Please identify the specific LAA theme(s) your role covers.
Frequency Count
Stronger Communities (or equivalent) 55.6% 5
Safer Communities (or equivalent) 33.3% 3
Children and Young People (or equivalent) 77.8% 7
Adult Health and Well being (or equivalent) 44.4% 4
Tackling Exclusion and Promoting Equality (or equivalent) 33.3% 3
Local Economy (or equivalent) 33.3% 3
Environmental Sustainability (or equivalent) 11.1% 1
Other (please specify) 33.3% 3
Source: DC Research survey, n=9, multiple response
Is the Cultural/MLA sector represented in LAA /LSP structures in your area?
Frequency Count
Yes 66.5% 135
No 24.1% 49
Don't know 9.4% 19
Source: DC Research survey, n=203
Which of the following groups within LAA and LSP structures in your area is the Cultural/MLA sector represented on?
Frequency Count
Stronger Communities (or equivalent) 36.7% 36
Safer Communities (or equivalent) 14.3% 14
Children and Young People (or equivalent) 25.5% 25
Adult Health and Well being (or equivalent) 27.6% 27
Tackling Exclusion and Promoting Equality (or equivalent) 9.2% 9
Local Economy (or equivalent) 20.4% 20
Environmental Sustainability (or equivalent) 2.0% 2
Executive group (or similar) 13.3% 13
Culture specific ‘theme’ group 41.8% 41
Other (please specify) 17.3% 17
Source: DC Research survey, n=98, multiple response

The Role of Museums, Libraries, Archives and Local Area Agreements
41
Is the Cultural/MLA Sector recognised as contributing to local priorities and/or outcomes of the LAA in your local area?
Frequency Count
Yes 74.5% 117
No 14.0% 22
Don't Know 11.5% 18
Source: DC Research survey, n=157
Which themes do the local priorities that the Cultural/MLA Sector contributes towards sit within?
Frequency Count
Stronger Communities (or equivalent) 67.3% 68
Safer Communities (or equivalent) 32.7% 33
Children and Young People (or equivalent) 59.4% 60
Adult Health and Well being (or equivalent) 49.5% 50
Tackling Exclusion and Promoting Equality (or equivalent) 30.7% 31
Local Economy (or equivalent) 43.6% 44
Environmental Sustainability (or equivalent) 12.9% 13
Other 20.8% 21
Source: DC Research survey, n=101, multiple response
Is the Cultural/MLA Sector recognised as contributing to National Indicators and/or outcomes of the LAA in your local area?
Frequency Count
Yes 63.3% 88
No 17.3% 24
Don't know 19.4% 27
Source: DC Research survey, n=139
Which themes do the National Indicators and/or outcomes that the Cultural/MLA Sector contributes towards sit within?
Frequency Count
Stronger Communities (or equivalent) 66.2% 51
Safer Communities (or equivalent) 31.2% 24
Children and Young People (or equivalent) 53.2% 41
Adult Health and Well being (or equivalent) 44.2% 34
Tackling Exclusion and Promoting Equality (or equivalent) 24.7% 19
Local Economy (or equivalent) 29.9% 23
Environmental Sustainability (or equivalent) 9.1% 7
Other (please specify) 26.0% 20
Source: DC Research survey, n=77, multiple response

The Role of Museums, Libraries, Archives and Local Area Agreements
42
Is NI 9 (Adult Participation in Libraries) one of the priority NI's within the LAA in your local area?
Frequency Count
Yes 14.4% 19
No 69.7% 92
Don't know 15.9% 21
Source: DC Research survey, n=132
Is NI 9 (or another local measure of participation in libraries) within your LAA but not as one of the priority NI's?
Frequency Count
Yes 10.6% 12
No 66.4% 75
Don't know 23.0% 26
Source: DC Research survey, n=113
How challenging do you think it was to get NI 9 (or other measures of participation in libraries) included within the LAA for your area?
Frequency Count
Not at all challenging 23.8% 5
Slightly challenging 47.6% 10
Majorly challenging 19.0% 4
Overwhelmingly challenging 9.5% 2
Source: DC Research survey, n=21
Was there any consideration given at all to including NI 9 within the LAA?
Frequency Count
Yes 42.4% 28
No 57.6% 38
Source: DC Research survey, n=66
Is NI 10 (Adult Participation in Museums) one of the priority NI's within the LAA in your local area?
Frequency Count
Yes 3.1% 3
No 89.7% 87
Don't know 8.2% 8
Source: DC Research survey, n=97
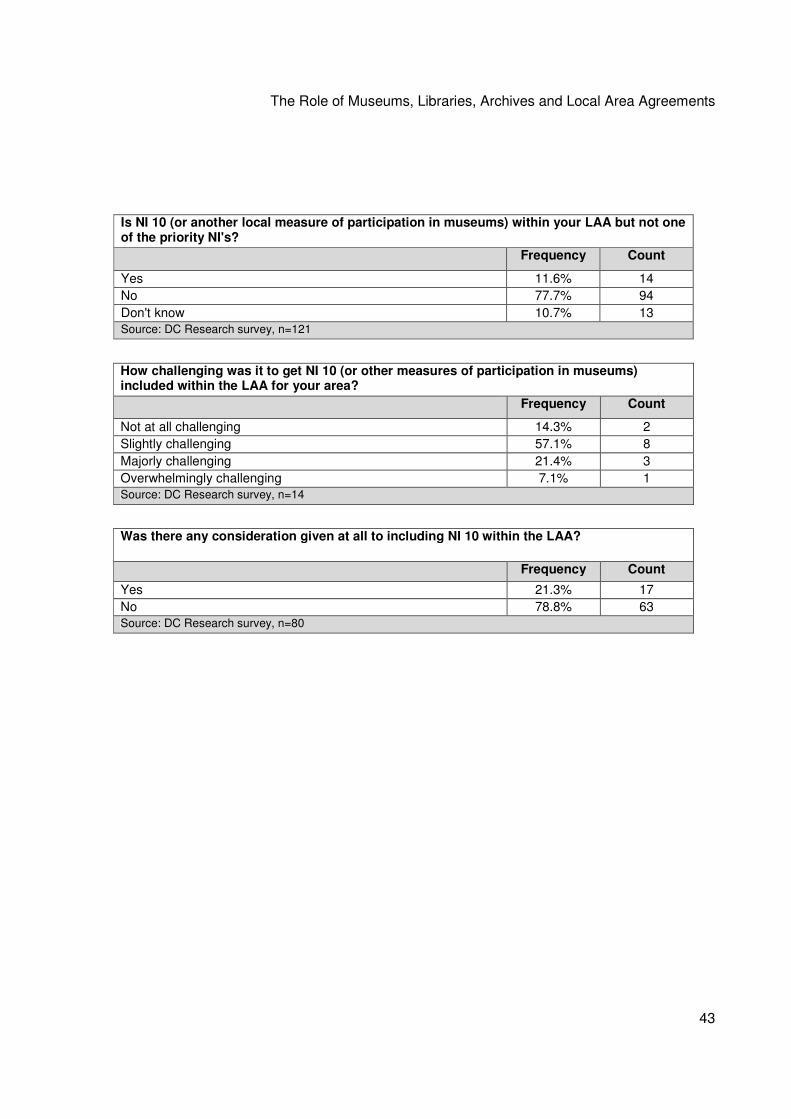
The Role of Museums, Libraries, Archives and Local Area Agreements
43
Is NI 10 (or another local measure of participation in museums) within your LAA but not one of the priority NI's?
Frequency Count
Yes 11.6% 14
No 77.7% 94
Don't know 10.7% 13
Source: DC Research survey, n=121
How challenging was it to get NI 10 (or other measures of participation in museums) included within the LAA for your area?
Frequency Count
Not at all challenging 14.3% 2
Slightly challenging 57.1% 8
Majorly challenging 21.4% 3
Overwhelmingly challenging 7.1% 1
Source: DC Research survey, n=14
Was there any consideration given at all to including NI 10 within the LAA?
Frequency Count
Yes 21.3% 17
No 78.8% 63
Source: DC Research survey, n=80

The Role of Museums, Libraries, Archives and Local Area Agreements
44
How involved would you describe the Cultural/MLA sector as being for each of the following
Major Moderate Minor Not at all
Response Count
As a key strategic partner in the LAA 15 29 45 16 105
As a key strategic partner in the Community Strategy 13 44 42 5 104
As a key strategic partner of the LSP generally 12 31 49 12 104
As a key delivery partner in the Stronger Communities (or equivalent) theme
15 34 43 11 103
As a key delivery partner in the Safer Communities (or equivalent) theme
5 21 52 24 102
As a key delivery partner in the Children and Young People (or equivalent) theme
10 41 39 12 102
As a key delivery partner in the Adult Health and Well Being (or equivalent) theme
13 35 38 16 102
As a key delivery partner in the Tackling Exclusion and Promoting Equality (or equivalent) theme
7 31 42 18 98
As a key delivery partner in the Local Economy (or equivalent) theme
5 31 47 20 103
As a key delivery partner in the Environmental Sustainability (or equivalent) theme
0 12 53 35 100
Source: DC Research survey, 98<n<106, multiple response
How involved would you describe the Cultural/MLA sector as being for each of the following
Major Moderate Minor Not at all
Response Count
As a key strategic partner in the LAA 14.3% 27.6% 42.9% 15.2% 105
As a key strategic partner in the Community Strategy 12.5% 42.3% 40.4% 4.8% 104
As a key strategic partner of the LSP generally 11.5% 29.8% 47.1% 11.5% 104
As a key delivery partner in the Stronger Communities (or equivalent) theme
14.6% 33.0% 41.7% 10.7% 103
As a key delivery partner in the Safer Communities (or equivalent) theme
4.9% 20.6% 51.0% 23.5% 102
As a key delivery partner in the Children and Young People (or equivalent) theme
9.8% 40.2% 38.2% 11.8% 102
As a key delivery partner in the Adult Health and Well Being (or equivalent) theme
12.7% 34.3% 37.3% 15.7% 102
As a key delivery partner in the Tackling Exclusion and Promoting Equality (or equivalent) theme
7.1% 31.6% 42.9% 18.4% 98
As a key delivery partner in the Local Economy (or equivalent) theme
4.9% 30.1% 45.6% 19.4% 103
As a key delivery partner in the Environmental Sustainability (or equivalent) theme
0.0% 12.0% 53.0% 35.0% 100
Source: DC Research survey, 98<n<106, multiple response

Leading strategically, we promote best practice in museums, libraries and archives, to inspire innovative, integrated and sustainable services for all.
Current news, developments and information on our activities are available to view or download from our website.
www.mla.gov.uk Copies of this publication can be provided in alternative formats. Please contact MLA Publications on
020 7273 1458.
Museums, Libraries and Archives Council
Grosvenor House
14 Bennetts Hill
Birmingham
B2 5RS
Tel: +44 (0)121 345 7300
Fax: +44 (0)121 345 7303 Email: [email protected]
Registered Charity No: 1079666