
The Role of miR-605 and its Variant in Li-Fraumeni Syndrome · The Role of miR-605 and its Variant...
63
The Role of miR-605 and its Variant in Li-Fraumeni Syndrome by Badr Idsaid A thesis submitted in conformity with the requirements for the degree of Master of Science Department of Medical Biophysics University of Toronto © Copyright by Badr Idsaid 2014
Transcript of The Role of miR-605 and its Variant in Li-Fraumeni Syndrome · The Role of miR-605 and its Variant...

The Role of miR-605 and its Variant in Li-Fraumeni Syndrome
by
Badr Idsaid
A thesis submitted in conformity with the requirements
for the degree of Master of Science
Department of Medical Biophysics
University of Toronto
© Copyright by Badr Idsaid 2014
ii
The Role of miR-605 and its Variant in Li-Fraumeni Syndrome
Badr Idsaid
Master of Science
Department of Medical Biophysics
University of Toronto
2014
Abstract
Li-Fraumeni Syndrome (LFS) is a rare cancer predisposition syndrome, typically involving
germline mutations in the TP53 gene. Despite the high penetrance of TP53 mutations, LFS
patients display striking phenotypic differences, suggesting the presence of secondary risk loci.
To date, all genetic modifiers in LFS have been shown to map to either TP53 or its principal
negative regulator, Mdm2. Given this strong association, we set out to interrogate the
contribution of a recently-described miRNA regulator of the p53-MDM2 loop, called miR-605.
We hypothesized that, if functional, the miR-605 gene and its variant (rs2043556) could impact
cancer risk in TP53 mutation carriers. Consistent with this proposition, the variant allele of miR-
605 was associated with a significant acceleration in tumor onset and caused a decrease in the
processing efficiency of its host miRNA. We also demonstrate that miR-605 overexpression
activates the MAPK pathway and leads to tumor suppression in TP53 mutant cell lines.

iii
Acknowledgments
I owe my deepest gratitude to my supervisor, Dr. David Malkin, for giving me the opportunity
and encouragement to pursue this topic. Many thanks as well to members of my advisory
committee, namely, Dr. Fei-Fei Liu and Dr. Annie Huang, for their thoughtful advice and
guidance. Finally, I am grateful to members of the Malkin and Tabori labs for their valuable
feedback and support throughout the course of my master’s degree. This project would not have
been possible without the time and effort of these contributors.
iv
Table of Contents
1
Chapter 1: Introduction………………………………………………………
1
1.1 TP53………………………………………………………….……………. 1
1.1.1 TP53 Activation…………………………………………………………… 2
1.1.1.1 p53 Stabilization…………………………………………………................ 2
1.1.1.2 MDM2 Inhibition………………………………………………….............. 4
1.1.2 TP53 Program………………………………………………....................... 5
1.1.2.1 Cell Cycle Arrest…………………………………………………………...... 6
1.1.2.2 Apoptosis………………………………………………………………....... 7
1.2 Li-Fraumeni Syndrome………………………………………………......... 9
1.2.1 Clinical Diagnosis………………………………………………………..... 9
1.2.2 Cancer Risk………………………………………………………………... 10
1.2.3 p53 Connection……..……………………………………………………... 11
1.2.4 TP53 Genotype:Phenotype Correlations…………………………………... 12
1.2.5 Secondary Modifiers in Li-Fraumeni Syndrome………………………….. 13
1.3 MicroRNAs………………………………………………………………... 15
1.3.1 Function and Biogenesis…………………………………………………... 15
1.3.2 The MicroRNAs-TP53 Network…………………………………………. 16
1.3.3 Genetic Variations in MicroRNAs………………………………………… 18
1.3.4 miR-605 and its Variant: a Role in Li-Fraumeni Syndrome?....................... 19
2 Chapter 2: Methods………………………………………………………...... 20
3 Chapter 3: Results…………………………………………………………… 25
3.1 Functional Impact of the miR-605 SNP…………………………………… 25
3.1.1 The miR-605 SNP modifies the age of cancer onset in LFS patients……... 25
3.1.2 The miR-605 SNP affects the processing efficiency of pre-miR-605……. 27
3.2 Role of miR-605 in TP53 Mutant cells……………………………………. 28
3.2.1 miR-605 affects cell viability and colony formation in TP53 mutant cells.. 28
3.2.2 miR-605 affects the chemosensitivity and migration of TP53 mutant cells. 30
3.2.3 miR-605 overexpression activates the MAPK pathway…………………… . 33
4 Chapter 4: Discussion……………………………………………………….. 35
4.1 miR-605 SNP and LFS Cancer Risk………………………………………. 35
4.2 miR-605 Action and Signalling in TP53 Mutant Cells……………………. 37
4.3 Study Limitations………………………………………………………...... 39
5 Chapter 5: Conclusion/Future Perspectives…………...……………….......... 41
v
List of Figures
Introduction
Figure 1: Scheme of p53 protein domains and sites of post-translational modifications
Results
Figure 1: Representative SNP-RFLP genotyping of the miR-605 SNP
Figure 2a: Age of cancer onset in TP53 mutation carriers according to miR-605 genotype
Figure 2b: Percentage of unaffected TP53 mutation carriers for each miR-605 genotype
Figure 3: Schematic representation of SNP expression experiment
Figure 4a: Sanger sequencing of the pre-miR-605-A and pre-miR-605-G vectors
Figure 4b: Impact of the miR-605 SNP on mature miR-605 levels
Figure 4c: Impact of the miR-605 SNP on precursor miR-605 levels
Figure 4d: Processing efficiency of pre-miR-605 according to genotype
Figure 5a: Effect of miR-605 overexpression on cell viability in TP53 mutant cells
Figure 5b: Effect of miR-605 overexpression on colony formation in TP53 mutant cells
Figure 5c: Representative plates from colony formation assay
Figure 5d: Western Blot targeting Mdm2, p53 and Vinculin in RD cells
Figure 6a: Effect of miR-605 on RD and Rh30 chemosensitivity to Actinomycin D
Figure 6b: Effect of miR-605 on RD and Rh30 chemosensitivity to Doxorubicin
Figure 6c: Effect of miR-605 on RD and Rh30 chemosensitivity to Etoposide
Figure 7a: Effect of miR-605 overexpression on cell migration in TP53 mutant cells
Figure 7b: Representative inserts from migration assay
Figure 8: Western Blot targeting MAPK proteins in RD cells
vi
List of Appendices
Appendix 1
Supplementary Figure 1: Secondary structures of wild-type and variant pre-miR-605
Supplementary Figure 2: Sequence of miR-605 PCR primers
Supplementary Figure 3: Representative Sanger sequencing of miR-605 genotypes
Appendix 2
Supplementary Table 1: Validated functional pre-miRNA SNPs
Supplementary Table 2: Predicted miR-605 targets in MAPK and/or p53 signaling

vii
List of Abbreviations
ARF Alternate Reading Frame Protein
Arg72Pro Arginine-to-Proline Substitution at Codon 72
Bcl-2 B-cell Lymphoma 2
BH3 Bcl-2 Homology 3
CDK2 Cyclin-Dependent-Kinase 2
CNV Copy Number Variation
Cyt C Cytochrome C
E2F E2 Promoter Binding Factor
ERK Extracellular-Signal-Regulated Kinase
JNK c-Jun N-terminal Kinase
Kb Kilo-Base Pair
LFS Li-Fraumeni Syndrome
LFS-C Li-Fraumeni Syndrome-Classic
LFS-L Li-Fraumeni Syndrome-Like
MAF Minor Allele Frequency
MAPK Mitogen-Activated Protein Kinase
MDM2 Mouse Double Minute 2
MDMX Mouse Double Minute X
miRNA MicroRNA
mRNA Messenger RNA
p21/CDKN1 Cyclin-dependent Kinase Inhibitor 1
p38 p38 MAP Kinase
p53 tumor protein, 53kDa
PCR Polymerase Chain Reaction
PEX4 Polymorphism in Exon 4
PIN3 Polymorphism in Intron 3
viii
pRB Retinoblastoma Tumor Suppressor
pre-miRNA Precursor-miRNA
pri-miRNA Primary-miRNA
qRT-PCR Quantitative Reverse Transcriptase Polymerase Chain Reaction
RE Response Element
RISC RNA-induced Silencing Complex
RMS Rhabdomyosarcoma
Ser Serine
SNP Single Nucleotide Polymorphism
SNP309 Single Nucleotide Polymorphism Codon 309
SNP-RFLP SNP-Restriction Fragment Length Polymorphism
Trp53 Transformation Related Protein 53
UTR Untranslated Region

1
CHAPTER 1
INTRODUCTION
1.1 TP53
The p53 protein, dubbed “the guardian of the genome”, plays a crucial role in
coordinating cellular defenses against cancer. Initially discovered because of its association with
the large T antigen of the Simian polyomavirus (SV40), early studies of this gene (TP53) and its
encoded product (p53) showed elevated expression in human cancer cell lines and the ability to
transform normal cells1,2,3
. These initial findings strongly indicated that TP53 was a novel
oncogene. However, with the discovery of inactivating TP53 alterations in human cancer cell
lines and tumors, and later by the finding that patients with Li-Fraumeni Syndrome had inherited
TP53 mutations, it became clear that TP53 was, in fact, a tumor suppressor gene and not an
oncogene as had been earlier suggested4,5,6
. Studies revealed that the “wild-type” allele used in
prior experiments was actually a mutant TP53 gene and that wild-type p53 could in fact suppress
cellular transformation7. Subsequent work on the mouse TP53 gene (Trp53) in heterozygous
(Trp53 +/-) and knockout (Trp53 -/-) mice –both highly tumorigenic breeds– would further
confirm the tumor suppressive role of the p53 protein8,9
. Today, it is clear that p53 dysfunction is
an important step in the transformation process of normal cells into cancer cells10
.
The TP53 gene spans approximately 20-Kb on the short arm of chromosome 17
(17p13.1) and consists of 11 exons, the first of which is non-coding9. The structure of the p53
protein reflects its role as a sequence-specific DNA binding transcription factor11
. p53 consists
of 393 amino acids that together make up four important functional domains: an N-terminal
domain, a DNA binding domain, a tetramerization domain and a C-terminal domain12
. The C-
terminal lysine-rich domain plays a key role in regulating the activity and nuclear localization of
2
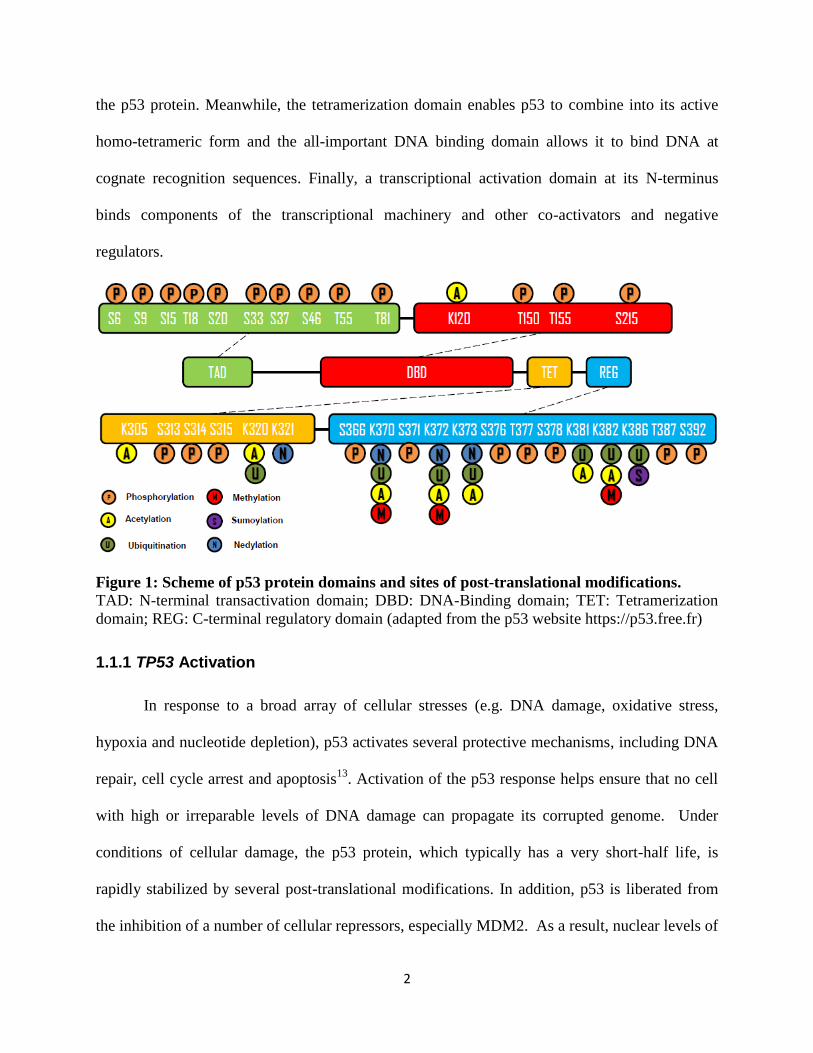
the p53 protein. Meanwhile, the tetramerization domain enables p53 to combine into its active
homo-tetrameric form and the all-important DNA binding domain allows it to bind DNA at
cognate recognition sequences. Finally, a transcriptional activation domain at its N-terminus
binds components of the transcriptional machinery and other co-activators and negative
regulators.
Figure 1: Scheme of p53 protein domains and sites of post-translational modifications.
TAD: N-terminal transactivation domain; DBD: DNA-Binding domain; TET: Tetramerization
domain; REG: C-terminal regulatory domain (adapted from the p53 website https://p53.free.fr)
1.1.1 TP53 Activation
In response to a broad array of cellular stresses (e.g. DNA damage, oxidative stress,
hypoxia and nucleotide depletion), p53 activates several protective mechanisms, including DNA
repair, cell cycle arrest and apoptosis13
. Activation of the p53 response helps ensure that no cell
with high or irreparable levels of DNA damage can propagate its corrupted genome. Under
conditions of cellular damage, the p53 protein, which typically has a very short-half life, is
rapidly stabilized by several post-translational modifications. In addition, p53 is liberated from
the inhibition of a number of cellular repressors, especially MDM2. As a result, nuclear levels of
3
p53 quickly rise and activated p53 acts as a sequence-specific transcription factor, leading to the
transcription – and sometimes the repression – of a number of different genes14
.
1.1.1.1 p53 Stabilization
Under normal conditions, the half-life of the p53 protein ranges between 5-30 min15
,
mainly due to the action of MDM2-mediated proteosomal degradation16
. In response to stress, a
number of different post-translational modifications act to rapidly stabilize p53. These
modifications are thought to stabilize the p53 protein by controlling its interaction with multiple
cellular factors, but particularly its association with the MDM2 protein. At least 36 different N-
and C-terminal amino acid residues are known to be affected by phosphorylation, acetylation,
methylation, ubiquitination and sumoylation17
. Out of these modifications, phosphorylation is
regarded as the most prolific and well-studied mode of p53 stabilization. Multiple protein kinases
including ATM (mutated in ataxia-telangiectasia); ATR (A-T and Rad3-related); DNA-PK
(DNA-dependent protein kinase), Chk1 and Chk2 have been shown to phosphorylate p5318
.
ATM-mediated phosphorylation of Ser15, as a result of DNA-double strand breaks, is
particularly noteworthy because of its role in facilitating the dissociation of MDM2 from p5319
.
Phosphorylation of Ser20 by Chk2 is also known to achieve the same end20
. As such,
phosphorylation at these sites is well-correlated with increased p53 levels; other commonly
phosphorylated sites occur at Ser33 and Ser4617
.
Another common mode of p53 stabilization involves the acetylation of several lysine
residues in its C-terminus. Transfer of an acetyl group by histone acetyltransferases (HATs) such
as p300 alters the folding of the C-terminal region of p53 and helps to expose its important
DNA-binding domain. These acetylated residues can also block MDM2-mediated ubiquitination
and degradation21
. In addition, evidence suggests that specific modifications, such as the
4
previously described Ser15 phosphorylation, are necessary first steps that facilitate further post-
translational modifications22
. Thus, the interplay of various modifications adds yet another layer
of complexity to the stress-induced stabilization of the p53 protein. It is important to note
however, that p53 retains its transcriptional activity even when all phosphorylation sites are
mutated, highlighting a level of redundancy in the p53 stabilization process, as well as perhaps
the supremacy of MDM2 regulation over other modes of p53 stabilization.
1.1.1.2 MDM2 Inhibition
In light of its critical functions, p53 activity is tightly regulated by several cellular factors,
but most importantly by MDM2. The Mdm2 gene, initially identified in mouse double minute
chromosomes, encodes a protein product that exerts tight control over p53 activity. Binding of
MDM2 to the N-terminus of p53, a region important for p53’s transactivational potential,
directly blocks its transcriptional activity23
. Fulfilling its role as a E3 ubiquitin ligase, MDM2
can also target p53 for degradation through its ubiquitin-mediated proteosomal pathway24
.
Furthermore, MDM2 is also known to promote the nuclear export of p53 and its cytoplasmic
accumulation as a result of mono-ubiquitination. Thus, MDM2 controls p53 activity at multiple
levels. Not surprisingly, conditional removal of the Mdm2 gene in adult tissues leads to cell
lethality as a result of elevated and hyperactive p53 signaling25
. Further evidence for the
intricate relationship between MDM2 and p53 comes from the observation that while
constitutive Mdm2 knockout mice are embryonic lethal, mice lacking both genes are viable26
.
Adding to this complexity, Mdm2 is also a transcriptional target of p5327
; therefore, MDM2
regulates p53 through an autoregulatory negative feedback system. The purpose of this
regulatory loop is to prevent p53 activation in unstressed cells and to reduce the severity of the
p53 response once activated28
. Consequently, the p53 response can only be activated once this
5
regulatory loop is broken. In response to stress, a variety of signals act to destabilize and inhibit
MDM2 activity29
. For example, ATM-mediated phosphorylation of MDM2 at Ser395 occurs
frequently in response to stress, helping to block the ability of MDM2 to degrade p53 and
promote its nuclear export30
. Furthermore, MDM2 activity can also be inhibited by increased
acetylation31
. Finally, decreased sumoylation of MDM2 can further inhibit its activity by
increasing its self-ubiquitination32
.
It is evident that post-translational modifications to both p53 and MDM2 play a role in
breaking the auto-regulatory loop controlling these two proteins; however, these modifications
are not the only factors involved in liberating p53 from MDM2 control. In this respect, the ARF
protein (p14 ARF) also plays a crucial role. ARF activates p53 by inhibiting the ubiquitin
activity of MDM2 as well as promoting its sequestration in the nucleolus33
. MDMX is yet
another potent modulator of the MDM2-p53 regulatory loop. In a manner similar to MDM2,
MDMX can also bind and inactivate p53 through its N-terminal domain but unlike MDM2, it has
no ubiquitin activity of its own34
. Paradoxically, MDMX can also activate p53 by binding
MDM2 through its RING finger domain35
. More recently, a number of small non-coding
regulatory RNAs (miR-192, -194, -215 and -605) have been shown to negatively regulate the
feedback loop controlling p53 and MDM2 function36,37
.
1.1.2 TP53 Program
The p53 protein acts primarily as a sequence-specific transcription factor. Not
surprisingly, the majority of TP53 mutations target the DNA-binding domain of p5338
. Target
genes that are activated by p53 typically contain at least one Response Element (RE) within their
promoter regions. In some instances, p53 RE sites may also be located in intronic or even exonic
regions39
. These canonical sites are usually made up of two half sites (5-RRRCWWGYYY-3)
6
separated by a variable number of nucleotides40
; however, non-canonical p53 RE are also known
to exist41,42
. Once bound to these REs through its DNA-binding domain, the N-terminal domain
of p53 facilitates transcription by attracting several members of the transcriptional machinery. In
this way, p53 activates genes involved in a variety of cellular processes, especially cell cycle
arrest and apoptosis.
1.1.2.1 Cell Cycle Arrest
The cell cycle is composed of four distinct stages (G1, S, G2 and M phase), and each cell
must pass through two important checkpoints (G1/S and G2/M checkpoints) before completing
cellular division, or mitosis43
. Normal cells, unlike those lacking p53, arrest during these critical
checkpoints in order to monitor the state of the cell and engage in DNA repair if needed44
. By
controlling the expression of multiple cell-cycle genes, p53 plays a pivotal role in dictating
whether a cell will progress through the cell cycle and undergo mitosis45
. The protein encoded by
the p21 gene (CDKN1A) represents the most prominent mediator of TP53-induced G1/S arrest46
.
Studies show that ectopic expression of the N- and C-terminal regions of p21 alone is sufficient
to induce cell-cycle arrest. Under conditions of stress, p53 up-regulates the transcription of p21,
leading to the inhibition of its most important cellular target: the Cyclin-Dependent-Kinase 2
(CDK2)47
. Importantly, activated p21 blocks CDK2 from phosphorylating and inactivating the
pRb protein, thus helping maintain pRb-mediated repression of the E2F family of transcription
factors. As a result, E2F-target genes responsible for facilitating the G1/S transition remain
transcriptionally silent and the cell cycle is temporarily arrested at G148
. Once checkpoint
requirements have been met and DNA repair has occurred, p53 levels drop and inhibition of
CDK2 by p21 is removed, allowing the cell to replicate its DNA in the S phase and proceed
towards the G2 phase. The final G2/M checkpoint is also similarly regulated by p53. In cancers
7
with a mutated TP53, the appropriate cell cycle response to DNA damage is impaired. Instead,
p53 dysfunction and thus deficient p21 activation empowers cancer cells to proceed through cell
cycle checkpoints despite the presence of oncogenic lesions in its DNA.
1.1.2.2 Apoptosis
In cases where the DNA is damaged beyond repair, apoptosis is needed in order to
safeguard the cell against oncogenic transformation49
. Apoptosis or programmed cell death is a
complex biochemical event that leads to specific morphological changes which culminate in
cellular death. Apoptotic cells are typically identified by the following morphological features:
formation of protrusions in the plasma membrane called ‘blebs’, cell shrinkage, nuclear
fragmentation, condensation of chromatin known as pyknosis, and finally DNA fragmentation.
Normally, apoptosis is a tightly regulated developmental and homeostatic process. For example,
the normal self-renewal of the gut epithelium depends on an intricate balance between cellular
proliferation and apoptosis while in the developing human embryo, apoptosis is necessary for the
proper separation of digits. Cancer cells will often evade this program by turning off apoptotic
signals. In fact, evasion of apoptosis is a major hallmark of cancer50
and abrogation of the TP53
response, typically through mutations in the DNA binding domain of TP53, a common
mechanism through which cancer cells can counter cell death. While TP53-induced apoptosis
can occur through transcription-independent pathways51
, this process is primarily dependent on
the transactivation of multiple components of the extrinsic and intrinsic apoptotic pathways (see
below)45
.
The extrinsic apoptosis pathway involves the ligand-induced activation of specific
“death” receptors belonging to the tumor necrosis factor receptor (TNF-R) family. Once
engaged, these cell surface receptors form a death-inducing-signaling-complex (DISC), in which

8
two important initiator caspases (caspase-8 and -10) are recruited and activated. These initiator
caspases in turn promote the maturation of the zymogenic form of the effector caspases
(caspases-3, -6 and -7), which finally cleave their own set of cellular targets in order to trigger
apoptosis52
. The p53 protein activates this important pathway by upregulating the expression of
its component parts in a tissue and stress-specific manner53
. Specifically, p53 augments the
activation of genes encoding three trans-membrane “death” receptors (Fas, DR5, PERP)54,55
, as
well as the expression of specific pro-apoptotic ligands such as TRAIL56
.
In the intrinsic pathway, apoptosis is triggered by the depolarization of the mitochondria
and the subsequent release of cytochrome C (cyt C) from the mitochondrial intermembrane space
into the cytoplasm. As a result, cyt C combines with apoptotic protease-activating factor 1
(APAF-1) and procaspase-9 to form a wheel-like molecule, termed the apoptosome. This “death
machine” serves to activate caspase-9, and with it the rest of the caspase cascade 57
. TP53-
mediated induction of the intrinsic pathway revolves around its transcriptional control over a
subset of the Bcl-2 family of proteins. The Bcl-2 family is composed of both pro-survival and
pro-apoptotic members which can associate with the mitochondria and which can be further
divided into three classes: pro-survival proteins (Bcl-2 and Bcl-Xl); pro-apoptotic proteins that
structurally resemble Bcl-2 (Bax and Bak); and finally pro-apoptotic BH3-only proteins (Puma,
Noxa, Bid)58
. In addition to Bax, all BH3-only proteins are transcriptional targets of TP5359,60,61
.
Following p53 induction, these genes help shift the balance of Bcl-2 family members at the
mitochondria towards the pro-apoptotic members. As a result, the mitochondria depolarize and
cyt C is released triggering the formation of the apoptosome and ultimately apoptosis.

9
1.2 Li-Fraumeni Syndrome
In addition to being the most mutated gene in sporadic cancers (>50%), TP53 dysfunction
is also implicated in the etiology of a peculiar familiar cancer syndrome, called Li-Fraumeni
Syndrome (LFS)4,62
. LFS was first described by Drs. Frederick Li and Joseph F. Fraumeni Jr in
1969 whilst studying families of children diagnosed with a rare soft-tissue tumor called
rhabdomyosarcoma63
. Upon retrospective analysis, they discovered that five of these families
had a second child who had also been diagnosed with a soft-tissue sarcoma. These families also
had a higher than usual prevalence of a number of different cancer types (soft-tissue sarcoma,
premenopausal breast cancer, adrenocortical carcinoma and brain tumors) amongst first- and
second-degree relatives from the same parental lineage. This observed inheritance pattern
coupled with the unusual clustering of early-onset tumors in these families was indicative of a
previously unknown autosomal dominant cancer predisposition syndrome.
1.2.1 Clinical Diagnosis
Prospective analysis of 24 similar families further defined this newly described syndrome
by the presence of all of the following criteria: a proband with a sarcoma diagnosed before age
45 years who has a first-degree relative with any cancer before age 45 years, as well as a first- or
second-degree relative with any cancer before age 45 years or a sarcoma at any age64
. Families
which fit this clinical criterion were defined as “classic” LFS (LFS-C). As the observed
component tumors of LFS expanded beyond the previously described “classic LFS tumors” to
include choroid plexus carcinoma, colorectal cancer, melanoma, lymphoma, gastric cancer,
Wilms tumor and germ cell tumor, the clinical definition of LFS similarly expanded65
. Today,
families that do not precisely fit the LFS-C criteria are termed “LFS-like” (LFS-L) and are
defined by a less stringent criterion in terms of the tumor types included and the age cut-offs66
.

10
The LFS-L criteria were further refined first by the “Chompret criteria” and later by the “revised
Chompret criteria” in order to account for those individuals with early-onset tumors who are
highly suggestive of LFS even in the absence of a clear family history of cancer67,68
.
1.2.2 Cancer Risk
The diagnosis of LFS carries a devastating prognosis: TP53 mutation carriers have up to
a 90% lifetime risk of developing cancer. A hospital-based analysis that investigated cancer risk
among LFS mutation carriers estimated that for males the lifetime probability of developing
cancer was approximately 73%, whereas for females it was nearly 100%. This marked difference
in lifetime cancer risk primarily resulted from the high risk of female breast cancer. In addition
to lifetime risk, probabilities of developing cancer were also examined in different age groups.
For male mutation carriers, the risk of developing cancer before the age of 15 was 19%, which
was higher than the probability in females (12%). However, in the age groups of 16 to 45, and 45
or older, the risk in females was 82% and 100% respectively; which was higher than the
probabilities observed for males (27% and 54%, respectively)69
. A subsequent study by Hwang
et al, where both TP53 mutation carriers and control non-carriers were followed for 20 years,
confirmed the results from the earlier hospital-based studies70
. This report also highlighted the
point that despite the similar distribution of TP53 mutations between males and females, the
cancer risks conferred by these mutations were significantly higher in females (p<0.001).
An important clinical feature of LFS that distinguishes it from other cancer susceptibility
syndromes is that LFS predisposes individuals towards a wide variety of cancer types. However,
the most common LFS tumors tend to include breast cancers, brain tumors, soft-tissue sarcomas,
adrenocortical carcinomas and bone sarcomas. These five cancer types account for 30.6%
(breast), 17.8% (soft-tissue), 14% (brain), 13.4% (bone) and 6.5% (adrenal gland) of LFS

11
malignancies71
. Furthermore, each tumor type also has a distinct profile in terms of the mean age
at presentation72
. For instance, brain tumors in LFS follow a bimodal distribution with two
peaks, one in childhood, and another in the 20s and 30s. On the other hand, tumors such as
osteosarcomas and soft-tissue sarcomas occur most frequently during the period of childhood
and adolescence. In addition to the disparate ages of cancer onset, multiple synchronous or
metachronous LFS tumors may also develop in the same patient73
.
1.2.3 The p53 Connection
In 1990, Malkin et. al employed a candidate gene approach in order to identify the
vertically transmitted susceptibility allele suspected of causing LFS. TP53 was chosen as a
promising candidate because of its widespread dysfunction in sporadic human cancers (>50%)
as well as evidence from transgenic mice linking mutant p53 overexpression to the development
of multiple cancers62,74
. All five of five LFS families studied in the initial report tested positive
for heterozygous point mutations spanning exons 5-9 of the TP53 gene75
. Since then, TP53
mutations have been shown to underlie 60% to 80% of “classic” LFS families, whilst on the
other hand contributing little to the etiology of LFS-L families76
. The spectrum of germline TP53
mutations in LFS closely mirrors the distribution of sporadic TP53 lesions, with the majority of
mutations manifesting as missense mutations in the highly-conserved DNA binding domain of
TP5338
. Specifically, these point mutations tend to cluster at specific “hotspots”; namely, codons
175, 245, 248, 249, 273, and 282. Due to their location either at or near the p53-DNA interface,
these recurrent “hotspot” lesions have a detrimental effect on the ability of p53 to act as a
sequence-specific transcription factor.
Furthermore, the predominance of missense mutations as the most common mode of
TP53 inactivation (>70%) is a particularly striking example of tumor evolutionary fitness62
. It is

12
thought that cancer cells acquire a distinct selective survival advantage when they retain the full
length mutant p53 protein as opposed to completely removing it. Studies show that mutant TP53
not only acquires a new oncogenic role but that it also sequesters the wild-type gene product of
TP5377,78
. For example, while overexpressing normal p53 can have profound anti-cancer effects,
overexpression of mutant p53 is sufficient to transform normal cells and increase the resistance
of cancer cells to chemotherapeutics and apoptosis79,80
. TP53 knock-in mice (+/mut) in which the
wild-type TP53 allele is swapped for a hotspot mutant also develop a more aggressive and
metastatic tumor profile when compared with TP53 knock-out mice (-/-)81
. In addition, since
mutated p53 becomes expressed at very high nuclear levels compared to its normal counterpart,
the mutant protein can also bind and inactive its close relatives, the tumor suppressors p63 and
p73, whilst also inactivating the remaining wild-type gene product of p53 by forming
dysfunctional mixed tetramers82,83
. Thus, the ubiquitous missense p53 mutants can promote
tumorigenesis through both a gain-of-function, and a dominant negative mechanism.
1.2.4 TP53 Genotype: Phenotype Correlations
Through site-directed mutagenesis of almost every single TP53 codon (>2000 mutants),
Kato et al were able to demonstrate that a patchwork of transcriptional activity defined different
p53 mutant genotypes84
. Following this revelation, multiple studies began dissecting
genotype:phenotype correlations in LFS. For example, in a study examining French LFS
families, the mean age of cancer onset was 9 years earlier for individuals carrying the more
oncogenic missense TP53 mutants85
. This suggested that earlier age of cancer onset in LFS was
directly related to the severity of the TP53 mutation. Additionally, these correlations also seem to
extend to the types of tumors that LFS patients develop. For example, LFS patients with early-
onset cancers such as brain tumors are more likely to carry nonsense, frameshift and splice TP53
13
mutations. Patients with adrenocortical cancers, on the other hand, are more likely to harbor
mutations in the non-DNA binding loops of p5371
.
Despite these advances, however, genotype:phenotype do not yet fully account for the
multitudes of tumors and the disparate ages of cancer onset typically observed in LFS patients.
Furthermore, functional differences in p53 activity cannot account for interfamilial variations in
LFS given that all affected members carry the same defective copy of the TP53 gene. Instead,
secondary genetic factors have been posited to be responsible for an important spectrum of these
clinical differences. Given the central importance of the p53 network in the etiology of LFS,
members of this signaling pathway have received particular scrutiny. To date, functional
polymorphisms in TP53 (Arg72Pro)/(PIN3), MDM2 (SNP 309), as well as DNA copy number
variations (CNVs) and telomere attrition, have been associated with cancer risk in LFS86,87,88,89,90
.
1.2.5 Secondary Modifiers in Li-Fraumeni Syndrome
The TP53 PEX4 polymorphism, which results in an Arginine to Proline substitution at
codon 72, was one of the first common variants to be implicated as an age of onset modifier in
LFS89
. Studies showed that the Pro72 and Arg72 variants of TP53 are functionally distinct. In
fact, not only does the Arg72 variant bind MDM2 with higher affinity and is thus degraded by it
faster, but as a result of greater mitochondrial localization, it can also induce apoptosis more
efficiently than the Pro72 variant91
. In LFS, carriers of the TP53 codon 72Arg allele develop
cancer at earlier ages compared to individuals who are homozygous for the 72Pro allele
(Pro:Pro)89
. The other modifier variant to be associated with cancer risk in LFS is the SNP309
polymorphism in intron 1 of the Mdm2 gene89,88
. This common genetic variation, which results
in a T to G transition, results in increased binding affinity for the Sp1 transcription factor; thus,
leading to higher basal levels of MDM2. As a result of elevated MDM2 levels, tumor cell lines

14
which are homozygous for the SNP309 (G/G) are unable to stabilize p53, and have an impaired
response to DNA damage92
. LFS patients who carry at least one copy of the SNP309 G-allele
have been shown to develop tumors at earlier ages compared to mutation carriers who are
homozygous for the T-allele89,88
. Intriguingly, the tumor accelerating effects of the Mdm2
SNP309 polymorphism seem to be amplified when present alongside the TP53 PEX4 variation93
.
Finally, a 16 base-pair duplication in intron 3 of TP53, which was reported to be associated with
lower levels of p53 mRNA in lymphoblastoid cells, has also shown age modifying activity in a
unique Brazilian LFS population carrying the R337H mutation87
. Thus, it seems that genetic
factors which impact p53 activity are plausible modifier events in patients with Li-Fraumeni
syndrome.
More recently, Shlien et. al uncovered higher levels of CNV enrichement in TP53
mutation carriers compared to controls90
. Accelerated telomere attrition has also been suggested
as a plausible mechanism for the observed reduction in the age of cancer onset through
successive generations of LFS families. Specifically, telomere length was shorter in affected
carriers compared to their non-affected and non-carrier family members86,94.
Today, it is clear
that individual LFS phenotypes are defined not only by the underlying germline TP53 mutation
but also by an important interplay of different modifier genes. Acting in tandem, different
combinations of these low-penetrance susceptibility loci could account for the wide spectrum of
different susceptibilities that characterize LFS95
. Thus, developing useful biomarkers for the
future clinical monitoring of LFS patients will require a more thorough and complete
understanding of all p53 modifying events.

15
1.3 MicroRNAs
MicroRNAs (miRNAs) are 19-25 nucleotide non-coding regulatory RNAs, that
participate in a variety of developmental pathways and whose deregulation has been implicated
in the etiology of human cancers96,97
. In 1993, Ambros et al discovered the very first miRNA
whilst screening for mutations that could block developmental stages in the worm
Caenorhabditis elegans98
. A mutant, called Lin-4, proved particularly interesting given that its
gene product was not a protein. Instead, Lin-4 produced a single stranded 22-nucleotide long
RNA molecule, which could bind with anti-sense complementarity to several sites in the
3’untranslated region (3’UTR) of lin-14. In the process, lin-4 could block the translation of the
lin-14 mRNA. It was not until 2000 that a second miRNA, named let-7, was discovered99
. More
important was the discovery that the let-7 sequence was evolutionarily conserved across
species100
. Thus, for the first time, miRNAs were recognized as an ancient and ubiquitous
eukaryotic program for regulating gene expression. Since then, more than 1000 microRNA genes
have been identified in humans 101
.
1.3.1 Biogenesis and Function
Functionally, miRNAs behave primarily as sequence-specific post-transcriptional
regulators of gene expression, affecting >60% of human genes102
. The seed sequence, typically
comprising nucleotides 2-7 of the mature miRNA sequence, is thought to specify the targeting
repertoire of each miRNA. By binding to the 3’ UTR of the complementary mRNA, each
miRNA can lead either to the degradation or translational repression of about 100 different
transcripts103
. The biogenesis of miRNAs is a multi-step process that involves numerous cellular
factors. miRNAs are first transcribed by RNA polymerase II as a primary miRNA (pri-miRNA)
transcript, that is capped and polyadenylated104
. This hairpin structure is recognized and cleaved

16
by the nuclear RNAse III endonuclease DROSHA and its partner DGCR8, leading to the
production of a 60-70 nucleotide stem-loop structure, called precursor miRNA (pre-miRNA)105
.
Alternatively, pre-miRNAs may also be produced from splicesome processing of intragenic
miRNA sequences. However they are generated, the next step involves the nuclear export of the
pre-miRNA structure by Exportin-5 and GTP-bound RAN106
. Once in the cytoplasm, the pre-
miRNA is processed by yet another endonuclease, Dicer. Dicer, along with TRBP cleaves the
pre-miRNA into a short RNA duplex. This duplex then dissociates into two single-stranded RNA
molecules (ssRNAs), namely the guide and the passenger strands. Generally, the passenger
strand is degraded while the guide strand is loaded into the RNA-induced Silencing Complex
(RISC). Within RISC, the guide strand binds with anti-sense complementarity to sites in the
sequence of its target mRNA. Depending on the extent of complementarity, RISC binding can
lead to either the degradation or translational repression of target sequences107
.
1.3.2 The MicroRNA-TP53 Network
Recently, several microRNAs have emerged as major players in the TP53 network. In
2007, the miR-34 genes (miR-34a and miR-34b/c) emerged as the first miRNA transcriptional
targets of TP53108
. In response to stress, activated p53 induces the transcriptional upregulation of
the miR-34 gene family. When ectopically expressed, miR-34 genes negatively regulate the
expression of multiple oncogenic genes, leading to cell cycle arrest and apoptosis. Importantly, a
majority of these genes, such as CDK4, CDK6, Cyclin D1 and c-MYC are known targets of
TP53-mediated repression109,110,111,112
. Thus, it seems that the miR-34 gene family represents the
missing link that controls TP53-meditated target repression. In addition to miR-34, numerous
other miRNAs, including miR-107, miR-145, miR-15a/16-1, miR-192, miR-194 and miR-215,
have been identified as TP53 transcriptional targets113,114,115,116
. Similar to miR-34, these p53-
17
induced miRNAs play an important role in negatively regulating protein repressors of the TP53
pathway.
Intriguingly, the p53 protein has also been shown to play a role in miRNA maturation117
.
Specifically, the wild-type p53 protein, but not its mutant version, was found to directly bind the
DROSHA complex and facilitate the processing of specific pri-miRNA transcripts. As a result of
enhanced p53-mediated processing, the levels of several miRNAs such as miR-16-1, miR-143
and miR-145 are increased, leading to the repression of their target genes. Thus, the proper
maturation of miRNA transcripts represents yet another important p53 function, which is lost in
the context of TP53 mutant cells. Furthermore, p53 has also been found to impact the selection
of miRNA targets by upregulating the expression of a natural molecular competitor of
miRNA:mRNA, called RNA-binding-motif protein 38 (RBM38)118
.
Not surprisingly, the TP53 mRNA transcript itself has emerged as a major target of
miRNA regulation. Multiple miRNAs such as miR-125b, miR-504, miR-33 and miR-1285
negatively regulate TP53 expression by binding to complementary sequences in the 3’UTR of
the TP53 mRNA119,120,121,122
. Indeed, activation of these oncogenic miRNAs is associated with
anti-p53 functions such as deficient cell cycle arrest, decreased cell death, and increased
stemness. The MDM2 transcript, as the most important controller of TP53 levels, is similarly
regulated by multiple miRNAs. Direct inhibition of MDM2 translation by p53-inducible
miRNAs (miR-192, miR-194, miR-215 and miR-605) promotes the activation of the p53
pathway123,36,37
. Thus, it is evident that miRNAs are not only regulated by p53, but in turn they
play important roles in regulating p53 itself, as well as its most important regulator, MDM2.
18
1.3.3 Genetic Variations in MicroRNAs
In cancer, miRNAs are often aberrantly expressed as a result of different mechanisms,
including genomic rearrangements, mutations, DNA copy number and epigenetic changes.
Recently, common point variations (SNPs) within miRNA genes have emerged as yet another
potent mechanism for miRNA deregulation. To date, more than 757 SNPs have been identified
in 440 pre-miRNA sequences. Amongst this, 178 SNPs map to the mature sequence of miRNAs
and only 50 SNPs are located in the important seed regions124
. Carlos et al were amongst the first
to demonstrate that variations in miRNA genes could cause cancer125
. In this study, they
discovered that a kindred with familial chronic lymphocytic leukemia had inherited a germ line
mutation in pri-miR-16-1, which led to lower levels of miR-16-1 expression. Subsequently,
several groups began reporting SNP-mediated miRNA dysfunction for several individual
miRNAs. For example, a SNP in the 3p strand of miR-146a was found to reduce the amount of
pre- and mature miR-146a levels by 1.9- and 1.8-fold, respectively; predisposing these patients
to papillary thyroid carcinoma126
. As a result of lower miR-146a levels, the variant C allele was
also less efficient at inhibiting its target genes. Moreover, tumors from heterozygote carriers of
this SNP had a markedly different apoptotic expression profile compared to homozygotes127
. In
other studies, SNPs in the pre-miRNA region of miR-196a-2, miR-499, miR-423, miR-492,
miR-27a, miR-631, and the pri-miRNA region of miR-26a-1, miR-124-1, miR-219-1 have also
been implicated with increased susceptibility to multiple cancer types128,129,130,125
. Based on those
studies, a SNP in a miRNA gene can be predicted to alter the function of its host miRNA in one
of three different ways: a) it can alter the transcriptional activation of the pri-miRNA; b) the
post-transcriptional processing of the pri- and pre-miRNA transcripts; and finally, c) the
interactions between miRNAs and their target mRNAs.
19
1.3.4 miR-605 and its variant: A role in Li-Fraumeni Syndrome?
Intriguingly, some miRNA regulators of the TP53 network are also known to contain
common genetic variations, which have previously been tested in cancer association studies. One
particular member of this family, miR-605 has been shown to liberate p53 from the control of the
MDM2-p53 negative feedback loop36
. These effects were shown to be mediated by miR-605
regulation of MDM2. In response to stress, Wang et al showed that miR-605 levels accumulated
in the cell, leading to lower levels of MDM2. As a result, p53 escapes MDM2 control and its
target genes are activated. miR-605 is thus a potent modulator of p53 signaling, and its
deregulation another potential mechanism through which cancer cells can escape p53-mediated
tumor suppression. This specific miRNA is also known to host a common genetic variant
(rs2043556) in its pre-miRNA sequence, which is located 74 base pairs (bps) downstream of the
5’ end of the pre-miRNA. The A>G polymorphism has a Minor Allele Frequency (MAF) of
0.344 and an energy change (ΔΔG) of 2.6 kcal/mol. In a recent study, the miR-605 SNP was
associated with gastrointestinal cancer risk131
. Furthermore, the authors showed that tumors from
patients who are homozygous for the variant allele contained lower levels of mature miR-605
compared to patients who were homozygous for the common allele. Due to its location in the
precursor structure of miR-605, this SNP could impact the post-transcriptional processing of
miR-605 by Dicer. Given the TP53 regulatory role of this miRNA, its potential deregulation by
this SNP could modulate LFS cancer risk by causing important transcriptional changes in the
levels of p53 and/or MDM2. Additional functional features of miR-605, such as its association
with cancer and its capacity to target multiple gene products, render miR-605 and its variant as
promising candidate modifiers in Li-Fraumeni Syndrome.
20
CHAPTER 2
METHODS
Study Subjects The study population consists of 55 individuals from Caucasian families with
a germline TP53 mutation who had provided informed consent to participate in the research
study. These patients fit at least one of the published LFS, LFL and revised Chompret criteria. In
cases where patients developed more than one tumor, including a benign tumor, we chose the
age at which the first malignant tumor was diagnosed.
Nucleic Acid Extraction DNA was extracted from peripheral leukocytes using standard
methods and DNA quantification was performed on a NanoDrop Spectrophotometer (NanoDrop,
Wilmington, DE). Total RNA was extracted from cell lines with TRIzol solution (Invitrogen).
miR-605 SNP Genotyping The rs2043556 variant was genotyped by Restriction Fragment
Length Polymorphism (SNP-RFLP). First, a 284-bp DNA fragment containing the pre-miR-605
region and its polymorphism was amplified by PCR: 5’-CGCCTCTTTTTGCTCATTCT-3’ and
5’-AGAGCAGTTACGCCACATGA-3’. Following amplification, genomic samples were
digested by the HinfI enzyme (New England Biolabs) and fragment lengths were assayed on a
2% w/v agarose gel. In homozygote carriers of the miR-605 A-allele, a HinfI enzyme recognition
site was created in the 284-bp PCR fragment resulting in two equal 142-bp fragments (1 band
total). In contrast, HinfI-digested PCR fragments from patients carrying the G-allele produce
three fragments: 1 uncut 284-bp DNA fragment, and 2 equal 142-bp DNA fragments (2 bands
total). To further validate the genotyping calls, 20% of our genomic samples were confirmed by
Sanger sequencing.
miR-605 Expression Vectors and RD Cell Nucleofection CMV promoter-driven
microRNA expression vectors (pCMV-MIR) containing genomic fragments (639-bp)

21
corresponding to pre-miR-605-G and pre-miR-605-A along with a control vector (no miRNA
insert) were purchased from OriGene (Rockville, MD). The sequence of both vectors was
confirmed by Sanger sequencing. These expression plasmids were transiently transfected into
RD cells by nucleofection (Amaxa Inc.). Briefly, 1 × 10^6 (confluent) cells were harvested,
centrifuged and slowly resuspended in a 100ul nucleofection solution (Amaxa) containing 2.5ug
of plasmid DNA. After transfer to the electroporation cuvette, this reaction mixture was inserted
into the Nucleofector device (Amaxa), and the T20 program was used. This nucleofection
program was chosen because it achieved the highest nucleofection efficiency in RD cells as
determined by GFP fluorescence. Total RNA was extracted 6 hours after nucleofection for real-
time RT-PCR.
Quantitative RT-PCR of mature miR-605 To evaluate expression levels of mature miR-
605, total RNA (200ng) from pre-miR-605-A- and pre-miR-605-G-nucleofected cells was
reverse transcribed into cDNA using specific stem-loop RT primers for mature miR-605 and U6
(Applied Biosystems). Subsequently, the PCR levels of these miRNAs were quantified using the
corresponding TaqMan miRNA Assays (Applied Biosystems). The amount of mature miR-605
relative to the negative control (no miRNA insert) was calculated using the 2-ΔΔCt method and
normalized to the U6 endogenous control. Results represent fold-change over control and are
shown as mean ± SEM; each experiment was conducted at least 4-times (n=4).
Quantitative RT-PCR of precursor miR-605 Similarly to our mature miR-605
quantification procedure, pre-miR-605 levels were determined by TaqMan qRT-PCR analysis.
First, total RNA (200ng) from transfected cells was reverse transcribed into cDNA using random
hexamer primers from the iScript cDNA Synthesis Kit (Bio-Rad Laboratories). In the qPCR step,

22
a custom TaqMan gene expression assay was used to measure the level of pre-miR-605. The
amount of pre-miR-605 was calculated, and results presented as described previously.
Cell Lines and Transfection Human embryonal (RD) and alveolar (Rh30)
rhabdomyosarcoma cell lines (both from Dr. A. Thomas Look of Dana-Farber Cancer Institute,
Boston, MA) were maintained in Dulbecco's Modified Eagle Medium (Wisent) with 10% Fetal
Bovine serum (Wisent). On the day of transfection, 60,000 (confluent) cells were added to a 12-
well tissue culture dish containing pre-plated transfection complexes: 2ul of Lipofectamine 2000
(Invitrogen) and 25nM of miR-605 or control miRNA mimics (Ambion). Cells were maintained
in culture at 37°C in a sealed humidified chamber (w/ 5% C02) for 24 hours before assay use.
Cell Viability Assay The viability of cells was measured by the colorimetric MTS assay
(Promega). Briefly, 3,500 RD and Rh30 transfected cells were seeded into a 96-well plate, and
maintained in culture for 96 hours. The MTS reagent was then added to each well and the cells
incubated at 37°C for a period of 2 hours. To quantify the resulting absorbance changes, a
spectrophotometer (490nm) was used. Background absorbance levels were adjusted by
subtracting the average absorbance values of negative control wells (i.e empty) from the raw
absorbance values of each experimental well. Results were normalized to control-transfected
cells and represent mean cell viability ± SEM; each experiment was conducted at least 3-times
(n=3).
Drug Sensitization Studies For the drug synergy studies, cells were transfected and replated
into a 96-well plate as described previously. On the following day, the cells were treated for 24
hours with separate doses of Actinomycin D (A1410), Doxorubicin hydrochloride (44583) and
Etoposide (E1383), all purchased from Sigma. The combinatorial treatment regimens for both
RD and Rh30 cells were as follows: 1) miR-605 mimic + vehicle; 2) miR-605 mimic + drug; 3)
23
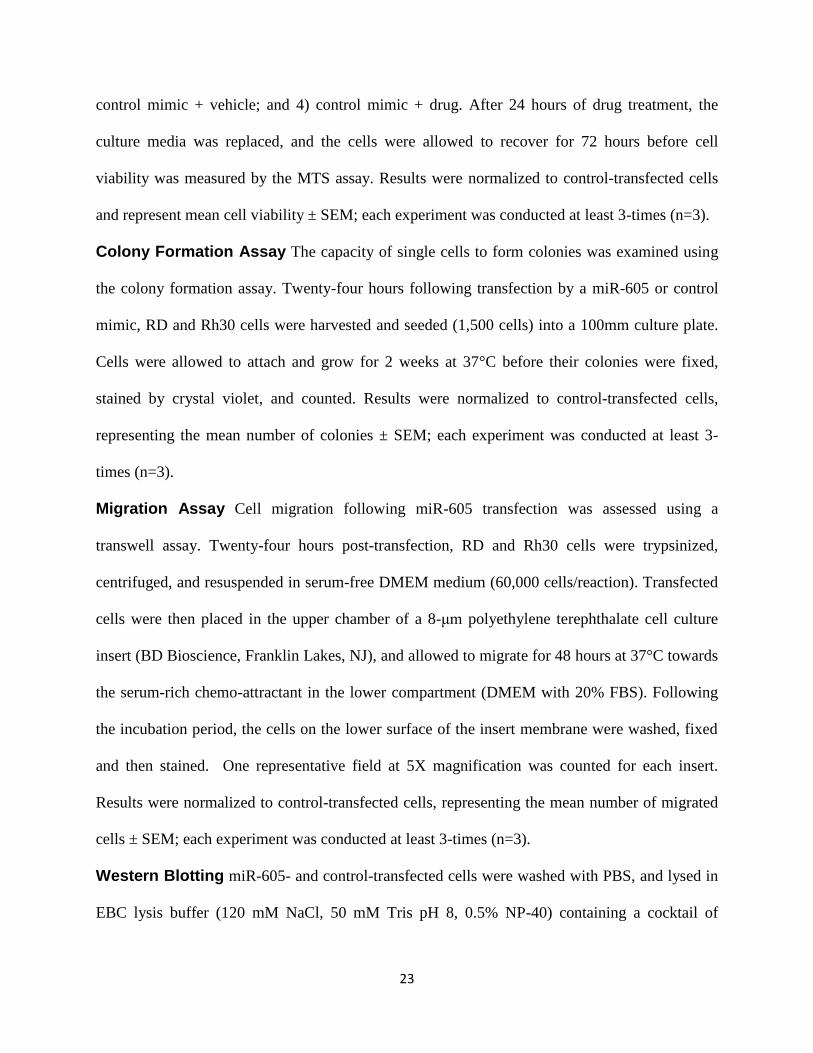
control mimic + vehicle; and 4) control mimic + drug. After 24 hours of drug treatment, the
culture media was replaced, and the cells were allowed to recover for 72 hours before cell
viability was measured by the MTS assay. Results were normalized to control-transfected cells
and represent mean cell viability ± SEM; each experiment was conducted at least 3-times (n=3).
Colony Formation Assay The capacity of single cells to form colonies was examined using
the colony formation assay. Twenty-four hours following transfection by a miR-605 or control
mimic, RD and Rh30 cells were harvested and seeded (1,500 cells) into a 100mm culture plate.
Cells were allowed to attach and grow for 2 weeks at 37°C before their colonies were fixed,
stained by crystal violet, and counted. Results were normalized to control-transfected cells,
representing the mean number of colonies ± SEM; each experiment was conducted at least 3-
times (n=3).
Migration Assay Cell migration following miR-605 transfection was assessed using a
transwell assay. Twenty-four hours post-transfection, RD and Rh30 cells were trypsinized,
centrifuged, and resuspended in serum-free DMEM medium (60,000 cells/reaction). Transfected
cells were then placed in the upper chamber of a 8-μm polyethylene terephthalate cell culture
insert (BD Bioscience, Franklin Lakes, NJ), and allowed to migrate for 48 hours at 37°C towards
the serum-rich chemo-attractant in the lower compartment (DMEM with 20% FBS). Following
the incubation period, the cells on the lower surface of the insert membrane were washed, fixed
and then stained. One representative field at 5X magnification was counted for each insert.
Results were normalized to control-transfected cells, representing the mean number of migrated
cells ± SEM; each experiment was conducted at least 3-times (n=3).
Western Blotting miR-605- and control-transfected cells were washed with PBS, and lysed in
EBC lysis buffer (120 mM NaCl, 50 mM Tris pH 8, 0.5% NP-40) containing a cocktail of

24
protease and phosphatase inhibitors (Roche). Following protein quantification by Bradford (Bio-
Rad Laboratories), cell lysates were electrophoresed through 10% SDS-PAGE gels and
transferred to a PVDF membrane (Millipore). The membrane was blocked in Odyssey Blocking
Buffer (LI-COR Biosciences) for 1 hour, then incubated overnight at 4°C with MDM2 antibody
(Calbiochem), p53 antibody (Calbiochem), Thr202/Try204-phosphorylated ERK1/2 antibody
(Cell Signaling), total ERK1/2 antibody (Cell signaling), Thr183/Tyr185-phosphorylated JNK
antibody (Cell signaling), total JNK antibody (Cell signaling), Thr180/Try182-phosphorylated
p38 antibody (Cell signaling), total p38 antibody (Cell signaling), or Vinculin antibody
(Millipore). Signals from infrared dye-labeled anti-rabbit (680 nm) or anti-mouse (800 nm)
secondary antibodies were detected using the Odyssey Infrared Imaging System (LI-COR
Biosciences, Lincoln, NE, USA). For the MAPK protein blots (JNK, ERK and p38), the Odyssey
Infrared Imaging System Application Software (LI-COR Biosciences) was used for densitometric
analysis. Densitometry values show the average ratio of phosphorylated MAPKs over total
MAPKs of three independent blots, normalized to control-transfected RD cells at 24 hours.
Statistical Analysis Data were analyzed using Graphpad Prism 3.0 (Graphpad Software Inc.).
For functional studies, statistical analyses were performed using the unpaired two-tailed
Student’s t-test. The non-parametric Mann-Whitney test was used to compare the age of cancer
onset between the different SNP genotypes. A p value of less than 0.05 was considered to be
statistically significant.
25
CHAPTER 3
RESULTS
3.1 Functional impact of the miR-605 SNP
3.1.1 The miR-605 SNP modifies the age of cancer onset in LFS patients
Since miR-605 is an important regulator of the p53-MDM2 loop, and its variant is
predicted by RNAfold to impact the stability of its precursor structure (Supp. Figure 1), we
analyzed the association of this polymorphism with the age of cancer onset in Caucasian LFS
patients carrying germline TP53 mutations. Genotyping of blood-derived DNA samples from 55
patients was performed using SNP-RFLP. Briefly, a 284-bp DNA fragment corresponding to the
miR-605 gene was amplified by PCR (Supp. Figure 2), with the resulting product digested using
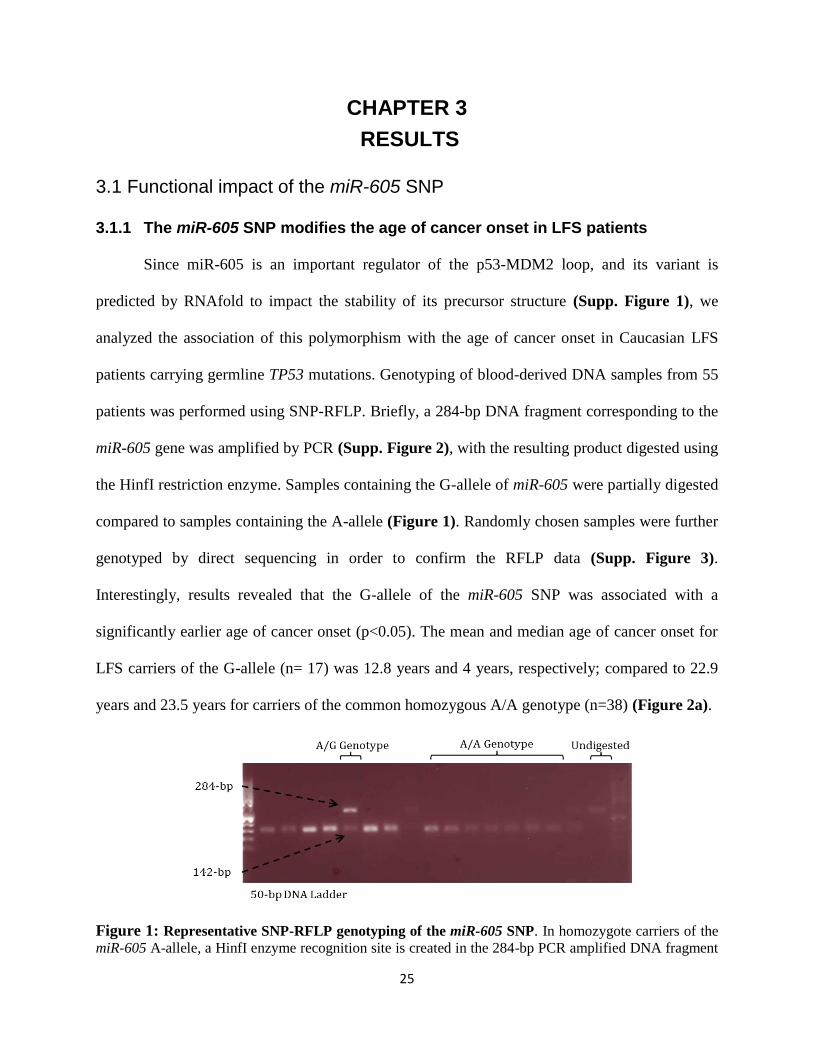
the HinfI restriction enzyme. Samples containing the G-allele of miR-605 were partially digested
compared to samples containing the A-allele (Figure 1). Randomly chosen samples were further
genotyped by direct sequencing in order to confirm the RFLP data (Supp. Figure 3).
Interestingly, results revealed that the G-allele of the miR-605 SNP was associated with a
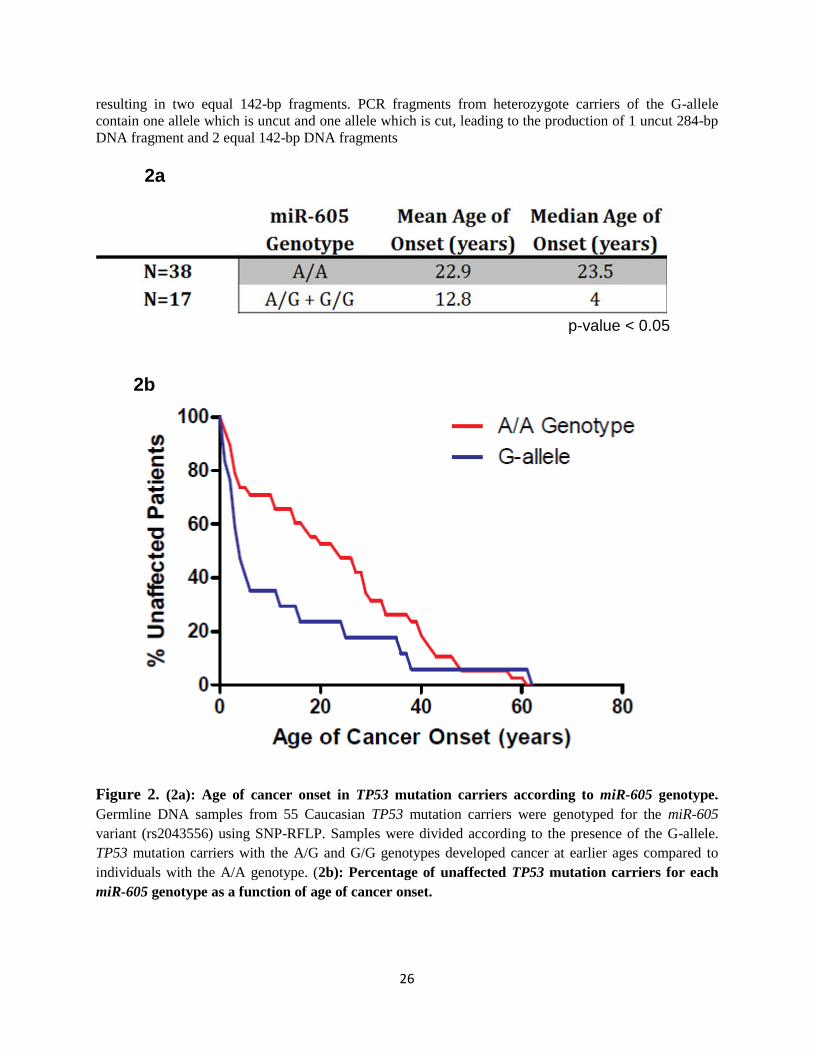
significantly earlier age of cancer onset (p<0.05). The mean and median age of cancer onset for
LFS carriers of the G-allele (n= 17) was 12.8 years and 4 years, respectively; compared to 22.9
years and 23.5 years for carriers of the common homozygous A/A genotype (n=38) (Figure 2a).
Figure 1: Representative SNP-RFLP genotyping of the miR-605 SNP. In homozygote carriers of the
miR-605 A-allele, a HinfI enzyme recognition site is created in the 284-bp PCR amplified DNA fragment
26
resulting in two equal 142-bp fragments. PCR fragments from heterozygote carriers of the G-allele
contain one allele which is uncut and one allele which is cut, leading to the production of 1 uncut 284-bp
DNA fragment and 2 equal 142-bp DNA fragments
Figure 2. (2a): Age of cancer onset in TP53 mutation carriers according to miR-605 genotype.
Germline DNA samples from 55 Caucasian TP53 mutation carriers were genotyped for the miR-605
variant (rs2043556) using SNP-RFLP. Samples were divided according to the presence of the G-allele.
TP53 mutation carriers with the A/G and G/G genotypes developed cancer at earlier ages compared to
individuals with the A/A genotype. (2b): Percentage of unaffected TP53 mutation carriers for each
miR-605 genotype as a function of age of cancer onset.
p-value < 0.05
2a
2b

27
3.1.2 The miR-605 SNP affects the processing efficiency of pre-miR-605
To determine the functional consequences of the miR-605 SNP, microRNA plasmids
(pCMV-MIR) containing genomic fragments (639-bp) corresponding to pre-miR-605-G and pre-
miR-605-A were nucleofected into the rhabdomyosarcoma cell line (RD) (Figure 3); these
plasmids were sequence confirmed (Figure 4a). By qRT-PCR, RD cells transfected with pre-
miR-605-A expressed 2.6 times more mature miR-605 compared to cells transfected with pre-
miR-605-G (Figure 4b). In contrast, the precursor form of miR-605 (pre-miR-605) was
expressed at similar levels in both pre-miR-605-A and pre-miR-605-G transfected cells,
indicating a defect in miR-605 processing from its pre- to mature form (Figure 4c). To compare
the efficiency of Dicer processing between the two variants, the expression level of mature miR-
605 was divided by that of pre-miR-605. The processing efficiency of the pre-miR-605-G
plasmid was 65% lower than the processing efficiency of the pre-miR-605-A plasmid (Figure
4d).
Figure 3: Schematic representation of SNP expression experiment

28
Figure 4. (4a): Sanger sequencing of the pre-miR-605-A and pre-miR-605-G vectors. Results
confirm the correct sequence with the only difference being in the SNP. (4b): Impact of the miR-605
SNP on mature miR-605 levels. Three different miRNA expression plasmids containing the following
constructs were used: pre-miR-605-A, pre-miR-605-G, no miRNA insert. RD cells were nucleofected and
total RNA was isolated 6 hours post-nucleofection. Compared to the empty vector, mature miR-605
levels were upregulated 137.1 fold in RD cells transfected with pre-miR-605-A vector compared to 52.4
fold upregulation in RD cells transfected with pre-miR-605-G. Results are normalized to the negative
control and represent mean ± SEM. n=4. * p< 0.05. (4c): Impact of the miR-605 SNP on precursor
miR-605 levels. Precursor levels of miR-605 were quantified using the same methodology and the same
RNA samples as our mature miR-605 expression results. (4d): Processing efficiency of pre-miR-605
according to genotype. The levels of mature miR-605 were divided by the levels of precursor miR-605
in order to calculate the processing efficiency of each variant.
*
*
4a
4b
4c
4d
*

29
3.2 Role of miR-605 in TP53 mutant cells
3.2.1 miR-605 affects cell viability and colony formation in TP53 mutant cells
Although miR-605 has been shown to have potent tumor suppressive activity in TP53
wild-type type cells, its effects on TP53 mutant cells have never been tested. To directly assess
the function of miR-605 in TP53 mutant cells, we overexpressed a commercial miR-605 mimic
into two RMS cell lines carrying homozygous and heterozygous TP53 mutations (RD and Rh30).
The effects of miR-605 expression on cellular function were examined by the MTS and colony
formation assays. Overexpression of miR-605 resulted in a significant reduction in cell viability
and clonogenicity (Figure 5a-c). Western blotting revealed that while MDM2 protein levels
were down regulated, p53 levels were not affected as a result of miR-605 overexpression
(Figure 5d). These data suggest a tumor suppressive role for miR-605 even in the absence of an
activated p53 response.
Figure 5. (5a): Effect of miR-605 overexpression on cell viability in TP53 mutant cells. RD and
Rh30 cells were transfected with either a miR-605 mimic or a control mimic; 96 hours post-transfection,
the MTS assay was performed to measure levels of cell viability. Compared to controls, both cell types
demonstrated lower levels of viability following miR-605 overexpression. Results are normalized to
control-transfected cells and represent mean ± SEM. n=3. * p< 0.05. (5b): Effect of miR-605
overexpression on colony formation in TP53 mutant cells. RD and Rh30 cells were transfected as
described previously. Two weeks post-transfection, colonies from miR-605- and control-transfected cells
were fixed, stained and counted. miR-605-transfected RD and Rh30 cells contained lower numbers of
RD Rh30
* *
5a
5b
RD Rh30
* *

30
colonies compared to control cells. Results are normalized to control-transfected cells and represent mean
± SEM. n=3. * p< 0.05.
(5c): Representative plates from colony formation assay. (5d): Western Blot of MDM2, p53 and
Vinculin in RD cells. Analysis reveals MDM2 downregulation at 24hrs and 48hrs following miR-605
transfection. Interestingly, miR-605 overexpression had no effect on p53 protein levels.
3.2.2 miR-605 affects the chemosensitivity and migration of TP53 mutant cells
Since our hypothesis suggested that SNP-mediated miR-605 deregulation could result in a
more aggressive cancer phenotype, we further sought to investigate the role of miR-605 in the
chemo-resistance and migratory potential of TP53 mutant cell lines. Similarly to our previous
experiments, overexpression of miR-605 was accomplished by transiently transfecting cells with
a commercial miR-605 mimic, along with the appropriate controls. Following our transfection,
these TP53 mutant RMS cells were then treated with one of three different chemotherapy agents;
Actinomycin D, Doxorubicin or Etoposide. Our combinatorial regimens were as follows: 1) drug
Control miR-605
RD
Rh30
5c
5d

31
+ miR-605; 2) drug + miRNA control; 3) Vehicle + miR-605; and 4) Vehicle + miRNA control.
Our MTS results showed a significant attenuation in the chemosensitivity of both RD and Rh30
cells following miR-605 overexpression. Specifically, treated cells showed a significant loss in
cell viability when combined with miR-605 as compared to treated cells that were control
transfected (Figure 6a-c). To measure the effects of miR-605 on cell migration, a classic
chemotactic transwell assay was employed. miR-605- and control-transfected cells were allowed
to migrate to the lower chamber for 48 hours before they were fixed, stained and counted.
Significantly fewer RD and Rh30 cells were attracted to the chemo-attractant (20% FBS) in the
miR-605-transfected group as compared to the control (Figure 7a-b). Taken together, these data
suggest that higher miR-605 expression was associated with a less aggressive cancer phenotype.
RD Rh30 6a
*
*

32
Figure 6: Effect of miR-605 on RD and Rh30 chemosensitivity. A miR-605 commercial mimic
was used to transfect RD and Rh30 cells, followed by the addition of a single chemotherapeutic (6a:
Eto=Etoposide, 6b: Dox=Doxorubicin, 6c: Act=Actinomycin). An MTS assay, measuring levels of cell
viability was employed to assess the chemosensitizing effects of miR-605 overexpression. In each case,
miR-605-transfected cells treated with a chemotherapeutic agent measured lower levels of cell viability
RD
RD
Rh30
Rh30
** *
***
**
6c
6b

33
compared to control cells treated with the same drug. Results are normalized to control-transfected +
vehicle-treated cells and represent mean ± SEM. n=3. * p< 0.05, ** p <0.01, *** p<0.001.
Figure7. (7a): Effect of miR-605 overexpression on cell migration in TP53 mutant cells. RD and
Rh30 cells were transfected as described previously. Twenty-four hours post-transfection, miR-605- and
control-transfected cells were seeded into serum-free media and allowed to migrate for forty-eight hours.
Migrated cells were then fixed, stained and counted. miR-605-transfected RD and Rh30 cells migrated at
lower levels compared to control cells. Results are normalized to control-transfected cells and represent
mean ± SEM. n=3. * p< 0.05, ** p <0.01, *** p<0.001. (7b): Representative inserts from migration
assay.
3.2.3 miR-605 overexpression activates the MAPK pathway in TP53 mutant cells
Since the tumor suppressive effects of miR-605 did not seem to be dependent on p53
activation, we hypothesized that miR-605 acted through alternative signalling pathways. The
MAP kinase family was probed because of previous work in our lab implicating these pathways
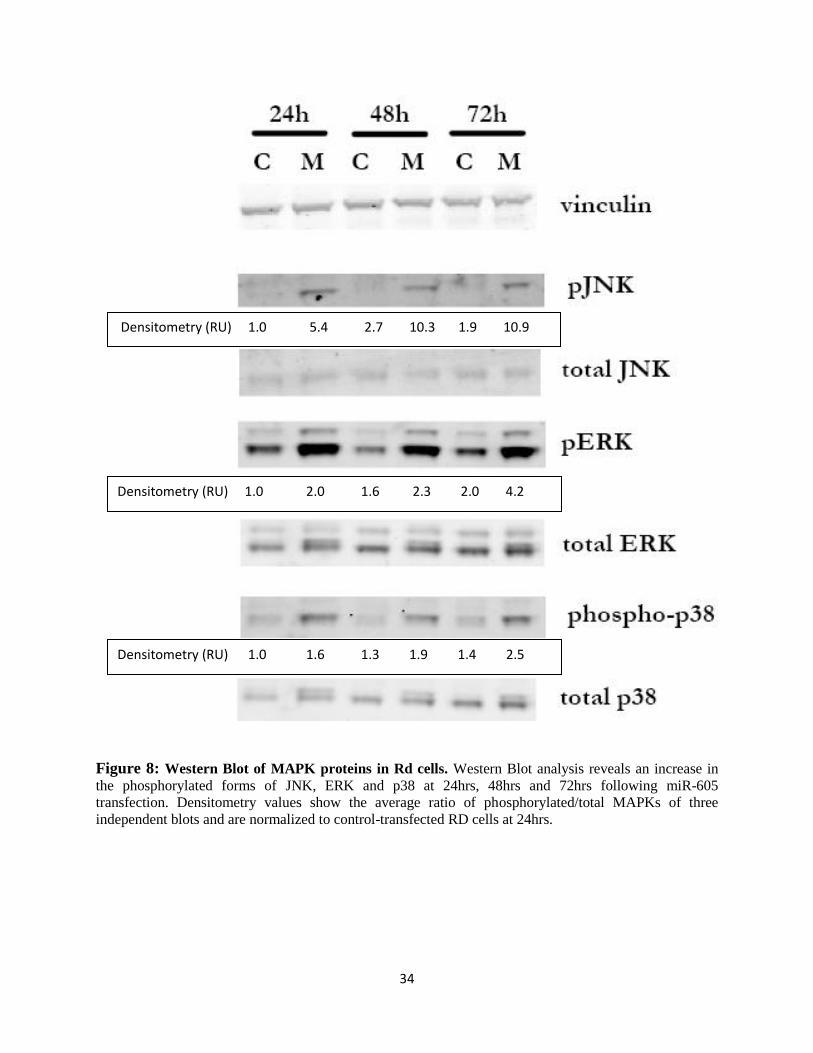
in RMS biology. At the same conditions as the aforementioned cell transfections, an increase in
the phosphorylated forms of p38, ERK and JNK were detected, whereas total level of these
proteins remained relatively constant (Figure 8).
RD Rh30
* ***
7a
7b
34
Figure 8: Western Blot of MAPK proteins in Rd cells. Western Blot analysis reveals an increase in
the phosphorylated forms of JNK, ERK and p38 at 24hrs, 48hrs and 72hrs following miR-605
transfection. Densitometry values show the average ratio of phosphorylated/total MAPKs of three
independent blots and are normalized to control-transfected RD cells at 24hrs.
Densitometry (RU) 1.0 5.4 2.7 10.3 1.9 10.9
Densitometry (RU) 1.0 2.0 1.6 2.3 2.0 4.2
Densitometry (RU) 1.0 1.6 1.3 1.9 1.4 2.5

35
CHAPTER 4
DISCUSSION
4.1 miR-605 SNP and LFS Cancer Risk
To our knowledge, this is the first report describing an association between a common
SNP in a pre-miRNA gene and cancer risk in Li-Fraumeni Syndrome. In this work, we showed
that the G-allele of the miR-605 SNP was associated with a significant reduction in the age of
cancer onset in a cohort of Caucasian germ-line TP53 mutation carriers. Functionally, the G-
allele of miR-605 appeared to cause a defect in the processing efficiency of its host miRNA,
leading to a 2.6 fold reduction in the amount of mature miR-605 as compared to the more
common A-allele. Significantly, no such difference was detected in the precursor levels of miR-
605. These findings are consistent with a recent report in which mature miR-605 expression
levels were shown to be attenuated in patients with colorectal cancers carrying the G/G
genotype131
. Expanding on those findings, our work establishes cytoplasmic miRNA processing
by Dicer as a potential mechanism for miR-605 SNP-mediated dysfunction. Thus, the miR-605
SNP adds to a growing list of pre-miRNA polymorphisms which can impact the post-
transcriptional processing of their host miRNA and which in the process predispose patients to
increased cancer risk.
As previously discussed, SNP-mediated defects in miRNA processing have become a
well-established feature of many human cancers such as breast, esophagus, bladder, lung, and
thyroid carcinomas132,128,133,134,135,126
. Changes in RNA duplex stability represent one particular
mechanism through which SNPs can impact miRNA biogenesis and function. Such changes can
alter the kinetics of several miRNA processes such as RNA unwinding, cleavage, strand
36
selection and RNA-protein interactions, all of which play a critical role in miRNA
maturation136,137,138
. The miR-605 SNP, similar to other pre-miRNA SNPs, is known to alter the
conformational stability of its pre-miRNA (Supp. Figure 1). Specifically, the secondary
structure of pre-miR-605 containing the wild base pairing G:U is calculated to be less stable than
the one with the SNP base pairing G:C (∆∆G=-2.6 kcal/mol). Importantly, this difference in
Gibbs free energy is comparable to that of previously-reported functional pre-miRNA SNPs
(Supp. Table 1). Given that the unwinding of pre-miRNAs is an important miRNA processing
step, less stable RNA duplexes such as the pre-miR-605-A variant would be predicted to be
processed faster and more efficiently as compared to the more stable pre-miR-605-G variant.
This mechanism could potentially explain the observed overexpression of mature miR-605 from
the A-allele as well as the lack of such difference in the precursor levels of miR-605 between
these two variants.
Because each miRNA is thought to regulate >100 different gene products, SNP-mediated
deregulation of miR-605 can be predicted to have widespread biological effects. Specifically,
transcripts normally regulated by miR-605, including MDM2, could be less efficiently regulated
as a result of lower miR-605 expression. In LFS patients carrying a mutant TP53 gene, higher
levels of MDM2 have been consistently shown to be associated with younger ages of tumor
onset. Functionally, these events have been linked to either deregulated MDM2 and/or p53
function87,93,88
. It is possible that LFS patients carrying copies of the G-allele produce lesser
amounts of miR-605, and thus have higher levels of its target transcripts. As a result of elevated
MDM2 levels, these cells would be predicted, as has been shown in some studies, to have an
impaired p53 response to DNA damage and other forms of genetic insults92
. Because LFS
patients already lack a functional copy of p53, further impairment of the p53 pathway could

37
render them at an even greater risk of developing cancer. Thus, from this work, we add yet more
evidence that regulators of the p53 pathway are promising genetic modifiers in LFS and that
their SNPs remain an important consideration in attempting to predict cancer risk in these
patients.
4.2 miR-605 Action and Signaling in TP53 Mutant Cells
Previously, miR-605 had been shown to exhibit potent tumor suppressive functions in
TP53 wild-type cells, but not in isogenic cell lines lacking the TP53 gene (TP53 -/-). Given these
findings, miR-605 was assumed to be dependent on p53 signaling for its biological effects37
. In
this report, we show for the first time that miR-605 behaves as a tumor suppressor, despite the
presence of TP53 mutations. Overexpressing miR-605 significantly reduced cell viability, colony
formation, cell migration and chemo-sensitivity in two RMS cell lines with differing TP53
mutant status. These findings suggest that miR-605 deregulation is a plausible modifier of cancer
phenotypes in TP53 mutation carriers, and they strengthen our hypothesis that expression
changes caused by the miR-605 SNP could be partly responsible for an accelerated tumor onset
in LFS. Importantly, the cytotoxic effects of miR-605 overexpression do not seem to rely on p53
activation. Following miR-605 overexpression in RD cells carrying a homozygous R248W
mutation, no changes in p53 protein levels were detected. Instead, our results suggest the
involvement of the Mitogen Activated Protein Kinase (MAPK) family as a potential mechanism
for miR-605-mediated tumor suppression.
The MAPK family of protein kinases are serine-threonine kinases that include c-Jun N-
terminal kinase (JNK), p38, and extracellular signal-regulated kinase (ERK), each with a well-
established role in carcinogenesis. The classical MAPK pathways form a multi-tier linear
signalling cascade that involves the sequential phosphorylation and activation of MAP3K,

38
MAP2K and finally MAPK itself. Upon activation by a number of different stimuli, including
mitogenic factors, cytokines, and cellular stress, the MAPK proteins lead to the phosphorylation
and activation of an important class of transcription factors that control cellular proliferation,
differentiation, survival and apoptosis. Interestingly, all three MAPKs (JNK, p38 and ERK) have
been shown to be regulated by numerous miRNAs, including miR-497, -101, and -143 139,140,141
.
However, this is the first reported instance of MAPK activation as a result of miR-605 signaling.
At this point, it remains unclear as to whether MAPK activation is directly related to miR-605’s
tumor-suppressive activities. From work in our lab as well as others, we know that MAPK
activation can lead to tumor suppression in the form of increased apoptosis and cell cycle arrest
but in order to establish a direct link with miR-605 activation, combinatorial treatments with
MAPK inhibitors/MAPK siRNAs and miR-605 mimics need to be performed. Understanding
whether MAPK inhibition/depletion can protect against miR-605-mediated tumor suppression
will help in our understanding of miR-605 function and its potential role in cancer and LFS.
Furthermore, the molecular link between miR-605 overexpression and MAPK activation
remains unknown. So far, miR-605 has only two validated targets: MDM2 and Sec24D, a protein
involved in cellular trafficking142,37
. While MDM2 has a well-established role in cancer, little is
known about the cancer role if any, of Sec24D. Furthermore, neither MDM2 nor Sec24D seem to
control MAPK activation. In the case of MDM2, the opposite is in fact true: JNK activation leads
to the phosphorylation of MDM2 and the inhibition of the MDM2-p53 interaction. In order to
explore further signalling pathways that may be regulated by miR-605 and thus potentially
involved in MAPK activation, we performed an in-silico analysis of predicted miR-605 targets.
Using a combinatorial miRNA target prediction approach, we screened the UTR sequences of all
known protein-coding genes for complementarity to the seed sequence of miR-605. A list of 12
39
putative miR-605 targets was generated from the common predictions of six microRNA
prediction algorithms (DIANA, PITA, TargetScan, MicroCosm, miRDB, TargetScan_cons).
From this initial list, PubMed searches with the keywords “<gene name> MAPK” and “<gene
name> p53” was performed to identify targets that had an established role in these signalling
pathways (Supp. Table 2). Probing for the biological relevance of these interactions and their
effects on MAPK and/or p53 signalling would be a starting point to expand our understanding of
miR-605-mediated MAPK activation and tumor suppression.
List of predicted miR-605 targets: ADAMTS6, CDH2/N-Cad, COPS2, DGKG, DHX8,
HIVEP2, IER5, MTMR8, SLAIN2, SLITRK2, TSN, VAPB
4.3 Study Limitations
In this study, we relied on two specific cell line models: RD and Rh30. These cell lines
were selected because of their mutant TP53 status as well as the fact that RMS is an important
component tumor of LFS. However certain limitations do arise; for one, we only tested the
effects of miR-605 overexpression on TP53 mutant cells carrying the R273C and R248W
hotspot missense mutants. Although these two mutations are some of the most commonly
occurring sites of TP53 lesions, it is possible that the effects of miR-605 could be dependent on
other types of TP53 mutations. Future experiments examining cell lines with different TP53
mutant status should be carried out to further delineate the role of this miRNA in the context of
TP53 mutations.
Secondly, since we used transient transfections as our method for transducing miR-605,
we were not able to examine the effect of these two SNP variants on the tumor suppressive
functions of miR-605. Future experiments in which the two variants are stably transfected into
RD cells or another cell type would offer a more powerful system of dissecting the functional

40
differences between these two variants. It remains possible that more sustained MDM2 inhibition
by miR-605 could activate parts of the p53 pathway. Again, a stably-expressed miR-605 system
would be most useful in clarifying this possibility. Thirdly, we were unable to perform knock-
down experiments because none of these cell lines express miR-605 at high levels. Lastly, even
though our results are strengthened by our SNP expression analyses, the rarity of this syndrome,
and thus our low sample size remains another important limitation of this study. Larger
independent cohorts of LFS patients would be necessary to further verify these results.

41
CHAPTER 5
CONCLUSION/FUTURE PERSPECTIVES
In summary, our results identified a miR-605 SNP as a potential modifying event in TP53
mutation carriers. The rs2043556 SNP was associated with a lower age of cancer onset in LFS
patients, and caused a decrease in the expression levels of its mature miRNA, indicating a SNP-
mediated processing defect in miR-605 maturation. In addition to defining a novel MAPK
signalling role for miR-605, our findings further implicate miR-605 overexpression in
attenuating cell viability, colony formation, cell migration and chemosensitivity in TP53 mutant
cells. Future work should focus on elucidating the functional consequences of the miR-605 SNP
on p53 and MAPK pathway signaling whilst also pursuing a more general understanding of miR-
605 tumor suppression. Finally, the role of miR-605 in suppressing MDM2 expression, and its
association with cancer risk in LFS suggests that modulating miR-605 might represent a novel
therapeutic strategy for the successful treatment of both TP53 wild-type and mutated tumors.

42
APPENDIX 1
SUPPLEMENTARY FIGURES
Supplementary Figure 1: Secondary structures of wild-type and variant pre-miR-605. RNAfold was
used to predict the RNA secondary structures and the Gibbs free energy of (A) pre-miR-605-A, (B) pre-
miR-605-G.
Minimum Free Energy: -52.3 kcal/mol
|∆∆G|: 2.6kcal/mol
pre-miR-605-A
Minimum Free Energy: -54.9 kcal/mol
pre-miR-605-G

43
CGCCTCTTTTTGCTCATTCTTTAAAGTAGGAACTTTGGTAGAACTTTCACAGCCTGTAACATAT
GTCTCTAGCCCTAGCTTGGTTCTAAATCCCATGGTGCCTTCTCCTTGGGAAAAACAGAGAAGGC
ACTATGAGATTTAGAAT/CCAAGTTAGGACTGCAGATACAGGTTACCTATGTTACAGGCTGACA
GCCACAGGTATATTGCTCTCTGCACATGTGTTTTTTCCTGGCCTCTCAATGACATTATAAGCTT
CTATTATACCTCATGTGGCGTAACTGCTCT
-Primer_Forward: CGCCTCTTTTTGCTCATTCT (Tm: 59.6 ° C, GC content: 45.0 %)
-Primer_Reverse: AGAGCAGTTACGCCACATGA (Tm: 59.5 °C, GC content: 50.0 %)
Supplementary Figure 2: Sequence of DNA primers (in blue) used to amplify a 284-bp PCR product
containing the pre-miR-605 gene (in red) and its rs2043556 SNP (in green).
Supplementary Figure 3. Representative Sanger sequencing of miR-605 PCR amplified product from
a) a patient sample with the homozygous A/A genotype and b) a patient sample with the heterozygous
A/G genotype
a
b

44
APPENDIX 2
SUPPLEMENTARY TABLES
Supplementary Table 1: Validated functional pre-miRNA SNPs with similar |∆∆G| to rs2043556 SNP
Supplementary Table 2: Predicted miR-605 targets in MAPK and/or p53 signaling
Gene Symbol
Gene Name
p53
Signaling
MAPK
Signaling
Reference(s)
(Pubmed ID)
CDH-2/N-CAD Cadherin-2/Neuronal
Cadherin
✓ 12213839
17409417
COPS2/ALIEN COP9 Signalosome
Subunit 2
✓
11285227
DHX8 DEAH Box Protein 8
✓
21460037
Gene
SNP ID
Variation
|∆∆G|
(kcal/mol)
Effect on
mature miR
levels
Reference(s)
(Pubmed ID)
miR-890 rs138166791 G/C 3.4 Downregulated 19617315
miR-149 rs2292832 T/C 2.2 Upregulated 23272122
miR-140 rs7205289 C/A 2.4 Downregulated 20358594
miR-146a rs2910164 G/C 2.8 Downregulated 18474871
miR-27a rs11671784 G/A 0.8 Downregulated 23246964
miR-34a rs72631823 C/T 0.87 Upregulated 23828613
miR-612 rs12803915 C/A 0.2 Upregulated 23077621
45
REFERENCES
1. Linzer, D.I.H. & Levine, A.J. Characterization of a 54K Dalton cellular SV40 tumor
antigen present in SV40-transformed cells and uninfected embryonal carcinoma cells. Cell
17, 43-52 (1979).
2. Crawford, L.V., Pim, D.C. & Lamb, P. The cellular protein p53 in human tumours.
Molecular biology & medicine 2, 261-72 (1984).
3. Jenkins, J.R., Rudge, K. & Currie, G.A. Cellular immortalization by a cDNA clone
encoding the transformation-associated phosphoprotein p53. Nature 312, 651-4
4. Malkin, D. et al. Germ Line p53 Mutations in a Familial Syndrome of Breast Cancer,
Sarcomas, and Other Neoplasms. Science 250, 1233-1238 (1990).
5. Baker, S.J. et al. Chromosome 17 deletions and p53 gene mutations in colorectal
carcinomas. Science (New York, N.Y.) 244, 217-21 (1989).
6. Munroe, D.G., Rovinski, B., Bernstein, A. & Benchimol, S. Loss of a highly conserved
domain on p53 as a result of gene deletion during Friend virus-induced erythroleukemia.
Oncogene 2, 621-4 (1988).
7. Finlay, C.A., Hinds, P.W. & Levine, A.J. The p53 proto-oncogene can act as a suppressor
of transformation. Cell 57, 1083-93 (1989).
8. Donehower, L.A. et al. Mice deficient for p53 are developmentally normal but susceptible
to spontaneous tumours. Nature 356, 215-21 (1992).
9. Harvey, M. et al. Spontaneous and carcinogen-induced tumorigenesis in p53-deficient
mice. Nature genetics 5, 225-9 (1993).
10. Cancer, G., Moleculaire, D.G. & Hospital, N.R. Database of p53 and cell lines. Database
22, 3551-3555 (1994).
11. Kern, S.E. et al. Identification of p53 as a sequence-specific DNA-binding protein.
Science (New York, N.Y.) 252, 1708-11 (1991).
12. Soussi, T. & May, P. Structural aspects of the p53 protein in relation to gene evolution: a
second look. Journal of molecular biology 260, 623-37 (1996).
13. Levine, a J. P53, the Cellular Gatekeeper for Growth and Division. Cell 88, 323-31
(1997).
14. Farmer, G. Wild-type p53 activates transcription in vitro.pdf. 83-86 (1992).

46
15. Rogel, A., Popliker, M. & Webb, C.G. levels in normal adult tissues , embryos , and p53
Cellular Tumor Antigen : Analysis of mRNA Levels in Normal Adult Tissues , Embryos ,
and Tumors. Microbiology 5, (1985).
16. Brooks, C.L. & Gu, W. P53 Regulation By Ubiquitin. FEBS letters 585, 2803-9 (2011).
17. Kruse, J.-P. & Gu, W. SnapShot: p53 posttranslational modifications. Cell 133, 930-30.e1
(2008).
18. Lavin, M.F. & Gueven, N. The complexity of p53 stabilization and activation. Cell death
and differentiation 13, 941-50 (2006).
19. Shieh, S.Y., Ikeda, M., Taya, Y. & Prives, C. DNA damage-induced phosphorylation of
p53 alleviates inhibition by MDM2. Cell 91, 325-34 (1997).
20. Shieh, S.-yann, Ahn, J., Tamai, K., Taya, Y. & Prives, C. The human homologs of
checkpoint phosphorylate p53 at multiple DNA damage-inducible sites. Genes &
Development 1, 289-300 (2000).
21. Li, M., Luo, J., Brooks, C.L. & Gu, W. Acetylation of p53 inhibits its ubiquitination by
Mdm2. The Journal of biological chemistry 277, 50607-11 (2002).
22. Saito, S. et al. Phosphorylation site interdependence of human p53 post-translational
modifications in response to stress. The Journal of biological chemistry 278, 37536-44
(2003).
23. Momand, J., Zambetti, G.P., Olson, D.C., George, D. & Levine, a J. The mdm-2 oncogene
product forms a complex with the p53 protein and inhibits p53-mediated transactivation.
Cell 69, 1237-45 (1992).
24. Honda, R., Tanaka, H. & Yasuda, H. Oncoprotein MDM2 is a ubiquitin ligase E3 for
tumor suppressor p53. FEBS letters 420, 25-7 (1997).
25. Ringshausen, I., O’Shea, C.C., Finch, A.J., Swigart, L.B. & Evan, G.I. Mdm2 is critically
and continuously required to suppress lethal p53 activity in vivo. Cancer cell 10, 501-14
(2006).
26. Montes de Oca Luna, R., Wagner, D.S. & Lozano, G. Rescue of early embryonic lethality
in mdm2-deficient mice by deletion of p53. Nature 378, 203-6 (1995).
27. Barak, Y., Juven, T., Haffner, R. & Oren, M. mdm2 expression is induced by wild type
p53 activity. The EMBO journal 12, 461-8 (1993).
28. Moll, U.M. & Petrenko, O. The MDM2-p53 Interaction The MDM2-p53 Interaction.
Molecular Cancer Research 1001-1008 (2004).

47
29. Meek, D.W. & Knippschild, U. Posttranslational Modification of MDM2. Mol. Cancer
Res. 1, 1017-1026 (2003).
30. Khosravi, R. et al. Rapid ATM-dependent phosphorylation of MDM2 precedes p53
accumulation in response to DNA damage. Proceedings of the National Academy of
Sciences of the United States of America 96, 14973-7 (1999).
31. Wang, X., Taplick, J., Geva, N. & Oren, M. Inhibition of p53 degradation by Mdm2
acetylation. FEBS letters 561, 195-201 (2004).
32. Buschmann, T., Fuchs, S.Y., Lee, C.-G., Pan, Z.-Q. & Ronai, Z. SUMO-1 Modification of
Mdm2 Prevents Its Self-Ubiquitination and Increases Mdm2 Ability to Ubiquitinate p53.
Cell 101, 753-762 (2000).
33. Tao, W. & Levine, a J. P19(ARF) stabilizes p53 by blocking nucleo-cytoplasmic shuttling
of Mdm2. Proceedings of the National Academy of Sciences of the United States of
America 96, 6937-41 (1999).
34. Danovi, D. et al. Amplification of Mdmx (or Mdm4) directly contributes to tumor
formation by inhibiting p53 tumor suppressor activity. Molecular and cellular biology 24,
5835-43 (2004).
35. Jackson, M.W. & Berberich, S.J. MdmX Protects p53 from Mdm2-Mediated Degradation.
Molecular and Cellular Biology 20, 1001-1007 (2000).
36. Pichiorri, F. et al. Downregulation of p53-inducible microRNAs 192, 194, and 215
impairs the p53/MDM2 autoregulatory loop in multiple myeloma development. Cancer
cell 18, 367-81 (2010).
37. Xiao, J., Lin, H., Luo, X., Luo, X. & Wang, Z. miR-605 joins p53 network to form a
p53:miR-605:Mdm2 positive feedback loop in response to stress. The EMBO journal 30,
524-32 (2011).
38. Olivier, M. et al. The IARC TP53 database: new online mutation analysis and
recommendations to users. Human mutation 19, 607-14 (2002).
39. Yang, H. & Wu, G.S. P53 transactivates the phosphatase MKP1 through both intronic and
exonic p53 responsive elements. Cancer Biology & Therapy 3, 1277-1282 (2004).
40. el-Deiry, W.S., Kern, S.E., Pietenpol, J.A., Kinzler, K.W. & Vogelstein, B. Definition of a
consensus binding site for p53. Nature genetics 1, 45-9 (1992).
41. Jordan, J.J. et al. Noncanonical DNA motifs as transactivation targets by wild type and
mutant p53. PLoS genetics 4, e1000104 (2008).

48
42. Contente, A., Dittmer, A., Koch, M.C., Roth, J. & Dobbelstein, M. A polymorphic
microsatellite that mediates induction of PIG3 by p53. Nature genetics 30, 315-20 (2002).
43. Elledge, S.J. Cell cycle checkpoints: preventing an identity crisis. Science (New York,
N.Y.) 274, 1664-72 (1996).
44. Agarwal, M.L., Agarwal, a, Taylor, W.R. & Stark, G.R. p53 controls both the G2/M and
the G1 cell cycle checkpoints and mediates reversible growth arrest in human fibroblasts.
Proceedings of the National Academy of Sciences of the United States of America 92,
8493-7 (1995).
45. Mirza, A. et al. Global transcriptional program of p53 target genes during the process of
apoptosis and cell cycle progression. Oncogene 22, 3645-54 (2003).
46. el-Deiry, W.S. et al. WAF1/CIP1 is induced in p53-mediated G1 arrest and apoptosis.
Cancer research 54, 1169-74 (1994).
47. Sherr, C.J. & Roberts, J.M. Inhibitors of mammalian G1 cyclin-dependent kinases. Genes
& development 9, 1149-63 (1995).
48. Weinberg, R.A. The retinoblastoma protein and cell cycle control. Cell 81, 323-30 (1995).
49. Sionov, R.V. & Haupt, Y. The cellular response to p53: the decision between life and
death. Oncogene 18, 6145-57 (1999).
50. Hanahan, D. & Weinberg, R. a Hallmarks of cancer: the next generation. Cell 144, 646-74
(2011).
51. Caelles, C., Helmberg, a & Karin, M. P53-Dependent Apoptosis in the Absence of
Transcriptional Activation of P53-Target Genes. Nature 370, 220-3 (1994).
52. Ashkenazi, A. & Dixit, V.M. Death Receptors: Signaling and Modulation. Science 281,
1305-1308 (1998).
53. Bouvard, V. et al. Tissue and cell-specific expression of the p53-target genes: bax, fas,
mdm2 and waf1/p21, before and following ionising irradiation in mice. Oncogene 19,
649-60 (2000).
54. Bennett, M. et al. Cell Surface Trafficking of Fas: A Rapid Mechanism of p53-Mediated
Apoptosis. Science 282, 290-293 (1998).
55. Takimoto, R. & El-Deiry, W.S. Wild-type p53 transactivates the KILLER/DR5 gene
through an intronic sequence-specific DNA-binding site. Oncogene 19, 1735-43 (2000).
49
56. Kuribayashi, K., El-Deiry, W.S., Wang, W. & Dicker, D.T. TNFSF10 (TRAIL), a p53
target gene that mediates p53-dependent cell death. Cancer biology & therapy 7, 2034-
2038 (2008).
57. Adams, J.M. Ways of dying: multiple pathways to apoptosis. Genes & development 17,
2481-95 (2003).
58. Chao, D.T. & Korsmeyer, S.J. BCL-2 family: regulators of cell death. Annual review of
immunology 16, 395-419 (1998).
59. Miyashita, T. & Reed, J.C. Tumor suppressor p53 is a direct transcriptional activator of
the human bax gene. Cell 80, 293-9 (1995).
60. Nakano, K. & Vousden, K.H. PUMA , a Novel Proapoptotic Gene , Is Induced by p53
National Cancer Institute at Frederick. 7, 683-694 (2001).
61. Schuler, M. et al. p53 triggers apoptosis in oncogene-expressing fibroblasts by the
induction of Noxa and mitochondrial Bax translocation. Cell death and differentiation 10,
451-60 (2003).
62. Soussi, T. & Béroud, C. Significance of TP53 mutations in human cancer: a critical
analysis of mutations at CpG dinucleotides. Human mutation 21, 192-200 (2003).
63. LI, F.P. & FRAUMENI JOSEPH F., J.R. Soft-Tissue Sarcomas, Breast Cancer, and Other
NeoplasmsA Familial Syndrome? Annals of Internal Medicine 71, 747-752 (1969).
64. Li, F.P. et al. A Cancer Family Syndrome in Twenty-four Kindreds A Cancer Family
Syndrome in Twenty-four Kindreds1. Cancer 5358-5362 (1988).
65. Nichols, K.E. et al. Germ-line p53 Mutations Predispose to a Wide Spectrum of Early-
onset Cancers Germ-line p53 Mutations Predispose to a Wide Spectrum of. Prevention
83-87 (2001).
66. Birch, J.M. et al. Prevalence and Diversity of Constitutional Mutations in the p53 Gene
among 21 Li-Fraumeni Families Mutations in the p53 Gene among 21. Medical Oncology
1298-1304 (1994).
67. Chompret, A. Sensitivity and predictive value of criteria for p53 germline mutation
screening. Journal of Medical Genetics 38, 43-47 (2001).
68. Tinat, J. et al. 2009 version of the Chompret criteria for Li Fraumeni syndrome. Journal of
clinical oncology : official journal of the American Society of Clinical Oncology 27, e108-
9; author reply e110 (2009).
69. Wu, C.-C., Shete, S., Amos, C.I. & Strong, L.C. Joint effects of germ-line p53 mutation
and sex on cancer risk in Li-Fraumeni syndrome. Cancer research 66, 8287-92 (2006).
50
70. Hwang, S.-J., Lozano, G., Amos, C.I. & Strong, L.C. Germline p53 mutations in a cohort
with childhood sarcoma: sex differences in cancer risk. American journal of human
genetics 72, 975-83 (2003).
71. Olivier, M. et al. Li-Fraumeni and related syndromes: correlation between tumor type,
family structure, and TP53 genotype. Cancer research 63, 6643-50 (2003).
72. Kleihues, P., Schäuble, B., zur Hausen, A., Estève, J. & Ohgaki, H. Tumors associated
with p53 germline mutations: a synopsis of 91 families. The American journal of
pathology 150, 1-13 (1997).
73. Hisada, M., Garber, J.E., Fung, C.Y., Joseph, F. & Li, F.P. Multiple Primary Cancers in
Families with Li-Fraumeni Syndrome. Cancer 90, (1998).
74. Lavigueur, A. et al. High incidence of lung, bone, and lymphoid tumors in transgenic
mice overexpressing mutant alleles of the p53 oncogene. Molecular and cellular biology
9, 3982-91 (1989).
75. Malkin, D. et al. Line and utations in a Familial Syndrome Cancer ,. Advancement Of
Science (2013).
76. Olivier, M. et al. Li-Fraumeni and Related Syndromes : Correlation between Tumor Type
, Family Structure , and TP53 Genotype Li-Fraumeni and Related Syndromes : Correlation
between Tumor Type , Family. Cancer 6643-6650 (2003).
77. Oren, M. & Rotter, V. Mutant p53 gain-of-function in cancer. Cold Spring Harbor
perspectives in biology 2, a001107 (2010).
78. Milner, J.O., Medcalf, E.A. & Cook, A.C. Tumor Suppressor p53 : Analysis of Wild-Type
and Mutant p53 Complexes. Microbiology 11, 11-19 (1991).
79. Sigal, A. & Rotter, V. Oncogenic Mutations of the p53 Tumor Suppressor : The Demons
of the Guardian of the Genome Oncogenic Mutations of the p53 Tumor Suppressor : The
Demons of the Guardian of the Genome. Cancer 6788-6793 (2000).
80. Fushimi, K. et al. Transformation of normal human fibroblasts into immortalized cells
with the mutant p53 gene and X-rays. International journal of cancer. Journal
international du cancer 70, 135-40 (1997).
81. Lang, G. a et al. Gain of function of a p53 hot spot mutation in a mouse model of Li-
Fraumeni syndrome. Cell 119, 861-72 (2004).
82. Gaiddon, C., Lokshin, M., Ahn, J., Zhang, T. & Prives, C. A Subset of Tumor-Derived
Mutant Forms a Direct Interaction with the p53 Core Domain A Subset of Tumor-Derived
Mutant Forms of p53 Down-Regulate p63 and p73 through a Direct Interaction with the
p53 Core Domain. Society (2001).doi:10.1128/MCB.21.5.1874
51
83. Willis, A., Jung, E.J., Wakefield, T. & Chen, X. Mutant p53 exerts a dominant negative
effect by preventing wild-type p53 from binding to the promoter of its target genes.
Oncogene 23, 2330-8 (2004).
84. Kato, S. et al. Understanding the function-structure and function-mutation relationships of
p53 tumor suppressor protein by high-resolution missense mutation analysis. Proceedings
of the National Academy of Sciences of the United States of America 100, 8424-9 (2003).
85. Bougeard, G. et al. Molecular basis of the Li-Fraumeni syndrome: an update from the
French LFS families. Journal of medical genetics 45, 535-8 (2008).
86. Tabori, U., Nanda, S., Druker, H., Lees, J. & Malkin, D. Younger age of cancer initiation
is associated with shorter telomere length in Li-Fraumeni syndrome. Cancer research 67,
1415-8 (2007).
87. Marcel, V. et al. TP53 PIN3 and MDM2 SNP309 polymorphisms as genetic modifiers in
the Li-Fraumeni syndrome: impact on age at first diagnosis. Journal of medical genetics
46, 766-72 (2009).
88. Ruijs, M.W.G. et al. The single-nucleotide polymorphism 309 in the MDM2 gene
contributes to the Li-Fraumeni syndrome and related phenotypes. European journal of
human genetics : EJHG 15, 110-4 (2007).
89. Bougeard, G. et al. Impact of the MDM2 SNP309 and p53 Arg72Pro polymorphism on
age of tumour onset in Li-Fraumeni syndrome. Journal of medical genetics 43, 531-3
(2006).
90. Shlien, A. et al. Excessive genomic DNA copy number variation in the Li-Fraumeni
cancer predisposition syndrome. Proceedings of the National Academy of Sciences of the
United States of America 105, 11264-9 (2008).
91. Dumont, P., Leu, J.I.-J., Della Pietra, A.C., George, D.L. & Murphy, M. The codon 72
polymorphic variants of p53 have markedly different apoptotic potential. Nature genetics
33, 357-65 (2003).
92. Bond, G.L. et al. A single nucleotide polymorphism in the MDM2 promoter attenuates the
p53 tumor suppressor pathway and accelerates tumor formation in humans. Cell 119, 591-
602 (2004).
93. Fang, S. et al. Effects of MDM2, MDM4 and TP53 codon 72 polymorphisms on cancer
risk in a cohort study of carriers of TP53 germline mutations. PloS one 5, e10813 (2010).
94. Trkova, M., Prochazkova, K., Krutilkova, V., Sumerauer, D. & Sedlacek, Z. Telomere
length in peripheral blood cells of germline TP53 mutation carriers is shorter than that of
normal individuals of corresponding age. Cancer 110, 694-702 (2007).

52
95. Malkin, D. Li-fraumeni syndrome. Genes & cancer 2, 475-84 (2011).
96. Lu, J. et al. MicroRNA expression profiles classify human cancers. Nature 435, 834-8
(2005).
97. Bartel, D.P., Lee, R. & Feinbaum, R. MicroRNAs : Genomics , Biogenesis , Mechanism ,
and Function Genomics : The miRNA Genes. 116, 281-297 (2004).
98. Lee, R.C., Feinbaum, R.L. & Ambros, V. The C. elegans heterochronic gene lin-4 encodes
small RNAs with antisense complementarity to lin-14. Cell 75, 843-54 (1993).
99. Reinhart, B.J. et al. The 21-nucleotide let-7 RNA regulates developmental timing in
Caenorhabditis elegans. Nature 403, 901-6 (2000).
100. Pasquinelli, a E. et al. Conservation of the sequence and temporal expression of let-7
heterochronic regulatory RNA. Nature 408, 86-9 (2000).
101. Kozomara, A. & Griffiths-Jones, S. miRBase: integrating microRNA annotation and deep-
sequencing data. Nucleic acids research 39, D152-7 (2011).
102. Friedman, R.C., Farh, K.K.-H., Burge, C.B. & Bartel, D.P. Most mammalian mRNAs are
conserved targets of microRNAs. Genome research 19, 92-105 (2009).
103. Brennecke, J., Stark, A., Russell, R.B. & Cohen, S.M. Principles of microRNA-target
recognition. PLoS biology 3, e85 (2005).
104. Bartel, D.P. MicroRNAs: genomics, biogenesis, mechanism, and function. Cell 116, 281-
97 (2004).
105. Zeng, Y. & Cullen, B.R. Sequence requirements for micro RNA processing and function
in human cells. RNA (New York, N.Y.) 9, 112-23 (2003).
106. Lund, E., Güttinger, S., Calado, A., Dahlberg, J.E. & Kutay, U. Nuclear export of
microRNA precursors. Science (New York, N.Y.) 303, 95-8 (2004).
107. Behm-Ansmant, I., Rehwinkel, J. & Izaurralde, E. MicroRNAs silence gene expression by
repressing protein expression and/or by promoting mRNA decay. Cold Spring Harbor
symposia on quantitative biology 71, 523-30 (2006).
108. Tarasov, V. et al. Differential regulation of microRNAs by p53 revealed by massively
parallel sequencing: miR-34a is a p53 target that induces apoptosis and G1-arrest. Cell
cycle (Georgetown, Tex.) 6, 1586-93 (2007).
109. Chang, T.-C. et al. Transactivation of miR-34a by p53 broadly influences gene expression
and promotes apoptosis. Molecular cell 26, 745-52 (2007).
53
110. He, L. et al. A microRNA component of the p53 tumour suppressor network. Nature 447,
1130-4 (2007).
111. Sun, F. et al. Downregulation of CCND1 and CDK6 by miR-34a induces cell cycle arrest.
FEBS letters 582, 1564-8 (2008).
112. Yamamura, S. et al. MicroRNA-34a modulates c-Myc transcriptional complexes to
suppress malignancy in human prostate cancer cells. PloS one 7, e29722 (2012).
113. Georges, S.A. et al. Coordinated regulation of cell cycle transcripts by p53-Inducible
microRNAs, miR-192 and miR-215. Cancer research 68, 10105-12 (2008).
114. Fabbri, M. et al. Association of a microRNA/TP53 feedback circuitry with pathogenesis
and outcome of B-cell chronic lymphocytic leukemia. JAMA : the journal of the American
Medical Association 305, 59-67 (2011).
115. Sachdeva, M. et al. p53 represses c-Myc through induction of the tumor suppressor miR-
145. Proceedings of the National Academy of Sciences of the United States of America
106, 3207-12 (2009).
116. Yamakuchi, M. et al. P53-induced microRNA-107 inhibits HIF-1 and tumor angiogenesis.
Proceedings of the National Academy of Sciences of the United States of America 107,
6334-9 (2010).
117. Suzuki, H.I. et al. Modulation of microRNA processing by p53. Nature 460, 529-33
(2009).
118. Léveillé, N. et al. Selective inhibition of microRNA accessibility by RBM38 is required
for p53 activity. Nature communications 2, 513 (2011).
119. Le, M.T.N. et al. MicroRNA-125b is a novel negative regulator of p53. Genes &
development 23, 862-76 (2009).
120. Hu, W. et al. Negative regulation of tumor suppressor p53 by microRNA miR-504.
Molecular cell 38, 689-99 (2010).
121. Herrera-Merchan, A. et al. miR-33-mediated downregulation of p53 controls
hematopoietic stem cell self-renewal. Cell cycle (Georgetown, Tex.) 9, 3277-85 (2010).
122. Tian, S. et al. MicroRNA-1285 inhibits the expression of p53 by directly targeting its 3’
untranslated region. Biochemical and biophysical research communications 396, 435-9
(2010).
123. Braun, C.J. et al. p53-Responsive micrornas 192 and 215 are capable of inducing cell
cycle arrest. Cancer research 68, 10094-104 (2008).
54
124. Gong, J. et al. Genome-wide identification of SNPs in microRNA genes and the SNP
effects on microRNA target binding and biogenesis. Human mutation 33, 254-63 (2012).
125. Calin, G.A. et al. A MicroRNA signature associated with prognosis and progression in
chronic lymphocytic leukemia. The New England journal of medicine 353, 1793-801
(2005).
126. Jazdzewski, K. et al. Common SNP in pre-miR-146a decreases mature miR expression
and predisposes to papillary thyroid carcinoma. Proceedings of the National Academy of
Sciences of the United States of America 105, 7269-74 (2008).
127. Jazdzewski, K. & de la Chapelle, A. Genomic sequence matters: a SNP in microRNA-
146a can turn anti-apoptotic. Cell cycle (Georgetown, Tex.) 8, 1642-3 (2009).
128. Hu, Z. et al. Common genetic variants in pre-microRNAs were associated with increased
risk of breast cancer in Chinese women. Human mutation 30, 79-84 (2009).
129. Clague, J. et al. Genetic variation in MicroRNA genes and risk of oral premalignant
lesions. Molecular carcinogenesis 49, 183-9 (2010).
130. Hoffman, A.E. et al. NIH Public Access. Cancer 69, 5970-5977 (2010).
131. Zhang, M.W. et al. Associations of lifestyle-related factors, hsa-miR-149 and hsa-miR-
605 gene polymorphisms with gastrointestinal cancer risk. Molecular carcinogenesis 51
Suppl 1, E21-31 (2012).
132. Yang, R. et al. A genetic variant in the pre-miR-27a oncogene is associated with a reduced
familial breast cancer risk. Breast cancer research and treatment 121, 693-702 (2010).
133. Ye, Y. et al. Genetic variations in microRNA-related genes are novel susceptibility loci
for esophageal cancer risk. Cancer prevention research (Philadelphia, Pa.) 1, 460-9
(2008).
134. Yang, H. et al. Evaluation of genetic variants in microRNA-related genes and risk of
bladder cancer. Cancer research 68, 2530-7 (2008).
135. Hu, Z. et al. Genetic variants of miRNA sequences and non-small cell lung cancer
survival. The Journal of clinical investigation 118, 2600-8 (2008).
136. Gu, S. et al. Thermodynamic stability of small hairpin RNAs highly influences the loading
process of different mammalian Argonautes. Proceedings of the National Academy of
Sciences of the United States of America 108, 9208-13 (2011).
137. Khvorova, A., Reynolds, A. & Jayasena, S.D. Functional siRNAs and miRNAs exhibit
strand bias. Cell 115, 209-16 (2003).
55
138. Zeng, Y. Principles of micro-RNA production and maturation. Oncogene 25, 6156-62
(2006).
139. Zheng, D., Radziszewska, A. & Woo, P. MicroRNA 497 modulates interleukin 1
signalling via the MAPK/ERK pathway. FEBS letters 586, 4165-72 (2012).
140. Zhu, Q.-Y., Liu, Q., Chen, J.-X., Lan, K. & Ge, B.-X. MicroRNA-101 targets MAPK
phosphatase-1 to regulate the activation of MAPKs in macrophages. Journal of
immunology (Baltimore, Md. : 1950) 185, 7435-42 (2010).
141. Clapé, C. et al. miR-143 interferes with ERK5 signaling, and abrogates prostate cancer
progression in mice. PloS one 4, e7542 (2009).
142. Lee, I. et al. New class of microRNA targets containing simultaneous 5’-UTR and 3'-UTR
interaction sites. Genome research 19, 1175-83 (2009).