The role of microRNA in zebrafish central nervous system regeneration Jez Supreme · 2.6...
78
The role of microRNA in zebrafish central nervous system regeneration Jez Supreme Experimental and Regenerative Neurosciences, School of Animal Biology This thesis is presented for the degree of Master of Philosophy at The University of Western Australia, August 2016
Transcript of The role of microRNA in zebrafish central nervous system regeneration Jez Supreme · 2.6...

The role of microRNA
in zebrafish central nervous system
regeneration
Jez Supreme
Experimental and Regenerative Neurosciences, School of
Animal Biology
This thesis is presented for the degree of Master of
Philosophy at The University of Western Australia,
August 2016
2
Abstract
Zebrafish have the ability to regenerate damaged parts of their central nervous system
and regain functionality. However, the molecular and cellular mechanisms involved
remain unclear. Here we test the hypothesis that gene regulatory mechanisms,
specifically microRNAs, are instrumental in orchestrating regenerative responses in
zebrafish. We used microarrays to analyse and integrate the mRNA and microRNA
(miR) expression profiles of zebrafish retina after optic nerve crush to identify potential
regulatory mechanisms that underpin central nerve regeneration. We used bioinformatic
analysis to identify candidate miRs and selected miR-223 for further analysis. In order
to downregulate miR223 we injected an inhibitor (i-miR), scrambled control, or vehicle
into the zebrafish eye immediately following an optic nerve crush. For proof of
principle, we validated the efficacy of miRNA injection for miR-223 by quantifying the
expression of miR-223 and its gene targets 2 days post injury. For all injection groups
(miR223, scrambled, vehicle), we assessed retinal ganglion cell axon regeneration
(distance and density) at two time points (3 and 7 days post-injury) using
immunohistochemistry. qPCR revealed the miR-223 inhibitor to be target-specific,
resulting in downregulation of miR223 levels and of target genes at 3 days post crush.
In addition, there appeared to be a delay in RGC axon regeneration with axons in the
miR injected groups failing to cross the chiasm. The density of RGC axons in the optic
tract was also reduced compared to controls at 3 days. However, for all fish, injection of
the inhibitor did not alter the distance reached by regenerating RGC axons at 7 days
post crush. Our results remain inconclusive about the role for miR-223 in zebrafish
RGC regeneration. However, the specificity of the miR targeting technique provides a
framework for future studies to investigate not only the cellular processes required for
CNS regeneration, but also how these mechanisms might be regulated to promote
successful repair and return of function in the injured mammalian brain.

3
Table of contents
ABSTRACT 1
ACKNOWLEDGEMENTS 6
STUDENT CONTRIBUTION DECLARATION 7
CHAPTER 1: LITERATURE REVIEW 8
1.1 CENTRAL NERVOUS SYSTEM 8 1.1.1 OVERVIEW 8 1.1.2. CNS DAMAGE 9 1.1.2.1. CNS Injury 9 1.1.2.2. Early phase vs. Secondary injury 10 1.1.2.3. Neurodegenerative Disease 10 1.2. SPONTANEOUS NEUROREGENERATION IN VERTEBRATES 11 1.2.1. OVERVIEW 11 1.2.2. THE OPTIC NERVE AS CNS MODEL 12 1.2.3. OPTIC NERVE REGENERATION IN VERTEBRATES 13 1.2.4. FACTORS PREVENTING SPONTANEOUS NEUROREGENERATION IN MAMMALS 14 1.2.5. ADVANCES IN STIMULATING SPONTANEOUS MAMMALIAN NEUROREGENERATION 16 1.3. PROCESSES LINKED WITH NEUROREGENERATION 17 1.3.1. INFLAMMATION 17 1.3.2. DEVELOPMENT AND REGENERATION 18 1.4. MICRORNAS AND GENE REGULATION 18 1.4.1. THE C-VALUE PARADOX 18 1.4.2 MIRNA 19 1.4.3. MIRNA NUMBER INCREASES IN LINE WITH NEURAL COMPLEXITY 20 1.4.4. MICRORNA IN NEUROREGENERATION & DEVELOPMENT 21 1.5. MODEL SPECIES IN STUDIES OF OPTIC NERVE REGENERATION 22 1.5.1 ZEBRAFISH 22 1.5.2. RATS 23 1.6. RATIONALE OF THE THESIS 23 1.7. AIMS 25 1.8. CONCLUSION AND SIGNIFICANCE 26
CHAPTER 2: METHODS 28
2.3. EXPERIMENTAL DESIGN AND ANIMAL NUMBERS 28 2.4 LNA OLIGONUCLEOTIDES 29 2.5 OPTIMISATION OF THE INJECTION PROTOCOL 30 2.6 INTRAVITREAL INJECTION – FINAL PROTOCOL 31 2.7 EYE AND RETINA REMOVAL FOR RNA EXTRACTION 32 2.8 RNA AND MIRNA EXTRACTION 32 2.9 MIRNA QUANTIFICATION 33 2.10 MRNA QUANTIFICATION ERROR! BOOKMARK NOT DEFINED. 2.11 FISH PERFUSION AND DISSECTION FOR IMMUNOHISTOCHEMISTRY 35 2.12 CRYOSECTIONING 37 2.13 IMMUNOHISTOCHEMISTRY 38 2.14 MEASUREMENT OF REGENERATION 40
CHAPTER 3: RESULTS 42
3.1 SHORT TERM PROOF OF PRINCIPLE STUDY 42 3.2 LONG TERM REGENERATION STUDY 45
CHAPTER 4: DISCUSSION 47

4
4.1. AN INSUFFICIENT CHANGE IN MIRNA EXPRESSION. 47 4.3. LACK OF ACCURACY IN MEASURING REGENERATION, DUE TO POOR TISSUE QUALITY. 48 4.4. CONTEXT AND SIGNIFICANCE OF MY STUDY 49
REFERENCES 56
Table of Figures
FIGURE 1.2. PRELIMINARY MICROARRAY DATA OF RETINAL CHANGES
IN BOTH ZEBRAFISH AND RAT. 24
FIGURE 2.1: MIR-223 EXPRESSION – CONCENTRATION OPTIMISATION 30
FIGURE 2.2: MIR-223 EXPRESSION - INJECTION TRIAL 31
FIGURE 2.3: VENTRAL VIEW OF THE ZEBRAFISH BRAIN 36
FIGURE 2.4: LAYOUT OF OPTIC NERVE FOR CRYOSECTIONING 37
FIGURE 2.5. METHOD OF TECTUM MEASUREMENTS 41
FIGURE 3.1: AXON REGENERATION 7 DAYS POST-OPTIC NERVE
CRUSH 43
FIGURE 3.2: REGENERATING AXONS 7 DAYS POST-INJURY 45
FIGURE 3.2. EXTENT OF REGENERATION 7 DAYS AFTER CRUSH 46
List of Tables
TABLE 2.1: SUMMARY OF ANIMAL NUMBERS USED IN THE STUDY 29
TABLE 2.2: MIRNA REVERSE TRANSCRIPTION (RT) MASTER MIX 34
TABLE 2.3: MIRNA PCR CYCLE PROGRAM 34
TABLE 2.4: MIRNA QPCR MASTER MIX 35
TABLE 2.5: MIRNA QPCR CYCLE PROGRAM 35
TABLE 2.6: TARGET GENE RT MASTER MIX ERROR! BOOKMARK NOT
DEFINED.
TABLE 2.7: TARGET GENE PCR CYCLE PROGRAM ERROR! BOOKMARK
NOT DEFINED.
TABLE 2.8: MIR-223 TARGET GENES ERROR! BOOKMARK NOT DEFINED.
TABLE 2.9: TARGET GENE QPCR MASTER MIX ERROR! BOOKMARK NOT
DEFINED.

5
TABLE 2.10: TARGET GENE QPCR CYCLE PROGRAM ERROR! BOOKMARK
NOT DEFINED.
TABLE 3.1: QUALITATIVE ANALYSIS OF REGENERATING AXONS IN
DISTANCE AND DENSITY 44

6
Acknowledgements
First, and most importantly, I need to give more thanks than I can ever express to my
primary supervisor, A/Prof Jenny Rodger. Through all the trials and tribulations of this
work she has never been anything but utterly, utterly supportive, intelligent, creative,
kind and generous with her time, expertise and support. Similarly, A/Prof Kim Carter
not only shepherded me through the perils of my honours year, but also introduced me
to Jenny and massively contributed to this project coming together. Without him, none
of this could have happened. Thanks also must go to the esteemed and impressive
Winthrop Professor Alan Harvey for his expert viewpoints in discussion of this project;
both in its initial stages and in critical assessment of its flaws. There were many people
at EaRN who helped this work come together. Specifically, a large measure of thanks
goes to Marissa Penrose, whose help with so many of the technical aspects cannot be
understated, and to Carole Bartlett & Michael Archer – thank you for being available to
assist me in the laboratory whenever I needed the help. So much of this project was
built on the work of others: Jenny, Kim & Alan of course, but also on the work of
masters student Jenny Ilgen and, absolutely critically and most of all, Paula Fuller-
Carter, whose brainchild this must rightly be called.
To my fellow students, all of whom are so much more talented and driven than I: kudos
to you. Particularly to Kalina Makowiecki, who made being her officemate not only a
joy, but a continual source of inspiration as she worked tirelessly in her own doctoral
work.
My candidature was financially supported by an Australian Postgraduate Award &
UWA top-up scholarship, and I was grateful to receive a travel grant from the school of
Animal Biology to travel to the Australian EMBL Symposium in my first year to learn
from some of the most impressive scientists in the country.
Finally, I must give my most heartfelt thanks to my partner and the love of my life:
Nicole. You have been a source of strength, friendship, inspiration and support. I have
no idea where I would be without you, but I would be so much the worse for your
absence from my life. You are my everything.

7
Student contribution declaration
The examination of the thesis is an examination of the work of the student. The work
must have been substantially conducted by the student during enrolment in the degree.
Where the thesis includes work to which others have contributed, the thesis must
include a statement that makes the student’s contribution clear to the examiners. This
may be in the form of a description of the precise contribution of the student to the work
presented for examination and/or a statement of the percentage of the work that was
done by the student.
In addition, in the case of co-authored publications included in the thesis, each author
must give their signed permission for the work to be included. If signatures from all the
authors cannot be obtained, the statement detailing the student’s contribution to the
work must be signed by the coordinating supervisor.
Chapter 1: Literature review.
This literature review was written by the student with feedback from and discussion
with his supervisors.
JZ contribution: 100%
Chapter 2: Methods
The methods section includes data on qPCR analysis of miRNA levels performed by a
German exchange student Ms Jennifer Illgen. Ms Illgen, Ms Paula Fuller-Carter and Ms
Marissa-Penrose-Menz assisted with surgical procedures and animal monitoring.
JZ contribution: 75%
Chapter 3: Results
Results were collected and analysed by JZ with assistance from German exchange
student Ms Jennifer Illgen for the 3 day regeneration timepoint.
JZ contribution: 80%
Chapter 4: General discussion
This chapter was written by the student with feedback from and discussion with his
supervisors.
JZ contribution: 100%
Student Signature
………………………………………………………………………………………….
Coordinating Supervisor Signature.
..……………………………………………………………………

8
Chapter 1: Literature review
1.1 Central Nervous System
1.1.1 Overview
The Central Nervous System (CNS) in vertebrates consists of the brain and the spinal
cord. The brain is the seat of cognition, emotions, and sensorimotor processing
(Fahrback, 2013) and the spinal cord, made up of axons and nerve cells, carries
information between the brain and the rest of the body to control function (Watson,
Paxinos, & Kayalioglu, 2009). The CNS is therefore the foundation on which our
essential selves are built; the conduit and storehouse for both our behavioural and
cognitive biology. Thus, its normal functioning is of prime importance to human health.
Following damage, however, the adult CNS has an extremely limited ability to
regenerate (Huebner & Strittmatter, 2009; Ramon & Cajal, 1928). A major hallmark of
CNS injury and disease is long-term disability, which severely impacts not only on the
affected individuals, but the wider economy (Access-Economics, 2007, 2009; Findley,
2007). The ability to induce regenerative properties in the adult CNS would be
incredibly important to the human civilisation.
In this introduction, I will explore the variability of spontaneous CNS regeneration
within the vertebrate phylum, and review how phylogenetic comparative investigation
can be used to identify the key molecular mechanisms underpinning differences in
regenerative capacity. This will be done through the use of molecular biology,
bioinformatics and neuroscience, in order to identify possible mechanisms through
which we may successfully induce neuroregeneration in mammals.

9
1.1.2. CNS damage
1.1.2.1. CNS Injury
Damage to the CNS, such as traumatic brain injury, cerebral ischemia, and Spinal Cord
Injury (SCI) is a major cause of death and disability in the adult population (Feigin,
2005; Javouhey, Guérin, & Chiron, 2006; Wyndaele & Wyndaele, 2006). Whether
acquired through insult or disease, CNS injury is not only a leading cause of major
human suffering, but also significantly impacts the economy through the need for
increased care, complex treatments, and the loss of ability to work. In the U.S.A. alone,
270 000 people live with spinal cord injury (SCI) and ~12 000 new injuries are reported
annually (DeVivo, 2012). This is not a small concern: worldwide, approximately 2.5
million people live with SCI and 130000 new cases are reported each year (Thuret,
Moon, & Gage, 2006).
In 2007, acquired brain injury severe enough to limit participation in the workforce was
reported to affect 1 in 45 of all Australians, with more than 75% of the affected below
the age of 65 (Disability in Australia, Disability in Australia: acquired brain injury,
2007). While most SCI occurs in those aged 18-35, in that same year 20,000 children
were reported to have suffered an acquired brain injury, and the increasing lifespan of
the population has been associated with increasing incidence of acquired brain injury
due to falls (Bramlett & Dietrich, 2004; Sun et al., 2011). While the long-term economic
and social costs of CNS damage are high, the impact on the individual is far more
severe; there are few options left to someone suddenly robbed of their ability to walk or,
in the case of quadriplegics, to even move their arms (Disability in Australia, Disability
in Australia: acquired brain injury, 2007).

10
1.1.2.2. Early phase vs. Secondary injury
Beyond the initial insult to the CNS, such acquired damage can often lead to secondary
injury (reviewed in Oyinbo, 2011). The early phase of injury is marked by disruption of
the blood-brain barrier, reduced or altered blood flow, as well as neuronal and/or glial
damage (Bramlett & Dietrich, 2004). The secondary phase brings increased
inflammation, which can often lead to additional damage and further cell death
(National Center for Injury Prevention and Control, 2001; Hinson, Rowell, & Schreiber,
2015; Liverman, Altevogt, Joy, & Johnson, 2005; Wyss-Coray & Mucke, 2002).
1.1.2.3. Neurodegenerative Disease
In addition to acquired injury through damage, more than 600 disorders are known to
affect the nervous system (Brown, Lockwood, & Sonawane, 2005). Neurodegenerative
disorders are those hereditary and/or sporadic conditions characterised by progressive
worsening nervous system dysfunction (reviewed in Brown et al., 2005). Often
associated with atrophy of the central or peripheral structures, they include conditions
such as Alzheimers disease and multiple sclerosis (Saba Sheikh, Safia, Ejazul Haque, &
Mir, 2012). While their aetiology differs from directly acquired injury, the mechanisms
share some overlap, such as through inflammation leading to secondary damage, and an
increased rate of neuronal cell death (Hinson et al., 2015; Oyinbo, 2011; Wyss-Coray &
Mucke, 2002). As of 2012, such neurodegenerative diseases afflict more than 30 million
people worldwide (Saba Sheikh et al., 2012).
These diseases are usually age-dependent, meaning that increasing lifespans across the
world are contributing to a rising prevalence (Khoo & Kopan, 2004; Roser, 2015;
Tzourio et al., 1997). This is an especially pertinent fact in regards to densely populated
countries in which the standard of living (and therefore both health and life expectancy)

11
are rapidly increasing, such as in China and India (Banister, Bloom, & Rosenberg,
2010; Panigrahi, 2014).
The economic costs generally increase in line with disease severity. In the UK, the
impact of Parkinson’s disease in 2007 alone is estimated to be somewhere between 449
million and 3.3 billion pounds (Findley, 2007; Morrow, 2014). While Parkinson’s
disease is the second most common neurodegenerative disease, the impact of more than
600 NDs worldwide is clearly huge.
1.2. Spontaneous neuroregeneration in vertebrates
1.2.1. Overview
Within the vertebrate phylum there is a range of complexity in the construction of the
CNS. Interestingly, there appears to be an inverse relationship between neurocomplexity
and spontaneous neuroregeneration (Figure 1) (Beazley & Dunlop, 2000; Kaslin, Ganz,
& Brand, 2008). The teleost fish, whose CNS architecture is some of the simplest within
the vertebrates, show a strong ability to regenerate from injury, being capable of adult
neurogenesis and regeneration in the brain and other parts of the CNS (Kaslin et al.,
2008).
Figure 1.1. Spontaneous neuroregeneration within vertebrates is inversely
correlated with relative neurological and evolutionary complexity.
Fish recover almost completely from crush injury to the optic nerve, and are
demonstrated to have significant and spontaneous regeneration from major spinal cord

12
injury (Beazley & Dunlop, 2000; Becker, Wullimann, Becker, Bernhardt, & Schachner,
1997; Zupanc & Sîrbulescu, 2011). Reptiles and amphibians, which possess
intermediate neurocomplexity, show intermediate levels of spontaneous regeneration
(Beazley & Dunlop, 2000; Dunlop et al., 2004). Mammals, which possess the most
complex vertebrate CNS architecture, show the least ability to spontaneously
neuroregenerate; CNS injury results only in the induction of brief, abortive and
ultimately unsuccessful regenerative processes (Ferguson & Son, 2011; Huebner &
Strittmatter, 2009; Silver & Miller, 2004).
1.2.2. The Optic Nerve as CNS model
Investigating the CNS is inherently difficult, as any damage to this integral system can
preclude survival. The optic nerve, however, is a part of the CNS that does not present
this issue.
Anatomically and developmentally, the optic nerve is an extension of the central
nervous system; it may not be the proverbial window to the soul but does provide an
excellent view of the CNS (London et al., 2012). The optic nerve exhibits CNS
characteristics: host to specialized immune responses similar to those in the brain and
spinal cord (London et al., 2012), a failure to exhibit robust regeneration in mammals, in
possession of a blood-brain barrier and containing non-neuronal supporting cells (Berry
et al., 2008). Further, the architecture and cell-type functionalities of retinal neurons
have been well defined over decades of investigation, mutations and injuries to the
visual system are non-lethal under laboratory conditions (which permits detailed
phenotypic examination) and the retina is relatively easy to access (reviewed in
Sundermeier and Palczewski, 2012). Finally of particular benefit to this phylogenetic
work, the physical architecture, histology, circuitry and biochemistry is highly

13
conserved among most vertebrates (Chan et al., 2009; Fadool & Dowling, 2008; Lamb,
Collin, & Pugh, 2007; Mahony, Corcoran, Feingold, & Benos, 2007).
1.2.3. Optic nerve regeneration in vertebrates
For the teleosts, such as goldfish and zebrafish, axotomy of the ON leads to complete
regeneration of the RGCs and a return to full function (Matsukawa, Arai, Koriyama,
Liu, & Kato, 2004). In zebrafish ON transection, the regenerating RGCs completely
traverse the tectum 25 days post-transection (Kaneda et al., 2008). Within 7 days,
regenerating axons have begun to traverse the anterior part of the tectum and at least
partial recovery of visual function is recovered as early as 14 days post-injury (Kaneda
et al., 2008). In a crush model, over 90% of axons are reported to reach the tectum
within the first week post-injury (Zou, Tian, Ge, & Hu, 2013). By contrast, in mammals,
such rats and humans, there is almost no spontaneous regeneration (Berkelaar, Clarke,
Wang, Bray, & Aguayo, 1994; Gao et al., 2012). In rat ON axotomy through
transection, most RGCs survive to 5 days post-injury, however they then experience a
massive die-off, with around 50% RGC death by 7 days post-injury (Berkelaar et al.,
1994). Axotomy through ON crush results in most RGCs apoptotically dying by
approximately 2 weeks after injury and no return to function or notable regeneration
(Villegas-Perez, Vidal-Sanz, Rasminsky, Bray, & Aguayo, 1993).
Regeneration of the optic nerve in vertebrates follows the same trend as the overall
CNS, in that there remains an inverse correlation between neurocomplexity and
spontaneous regeneration. Following optic nerve damage, zebrafish and amphibian
regeneration is robust (Beazley and Dunlop, 2000; Zupanc and Sîrbulescu, 2011).
Regeneration still occurs in many lizard species, but with significant errors in
pathfinding and retinotopic mapping (Dunlop et al., 2004). In mammalian vertebrates,

14
such as rats and humans, the ability of the CNS to grow and path-find after damage
appears to be developmentally lost, meaning that in adults, aside from slight and
abortive induction of neuroregenerative processes, successful CNS regeneration is
essentially absent (Beazley and Dunlop, 2000; Vajn et al., 2013).
Even within spontaneously neuroregenerating vertebrates, such as the teleosts,
successful regeneration of damage to the optic nerve is highly dependent on the extent,
type and positioning of the insult (Harvey et al., 2006). For multiple reasons, not least of
which is the disruption of the blood-brain barrier, ‘cut’ injuries in which the axons are
entirely severed and the myelin sheath of the optic nerve is broken are far less
successfully repaired than ‘crush’ injuries, in which the axons of the optic nerve are
severed but the sheath is left intact (Reier & de Webster, 1974). Further, the distance
from the eye in which the damage occurs is a relevant factor to CNS repair; greater
distance results in less successful repair of damage (Berkelaar et al., 1994; Weibel,
Cadelli, & Schwab, 1994).
1.2.4. Factors preventing spontaneous neuroregeneration in mammals
In mammals, the CNS fails to regenerate due to both intrinsic and extrinsic inhibitory
factors. Extrinsic inhibitory factors include: CNS myelin, which collapses the tips of
growing axons on contact (Schnell & Schwab, 1993; Wang et al., 2002); inhibitory glial
scarring that forms at CNS injury sites (Benowitz & Yin, 2007; Silver & Miller, 2004);
and a lack of neurotrophic support within the CNS (Harvey, Ooi, & Rodger, 2012; Jin,
Fischer, Tessler, & Houle, 2002; Lu & Tuszynski, 2008).
The intrinsic growth capacity of axons changes over time; Retinal Ganglion Cells (RGCs)
younger than embryonic day 21 show rapid axonal extension, while RGCs older than 2
15
days postnatal fail to extend (Benowitz & Yin, 2007). This shift appears to require direct
contact with amacrine cells (Goldberg, Klassen, Hua, & Barres, 2002). The intrinsic
regenerative capacity relies heavily on gene transcription and protein translation
(reviewed in (Wang & Jin, 2011)). For example, RGCs express a wide range of proteins
during developmental connection formation, like GAP-43, which becomes
downregulated as mature connections form. Successfully regenerating neurons (like the
sensory neurons of the peripheral sensory ganglia, or fish CNS neurons) strongly
upregulate GAP-43, whereas mammalian RGCs show only a small transient upregulation
after axotomy (Skene, 1989). It has been reported that limited regeneration of the dorsal
root ganglions can be promoted in adult mice through the co-expression of GAP-43 and
CAP-23 (Bomze, Bulsara, Iskandar, Caroni, & Pate Skene, 2001), that increased GAP-
43 expression is associated with macrophage-activation-mediated RGC regeneration in
rats (Botstein & Risch, 2003) and that overexpression induces nerve sprouting in adult
mice (Aigner et al.). However, other studies have shown that transducing RGCs to express
GAP-43 alone does not improve regeneration (Hellstrom & Harvey, 2011; Leaver, Cui,
Bernard, & Harvey, 2006). Further, the overexpression of GAP-43 can potentially result
in pathological outcomes (Hocquemiller et al., 2010). There remain considerable
questions as to how the intrinsic growth capacity of RGCs are modulated.
The intrinsic state of the RGC is crucial to understand, as it dictates the response to
extrinsic factors (Benowitz & Yin, 2007). For example, elevated intracellular cAMP
levels are generally required for RGCs to respond to cell survival and axon outgrowth-
inducing factors, but once a mammal reaches adulthood these levels are low, contributing
to the lack of regenerative ability (Benowitz & Yin, 2007; Hellström & Harvey, 2014).
In contrast, cAMP levels in fish RGCs increase during regeneration and return to normal
levels once regrowth is complete (Rodger, Goto, Cui, Chen, & Harvey, 2005).

16
1.2.5. Advances in stimulating spontaneous mammalian neuroregeneration
While recent work has shown it possible to stimulate pro-regenerative responses in the
mammalian retina through various strategies, such as the addition of subtoxic
concentrations of excitatory amino acids, specific molecules like oncomodulin (Harel et
al., 2012), growth factors, or the stimulation/repression of Transcription Factors (TFs)
(Benowitz & Yin, 2007), this has not led to significant recovery of function in the limited
regeneration achieved (Karl & Reh, 2010). With even the combination of the existing
approaches failing to bring about a full, functional recovery, the puzzle appears to be
missing necessary elements for solution.
There remain further avenues through which neuroregeneration in mammals might be
enhanced. The induction of some aspects of developmental gene expression, pro-
regenerative gene pathways and/or the mimicking of genetic regulation seen in the more
plastic vertebrate neural systems might all yield valuable additional pieces towards
solving the problem (Benowitz & Popovich, 2011; Fischer, Petkova, Thanos, &
Benowitz, 2004; Glass, Saijo, Winner, Marchetto, & Gage, 2010). The regulatory aspect
is particularly compelling, as genes upregulated during teleost CNS regeneration are
common to mammals, suggesting the disparity in regeneration is the result of
differential gene expression rather than species-specific genes (Blackmore, 2012; Hui et
al., 2014).

17
1.3. Processes linked with neuroregeneration
1.3.1. Inflammation
In teleosts, damaged RGCs either survive, or die only in small numbers by apoptosis
(Murray & Edwards, 1982). By contrast, CNS lesions in mammals lead to injured cells
undergoing both apoptosis and necrosis (Kerr, Seorl, Harmon, & Bishop, 1987).
Necrosis generally leads to tissue inflammation and the formation of glial scars, which
inhibit regeneration (Zhang, Krebs, & Guth, 1997).
In fish, the immune response is rapid and localized. Cell apoptosis is followed by the
appearance of innate immune cells, neutrophils and macrophages, post-lesion (Zupanc
et al., 2003), which are associated with rapid clearing of astrocytes and
oligodendrocytes from the lesion site, preventing the formation of an astrocytic scar
(Nona, 1998). Neutrophil infiltration is the first response to inflammation within 12-
24h (Kurimoto et al., 2013; Schnell, Fearn, Klassen, Schwab, & Perry, 1999; Stirling,
Liu, Kubes, & Yong, 2009). Next, macrophages invade the injury zone to clear axonal
debris and myelin (Blaugrund, Duvdevani, Lavie, Solomon, & Schwartz, 1992).
In rats, however, the inflammatory response to an optic nerve crush shows a small and
steady increase in macrophages over the first 5 days (Perry, Brown, & Gordon, 1987). It
is known that macrophages release trophic factors and that may play a beneficial role in
nerve regeneration; specifically, there is evidence that macrophage-derived factors and
oncomodulin promote regeneration in rat models (Kurimoto et al., 2013; Yin et al.,
2003). For example, activating macrophages with the pro-inflammatory agent Zymosan
following an optic nerve crush in rats promoted axon regeneration through a peripheral
nerve graft, suggesting that macrophages in fact support optic nerve regeneration(Yin et

18
al., 2003). Therefore, there seems to be a correlation between poor regenerative capacity
of the CNS and limited number of immune cells in the region following injury.
1.3.2. Development and regeneration
During development of the CNS, axons grow and path-find, forming connections as a
result of complex, multifaceted gene expression. In the formation of the optic nerve, for
instance, the growth cones make rapid adjustments based on feedback from their
surroundings (Erdogan, Ebbert, & Lowery, 2016). Once reaching the tectum, retinotopic
mapping of the axons to form useful connections is based on both attraction and
repulsion, and highly modulated gene expression (McLaughlin & O'Leary, 2005;
Tamariz & Varela-Echavarría, 2015)
Successful CNS regeneration, such as in zebrafish optic nerve regrowth, inducts a local
gene expression profile similar to that seen during development, however with notable
differences, primarily because axons are regrowing through a mature brain environment
(Munzel et al., 2012; Ramachandran, Reifler, Parent, & Goldman, 2010). Beyond
inducing cell survival and regrowth, re-creating this mapping in adult mammals may
require the mimicking of some, but not all, of the gene expression profile seen in the
region during development.
1.4. microRNAs and gene regulation
1.4.1. The c-value paradox
The c-value is the term for genome size in an organism. One of the surprising
discoveries in the study of evolutionary genetics was that the size of the genome does
not scale in line with the ‘complexity’ of a species (Gregory, 2005). The discovery of
noncoding DNA, illuminating the fact that the sheer gene number does not itself
necessarily dictate genome size, went a small way to explaining this paradox. However,

19
the number of genes is also not strongly correlated with the complexity of an organism
(Bird, 1995). More recent work has demonstrated that an increase in the regulatory
complexity and apparatus correlates much more closely with complexity than does
simple gene number (Fritzsch, Jahan, Pan, & Elliott, 2015).
1.4.2 miRNA
Most of the information in the vertebrate genome is involved in complex regulatory
processes, many of which underpin development and brain function. Key players in this
process are non-coding RNAs (described by large consortia such as ENCODE and
FANTOM), which play a significant role in many key biological processes. One of the
most intensely studied groups of these non-coding RNAs are microRNAs. microRNAs
(miRNAs) were first discovered in 1993, but not reported to definitively act in
biological regulation until the early 2000s (Almeida, Reis, & Calin, 2011). These small
(~22 nts), noncoding RNA sequences have since been shown to act in the regulation of
almost all protein-coding transcripts in animals (Berezikov, 2011). They act as guide
molecules in RNA silencing, downregulating expression of their targets as ‘fine-tuning’
regulators; modulating expression to a smaller degree than do other methods, such as
larger RNA molecules; they act as a rapidly activated ‘spigot’ to adjust expression
through downregulation, rather than as an on/off switch (Almeida et al., 2011). A given
miRNA binds through perfect/imperfect binding, and may target many different genetic
regions with varying strength, or act in combination with transcription factors to
regulate entire pathways as ‘master regulators’ (van Rooij, 2011). One miRNA can
target hundreds of genes and their regulatory models are complex (Chiu, Alqadah, &
Chang, 2014; Corrada, Viti, Merelli, Battaglia, & Milanesi, 2011). Further, there is
often a redundancy of targeting, meaning that for some regions, knockout of just a
single miRNA may not be sufficient to meaningfully change expression (Fischer,

20
Handrick, Aschrafi, & Otte, 2015). The evolutionary importance of microRNAs as
regulatory molecules is reflected in their strong sequence conservation between species
(Berezikov, 2011). Compellingly, there is a greater divergence in microRNA expression
between tissues than between species, and further, there are more distinct microRNAs
expressed in the brains of vertebrates than in any other tissue, highlighting the
evolutionary conservation of microRNAs in brain development and function (Mattick,
2011). In neurons, microRNAs regulate many fundamental processes including
differentiation, axonal growth, synaptogenesis, and plasticity (Manakov, Grant, &
Enright, 2009). microRNA implication in neurological diseases, combined with their
remarkable specificity for individual signalling pathways, has led to the development of
microRNA-based CNS therapeutics (Madathil, Nelson, Saatman, & Wilfred, 2011),
with microRNAs found to be versatile and reversible regulators of gene expression in
neurons (Chiu et al., 2014).
An intriguing and compelling aspect of microRNAs is their ability to regulate other
transcriptional regulators, particularly transcription factors (TFs), which themselves
play an important role in CNS development and regeneration (Tedeschi, 2011). The
high conservation between species observed for TFs, as seen for microRNAs, supports
the idea that microRNAs and TFs co-evolved (Chen & Rajewsky, 2007). MicroRNAs
appear to target TFs more than other gene types (Dannemann et al., 2012), whilst
microRNA genes are preferentially regulated by TFs, indicating an intricate, complex
and synergistic mechanism for gene regulation (Krol, Loedige, & Filipowicz, 2010).
1.4.3. miRNA number increases in line with neural complexity
The number of miRNA present and active within the CNS of vertebrates follows the
same general trend in neural complexity (Figure 1). This suggests that this regulatory

21
apparatus is an important part of a developing nervous system, and contributes to its
ability to gain complexity. Key characteristics of miRNA, covered earlier, make them
well suited to regulate the complex events of brain development.
miRNA are important gene regulators within the CNS. These small, noncoding RNAs
are found in almost all eukaryotic cells, and abundantly expressed in the CNS
(Benowitz & Yin, 2007; Lu & Tuszynski, 2008; Madathil et al., 2011). Many show
specificity of tissue and developmental stage expression, with the suggestion of unique
functions in the retina and other ocular tissues (Liu et al., 2009). Their ability to induce
and regulate entire pathways of expression means their modulation may represent the
key to generating functional recovery from CNS damage in mammals.
1.4.4. MicroRNA in Neuroregeneration & Development
It is primarily the epigenetic processes (e.g. DNA methylation, chromatin remodelling,
noncoding RNAs, RNA & DNA editing) that shape development, differentiation and
plasticity in the nervous system (Mattick, 2011). In the brain, animals (particularly
primates) have evolved considerable adaptability within RNA regulatory systems
(McNeill & Van Vactor, 2012). Predicted to regulate synaptogenesis and neural
development (reviewed in Xu, 2009), miRNA have been described as the ‘prime movers’
shaping the epigenetic landscape of the CNS (Manakov et al., 2009).
Essential regulatory elements during development (reviewed in Sibley & Wood, 2011), a
number of specific miRNA may be important for spontaneous CNS repair. In particular,
one miRNA, miR-223, was identified in our previous work in zebrafish (Fuller Carter et
al., 2015; described in detail in section 1.6: Rationale) and has been shown to have a
number of gene targets important for neuroregeneration. It has been implicated in
22
preventing neuronal cell death following transient global ischemia (Rita & Robert, 2010),
is upregulated in response to spinal cord injury (SCI) and plays a role in regulating
neutrophils (Harraz, Eacker, Wang, Dawson, & Dawson, 2012), suppressing
proinflammatory macrophage activation (Izumi et al., 2011).
1.5. Model species in studies of optic nerve regeneration
In order to facilitate identification of the important molecules and processes involved in
human health and disease, model species should have a useful phenotype and well
characterised genomes (Li, Yang, & Zhong, 2015). Here, I study regulation of gene
expression in zebrafish, which display successful regeneration with full return of visual
function (Becker & Becker, 2007). I have chosen to study zebrafish because their
genome has been completely sequenced and annotated, with continuous ongoing
revision. In addition, their microRNA genetic make-up is relatively well described and
annotated. Although insights into the requirements for successful regeneration could be
obtained from a comparison of reptiles, which have varied regenerative responses
(Dunlop et al., 2004), little is known about reptilian genomes. Furthermore, within-class
comparisons have limited ability to identify functional conserved non-coding sequences,
due to high sequence similarity (Ahituv, Rubin, & Nobrega, 2004). For this reason, the
present thesis will focus on mammal-fish comparisons.
1.5.1 Zebrafish
One of the great benefits of the zebrafish as an animal model in terms of genetic
investigation is that they have a fully sequenced and well annotated genome (D. G.
Howe et al., 2013; K. Howe et al., 2013). The species has been used by a large number
of biological investigations over the last decades, and has been well characterised. In the
case of this specific investigation, many of the genes inducted by CNS injury are

23
virtually identical to the human orthologues (K. Howe et al., 2013). As with most
species, the knowledge base concerning the microgenome (or, the genome of the
microRNA) lags behind that of the base DNA. While this does represent an additional
challenge to phylogenetic investigation of miRNA in zebrafish specifically, much of the
microgenome has been reported within the literature and there are powerful online tools
with which to support such study (eg. TargetScanFish; (Cho et al., 2005; Grimson et al.,
2007)). There are additional benefits to the use of zebrafish in a laboratory setting, as
they have not only been used in previous neuroregeneration studies (enabling
comparison to the existing literature and benefits to the planning of specific
experimentation), but are easy to care for, inexpensive and easy to acquire, as well as
being in possession of a fairly rapid growth cycle (Cho et al., 2005; Jiao et al., 2005).
1.5.2. Rats
The ultimate goal of medical research is to take the lessons we learn and apply it to
human health outcomes. As a mammalian model, rats are a good proxy for human
studies. While there are clear differences between rats and humans, rats present, in
contrast to primates, for examples, a much better studied and well-understood model, as
well as being more cost-effective and less ethically problematic (Iannaccone & Jacob,
2009). Their genome has been very well investigated and annotated, and their
microgenome is relatively well known (Gibbs et al., 2004; Minami et al., 2014). As with
zebrafish, rats are heavily reported in the literature of neuroregeneration studies,
facilitating comparison and interpretation.
1.6. Rationale of the thesis
The experimental design of this thesis was informed by the outcome of a bioinformatics
analysis of mRNA and miRNA expression in zebrafish eye following an optic nerve

24
crush (Fuller-Carter et al., 2015). We performed a pilot study of gene expression
microarrays in rat and zebrafish retina at 3 days following an optic nerve crush injury,
identifying differentially regulated microRNAs and genes (including TFs) potentially
contributing to the successful regenerative response in zebrafish.
Figure 1.2. Preliminary microarray data of retinal changes in both zebrafish and rat.
Differentially expressed
microRNAs, genes, and
transcription factors after
optic nerve crush. Up (↑)
and down (↓) represent
direction of change.
Transcription factors were
identified by GO terms
associated with DNA-
transcription processes.
Data were collected from
n=4 pooled retinae (each
pool=4 animals) for control
vs. crush, in each species.
An initial species comparison revealed 657 differentially expressed genes in the
zebrafish compared to 593 differentially expressed genes in the rat (log fold change
1.5; adjusted p-value <0.05; Figure 2). Many of these genes were also identified in
previous mRNA screens (Agudo et al., 2008; McCurley & Callard, 2010; Veldman,
Bemben, Thompson, & Goldman, 2007). Further analysis identified miR-223 and
miR29b to be significantly up-regulated in zebrafish and down-regulated in rat. The
predicted targets of these miRs based on inverse expression patterns and bioinformatic
prediction software are involved in axonal outgrowth and neuronal plasticity. The
relationship between miR-223 and these predicted targets was validated in cell culture
(Fuller-Carter et al., 2015) and here I further investigate the role of miR223 in optic
nerve regeneration in zebrafish.
A.
A.

25
1.7. Aims
Investigate the effects of specific miRNA on CNS regeneration in vertebrates
In this work I will explore the effects on neuroregeneration in zebrafish of modulating
expression of miR223. My results will inform future studies to conversely modulate the
miR223 in rats in order to promote mammalian neuroregeneration. More broadly, my
results will also provide a framework to explore the role of other miRNAs in optic nerve
regeneration.
Aim 1: To determine whether injection of miRNA inhibitors into the eye in vivo in
zebrafish can downregulate the target miRNA
As this is a methodological aim, the outcomes will be described in chapter 2: Methods.
Aim 2: To investigate the effects on retinal ganglion cell regeneration zebrafish of
inhibiting our target miRNA
The intervention (covered within the experimental chapter in more detail) consists of a
complete of the optic nerve of the right eye, approximately 3 mm from the eye, so as to
completely sever the axons of the optic nerve while leaving the myelin sheath intact as a
path for regenerative growth (and to minimise secondary damage due to inflammation
and disruption of the blood-brain barrier). Immediately after injury, I will inject a miR-
specific inhibitor which binds to and ‘knocks down’ the miR223. Zebrafish will be
sacrificed at two timepoints: an early timepoint (2-3 days) to confirm knockdown of
miR and target gene expression, and a late timepoint (7 days) to examine the effects on
RGC axon regeneration. After sacrifice, the zebrafish will be dissected, optic nerves and
brain preserved and sectioned for histochemical analysis to determine the extent of
regrowth and effects of miR knockdown on the axonal regeneration.

26
1.8. Conclusion and significance
There are myriad interconnected signalling pathways involved in neuronal survival and
regeneration and it is not clear which ones are the best targets for therapeutic
interventions (Benowitz & Yin, 2007). By using a comparative species approach, our
lab previously identified miRNAs that differentially expressed in zebrafish and rats.
Here we will assess the ability of microRNAs to mediate rapid, specific and adaptive
changes in gene expression that may drive CNS regeneration.
Our approach of using miRNAs to gain insight into regulation of gene expression
reflects the current understanding that most differences between species comes down to
differences in the timing and location of gene expression, not the existence of unique
genes (Carroll, 2008). The emerging field of miRNAs is likely to provide insights into
gene regulatory mechanisms that underpin the differences in regenerative ability across
the vertebrate phyla, differences which have intrigued researchers for over 100 years.
Moreover, the use of miRNAs which affect the expression of multiple genes, potentially
overcomes the requirement for combinatorial therapies with associated combinatorial
side effects (Benowitz & Yin, 2007). Furthermore, our study of targets downstream of
miR-223 will allow us to refine any potential therapeutic intervention to minimize side
effects and maximize efficacy.
Manipulating levels of miRNAs is an exciting therapeutic concept that is being trialed
in many diseases, and miRNAs have been used as therapeutic agents in the experimental
treatment of cancer (Roshan, Ghosh, Scaria, & Pillai, 2009; Schratt, 2009). However,
very little work has been done on the potential for miRNAs to treat neurological
conditions. Nonetheless, miRNAs are abundantly expressed in the vertebrate and

27
specifically the human brain, emphasizing their importance in regulating appropriate
gene expression for complex connectivity and function.

28
Chapter 2: Methods
2.1 Animals and anaesthesia
Common longfin adult zebrafish (Danio rerio), 2–4 cm in body length, were obtained
from commercial suppliers, kept in gravel-bottomed tanks containing aerated,
dechlorinated tap water in a controlled temperature room at 220C on a 12-h light/dark
cycle, and fed five times a week with dried goldfish pellets. For surgery and intravitreal
injections, zebrafish were anaesthetised by immersion in 0.3% MS222 solution,
buffered with bicarbonate soda (0.6g MS222 and 0.6g NAHCO3 in 200mL deionized
H2O). For terminal anaesthesia the [MS222] was 0.6%, with the same concentration of
NAHCO3. Procedures conformed to the NHMRC guidelines for the use of animals and
were approved by the Animal Ethics Committee of The University of Western
Australia.
2.2 Optic nerve crush & Intravitreal injections
The right eye was deflected forward and connective tissue removed to expose the optic
nerve that was crushed with watchmaker's forceps with pressure applied for 10 seconds,
1 mm from the back of the eye; the procedure severs all RGC axons but leaves the nerve
sheath intact as a conduit for regeneration (Meyer & Kageyama, 1999). The eye was
then placed back into the socket.
2.3. Experimental design and animal numbers
Animal numbers are summarized in table 2.1.

29
Experimental groups: Fish received an optic nerve crush and were injected with (1) a
miR223 inhibitor, (2) a scrambled control sequence, (3) a vehicle control, or (4) no
injection.
Proof of principle short term (2-3 days) injection study: Retinas from 3 fish were pooled
to give sufficient RNA for analysis, and nine fish were used per group, resulting in 3
samples per group. For immunohistochemistry (IHC) analysis of nerves at 3 days, each
group contained 3 fish.
RGC regeneration long term (7 day) study: Brains were collected for
immunohistochemistry from 10 fish per group. All tissue from an initial experiment was
lost due to a freezer breakdown in 2015 and these animals were repeated a second time
with n=6-9 per group. Due to lack of time, only brains were analysed by
immunohistochemistry for RT97 and eyes and nerves were retained for future analysis.
Table 2.1: Summary of animal numbers used in the study
Short term Long term
2 days (RNA) 3 days (Histology) 7 days (Histology)
miRNA validation
36
NA
NA
Histology 1 (lost
due to freezer
failure)
NA
12
40
Histology 2
NA
12
40
2.4 LNA oligonucleotides
The zebrafish-specific LNA miR-223 inhibitor (i-miR) and scrambled negative control
were ordered from Exiqon (Denmark). The miR-223 inhibitor specifically binds to

30
endogenous mature miR-223 sequences, whilst the scrambled negative control has non
known binding partner in zebrafish. Each lyophilized LNA oligo (5.0nmol) in was
resuspended in ddH2O to various concentrations. The oligo sequences for LNAs were as
follows: i-miR223 sequence 5’-3’: GGGTATTTGACAAACT; scrambled sequence 5’-
3’: ACGTCTATACGCCCA.
2.5 Optimisation of the injection protocol
Review of the literature for appropriate doses of miR inhibitors revealed a concentration
of 250µM (0.125nmol) significantly decreased miR expression while control miRs
(scrambled) at this concentration had no effect (Sano et al., 2012). After testing
concentrations ranging from 500µM to 30µM, we found that a concentration of 100µM
(0.05nmol in 0.5ul) of the miR inhibitor (i-miR) significantly decreased miR-223 levels
but scrambled control had no effect (Fig. 1).
Figure 2.1: miR-223 Expression – Concentration Optimisation
Different concentrations were tested to find the optimal concentration. 30, 60, 200, 250,
and 500µM concentrations of the inhibitor had no effect on miR223 levels. Although
300 and 400µM decrease the miR-223 expression, I found that at 100µM the decrease
was more stable and consistent. Therefore, I used a concentration of 100µM for all
injections in this study.

31
When compared to a crush control, the glass micropipette increased miR-223 expression
to the same extent as the Hamilton syringe (Fig. 2.2), but the glass micropipette was
easier to stabilize whilst injecting. I therefore used a glass micropipette for all injections
in this study.
Figure 2.2: miR-223 Expression - Injection Trial
Two different injection techniques were trialed to determine a tool that induces the least
amount of lens damage at the time of injection following an optic nerve crush. A crush
control, where only the optic nerve was crushed, was used to compare the miR-223
expressions after injection. Although the injections procedures gave similar results, the
glass micropipette was used due to ease of handling.
2.6 Intravitreal Injection – final protocol
Injections were made with a 10µl Hamilton syringe connected to a glass micropipette
via tubing. The tubing was prefilled with mineral oil to ensure the exact amount of oligo
was injected. A dorsal eye incision was made with a 30-gauge needle to insert the
syringe into the eye. It has been shown by several groups that damage to the lens can
occur during injections in mammals, hence the needle was carefully placed in front of

32
the lens to avoid contact with the lens itself or the retina(D. Fischer, P. Heiduschka, &
S. Thanos, 2001; Fischer, Pavlidis, & Thanos, 2000; Leon, Yin, Nguyen, Irwin, &
Benowitz, 2000). Experiments in our lab found the maximum volume that could be
injected into the zebrafish eye was 0.5µl. Therefore 0.5µl of the miR-223 inhibitor (i-
miR) or the negative control (scrambled) was injected into the vitreous. A fine tube was
placed into the mouth of the fish to flush tank water through to accelerate reanimation.
2.7 Eye and Retina Removal for RNA extraction
Retinae were collected for RNA extraction. The fish was anesthetised in 0.3% MS222.
Using a binocular microscope, the eye was cut out with forceps and scissors by first
tearing the connective tissue around the eye and then by cutting the optic nerve and
removing the eye from the eye socket. To cut the cornea around the lens, an incision
across the lens was made with a 30g needle. The retina was then isolated by using
forceps to tear apart the eye, and remove the lens, sclera and retinal epithelial pigment.
The retina was placed into 400µl RNA Later, a RNA stabilisation solution, and kept in
4°C overnight before being transferred into -80°C for storage.
2.8 RNA and miRNA Extraction
The pooled zebrafish retinas were homogenized in 1ml Trizol using a syringe (22g then
27g). The homogenate was then allowed to sit for ~3min at room temperature and 200µl
chloroform was added. The Eppendorf tube was shaken for 15sec and then allowed to
sit for another ~3min at room temperature. The samples were centrifuged at 12,000g for
20min at 4°C. Next, the upper aqueous phase was transferred to a new Eppendorf tube
without disturbing the interphase or organic layers (~450µl). 500µl of room temperature
isopropanol was added to the supernatant, mixed and then allowed to precipitate at room

33
temperature for 10min. The samples were spun for 20min at 12,000g at 4°C and the
supernatant removed. The pellet was washed 2x with 500µl of ice-cold 80% ethanol
(EtOH), mixed with a finger flick and centrifuged again at 12,000g for 5min at 4°C. To
concentrate the RNA, 5 volumes of 100% EtOH, 1/10th volume 3M sodium acetate
(NaOAc) and 1µl glycogen were added to the sample, mixed thoroughly and incubated
at -80°C overnight. After incubation, the samples were centrifuged at 12,000g for 20min
at 4°C and the supernatant removed. Next, the pellets were washed two times with
500µl of ice-cold 80% EtOH and centrifuged at 12,000g for 5min at 4°C. The pellets
were air-dried for 5-10min and 20-30µl of RNase free H2O was added. Before the RNA
concentration was determined using a Nanodrop (Thermo Scientific) the samples were
frozen at -20°C for ~15min and then resuspended. The 260/280 and 260/230 ratios were
observed to make sure that the samples were not contaminated (protein, salt, phenol,
etc.).
2.9 miRNA quantification
microRNA RT and qPCR for miR-223 and U6 was performed using Taqman miRNA
assay kits (Applied Biosystems). Each kit contains a miR-specific stem-loop primer to
reverse transcribe the mature miR sequence, and a miR-specific fluorogenic probe to
quantify the mature miR by qPCR.
For the RT PCR about 10ng RNA was used for each sample, if necessary the RNA was
diluted (1/10). The samples were prepared on ice as followed, 7µl of the master mix
(H2O, 100mM dNTPs, RT Enzyme, 10x Buffer, RNase Inhibitor) (Table 2.2), 5µl of
RNA (up to 10ng RNA + H2O), and 3µl of 5x RT Primer were aliquoted into 0.2ml
tubes to a total volume of 15µl. The RT Primers used were miR 223 and U6. U6 is a
small nuclear RNA which is used as control. The samples were gently mixed and
incubated for 5min on ice before starting the PCR cycle (Table 2.3).

34
Table 2.2: miRNA Reverse Transcription (RT) Master Mix
Master Mix 1x
100mM dNTPs 0.15µl
RT Enzyme (Multiscribe) 1.00µl
10x Buffer 1.50µl
RNase Inhibitor 0.19µl
H2O 4.16µl
Final Volume 7.00µl
Table 2.3: miRNA PCR Cycle Program
Cycle Temperature + Time
Reverse Transcription to
cDNA
16°C for 30min
Amplification 42°C for 30min
Termination 85°C for 5min
Cooling of Sample 4°C forever
For qPCR, the Taqman-based detection uses a 5’ fluorogenic-labeled probe to identify
specific amplification products by using quenchers on the 3’ ends which first inhibit
fluorescence and then emits fluorescence as soon as it is separated from the reporter
dye. For the microRNA qPCR each sample was tested in triplicate with a final volume
of 20µl. The Taqman Universal Master Mix was combined with RNase free H2O, the

35
miR-223 RT 20x Primer, and the cDNA from the RT-PCR (Table 2.4). The samples
were amplified in a quantitative PCR (qPCR) reaction (Table 5). A water sample was
used as a negative control.
Table 2.4: miRNA qPCR Master Mix
Master Mix 1x 3x (w 20% excess)
Taqman Universal MM
(no UNG)
10.00µl 36.00µl
H2O 7.67µl 27.60 µl
RT 20x Primer 1.00µl 3.60µl
cDNA 1.33µl 4.8µl
Final Volume 20.00µl 72.00µl
Table 2.5: miRNA qPCR Cycle Program
Cycle Temperature + Time
UNG Enzyme Activation 1x 50°C for 2min
Hot-Start Activation 1x 95°C for 10min
Denaturation 95°C for 15sec
Annealing/Elongation 95°C for 1min
2.11 Fish Perfusion and dissection for immunohistochemistry
For immunohistochemistry (IHC) assays, the brain together with the optic nerve and the
eyes were dissected. Before the dissection, the fish was anesthetised in MS222 (0.3%)
and then perfused with 4% paraformaldehyde (PFA). An incision was made above the
ventral fin and cut along the midline up to the heart. The ribcage was cut to get better
40x

36
access to the heart. The tissue enclosing the heart was also removed. A 30g needle
attached to a syringe was then inserted into the ventricle of the heart and 0.65% saline
slowly injected to remove the blood in the blood vessels. The 4% PFA solution was
then injected into the ventricle to fix the brain tissue for dissection and histological
analysis. After the perfusion the fish head was cut off and placed into 400µl 4% PFA
and stored overnight in 4°C.
To gain access to the brain, firstly the jaw as well as the surrounding tissue had to be
removed. The ribcage was cut through to remove the tissue. Once the skull was cut
open, the muscles connecting the brain to the eyes were removed. The skin on the dorsal
side of the head and all of the mandibular cartilage was removed. Following the
dissection, the eyes were removed from the brain and optic nerve whereas the crush site
was kept on the optic nerve (Fig.3). The optic nerve, together with the brain was stored
in 4% PFA by 4°C. The optic nerves and chiasm were removed from the brain before
cryosectioning for antibody (AB) staining.
Figure 2.3: Ventral View of
the Zebrafish Brain
The zebrafish eye is
connected to the optic nerve.
At the optic chiasm, the
nerve crosses over to the
contralateral hemisphere
where it connects to the optic
tectum via the optic tract.
The crush (clear strip in the
optic nerve corresponding to
discontinuous axons) was
performed with fine forceps
on the right optic nerve right
after the eye before the optic
chiasm.
crush site
Optic tectum
Optic tract
Eye
Optic nerve
37
2.12 Cryosectioning
A cryostat, Leica CM1900, was used to section the zebrafish optic nerve for
immunohistochemistry. The cryostat was held at a temperature of -20°C to maintain
specimens frozen for cutting. A metal chuck was mounted with O.C.T. (optimal cutting
temperature) compound, an embedding medium for frozen tissue specimens to ensure
optimal cutting temperature. The metal chuck was placed in the cryostat to freeze and a
few sections were cut to smoothen the surface. The sample was soaked in O.C.T. and
then placed onto the metal chuck and again coated with O.C.T.. The zebrafish optic
nerve was placed with the ventral side
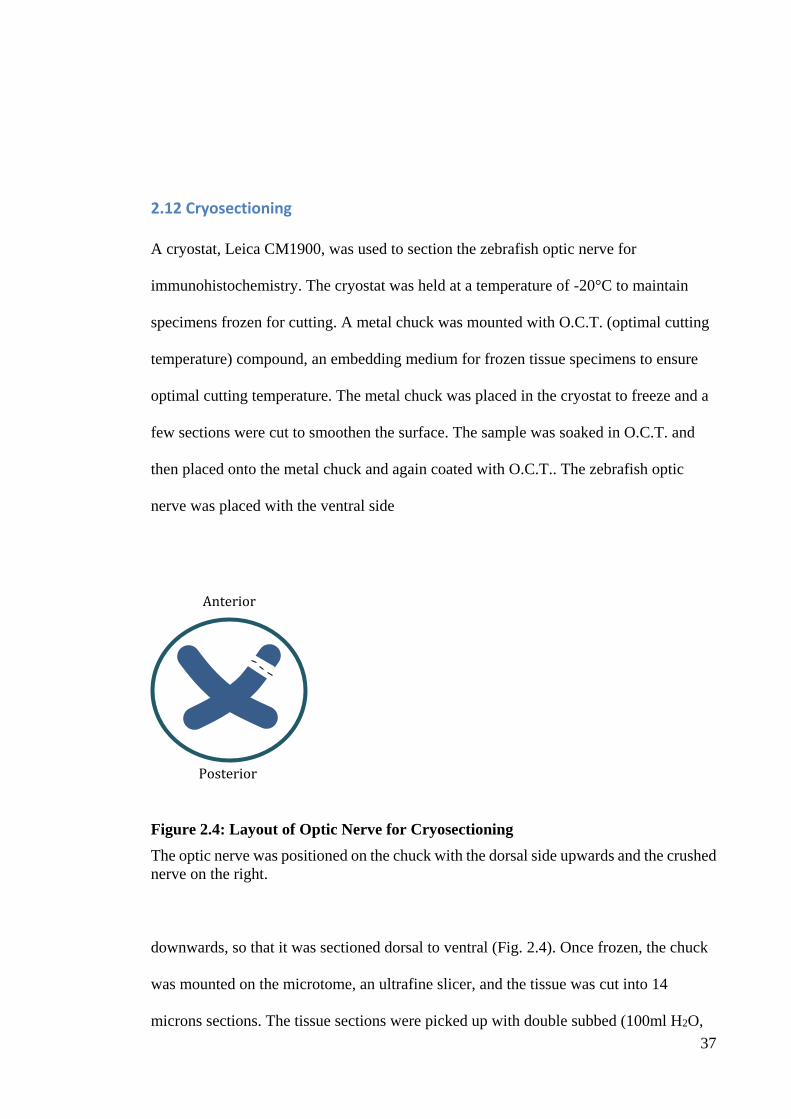
Figure 2.4: Layout of Optic Nerve for Cryosectioning
The optic nerve was positioned on the chuck with the dorsal side upwards and the crushed
nerve on the right.
downwards, so that it was sectioned dorsal to ventral (Fig. 2.4). Once frozen, the chuck
was mounted on the microtome, an ultrafine slicer, and the tissue was cut into 14
microns sections. The tissue sections were picked up with double subbed (100ml H2O,
Anterior
Posterior

38
0.5g gelatin, 0.05g chromium (III) potassium sulphate (CrK(SO4)2)) superfrost slides
(Menzel Gläser, Lomb Scientific Pty LTD). The slides were kept in -20°C before being
used for IHC.
2.13 Immunohistochemistry
Fish were terminally anaesthetised with [0.6%] MS222 and perfused transcardially with
saline followed by 4% paraformaldehyde. Eyes and brains were dissected, wherever
possible preserving the ON intact, and post-fixed in 4% paraformaldehyde overnight at
40C. Gross dissections were made the following day and finer dissections made over
the subsequent week. After 1 week storage at 40C in 4% PFA the brains, eyes and ONs
were transferred to 30% sucrose in phosphate buffered saline (PBS, pH 7.2) and stored
at 40C for minimum 24 hrs, in order to cryoprotect them prior to cryosectioning. Tissue
was embedded in tissue-tek medium for sectioning. Brains were sectioned horizontally
at 14 um to visualize the rostro-caudal tectal axis. ON were sectioned horizontally at 14
um. Slides were left to air dry on a heating block set to 400C and then initially stored at -
200C, and subsequently moved to storage at -800C. Prior to use, sections were removed
from -80o C and air-dried for 1-2 hours at room temperature.
Two different inmmunohistochemical approaches were used in an effort to reduce the
levels of background staining and auto-fluorescence. For nerves, a fluorescent
secondary antibody was used to detect primary antibody (RT-97) staining. However,
due to high background in some of the tissue, a colorimetric method using horseradish
peroxidase and diaminobenzidine (DAB) was used for staining the brains as this method
can increase sensitivity while retaining low background. Unfortunately, background

39
staining was also present in brain tissue (see results section). Both protocols are
described below.
For nerves, slides were washed for ~5min in 1x PBS in a glass container. They were
then dried and a hydrophobic pen used to surround the tissue sections so that
incubations could proceed directly on the slide. The tissue was permeablised in PBS-T
(0.2% Triton) for 10min to allow further reagents to infiltrate. A blocking solution
consisting of 10% NDS (normal donkey serum) in 0.1% BSA (bovine serum albumin)
in PBS-T was applied to the slides at room temperature in a humidified chamber for 2
hours to avoid non-specific binding of the antibody. Next, the first antibody (Table 10)
was diluted with blocking solution accordingly and then applied and incubated
overnight at 4°C in a humidified chamber. Following the incubation the tissue was
washed 3x in 1x PBS for 5-10min and the appropriate alexa-fluor labeled second
antibody (1:600) as well as Hoechst (1:1500), for nuclei staining, were applied for 2
hours at room temperature. Afterwards the tissue was washed 3x in 1x PBS for 5-
10min, again. The slides were then air dried and mounted: ~80µl Fluoromount-G was
applied onto a 40mm coverslip at the side and spread whilst putting down the slide
slowly from one side to the other and avoiding any bubbles during this process. The
sections were examined under a Nikon Eclipse 80i fluorescence microscope.
For brains: Tissue was rehydrated in PBS containing 0.2% tritonX100 for 10 minutes;
endogenous peroxidases were inhibited by incubation with PBS containing 0.9% H2O2
for 10 minutes; sections were rinsed in PBS and incubated in blocking solution (10%
horse serum, 0.1% bovine serum albumin) for 2 hours in a humidified chamber at room
temperature. Brain sections were then incubated with RT-97 (1:200, in blocking soln.
mouse human, EMD Millipore) to reveal regenerating retinal ganglion cell axons,

40
overnight at 40C, in a humidified chamber. Antibody binding was visualized using a
biotin-streptavidin-HRP system (Vectastain ABC, Vector Laboratories) and a diamino-
benzidine (DAB)-metal complex (Thermo Scientific). Slides were rinsed in PBS,
dehydrated by increasing alcohol concentrations, cleared in xylene and mounted in
‘Entellen new’ (Merck Millipore) in preparation for microscopy. Control sections were
processed in the absence of primary antibody.
2.14 Measurement of regeneration
Sections of optic nerve (short term study only).
The absolute distance from the crush site to the farthest labelled axon, as well as the
distance from the chiasm to the farthest labelled axon were analysed. In addition, a
qualitative approach was used to rate the amount of regeneration: +++ - robust
regeneration, optic tract filled. ++ - sparse regeneration , optic tract half filled. + -
regeneration stopped at chiasm with only sparse axons in the tract. Due to the small
number of samples (2-3 per group due to the accidental damage or loss of the very small
nerve tissue in several of the experimental groups), statistical analysis was not
attempted on either of these methods.
Sections of brain (optic tectum: long term regeneration study only)
To chart the rate of axon regeneration the distance of the leading regenerating axons
from the tract/tectal border was measured in sections spanning the dorsal-ventral extent
of the tectum and expressed as a % of total tectal length (Fig. 5). As there was visible
(though lesser) staining in the control tectum, in cases where there was no staining
visible in either tectum the sections were not used for analysis. Analysis was undertaken
at a final magnification of 200x under white light. Images were taken at a final
magnification of 100x. The program ‘ImageJ’ (Abramoff, Magalhaes, & Ram, 2004)

41
was used to measure the total length of the tectum (Fig. 5), as well as determine the
length of regeneration (Fig. 2.5).
Figure 2.5. Schematic of measurements taken for extent of regeneration
The percentage regeneration for all sections on each side was averaged to determine the
‘slide regeneration’. Some fish were poorly perfused, resulting in tissue damage during
sectioning and poor immunostaining. These animals were not included in the analysis.
Values from all sections from a single animal were averaged to determine the
percentage axon regeneration per animal, and then averaged within each group. Final
animal numbers included in the analysis were as follows: for i-miR223 (n=5); for
scrambled (n=4); for crush/pierce control (n=5).

42
Chapter 3: Results
Results of the optimization of miR inhibitor injection are reported in the methods
section as these reflect technical aspects of the work. Data reporting the effect of i-miR
injection on RGC axonal regeneration are presented here.
The regeneration of RGC axons in zebrafish is characterised by the appearance of
regenerating axons at the lesion site 2 days post-injury, and extending into the optic
tract by 3-4 days post-injury (Becker & Becker, 2007). This is followed by further
growth into the optic tectum by about 7 days post-injury (Becker & Becker, 2007). In
this experiment, all control samples exhibited the expected timecourse of regeneration,
validating our approach.
3.1 Short term proof of principle study
The extent of regeneration was examined immunohistochemically at 3 days post-injury.
All fish showed regenerating RGC axons extending beyond the lesion site and into the
chiasm. The distance from the chiasm to the farthest regenerating axon appeared to be
lowest in the miR223 injected group (Fig. 3.1) but no statistical analysis could be
performed due to low numbers in the experimental groups.
43
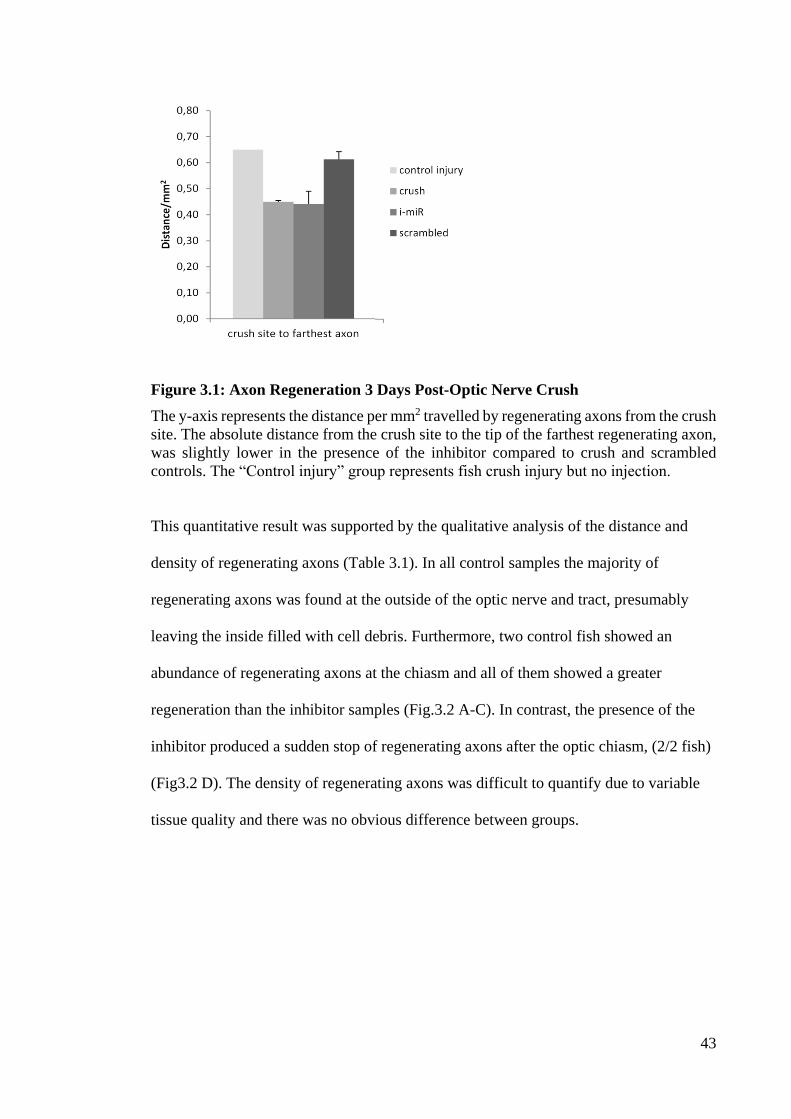
Figure 3.1: Axon Regeneration 3 Days Post-Optic Nerve Crush
The y-axis represents the distance per mm2 travelled by regenerating axons from the crush
site. The absolute distance from the crush site to the tip of the farthest regenerating axon,
was slightly lower in the presence of the inhibitor compared to crush and scrambled
controls. The “Control injury” group represents fish crush injury but no injection.
This quantitative result was supported by the qualitative analysis of the distance and
density of regenerating axons (Table 3.1). In all control samples the majority of
regenerating axons was found at the outside of the optic nerve and tract, presumably
leaving the inside filled with cell debris. Furthermore, two control fish showed an
abundance of regenerating axons at the chiasm and all of them showed a greater
regeneration than the inhibitor samples (Fig.3.2 A-C). In contrast, the presence of the
inhibitor produced a sudden stop of regenerating axons after the optic chiasm, (2/2 fish)
(Fig3.2 D). The density of regenerating axons was difficult to quantify due to variable
tissue quality and there was no obvious difference between groups.
44
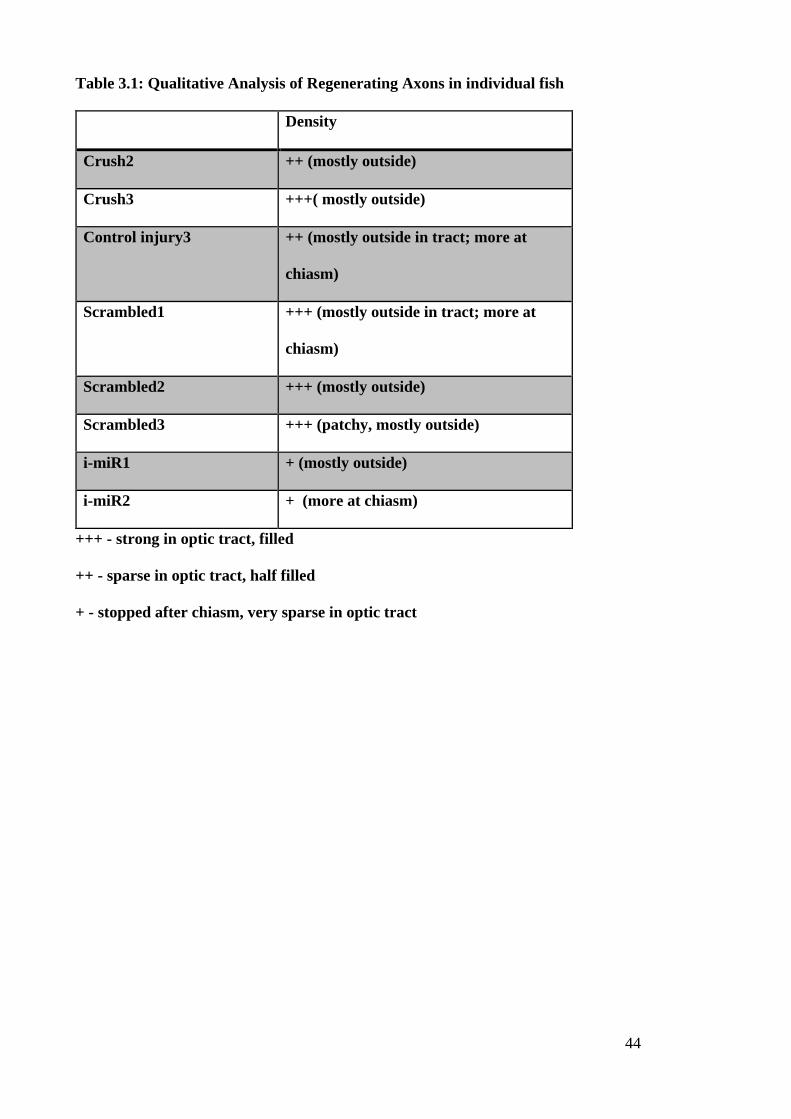
Table 3.1: Qualitative Analysis of Regenerating Axons in individual fish
Density
Crush2 ++ (mostly outside)
Crush3 +++( mostly outside)
Control injury3 ++ (mostly outside in tract; more at
chiasm)
Scrambled1 +++ (mostly outside in tract; more at
chiasm)
Scrambled2 +++ (mostly outside)
Scrambled3 +++ (patchy, mostly outside)
i-miR1 + (mostly outside)
i-miR2 + (more at chiasm)
+++ - strong in optic tract, filled
++ - sparse in optic tract, half filled
+ - stopped after chiasm, very sparse in optic tract

45
Figure 3.2: Regenerating Axons in the optic nerve and tract 3 Days Post-Injury
The regenerating axons of the scrambled control (A) are very abundant beyond the
crush site (X) and at the chiasm (Ch) and reach into the optic tract (Ot). The control
injury (B), as well as the crush control (C) show the same distance for axon regeneration
as the scrambled control (A). However, the regenerating axons are less dense and the
majority of the axons are found the outside of the nerve. In presence of the inhibitor (D)
the regenerating axons make a sudden stop after the optic chiasm but maintain a high
density at the chiasm. Scale bar: 500 µm.
3.2 Long term regeneration study
The first cohort of 48 fish were processed for optic nerve crush, miR or control
injections and perfused and cryoprotected. However, due to a freezer breakdown in the
summer of 2015-2016, the tissue thawed and proved to be unusable for
immunohistochemical analysis. The experiment was repeated with a lower number of
animals due to limitations of time and resources and the data collected are shown below.
Some problems with tissue quality and high background staining in some fish again
meant that analysis was limited and interpretation must be carried out with caution.
Examples of histology are shown in Figure 3.3. In all groups, RGC axons had
.
X
Ch
Ot

46
regenerated to occupy roughly 25-30% of the optic tectum by 7 days post crush (Figure
3.4). ANOVA showed that there was no significant difference between groups (p=
0.058).
Figure 3.3 Histology showing extent of regeneration 7 days after crush
Immunohistochemistry showing the extent of optic nerve regeneration in zebrafish
following control (pierce crush; A), i-mir223 (B) or scrambled control (C). Axons have
entered the rostral tectum (shown by *) and extend roughly ¼ of the full tectal extent
(limit of regeneration identified under 40x magnification and indicated by an arrow).
Scale bar: 500 µm
Figure 3.4. Quantification of the extent of regeneration 7 days after crush
There was no significant difference in the extent or distance of regeneration between
experimental groups. Groups: ‘crushpierce’: control, ‘i-miR’: targeted disruption of
miR-223, and ‘scrambled’: control for imiR-223 injection.
i-miR, n=5,
24.68%
scrambled, n=3,
23.60%
crushpierce,n=5,
28.70%
0.00%
5.00%
10.00%
15.00%
20.00%
25.00%
30.00%
35.00%
Pe
rce
nta
ge
te
ctu
m r
eg
en
era
ted
Regeneration of zebrafish tectum after ON crush
A B C
* * *
47
Chapter 4: Discussion
The aim of this experiment was to perform in vivo knockdown in the retina of the prime
candidate CNS-associated miRNA, miR-223, following an optic nerve rush in zebrafish,
in order to prevent optic nerve regeneration. Locked Nucleic Acid ‘anti-miRs’ can bind
to miRNA in vivo and cause its degradation, thus preventing their activity (Boon et al.,
2013). In this work we used an anti-miR targeted to suppress miR-223 in the eye after
an optic nerve crush in zebrafish. We first provided a proof of principle that injection of
a miR inhibitor reduced the levels of miR-223 and its target genes in the zebrafish
retina. Immediately following optic nerve crush we performed an injection of this ‘anti-
miR’; a ‘scramble anti-miR’ and mechanical equivalent intervention were used as
negative controls to assess the outcome on RGC axon regeneration.
These results indicate that knockdown of miR-223 alone is insufficient to change
regeneration in Danio rerio optic nerve injury. Possible reasons why experimental
groups did not show a clear different to the controls are discussed below.
4.1. An insufficient change in miRNA expression.
While the validation study did show a significant change in miRNA expression after
injection of the anti-miR, this was validated to only to 3 days post-injection, and the
data did indicate a trend at this time towards returning to pre-injection expression levels.
This could mean that while regeneration in the experiment was tracked for 1 week, the
miR-223 inhibition was only effective for the first half of that time. Further, it is
possible, given that miR-expression in general is known to be extremely dynamic and
variable over time, that the timepoints in which miR-223 most strongly regulates

48
regeneration of the optic nerve may not fall within the initial 3 days post-injury. This
could be addressed by using viral vectors to maintain sustained expression levels over
several weeks. AAV vectors have been proven to be an effective tool for overexpressing
and inhibiting miRNAs (Grobetal et al., 2014).
4.2 Insufficient change in gene expression.
It may be that the inhibition of ONLY miR-223 did not adequately upregulate its gene
targets. It was discovered on further research that the secondary target miRNA from the
dataset, miR-29b, in fact has some overlapping gene targets with miR-223. This would
suggest that in the suppression of miR-223 alone, miR-29b may provide ‘redundancy’
of gene regulation, downregulating expression of those same targets despite miR-223’s
lack of activity. This could be addressed by creating more experimental groups, in
which not only would miR-223 activity be suppressed in isolation, but also miR-29b in
isolation, and both miRNAs in combination. Before undertaking this, the predicted
targets of miR-29b would need to be experimentally validated (especially in the case of
those involved with cell survival and regeneration), and its knockdown in vivo
demonstrated.
4.3. Lack of accuracy in measuring regeneration, due to poor tissue quality.
The scope of this study was limited by the significant loss of an entire cohort of
experimental tissue at the end of my first year. Despite repeating the entire experiment,
my immunohistochemical analysis remained difficult to interpret with confidence due to
consistently high levels of background staining, regardless of the protocols and
detection methods we attempted, suggesting that tissue quality and problems with
histological processing caused significant technical limitations. In future, this could be

49
resolved by using a neuronal tracer to label regenerating RGCs without the need for
antibody detection. Preliminary studies in the lab after my experiments were completed
suggest that DiI (1,1’-dioctadecyl-3,3,3’,3’-tetramethylindocarbocyanine perchlorate)
injected into the eye can be used to label RGCs, and that this label can subsequently be
detected in the optic nerve, tract and tectum, although even using this method,
background auto-fluorescence levels remained high. Alternative mounting medias and
careful storage of tissue at constant temperature may further improve the quality of
histology.
4.4 Context and significance of my study
In humans, damage to the adult CNS has an extremely limited ability to regenerate
(Huebner & Strittmatter, 2009; Ramon & Cajal, 1928). CNS injury through insult or
disease is a leading cause of not only major human suffering, but of significant
economic impacts through the need for increased care, treatment and loss of ability to
work (Access-Economics, 2009; Findley, 2007). In the U.S.A. alone, 270 000 people
live with spinal cord injury (SCI) and ~12 000 new injuries are reported annually
(DeVivo, 2012; Thuret et al., 2006). It is therefore greatly important to carry out
research in discovering new therapeutic options to repair the damaged CNS.
This thesis builds on numerous findings within the field of CNS regeneration in
vertebrates. These have collectively demonstrated many examples of small, incremental
steps towards inducting successful regeneration of the central nervous system (Dietmar
Fischer, Peter Heiduschka, & Solon Thanos, 2001; Hellstrom & Harvey, 2011; Leaver
et al., 2006; Sindhu, Peter, Kathryn, & Bernard, 2011; Yin et al., 2003). While much of
the work to promote CNS regeneration in mammals has attempted to either mimic or

50
co-opt the mammalian peripheral nervous system’s regenerative ability and apply that to
the CNS, my thesis took an alternative approach by examining successful spontaneous
CNS regeneration in other vertebrates and applying those findings to mammals. While
the specific outcomes of this project were inconclusive, it has put in place the
framework for an improved study design which could more effectively investigate the
role of microRNA in CNS regeneration.
As briefly mentioned in the introduction, and as our primary rationale for a comparative
approach between vertebrate regeneration phenotypes, it may be that the variable
regeneration seen across phyla is in part the result of a causal relationship between
neurocomplexity and spontaneous neuroregenerative ability, whereby the increasingly
interrelated and subtle elements of a complex, fine-tuned and highly evolved CNS
inhibit its spontaneous regeneration after acquired injury, as a form of ‘evolutionary
collateral damage’. As seen in Figure 1, vertebrates which regenerate their CNS
completely (e.g. teleosts), mostly (e.g. amphibians) and those in which such
regeneration is extremely limited or abortive (e.g. mammals) lie along an increasing
trend line of neurocomplexity. This follows logically, as a more complex system would
be more challenging to regulate into a ‘regenerative state’ than a simpler one. This
could help explain why those vertebrates with simpler CNS makeups are better able to
spontaneously regenerate damage to them (Dunlop et al., 2004; Vajn, Plunkett,
Tapanes-Castillo, & Oudega, 2013).
But why would evolutionary pressures lead to a LOSS of spontaneous CNS
regeneration? One of the major determinants of the success of humans as a species is
our large, complex brain (Sherwood, Subiaul, & Zawidzki, 2008). The ability to enact
cognition at a high level thus provides a strong selector for evolutionary fitness and

51
reproductive advantage. This is true in terms of sexual selection, species survival (e.g.
through advanced language) and overall individual survival, though this latter may be
substantially less true in a globalised world (Arden et al., 2015; Miller, 2000; Sherwood
et al., 2008). Thus, our evolution has favoured increasing neurocomplexity. However,
given that natural selection only acts on traits which manifests prior to reproduction and
rearing of the young, and given that the ability to regenerate damage to the CNS would
only come into play in the case of rare injury or a later-in-life CNS disease, one can
surmise that the traits of spontaneous CNS repair are not strongly selected for. This may
well have led to its being lost in tandem with increasing vertebrate neurocomplexity.
This possibility further supports an investigation in miRNA as potentially inhibitory to
regeneration in mammals, as increasingly neurocomplex vertebrates have a much larger
complement of this regulatory element and they have been reported to have significant
effects in neural development (Bian & Sun, 2011; He & Hannon, 2004; Heimberg,
Sempere, Moy, Donoghue, & Peterson, 2008).
The pilot study conducted by Fuller-Carter et. al. (Fuller-Carter et al., 2015) using
microarray expression data from retina of zebrafish and rat at 3 days post ON crush
post-injury, identified a list of ‘top candidate’ miRNA (and their respective validated
gene targets) which could play a role in CNS regeneration. The analysis used
bioinformatics techniques to investigate gene ontology and networks, in combination
with the gene expression data indicating upregulated and downregulated genes during
regeneration. Thus, the study attempted to identify miRNA which could plausibly
influence known or suspected neuroregenerative processes and were differentially
expressed between these species. While several miRNA within zebrafish were identified
to be plausibly involved in regeneration; the top 2 candidates were miR-223 and miR-
29b.

52
miR-223 acts in the regulation of genes involved with inflammation, which has
been reported to both enhance and hinder the regenerative process (Haneklaus,
Gerlic, O'Neill, & Masters, 2013; Kyritsis et al., 2012; Wyss-Coray & Mucke,
2002). It has also been reported to inhibit calcium influx in neurons, which plays
a role both in regeneration and in prevention of cell death (Ferguson & Son,
2011; Harraz et al., 2012; Rehder, Jensen, & Kater, 1992).
miR-29b has been reported to prevent apoptosis and become activated during
neuronal maturation (Kole, Swahari, Hammond, & Deshmukh, 2011; Y. Zhang
et al., 2014). The miR-29 family directly targets at least 16 genes involved with
the extracellular matrix (reviewed in) (Fu, Zhou, Cheng, Liao, & Zhou). It is
also associated with neurodegenerative disease (reviewed in (Bicchi, Morena,
Montesano, Polidoro, & Martino, 2013; Villa et al., 2013).
miR-223 and miR-29b expression levels have been observed to be associated in
muscle tissue, suggesting that they may act synergistically (Kin et al., 2012).
This possibility is supported by evidence that these two miRNAs act together to
regulate cyclin T1 protein levels (Chiang, Sung, & Rice, 2012; Rottiers & Näär,
2012).
The functional characterisation of miRs through bioinformatics-based investigation is
by necessity a ‘best-guess’ with a number of challenges (Vlachos et al., 2015; Witkos,
Koscianska, & Krzyzosiak, 2011). This is in part due to the fact that there is no ‘gold
standard’ tool or collection of tools and that miRNA databases (particularly in
zebrafish) are substantially lacking in experimentally validated miRNA and targets (Cho
et al., 2005; Grimson et al., 2007). Even most validated miRs within a zebrafish dataset
have ‘predicted’ gene targets only (Cho et al., 2005; Grimson et al., 2007). This
necessitates further experimental validation on the part of a laboratory investigating the

53
potential effects of any specific miRNA. There are substantial limitations to using
alternate software tools/approaches and taking the ‘intersect’ of results (meaning that
only results which are indicated in both or multiple approaches are taken as ‘valid), as
this tends to vastly under-report likely miRNA and their gene targets (Tabas-Madrid,
Muniategui, Sánchez-Caballero, Martínez-Herrera, Sorzano, Rubio, & Pascual-
Montano, 2014). Further, using a ‘union’ methodology, in which two or more
approaches are used and results from both datasets are combined tends to vastly over-
report these results (Tabas-Madrid et al., 2014). However, there are workflows designed
to combat these limitations (Karbiener, Glantschnig, & Scheideler, 2014), and within
the context of this work we are reasonably confident in the predictions made.
A much more comprehensive approach than the use of microarrays would have been
complete miRNA sequencing from the tissue, however this is much more expensive
(Zhao, Fung-Leung, Bittner, Ngo, & Liu, 2014). This approach leads to unbiased
detection of novel transcripts (microarrays require species- and transcript-specific
probes in order to indicate their presence) as well as enhanced detection of genes,
transcripts and differential expression (Pritchard, Cheng, & Tewari, 2012) . It also
avoids issues of cross-hybridisation between probes and their limited detection range, as
well as those of probe redundancy and annotation (Zhao et al., 2014). Essentially,
microarrays tend to find examples of transcripts we are already aware of and miss those
which may be novel. RNA-Seq also provides for increased detection of rare and low-
abundance transcripts, though of course in this study a low-abundance transcript would
be unlikely to have a significant biological effect, and entirely novel transcripts would
be very difficult to justify investigating as their target genes would not be known and
therefore difficult if not impossible to quantify as likely/unlikely to influence
regeneration beyond simple changes in expression levels.

54
These microarray-derived results were somewhat confounded by using miRNA derived
from the whole eye, where this work focused on RGC axonal growth specifically.
However, RGCs represent less than 0.1% of all cells in the retina and changes in gene
expression within this population may be swamped if the whole retina is collected (this
may have contributed to the low number of differentially regulated genes we observed
in our pilot study; (Nadal-Nicolás et al., 2009). While it is possible to sort RGCs based
on the expression of cell surface markers, the lengthy process of antibody binding and
FACS or magnetic bead sorting is likely to induce changes in gene expression that are
irrelevant to the regenerative process we are examining. W/Prof Harvey developed a
physical isolation method in which the RGC layer is scraped from frozen retinal
sections and RNA extracted following standard procedures (LeVaillant et al., 2016).
Although this preparation still contains a mixed population (60% RGCs & 40%
amacrine cells in rats (Perry, 1981), similar numbers in fish (Zhang, Bonilla, Zhang, &
Leung, 2014), it represents a significant improvement over previous studies, which
extracted mRNA from the entire retina and included photoreceptors, interneurons, glial
cells and others.
There is an argument to be made for using whole-eye derived samples in the
experiment, as gene expression surrounding the axonal regeneration may well play a
part, such as inducing inflammation, which brings with it pro-regenerative factors such
as macrophage-derived oncomodulin (Yin et al., 2006). On the other hand, the close-
range nature of miRNA action would suggest that a more targeted approach would
result in identification of miRNA targets more likely to play a more direct and
significant role in RGC regeneration, and thus more likely to result in changed regrowth
after intervention. Another concern with this analysis is the small sample size, however
55
once more this was a cost-based compromise and difficult to avoid without significantly
more funding. Furthermore, the use of different techniques of analysis (both inverted
expression between regenerative and non-regenerative phenotypes and bioinformatics-
based predicted targets) resulted in several targets of high confidence, and the validation
of miR-223 action within the tissue post-selection alleviated any remaining concerns.
Overall, while these results are ultimately inconclusive, this work has paved the way for
a more rigorous repetition of the study, which could lead to validated method of
modulating regeneration-based gene expression in zebrafish and its extrapolation to
benefitting regeneration of the mammalian CNS.
Future directions
A key aspect of both miRs identified in the comparative bioinformatics analysis was
that both play a role in regulation of the immune response. My thesis primarily
investigated the effect of inhibiting miR223 on axonal regeneration per se, however, it
would also be of interest to examine whether miR223 affected the immune response
after optic nerve crush. As briefly outlined in the introduction, inflammation, as part of
the inducted immune response following CNS injury, appears in mammals to have a
complicated relationship with regeneration. A number of studies have reported that
localised inflammation can act to increase the regenerative properties of the CNS,
however there is an equally compelling body of evidence to suggest a negative impact
of inflammation on repair (Mietto, Mostacada, & Martinez, 2015). There are clear
differences between zebrafish and rats in terms of their inflammatory (and general
immune response) in the case of ON crush injury (Benowitz & Popovich, 2011; Filbin,
2006; Kyritsis, Kizil, & Brand, 2014; Kyritsis et al., 2012; Yin et al., 2009). In teleosts
like zebrafish, the RGCs do not die in large numbers, and those that do generally follow

56
the cell death path of apoptosis (McCurley & Callard, 2010). By contrast, mammalian
ON crush injuries result in large numbers of RGC death by both apoptosis and necrosis
(Berkelaar et al., 1994). Necrosis, in which the cell content leak out into the surrounding
areas, inducts significantly more inflammation, and the formation of glial scars, which
inhibit regeneration (Fawcett, Schwab, Montani, Brazda, & MÜller, 2012; Filbin,
2006). The immune response in the case of zebrafish is rapid and localised and may
promote regeneration (Kyritsis et al., 2012; Nona, 1998). In rats, the response is slower,
more generalised, and more extreme (Mietto et al., 2015). Ultimately, it may be that
miR-223 modulates regeneration indirectly by regulating and coordinating the immune
response. As shown by Jenny Ilgen’s work in her 2015 thesis (Ilgen, 2015), macrophage
and neutrophil recruitment to the vicinity of an optic nerve crush in zebrafish does
appear to be affected by this molecule. Given inflammation’s clear, though complex,
involvement in the regenerative process it may be only due to the limitations of this
study that a real effect by miR-223 suppression was dissipated by the 7 day timepoint.
My work has identified a number of improvements such a subsequent investigation
might make in order to explore the role of miR-223 (and miR-29b) in the future.
Chapter 5: References
Abramoff, M. D., Magalhaes, P. J., & Ram, S. J. (2004). Image Processing with ImageJ.
Biophotonics International, 11(7), 36-42.
Access-Economics. (2007). The Cost of Muscular Dystrophy. Retrieved from
Access-Economics. (2009). The economic cost of spinal cord injury and traumatic
brain injury in Australia Retrieved from Victoria:

57
Agudo, M., Perez-Marin, M., Lonngren, U., Sobrado, P., Conesa, A., Canovas, I., . . .
Vidal-Sanz, M. (2008). Time course profiling of the retinal transcriptome after optic
nerve transection and optic nerve crush. Molecular Vision, 14, 1050-1063.
Ahituv, N., Rubin, E. M., & Nobrega, M. A. (2004). Exploiting human–fish genome
comparisons for deciphering gene regulation. Human Molecular Genetics, 13(suppl 2),
R261-R266. doi:10.1093/hmg/ddh229
Aigner, L., Arber, S., Kapfhammer, J. P., Laux, T., Schneider, C., Botteri, F., . . .
Caroni, P. (1995). Overexpression of the neural growth-associated protein GAP-43
induces nerve sprouting in the adult nervous system of transgenic mice. Cell, 83(2),
269-278. doi:10.1016/0092-8674(95)90168-X
Almeida, M. I., Reis, R. M., & Calin, G. A. (2011). MicroRNA history: Discovery,
recent applications, and next frontiers. Mutation Research/Fundamental and
Molecular Mechanisms of Mutagenesis, 717(1–2), 1-8.
doi:http://dx.doi.org/10.1016/j.mrfmmm.2011.03.009
Arden, R., Luciano, M., Deary, I. J., Reynolds, C. A., Pedersen, N. L., Plassman, B. L., .
. . Visscher, P. M. (2015). The association between intelligence and lifespan is mostly
genetic. International Journal of Epidemiology. doi:10.1093/ije/dyv112
Banister, J., Bloom, D. E., & Rosenberg, L. (2010). Population Aging and Economic
Growth in China. Program on the global demography of aging. Working Paper Series,
Harvard, Massachusetts.
Beazley, L. D., & Dunlop, S. A. (2000). Evolutionary hierarchy of optic nerve
regeneration: Implications for cell survival, axon outgrowth and map formation
Degeneration and Regeneration in the Nervous System. Singapore: Harwood
Academic Press.

58
Becker, C. G., & Becker, T. (2007). Growth and pathfinding of regenerating axons in
the optic projection of adult fish. Journal of Neuroscience Research, 85(12), 2793-
2799. doi:10.1002/jnr.21121
Becker, T., Wullimann, M. F., Becker, C. G., Bernhardt, R. R., & Schachner, M. (1997).
Axonal regrowth after spinal cord transection in adult zebrafish. The Journal of
Comparative Neurology, 377(4), 577-595. doi:10.1002/(SICI)1096-
9861(19970127)377:4<577::AID-CNE8>3.0.CO;2-#
Benowitz, L. I., & Popovich, P. G. (2011). Inflammation and axon regeneration.
Current Opinion in Neurology, 24(6), 577-583
510.1097/WCO.1090b1013e32834c32208d.
Benowitz, L. I., & Yin, Y. (2007). Combinatorial treatments for promoting axon
regeneration in the CNS: Strategies for overcoming inhibitory signals and activating
neurons' intrinsic growth state. Developmental Neurobiology, 67(9), 1148-1165.
doi:10.1002/dneu.20515
Berezikov, E. (2011). Evolution of microRNA diversity and regulation in animals. Nat
Rev Genet, 12(12), 846-860.
Berkelaar, M., Clarke, D. B., Wang, Y.-C., Bray, G. M., & Aguayo, A. J. (1994).
Axotomy Results in Delayed Death and Apoptosis of Retinal Ganglion Cells in Adult
Rats. The Journal of Neuroscience, 14(7), 4368 - 4374.
Berry, M., Ahmed, Z., Lorber, B., Douglas, M., & Logan, A. (2008). Regeneration of
axons in the visual system. Restor Neurol Neurosci, 26(2-3), 147-174.
Bian, S., & Sun, T. (2011). Functions of Noncoding RNAs in Neural Development and
Neurological Diseases. Molecular Neurobiology, 44(3), 359-373. doi:10.1007/s12035-
011-8211-3
Bicchi, I., Morena, F., Montesano, S., Polidoro, M., & Martino, S. (2013). MicroRNAs
and Molecular Mechanisms of Neurodegeneration. Genes, 4, 244-263.

59
Bird, A. P. (1995). Gene number, noise reduction and biological complexity. Trends in
Genetics, 11(3), 94-100. doi:http://dx.doi.org/10.1016/S0168-9525(00)89009-5
Blackmore, M. G. (2012). Molecular Control of Axon Growth. In J. L. Goldberg & E.
F. Trakhtenberg (Eds.), Axon growth and regeneration. Amsterdam: Elsevier.
Blaugrund, E., Duvdevani, R., Lavie, V., Solomon, A., & Schwartz, M. (1992).
Disappearance of astrocytes and invasion of macrophages following crush injury of
adult rodent optic nerves: Implications for regeneration. Experimental Neurology,
118(1), 105-115. doi:http://dx.doi.org/10.1016/0014-4886(92)90027-N
Bomze, H. M., Bulsara, K. R., Iskandar, B. J., Caroni, P., & Pate Skene, J. H. (2001).
Spinal axon regeneration evoked by replacing two growth cone proteins in adult
neurons. Nat Neurosci, 4(1), 38-43.
Boon, R. A., Iekushi, K., Lechner, S., Seeger, T., Fischer, A., Heydt, S., . . . Dimmeler,
S. (2013). MicroRNA-34a regulates cardiac ageing and function. Nature, 495(7439),
107-110.
doi:http://www.nature.com/nature/journal/v495/n7439/abs/nature11919.html#supplem
entary-information
Botstein, D., & Risch, N. (2003). Discovering genotypes underlying human phenotypes:
past successes for mendelian disease, future approaches for complex disease. Nat
Genet, 33, 228-237.
Bramlett, H. M., & Dietrich, W. D. (2004). Pathophysiology of cerebral ischemia and
brain trauma: Similarities and differences. J Cereb Blood Flow Metab, 24(2), 133-150.
Brown, R. C., Lockwood, A. H., & Sonawane, B. R. (2005). Neurodegenerative
Diseases: An Overview of Environmental Risk Factors. Environmental Health
Perspectives, 113(9), 1250-1256. doi:10.1289/ehp.7567

60
Carroll, S. B. (2008). Evo-Devo and an Expanding Evolutionary Synthesis: A Genetic
Theory of Morphological Evolution. Cell, 134(1), 25-36.
doi:10.1016/j.cell.2008.06.030
Chan, E., Quon, G., Chua, G., Babak, T., Trochesset, M., Zirngibl, R., . . . Hughes, T.
(2009). Conservation of core gene expression in vertebrate tissues. Journal of Biology,
8(3), 33.
Chen, K., & Rajewsky, N. (2007). The evolution of gene regulation by transcription
factors and microRNAs. Nat Rev Genet, 8(2), 93-103.
doi:http://www.nature.com/nrg/journal/v8/n2/suppinfo/nrg1990_S1.html
Chiang, K., Sung, T.-L., & Rice, A. P. (2012). Regulation of Cyclin T1 and HIV-1
Replication by MicroRNAs in Resting CD4+ T Lymphocytes. Journal of Virology,
86(6), 3244-3252. doi:10.1128/jvi.05065-11
Chiu, H., Alqadah, A., & Chang, C. (2014). The role of microRNAs in regulating
axonal connectivity. Frontiers in Cellular Neuroscience, 7.
doi:10.3389/fncel.2013.00283
Cho, K.-S., Yang, L., Lu, B., Ma, H. F., Huang, X., Pekny, M., & Chen, D. F. (2005).
Re-establishing the regenerative potential of central nervous system axons in postnatal
mice. Journal of cell science, 118(Pt 5), 863-872. doi:10.1242/jcs.01658
Control, N. C. f. I. P. a. (2001). Injury Fact Book 2001–2002. Atlanta, GA: Centers for
Disease Control and Prevention.
Corrada, D., Viti, F., Merelli, I., Battaglia, C., & Milanesi, L. (2011). myMIR: a
genome-wide microRNA targets identification and annotation tool. Briefings in
bioinformatics, 12, 588-600. doi:10.1093/bib/bbr062
Dannemann, M., Prüfer, K., Lizano, E., Nickel, B., Burbano, H. A., & Kelso, J. (2012).
Transcription Factors Are Targeted by Differentially Expressed miRNAs in Primates.
Genome Biology and Evolution, 4(4), 552-564. doi:10.1093/gbe/evs033

61
DeVivo, M. J. (2012). Epidemiology of traumatic spinal cord injury: trends and future
implications. Spinal Cord, 50(5), 365-372.
Disability in Australia: acquired brain injury. (2007).
Dunlop, S. A., Harvey, A. R., Beazley, L. D., Tee, L. B. G., Stirling, R. V., Taylor, A.
L., . . . Roberts, J. D. (2004). Failure to restore vision after optic nerve regeneration in
reptiles: interspecies variation in response to axotomy. Journal of Comparative
Neurology, 478(3), 292-305.
Erdogan, B., Ebbert, P. T., & Lowery, L. A. (2016). Using Xenopus laevis retinal and
spinal neurons to study mechanisms of axon guidance in vivo and in vitro. Seminars in
Cell & Developmental Biology, 51, 64-72.
doi:http://dx.doi.org/10.1016/j.semcdb.2016.02.003
Fadool, J. M., & Dowling, J. E. (2008). Zebrafish: A model system for the study of eye
genetics. Progress in Retinal and Eye Research, 27, 89-110.
Fahrback, S. E. (2013). Developmental Neuroscience: a concise introduction. United
States of American: Princeton University Press.
Fawcett, J. W., Schwab, M. E., Montani, L., Brazda, N., & MÜller, H. W. (2012).
Chapter 31 - Defeating inhibition of regeneration by scar and myelin components. In
V. Joost & W. M. John (Eds.), Handbook of Clinical Neurology (Vol. Volume 109,
pp. 503-522): Elsevier.
Feigin, V. L. (2005). Stroke epidemiology in the developing world. The Lancet,
365(9478), 2160-2161. doi:http://dx.doi.org/10.1016/S0140-6736(05)66755-4
Ferguson, T. A., & Son, Y.-J. (2011). Extrinsic and intrinsic determinants of nerve
regeneration. Journal of Tissue Engineering, 2(1). doi:10.1177/2041731411418392
Filbin, M. T. (2006). How inflammation promotes regeneration. Nat Neurosci, 9(6),
715-717.

62
Findley, L. J. (2007). The economic impact of Parkinson's disease. Parkinsonism &
Related Disorders, 13, Supplement(0), S8-S12.
doi:http://dx.doi.org/10.1016/j.parkreldis.2007.06.003
Fischer, D., Heiduschka, P., & Thanos, S. (2001). Lens-Injury-Stimulated Axonal
Regeneration throughout the Optic Pathway of Adult Rats. Experimental Neurology,
172(2), 257-272. doi:http://dx.doi.org/10.1006/exnr.2001.7822
Fischer, D., Heiduschka, P., & Thanos, S. (2001). Lens-injury-stimulated axonal
regeneration throughout the optic pathways of adult rats. Experimental Neurology,
172, 257-272.
Fischer, D., Pavlidis, M., & Thanos, S. (2000). Cataractogenic lens injury prevents
traumatic ganglion cell death and promotes axonal regeneration both in vivo and in
culture. Invest Opthalmol Vis Sci, 41, 3943-3954.
Fischer, D., Petkova, V., Thanos, S., & Benowitz, L. I. (2004). Switching mature retinal
ganglion cells to a robust growth state in vivo: gene expression and synergy with
RhoA inactivation. The Journal of Neuroscience, 24(40), 8726-8740.
Fischer, S., Handrick, R., Aschrafi, A., & Otte, K. (2015). Unveiling the principle of
microRNA-mediated redundancy in cellular pathway regulation. RNA Biology, 12(3),
238-247. doi:10.1080/15476286.2015.1017238
Fritzsch, B., Jahan, I., Pan, N., & Elliott, K. L. (2015). Evolving gene regulatory
networks into cellular networks guiding adaptive behavior: an outline how single cells
could have evolved into a centralized neurosensory system. Cell Tissue Res, 359(1),
295-313. doi:10.1007/s00441-014-2043-1
Fu, X.-m., Zhou, Y.-z., Cheng, Z., Liao, X.-b., & Zhou, X.-m. (2014). MicroRNAs:
Novel Players in Aortic Aneurysm. BioMed Research International.
Fuller-Carter, P. I., Carter, K. W., Anderson, D., Harvey, A. R., Giles, K. M., & Rodger,
J. (2015). Integrated analyses of zebrafish miRNA and mRNA expression profiles

63
identify miR-29b and miR-223 as potential regulators of optic nerve regeneration.
BMC Genomics, 16(1), 591. doi:10.1186/s12864-015-1772-1
Gao, H., Zhang, H. L., Shou, J., Chen, L., Shen, Y., Tang, Q., . . . Zhu, J. (2012).
Towards retinal ganglion cell regeneration. Regenerative Medicine, 7(6), 865-875.
Gibbs, R. A., Weinstock, G. M., Metzker, M. L., Muzny, D. M., Sodergren, E. J.,
Scherer, S., . . . Rat Genome Sequencing Project, C. (2004). Genome sequence of the
Brown Norway rat yields insights into mammalian evolution. Nature, 428(6982), 493-
521. doi:10.1038/nature02426
Glass, C. K., Saijo, K., Winner, B., Marchetto, M. C., & Gage, F. H. (2010).
Mechanisms Underlying Inflammation in Neurodegeneration. Cell, 140(6), 918-934.
doi:http://dx.doi.org/10.1016/j.cell.2010.02.016
Goldberg, J. L., Klassen, M. P., Hua, Y., & Barres, B. A. (2002). Amacrine-Signaled
Loss of Intrinsic Axon Growth Ability by Retinal Ganglion Cells. Science, 296(5574),
1860-1864. doi:10.1126/science.1068428
Gregory, T. R. (2005). The C-value Enigma in Plants and Animals: A Review of
Parallels and an Appeal for Partnership. Annals of Botany, 95(1), 133-146.
doi:10.1093/aob/mci009
Grimson, A., Farh, K. K.-H., Johnston, W. K., Garrett-Engele, P., Lim, L. P., & Bartel,
D. P. (2007). MicroRNA Targeting Specificity in Mammals: Determinants beyond
Seed Pairing. Molecular Cell, 27(1), 91-105. doi:10.1016/j.molcel.2007.06.017
Grobetal, T., Hammer, E., Bien-Moller, S., Geisler, A., Pinkert, S., Roger, C., . . .
Fechner, H. (2014). A novel artificial microRNA expressing AAV vector for
phospholamban silencing in cardiomyocytes improves Ca2+ uptake into the
sarcoplasmic reticulum. PLoS ONE, 9(3), e92188. doi:10.1371/journal.pone.0092188
PONE-D-13-37673 [pii]

64
Haneklaus, M., Gerlic, M., O'Neill, L. A. J., & Masters, S. L. (2013). miR-223:
infection, inflammation and cancer. Journal of Internal Medicine, 274(3), 215-226.
doi:10.1111/joim.12099
Harel, R., Iannotti, C. A., Hoh, D., Clark, M., Silver, J., & Steinmetz, M. P. (2012).
Oncomodulin affords limited regeneration to injured sensory axons in vitro and in
vivo. Experimental Neurology, 233, 708-716.
Harraz, M. M., Eacker, S. M., Wang, X., Dawson, T. M., & Dawson, V. L. (2012).
MicroRNA-223 is neuroprotective by targeting glutamate receptors. Proceedings of
the National Academy of Sciences, 109(46), 18962-18967.
doi:10.1073/pnas.1121288109
Harvey, A. R., Hu, Y., Leaver, S. G., Mellough, C. B., Park, K., Verhaagen, J., . . . Cui,
Q. (2006). Gene therapy and transplantation in CNS repair: the visual system. Prog
Retin Eye Res, 25(5), 449-489.
Harvey, A. R., Ooi, J. W. W., & Rodger, J. (2012). Neurotrophic Factors and the
Regeneration of Adult Retinal Ganglion Cell Axons. In L. G. Jeffrey & F. T. Ephraim
(Eds.), International Review of Neurobiology (Vol. Volume 106, pp. 1-33): Academic
Press.
He, L., & Hannon, G. J. (2004). MicroRNAs: small RNAs with a big role in gene
regulation. Nature Reviews: Genetics, 5, 522-532.
Heimberg, A. M., Sempere, L. F., Moy, V. N., Donoghue, P. C. J., & Peterson, K. J.
(2008). MicroRNAs and the advent of vertebrate morphological complexity.
Proceedings of the National Academy of Sciences, 105(8), 2946-2950.
doi:10.1073/pnas.0712259105
Hellstrom, M., & Harvey, A. R. (2011). Retinal ganglion cell gene therapy and visual
system repair. Current Gene Therapy, 11(2), 116-131.

65
Hellström, M., & Harvey, A. R. (2014). Cyclic AMP and the regeneration of retinal
ganglion cell axons. The International Journal of Biochemistry & Cell Biology(0).
doi:http://dx.doi.org/10.1016/j.biocel.2014.04.018
Hinson, H. E., Rowell, S., & Schreiber, M. (2015). Clinical evidence of inflammation
driving secondary brain injury: A systematic review. The journal of trauma and acute
care surgery, 78(1), 184-191. doi:10.1097/TA.0000000000000468
Hocquemiller, M., Vitry, S., Bigou, S., Bruyère, J., Ausseil, J., & Heard, J. M. (2010).
GAP43 overexpression and enhanced neurite outgrowth in mucopolysaccharidosis
type IIIB cortical neuron cultures. Journal of Neuroscience Research, 88(1), 202-213.
doi:10.1002/jnr.22190
Howe, D. G., Bradford, Y. M., Conlin, T., Eagle, A. E., Fashena, D., Frazer, K., . . .
Westerfield, M. (2013). ZFIN, the Zebrafish Model Organism Database: increased
support for mutants and transgenics. Nucleic Acids Research, 41(D1), D854-D860.
doi:10.1093/nar/gks938
Howe, K., Clark, M. D., Torroja, C. F., Torrance, J., Berthelot, C., Muffato, M., . . .
Stemple, D. L. (2013). The zebrafish reference genome sequence and its relationship
to the human genome. Nature, 496(7446), 498-503. doi:10.1038/nature12111
http://www.nature.com/nature/journal/v496/n7446/abs/nature12111.html#supplementar
y-information
Huebner, E. A., & Strittmatter, S. M. (2009). Axon Regeneration in the Peripheral and
Central Nervous Systems. Results Probl Cell Differ., 48, 339-351.
Hui, S. P., Sengupta, D., Lee, S. G. P., Sen, T., Kundu, S., Mathavan, S., & Ghosh, S.
(2014). Genome Wide Expression Profiling during Spinal Cord Regeneration
Identifies Comprehensive Cellular Responses in Zebrafish. PLoS ONE, 9(1), e84212.
doi:10.1371/journal.pone.0084212

66
Iannaccone, P. M., & Jacob, H. J. (2009). Rats! Disease Models &amp;
Mechanisms, 2(5-6), 206.
Ilgen, J. (2015). The Effect of miR-223 in Optic Nerve Regeneration in Zebrafish.
(Masters), University of Western Australia, Perth.
Izumi, B., Nakasa, T., Tanaka, N., Nakanishi, K., Kamei, N., Yamamoto, R., . . . Ochi,
M. (2011). MicroRNA-223 expression in neutrophils in the early phase of secondary
damage after spinal cord injury. Neuroscience Letters, 492(2), 114-118.
doi:http://dx.doi.org/10.1016/j.neulet.2011.01.068
Javouhey, E., Guérin, A.-C., & Chiron, M. (2006). Incidence and risk factors of severe
traumatic brain injury resulting from road accidents: A population-based study.
Accident Analysis & Prevention, 38(2), 225-233.
doi:http://dx.doi.org/10.1016/j.aap.2005.08.001
Jiao, J., Huang, X., Feit-Leithman, R. A., Neve, R. L., Snider, W., Dartt, D. A., & Chen,
D. F. (2005). Bcl-2 enhances Ca(2+) signaling to support the intrinsic regenerative
capacity of CNS axons. The EMBO Journal, 24(5), 1068-1078.
doi:10.1038/sj.emboj.7600589
Jin, Y., Fischer, I., Tessler, A., & Houle, J. D. (2002). Transplants of Fibroblasts
Genetically Modified to Express BDNF Promote Axonal Regeneration from
Supraspinal Neurons Following Chronic Spinal Cord Injury. Experimental Neurology,
177(1), 265-275. doi:http://dx.doi.org/10.1006/exnr.2002.7980
Kaneda, M., Nagashima, M., Nunome, T., Muramatsu, T., Yamada, Y., Kubo, M., . . .
Kato, S. (2008). Changes of phospho-growth-associated protein 43 (phospho-GAP43)
in the zebrafish retina after optic nerve injury: A long-term observation. Neuroscience
Research, 61(3), 281-288. doi:http://dx.doi.org/10.1016/j.neures.2008.03.008
Karbiener, M., Glantschnig, C., & Scheideler, M. (2014). Hunting the Needle in the
Haystack: A Guide to Obtain Biologically Meaningful MicroRNA Targets.

67
International Journal of Molecular Sciences, 15(11), 20266-20289.
doi:10.3390/ijms151120266
Karl, M. O., & Reh, T. A. (2010). Regenerative medicine for retinal diseases: activating
endogenous repair mechanisms. Trends in Molecular Medicine, 16(4), 193-202.
doi:http://dx.doi.org/10.1016/j.molmed.2010.02.003
Kaslin, J., Ganz, J., & Brand, M. (2008). Proliferation, neurogenesis and regeneration in
the non-mammalian vertebrate brain. Philosophical Transactions of the Royal Society
B: Biological Sciences, 363(1489), 101-122. doi:10.1098/rstb.2006.2015
Kerr, J., Seorl, J., Harmon, B., & Bishop, C. (1987). Perspectives on Mammalian Cell
Death. Oxford and New York: Oxford Science Publications.
Khoo, E. H., & Kopan, R. (2004). Potential role of presenilin-regulated signaling
pathways in sporadic neurodegeneration. Nature Medicine, 10, S26-S33.
Kin, K., Miyagawa, S., Fukushima, S., Shirakawa, Y., Torikai, K., Shimamura, K., . . .
Sawa, Y. (2012). Tissue- and Plasma-Specific MicroRNA Signatures for
Atherosclerotic Abdominal Aortic Aneurysm. Journal of the American Heart
Association, 1(5). doi:10.1161/jaha.112.000745
Kole, A. J., Swahari, V., Hammond, S. M., & Deshmukh, M. (2011). miR-29b is
activated during neuronal maturation and targets BH3-only genes to restrict apoptosis.
Genes and development, 25, 125-130.
Krol, J., Loedige, I., & Filipowicz, W. (2010). The widespread regulation iof
microRNA biogenesis, function and decay. Nature Reviews Genetics, 11, 597-610.
Kurimoto, T., Yin, Y., Habboub, G., Gilbert, H., Li, Y., Nakao, S., . . . Benowitz, L.
(2013). Neutrophils express oncomodulin and promote optic nerve regeneration. The
Journal of Neuroscience, 33(37), 14816-14824.

68
Kyritsis, N., Kizil, C., & Brand, M. (2014). Neuroinflammation and central nervous
system regeneration in vertebrates. Trends in Cell Biology, 24(2), 128-135.
doi:10.1016/j.tcb.2013.08.004
Kyritsis, N., Kizil, C., Zocher, S., Kroehne, V., Kaslin, J., Freudenreich, D., . . . Brand,
M. (2012). Acute Inflammation Initiates the Regenerative Response in the Adult
Zebrafish Brain. Science, 338(6112), 1353-1356. doi:10.1126/science.1228773
Lamb, T. D., Collin, S. P., & Pugh, E. N. (2007). Evolution of the vertebrate eye:
opsins, photoreceptors, retina and eye cup. Nature reviews. Neuroscience, 8(12), 960-
976. doi:10.1038/nrn2283
Leaver, S. G., Cui, Q., Bernard, O., & Harvey, A. R. (2006). Cooperative effects of bcl-
2 and AAV-mediated expression of CNTF on retinal ganglion cell survival and axonal
regeneration in adult transgenic mice. European Journal of Neuroscience, 24(12),
3323-3332. doi:10.1111/j.1460-9568.2006.05230.x
Leon, S., Yin, Y., Nguyen, J., Irwin, N., & Benowitz, L. I. (2000). Lens injury
stimulates axon regeneration in the mature rat optic nerve. Journal of Neuroscience,
20, 4615-4626.
LeVaillant, C., Sharma, A., Muhling, J., Wheeler, L., Cozens, G., Hellström, M., . . .
Harvey, A. (2016). Significant changes in endogenous retinal gene expression one
year after a single intraocular injection of AAV-CNTF or AAV-BDNF. Molecular
Therapy - Methods & Clinical Development, submitted.
Li, Q., Yang, H., & Zhong, T. P. (2015). Regeneration across metazoan phylogeny:
lessons from model organisms. J Genet Genomics, 42(2), 57-70.
doi:10.1016/j.jgg.2014.12.002
Liu, B., Li, J., Tsykin, A., Liu, L., Gaur, A., & Goodall, G. (2009). Exploring complex
miRNA-mRNA interactions with Bayesian networks by splitting-averaging strategy.
BMC Bioinformatics, 10(1), 408.
69
Liverman, T. C., Altevogt, M. B., Joy, E. J., & Johnson, T. R. (2005). Spinal cord
injury: progress, promise, and priorities. Washington, D.C.: National Academy of
Sciences.
London, A., Cohen, M., & Schwartz, M. (2013). Microglia and monocyte-derived
macrophages: functionally distinct populations that act in concert in CNS plasticity
and repair. Front. Cell. Neurosci., 7, 34. doi:10.3389/fncel.2013.00034
Lu, P., & Tuszynski, M. H. (2008). Growth factors and combinatorial therapies for CNS
regeneration. Experimental Neurology, 209(2), 313-320.
Madathil, S. K., Nelson, P. T., Saatman, K. E., & Wilfred, B. R. (2011). MicroRNAs in
CNS injury: Potential roles and therapeutic implications. BioEssays, 33(1), 21-26.
doi:10.1002/bies.201000069
Mahony, S., Corcoran, D., Feingold, E., & Benos, P. (2007). Regulatory conservation of
protein coding and microRNA genes in vertebrates: lessons from the opossum
genome. Genome Biology, 8(5), R84.
Manakov, S. A., Grant, S. G. N., & Enright, A. J. (2009). Reciprocal regulation of
microRNA and mRNA profiles in neuronal development and synapse formation. BMC
Genomics, 10, 419.
Matsukawa, T., Arai, K., Koriyama, Y., Liu, Z., & Kato, S. (2004). Axonal regeneration
of fish optic nerve after injury. Biol. Pharm. Bull., 27(4), 445-451.
Mattick, J. S. (2011). The central role of RNA in human development and cognition.
FEBS Letters, 585(11), 1600-1616. doi:http://dx.doi.org/10.1016/j.febslet.2011.05.001
McCurley, A. T., & Callard, G. V. (2010). Time course analysis of gene expression
patterns in zebrafish eye during optic nerve regeneration. Journal of Experimental
Neuroscience, 2010(4), 17-33.
McLaughlin, T., & O'Leary, D. D. (2005). Molecular gradients and development of
retinotopic maps. Annu. Rev. Neurosci., 28, 327-355.

70
McNeill, E., & Van Vactor, D. (2012). MicroRNAs Shape the Neuronal Landscape.
Neuron, 75(3), 363-379. doi:http://dx.doi.org/10.1016/j.neuron.2012.07.005
Meyer, R. L., & Kageyama, G. H. (1999). Large-scale synaptic errors during map
formation by regenerating optic axons in the goldfish. The Journal of Comparative
Neurology, 409(2), 299-312. doi:10.1002/(SICI)1096-
9861(19990628)409:2<299::AID-CNE10>3.0.CO;2-C
Mietto, B. S., Mostacada, K., & Martinez, A. M. B. (2015). Neurotrauma and
Inflammation: CNS and PNS Responses. Mediators of Inflammation, 2015, 14.
doi:10.1155/2015/251204
Miller, G. (2000). Sexual selection for indicators of intelligence. Novartis Found
Symp.(233), 260-270.
Minami, K., Uehara, T., Morikawa, Y., Omura, K., Kanki, M., Horinouchi, A., . . .
Urushidani, T. (2014). miRNA expression atlas in male rat. Sci Data, 1, 140005.
doi:10.1038/sdata.2014.5
Morrow, L. (2014). Neuroeconomy; Economic Impact of Neurodegenerative Diseases
both in the US and Globally Labroots Webinars.
Munzel, E. J., Schaefer, K., Obirei, B., Kremmer, E., Burton, E. A., Kuscha, V., . . .
Becker, T. (2012). Claudin k is specifically expressed in cells that form myelin during
development of the nervous system and regeneration of the optic nerve in adult
zebrafish. Glia, 60(2), 253-270. doi:10.1002/glia.21260
Murray, M., & Edwards, M. A. (1982). A quantitative study of the reinnervation of the
goldfish optic tectum following optic nerve crush. The Journal of Comparative
Neurology, 209(4), 363-373. doi:10.1002/cne.902090406
Nadal-Nicolás, F. M., Jiménez-López, M., Sobrado-Calvo, P., Nieto-López, L.,
Cánovas-Martínez, I., Salinas-Navarro, M., . . . Agudo, M. (2009). Brn3a as a marker
of retinal ganglion cells: qualitative and quantitative time course studies in naive and

71
optic nerve-injured retinas. Invest Ophthalmol Vis Sci, 50(8), 3860-3868.
doi:10.1167/iovs.08-3267
Nona, S. N. (1998). Repair in goldfish central nervous system. Restorative Neurology
and Neuroscience, 12, 1-11.
Oyinbo, C. A. (2011). Secondary injury mechanisms in traumatic spinal cord injury: a
nugget of this multiply cascade. Acta Neurobiol Exp, 71, 281-299.
Panigrahi, D. N. (2014). Life Expectancy in India: Contributing Factors. International
Journal of Innovative Research & Development, 3(12).
Perry, V. H. (1981). Evidence for an amacrine cell system in the ganglion cell layer of
the rat retina. Neuroscience, 6(5), 931-944.
Perry, V. H., Brown, M. C., & Gordon, S. (1987). The Macrophage Response to Central
and Peripheral Nerve Injury. Retrieved from Oxford:
Pritchard, C. C., Cheng, H. H., & Tewari, M. (2012). MicroRNA profiling: approaches
and considerations. Nat Rev Genet, 13(5), 358-369.
doi:http://www.nature.com/nrg/journal/v13/n5/suppinfo/nrg3198_S1.html
Ramachandran, R., Reifler, A., Parent, J. M., & Goldman, D. (2010). Conditional gene
expression and lineage tracing of tuba1a expressing cells during zebrafish
development and retina regeneration. J Comp Neurol, 518(20), 4196-4212.
doi:10.1002/cne.22448
Ramon, & Cajal, S. (1928). Degeneration and regeneration of the nervous system (R.
M. May, Trans.). London: Oxford University Press.
Rehder, V., Jensen, J. R., & Kater, S. B. (1992). The initial stages of neural regeneration
are dependent upon intracellular calcium levels. Neuroscience, 51(3), 565-574.
doi:http://dx.doi.org/10.1016/0306-4522(92)90296-E

72
Reier, P. J., & de Webster, H. F. (1974). Regeneration and remyelination ofXenopus
tadpole optic nerve fibres following transection or crush. Journal of Neurocytology,
3(5), 591-618. doi:10.1007/BF01097626
Rita, P., & Robert, H. (2010). Perturbations of MicroRNA Function in Mouse Dicer
Mutants Produce Retinal Defects and Lead to Aberrant Axon Pathfinding at the Optic
Chiasm. PLoS ONE, 5(4). doi:10.1371/journal.pone.0010021
Rodger, J., Goto, H., Cui, Q., Chen, P. B., & Harvey, A. R. (2005). cAMP regulates
axon outgrowth and guidance during optic nerve regeneration in goldfish. Molecular
and Cellular Neuroscience, 30, 452-464.
Roser, M. (2015). Life Expectancy. Retrieved October 16, 2015, from
OurWorldInData.org http://ourworldindata.org/data/population-growth-vital-
statistics/life-expectancy/
Roshan, R., Ghosh, T., Scaria, V., & Pillai, B. (2009). MicroRNAs: novel therapeutic
targets in neurodegenerative diseases. Drug Discov Today, 14(23-24), 1123-1129.
doi:S1359-6446(09)00334-1 [pii]
10.1016/j.drudis.2009.09.009
Rottiers, V., & Näär, A. M. (2012). MicroRNAs in metabolism and metabolic disorders.
Nat Rev Mol Cell Biol, 13(4), 239-250.
Saba Sheikh, Safia, Ejazul Haque, & Mir, S. S. (2012). Neurodegenerative Diseases:
Multifactorial Conformational Diseases and Their Therapeutic Interventions. Journal
of Neurodegenerative Diseases, 2013. doi:10.1155/2013/563481
Sano, T., Reynolds, J. P., Jimenez-Mateos, E. M., Matsushima, S., Taki, W., &
Henshall, D. C. (2012). MicroRNA-34a upregulation during seizure-induced neuronal
death. Cell Death Dis, 3, e287.
doi:http://www.nature.com/cddis/journal/v3/n3/suppinfo/cddis201223s1.html

73
Schnell, L., Fearn, S., Klassen, H., Schwab, M. E., & Perry, V. H. (1999). Acute
inflammatory responses to mechanical lesions in the CNS: differences between brain
and spinal cord. European Journal of Neuroscience, 11(10), 3648-3658.
doi:10.1046/j.1460-9568.1999.00792.x
Schnell, L., & Schwab, M. E. (1993). Sprouting and Regeneration of Lesioned
Corticospinal Tract Fibres in the Adult Rat Spinal Cord. European Journal of
Neuroscience, 5(9), 1156-1171. doi:10.1111/j.1460-9568.1993.tb00970.x
Schratt, G. (2009). Fine-tuning neural gene expression with microRNAs. Curr Opin
Neurobiol, 19(2), 213-219. doi:S0959-4388(09)00056-7 [pii]
10.1016/j.conb.2009.05.015
Sherwood, C. C., Subiaul, F., & Zawidzki, T. W. (2008). A natural history of the human
mind: tracing evolutionary changes in brain and cognition. Journal of Anatomy,
212(4), 426-454. doi:10.1111/j.1469-7580.2008.00868.x
Sibley, C., & Wood, M. A. (2011). The miRNA pathway in neurological and skeletal
muscle disease: implications for pathogenesis and therapy. Journal of Molecular
Medicine, 89(11), 1065-1077. doi:10.1007/s00109-011-0781-z
Silver, J., & Miller, J. H. (2004). Regeneration beyond the glial scar. Nat Rev Neurosci,
5(2), 146-156.
Sindhu, K. M., Peter, T. N., Kathryn, E. S., & Bernard, R. W. (2011). MicroRNAs in
CNS injury: Potential roles and therapeutic implications. BioEssays, 33(1), 21-26.
doi:10.1002/bies.201000069
Skene, J. H. P. (1989). Axonal Growth-Associated Proteins. Annual Review of
Neuroscience, 12(1), 127-156. doi:doi:10.1146/annurev.ne.12.030189.001015
Stirling, D. P., Liu, S., Kubes, P., & Yong, V. W. (2009). Depletion of Ly6G/Gr-1
Leukocytes after Spinal Cord Injury in Mice Alters Wound Healing and Worsens
Neurological Outcome. The Journal of Neuroscience, 29(3), 753-764.

74
Sun, F., Park, K. K., Belin, S., Wang, D., Lu, T., Chen, G., . . . He, Z. (2011). Sustained
axon regeneration induced by co-deletion of PTEN and SOCS3. Nature, 480(7377),
372-375.
doi:http://www.nature.com/nature/journal/v480/n7377/abs/nature10594.html#supplem
entary-information
Sundermeier, T.R., Palczewski, K. (2016). The impact of microRNA gene regulation on
the survival and function of mature cell types in the eye. FASEB J. 30, 23. doi:
10.1096/fj.15-279745.
Tabas-Madrid, D., Muniategui, A., Sánchez-Caballero, I., Martínez-Herrera, D. J., S
Sorzano, C. O., Rubio, A., & Pascual-Montano, A. (2014). Improving miRNA-mRNA
interaction predictions. BMC Genomics, 15(Suppl 10), S2-S2. doi:10.1186/1471-2164-
15-s10-s2
Tamariz, E., & Varela-Echavarría, A. (2015). The discovery of the growth cone and its
influence on the study of axon guidance. Frontiers in Neuroanatomy, 9, 51.
doi:10.3389/fnana.2015.00051
Tedeschi, A. (2011). Tuning the Orchestra: Transcriptional Pathways Controlling Axon
Regeneration. Frontiers in Molecular Neuroscience, 4, 60.
doi:10.3389/fnmol.2011.00060
Thuret, S., Moon, L. D. F., & Gage, F. H. (2006). Therapeutic interventions after spinal
cord injury. Nat Rev Neurosci, 7(8), 628-643.
Tzourio, T., Rocca, W. A., Breteler, M. M., Baldereschi, M., Dartigues, J. F., Lopez-
Pousa, S., . . . Alperovitch, A. (1997). Smoking and Parkinson's disease: An age-
dependent risk effect? The EUROPARKINSON Study Group. Neurology, 49(5),
1267-1272.

75
Vajn, K., Plunkett, J., Tapanes-Castillo, A., & Oudega, M. (2013). Axonal regeneration
after spinal cord injury in zebrafish and mammals: differences, similarities, translation.
Neuroscience Bulletin, 29(4), 402-410. doi:10.1007/s12264-013-1361-8
van Rooij, E. (2011). The Art of MicroRNA Research. Circulation Research, 108(2),
219-234. doi:10.1161/circresaha.110.227496
Veldman, M. B., Bemben, M. A., Thompson, R. C., & Goldman, D. (2007). Gene
expression analysis of zebrafish retinal ganglion cells during optic nerve regeneration
identifies KLF6a and KLF7a as important regulators of axon regeneration.
Developmental Biology, 312(2), 596-612.
doi:http://dx.doi.org/10.1016/j.ydbio.2007.09.019
Villa, C., Ridolfi, E., Fenoglio, C., Ghezzi, L., Vimercati, R., Clerici, F., . . . Galimberti,
D. (2013). Expression of the transcription factor Sp1 and its regulatory hsa-miR-29b in
peripheral blood mononuclear cells from patients with Alzheimer's disease. J
Alzheimers Dis., 35(3), 487-494.
Villegas-Perez, M. P., Vidal-Sanz, M., Rasminsky, M., Bray, G. M., & Aguayo, A. J.
(1993). Rapid and protracted phases of retinal ganglion cell loss follow axotomy in the
optic nerve of adult rats. J. Neurobiol., 24(1), 23-26.
Vlachos, I. S., Zagganas, K., Paraskevopoulou, M. D., Georgakilas, G., Karagkouni, D.,
Vergoulis, T., . . . Hatzigeorgiou, A. G. (2015). DIANA-miRPath v3.0: deciphering
microRNA function with experimental support. Nucleic Acids Research.
doi:10.1093/nar/gkv403
Wang, K. C., Koprivica, V., Kim, J. A., Sivasankaran, R., Guo, Y., Neve, R. L., & He,
Z. (2002). Oligodendrocyte-myelin glycoprotein is a Nogo receptor ligand that inhibits
neurite outgrowth. Nature, 417(6892), 941-944. doi:10.1038/nature00867
Wang, Z., & Jin, Y. (2011). Genetic dissection of axon regeneration. Current Opinion in
Neurobiology, 21(1), 189-196. doi:http://dx.doi.org/10.1016/j.conb.2010.08.010

76
Watson, C., Paxinos, G., & Kayalioglu, G. (Eds.). (2009). The Spinal Cord: Elsevier
Ltd.
Weibel, D., Cadelli, D., & Schwab, M. E. (1994). Regeneration of lesioned rat optic
nerve fibers is improved after neutralization of myelin-associated neurite growth
inhibitors. Brain Res, 642(1-2), 259-266.
Witkos, T. M., Koscianska, E., & Krzyzosiak, W. J. (2011). Practical Aspects of
microRNA Target Prediction. Current Molecular Medicine, 11(2), 93-109.
doi:10.2174/156652411794859250
Wyndaele, M., & Wyndaele, J. J. (2006). Incidence, prevalence and epidemiology of
spinal cord injury: what learns a worldwide literature survey? Spinal Cord, 44(9), 523-
529.
Wyss-Coray, T., & Mucke, L. (2002). Inflammation in Neurodegenerative Disease—A
Double-Edged Sword. Neuron, 35(3), 419-432. doi:http://dx.doi.org/10.1016/S0896-
6273(02)00794-8
Xu, S. (2009). microRNA expression in the eyes and their significance in relation to
functions. Progress in Retinal and Eye Research, 28(2), 87-116.
doi:http://dx.doi.org/10.1016/j.preteyeres.2008.11.003
Yin, Y., Cui, Q., Gilbert, H.-y., Yang, Y., Yang, Z., Berlinicke, C., . . . Benowitz, L. I.
(2009). Oncomodulin links inflammation to optic nerve regeneration. Proceedings of
the National Academy of Sciences, 106(46), 19587-19592.
doi:10.1073/pnas.0907085106
Yin, Y., Cui, Q., Li, Y., Irwin, N., Fischer, D., Harvey, A. R., & benowitz, L. I. (2003).
Macrophage-derived factors stimulate optic nerve regeneration. The Journal of
Neuroscience, 23(6), 2284-2293.
Yin, Y., Henzl, M. T., Lorber, B., Nakazawa, T., Thomas, T. T., Jiang, F., . . .
Benowitz, L. I. (2006). Oncomodulin is a macrophage-derived signal for axon

77
regeneration in retinal ganglion cells. Nat Neurosci, 9(6), 843-852.
doi:http://www.nature.com/neuro/journal/v9/n6/suppinfo/nn1701_S1.html
Zhang, L., Bonilla, S., Zhang, Y., & Leung, Y. F. (2014). p35 promotes the
differentiation of amacrine cell subtype in the zebrafish retina under the regulation of
egr1. Dev Dyn, 243(2), 315-323. doi:10.1002/dvdy.24061
Zhang, Y., Huang, X.-R., Wei, L.-H., Chung, A. C. K., Yu, C.-M., & Lan, H.-Y. (2014).
miR-29b as a Therapeutic Agent for Angiotensin II-induced Cardiac Fibrosis by
Targeting TGF-[beta]/Smad3 signaling. Mol Ther, 22(5), 974-985.
doi:10.1038/mt.2014.25
Zhang, Z., Krebs, C. J., & Guth, L. (1997). Experimental Analysis of Progressive
Necrosis after Spinal Cord Trauma in the Rat: Etiological Role of the Inflammatory
Response. Experimental Neurology, 143(1), 141-152.
doi:http://dx.doi.org/10.1006/exnr.1996.6355
Zhao, S., Fung-Leung, W.-P., Bittner, A., Ngo, K., & Liu, X. (2014). Comparison of
RNA-Seq and Microarray in Transcriptome Profiling of Activated T Cells. PLoS ONE,
9(1), e78644. doi:10.1371/journal.pone.0078644
Zou, S., Tian, C., Ge, S., & Hu, B. (2013). Neurogenesis of Retinal Ganglion Cells Is
Not Essential to Visual Functional Recovery after Optic Nerve Injury in Adult
Zebrafish. PLoS ONE, 8(2), e57280. doi:10.1371/journal.pone.0057280
Zupanc, G. K. H., Clint, S. C., Takimoto, N., Hughes, A. T. L., Wellbrock, U. M., &
Meissner, D. (2003). Spatio-Temporal Distribution of Microglia/Macrophages during
Regeneration in the Cerebellum of Adult Teleost Fish, <i>Apteronotus
leptorhynchus:</i> A Quantitative Analysis. Brain, Behavior and Evolution, 62(1),
31-42.

78
Zupanc, G. K. H., & Sîrbulescu, R. F. (2011). Adult neurogenesis and neuronal
regeneration in the central nervous system of teleost fish. European Journal of
Neuroscience, 34(6), 917-929. doi:10.1111/j.1460-9568.2011.07854.x