The Role of Metrics in UX Strategy - · PDF fileUX Strategy Leveraging the Power of UX Data to...
20
Photo by David Paul Ohmer - Creative Commons Attribution License http://www.flickr.com/photos/50965924@N00 The Role of Metrics in UX Strategy Leveraging the Power of UX Data to Create Better Designs and Drive Innovation Bill Albert User Experience Center, Bentley University
Transcript of The Role of Metrics in UX Strategy - · PDF fileUX Strategy Leveraging the Power of UX Data to...

Photo by David Paul Ohmer - Creative Commons Attribution License http://www.flickr.com/photos/50965924@N00
The Role of Metrics in UX Strategy
Leveraging the Power of UX Data to Create Better Designs and Drive Innovation
Bill Albert User Experience Center, Bentley University

Photo by krossbow - Creative Commons Attribution License http://www.flickr.com/photos/13194817@N00 Created with Haiku Deck
How do we create great design?
How do we know it?

Qualitative Quantitative
Att
itu
des
B
ehav
iors
What is the problem and how
big is it?
Why is it a problem and how to fix it?
What are people doing?
What do people think?
UX Research Framework

Discovery Design Evaluate Validate
UX Process

Photo by cwbuecheler - Creative Commons Attribution License http://www.flickr.com/photos/46328592@N00 Created with Haiku Deck
Discovery

Personas
• Factor Analysis
• Cluster Analysis
• Quantitative Validation

Photo by sporras - Creative Commons Attribution-ShareAlike License http://www.flickr.com/photos/78696157@N00 Created with Haiku Deck
Competitive Benchmark
• UX wins (and losses)
• Insight into “why”
• Start design process efficiently
• Drive future design efforts

Design & Evaluation
Design and Evaluation

Tree Tests Tree Tests
• Measure intuitiveness of IA
• Success and Directness
• Compare IA’s

Photo by The Bees - Creative Commons Attribution-NonCommercial License http://www.flickr.com/photos/76236627@N00 Created with Haiku Deck
Measuring Preferences
• Comparing design treatments
• Terminology and content
• Importance of functionality
• Navigation choices
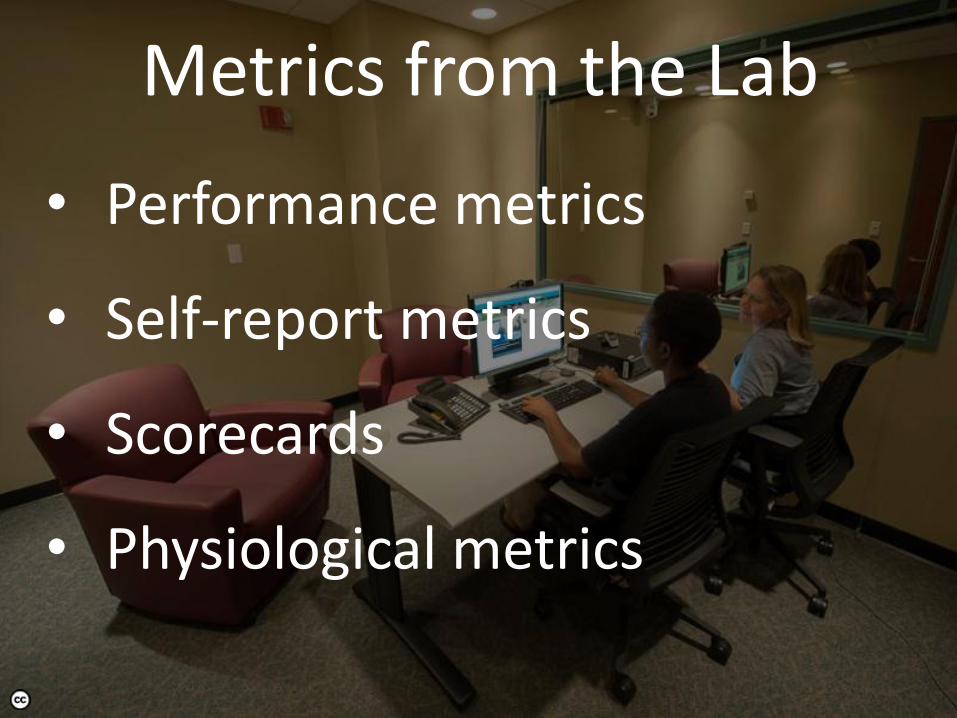
Metrics from the Lab
• Performance metrics
• Self-report metrics
• Scorecards
• Physiological metrics

Average Expectation and Experience Ratings
by Task
1
2
3
4
5
6
7
1 2 3 4 5 6 7
Average Expectation Rating
Avg
. E
xp
eri
en
ce R
ati
ng
Promote Don’t Touch It
Big Problems Opportunities
Difficult Easy
Dif
ficu
lt
Easy

Photo by El Scrapeo - Creative Commons Attribution-NonCommercial-ShareAlike License http://www.flickr.com/photos/76965000@N00 Created with Haiku Deck
Validation

Unmoderated UX
• Lots of people, quickly
• Tons of UX metrics
• Competitive landscape
• Predictor

Photo by Darren Krape - Creative Commons Attribution-NonCommercial License http://www.flickr.com/photos/13894404@N05 Created with Haiku Deck
Post-Launch Metrics
• Voice of Customer
• A/B or Multivariate Testing
• Analytics
• Social Networks

Tips
Moving Forward
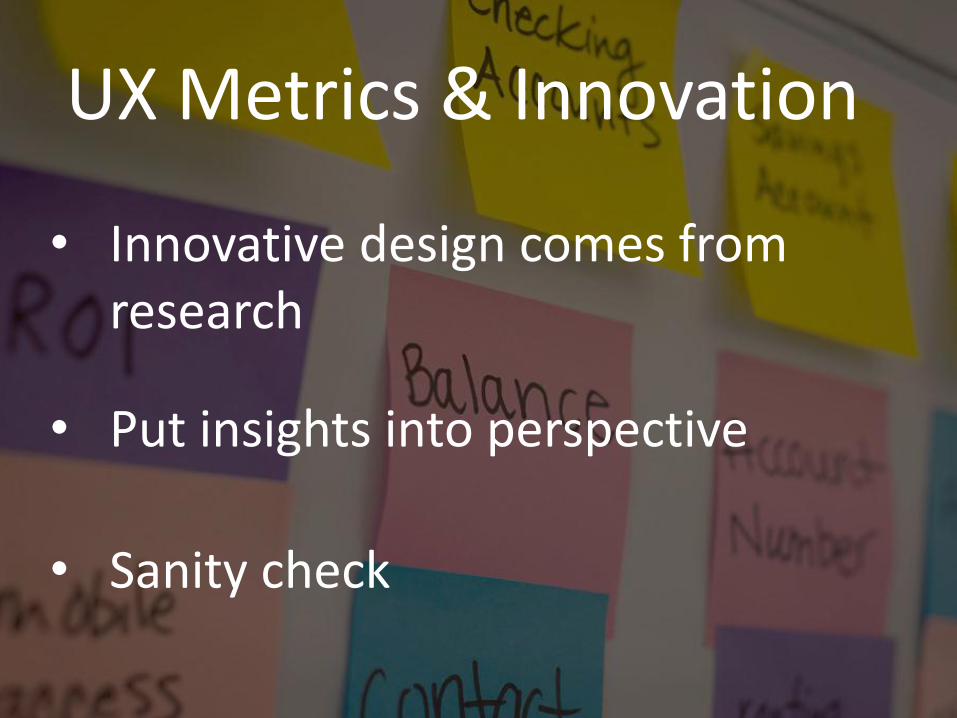
UX Metrics & Innovation
• Innovative design comes from research
• Put insights into perspective
• Sanity check

Myths / Excuses
• I already know the user
• Too expensive
• Too hard to measure
• Were moving too fast

Keys to Success
• Right metrics, right time
• Triangulation
• Numbers (confidence)
• Align with business goals
• Actionable results

Bill Albert User Experience Center, Bentley University
[email protected] www.bentley.edu/uxc
@UXMetrics | @BentleyUXC