The Role of Hypoxia in Air Pollutant-Induced ...
166
The Role of Hypoxia in Air Pollutant-Induced Cardiovascular Dysfunction Christina M. Perez A dissertation submitted to the faculty of the University of North Carolina at Chapel Hill in partial fulfillment of the requirements for the degree of Doctor of Philosophy in the Curriculum of Toxicology. Chapel Hill 2013 Approved by: Aimen K. Farraj, Ph.D. Daniel L. Costa, Sc.D. Ilona Jaspers, Ph.D. Kimryn Rathmell, M.D., Ph.D. Joan M. Taylor, Ph.D.
Transcript of The Role of Hypoxia in Air Pollutant-Induced ...

The Role of Hypoxia in Air Pollutant-Induced Cardiovascular Dysfunction
Christina M. Perez
A dissertation submitted to the faculty of the University of North Carolina at Chapel Hill in
partial fulfillment of the requirements for the degree of Doctor of Philosophy in the
Curriculum of Toxicology.
Chapel Hill
2013
Approved by:
Aimen K. Farraj, Ph.D.
Daniel L. Costa, Sc.D.
Ilona Jaspers, Ph.D.
Kimryn Rathmell, M.D., Ph.D.
Joan M. Taylor, Ph.D.
ii
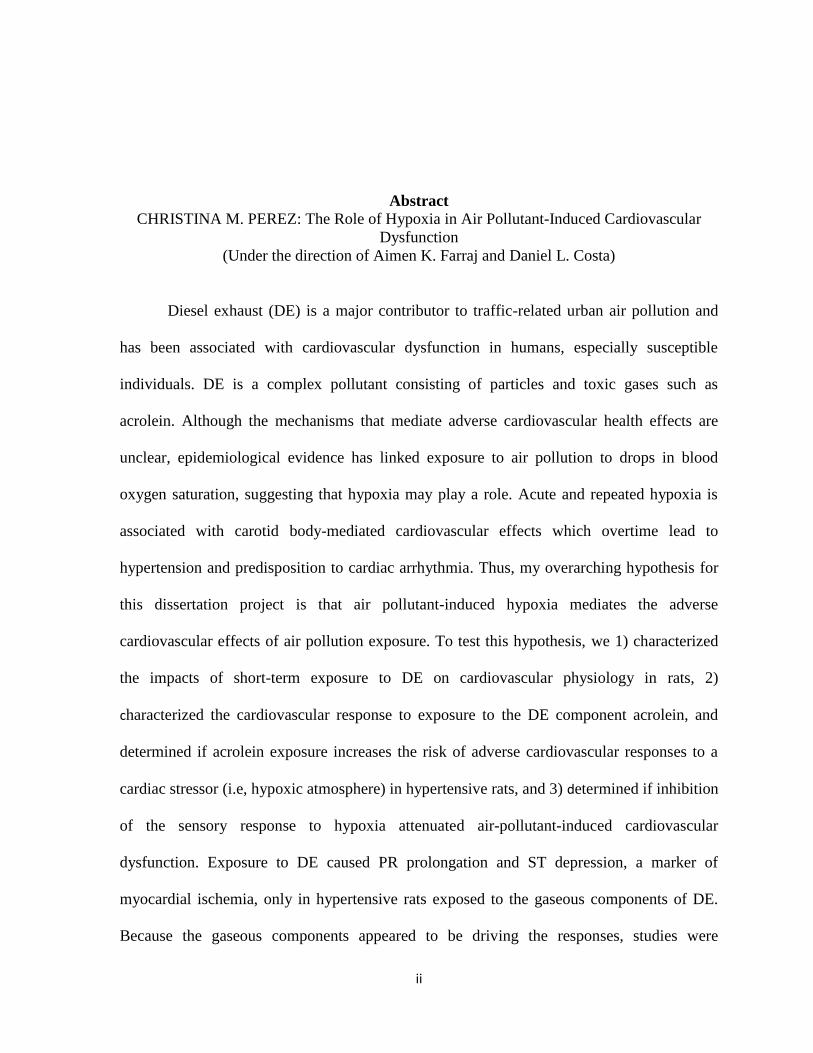
Abstract
CHRISTINA M. PEREZ: The Role of Hypoxia in Air Pollutant-Induced Cardiovascular
Dysfunction
(Under the direction of Aimen K. Farraj and Daniel L. Costa)
Diesel exhaust (DE) is a major contributor to traffic-related urban air pollution and
has been associated with cardiovascular dysfunction in humans, especially susceptible
individuals. DE is a complex pollutant consisting of particles and toxic gases such as
acrolein. Although the mechanisms that mediate adverse cardiovascular health effects are
unclear, epidemiological evidence has linked exposure to air pollution to drops in blood
oxygen saturation, suggesting that hypoxia may play a role. Acute and repeated hypoxia is
associated with carotid body-mediated cardiovascular effects which overtime lead to
hypertension and predisposition to cardiac arrhythmia. Thus, my overarching hypothesis for
this dissertation project is that air pollutant-induced hypoxia mediates the adverse
cardiovascular effects of air pollution exposure. To test this hypothesis, we 1) characterized
the impacts of short-term exposure to DE on cardiovascular physiology in rats, 2)
characterized the cardiovascular response to exposure to the DE component acrolein, and
determined if acrolein exposure increases the risk of adverse cardiovascular responses to a
cardiac stressor (i.e, hypoxic atmosphere) in hypertensive rats, and 3) determined if inhibition
of the sensory response to hypoxia attenuated air-pollutant-induced cardiovascular
dysfunction. Exposure to DE caused PR prolongation and ST depression, a marker of
myocardial ischemia, only in hypertensive rats exposed to the gaseous components of DE.
Because the gaseous components appeared to be driving the responses, studies were
iii
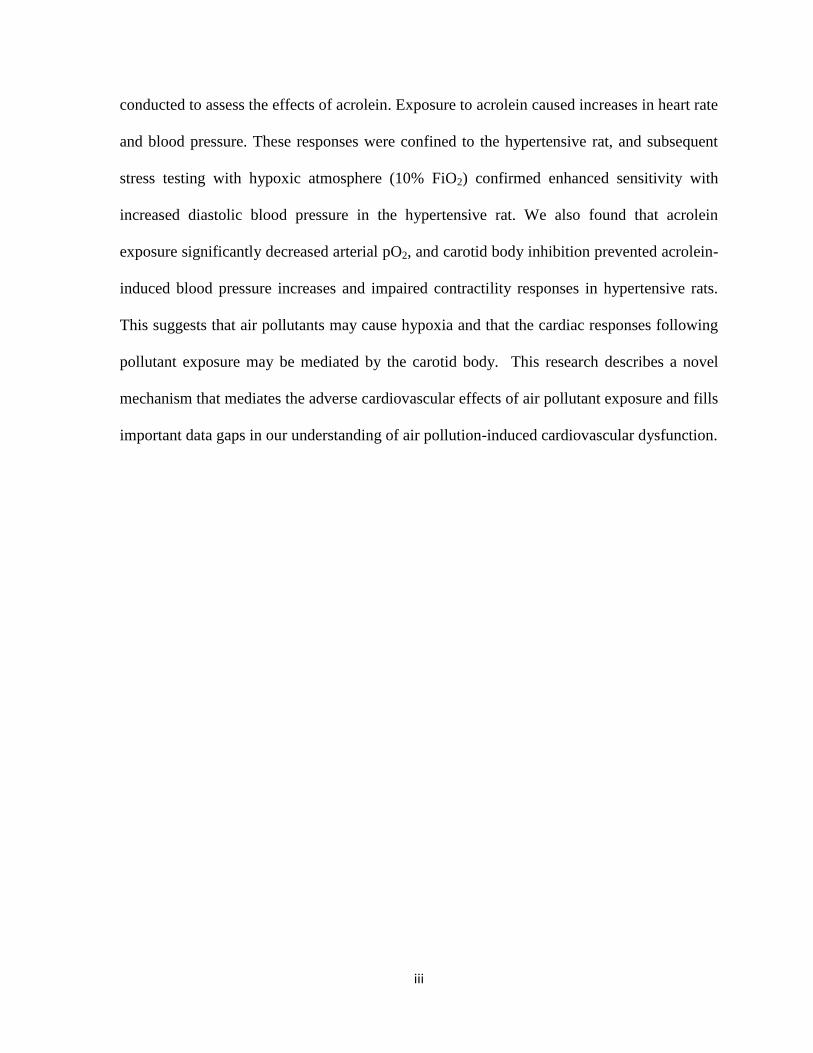
conducted to assess the effects of acrolein. Exposure to acrolein caused increases in heart rate
and blood pressure. These responses were confined to the hypertensive rat, and subsequent
stress testing with hypoxic atmosphere (10% FiO2) confirmed enhanced sensitivity with
increased diastolic blood pressure in the hypertensive rat. We also found that acrolein
exposure significantly decreased arterial pO2, and carotid body inhibition prevented acrolein-
induced blood pressure increases and impaired contractility responses in hypertensive rats.
This suggests that air pollutants may cause hypoxia and that the cardiac responses following
pollutant exposure may be mediated by the carotid body. This research describes a novel
mechanism that mediates the adverse cardiovascular effects of air pollutant exposure and fills
important data gaps in our understanding of air pollution-induced cardiovascular dysfunction.
iv
Acknowledgements
I would like to thank everyone who contributed to this work and supported me
throughout my graduate school journey. Firstly, my most sincere thanks for the absolutely
superb mentoring I received from Dr. Aimen Farraj and Dr. Dan Costa. I cannot thank them
enough for making my graduate school experience extremely positive and productive, and I
am so grateful for their time and support throughout my entire doctoral program. I would also
like to thank Dr. Mehdi Hazari for his expertise in physiology and his guidance of my
experiments and Dr. Alex Carll for his untiring patience in teaching me the nuances of
cardiac electrophysiology and always keeping me updated with the latest literature. I would
also like to thank all of the members of the laboratory and employees of the EPA that helped
me with the many facets of my project including Najwa Haykal-Coates, Allen Ledbetter, Ron
Thomas, Darrell Winsett, Todd Krantz, Charly King, Judy Richards, Nicole Kurhanewicz,
and Anthony Kulukulualani. I would also like to thank Dr. Ilona Jaspers, Dr. Kim Rathmell,
and Dr. Joan Taylor for their invaluable support and guidance on my dissertation committee
and Dr. Wayne Cascio for his support of my research and his insight into the cardiovascular
responses seen in my studies. Finally, I would like to thank Dr. Ammini Moorthy for her
overwhelming love for science and teaching, my wonderful mother, father, sister, and brother
for raising me with imagination and determination, and most especially I would like to thank
my husband for his unending love and devotion in every situation.
v
Table of Contents
List of Tables………………………………………………………………………………...vii
List of Figures……………………………………………………………………………….viii
List of Abbreviations………………………………………………………………………….x
Chapter
I. INTRODUCTION………………………………………………………………..1
Background………………………………………………………………..………1
Specific Aims……………………………..……………………………………...24
II. DIVERGENT ELECTROCARDIOGRAPHIC RESPONSES
TO WHOLE AND PARTICLE-FREE DIESEL EXHAUST
INHALATION IN SPONTANEOUSLY HYPERTENSIVE RATS …………...28
Overview…………………………………………………………………………28
Introduction………………………………………………………………..……..29
Materials and Methods……………………………………………………..…….31
Results……………………………………………………………………..……..40
Discussion…………………………………………………………………..……43
Tables………………………………………………………………………..…...49
Figures………………………………………………………………………..…..52
III. HYPOXIA STRESS TEST REVEALS EXAGERATED
CARDIOVASCULAR EFFECTS IN HYPERTENSIVE
RATS AFTER EXPOSURE TO THE AIR POLLUTANT
ACROLEIN …………………………………………….…………..…………...57
Overview…………………………………………………………………………57
vi
Introduction………………………..………………………………………....…..58
Materials and Methods……………………………………..…………………….60
Results…………………………………………..………………………………..68
Discussion……………………………..…………………………………………73
Tables…………………………………..………………………………………...79
Figures……………………………..……………………………………………..80
Supplementary Data…………………..………………………………………….86
IV. ACROLEIN INDUCED CARDIOVASCULAR DYSFUNCTION
IN RATS IS ASSOCIATED WITH REDUCED ARTERIAL
BLOOD OXYGEN AND IS MEDIATED BY THE
CAROTID BODY……………………………………………………………….89
Overview…………………………………………………………………………89
Introduction…………………………………………………………..…………..90
Materials and Methods……………………………..…………………………….92
Results………………………………………………..…………………………101
Discussion…………………………………………………..…………………..105
Tables…………………………………………………..……………………….113
Figures………………………………………………..…………………………114
V. IMPLICATIONS AND CONCLUSIONS……………………………………...121
Bibliography………………………………………………………………………………..138
vii
List of Tables
Table
2.1. Diesel exhaust characterization………………...………………………………..49
2.2. Electrocardiographic parameters in Spontaneously
Hypertensive Rats during exposure………………………….………………………50
2.3. Heart rate variability parameters in Spontaneously Hypertensive
rats during exposure………………………………………….………………………51
3.1. Arterial blood parameters during the hypoxia stress test……………………..…79
Supplementary 3.1. Electrocardiographic parameters in Spontaneously
Hypertensive and Wistar Kyoto rats during acrolein exposure……………………...86
Supplementary 3.2. Electrocardiographic parameters in Spontaneously
Hypertensive and Wistar Kyoto rats during the hypoxia stress test…………………87
Supplementary 3.3. Heart rate variability parameters in Spontaneously
Hypertensive and Wistar Kyoto rats during the hypoxia stress test…………………88
4.1. Arterial blood parameters during acrolein exposure in WKY rats………….....113

viii
List of Figures
Figure
1.1. The role of ion channels in the response to hypoxia…………………………….17
1.2. Chemoreceptor reflex control of blood pressure……………………………......22
2.1. fDE causes decreases in heart rate (HR) during exposure in SH rats…………...52
2.2. wDE causes decreases in heart rate (HR) during exposure in WKY rats……….53
2.3. SH rats exposed to fDE have increased PR interval during exposure………......54
2.4. SH rats exposed to fDE had increased negative ST amplitude during
and after exposure……………………………………………………………………55
2.5. SH rats exposed to wDE have increased susceptibility to apnea
after capsaicin challenge……………………………………………………………..56
3.1. Acrolein exposure causes increases in heart rate, mean arterial blood
pressure, and the low frequency component of heart rate variability
in SH rats…………………………………………….…………………………….…80
3.2. Acrolein exposure causes significant increases in breathing
frequency and minute volume in SH rats…………………………………….………81
3.3. A novel hypoxia stress test may reveal latent sensitivity to
a gaseous pollutant…………………………………………………………………...82
3.4. Hypoxia stress test after acrolein exposure causes significant
increases in diastolic blood pressure in SH rats……………………………………...84
3.5. Hypoxia stress test after acrolein exposure causes significant
increases in minute volume and expiratory time in WKY rats………………………85
4.1. Acrolein exposure causes significant decreases in arterial
blood oxygen and potassium and significant increases in arterial carbon
dioxide………………………………………………………………………………114
4.2. Acrolein exposure causes significant decreases in breathing
frequency and significant increases in expiratory time immediately
after the beginning of exposure……………………………………………………..116
4.3. Carotid body inhibition attenuates blood pressure and temperature
ix
increases during acrolein exposure…………………………………………………117
4.4. Carotid body inhibition reverses decreases in dP/dTmax, a measure
of contractility, 24 hours post acrolein exposure…………………………………...118
4.5. Decrease contractility one day after exposure is likely mediated
by the parasympathetic nervous system, while dobutamine infusion
reveals significant increases in contractility that is reversed by vagotomy……..….119
4.6. Acrolein-induced cardiovascular dysfunction is mediated by carotid
body sensing of hypoxia……………………………………………………………120
x
List of Abbreviations
AHA, American Heart Association
ANS, autonomic nervous system
APB, atrial premature beat
ApoE-/-
, apolipoprotein E–deficient
AVB, atrioventricular block
BP, blood pressure
BPM, beats per minute
Ca2+
, calcium ion
CAPs, concentrated ambient particles
cDNA, complementary DNA
CEMs, continuous emission monitors
CIH, chronic intermittent hypoxia
CO, carbon monoxide
COPD, chronic obstructive pulmonary disease
CV, cardiovascular
DE, diesel exhaust
dP/dtmax, maximum up-slope in pressure
dP/dtmin, minimum down-slope in pressure
ECG, electrocardiogram
EDV, end diastolic volume
ESV, end systolic volume
fDE, filtered diesel exhaust
xi
FIO2, fraction of inspired oxygen
HAPs, hazardous air pollutants
Hct, hematocrit
HF, high frequency
HIF-1, hypoxia inducible factor 1
HO-1, heme oxygenase-1
HR, heart rate
HRV, heart rate variability
HVR, hypoxic ventilatory response
IL-6, interleukin 6
K+, potasium ion
LF, low frequency
MAP, mean arterial pressure
MI, myocardial infarction
Na+, sodium ion
NAAQS, National Ambient Air Quality Standards
NATA, National-scale air toxics assessment
NF-ĸB, nuclear factor- kappa B
NO, nitric oxide
NO2, nitrogen dioxide
NOS, nitric oxide Synthase
NTS, nucleus of the solitary tract
O3, ozone

xii
OSA, obstructive sleep apnea
PAH, polyaromatic hydrocarbon
Pb, lead
pCO2, partial pressure of carbon dioxide
PCR, polymerase chain reaction
PM, particulate matter
PM2.5, “fine particulate matter”, less than 2.5 µm in diameter
PM10, “coarse particulate matter”, between 2.5 and 10 µm in diameter
pO2, partial pressure of oxygen
ppb, parts per billion
ppm, parts per million
QTc, heart rate-corrected QT interval
RARs, rapidly adapting pulmonary receptors
RAS, renin-angiotensin system
RNA, ribonucleic acid
RMSSD, square root of the mean of squared differences of adjacent RR intervals
ROFA, residual oil fly ash
ROS, reactive oxygen species
SAB, sinoatrial block
SaO2, oxygen saturation
SARs, slowly adapting pulmonary receptors
SDNN, standard deviation of the RR interval
SEM, standard error of the mean

xiii
SH, Spontaneously Hypertensive
SHHF, Spontaneously Hypertensive Heart Failure
SO2, sulfur dioxide
Te, expiratory time
TEOM, tapered element oscillating microbalance
tHB, total hemoglobin
TLR, toll-like receptor
TRP, transient receptor potential channel
UFP, ultrafine particulate matter
US EPA, United States Environmental Protection Agency
VBP, ventricular premature beat
VOCs, volatile organic compounds
VT, ventricular tachycardia
wDE, whole diesel exhaust
WHO, World Health Organization
WKY, Wistar Kyoto
Chapter 1
Introduction
History of Air Pollution Epidemiology and Policy
Air is all around us. Air sustains life and brings growth, but it is also vulnerable to
pollution from human industry and global progress. In the twenty-first century, we recognize
that the decisions we make affect the environment around us, and numerous companies are
investing in “green” energy and more efficient practices. Despite this invigorated desire to
protect the air we breathe, the history of air pollution epidemiology is rich with stories of
human progress mixed with environmental destruction and an ever evolving understanding of
the relationship between human health and our air. It was not long ago that major
industrialized cities of the world boasted some of the worst breathing conditions, a fact that
still remains true for many developing countries. Revisiting these situations is important in
realizing both how far we have come in our understanding of the health effects of air
pollution exposure but also as a warning that our environment is an ever changing entity that
must be consistently protected to ensure human health.
The British industrial revolution that began in the late 1770’s presents some of the
most widely read accounts of the horrific air quality in London caused by excessive use of
coal. Charles Dickens’s Bleak House, published in 1852, opens with this detailed description
of the air in industrial London:
2
London. Michaelmas term lately over, and the Lord Chancellor sitting in
Lincoln's Inn Hall. Implacable November weather … smoke lowering down
from chimney-pots, making a soft black drizzle, with flakes of soot in it as big
as full-grown snowflakes—gone into mourning, one might imagine, for the
death of the sun… Fog everywhere. Fog up the river, where it flows among
green aits and meadows; fog down the river, where it rolls defiled among the
tiers of shipping and the waterside pollutions of a great (and dirty) city.
(Dickens, Bleak House).
Despite well documented accounts of severe air pollution during the 1800s and even
for centuries before that time, the link between air pollution exposure and adverse effects on
human health did not become apparent until the early twentieth century with three key air
pollution events. In 1930, an acute air pollution event occurred in the Meuse Valley of
Belgium leading to the death of sixty residents and numerous cattle (Firket, 1936). The
narrow, 15 mile strip of land held 14 different industrial centers including coke ovens, steel
mills, and zinc smelters. A temperature inversion in December caused abnormally high levels
of air pollution that led to a 10.5 times increase in mortality and left almost 6000 residents ill
with respiratory disease and complaints of eye and throat irritation (Jun, 2009). Despite the
severity of this incident, additional events would have to occur to solidify the link between
air pollution exposure and adverse effects on human health. In the fall of 1948, a heavy smog
settled over Donora, Pennsylvania, a town located on a river with multiple industries
including a steel mill and zinc production facility. The steady accumulation of air pollutants
from the factories caused increased mortality and over 40% of the town’s residents to be
affected with acute illness during the high air pollution episode (Jun, 2009). Several years

3
later, the infamous “London smog” of 1952 forever linked the association between dangerous
levels of air pollution and increased morbidity and mortality. This acute air pollution event
led to over 4000 excess deaths and a dramatic rise in hospital admissions for cardiovascular
and respiratory related injuries (Logan, 1953). Similar to the other classic acute air pollution
events, many of the deaths occurred in patients with pre-existing cardiovascular or
respiratory diseases. These three examples as well as many other events that occurred during
the 1960’s and 1970’s led to the understanding that exposure to air pollution can increase
morbidity and mortality in human populations and set the stage for both policy changes to
monitor air pollution and more in-depth studies to decipher how air pollution effects human
health.
By the late 1940’s in the United States, there were a few state-initiated laws involving
air pollution control, but it was not until 1955 that the federal government passed the Air
Pollution Control Act, the first federal legislation that allocated funds to study the effects of
air pollution (Roman and Saundry, 2007). The Clean Air Act of 1963 was the first federal
legislation involving the control of air pollution, and the subsequent Air Quality Act in 1967
expanded the federal government’s ability to monitor and control air pollution levels. These
laws and others created the groundwork for the landmark Clean Air Act amendment in 1970
which resulted in a radical shift in the role of the federal government regarding air pollution
control and research. The Clean Air Act of 1970 established emission standards for both
stationary and mobile sources of air pollution and allowed the development of the National
Ambient Air Quality Standards (NAAQS). On December 2, 1970, the United States
Environmental Protection Agency (US EPA) was created to implement the new laws now
governing the country. The US EPA established six criteria pollutants including ozone (O3),

4
sulfur dioxide (SO2), particulate matter (PM), nitrogen dioxide (NO2), carbon monoxide
(CO), and lead (Pb) that would be included in the NAAQS with appropriate standards being
reviewed every five years in order to monitor the evolving understanding of the different
pollutants and ensure human health (US EPA http://epa.gov/air/caa/caa_history.html). In
addition to the criteria pollutants, the US EPA set standards for Hazardous Air Pollutants
(HAPs) and stationary sources of air pollution. Since the implementation of this
revolutionary act, our regulation of air pollution from multiple sources has greatly evolved
and our understanding of the link between air pollution exposure and adverse effects on
human health has increased exponentially.
Despite huge advancements in policy and scientific understanding, the regulation of
air pollution levels in the United States and abroad remains a daunting necessity with a
variety of challenges. In the United States, our landscape has changed from several large
industrial cities surrounded by unspoiled expanses of rural lands to a suburban sprawl with
air pollution spread diffusely over the landscape (Costa and Amdur, 1996). This change in air
pollution dynamics tests the government’s ability to regulate air pollution levels on such a
vast scale and highlights the necessity of increased awareness and increased regulation
outside of the traditional industrialized city centers. On a global scale, high levels of air
pollution are still a common problem in developing countries. The World Health
Organization (WHO) recently released more stringent standards for global levels of the six
criteria pollutants, but most cities in developing countries such as Asia, Africa, and Latin
America have baseline air pollution levels that greatly exceed WHO recommendations (Chen
and Khan, 2008). These recommendations focus mainly on outdoor air pollution, but for
many nations, indoor air pollution from biomass burning is a major source of particle and gas

5
exposure and greatly increases an individual’s overall exposure to air pollution (Fullerton et
al., 2008). Although the following information will focus primarily on the health effects of
air pollution in United States cities, it is critical to understand that regulating air pollution
levels to protect human health is as relevant today as it was when the Clean Air Act was
passed in 1967. The history of air pollution epidemiology is a continuing mosaic with pieces
from a variety of nations and governments. Through past examples of acute air pollution
events and the modern challenges we face domestically and abroad, it is critically important
to understand that the air we breathe not only sustains our lives but presents a rich history of
human evolution, environmental awareness, and the importance of public health policy in
protecting human health.
Modern Epidemiology and Health Effects of Criteria Air Pollutants
Studies decades after the acute air pollution events in the 1930’s to 1950’s established
strong links between exposure to air pollution and increased human morbidity and mortality.
The exact health effects of air pollution exposure and what components were causing those
responses still need to be deciphered. Numerous epidemiological studies have demonstrated
clear adverse health effects associated with the each of the criteria pollutants. The current
NAAQS standard for O3 is 75 ppb over an 8 hour period (NAAQS US EPA). Ozone
exposure has been associated with increased mortality (Levy et al., 2005), asthma
exacerbation (Dockery and Pope, 1994), and increased hospital and emergency room visits
(Choi et al., 2011). In addition, individuals with underlying pulmonary and cardiovascular
disease have increased susceptibility to ozone exposure (Burnett et al., 2001). The current
NAAQS standard for CO is 9 ppm over an 8 hour period (NAAQS US EPA), and prolonged
6
CO exposure has been associated with altered redox status and ion homeostasis as well as
adverse effects on cardiovascular health (Reboul et al., 2012). The national standard for NO2
is 100 ppb during a 1 hour period (NAAQS US EPA), but epidemiological studies have
calculated that each increase of 5 ppb NO2 is associated with a 12% increase in mortality
from cardiovascular disease (Chen et al., 2013). Another criteria air pollutant strongly
associated with adverse exposure effects is SO2 with a national standard of 75 ppb for every
1 hour period (NAAQS US EPA). Exposure to SO2 has been linked to increased risk of
myocardial infarction and increased hospitalizations for cardiovascular events (Amancio and
Nascimiento, 2012). In addition to these major components of air pollution, PM has been
strongly associated with adverse health effects and a significant amount of research has
characterized the response to this dynamic pollutant.
Health Effects of Particulate Matter (PM)
Since the establishment of the NAAQS, an enormous amount of research has been
conducted to characterize the effects of each criteria pollutant. Although all criteria pollutants
are dangerous to human health and important to consider in any air pollution exposure, PM
has probably been the most intensely studied over the last two decades. There are three major
categories of PM based on size. The first is PM10, or particulate matter less than or equal to
10µm in aerodynamic diameter. The current NAAQS standard for coarse particulate matter is
150 ug/m3
over a 24 hour period (NAAQS US EPA). The second is PM2.5, or particulate
matter less than or equal to 2.5 µm in aerodynamic diameter. The current NAAQS standard
for fine (PM2.5) particulate matter is 35 µg/m3
over a 24-hour period (NAAQS US EPA).
Finally, ultrafine particles (UFPs) are defined as particles less than or equal to 0.1 µm in

7
diameter (Brook et al., 2010). There is no current standard for UFPs. While each of these
particle size ranges has been associated with adverse health outcomes in humans, most of the
evidence implicates fine and coarse PM.
Several key epidemiological studies defined the adverse health effects of PM
exposure. The Harvard Six Cities Studies which began in 1974 estimated the effects of air
pollution on mortality in 8111 adults in six different US cities including Portage, Wisconsin;
Topeka, Kansas; Watertown, Massachusetts; St. Louis, Missouri; Harriman, Tennessee; and
Steubenville, Ohio (Dockery et al., 1993). The study found that residents in the most polluted
city had a 1.26-fold higher likelihood of air pollution associated mortality than the least
polluted cities, and this mortality was associated with PM2.5 and sulfate exposure (Dockery et
al., 1993). In addition, the increased mortality after air pollution exposure was most strongly
associated with lung cancer and cardiopulmonary diseases after an individual’s smoking
habits were taken into account (Dockery et al., 1993). Several years later, the link between
PM exposure and cardiopulmonary disease was further demonstrated with the analysis of a
cohort from an American Cancer Society study that found that 45% of the deaths associated
with PM were due to cardiovascular disease and 8% of deaths were due to respiratory disease
(Pope et al., 2004). Specifically, the deaths due to cardiovascular disease were predominately
due to ischemic heart disease, dysrhythmias, heart failure, and cardiac arrest (Pope et al.,
2004). The association between air pollution exposure and increased mortality due to
cardiopulmonary disease has been further strengthened by subsequent epidemiological
studies.
Additional studies demonstrated that inhalation of particulate matter (PM) associated
with ambient air pollution causes adverse effects on cardiovascular function. Peters et al.

8
(2004) found that increases as small as 10-20µg/m3
PM2.5 caused significant increases in the
risk of myocardial infarction up to 1 day after exposure. In addition, individuals who had
been hospitalized for coronary artery disease showed increases in T wave area (suggesting
impairment in myocardial repolarization) after exposure to ambient levels of black carbon
(Zanobetti et al., 2010) PM inhalation has also been associated with myocardial ischemia
(Gold et al., 2005; Wellenius et al., 2003) and arrhythmias (Brook et al., 2004), especially in
susceptible populations such as the elderly and those with underlying cardiovascular disease.
Epidemiological studies indicate that these effects are not immediate, usually manifesting
some time after exposure. Patients with implanted cardioverter defibrillators had increased
incidence of life-threatening arrhythmias up to 2 days after air pollution exposure (Peters et
al., 2000). These findings suggest that exposure to air pollution alters cardiovascular
physiology and increases conditional susceptibility to triggers of thrombosis and arrhythmia.
Moreover, the fact that these effects happen at lower exposure concentrations than those
shown to elicit effects in animal studies indicates that the responses are more complicated
than the standard monotonic dose-response relationship of traditional toxicology. Several
mechanisms have been proposed to account for these responses to air pollution exposure
including autonomic imbalance, systemic inflammation-mediated vascular dysfunction, and
direct actions of particles on the heart and vasculature (Donaldson et al., 2001; Schulz et al.,
2005; Utell et al., 2002). Much work remains to further delineate these mechanisms in order
to provide biological plausibility for the health effects observed after short-term fluctuations
in ambient levels of PM.

9
Diesel Exhaust
There are many sources of PM in the environment, but diesel exhaust is one of the
major contributors to fine and ultrafine PM air pollution (EPA/600/8-90/057F 2002).
Vehicular traffic is a dominant source of ambient PM, particularly in urban environments,
and studies have shown that proximity to traffic sources (e.g., highway or tunnel) is a major
determinant of cardiovascular health outcomes (Hoek et al., 2002; Hoffman et al., 2006; Van
Hee et al., 2009). Peters et al. (2004) found that exposure to traffic with high levels of DE
was associated with onset of myocardial infarction. Similarly, a study in eight European
countries attributed hospitalizations for acute coronary syndrome in older patients to
exposure to DE (Le Tertre et al., 2002). In a controlled human exposure study, Mills et al.
(2007) found that DE exposure accentuated exercise-induced electrocardiographic ST
depression (potential indication of myocardial ischemia) in subjects with known coronary
artery disease and exercise-induced ischemic ECG changes. While DE is a significant
contributor to PM, it is also a source of other pollutants constituting a complex mixture of
particulate and gaseous components. DE also consists of a mixture of gases including
nitrogen oxides (NOx), sulfur oxides (SOx), carbon monoxide (CO), and volatile organics
including aldehydes, benzene, and polycyclic aromatic hydrocarbons. The complex
composition of DE makes attributing specific health effects to one or more components
within DE challenging.
Acrolein
One notable toxic component of DE is acrolein, a pulmonary irritant that has been
associated with reflex pulmonary irritation and changes in autonomic tone. Acrolein is an

10
α,β-unsaturated aldehyde that is formed during the combustion of organic materials and is a
toxic components of cigarette smoke and internal combustion engine exhaust (Baeuchamp et
al., 1985). The most recent national scale assessment (NATA) released by the US EPA has
listed acrolein as the number one national noncancer hazard driver (NATA 2005). Acrolein is
a widespread environmental pollutant and ambient levels of 0.04 - 0.08 ppm have been
measured (Costa and Amdur, 1996). Cigarette smoke, however, contains up to 90 ppm
acrolein (Esterbauer et al., 1991), and acrolein levels in sidestream tobacco smoke are as
high as 10 ppm (Esterbauer et al., 1991). Acrolein is highly reactive and will immediately
bind and deplete glutathione levels in cells as well as form adducts by reacting with protein
residues (Keher and Biswal, 2000). Acrolein can cause oxidative stress and inhibit cell
proliferation in vivo and can also illicit a host of reflex responses due to its high reactivity.
Acrolein exposure in primary human hepatocytes resulted in increased apoptosis, decreased
intracellular glutathione, and activation of stress-signaling MAP-kinases (Mohammad et al.,
2012). In human bronchial smooth muscle cells, acrolein exposure causes induction of IL-8
and leads to phosphorylation of MAP kinase substrates (Moretto et al., 2012). In addition,
intravenous injection of acrolein in rats causes significant increases in blood pressure that are
reversed with guanethidine, a sympatholytic drug (Green and Egle, 1983). DE and its
components present highly relevant pollutants to utilize in controlled experiments to
characterize the cardiovascular effects of air pollution exposure.
Susceptibility to Air Pollution
Many of the adverse responses to air pollution occur in susceptible subpopulations,
groups with a heightened risk for an adverse endpoint compared with the general population

11
(Brook et al., 2010). Multiple epidemiological studies have demonstrated that adverse events
following PM exposure are heightened in the elderly (Pope et al., 2002) and in individuals
with diabetes (Zanobetti and Schawart, 2001), preexisting heart disease (Katsouyanni et al.,
2001) or heart failure (Goldberg et al., 2001). Individuals with pre-existing coronary artery
disease had a significant increase in the risk of a cardiac event after PM exposure even if they
did not experience any symptoms of the underlying disease (Pope et al., 2006). In addition,
increases in PM2.5 have been associated with more hospitalizations for heart failure than any
other cardiopulmonary disease (Dominici et al., 2006), and daily increases in PM10 have been
shown to cause increases in heart failure hospitalizations in older adults (Schwartz and
Morris, 1995). Obesity and current smoking status have also been suggested as susceptibility
markers for air pollution exposure (Miller et al., 2007). Because many of the adverse
responses observed during and after air pollution exposure occur in susceptible groups, it is
critical to model susceptibility in experimental studies to more accurately reflect
physiological responses.
Modeling Susceptibility
To understand the mechanisms behind adverse effects of air pollution exposure in
susceptible populations, researchers model exposures in the laboratory using rodents with
underlying disease. One of the primary rodent models used to study the cardiovascular
effects of air pollution is the Spontaneously Hypertensive (SH) rat. The mechanisms
accounting for the elevated sensitivity of the SH rat are uncertain, but may relate to the
structural, biochemical, and physiological characteristics of the cardiovascular system
attendant to prolonged hypertension. Previous studies have shown that SH rats have, on

12
average, 40 mmHg higher mean arterial pressure than background control rats with normal
blood pressure (El-Mas and Abdel-Rahman, 2005) as well as greater arterial wall thickness
(Mulvany and Halpern, 1977). The hypertensive rat was developed in 1963 when two Wistar
Kyoto rats with spontaneous hypertension were mated (Hulstrom, 2012). Although the exact
genetic determinates of spontaneous hypertension in this model are not fully characterized,
the hypertensive phenotype of the SH rat is believed to be related to vascular damage leading
to arterial hypertension in the juxtamedullary cortex of the kidney resulting in dysfunction
(Hulstrom, 2012). Over time, hypertension leads to structural and biological remodeling of
the left ventricle characterized by hypertrophy, fibrosis, and changes in membrane channels,
cellular energetics and ion regulation that combine to heighten myocardial sensitivity
(Bernardo et al., 2010). Such remodeling has been demonstrated in SH rats (Goltz et al.,
2007) and may account for the differences between the SH rat and rats with normal blood
pressure. It has previously been demonstrated that exposure to both particulate or gaseous air
pollutants causes exaggerated cardiovascular effects in rat models of hypertension and heart
failure (Carll et al., 2012; Farraj et al., 2011; Hazari et al., 2009; Lamb et al., 2012).
Mechanisms of Adverse Cardiovascular Effects After PM Exposure
Our understanding of the mechanisms underlying air-pollution induced
cardiovascular function has increased substantially since the first epidemiological studies
suggested a link between PM exposure and increased cardiovascular morbidity/mortality.
While multiple mechanisms have been postulated, there are three widely-acknowledged
hypothesized mechanisms of action. One postulates that health effects result from the
translocation of PM and/or its components into the systemic circulation with injury resulting

13
from the direct interaction of PM/components with blood vessel walls and/or the
myocardium. Fine and ultrafine PM can deposit deep within the lung and penetrate through
the lung tissue to the capillaries (Peters et al., 2006). Researchers have found that some UFPs
were able to translocate to the liver within 4 to 24 hours post exposure, and entered the
olfactory bulb and possibly crossed the blood-brain barrier (Oberdorster et al., 2004).
Despite evidence for translocation of particles, this mechanism is probably the least
understood with limited evidence to support such effects.
The second mechanism of PM-induced cardiovascular dysfunction postulates that PM
inhalation triggers a local pulmonary oxidative injury and inflammation. This local response
leads to systemic oxidative stress and inflammation characterized by an increase in activated
white blood cells, platelets, and cytokine expression. This activation of immune components
causes inflammation of the liver and increased vasoconstriction leading to higher
thrombogenecity and coagulation (Brooks et al., 2010). The exact pathway by which PM
inhalation leads to oxidative stress and inflammation is multivariable and complex with
particle size and site of deposition being large determents of the response. UFPs may have
the ability to enter lung cells directly and interact with mitochondria (Muhlfeld et al., 2008)
while larger particles are taken up by macrophages through the innate immune response
(Møller et al., 2010). Some particles, such as metals, may generate reactive oxygen species
(ROS) directly or through biotransformation, while others may interfere with iron
homeostasis and generate ROS’s through Fenton reactions (Ghio and Cohen, 2005). This
increased oxidative stress can lead to inflammation with increased signaling of toll-like
receptors (TLR) and mitogen activated protein kinases that lead to the production of pro-
inflammatory transcription factors such as NF-κB (nuclear factor-κB) and the increased

14
production of inflammatory cytokines (Nel et al., 2006). Perhaps the major consequence of
PM-induced systemic inflammation is the targeting of the vascular endothelium, the inner
lining of the blood vessel wall. Under normal physiological conditions, the endothelium
mediates vascular dilation to maintain normal blood pressure and ensure adequate organ
perfusion, prevents platelet activation and clot formation, and inhibits adhesion of leukocytes
(Madden, 2012). Evidence in both humans and animal models has shown that PM causes
endothelial injury thus promoting vasoconstriction, thrombosis, and inflammation (Krishna et
al., 1998). These effects can lead to atherosclerotic plaque progression, coronary vasospasm,
and myocardial ischemia (Madden, 2012).
The third mechanism for PM-induced cardiovascular dysfunction postulates that PM
inhalation triggers lung reflexes that modify autonomic nervous system control of
cardiovascular function (ANS). The ANS controls many of the visceral functions and is
composed of two branches, the sympathetic branch that is responsible for the “fight or flight”
response and the parasympathetic branch that is responsible for returning the body to a
homeostatic baseline. One of the ways that researchers can measure changes in the ANS in
both humans and experimental animal models is by measuring heart rate variability (HRV).
HRV is the degree of difference in the interbeat intervals of successive heartbeats, and is an
indicator of the balance between the sympathetic and parasympathetic arms of the autonomic
nervous system (Rowan et al., 2007). The heart is a dynamic organ and must be able to
respond to changes in the body’s activity level. High HRV is traditionally considered positive
because the heart has the ability to respond to rapidly changing environments. Low HRV,
reflecting increased sympathetic tone (Rowan et al., 2007), is associated with an increased
risk of cardiac arrhythmia (Corey et al., 2006) and an increased risk of mortality in people

15
with heart disease (Bigger et al., 1993). An association between high ambient PM and low
HRV has been observed in several different studies in both healthy individuals and those
with cardiovascular disease (Chuang et al., 2005; Schulz et al., 2005; Vallejo et al., 2006).
Exposure to PM causes significant reduction in HRV and is associated with increased risk of
myocardial infarction, cardiac arrhythmias, and sudden cardiac death, especially in
susceptible populations (Sinnreich et al., 1998; Singh et al., 2003). The elderly and
individuals with preexisting cardiovascular diseases have been shown to have significant
decreases in HRV after exposure to PM (Liao et al., 1999). The response of the autonomic
nervous system is an orchestrated series of events that is influenced by a variety of sensory
responses in the lungs and vasculature. The established link between air pollution exposure
and changes to autonomic function presents an important relationship between reflex
responses and environmental exposures.
Autonomic Reflex Arcs and Their Perturbation by Air Pollution Exposure
The body has a complex and multivariate system that responds to environmental
stressors by triggering autonomic reflexes. One of the first responses that occurs after
inhalation of certain air pollution components or different irritants is activation of pulmonary
neural reflexes that send information to the brain through various airway sensory receptors.
The activation of these receptors depends on location of particle deposition as well as
chemistry and reactivity of the irritant. In addition to activation of pulmonary sensory
mechanisms, the baroreceptor response may also be elicited. Baroreceptors are localized
mechanoreceptors in the body that respond to changes in blood pressure through a negative
feedback mechanism. Baroreceptors sensing elevations in blood pressure will communicate
16
with the brainstem to decrease heart rate and subsequently blood pressure. In addition to the
pulmonary reflex response and the baroreceptor response, the body also utilizes a
chemoreceptor response that senses changes in blood gases and leads to downstream
responses to maintain homeostasis. It is important to note that the reflex responses in the lung
communicate with the baroreflex and chemoreflex responses, and each pathway influences
the other responses to coordinate the body’s homeostatic control of breathing and heart rate
at baseline and following exposure to a stimulus such as air pollution.
Pulmonary Neural Reflexes/Lung-Airway Sensory Receptors
There are three major types of sensory receptors in the lungs and airways: C-fibers,
rapidly adapting pulmonary receptors (RARs or irritant receptors), and slowly adapting
pulmonary receptors (SARs or stretch receptors) (Coleridge et al., 1984). Inhalation of
cigarette smoke, SO2, and acrolein have been shown to activate pulmonary C fibers leading to
reflex bronchospasm, apnea, and bradycardia (Lee et al., 1987). These responses were
inhibited with capsaicin treatment of the vagus nerve, the predominate parasympathetic
signaling pathway, to block conduction of C fibers and with bilateral vagotomy (Wang et al.,
1996). It has been observed that an increase in inspiration occurs only after C fiber afferents
are blocked, showing that the irritant response to air pollutants occurs through a combination
of C fiber and RAR receptor activation with C fiber activation being the predominate driver
of the response (Lee et al., 1992). A variety of ion channels are responsible for the responses
seen in the different pulmonary receptors. One of the most well characterized responses in
the lung is ion channel activation following exposure to hypoxia, or low ambient oxygen.
Acute hypoxia will lead to pulmonary vascoconstriction while chronic hypoxia will lead to

17
pulmonary vascular remodeling. Acute hypoxia increases cytosolic Ca2+
through inhibition
of voltage gated K+
(Kv) and tandem pore domain K+ (KT) channels, activation of voltage
gated Ca2+
channels (VDCC), and alteration of Ca2+
storage in the sarcoplasmic reticulum
(SR) in pulmonary artery smooth muscle cells (PASMCs) (Mauban et al., 2005; Fig. 1.1).
The complex pulmonary sensory and ion channel response to irritants and environmental
stressors such as hypoxia also elicits a host of responses in the cardiovascular system.
Figure 1.1. The role of ion channels in the response to hypoxia. (Reprinted with permission
from Mauban et al., 2005).
18
In addition to causing changes in tidal volume and breathing frequency, pulmonary
reflex responses also influence cardiovascular responses to air pollutants. Inhalation of
irritants in the upper airway tract causes reflex bradycardia coupled with increases or
decreases in heart rate depending on the airway site (Widdicombe and Lee., 2001).
Administration of atropine prevents bradycardia, showing that the response is predominately
vagally driven (Widdicombe and Lee, 2001). In the lower airways, C fibers and RARs will
respond strongly to inhaled irritants and lead to pronounced bradycardia and hypotension
(Lee et al., 2001). The pulmonary and cardiovascular systems are intimately related, and
airway reflexes originating in the larynx have been shown to cause cardiac dysrrythmia and
ST depression (Prys-Roberts et al., 1971). The lung and heart are intimately connected, and
physiologically, the two systems are always referred to as the cardiopulmonary system. Many
of the responses in the lungs from sensory receptor activation will lead to a host of
downstream events affecting heart rate and blood pressure. The mechanism by which the
body responds to changes in blood pressure is through the baroreceptor response, and like the
reflex pulmonary response, activation of baroreflex receptors will lead to downstream
responses that are meant to maintain homeostasis and allow the body to respond to diverse
stimuli.
Baroreceptor Reflex Responses
The baroreceptor reflex is the body’s way of maintaining control of blood pressure.
Baroreceptors are stretch sensitive mechanoreceptors located in the carotid sinus and aortic
arch, and each location is innervated by the glossopharyngeal nerve and vagus nerve,
respectively, which communicate downstream with the nucleus of the solitary tract (NTS) in

19
the brainstem (Williamson et al., 2006). The baroreceptor reflex functions through a negative
feedback mechanism where an increase in blood pressure will be sensed by the receptors and
causes a reflex decrease in heart rate and blood pressure. The same is true for decreases in
blood pressure eliciting a reflex increase in heart rate and subsequently blood pressure.
Studies using isolated carotid sinuses found that when pressure was lowered in the sinus, it
caused a reflex increase in systemic arterial blood pressure and heart rate (Walgenbach and
Shepard, 1984). Upon receiving input from the baroreceptors, the NTS communicates with
regions of the brain controlling the autonomic nervous system and leads to an inhibition of
the sympathetic nervous system and an activation of the parasympathetic nervous system
(Lohmeier and Iliescu, 2011). The baroreceptor reflex is crucial in day-to-day homeostatic
control, but it has also been implicated in the response to air pollution exposure.
Multiple studies have reported significant changes in blood pressure and baroreflex
sensitivity following air pollution exposure. In a cohort of German citizens, individuals living
in close proximity to high traffic had higher arterial blood pressure and greater prevalence of
hypertension than individuals living in low traffic areas (Fuks et al., 2011). Exposure to
particulate matter causes significant increases in diastolic blood pressure in healthy adults
and this increase was coupled with decreases in heart rate variability (Brook et al., 2009).
The baroreceptor reflex has important influence over changes in heart rate variability through
its communication with the brainstem. In addition to changes in blood pressure and
autonomic control, healthy non-smokers exposed to sidestream cigarette smoke had
significant increases in muscle sympathetic nerve activity (Hausberg et al., 1997). Rats
exposed to carbon nanotubes had alterations to baroreflex sequences (Legramante et al.,
2009), and exposure to concentrated ambient particles (CAPs) in dogs resulted in increases in

20
arterial blood pressure and significantly greater baroreflex sensitivity that was reversed with
alpha-adrenergic blockade (Bartoli et al., 2009). These studies demonstrate both the
importance of the baroreceptor reflex in controlling blood pressure changes and the
relationship between exposure to air pollution and baroreflex activation. The baroreceptor
reflex is a mechano-reflex that responds to changes in blood pressure mainly through stretch
receptors, but the body also utilized chemoreceptors that respond the stimuli such as air
pollutants.
Chemoreceptor Reflex Response- Carotid Body Reflex Response to Hypoxia
Both the pulmonary and baroreceptor reflex responses are integrated in the peripheral
chemoreflex receptors, including the carotid body. Hypoxia is defined as the lack of
sufficient oxygen to tissues. In mammals, the response to systemic hypoxia is controlled by
the carotid body. The carotid body is a cluster of chemo-sensitive cells located at the
bifurcation of the carotid artery and serves as the major chemoreceptor for pO2 levels in
mammals (Conde et al., 2004). In response to hypoxia, the carotid body releases excitatory
neurotransmitters that elicit reflex hyperventilation to compensate for reduced oxygen levels
through a HIF-1 mediated pathway (Roux et al., 2000; Liu et al., 2003; Lopez-Barneo et al.,
2008). Carotid body signaling then leads to increased sympathetic activation, which increases
blood pressure, ventilation, heart rate, and arrhymogenicity (Lopez-Barneo et al., 2008). The
carotid body response is also closely linked with baroreceptor response, and signals from
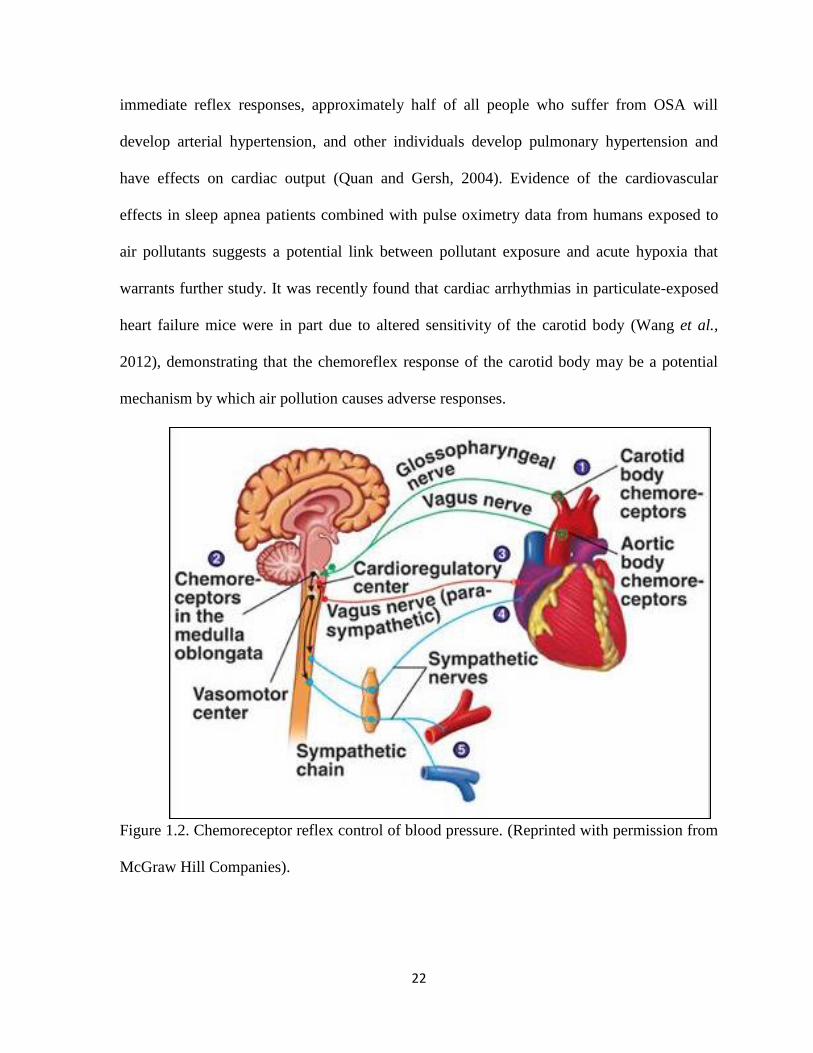
both will be integrated in the brainstem (Fig. 1.2; McGraw Hill Companies). Chronic
hypoxia is associated with increased myocyte apoptosis and is implicated in cardiac
remodeling and progression to heart failure (Bao et al., 2011). In addition, hypoxia has been
21
shown to cause atrial fibrillation, AV block, and ventricular tachycardia as well as changes in
autonomic balance associated with ventricular arrhythmias (Davies et al., 1993). Many of
these responses occur after carotid body sensing of hypoxia and present a potential pathway
to explain the role of hypoxia in air-pollutant induced cardiovascular function.
The body has a very specific response to hypoxic environments known as the hypoxia
ventilatory response (HVR). The first step is a reflex increase in ventilation, which is
followed by a gradual decrease or plateau if hypoxia is chronic. These responses are heavily
influenced by the pulmonary reflex response discussed previously. The body is actually
much more sensitive to changing levels of carbon dioxide than it is to oxygen, and the central
chemoreceptor in the medulla will respond to hypercapnia and increase the HVR. Peripheral
chemoreceptors, including the carotid bodies and aortic bodies, sense changes in oxygen and
carbon dioxide levels and communicate with the nucleus tractus solitarius which has
downstream communication with the respiratory network and can stimulate movement of the
diaphragm (Richard and Koehle, 2012). This will also lead to increased minute volume and,
in some cases, hypertrophy of the carotid body, especially in the event of chronic hypoxia.
Individuals who suffer from obstructive sleep apnea (OSA) and chronic obstructive
pulmonary disease (COPD) experience chronic intermittent hypoxia (CIH) characterized by
short episodes of hypoxia followed by normoxia (Iturriaga et al., 2005). In OSA, obstruction
of the upper airway during sleep causes both hypoxia and hypercapnia, which stimulate the
carotid body chemoreceptors. This causes a reflex increase in ventilation, sympathetic tone
and arterial blood pressure. The stimulation of these pathways is accompanied by both
chemoreceptor and pulmonary mechanoreceptor activation, restoring normal ventilation,
often causing individuals to awake from sleep (Iturriaga et al., 2005). In addition to
22
immediate reflex responses, approximately half of all people who suffer from OSA will
develop arterial hypertension, and other individuals develop pulmonary hypertension and
have effects on cardiac output (Quan and Gersh, 2004). Evidence of the cardiovascular
effects in sleep apnea patients combined with pulse oximetry data from humans exposed to
air pollutants suggests a potential link between pollutant exposure and acute hypoxia that
warrants further study. It was recently found that cardiac arrhythmias in particulate-exposed
heart failure mice were in part due to altered sensitivity of the carotid body (Wang et al.,
2012), demonstrating that the chemoreflex response of the carotid body may be a potential
mechanism by which air pollution causes adverse responses.
Figure 1.2. Chemoreceptor reflex control of blood pressure. (Reprinted with permission from
McGraw Hill Companies).

23
Air Pollution and Normal Blood Oxygen Levels
In humans, oxygen saturation is usually measured by pulse oximetry with a device
placed on the finger that measures arterial blood oxygen saturation using light absorbance.
While pulse oximetry devices exist for animal models, more reliable measurements are
obtained by taking serial blood draws and measuring blood gas analytes with a specialized
machine. Most modern blood gas analyzers measure a host of factors including oxygen
saturation (SaO2), partial pressure of oxygen (pO2) and carbon dioxide (pCO2), Na+, K
+, and
Ca++
. The body will respond to changes in blood oxygen levels almost immediately, and
small changes in carbon dioxide and oxygen levels can also impact important ions that effect
cellular repolarization. Many of these effects are mediated by the carotid body, and present
an important but surprisingly unappreciated focus of air pollution studies.
Exposure to air pollutants causes a host of responses in the cardiovascular system
including changes in heart rate, blood pressure, and increased arrhythmias. Episodes of
hypoxia elicit similar responses, and studies with pulmonary irritants have reported apnea as
a dominant reflex response to pollutant exposures (Hazari et al., 2008). Several
epidemiological studies have found significant decreases in oxygen saturation after exposure
to air pollutants. Pulse oximetry recordings in adults exposed to concentrated ultrafine
particles showed a 0.5% mean decrease in arterial O2 saturation (Gong et al., 2005). In
addition, healthy elderly adults exposed to concentrated ambient particles had significant
decreases in oxygen saturation during exposure (Gong et al., 2004). Recent work by Wang et
al. (2012) in heart failure mice demonstrated that cardiac arrhythmias with particulate-
exposure were in part due to altered sensitivity of the carotid body. Furthermore, exposures
to the air pollutants tobacco smoke (Adgent, 2006), sulfur dioxide and nitrogen dioxide

24
(Hoppenbrouwers et al., 1981) have been linked to abnormal cardiopulmonary sensitivity
responses to hypoxia. These studies demonstrate the potential for hypoxia to mediate the
adverse cardiovascular events following air pollution exposure and establish a strong
justification for research focusing on hypoxia as a potential mechanism for air-pollutant
induced cardiovascular dysfunction.
Overarching Hypothesis/Purpose of Research
Despite documented decreases in oxygen saturation during pollutant exposure, a
direct link between air pollution-induced hypoxia and adverse cardiovascular effects has not
been established, and the exact mechanism leading to adverse cardiovascular events remains
unclear. Preliminary results show that exposure to components of DE, such as acrolein,
trigger immediate irritant responses characterized by apnea and bradycardia, suggesting that
air pollution exposure may leads to hypoxia. Hypoxia has adverse effects on heart rate, blood
pressure, and sympathetic activation in heart rate variability and can precipitate adverse
cardiovascular responses. Thus, my overarching hypothesis for this dissertation project is that
air pollutant-induced cardiovascular dysfunction (e.g., increased arrhythmias, autonomic
imbalance, changes in cardiac function, and/or deficits in repolarization) is in part mediated
by systemic hypoxia (i.e., low arterial blood oxygen levels). The primary purpose for this
research effort is to better define mechanisms of actions of air pollutants to establish
biological plausibility for the spikes in human cardiovascular morbidity and mortality
associated with small fluctuations in ambient air pollution. This may help reduce
uncertainty in standard setting and ultimately contribute to a reduction in the risk associated
with exposure.

25
Hypothesis
A ir Pollutants
Hypoxia (Low PO2)
Increased Sympathetic Activity
Carotid Body Br a instem
•Altered HRV•Arrythmogenesis•Conduction deficits•Ion channel dysfunction•Oxidative stress
Cardiac effects
Increased BP
Increased HR
To achieve this goal, the following Specific Aims were carried out:
Specific Aim (SA) 1. Characterize the impacts of short-term exposure to DE on
cardiovascular physiology in rats. DE was studied because it is a significant contributor to
ambient PM and traffic-related adverse clinical outcomes. Thus, DE is an ideal model
pollutant to examine the role of hypoxia in the mediation of cardiovascular dysfunction. The
goal of this study was to perform a comprehensive assessment of the electrocardiographic
response to DE exposure in the rat. SA 1 will contribute valuable knowledge to the field by
providing a comprehensive characterization of the electrocardiographic impacts of exposure
before, during, and after exposure to both whole and filtered diesel exhaust in hypertensive
and normal rats. In addition, we will determine if DE exposure causes changes in heart rate
variability as well as pulmonary and cardiac toxicity and inflammation. This study will
enable the determination of the effects of the classes of components within DE (particulate
versus gas), shedding light on the drivers of toxicity within DE and inform on the role of pre-

26
existing cardiovascular disease in sensitivity to the effects of air pollution. I hypothesized
that DE exposure will cause concentration-dependent cardiac dysfunction in SH, but not
normal rats, and that exposure to whole DE will elicit greater effects than particle-free DE.
Specific Aim 2. Characterize the cardiovascular response to exposure to the DE
component acrolein, and determine if acrolein exposure increases the risk of adverse
cardiovascular responses to a cardiac stressor (i.e, hypoxic atmosphere) in hypertensive
rats. Acrolein is a component of DE that has been associated with reflex pulmonary irritation
and changes in autonomic tone. The US EPA has listed acrolein as the number one non-
cancer hazard driver in the United States, showing that the effects of acrolein exposure
warrant additional research. Epidemiological studies indicate that the cardiovascular effects
of air pollution inhalation are not immediate, usually manifesting some time after exposure.
For example, patients with implanted cardioverter defibrillators had increased incidence of
life-threatening arrhythmias up to 2 days after air pollution exposure (Peters et al., 2000).
These findings suggest that exposure to air pollution alters cardiovascular physiology and
increases conditional susceptibility to triggers of thrombosis and arrhythmia. Our lab has
previously found using other stress tests (e.g., exercise or exposure to an agent that triggers
cardiac arrhythmia) that air pollutant exposure disrupts homeostasis such that individuals
respond abnormally to normally tolerable stressors. Thus, sensitivity to hypoxia will reflect
the degree to which homeostatic mechanisms have been compromised. The goal of Aim 2 is
to determine if acrolein confers increased susceptibility to a cardiac stressor and determine if
this response is exaggerated in hypertensive rats. Acrolein was selected as the model
pollutant for this study because of the exaggerated effects observed with DE gases. I

27
hypothesized that acrolein exposure will modify the response to hypoxia in hypertensive but
not normal rats.
Specific Aim 3. Determine if inhibition of the sensory response to hypoxia will
attenuate air-pollutant-induced cardiac dysfunction. Although all of the mechanisms
mediating the adverse cardiovascular health effects of air pollution are unclear,
epidemiological evidence has linked exposure to air pollution to drops in blood oxygen
saturation, suggesting that hypoxia may play a role. Acute and repeated hypoxia is associated
with carotid body-mediated cardiovascular effects which overtime lead to hypertension and
predisposition to cardiac arrhythmia. The goal of Aim 3 is two fold: 1) determine if acrolein
exposure causes hypoxia by measuring oxygen levels in arterial blood and 2) determine if
inhibition of the carotid body, the major sensory organ involved in hypoxia sensing and the
triggering of reflex cardiorespiratory responses, leads to a reduction in cardiac abnormalities
associated with acrolein exposure. I hypothesized that inhibition of hypoxic sensing by the
carotid body will lead to the reduction and/or absence of air pollutant-induced cardiac
dysfunction. ECG, HRV, blood pressure, and cardiac contractility were assessed in this
study.
Chapter 2
Divergent Electrocardiographic Responses to Whole and Particle-Free
Diesel Exhaust Inhalation in Spontaneously Hypertensive Rats
Diesel exhaust (DE) is a major contributor to traffic-related fine PM2.5. While inroads
have been made in understanding the mechanisms of PM related health effects, DE’s
complex mixture of PM, gases and volatile organics makes it difficult to determine how the
constituents contribute to DE’s effects. We hypothesized that exposure to particle-filtered DE
(gases alone) will elicit less cardiac effects than whole DE (particles plus gases). In addition,
we hypothesized that Spontaneously Hypertensive (SH) rats will be more sensitive to the
electrocardiographic effects of DE exposure than Wistar Kyoto rats (WKY; background
strain with normal blood pressure). SH and WKY rats, implanted with telemeters to monitor
electrocardiogram (ECG) and heart rate (HR), were exposed once for 4 hrs to 150ug/m3 or
500ug/m3 of whole (wDE; gases plus PM) or filtered (fDE; gases alone) DE, or filtered air.
Exposure to fDE, but not wDE, caused immediate electrocardiographic alterations in cardiac
repolarization (ST depression) and atrioventricular conduction block (PR prolongation) as
well as bradycardia in SH rats. Exposure to wDE, but not fDE, caused post-exposure ST
depression and increased sensitivity to the pulmonary C fiber agonist capsaicin in SH rats.
The only notable effect of DE exposure in WKY rats was a decrease in heart rate. Taken
together, hypertension may predispose to the potential cardiac effects of DE and components
of DE may have divergent effects with some eliciting immediate irritant effects (e.g., gases)
while others (e.g., PM) trigger delayed effects potentially via separate mechanisms.
29
Introduction
Inhalation of fine particulate matter (PM) air pollution at concentrations frequently
encountered in ambient air sheds increases cardiovascular morbidity and mortality (Brook et
al., 2010), especially in individuals with pre-existing cardiovascular diseases (Brook and
Rajagopalan, 2009). Vehicular traffic is a dominant source of ambient PM particularly in
urban environments (Zhu et al., 2002) and studies have shown that proximity to traffic
sources (e.g., highway or tunnel) is a major determinant of cardiovascular health outcomes
(Hoek et al., 2002; Hoffman et al., 2006; Van Hee et al., 2009). Diesel exhaust (DE), largely
emanating from heavy duty diesel engines, is a significant source of fine (PM2.5) and ultrafine
PM air pollution (EPA/600/8-90/057F 2002), and is a major contributor to near roadway
emissions and near road-related adverse clinical outcomes. Peters et al. (2004) found that
exposure to traffic with high levels of DE was associated with onset of myocardial infarction.
Similarly, a study in eight European countries attributed hospitalizations for acute coronary
syndrome in older patients to exposure to DE (Le Tertre et al., 2002). In a controlled human
exposure study, Mills et al. (2007) found that DE exposure accentuated exercise-induced
electrocardiographic ST depression in subjects with known coronary artery disease and
exercise-induced ischemic ECG changes.
Several mechanisms of ambient PM effects have been postulated including
pulmonary receptor mediated modulation of autonomic balance, systemic
inflammation/oxidative stress leading to altered vasomotor regulation, and direct actions
through particles entering systemic circulation (Brook et al., 2010). DE is a chemically
complex source of ambient PM and thus defining modes of action is challenging. In addition
to PM, DE also consists of a mixture of gases including nitrogen oxides (NOx), sulfur oxides

30
(SOx), carbon monoxide (CO), and volatile organics including aldehydes, benzene, and
polycyclic aromatic hydrocarbons. While DE PM has been linked to altered cardiovascular
effects (Anselme et al., 2007; Mills et al., 2011a), other studies have shown that DE gases
affect health adversely. In addition to noting the effects of PM, Berger et al. (2006) found
that increased risk of supraventricular tachycardia in men with coronary heart disease was
associated with NO2, and Dockery et al. (2005) found similar responses associated with
exposure to NO2 and CO, gases known to originate from DE. In addition, atherosclerotic
mice exposed to DE gases showed increased endothelin-1 induced vasoconstriction and
altered T wave morphology (Campen et al., 2005).
Abnormal impulse formation and conduction can lead to clinically important heart
rhythm disorders and even sudden cardiac death. Despite clear associations with cardiac
dysfunction, it is unclear what modifying effects DE components may have when in
combination on heart rate and cardiac electrophysiology in individuals with pre-existing
cardiovascular disease. We have previously shown that exposure to PM (Farraj et al., 2009;
Carll et al., 2010) or the irritant acrolein (Hazari et al., 2009) in rat models of hypertension or
heart failure causes bradycardia, increased parasympathetic tone, ST depression, and
arrhythmia. In addition, we have previously shown that air pollution exposure (acrolein)
enhances sensitivity of pulmonary C fibers (Hazari et al., 2008), suggesting that air pollution
exposure may modify chemoreflex responses and potentially autonomic effects. Given the
heightened sensitivity to air pollution in individuals with cardiovascular disease, we
hypothesized that 1) Spontaneously Hypertensive (SH) rats will be more sensitive to the
electrocardiographic effects of a single DE exposure than similarly exposed Wistar Kyoto
rats (WKY; background strain with normal blood pressure), 2) exposure to particle-filtered

31
DE (gases alone) will elicit less cardiac effects than exposure to whole DE (particles plus
gases), and 3) the pulmonary chemoreflex response to capsaicin (C fiber agonist) provocation
will be potentiated 24 h after DE exposure. Physiological endpoints were monitored during
and up to one day after exposure to two different concentrations of DE as studies have shown
that exposure to traffic-related air pollution can trigger short term effects within hours after
exposure (Peters et al., 2004).
Materials and Methods
Animals
Twelve week-old male Spontaneously Hypertensive (SH) (n = 65) and Wistar Kyoto
(WKY) normotensive (n = 15) rats (Charles River, Raleigh, NC) were housed in plastic cages
(one per cage), maintained on a 12-hr light/dark cycle at approximately 22°C and 50%
relative humidity in our Association for Assessment and Accreditation of Laboratory Animal
Care-approved facility, and held for a minimum of 1 week before implantation. The
Institutional Animal Care and Use Committee of the U.S. Environmental Protection Agency
approved all protocols. Food (Prolab RMH 3000; PMI Nutrition International, St. Louis,
MO) and water were provided ad libitum, and all rats were randomized by weight.
Radiotelemetry Implantation
Animals (SH rats; n = 7 per group; 35 total and WKY rats; n = 5 per group; 15 total)
were anesthetized with a ketamine/xylazine solution (80 mg/ml ketamine HCL and 12 mg/ml
xylazine HCL; 1 ml/kg i.p.; Sigma Chemical Co., St. Louis, MO), and were implanted with
radiotelemeters as previously described (Watkinson et al., 1995). Briefly, an aseptic surgical
32
technique was used to implant a radiotelemetry transmitter (Model TA11CTA-F40; Data
Science International, Inc., St. Paul, MN) in the abdominal cavity. Electrode leads were
guided through the abdominal musculature through stab wounds. Leads were tunneled
subcutaneously and secured in a lead II configuration. Body heat was maintained during and
after surgery using a heating pad. Animals recovered for two weeks after surgery before
inhalation studies.
Diesel exhaust generation and exposure
Rats were assigned to exposure groups and acclimated to exposure chambers for 1
hour once per day beginning two days before exposure. On the exposure day, rats were
allowed to acclimate to the chambers for 1 hour and then baseline data was recorded for the
next hour. SH rats were then exposed once to filtered air, 150ug/m3 filtered diesel exhaust
(fDE) or whole diesel exhaust (wDE), or 500 ug/m3 fDE or wDE for 4 hours in whole body
exposure chambers. We hypothesized that the highest concentration of fDE and wDE would
cause the most severe effects. Because of this, WKY rats were exposed to only 500 ug/m3
fDE or wDE for 4 hours in whole body exposure chambers. wDE for exposure experiments
was generated using a 4.8 kW (6.4 hp) direct injection single-cylinder 0.320 L displacement
Yanmar L70 V diesel generator operated at a constant 3600 rpm. Resistance heating elements
provided a constant 3 kW load. Low sulfur diesel fuel (32 ppm), purchased from a local
distributor was available from a large storage tank. Engine lubrication oil (Shell Rotella,
15W-40) was changed before each set of exposure tests. From the engine, the exhaust was
mixed with particulate (HEPA) filtered room air. wDE concentrations were based on the fine
particulate matter (PM2.5; Mass Median Aerodynamic Diameter < 2.5 microns) fractions of

33
the diluted exhaust. Approximately 85 L/min of the exhaust was directed to a cone diluter
and mixed with approximately 595 L/min (7:1 dilution) of high efficiency particulate air
(HEPA) filtered room air. The diluted exhaust then traveled approximately 12 m through
7.1 cm diameter stainless steel tubing to a Hazelton 1000 (984 L) exposure chamber housed
in an isolated animal exposure room. Target wDE concentration of the diluted exhaust was
500 g of particulate matter (PM)/m3 (high) and 150 g of PM/m
3 (low) which was routed to
filtered and unfiltered exposure chambers. Multiple human and rodent studies have
performed DE studies at concentrations similar to and/or greater than the present study (Mills
et al., 2007; Harkema et al., 2009). The filtered chamber was operated at the same pressure,
temperature, flow-rate and gas concentrations as the whole particle chamber. The only
difference was that the filtered chamber pulled its exposure gas through a Solberg (Itaska, IL)
filter housing (model number is CSL-851-200HC) containing a HEPA canister filter. The
housing has an inlet to the outside of the pleated canister filter and discharges through the
core. The housing was equipped with 2 inch NPT thread inlet and exit ports. The HEPA
canister filter (part number HE-851) had a height of 8.75 inches and an OD of 5.75 inches.
This filter features a 99.97% removal efficiency standard to 0.3 micron and a temperature
range from -15° F to 220° F. Although the filtered chamber had nearly no PM present, it still
contained all the diluted combustion gases as the unfiltered chamber. The chamber
concentrations were controlled by periodic adjustments of dilution air based on continuous
mass concentrations determined by tapered element oscillating microbalance (TEOM,
Rupprecht and Patashnick Co., series 1400, Albany, NY) instruments. These instruments
include a heated (50 °C) chamber that could theoretically vaporize low temperature volatiles.
Control animals were placed in a third chamber supplied with the same HEPA filtered room
34
air. The chambers were operated at the same flow rate (424 L/min) resulting in
approximately 25 air exchanges per hour. Integrated 4 h filter samples (14.1 L/min) were
collected daily from each chamber and analyzed gravimetrically to determine particle
concentrations. Continuous emission monitors (CEMs) were used to measure chamber
concentrations of PM by TEOM, oxygen (O2, Beckman Corp., model 755, La Habra, CA),
carbon monoxide (CO, Thermo Electron Corp., model 48, Franklin, MA), nitrogen oxides
(NO and NO2, Teledyne Technology Co., model 200A4, San Diego, CA), and sulfur dioxide
(SO2, Thermo Electron Corp, model 43c, Franklin, MA). Samples were extracted through
fixed stainless steel probes in the exposure chambers. Gas samples were passed through a
particulate filter prior to the individual gas analyzers. Dilution of air was adjusted
periodically to maintain target PM concentrations as measured by the TEOM. Particle size
distributions were characterized during each exposure using an engine exhaust particle sizer
(EEEPS, TSI Inc., model 3090, St. Paul, MN). Chamber temperatures, relative humidity, and
noise were also monitored, and maintained within acceptable ranges.
Radiotelemetry Data Acquisition
Radiotelemetry methodology (Data Sciences International, Inc.) allowed constant
monitoring of electrocardiographic data in unrestrained, un-anesthetized rats from
implantation until sacrifice. Electrocardiographic data was monitored by remote receivers
(DataART3.01; Data Sciences International, Inc.) positioned under the home cages within the
animal facility, and under the exposure cages within the exposure chambers. The exposure
cages were modified with plastic siding to limit signal noise from metal interference and
positioned away from other animals to prevent signal crosstalk. In home cages, sixty-second
35
segments of ECG waveforms were acquired and saved at 15-minute intervals from surgical
recovery through sacrifice not including the exposure period. Pre-exposure baseline data was
collected from home cages, as well as a 30 min baseline in exposure cages after a l hour
acclimation period. During the 4 hr exposure, sixty-second segments were acquired and
saved at 5-minute intervals. After exposure, rats were monitored in home cages until
sacrifice, approximately 18 hrs after the end of exposure. Heart rate (HR) was automatically
obtained from the ECG waveforms with data acquisition software (DataART3.01; Data
Sciences International, Inc.).
Electrocardiogram, Arrhythmia Identification and Heart Rate Variability (HRV) Analysis
ECGAuto software (EMKA Technologies, Falls Church, VA) was used for automated
analyses of ECG wave amplitudes and segment durations and areas, as well as for the visual
identification and enumeration of cardiac arrhythmias. Several parameters were determined
for each ECG waveform: PR interval; R amplitude and interval; QRS duration, amplitude,
and area; ST interval, amplitude, and area; and T-wave amplitude and
area; QT interval, heart
rate–corrected QT interval (QTc). To account for potential effects of normal circadian
rhythm,
ECG parameters were quantified over four 6-hour periods for
time-matched
comparisons between pre-exposure and post-exposure
periods while the rats were
unrestrained in their home cages. The times analyzed included 12 AM–6 AM, 6 AM–12
PM,
12 PM–6 PM, and 6 PM–12 AM. ECG parameters during exposure were analyzed in terms of
baseline (1-hr recordings while in the exposure chambers immediately before the beginning
of exposure) and Hours 1–4 (constituting the entire exposure period between 7:00 AM and
11:00 AM).
For magnitude change, exposure values were subtracted from the baseline

36
values. Magnitude changes were assessed to allow for comparisons between strains and
exposures and are presented where appropriate. Most of the data are presented as baseline vs.
exposure information and is separated by hour in some cases.
Cardiac arrhythmic events were identified in part by using the Lambeth conventions
(Walker et al., 1988) as a guideline for the identification of arrhythmias in rats. Arrhythmias
were identified as atrial premature beats (APB), ventricular premature beats (VPB), sinoatrial
blocks (SAB) atrioventricular blocks (AVB), or ventricular tachycardia (VT). Arrhythmias
were quantified and totaled over an 18 hour period prior to exposure (this corresponded to
the same times assessed after exposure), during the 4 hour exposure period, or during the 18
hour period beginning immediately after exposure. Total arrhythmia counts during exposure
were quantified (total of 48 two-minute segments during 4 h exposure period). To arrive at
counts per hour, the total amount of time sampled in minutes (96) was divided by the number
of minutes per hour (60).
For the analysis of HRV, thorough visual inspection was conducted to identify and
exclude arrhythmias, artifacts, and 1-min ECG waveforms lacking distinguishable R waves
for more than 30 sec. The analysis of HRV generated heart rate (HR) and
time-domain
measures, including mean time between adjacent QRS complex peaks (the RR interval), a
standard deviation of the RR interval (SDNN), SDNN normalized for the effects of heart
rate
[SDNN/(RR interval x 100)], and the square root of the mean of squared differences of
adjacent RR intervals (RMSSD). The SDNN represents overall HRV, whereas RMSSD
represents parasympathetic influence over HR. The
analysis of HRV also calculated
frequency domain parameters, particularly low frequency (LF) and high frequency (HF), and
the ratio of these two frequency domains (LF/HF). LF is generally believed to represent a

37
combination of sympathetic and parasympathetic tones, whereas HF indicates cardiac vagal
(parasympathetic) tone, and LF/HF serves as an index of sympathovagal balance.
Necropsy, Blood Collection, and Bronchoalveolar Lavage
Rats were deeply anesthetized with an intraperitoneal injection of Euthasol (200
mg/kg Na pentobarbital and 25 mg/kg phenytoin; Virbac Animal Health, Fort Worth, TX).
The 35 SH rats and 15 WKY rats implanted with radiotelemeters were sacrificed 18 hrs after
exposure. The remaining 30 SH rats were sacrificed 1 hr after exposure. Blood samples were
collected from the abdominal aorta with a syringe. The trachea was cannulated, and the lungs
were lavaged with a total volume of 35 ml/kg of Ca21, Mg21, and phenol red-free
Dulbecco’s PBS (SAFC Biosciences, Lenexa, MD), divided into two equal aliquots.
Cytospins and cell differentials from lavaged cell samples, assays for total protein
(Coomassie Plus Protein Reagent; Pierce, Rockford, IL), albumin (Diasorin, Inc., Stillwater,
MN), lactate dehydrogenase (Thermo DMA, Louisville, CO), and N-acetyl-b-d-
glucosaminidase (Roche Diagnostics, Mannheim, Germany) in lavage supernatants, and
serum C-reactive protein and creatine kinase (kit from Diasorin, Inc.; standard from Kamiya
Biomedical Co., Seattle, WA) were analyzed as previously described (Ghio et al. 2002).
Capsaicin challenge
A separate cohort of 15 male age-matched SH rats (not implanted with telemeters)
were used for this challenge test. Intravenous capsaicin challenge was performed as
described by Hazari et al. (2008). Capsaicin (Sigma-Aldrich, St. Louis, MO) was prepared as
a stock solution (500μg/ml) in a vehicle of 10% Tween 80, 10% ethyl alcohol, and 80%
38
saline. On the day of the experiment solutions with incremental capsaicin concentrations
were made by diluting the stock solution in saline based on individual animal body weights.
Briefly, 24 hrs after exposure, animals were anesthetized with urethane (1.5g/kg, i.p.),
supplemental doses of the anesthetic were administered intravenously as necessary to abolish
pain reflex. Body temperature was maintained at ~36ºC with a heating pad. The left jugular
vein was cannulated with P.E. 50 polyethylene tubing for the administration of capsaicin.
The cannula was exteriorized through an airtight port in the whole-body plethysmograph
(Buxco Electronics, Inc, Wilmington, NC). The flow signal was integrated to give VT, and f
was computed from the amount of time it took for one breath. A flow threshold of
approximately 60% of the peak inspiratory flow was programmed using Biosystems XA
software (Buxco Electronics, Inc, Wilmington, NC) into the analyzing computer. To be
registered the flow signal had to drop below this threshold, indicating an adequate
inspiration. Ti was calculated as the time between the start of the breath, or where the flow
last crossed zero flow, and the start of expiratory flow, or the point where the flow signal
rose to zero. Te was calculated as the difference between the length of the breath and the
inspiratory time. A breath was “rejected” when the expired volume differed by more than
2/3 the inspired volume. The parameters were measured and recorded on a breath-by-breath
basis and averaged over 10-sec intervals. For each dose, 0.1 ml of capsaicin was first
injected into the catheter and then flushed into the animal with 0.2ml of physiological saline.
The volume of the catheter was approximately 0.2 ml. Administration of capsaicin in this
manner initiated the pulmonary chemoreflex apneic response (rapid decrease in f and
increase in Te). At least 15 min elapsed between doses to allow complete recovery. Data
from ten breaths immediately preceding the capsaicin injection were pooled to represent the

39
baseline values. Animals were euthanized with an overdose of Na pentobarbital after the
experiment.
Real-Time Polymerase Chain Reaction (PCR)
Total RNA was isolated from the left ventricle of the heart, using the TriZol
(Invitrogen, Carlsbad, CA) method of RNA isolation. RNA concentration and integrity were
confirmed using the NanoDrop ND-1000 Spectrophotometer (Thermo Scientific,
Wilmington, DE) and the Agilent 2100 Bioanalyzer (Thermo Scientific), respectively. RNA
was converted to complementary DNA (cDNA) using the TaqMan Reverse Transcription
Reagents (Roche; Applied Biosystems, New Jersey). Real-Time PCR was performed using
the TaqMan Universal PCR Master Mix and TaqMan Gene Expression Assays: Hmox1
(Rn01536933_m1), IL-6 (Rn01410330_m1), and Gapdh housekeeping gene
(Rn01462661_g1) (Roche; Applied Biosystems, New Jersey). Reaction plates (96 wells)
were run on the Applied Biosystems 7900HT Real-Time PCR System (Applied Biosystems,
New Jersey) with the following temperature cycle: RT 50°C for 2 min, activation at 95°C for
10 min, amplification for 40 cycles at 95°C for 15 sec and 60°C for 1 min. Results were
analyzed using the Sequence Detection System 2.2.2 (Applied Biosystems, New Jersey).
Statistics
ECG and HRV data included 5 different treatment groups (Air, 150ug/m3 fDE or
wDE, and 500 ug/m3 fDE or wDE). The statistical analyses of the ECG and HRV data in this
study were performed using SAS version 9.2 software (SAS Institute Inc, Cary NC). We
used PROC MIXED of SAS since it offers greater flexibility for the modeling of repeated
40
measures data than PROC GLM. It is also suitable for analysis of large, unbalanced data with
missing data at random. A linear mixed model with restricted maximum-likelihood
estimation analysis, least squares means and repeated measures ANOVA was used to
determine which TIME*TRT interactions were statistically significant between baseline and
exposure. Multiple comparison adjustment for the p values and confidence limits for the
differences between the least squares means was done using adjust=Tukey HSD (Honest
Significant Difference) test. All the biochemical, differential, lung physiology and molecular
data were analyzed using GraphPad Prism (GraphPad Software, Inc., La Jolla, CA) with a
one, two, or three-way analysis of variance (ANOVA) model examining the main effects of
each model as well as the interactive effects of two- and three-way ANOVA models. p < 0.05
was considered statistically significant.
Results
Exposure Characterization
Table 2.1 lists average particle and gas exposure concentrations, particle size and
number. Chamber temperature and humidity were 72.45 ± 0.69 oF and 43.58 ± 1.27 %
respectively for all chambers.
Heart Rate
Heart rates decreased in SH rats during exposure to both 150 µg/m3
and 500 µg/m3
fDE when compared to heart rates before exposure (Fig. 2.1A-D). By the second hour of
exposure, SH rats exposed to 150 µg/m3 fDE had a 16% decrease in heart rate, from 361 ± 8
beats/min to 311 ± 9 beats/min (p<0.05; Fig. 2.1B). For SH rats exposed to 500 µg/m3 fDE,
41
heart rates decreased by 11.4% by the second hour of exposure, from 348 ± 6 beats/min to
312 ± 4 beats/min (p<0.05; Fig. 2.1B). For WKY rats, exposure to 500 µg/m3
wDE caused a
14.9% decrease in heart rate by hour 4 from 353 ± 8 beats/min to 308 ± 4 beats/min (p<0.05;
Fig. 2.2D). No changes in heart rate were measured in SH or WKY rats exposed to filtered
air.
Heart Rate Variability
There were no significant changes were in SDNN or RMSSD during exposure in SH
(Table 2.3) or WKY rats (data not shown). All SH rats including those exposed to air had
significant decreases in LF/HF during exposure, likely an effect due to chamber stress (Table
2.3).
Electrocardiogram and Arrhythmia
Exposure of SH rats to 500 µg/m3 fDE increased PR interval during hour 2 of
exposure, an effect that persisted throughout hours 3 and 4 of exposure (Fig. 2.3). There were
no significant changes in PR interval in SH rats exposed to filtered air, 150 µg/m3 fDE or
wDE, 500 µg/m3, or WKY rats under any exposure condition.
Only SH rats exposed to 150 µg/m3 fDE exposed had a significant increase in
negative amplitude during exposure (% change, p-value) (Figure 2.4A). Although still
reduced after exposure (a decrease of 160%), this difference was not statistically significant
(Figure 2.4B). There were no changes in the amplitude of the ST segment in any of the other
exposure groups. No changes in ST segment amplitude were seen in WKY rats.

42
SH rats exposed to 150 ug/m3 fDE had significant increase in negative ST area during
exposure (Table 2.2), while only exposure to 500 ug/m3 wDE caused significant increases in
negative ST area 18 hours after exposure (data not shown). Negative ST area is an
electrocardiographic parameter that measures the area under the curve between the S wave
and the peak of the T wave and can be used to infer changes in repolarization. During
exposure, 150 µg/m3 fDE caused negative ST area to increase from -0.78 ± 0.02 mVsec to -
0.94 ± 0.01 mVsec, a 17% decrease (p < 0.05). When 18 hours of post exposure data is
averaged, 500µg/m3 wDE caused negative ST area to increase from -1.23 ± 0.01 mVsec to -
1.32 ± 0.01 mVsec, a 6.8% decrease (p < 0.05).
There were no significant effects in any of the measured arrhythmias during or after
exposure in any of the exposure groups in either strain.
Capsaicin Challenge
Capsaicin (1, 2, 4, 8ug/kg, i.v.) caused a dose-dependent increase in Te in air exposed
SH rats (Figure 2.5). A single exposure to 500 µg/m3 wDE significantly potentiated the
chemoreflex apneic response to capsaicin in SH rats (this assay was not performed in WKY
rats); a greater than 60% increase in the apneic period at the two highest doses.
Heart Weight
SH rats had on average higher average heart weight than WKY rats (means, SEMs,
and p values). There were no significant effects of exposure on heart weight in either strain
(data not shown).
43
Oxidative Stress and Pulmonary Inflammation
There were no significant effects of exposure on the measured systemic and
pulmonary markers of oxidative stress and inflammation in either strain at either 1 or 24 hr
after exposure (data not shown).
Real-Time PCR
There were no significant gene expression expression changes in HO-1 or IL-6 in the
left ventricles of SH and WKY rats both 1 hr and 24 hrs after exposure.
Discussion
The current study demonstrates that exposure to filtered and whole DE affects
electrocardiographic parameters in SH rats, but not WKY rats, corroborating studies that
demonstrate enhanced sensitivity to the effects of air pollution in susceptible clinical
subgroups having underlying cardiovascular disease including hypertension (Brook and
Rajagopalan, 2009). Only exposure to the gaseous components of DE (fDE) caused heart
rate slowing, PR prolongation, and ST segment depression during exposure in SH rats.
Conversely, exposure to the high concentration of whole DE (wDE, both particles and gases)
caused ST depression after exposure in SH rats and was associated with elevated post-
exposure sensitivity to the pulmonary C fiber agonist capsaicin, suggesting that the gaseous
components of DE may activate separate pathways than the gas/particle mixture of wDE.
Exposure to fDE, but not wDE, in SH rats caused electrocardiographic alterations
during exposure indicative of changes in the early phase of repolarization (ST depression)
and atrioventricular conduction slowing (PR prolongation). In contrast, exposure to wDE

44
caused ST depression only after exposure. The exact reason for this disparity is unclear and
is discussed below. Nonetheless, multiple studies have reported ST segment depression with
both particulate and gaseous air pollution exposure. In a cohort of adults with stable
coronary heart disease, PM levels two days before clinic visits were positively associated
with increased risk of ST segment depression during an exercise test (Pekkanen et al., 2002),
and were attributed to the gaseous pollutants NO2 and CO (Pekkanen et al., 2002). Likewise,
ST segment depression has also been reported after exercise in elderly patients exposed to
black carbon (Gold et al., 2005). Although the mechanism behind ST depression is unclear,
previous studies have shown that combustion related gases in DE such as volatile
organics/aldehydes and alkanes cause coronary \vasoconstriction (Campen et al., 2005). In
addition, air pollution exposure causes variability in T wave morphology and repolarization
and may lead to myocardial vulnerability and the potential for adverse myocardial events
(Henneberger et al., 2005). While the ST segment changes are suggestive of ischemia,
measurements of biological indicators of ischemia were not carried out in this study and will
be needed to confirm ischemia in future studies. Moreover, this is the first study to report DE
induced PR prolongation. PR prolongation is fairly common irrespective of the presence of
disease and is usually associated with increased vagal tone (Sapire et al., 1979). These
findings are similar to our previous findings with inhaled PM (Farraj et al., 2009; Farraj et
al., 2011) and suggest that air pollution exposure secondarily impacts intra-myocardial
conduction.
While cardiac responses were the focus of this study, there were also respiratory
observations, some of which may have linkage to the cardiac responses and may explain the
divergence in cardiac responses with whole DE and DE gases alone. Previous reports from
45
our laboratory have demonstrated that stimulation of irritant receptors in the airways with
acrolein or DE can initiate cardiac responses. Capsaicin is an agonist for the transient
receptor potential channel (TRP) V1 receptor found on pulmonary C fibers; it causes reflex
bronchospasm and is useful as a challenge regimen to determine enhanced sensitivity to
pulmonary irritation and injury (Hazari et al., 2008). In this study, only SH rats exposed to
high wDE had significant increases in Te, a measure of apnea, after i.v. injection of capsaicin
24 hrs after exposure, suggesting enhanced sensitivity to capsaicin induced respiratory
dysfunction. The discrepancy in effects with whole and filtered DE suggests the activation
of separate mechanisms. Traditionally, air pollution toxicity is believed to occur through
three major pathways: 1) irritant or sensory receptor activation leading to changes in
autonomic balance, 2) activation of systemic inflammatory pathways that impact vascular
function, and 3) direct effects of translocated PM (Brook et al., 2010). While there was no
evidence of inflammatory changes in the heart, lung, and circulation, the immediacy of
effects with fDE exposure (HR slowing, PR prolongation, and ST depression during
exposure) suggest the activation of irritant pathways while the delayed effects with wDE
exposure suggest non-irritant pathways that are potentially mediated by oxidative or
inflammatory pathways. There were no significant HRV changes after exposure to DE.
Interestingly, Mills et al. (2011b) had similar finding showing that exposure to 300ug/m3
DE
did not affect HRV in human volunteers. Although there was no evidence of altered HRV
with fDE during exposure, high fDE did cause bradycardia and accompanying PR
prolongation that are associated with increased vagal tone. Conversely, the delayed response
with the wDE (i.e., ST segment depression after exposure) was accompanied by exaggerated
sensitivity to capsaicin, suggesting potential mediation by neurogenic/neuroimmune
46
mechanisms. Further work is needed to decipher the mechanisms that mediate these
responses.
The divergence in responsiveness is likely due to the distinct composition of fDE and
wDE. Several studies have shown that several components within DE, including particles,
particle/organic compound mixtures, and organic compounds found in the gas phase are
capable of eliciting adverse cardiovascular effects (Ris, 2007). For example, atherosclerotic
mice exposed to gaseous components of DE had increased coronary vasoconstrictive
responses (Campen et al., 2005). Epidemiological studies have also shown that gaseous
components of ambient air pollution also drive some of the adverse cardiovascular effects of
air pollution. For example, pollutant models excluding the effects of PM2.5 found increased
resting diastolic blood pressure due to ozone concentrations in patients with pre-existing
cardiovascular disease (Zanobetti et al., 2004). In addition, gaseous and particulate
components of DE interact and these interactions may have driven some of the divergent
responses seen in this study. The carbonaceous core of diesel particles creates a high surface
area vehicle suitable for absorption of a number of organic compounds including volatile
organic compounds (VOCs) and polyaromatic hydrocarbons (PAHs) that can then be
transported more deeply into the lung (Sosnowski et al., 2011). In addition, Kamm et al.
(1999) found that the surface properties of diesel soot were significantly altered after
interaction with ozone. Thus the composition of the exhaust affects particle and chemical
characteristics, which in turn might affect both the nature of the cardiopulmonary responses
and their time to onset.
While DE exposure decreased heart rate in both strains of rats, only the hypertensive
rat had significant electrocardiographic changes during and after exposure to DE. The
47
mechanisms accounting for the elevated sensitivity of the SH rat are uncertain, but may relate
to the structural, biochemical, and physiological characteristics of the cardiovascular system
attendant to prolonged hypertension. Previous studies have shown that SH rats have, on
average, 40 mmHg higher mean arterial pressure than background control rats with normal
blood pressure at the stage of life used in the present study (El-Mas and Abdel-Rahman,
2005) as well as greater arterial wall thickness (Mulvany and Halpern, 1977). Over time
hypertension leads to structural and biological remodeling of the left ventricle characterized
by hypertrophy, fibrosis, and changes in membrane channels, cellular energetics and ion
regulation that combine to heighten myocardial sensitivity (Bernardo et al., 2010). Such
remodeling has been demonstrated in SH rats (Goltz et al., 2007) and may account for the
differences in responsiveness to DE among the SH and WKY rat. The potential effects of the
low DE concentration on electrocardiographic response in WKY rats are unknown and
should be determined in future studies.
Collectively, the present findings demonstrate for the first time that whole DE and
particulate-free DE from the same diesel engine source trigger divergent electrocardiographic
responses. As illustrated with DE in this study, the specific composition of ambient
pollutants at any one location likely exacts unique physicochemical characteristics that
influence both the quality and magnitude of toxicity. The complex composition of DE makes
these divergent responses likely and also displays the challenge in determining mechanisms
controlling responses to multipollutant environments. The mixing of particles and gases
likely results in the generation of multiple new byproducts not found in particles or gases
alone. Thus, as evident from the data, traditional dose-response relationships may not readily
apply. DE exhaust exposure also caused little to no effect in healthy rats, stressing the
48
necessity of modeling susceptible human populations. Future studies should model additional
susceptible populations such as the elderly or individuals suffering from asthma. Taken
together, these findings highlight the need for additional studies that focus on the effects of
multi-pollutant exposures to more accurately assess the comparative cardiopulmonary
toxicity of different air sheds.
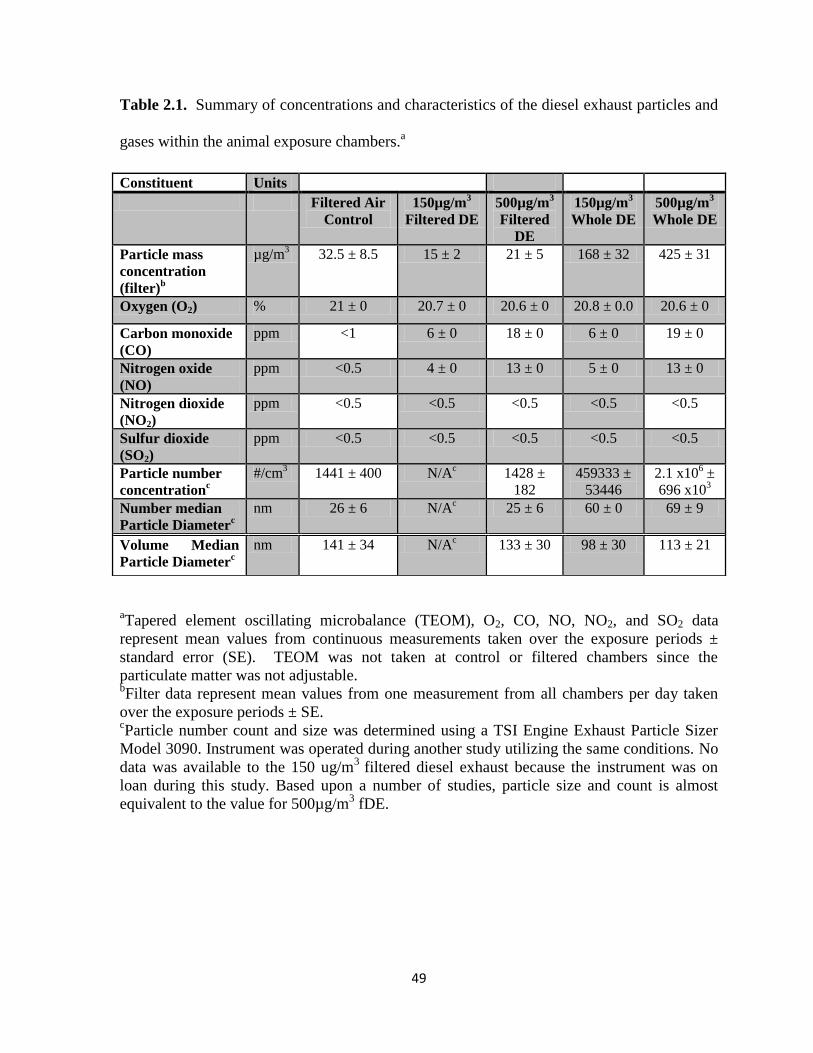
49
Table 2.1. Summary of concentrations and characteristics of the diesel exhaust particles and
gases within the animal exposure chambers.a
aTapered element oscillating microbalance (TEOM), O2, CO, NO, NO2, and SO2 data
represent mean values from continuous measurements taken over the exposure periods ±
standard error (SE). TEOM was not taken at control or filtered chambers since the
particulate matter was not adjustable. bFilter data represent mean values from one measurement from all chambers per day taken
over the exposure periods ± SE. cParticle number count and size was determined using a TSI Engine Exhaust Particle Sizer
Model 3090. Instrument was operated during another study utilizing the same conditions. No
data was available to the 150 ug/m3
filtered diesel exhaust because the instrument was on
loan during this study. Based upon a number of studies, particle size and count is almost
equivalent to the value for 500µg/m3 fDE.
Constituent Units
Filtered Air
Control
150µg/m3
Filtered DE
500µg/m3
Filtered
DE
150µg/m3
Whole DE
500µg/m3
Whole DE
Particle mass
concentration
(filter)b
µg/m3 32.5 ± 8.5 15 ± 2 21 ± 5 168 ± 32 425 ± 31
Oxygen (O2) % 21 ± 0 20.7 ± 0 20.6 ± 0 20.8 ± 0.0 20.6 ± 0
Carbon monoxide
(CO)
ppm <1 6 ± 0 18 ± 0 6 ± 0 19 ± 0
Nitrogen oxide
(NO)
ppm <0.5 4 ± 0 13 ± 0 5 ± 0 13 ± 0
Nitrogen dioxide
(NO2)
ppm <0.5 <0.5 <0.5 <0.5 <0.5
Sulfur dioxide
(SO2)
ppm <0.5 <0.5 <0.5 <0.5 <0.5
Particle number
concentrationc
#/cm3 1441 ± 400 N/A
c 1428 ±
182
459333 ±
53446
2.1 x10⁶ ±
696 x103
Number median
Particle Diameterc
nm 26 ± 6 N/Ac
25 ± 6 60 ± 0 69 ± 9
Volume Median
Particle Diameterc
nm 141 ± 34 N/Ac
133 ± 30 98 ± 30 113 ± 21
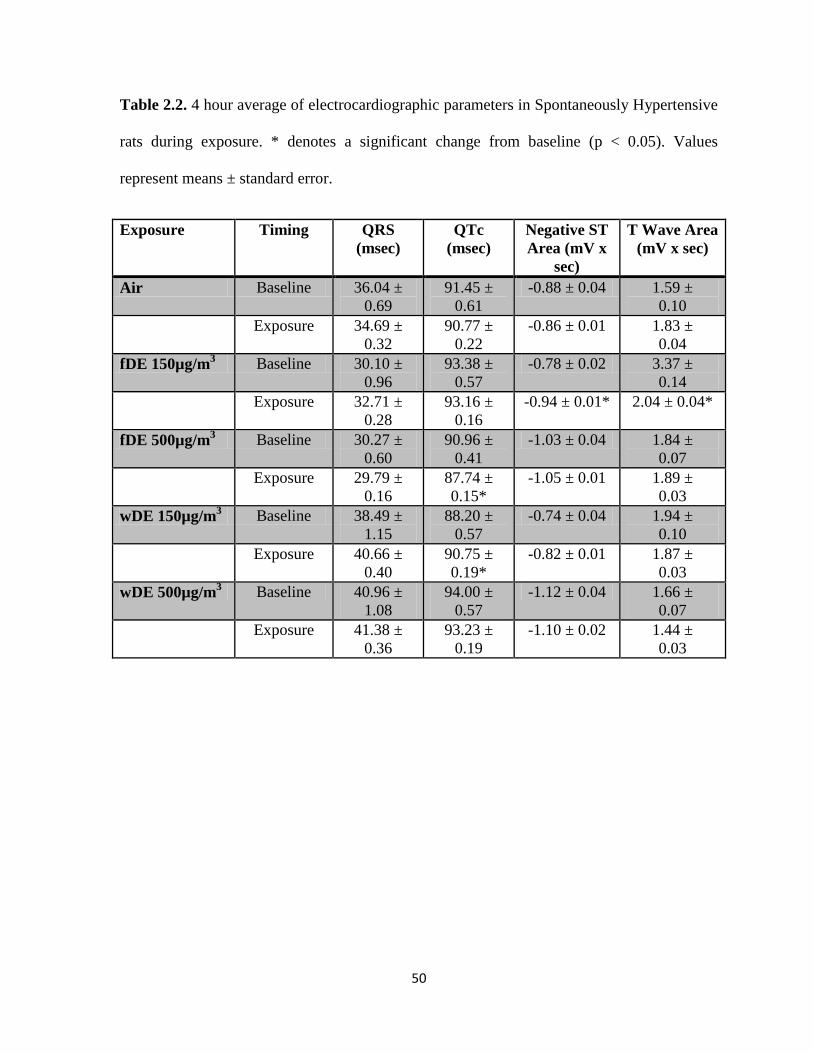
50
Table 2.2. 4 hour average of electrocardiographic parameters in Spontaneously Hypertensive
rats during exposure. * denotes a significant change from baseline (p < 0.05). Values
represent means ± standard error.
Exposure Timing QRS
(msec)
QTc
(msec)
Negative ST
Area (mV x
sec)
T Wave Area
(mV x sec)
Air Baseline 36.04 ±
0.69
91.45 ±
0.61
-0.88 ± 0.04 1.59 ±
0.10
Exposure 34.69 ±
0.32
90.77 ±
0.22
-0.86 ± 0.01 1.83 ±
0.04
fDE 150µg/m3 Baseline 30.10 ±
0.96
93.38 ±
0.57
-0.78 ± 0.02 3.37 ±
0.14
Exposure 32.71 ±
0.28
93.16 ±
0.16
-0.94 ± 0.01* 2.04 ± 0.04*
fDE 500µg/m3 Baseline 30.27 ±
0.60
90.96 ±
0.41
-1.03 ± 0.04 1.84 ±
0.07
Exposure 29.79 ±
0.16
87.74 ±
0.15*
-1.05 ± 0.01 1.89 ±
0.03
wDE 150µg/m3 Baseline 38.49 ±
1.15
88.20 ±
0.57
-0.74 ± 0.04 1.94 ±
0.10
Exposure 40.66 ±
0.40
90.75 ±
0.19*
-0.82 ± 0.01 1.87 ±
0.03
wDE 500µg/m3 Baseline 40.96 ±
1.08
94.00 ±
0.57
-1.12 ± 0.04 1.66 ±
0.07
Exposure 41.38 ±
0.36
93.23 ±
0.19
-1.10 ± 0.02 1.44 ±
0.03
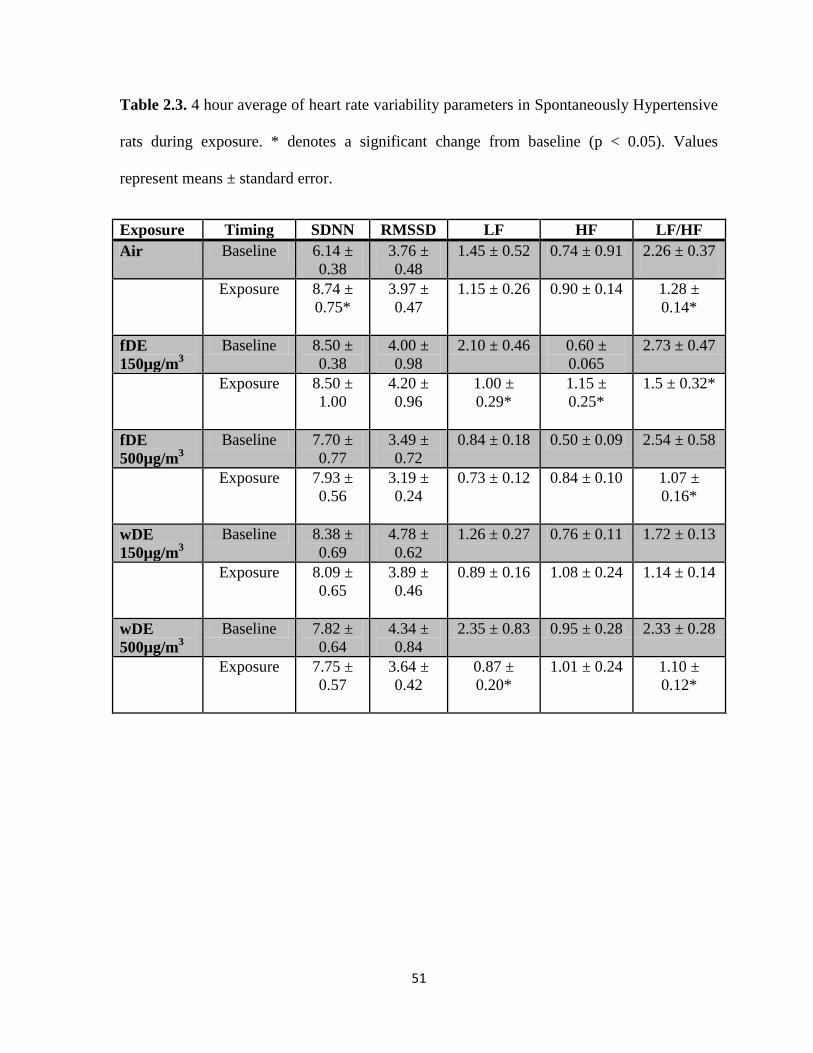
51
Table 2.3. 4 hour average of heart rate variability parameters in Spontaneously Hypertensive
rats during exposure. * denotes a significant change from baseline (p < 0.05). Values
represent means ± standard error.
Exposure Timing SDNN RMSSD LF HF LF/HF
Air Baseline 6.14 ±
0.38
3.76 ±
0.48
1.45 ± 0.52 0.74 ± 0.91 2.26 ± 0.37
Exposure 8.74 ±
0.75*
3.97 ±
0.47
1.15 ± 0.26 0.90 ± 0.14 1.28 ±
0.14*
fDE
150µg/m3
Baseline 8.50 ±
0.38
4.00 ±
0.98
2.10 ± 0.46 0.60 ±
0.065
2.73 ± 0.47
Exposure 8.50 ±
1.00
4.20 ±
0.96
1.00 ±
0.29*
1.15 ±
0.25*
1.5 ± 0.32*
fDE
500µg/m3
Baseline 7.70 ±
0.77
3.49 ±
0.72
0.84 ± 0.18 0.50 ± 0.09 2.54 ± 0.58
Exposure 7.93 ±
0.56
3.19 ±
0.24
0.73 ± 0.12 0.84 ± 0.10 1.07 ±
0.16*
wDE
150µg/m3
Baseline 8.38 ±
0.69
4.78 ±
0.62
1.26 ± 0.27 0.76 ± 0.11 1.72 ± 0.13
Exposure 8.09 ±
0.65
3.89 ±
0.46
0.89 ± 0.16 1.08 ± 0.24 1.14 ± 0.14
wDE
500µg/m3
Baseline 7.82 ±
0.64
4.34 ±
0.84
2.35 ± 0.83 0.95 ± 0.28 2.33 ± 0.28
Exposure 7.75 ±
0.57
3.64 ±
0.42
0.87 ±
0.20*
1.01 ± 0.24 1.10 ±
0.12*
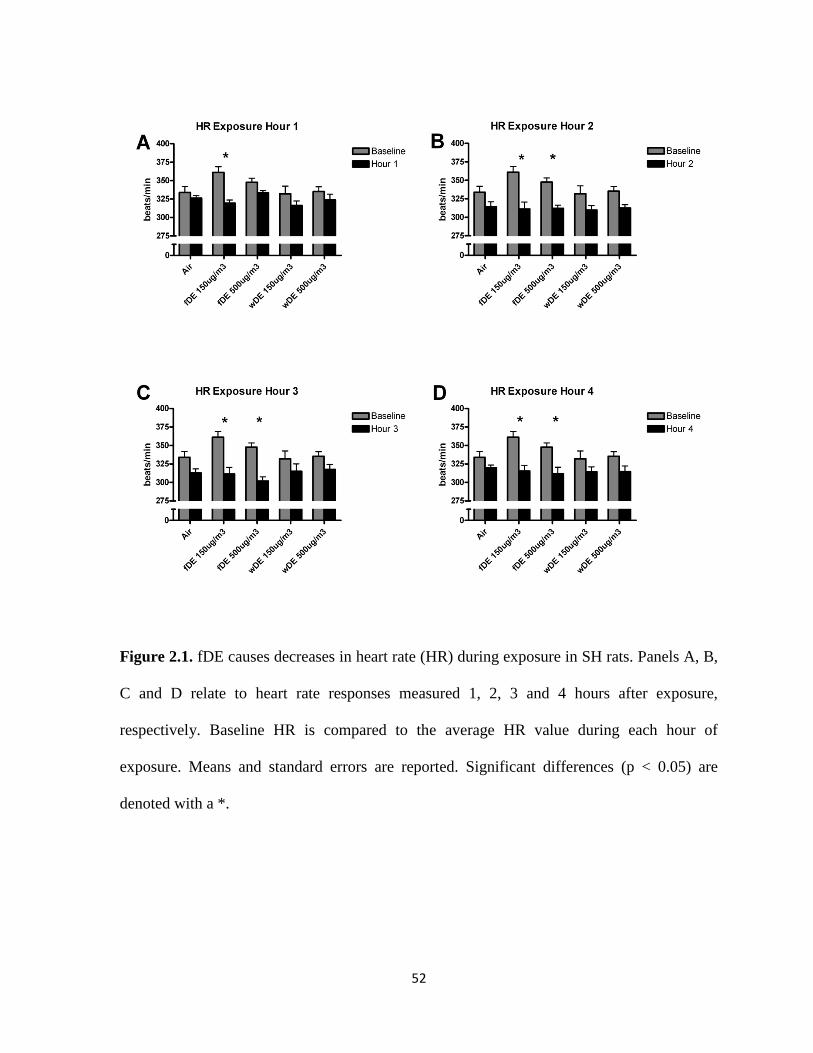
52
Figure 2.1. fDE causes decreases in heart rate (HR) during exposure in SH rats. Panels A, B,
C and D relate to heart rate responses measured 1, 2, 3 and 4 hours after exposure,
respectively. Baseline HR is compared to the average HR value during each hour of
exposure. Means and standard errors are reported. Significant differences (p < 0.05) are
denoted with a *.

53
Figure 2.2. wDE causes decreases in heart rate (HR) during exposure in WKY rats. Panels
A, B, C and D relate to heart rate responses measured 1, 2, 3 and 4 hours after exposure,
respectively. Baseline HR is compared to the average HR value during each hour of
exposure. Means and standard errors are reported. Significant differences (p < 0.05) are
denoted with a *.

54
Figure 2.3. SH rats exposed to fDE have increased PR interval during exposure. Panels A, B,
C and D relate to PR responses measured 1, 2, 3 and 4 hours after exposure, respectively.
Baseline PR interval is compared to the average PR interval value during each hour of
exposure. Means and standard errors are reported. Significant differences (p < 0.05) are
denoted with a *.
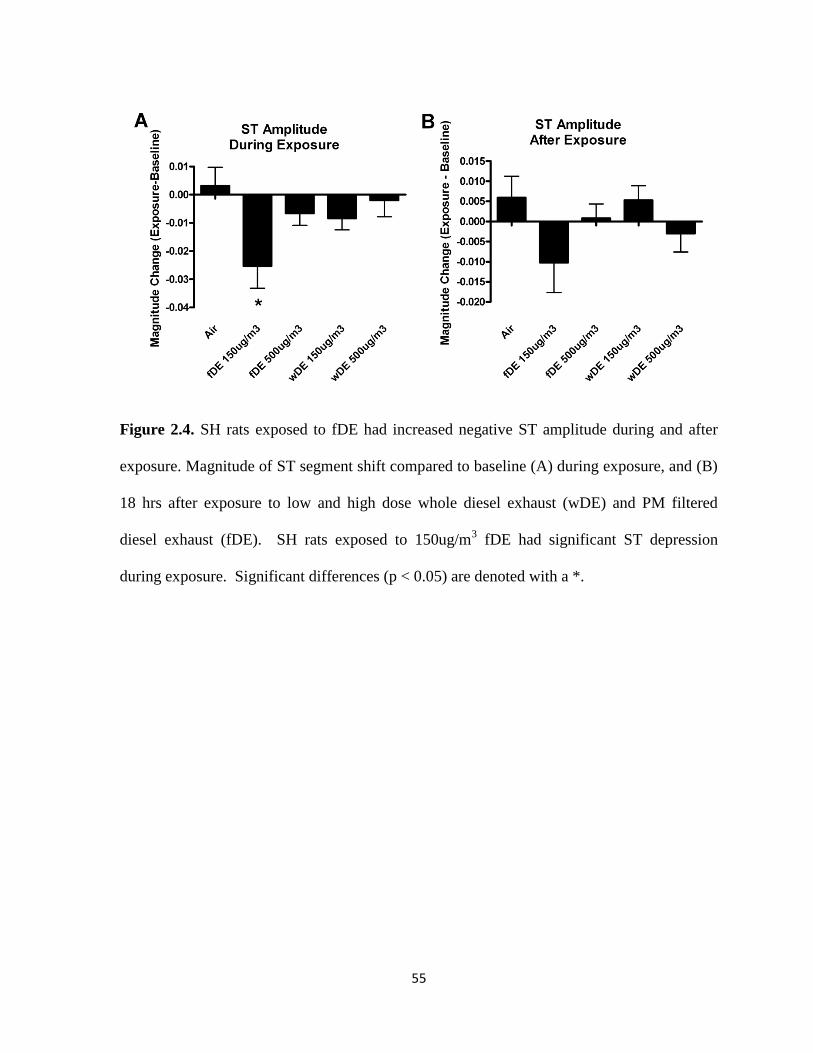
55
Figure 2.4. SH rats exposed to fDE had increased negative ST amplitude during and after
exposure. Magnitude of ST segment shift compared to baseline (A) during exposure, and (B)
18 hrs after exposure to low and high dose whole diesel exhaust (wDE) and PM filtered
diesel exhaust (fDE). SH rats exposed to 150ug/m3 fDE had significant ST depression
during exposure. Significant differences (p < 0.05) are denoted with a *.
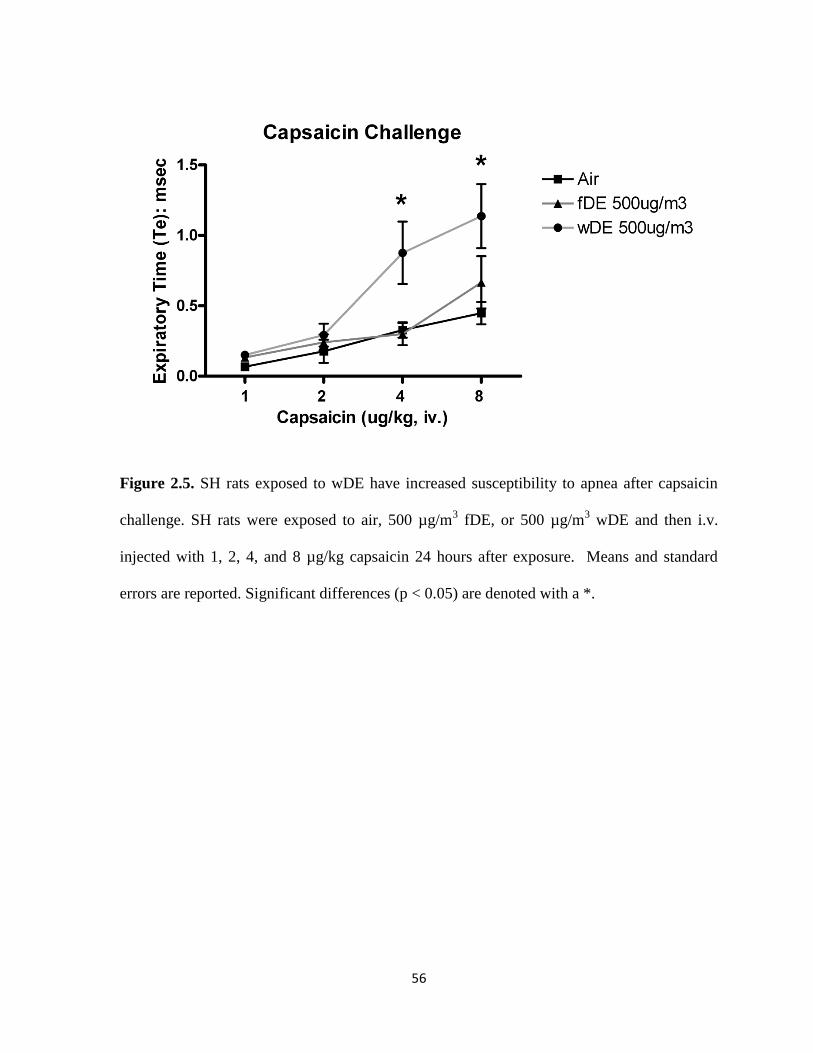
56
Figure 2.5. SH rats exposed to wDE have increased susceptibility to apnea after capsaicin
challenge. SH rats were exposed to air, 500 µg/m3 fDE, or 500 µg/m
3 wDE and then i.v.
injected with 1, 2, 4, and 8 µg/kg capsaicin 24 hours after exposure. Means and standard
errors are reported. Significant differences (p < 0.05) are denoted with a *.
Chapter 3
Hypoxia Stress Test Reveals Exaggerated Cardiovascular Effects in Hypertensive Rats after
Exposure to the Air Pollutant Acrolein
Exposure to air pollution increases the risk of cardiovascular morbidity and mortality,
especially in susceptible populations with cardiovascular disease. Despite increased risk,
adverse responses are often delayed and require additional stress tests to reveal latent effects
of exposure. The goal of this study was to use an episode of “transient hypoxia” as an
extrinsic stressor to uncover latent susceptibility to environmental pollutants in a rodent
model of hypertension. We hypothesized that exposure to acrolein, an unsaturated aldehyde
and mucosal irritant found in cigarette smoke, diesel exhaust, and power plant emissions
would increase cardiopulmonary sensitivity to hypoxia, particularly in hypertensive rats.
Spontaneously hypertensive (SH) and Wistar Kyoto (WKY; normotensive) rats, implanted
with radiotelemeters, were exposed once for 3 hours to 3 ppm acrolein gas or filtered air in
whole body plethysmograph chambers and challenged with a 10% oxygen atmosphere (10
minutes) 24 hours later. Acrolein exposure increased heart rate, blood pressure, breathing
frequency, and minute volume in hypertensive rats and also increased the heart rate
variability parameter LF, suggesting a potential role for increased sympathetic tone.
Normotensive rats only had increased blood pressure during acrolein exposure. The hypoxia
stress test after acrolein exposure revealed increased diastolic blood pressure only in
hypertensive rats and increased minute volume and expiratory time only in normotensive
rats. These results suggest that hypertension confers exaggerated sensitivity to air pollution
58
and that the hypoxia stress test is a novel tool to reveal the potential latent effects of air
pollution exposure.
Introduction
Exposure to air pollution increases cardiovascular morbidity and mortality, especially
in individuals with pre-existing cardiovascular diseases (Brook et al., 2010).
Epidemiological studies indicate that these effects are not immediate, usually manifesting
some time after exposure. For example, Peters et al. (2004) showed that humans exposed to
traffic were more susceptible to myocardial infarction up to 24 hours after exposure. In
addition, patients with implanted cardioverter defibrillators had increased incidence of life-
threatening arrhythmias up to 2 days after air pollution exposure (Peters et al., 2000). These
findings suggest that exposure to air pollution alters cardiovascular physiology and increases
conditional susceptibility to triggers of thrombosis and arrhythmia. Moreover, the fact that
these effects happen at lower exposure concentrations than those shown to elicit effects in
animal studies indicates that the responses are more complicated than the standard monotonic
dose-response relationship of traditional toxicology. The reduced capacity to compensate to
daily stressors may account for the “lagged” responses associated with air pollution
exposure. The study of the factors that determine the capacity to compensate fully presents a
potentially informative approach when seeking to uncover and explain the latent effects of air
pollution exposure.
A stress test is a common way to reveal enhanced sensitivity or the potential for
adverse responses because increased cardiovascular effort causes reduced oxygen availability
to tissues and may provoke autonomic imbalance (Goldberger et al., 2006). Numerous
59
studies have shown that stress tests trigger many adverse cardiovascular effects including
increased cardiac arrhythmias and deleterious changes in heart rate (HR), heart rate
variability (HRV), an indirect indicator of cardiac autonomic tone, and ECG parameters
(Watanabe et al., 2001). Recently, exercise stress was used to demonstrate that exposure to
diesel exhaust during exercise in men with coronary artery disease caused myocardial
ischemia (Mills et al., 2007). Analogous effects, including increases in cardiac arrhythmia
and myocardial ischemia, were demonstrated in rats infused with the sympathomimetic
dobutamine one day after exposure to diesel exhaust (Hazari et al., 2012). In addition, rats
exposed to particulate matter or acrolein had exaggerated sensitivity to aconitine, an agent
that causes myocardial calcium loading (Hazari et al., 2009). These results are consistent
with epidemiological evidence for a time lag in responses and highlight the value of stress
tests in unmasking latent responses.
We have previously demonstrated that exposure to both particulate or gaseous air
pollutants, including acrolein, causes exaggerated cardiovascular effects in rat models of
hypertension and heart failure (Carll et al., 2012; Farraj et al., 2011; Hazari et al., 2009;
Lamb et al., 2012). While the mechanisms responsible for these effects are unclear, recent
work by Wang et al. (2012) demonstrated that cardiac arrhythmias in particulate-exposed
heart failure mice were in part due to altered sensitivity of the carotid body, a key organ
involved in oxygen sensing and initiating reflex cardiopulmonary changes to maintain
homeostasis. Furthermore, exposures to the air pollutants tobacco smoke (Adgent, 2006),
sulfur dioxide and nitrogen dioxide (Hoppenbrouwers et al., 1981) have been linked to
abnormal cardiopulmonary sensitivity responses to hypoxia. These findings suggest that the
response to hypoxia may be useful in unmasking the latent effects of air pollution. The
60
purpose of this study was to: 1) examine the utility of a novel hypoxia stress test in revealing
the potential latent effects of air pollution, and 2) given that hypertensive individuals have
exaggerated sensitivity to low atmospheric oxygen (Yu et al., 1999), test the hypothesis that
acrolein exposure will modify the response to hypoxia in hypertensive, but not normal rats.
HR, blood pressure, ECG, and HRV were measured during acrolein exposure and one day
later during hypoxia challenge.
Materials and Methods
Animals
Twelve week-old male Spontaneously Hypertensive (SH) (n = 6) and Wistar Kyoto
(WKY) normotensive (n = 6) rats (Charles River, Raleigh, NC) were housed in plastic cages
(one per cage), maintained on a 12-hr light/dark cycle at approximately 22°C and 50%
relative humidity in our Association for Assessment and Accreditation of Laboratory Animal
Care-approved facility, and held for a minimum of 1 week before exposure. Food (Prolab
RMH 3000; PMI Nutrition International, St. Louis, MO) and water were provided ad libitum,
and all rats were randomized by weight. After all experiments were performed, rats were
deeply anesthetized with an intraperitoneal injection of Euthasol (200 mg/kg Na
pentobarbital and 25 mg/kg phenytoin; Virbac Animal Health, Fort Worth, TX) and
euthanized by exsanguination. The Institutional Animal Care and Use Committee of the U.S.
Environmental Protection Agency (US EPA) approved all protocols.

61
Telemeter Implantation
Animals were implanted with radiotelemetry transmitters to monitor heart rate (HR),
blood pressure (BP), and heart rhythms and electrocardiographic intervals (Model TL11M2-
C50-PXT; Data Science International, Inc., St. Paul, MN). Charles River Laboratories
performed all telemetry implantation surgeries in accordance with methods specified by the
vendor (Charles River Laboratories, 2005). Animals were shipped to the US EPA 10 days
after implantation surgeries, and animals were allowed to recover for 1 week at the US EPA
before exposures began.
A separate cohort of SH (n = 5) and WKY (n = 5) rats were implanted with femoral
artery catheters in accordance with methods specified by the vendor (Charles River
Laboratories, 2005). Animals were shipped to the US EPA within 1 week of surgery. The
catheters were flushed with saline, locked with heparin and plugged immediately upon
arrival and every two days thereafter until exposure began.
Acrolein Exposure and Hypoxia Stress Test
A paired design was utilized to control for baseline differences in HR, BP, and ECG
rhythms between rats. SH and WKY rats were first exposed to air control for 3 hours and
then underwent a hypoxia stress test 24 hours later. The hypoxia stress test was performed 24
hours after acrolein exposure to uncover latent responses consistent with the delay between
exposure and adverse health effect observed in some epidemiological studies (Peters et al.,
2000; Peters et al., 2004). Exposure to subatmospheric oxygen has been used as a stress test
in humans with hypertension to demonstrate exaggerated cardiorespiratory responses to
hypoxia (Ledderhos et al., 2002). After 5 days, these same rats were exposed to 3 ppm
62
acrolein for 3 hours and then underwent a second hypoxia stress test 24 hours later (Please
refer to Figure 3.3A). We assumed that a period of 5 days between the initial hypoxia stress
test and the subsequent exposures would allow residual effects, if any, of the initial hypoxia
stress test to lapse. This was confirmed by the absence of any differences in air-exposed rats
at baseline relative to the previous air and hypoxia exposures.
All exposures (air and acrolein) as well as the hypoxia stress test took place in whole
body plethysmography chambers (WBP; Model PLY3213, Buxco Electronics, Inc,
Wilmington, NC), which continuously and non-invasively monitor ventilatory parameters in
conscious animals. All rats were acclimated to the chambers for 1 hour on the two days prior
to both air and acrolein exposure. On exposure days, rats were allowed to acclimate to
exposure chambers for 30 minutes, and then baseline data were recorded for the next 30
minutes. For air exposure, rats were exposed to filtered air in whole-body plethysmography
chambers for 3 hours. HR, systolic and diastolic BP, ECG waveforms, and ventilatory data
were collected during the entire exposure period. After exposure, animals were returned to
their home cages. Twenty-four hours after air exposure, animals underwent a hypoxia stress
test. Animals were placed in whole-body plethysmography chambers and allowed to
acclimate for 30 minutes. A 30 minute baseline was then recorded. After baseline
measurements, animals were kept at 20% oxygen concentration (ambient O2 concentration)
for 5 minutes before the hypoxia stress test. To reduce the PO2 in the chamber, 100%
nitrogen (N2) gas was delivered to a glass mixing chamber where the gas was mixed with dry
filtered air to achieve a fraction of inspired O2 (FIO2) of 10% at a flow rate of 2 L/min.
Oxygen levels were monitored continuously with an O2 sensor attached directly to the
chamber, and an FIO2 of 10% was maintained for 10 minutes. Nitrogen was then turned off,

63
and the FIO2 oxygen saturation rose to 20% (Figure 3.3B). Rats were then kept in the
chambers for an additional 15 minutes. HR, systolic and diastolic BP, ECG waveforms, and
ventilatory data were collected continuously during the stress test.
Five days after air exposure and the hypoxia stress test when all latent
preconditioning was absent, these same rats were exposed to 3 ppm acrolein for 3 hours in
the same whole-body plethysmography chambers. The concentration of acrolein (3 ppm) is
higher than ambient levels, but it may represent concentrations in high combustion areas
(Hazari et al., 2008). In addition, cigarette smoke contains up to 90 ppm acrolein (Esterbauer
et al., 1991), and acrolein levels in sidestream tobacco smoke are as high as 10 ppm
(Esterbauer et al., 1991). Acrolein gas was metered from a 1000 ppm cylinder into a glass
mixing chamber where the gas was mixed with dry filtered dilution air to achieve a final
concentration of 3 ppm of acrolein with a total flow of 6 L/min. The actual chamber
concentration was measured using an HP5890 gas chromatograph (GMI Inc., Ramsey, MN)
equipped with manual injection, a flame ionization detector and a DB-VRX capillary
column. The plethysmograph pressure was monitored using Biosystems XA software
(Buxco Electronics, Inc, Wilmington, NC). Using respiratory-induced fluctuations in
ambient pressure, respiratory parameters including tidal volume, breathing frequency,
inspiratory time and expiratory time were calculated and recorded on a breath-by-breath basis
and averaged over 10 second intervals. HR, systolic and diastolic BP, ECG waveforms, and
ventilatory data were collected during the exposure, and animals were returned to their home
cages after exposure. Rats underwent a hypoxia stress test 24 hours later as previously
described. Because the data collected were repeated measures, the data during acrolein
64
exposure and the subsequent hypoxia stress test are presented as % change from air exposure
and the initial hypoxia stress test, respectively.
Validation of Hypoxia Stress Test
The hypoxia stress test was validated by measuring arterial blood O2 saturation
(SaO2) during hypoxia challenge in a separate cohort of rats. Rats implanted with femoral
artery catheters were acclimated to whole body plethysmography chambers (WBP; Model
PLY3213, Buxco Electronics, Inc, Wilmington, NC), for 1 hour on the two days prior to
hypoxia validation. On the day of validation, the exteriorized catheter was extended with a 1
ml PE50 catheter attached to a 23 gauge adapter and run through a pre-measured hole in the
wall of the plethysmograph to allow for blood draws outside of the sealed exposure chamber.
Rats were acclimated to the exposure chambers for 30 minutes and then underwent a 250µl
blood draw while conscious and unrestrained within the chamber. This served as the
baseline blood sample. Nitrogen was metered into the chamber to reduce the FIO2 to 10%,
and a second 250µl blood sample was taken after the FIO2 stabilized at 10%. The addition
of N2 was discontinued, and a final 250µl blood sample was taken 15 minutes after the
oxygen content of the chamber stabilized at an FIO2 of 20%. For each blood draw, the pin
was removed from the tip of the catheter, and the heparin was allowed to exit the catheter.
When only blood remained, a 23-gauge adapter attached to a 1 ml syringe was placed on the
end of the catheter and used to draw a 250µl sample. The blood sample was immediately
read on an OPTI CCA-TS Blood Analyzer (OPTI Medical Systems, Inc.) using the OPTI
Cassette E-Ca which measures blood pH, PCO2, PO2, Na+, K
+, Ca
2+, total hemoglobin (tHb),
65
oxygen saturation (SaO2), and hematocrit (Hct). The catheter was flushed with saline and
locked with heparin after each blood draw.
Whole-body Plethysmograph Data Acquisition and Analysis
All exposures were performed in whole-body plethysmography chambers (Buxco
Electronics, Sharon, CT). The plethysmography methodology permitted continuous
monitoring of breathing frequency, tidal volume, minute volume, inspiratory time and
expiratory time. Animals were acclimated to plethysmographs for 1 hour each day on the two
days prior to exposure before both air and acrolein exposure. Plethysmography chambers
(model PLY3213; Buxco Electronics) were calibrated each day before every animal loading.
A bias flow regulator delivered fresh air (1.8 L/min) to each cylindrical chamber, preventing
CO2 buildup within the chamber. Unrestrained animals were placed in individual cylindrical
plethysmograph boxes containing a built-in reference chamber for measuring respiration-
induced pressure fluctuations. Data were channeled to computer software (BioSystem XA;
Buxco Electronics) that calculated respiratory parameters. Data were collected continuously
for each parameter, and automated breath-by-breath analyses were performed using a
rejection algorithm to eliminate breaths that were outside a given range. On exposure day,
animals were acclimated to the chambers for 30 minutes before any readings were taken.
After acclimation, 30 minutes of baseline data were taken, and animals were exposed to
either control air or 3ppm acrolein for 3 hours. After exposure, rats were removed and
returned to home-cages.
66
Radiotelemetry Data Acquisition
Radiotelemetry methodology (Data Sciences International, Inc.) enabled constant
monitoring of ECG data in unrestrained, un-anesthetized rats from implantation until
euthanasia. Remote receivers (DataART3.01; Data Sciences International, Inc.) positioned
under the home cages, and under the plethysmographs during exposure collected the ECG
data and transferred it to the computer for storage. In home cages, sixty-second segments of
ECG waveforms were acquired and saved at 15-minute intervals from surgical recovery
through euthanasia not including the exposure period. Pre-exposure baseline data were
collected from home cages, as well as a 30 min baseline in exposure cages after a 30 min
acclimation period. During the 3 hr exposure, sixty-second segments were acquired and
saved at 5-minute intervals. After exposure, rats were monitored in home cages until
euthanasia, approximately 18 hrs after the end of the final hypoxia challenge. HR and BP
were automatically obtained from the ECG and BP waveforms, respectively, with data
acquisition software (DataART3.01; Data Sciences International, Inc.).
Electrocardiogram, Arrhythmia Identification and Heart Rate Variability (HRV) Analysis
ECGAuto software (EMKA Technologies, Falls Church, VA) was used for automated
analyses of ECG wave amplitudes and segment durations and areas, as well as for the visual
identification and enumeration of cardiac arrhythmias. Several parameters were determined
for each ECG waveform: PR interval; R amplitude and duration; QRS area; ST interval,
amplitude, and area; and T-wave amplitude and
area; QT interval, and heart
rate-corrected QT
interval (QTc). ECG parameters during exposure were analyzed in terms of baseline (30 min

67
recordings while in the exposure chambers immediately before the beginning
of exposure)
and Hours 1–3 (constituting the entire exposure period between 8:00 AM and 11:00 AM).
Cardiac arrhythmic events were identified in part by using the Lambeth conventions
(Walker et al., 1988) as a guideline for the identification of arrhythmias in rats. Arrhythmias
were identified as atrial premature beats (APB), ventricular premature beats (VPB), sinoatrial
blocks (SAB), atrioventricular blocks (AVB), or ventricular tachycardia (VT). Arrhythmias
were quantified, counted and totaled over an 18 hour period prior to exposure (this
corresponded to the same times assessed after exposure), during the 4 hour exposure period,
or during the 18 hour period beginning immediately after exposure. Total arrhythmia counts
during exposure were quantified (total of 48 two-minute segments during 3 h exposure
period) and expressed as counts per minute.
For the analysis of HRV, thorough visual inspection was conducted to identify and
exclude arrhythmias, artifacts, and 1-min ECG waveforms lacking distinguishable R waves
for more than 30 sec. The analysis of HRV generated heart rate (HR) and
time-domain
measures, including mean time between adjacent QRS complex peaks (the RR interval), a
standard deviation of the RR interval (SDNN), SDNN normalized for the effects of heart
rate
[SDNN/(RR interval x 100)], and the square root of the mean of squared differences of
adjacent RR intervals (RMSSD). The SDNN represents overall HRV, whereas RMSSD
represents parasympathetic influence over HR. The
analysis of HRV also calculated
frequency domain parameters, particularly low frequency (LF) and high frequency (HF), and
the ratio of these two frequency domains (LF/HF). LF is generally believed to represent a
mixture of sympathetic and parasympathetic tone, whereas HF indicates cardiac
parasympathetic (vagal) tone, and LF/HF serves as an index of sympathovagal balance.

68
Statistics
The statistical analyses of the Buxco, ECG and HRV data in this study used SAS
version 9.2 software (SAS Institute Inc, Cary NC). We used PROC MIXED of SAS since it
offers greater flexibility for the modeling of repeated measures data than PROC GLM. It is
also suitable for analysis of large, unbalanced data with missing data at random. A linear
mixed model with restricted maximum-likelihood estimation analysis, least squares means
and repeated measures ANOVA was used to determine which TIME*TRT interactions were
statistically significant between baseline and exposure. Multiple comparison adjustment for
the p values and confidence limits for the differences between the least squares means was
done using adjust=Tukey HSD (Honest Significant Difference) test. All blood gas data were
analyzed using GraphPad Prism (GraphPad Software, Inc., La Jolla, CA) with a one-way
analysis of variance (ANOVA) model examining the main effects of each model. All strain
comparisons were performed using GraphPad Prism (GraphPad Software, Inc., La Jolla, CA)
with a student t-test. Trend analysis of SDNN data during exposure and HR data during
hypoxia challenge was performed using GraphPad Prism (GraphPad Software, Inc., La Jolla,
CA) with a one-way ANOVA followed by a post-hoc test for linear trend between mean and
column number. P < 0.05 was considered statistically significant.
Results
Effect of Acrolein on Heart Rate, Blood Pressure, and Heart Rate Variability
Heart rates increased in SH rats during all three hours of acrolein exposure (Fig.
3.1A). At hour 1, mean heart rates increased from baseline levels of 294.4 ± 5.4 beats per

69
minute (bpm) to 313.3 ± 15.3 bpm. At hour 2, mean heart rates increased from baseline
levels of 269.2 ± 3.9 bpm to 297.7 ± 16.0 bpm. At hour 3, mean heart rates increased from
baseline levels of 274.1 ± 6.7 bpm to 305 ± 16.7 bpm. When each acrolein exposed rat is
compared to itself during air exposure these changes constituted a 10.3 ± 4.22% increase
from air at hour 1, a 10.8 ± 4.57% increase from air at hour 2 and a 14.6 ± 3.17% increase
from air at hour 3 (p<0.05; Fig. 3.1A). Heart rate did not change in WKY rats during acrolein
exposure.
Before exposures commenced, the baseline BP values for all rats were calculated and
it was determined that SH rats had an average of 44 mmHg higher baseline mean arterial
blood pressure level than WKY rats (162.46 ± 3.71 mmHg v. 118.57 ± 4.26 mmHg,
respectively), consistent with their hypertensive phenotype. Mean arterial blood pressure
increased during hour 2 of acrolein exposure in SH rats and during hour 3 of acrolein
exposure in both SH and WKY rats (Fig. 3.1B). In SH rats, mean arterial blood pressure
increased from baseline levels of 150.20 ± 2.35 mmHg to 169.65 ± 4.04 mmHg at hour 2,
constituting a 15.19 ± 2.51% increase from air (p<0.05; Fig. 3.1B). At hour 3, mean arterial
blood pressure increased from baseline levels of 154.14 ± 2.07 mmHg to 189.32 ± 4.06
mmHg, constituting a 23.67 ± 2.79% increase from air in SH rats (p<0.05; Fig. 3.1B). The
increases in mean arterial blood pressure at hour 3 were accompanied by 22.86 ± 3.38% and
23.31 ± 3.30% increases in systolic and diastolic blood pressure, respectively. In WKY rats,
blood pressure significantly increased from baseline levels of 120.15 ± 2.74 mmHg to 130.24
± 5.38 mmHg at hour 3, constituting a 14.44 ± 2.55% increase from air (p<0.05; Fig. 3.1B).
SH rats also had a significant increase in the low frequency (LF) heart rate variability
parameter during hour 3 of acrolein exposure (Fig. IC). LF increased from baseline levels of
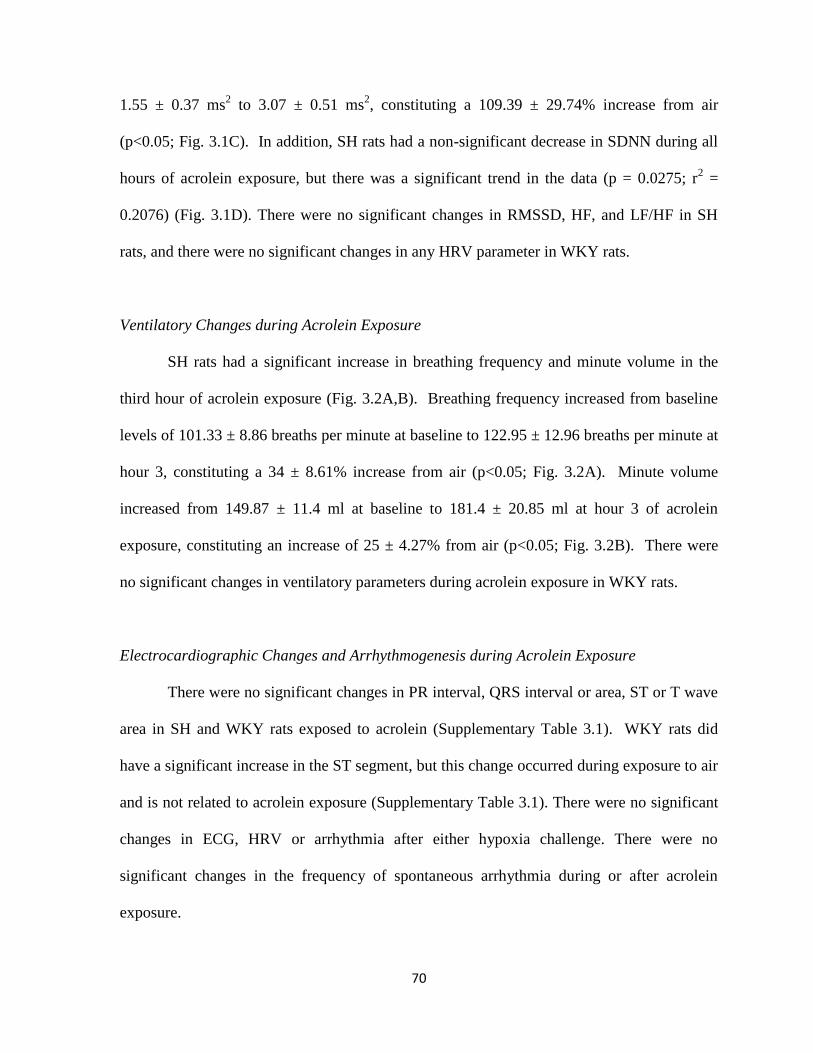
70
1.55 ± 0.37 ms2 to 3.07 ± 0.51 ms
2, constituting a 109.39 ± 29.74% increase from air
(p<0.05; Fig. 3.1C). In addition, SH rats had a non-significant decrease in SDNN during all
hours of acrolein exposure, but there was a significant trend in the data (p = 0.0275; r2 =
0.2076) (Fig. 3.1D). There were no significant changes in RMSSD, HF, and LF/HF in SH
rats, and there were no significant changes in any HRV parameter in WKY rats.
Ventilatory Changes during Acrolein Exposure
SH rats had a significant increase in breathing frequency and minute volume in the
third hour of acrolein exposure (Fig. 3.2A,B). Breathing frequency increased from baseline
levels of 101.33 ± 8.86 breaths per minute at baseline to 122.95 ± 12.96 breaths per minute at
hour 3, constituting a 34 ± 8.61% increase from air (p<0.05; Fig. 3.2A). Minute volume
increased from 149.87 ± 11.4 ml at baseline to 181.4 ± 20.85 ml at hour 3 of acrolein
exposure, constituting an increase of 25 ± 4.27% from air (p<0.05; Fig. 3.2B). There were
no significant changes in ventilatory parameters during acrolein exposure in WKY rats.
Electrocardiographic Changes and Arrhythmogenesis during Acrolein Exposure
There were no significant changes in PR interval, QRS interval or area, ST or T wave
area in SH and WKY rats exposed to acrolein (Supplementary Table 3.1). WKY rats did
have a significant increase in the ST segment, but this change occurred during exposure to air
and is not related to acrolein exposure (Supplementary Table 3.1). There were no significant
changes in ECG, HRV or arrhythmia after either hypoxia challenge. There were no
significant changes in the frequency of spontaneous arrhythmia during or after acrolein
exposure.
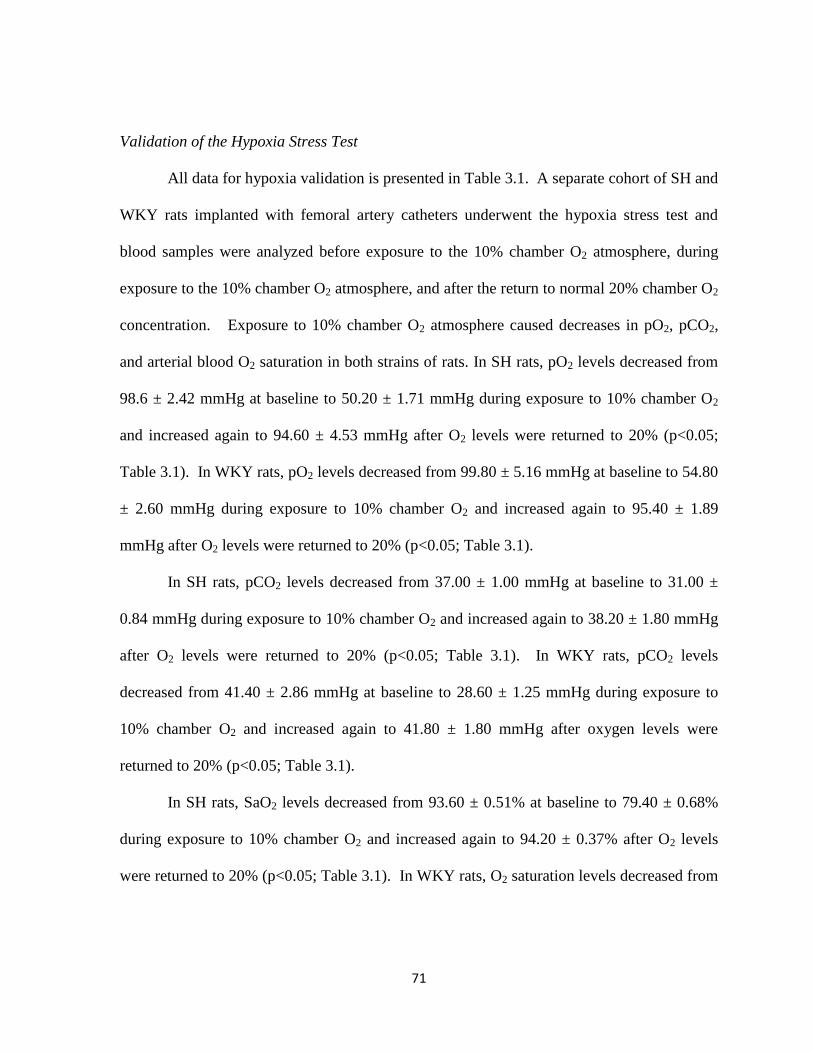
71
Validation of the Hypoxia Stress Test
All data for hypoxia validation is presented in Table 3.1. A separate cohort of SH and
WKY rats implanted with femoral artery catheters underwent the hypoxia stress test and
blood samples were analyzed before exposure to the 10% chamber O2 atmosphere, during
exposure to the 10% chamber O2 atmosphere, and after the return to normal 20% chamber O2
concentration. Exposure to 10% chamber O2 atmosphere caused decreases in pO2, pCO2,
and arterial blood O2 saturation in both strains of rats. In SH rats, pO2 levels decreased from
98.6 ± 2.42 mmHg at baseline to 50.20 ± 1.71 mmHg during exposure to 10% chamber O2
and increased again to 94.60 ± 4.53 mmHg after O2 levels were returned to 20% (p<0.05;
Table 3.1). In WKY rats, pO2 levels decreased from 99.80 ± 5.16 mmHg at baseline to 54.80
± 2.60 mmHg during exposure to 10% chamber O2 and increased again to 95.40 ± 1.89
mmHg after O2 levels were returned to 20% (p<0.05; Table 3.1).
In SH rats, pCO2 levels decreased from 37.00 ± 1.00 mmHg at baseline to 31.00 ±
0.84 mmHg during exposure to 10% chamber O2 and increased again to 38.20 ± 1.80 mmHg
after O2 levels were returned to 20% (p<0.05; Table 3.1). In WKY rats, pCO2 levels
decreased from 41.40 ± 2.86 mmHg at baseline to 28.60 ± 1.25 mmHg during exposure to
10% chamber O2 and increased again to 41.80 ± 1.80 mmHg after oxygen levels were
returned to 20% (p<0.05; Table 3.1).
In SH rats, SaO2 levels decreased from 93.60 ± 0.51% at baseline to 79.40 ± 0.68%
during exposure to 10% chamber O2 and increased again to 94.20 ± 0.37% after O2 levels
were returned to 20% (p<0.05; Table 3.1). In WKY rats, O2 saturation levels decreased from

72
94.60 ± 0.68% at baseline to 82.40 ± 0.68% during exposure to 10% chamber O2 and
increased again to 93.40 ± 0.40% after O2 levels were returned to 20% (p<0.05; Table 3.1).
Blood Pressure and Heart Rate Changes during Hypoxia Stress Test
Hypoxia stress test was initially performed 24 hours after a 3 hr exposure to air. The
10% chamber O2 concentration caused similar increases in heart rate in both the SH and
WKY rats during the hypoxia period but did not affect systolic blood pressure in either strain
(data not shown).
Hypoxia stress test after acrolein exposure caused a significant increase in diastolic
blood pressure during exposure to 10% chamber O2 in SH rats (p<0.05; Fig. 3.4A). Diastolic
blood pressure increased from 124.99 ± 5.16 mmHg at baseline to 135.99 ± 2.51 mmHg
during exposure to 10% chamber O2, constituting a 12.11 ± 2.23% increase from air (p<0.05;
Fig. 3.4A). The hypoxia stress test caused a non-significant decrease in heart rate during the
descend period, the time during which chamber O2 saturation decreases from 20% to 10%, in
the SH rat and a non-significant increase in heart rate during exposure to 10% chamber O2 in
WKY rats (Fig. 3.4B). In addition, SH rats displayed a higher baseline blood pressure than
WKY rats during the entire hypoxia stress test.
Respiratory Changes during Hypoxia Stress Test
Hypoxia stress test following air exposure increased breathing frequency and minute
volume in SH and WKY rats during the descent and hypoxia period of the stress test and
decreased expiratory time in SH and WKY rats during the descend period (data not shown).
The magnitudes of these changes were similar between the two strains.
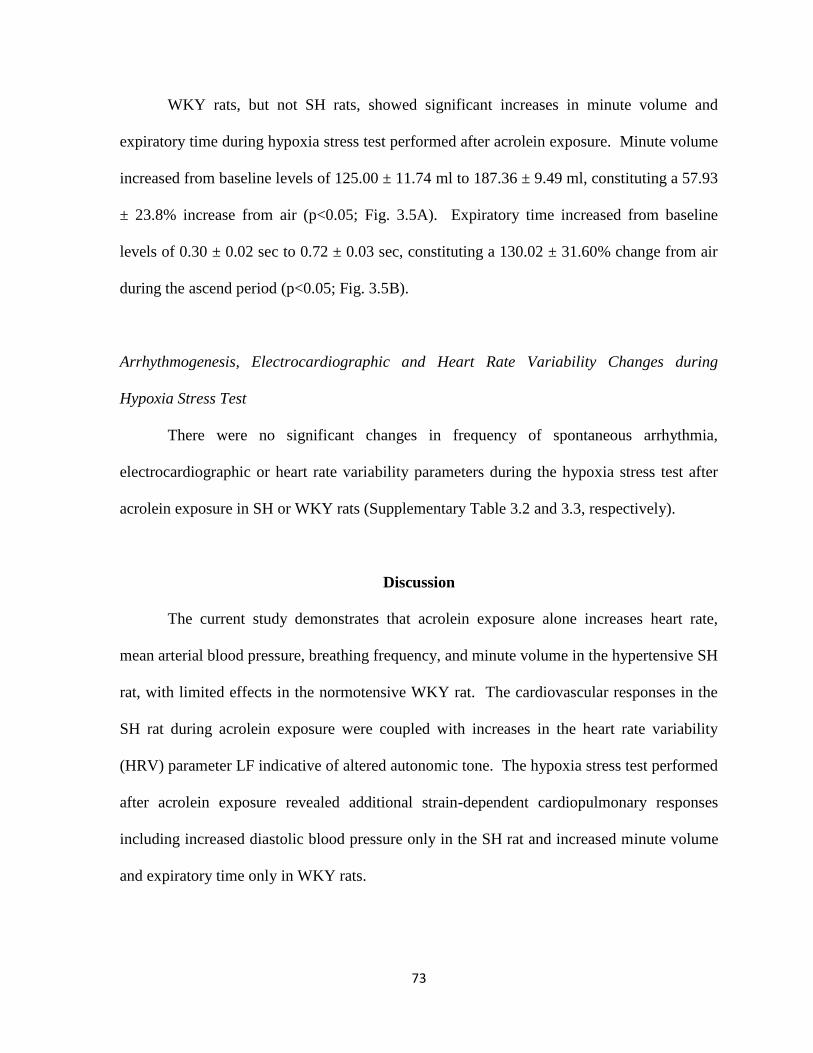
73
WKY rats, but not SH rats, showed significant increases in minute volume and
expiratory time during hypoxia stress test performed after acrolein exposure. Minute volume
increased from baseline levels of 125.00 ± 11.74 ml to 187.36 ± 9.49 ml, constituting a 57.93
± 23.8% increase from air (p<0.05; Fig. 3.5A). Expiratory time increased from baseline
levels of 0.30 ± 0.02 sec to 0.72 ± 0.03 sec, constituting a 130.02 ± 31.60% change from air
during the ascend period (p<0.05; Fig. 3.5B).
Arrhythmogenesis, Electrocardiographic and Heart Rate Variability Changes during
Hypoxia Stress Test
There were no significant changes in frequency of spontaneous arrhythmia,
electrocardiographic or heart rate variability parameters during the hypoxia stress test after
acrolein exposure in SH or WKY rats (Supplementary Table 3.2 and 3.3, respectively).
Discussion
The current study demonstrates that acrolein exposure alone increases heart rate,
mean arterial blood pressure, breathing frequency, and minute volume in the hypertensive SH
rat, with limited effects in the normotensive WKY rat. The cardiovascular responses in the
SH rat during acrolein exposure were coupled with increases in the heart rate variability
(HRV) parameter LF indicative of altered autonomic tone. The hypoxia stress test performed
after acrolein exposure revealed additional strain-dependent cardiopulmonary responses
including increased diastolic blood pressure only in the SH rat and increased minute volume
and expiratory time only in WKY rats.

74
The increases in HR and BP during acrolein exposure in the hypertensive rat may be
related to altered autonomic tone during exposure. While chronic exposure to acrolein in
mice has been linked to left ventricular dilation (Ismahil et al., 2011) and progression of
atherosclerosis (Srivastava et al., 2011), acute exposure to 3 ppm acrolein in this study
caused significant increases in HR in SH rats during all 3 hours of exposure. This was
accompanied by increases in BP and the LF component of HRV and, although not
statistically significant, a decrease in SDNN. These findings are consistent with elevated
sympathetic tone. Increased sympathetic tone coupled with decreased heart rate variability is
associated with an elevated risk of heart disease (Pope et al., 2001). While the implications
of these changes in rats are unclear, similar changes in humans are consistent with elevated
sympathetic tone. In addition, intravenous injection of acrolein causes significant increases in
blood pressure that are reversed with guanethidine, a sympatholytic drug (Green and Egle,
1983). Despite these findings, there were no significant changes in LF/HF, a measure of
sympathetic and parasympathetic balance. Furthermore, LF alone may not be a reliable
indicator of sympathetic tone and may instead reflect an interaction of the sympathetic and
parasympathetic nervous systems (Houle and Billman, 1999). Thus, further work is required
to confirm linkages with altered autonomic tone. Although WKY rats had a significant
increase in BP in the third hour of acrolein exposure, this response was not accompanied by
increases in HR or any significant changes in HRV.
The hypoxia stress test revealed exaggerated cardiovascular sensitivity, characterized
by increased diastolic blood pressure, only in acrolein-exposed SH rats. This response may
be due to increased vascular resistance, as in vivo acrolein exposure in SH rats has been
shown to increase ex vivo aortic reactivity (Conklin et al., 2006). Hypoxia has been shown to

75
heighten sympathetic activation in healthy men during periods of submaximal exercise (Al
Haddad et al., 2012). In addition, chronic intermittent hypoxia has been shown to increase
arterial blood pressure and impair vasodilation through increased levels of angiotensin II
(Marcus et al., 2012). Carotid body-mediated sensation of low blood oxygen saturation
levels triggers reflex cardiovascular responses including tachycardia, hypertension, and
increased cardiac output (Downing et al., 1962). SH rats have larger carotid bodies (Habeck
et al., 1985) and are more sensitive to the effects of hypoxia as evidenced by increased
carotid sinus nerve activity and intracellular Ca2+
changes (Weil et al., 1998). Thus,
differential carotid body sensitivity may in part underlie the differences in responses to
acrolein and hypoxia in normotensive and hypertensive rats. Recent work by Wang et al.
(2012) demonstrated that particulate matter exposure-induced cardiac arrhythmias in mice
with heart failure were in part due to dysregulation of carotid body sensitivity. Further
research is required to examine the impact of carotid body sensitivity and the potential effects
of air pollutant exposure on carotid body-mediated cardiovascular responses. Although the
ventilatory responses to hypoxia after the mock air exposure were similar in SH and WKY
rats, only WKY rats exposed to acrolein had significant increases in minute volume and
expiratory time during the hypoxia stress test. It is unclear exactly why these ventilatory
responses occurred only in WKY and not SH rats, but it may relate to the increased
respiratory sensitivity to air pollutant inhalation in the SH rat compared to the WKY rat.
Previous studies have shown that SH rats respond with greater airway inflammation and
injury after air pollution exposure than WKY rats, and underlying susceptibility in the SH rat
may result in the nerve fibers being overloaded and unable to illicit a normal response to
76
acrolein. An acrolein-induced airway lesion in the SH rat may have precluded a normal
ventilatory response to hypoxia during the hypoxia stress test (Leikauf et al., 1989).
These findings demonstrate that the hypoxia stress test is a novel approach to reveal
latent responses to air pollutants. Researchers are becoming increasingly interested in latent
responses to air pollution exposure, and stress tests provide a useful model to study latent
effects that would be missed in an acute exposure setting. Traditionally, epidemiological
studies have estimated morbidity and mortality within 24 hours of air pollution events.
Although this time frame reveals significant increases in cardiovascular events after air
pollution exposure, it may miss equally severe delayed responses that can occur up to 3 days
(Faustini et al., 2011) and even 2 weeks after exposure (Goodman et al., 2004). Several
stress tests have been used to determine enhanced sensitivity to air pollutants including
exercise stress test in humans (Gold et al., 2005), dobutamine stress test in rats (Hazari et al.,
2012) and isoproterenol cardiac stress test in rats (Andre et al., 2011). Intermittent hypoxia
has been used to model nocturnal desaturation in sleep apnea patients (Norton et al., 2011).
We designed a new hypoxia stress test with one prolonged (10 min) acute session of hypoxia
followed by a return to normoxic conditions. The effects of the 10% O2 atmosphere were
validated by measuring blood O2 saturation in arterial blood drawn before, during and after
hypoxia challenge. Arterial O2 saturation, pO2 and pCO2 decreased significantly during
hypoxia in both strains of rats. In addition, pH was not significantly affected by hypoxia
challenge, demonstrating that the rat completely compensates for the drop in pCO2,
suggesting that the effects are not due to metabolic acidosis. Normal pO2 levels in humans
range from 80-100 mmHg, and a drop in partial pressure below 60 mmHg is required for
hypoxemia. Normal pCO2 levels in the human range from 35-45 mmHg and the hypoxia

77
stress test reduced pCO2 levels well below this level. While the stress test was used in this
context to examine susceptibility after air pollution exposure, the data suggest that it can
easily be applied to different models to examine overall cardiovascular sensitivity.
The exaggerated effects of acrolein in the SH rats in this study are consistent with our
previous studies with other air pollutants indicating enhanced sensitivity in this strain (Farraj
et al., 2011; Lamb et al., 2012). In this study, SH rats had an average of 44 mmHg higher
blood pressure than WKY rats. It has long been known that hypertension increases the risk
of cardiovascular disease and stroke (Brook et al., 2010). In addition to higher baseline blood
pressure, SH rats have increased arterial wall thickness (Mulvany and Halpern, 1977) and
undergo left ventricular remodeling characterized by hypertrophy, fibrosis, and changes in
membrane channels, cellular energetics and ion regulation that combine to heighten
myocardial sensitivity (Bernardo et al., 2010). SH rats were not only more susceptible to HR
and BP increases during acrolein exposure, they also had significant increases in breathing
frequency and minute volume in the third hour of exposure. Previous studies have found that
acrolein, like other pulmonary irritants, causes decreases in respiratory rate (Hazari et al.,
2008). It is unclear why SH rats had increased breathing frequency at hour 3 of acrolein
exposure, but it’s possible that these responses were secondary to the significant increases in
HR and BP that were initiated during hours 1 and 2 of acrolein exposure. Minute volume
tends to increase with exercise or stress, and it has been shown to increase with acrolein
exposures (Linhart et al., 1996). Taken together, the results demonstrate that the SH rat has
increased susceptibility to the adverse effects of acrolein exposure including cardiovascular
effects that appear directly and immediately as well as a priming effects through homeostatic
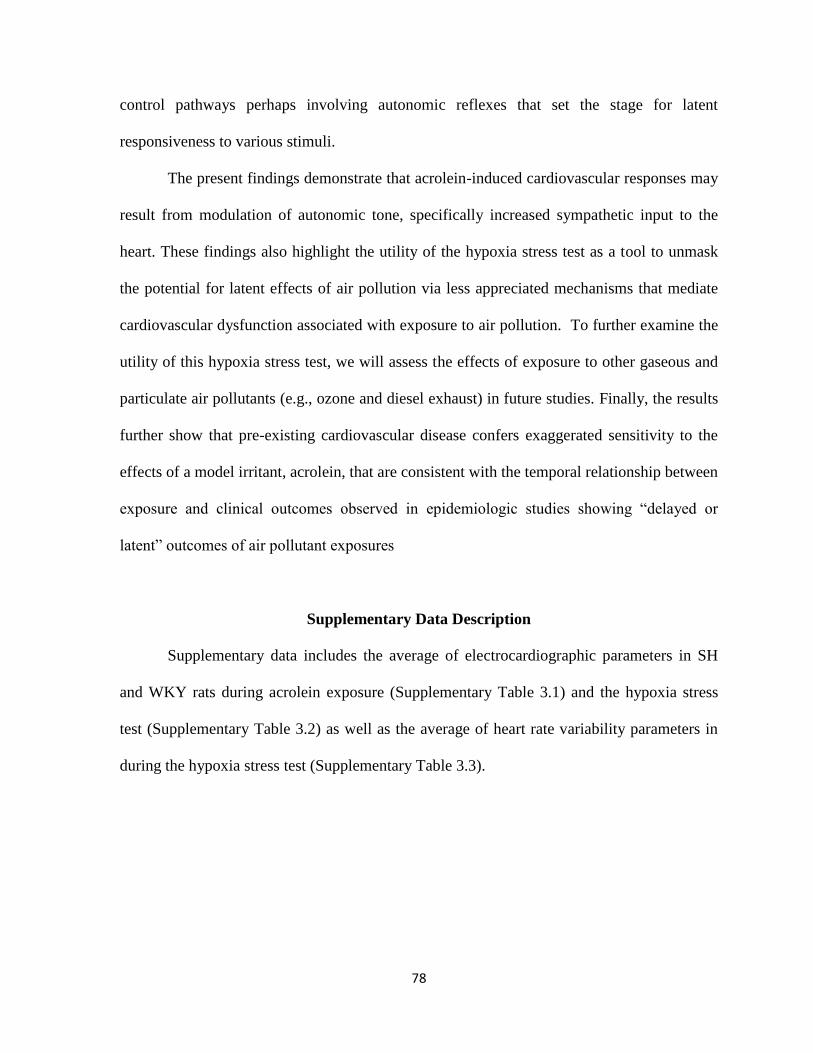
78
control pathways perhaps involving autonomic reflexes that set the stage for latent
responsiveness to various stimuli.
The present findings demonstrate that acrolein-induced cardiovascular responses may
result from modulation of autonomic tone, specifically increased sympathetic input to the
heart. These findings also highlight the utility of the hypoxia stress test as a tool to unmask
the potential for latent effects of air pollution via less appreciated mechanisms that mediate
cardiovascular dysfunction associated with exposure to air pollution. To further examine the
utility of this hypoxia stress test, we will assess the effects of exposure to other gaseous and
particulate air pollutants (e.g., ozone and diesel exhaust) in future studies. Finally, the results
further show that pre-existing cardiovascular disease confers exaggerated sensitivity to the
effects of a model irritant, acrolein, that are consistent with the temporal relationship between
exposure and clinical outcomes observed in epidemiologic studies showing “delayed or
latent” outcomes of air pollutant exposures
Supplementary Data Description
Supplementary data includes the average of electrocardiographic parameters in SH
and WKY rats during acrolein exposure (Supplementary Table 3.1) and the hypoxia stress
test (Supplementary Table 3.2) as well as the average of heart rate variability parameters in
during the hypoxia stress test (Supplementary Table 3.3).
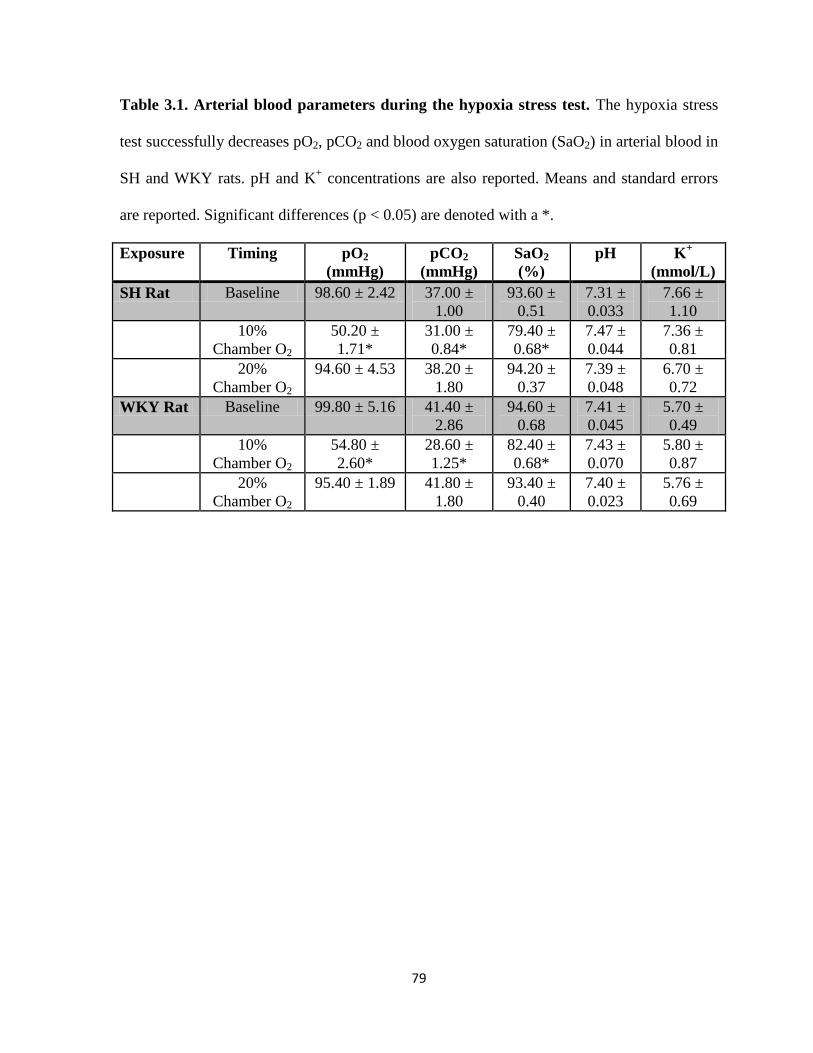
79
Table 3.1. Arterial blood parameters during the hypoxia stress test. The hypoxia stress
test successfully decreases pO2, pCO2 and blood oxygen saturation (SaO2) in arterial blood in
SH and WKY rats. pH and K+ concentrations are also reported. Means and standard errors
are reported. Significant differences (p < 0.05) are denoted with a *.
Exposure Timing pO2
(mmHg)
pCO2
(mmHg)
SaO2
(%)
pH K+
(mmol/L)
SH Rat Baseline 98.60 ± 2.42 37.00 ±
1.00
93.60 ±
0.51
7.31 ±
0.033
7.66 ±
1.10
10%
Chamber O2
50.20 ±
1.71*
31.00 ±
0.84*
79.40 ±
0.68*
7.47 ±
0.044
7.36 ±
0.81
20%
Chamber O2
94.60 ± 4.53 38.20 ±
1.80
94.20 ±
0.37
7.39 ±
0.048
6.70 ±
0.72
WKY Rat Baseline 99.80 ± 5.16 41.40 ±
2.86
94.60 ±
0.68
7.41 ±
0.045
5.70 ±
0.49
10%
Chamber O2
54.80 ±
2.60*
28.60 ±
1.25*
82.40 ±
0.68*
7.43 ±
0.070
5.80 ±
0.87
20%
Chamber O2
95.40 ± 1.89 41.80 ±
1.80
93.40 ±
0.40
7.40 ±
0.023
5.76 ±
0.69

80
Figure 3.1. Acrolein exposure causes increases in heart rate, mean arterial blood pressure,
and the low frequency component of heart rate variability in SH rats. Panels A, B, C and D
relate to heart rate, blood pressure, low frequency and SDNN values at baseline and all three
hours of acrolein exposure, respectively. Panels A, B, C and D are presented as % change
from air. Percent change baseline values are compared to the average % change values
during each hour of exposure. Means and standard errors are reported. Significant differences
from baseline percent change values (p < 0.05) are denoted with a *. Significant differences
(p < 0.05) between SH and WKY strains at each hour are denoted with a #. There was a
significant trend in the SDNN data (p = 0.0275; r2
= 0.2076)
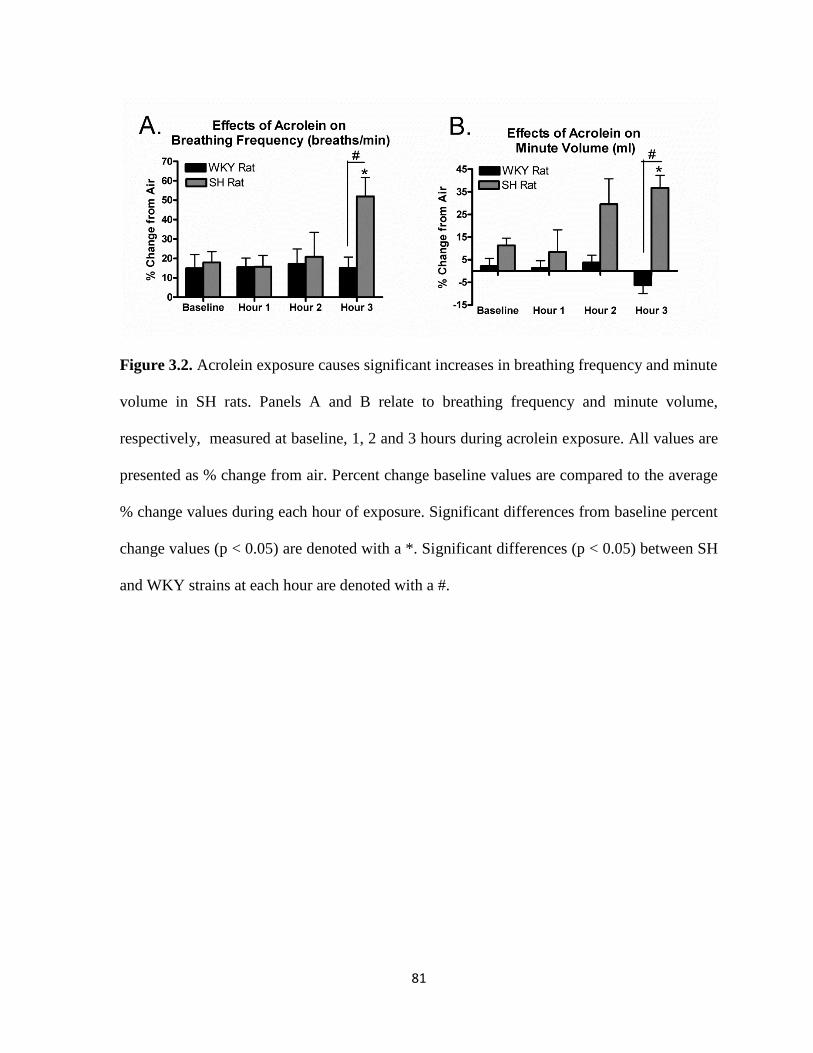
81
Figure 3.2. Acrolein exposure causes significant increases in breathing frequency and minute
volume in SH rats. Panels A and B relate to breathing frequency and minute volume,
respectively, measured at baseline, 1, 2 and 3 hours during acrolein exposure. All values are
presented as % change from air. Percent change baseline values are compared to the average
% change values during each hour of exposure. Significant differences from baseline percent
change values (p < 0.05) are denoted with a *. Significant differences (p < 0.05) between SH
and WKY strains at each hour are denoted with a #.
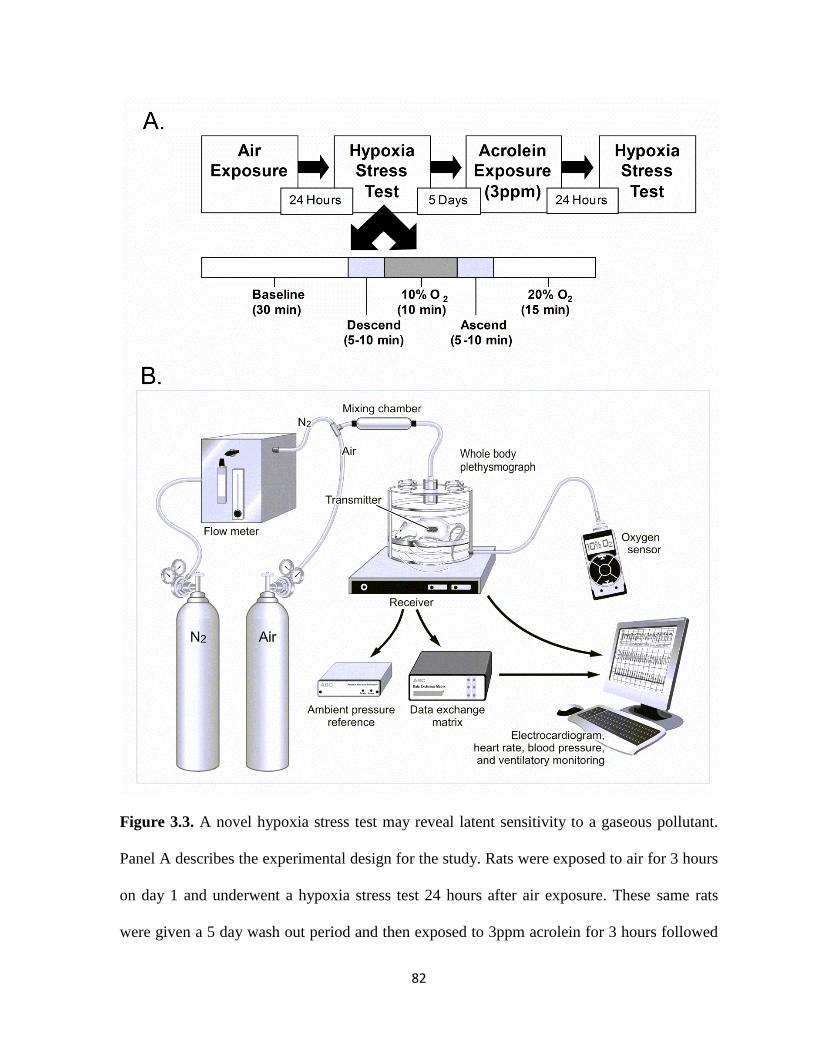
82
Figure 3.3. A novel hypoxia stress test may reveal latent sensitivity to a gaseous pollutant.
Panel A describes the experimental design for the study. Rats were exposed to air for 3 hours
on day 1 and underwent a hypoxia stress test 24 hours after air exposure. These same rats
were given a 5 day wash out period and then exposed to 3ppm acrolein for 3 hours followed
83
by a hypoxia stress test 24 hours after acrolein exposure. The hypoxia stress test consists of a
30 min baseline, the descend period (time it takes for oxygen saturation to decrease form
20% to 10%, a 10 min hypoxia period (10% oxygen saturation, an ascend period (time it
takes for oxygen saturation to increase from 10% to 20% and a 15 min period after the return
to normal oxygen saturation (20%). Panel B represent the hypoxia stress test experimental
setup. The rat is placed in a Buxco plethysmograph that sits over a radiotelemetry receiver.
Ventilatory, ECG, HR, and BP data is captured during the entire stress test. For hypoxia,
nitrogen in metered into the plethysmograph and an oxygen sensor attached to the
plethysmograph records oxygen saturation in real-time.

84
Figure 3.4. Hypoxia stress test after acrolein exposure causes significant increases in
diastolic blood pressure in SH rats. Panel A and B refer to diastolic blood pressure and heart
rate, respectively, measured at baseline, the descend period, 10% hypoxia, the ascend period
and the return to 20% oxygen saturation. All values are presented as % change from hypoxia
challenge after air exposure. Percent change baseline values are compared to the average %
change values during the different segments of the hypoxia challenge. Means and standard
errors are reported. Significant differences from baseline percent change values (p < 0.05) are
denoted with a *. Significant differences (p < 0.05) between SH and WKY strains at each
hour are denoted with an #.
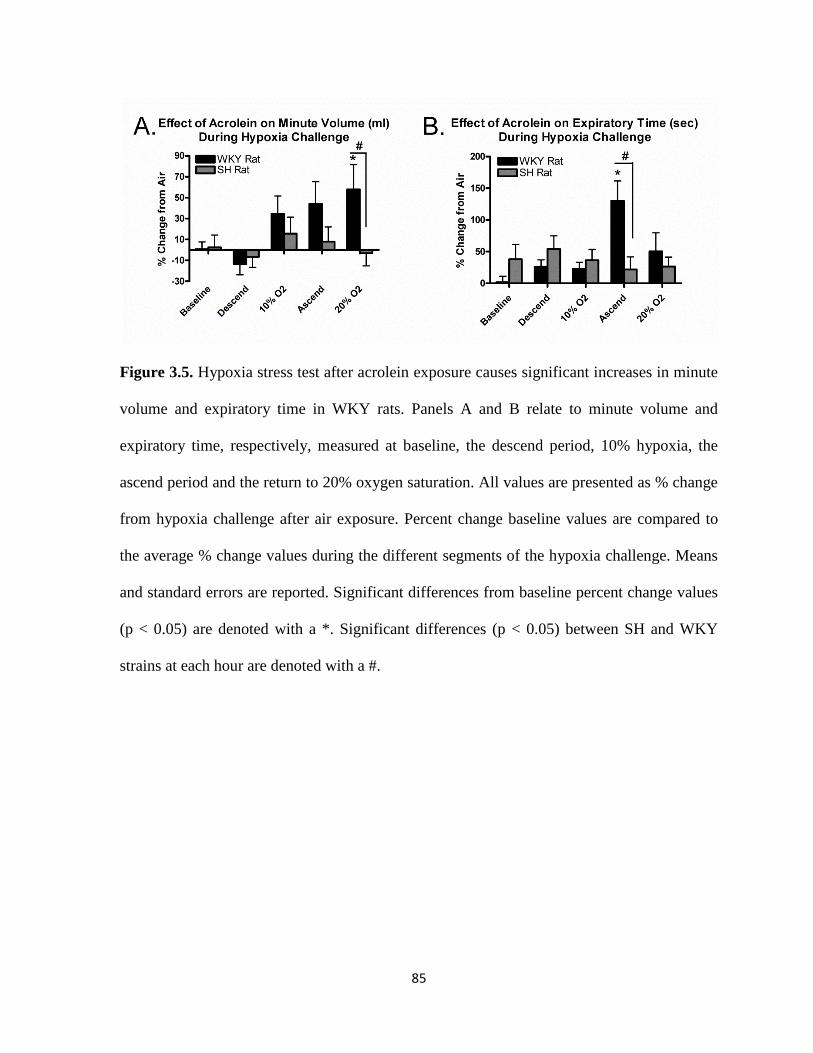
85
Figure 3.5. Hypoxia stress test after acrolein exposure causes significant increases in minute
volume and expiratory time in WKY rats. Panels A and B relate to minute volume and
expiratory time, respectively, measured at baseline, the descend period, 10% hypoxia, the
ascend period and the return to 20% oxygen saturation. All values are presented as % change
from hypoxia challenge after air exposure. Percent change baseline values are compared to
the average % change values during the different segments of the hypoxia challenge. Means
and standard errors are reported. Significant differences from baseline percent change values
(p < 0.05) are denoted with a *. Significant differences (p < 0.05) between SH and WKY
strains at each hour are denoted with a #.

86
Supplementary Data
Supplementary Table 3.1. 3 hour average of electrocardiographic parameters in
Spontaneously Hypertensive and Wistar Kyoto rats during acrolein exposure. * denotes a
significant change from baseline (p < 0.05). Values represent means ± standard error.
Exposure Timing PR
Interval
(ms)
QRS
Interval
(ms)
QTcB
(ms)
ST
Level
(mV)
ST
Element
(mV)
QRS
Area
(mV
x
Time)
Negative
ST Area
(mV x
sec)
T
Wave
Area
(mV
x sec)
SH Rat
Air
Baseline 47.53 ±
0.44
32.27 ±
1.63
85.62
± 2.20
-
0.055
±
0.01
-0.031 ±
0.01
1.67 ±
0.27
-0.82 ±
0.12
0.98
±
0.15
Exposure 47.97 ±
0.49
37.04 ±
2.68
80.81
± 0.83
-
0.052
±
0.01
-0.031 ±
0.01
1.93 ±
0.33
-0.82 ±
0.12
0.97
±
0.12
SH Rat
Acrolein
Baseline 47.13 ±
0.67
36.41 ±
2.60
88.06
± 0.71
-0.06
±
0.01
-0.04 ±
0.01
1.93 ±
0.30
-0.90 ±
0.13
0.93
±
0.30
Exposure 48.09 ±
0.90
39.34 ±
3.79
88.84
± 2.41
-0.05
±
0.28
-0.03 ±
0.01
2.27 ±
0.43
-0.82 ±
0.09
1.17
±
0.08
WKY
Rat Air
Baseline 46.46 ±
1.57
26.78 ±
3.98
64.57
± 1.85
-0.03
±
0.02
0.0002 ±
0.02
1.28 ±
0.27
-0.63 ±
0.19
2.50
±
0.60
Exposure 47.99 ±
1.35
25.08 ±
1.67
63.45
± 1.56
-0.02
±
0.01
0.01 ±
0.01*
1.11 ±
0.20
-0.46 ±
0.13
2.39
±
0.37
WKY
Rat
Acrolein
Baseline 45.86 ±
1.38
23.84 ±
0.77
63.79
± 2.70
-
0.027
±
0.01
0.01 ±
0.01
1.21 ±
0.23
-0.46 ±
0.11
2.41
±
0.55
Exposure 47.79 ±
1.38
27.83 ±
3.96
63.45
± 1.49
-0.02
±
0.01
0.01 ±
0.01
1.40 ±
0.20
-0.43 ±
0.11
2.17
±
0.38
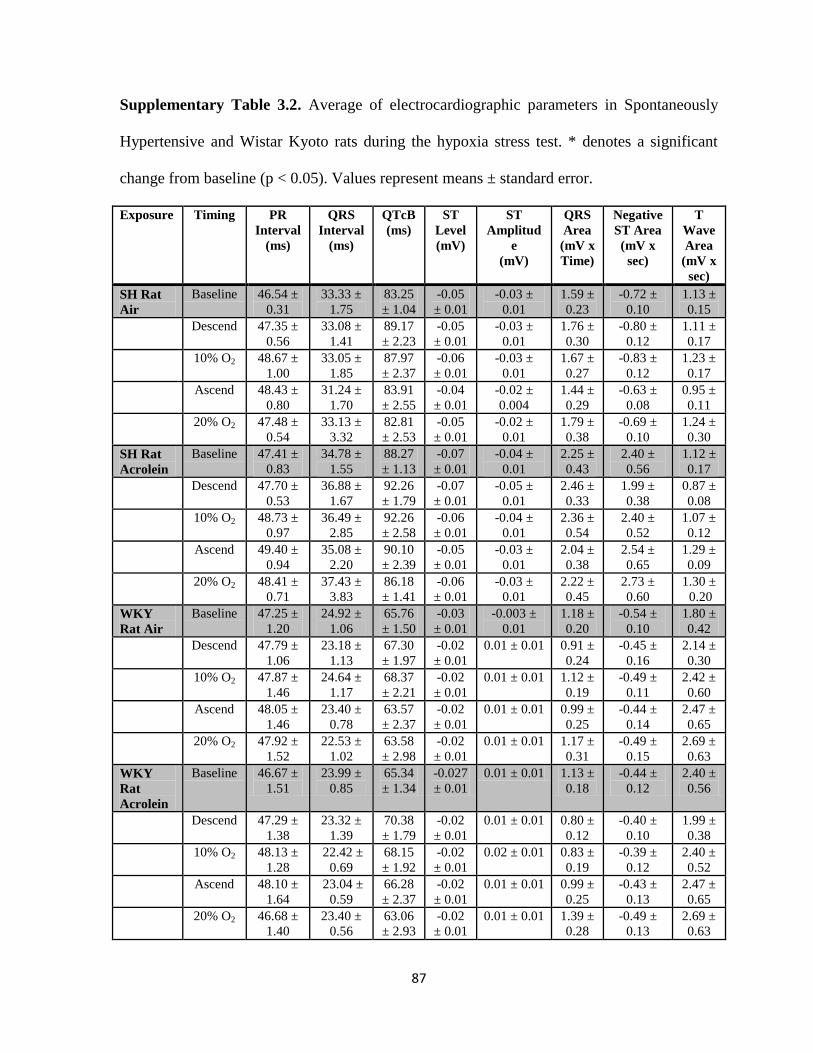
87
Supplementary Table 3.2. Average of electrocardiographic parameters in Spontaneously
Hypertensive and Wistar Kyoto rats during the hypoxia stress test. * denotes a significant
change from baseline (p < 0.05). Values represent means ± standard error.
Exposure Timing PR
Interval
(ms)
QRS
Interval
(ms)
QTcB
(ms)
ST
Level
(mV)
ST
Amplitud
e
(mV)
QRS
Area
(mV x
Time)
Negative
ST Area
(mV x
sec)
T
Wave
Area
(mV x
sec)
SH Rat
Air
Baseline 46.54 ±
0.31
33.33 ±
1.75
83.25
± 1.04
-0.05
± 0.01
-0.03 ±
0.01
1.59 ±
0.23
-0.72 ±
0.10
1.13 ±
0.15
Descend 47.35 ±
0.56
33.08 ±
1.41
89.17
± 2.23
-0.05
± 0.01
-0.03 ±
0.01
1.76 ±
0.30
-0.80 ±
0.12
1.11 ±
0.17
10% O2 48.67 ±
1.00
33.05 ±
1.85
87.97
± 2.37
-0.06
± 0.01
-0.03 ±
0.01
1.67 ±
0.27
-0.83 ±
0.12
1.23 ±
0.17
Ascend 48.43 ±
0.80
31.24 ±
1.70
83.91
± 2.55
-0.04
± 0.01
-0.02 ±
0.004
1.44 ±
0.29
-0.63 ±
0.08
0.95 ±
0.11
20% O2 47.48 ±
0.54
33.13 ±
3.32
82.81
± 2.53
-0.05
± 0.01
-0.02 ±
0.01
1.79 ±
0.38
-0.69 ±
0.10
1.24 ±
0.30
SH Rat
Acrolein
Baseline 47.41 ±
0.83
34.78 ±
1.55
88.27
± 1.13
-0.07
± 0.01
-0.04 ±
0.01
2.25 ±
0.43
2.40 ±
0.56
1.12 ±
0.17
Descend 47.70 ±
0.53
36.88 ±
1.67
92.26
± 1.79
-0.07
± 0.01
-0.05 ±
0.01
2.46 ±
0.33
1.99 ±
0.38
0.87 ±
0.08
10% O2
48.73 ±
0.97
36.49 ±
2.85
92.26
± 2.58
-0.06
± 0.01
-0.04 ±
0.01
2.36 ±
0.54
2.40 ±
0.52
1.07 ±
0.12
Ascend
49.40 ±
0.94
35.08 ±
2.20
90.10
± 2.39
-0.05
± 0.01
-0.03 ±
0.01
2.04 ±
0.38
2.54 ±
0.65
1.29 ±
0.09
20% O2
48.41 ±
0.71
37.43 ±
3.83
86.18
± 1.41
-0.06
± 0.01
-0.03 ±
0.01
2.22 ±
0.45
2.73 ±
0.60
1.30 ±
0.20
WKY
Rat Air
Baseline 47.25 ±
1.20
24.92 ±
1.06
65.76
± 1.50
-0.03
± 0.01
-0.003 ±
0.01
1.18 ±
0.20
-0.54 ±
0.10
1.80 ±
0.42
Descend 47.79 ±
1.06
23.18 ±
1.13
67.30
± 1.97
-0.02
± 0.01
0.01 ± 0.01 0.91 ±
0.24
-0.45 ±
0.16
2.14 ±
0.30
10% O2
47.87 ±
1.46
24.64 ±
1.17
68.37
± 2.21
-0.02
± 0.01
0.01 ± 0.01 1.12 ±
0.19
-0.49 ±
0.11
2.42 ±
0.60
Ascend
48.05 ±
1.46
23.40 ±
0.78
63.57
± 2.37
-0.02
± 0.01
0.01 ± 0.01 0.99 ±
0.25
-0.44 ±
0.14
2.47 ±
0.65
20% O2
47.92 ±
1.52
22.53 ±
1.02
63.58
± 2.98
-0.02
± 0.01
0.01 ± 0.01 1.17 ±
0.31
-0.49 ±
0.15
2.69 ±
0.63
WKY
Rat
Acrolein
Baseline 46.67 ±
1.51
23.99 ±
0.85
65.34
± 1.34
-0.027
± 0.01
0.01 ± 0.01 1.13 ±
0.18
-0.44 ±
0.12
2.40 ±
0.56
Descend 47.29 ±
1.38
23.32 ±
1.39
70.38
± 1.79
-0.02
± 0.01
0.01 ± 0.01 0.80 ±
0.12
-0.40 ±
0.10
1.99 ±
0.38
10% O2
48.13 ±
1.28
22.42 ±
0.69
68.15
± 1.92
-0.02
± 0.01
0.02 ± 0.01 0.83 ±
0.19
-0.39 ±
0.12
2.40 ±
0.52
Ascend
48.10 ±
1.64
23.04 ±
0.59
66.28
± 2.37
-0.02
± 0.01
0.01 ± 0.01 0.99 ±
0.25
-0.43 ±
0.13
2.47 ±
0.65
20% O2
46.68 ±
1.40
23.40 ±
0.56
63.06
± 2.93
-0.02
± 0.01
0.01 ± 0.01 1.39 ±
0.28
-0.49 ±
0.13
2.69 ±
0.63

88
Supplementary Table 3.3. Average of heart rate variability parameters in Spontaneously
Hypertensive and Wistar Kyoto rats during the hypoxia stress test. * denotes a significant
change from baseline (p < 0.05). Values represent means ± standard error.
Exposure Timing SDNN
(ms)
RMSSD
(ms)
LF
(ms2)
HF
(ms2)
LF/HF
SH Rat
Air
Baseline 8.19 ± 3.34 4.01 ± 0.31 0.94 ± 0.27 2.08 ± 0.38 0.55 ± 0.06
Descend 6.52 ± 2.66 3.37 ± 1.38 0.78 ± 0.33 1.83 ± 0.76 0.67 ± 0.04
10% O2 6.07 ± 2.48 4.87 ± 0.39 0.94 ± 0.31 2.82 ± 1.02 0.51 ± 0.04
Ascend 7.30 ± 2.98 5.21 ± 2.13 1.97 ± 0.54 2.80 ± 0.69 0.52 ± 0.06
20% O2 7.65 ± 3.12 4.31 ± 1.76 0.74 ± 0.15 1.96 ± 0.49 0.50 ± 0.03
SH Rat
Acrolein
Baseline 7.25 ± 0.49 3.52 ± 0.15 0.78 ± 0.19 1.51 ± 0.25 0.49 ± 0.05
Descend 5.69 ± 0.57 2.94 ± 0.13 0.59 ± 0.22 1.01 ± 0.32 0.54 ± 0.06
10% O2 5.43 ± 0.65 3.98 ± 0.44 0.60 ± 0.23 1.78 ± 0.72 0.52 ± 0.04
Ascend 6.56 ± 0.96 3.91 ± 0.34 0.84 ± 0.39 2.15 ± 0.66 0.48 ± 0.06
20% O2 7.82 ± 0.67 3.95 ± 0.31 0.92 ± 0.15 1.82 ± 0.28 0.50 ± 0.02
WKY
Rat Air
Baseline 9.90 ± 4.04 4.33 ± 1.77 0.81 ± 0.23 2.04 ± 0.65 0.43 ± 0.04
Descend 7.72 ± 1.16 3.32 ± 0.30 0.85 ± 0.20 1.44 ± 0.24 0.52 ± 0.07
10% O2 7.46 ± 0.73 4.65 ± 0.85 1.16 ± 0.33 3.04 ± 1.12 0.45 ± 0.08
Ascend 6.96 ± 0.44 3.92 ± 0.49 0.78 ± 0.24 1.78 ± 0.54 0.47 ± 0.06
20% O2 10.41 ± 4.25 5.37 ± 2.19 1.40 ± 0.53 3.48 ± 1.13 0.44 ± 0.02
WKY
Rat
Acrolein
Baseline 10.17 ± 0.86 4.34 ± 0.53 1.03 ± 0.23 2.20 ± 0.45 0.45 ± 0.03
Descend 8.92 ± 0.85 3.14 ± 0.28 0.43 ± 0.08 0.98 ± 0.19 0.45 ± 0.02
10% O2 7.16 ± 0.83 3.46 ± 0.45 0.76 ± 0.21 1.40 ± 0.33 0.53 ± 0.03
Ascend 9.29 ± 0.77 5.25 ± 0.71 1.49 ± 0.43 3.50 ± 0.88 0.50 ± 0.04
20% O2 10.26 ± 0.75 5.42 ± 0.70 1.10 ± 0.28 3.52 ± 1.09 0.45 ± 0.02

Chapter 4
Acrolein Induced Cardiovascular Dysfunction in Rats is Associated with Reduced Arterial
Blood Oxygen and is Mediated by the Carotid Body
Exposure to air pollution increases the risk of cardiovascular morbidity and mortality,
especially in susceptible populations with underlying cardiopulmonary disease. There are
several postulated mechanisms accounting for adverse responses, including decreases in
blood oxygen levels following pollutant exposure. Despite several epidemiological studies
reporting decreases in oxygen saturation following exposure to different environmental
pollutants, the direct link between air pollution-induced hypoxia and adverse cardiovascular
effects is not well accepted, and the exact mechanism leading to adverse cardiovascular
events remains unclear. We hypothesized that exposure to acrolein, an unsaturated aldehyde
and mucosal irritant found in cigarette smoke, diesel exhaust, and power plant emissions,
would decrease blood oxygen levels and exert cardiovascular effects through a carotid body
mediated mechanism. A cohort of Spontaneously Hypertensive (SH) rats implanted with
radiotelemeters were exposed once for 3 hours to 3 ppm acrolein gas or filtered air with or
without pharmacological inhibition of the carotid body in whole body plethysmograph
chambers while another identical cohort implanted with femoral artery catheters underwent
blood gas analysis before, during, and after acrolein exposure. Acrolein exposure caused
significant decreases in pO2 and significant increases in pCO2 during exposure. In addition,
acrolein exposure caused significant increases in mean arterial, systolic, and diastolic blood
90
pressure that were eliminated with carotid body inhibition. These results suggest that
acrolein-induced cardiac events may be mediated by the carotid body.
Introduction
Multiple lines of evidence demonstrate that exposure to air pollution increases
cardiovascular morbidity and mortality (Brook et al., 2010). Several mechanisms have been
postulated that overlap among gaseous and particulate pollutants including vascular oxidative
stress, endothelial/vascular dysfunction, inflammation, and altered autonomic tone (Brook et
al., 2010; Srebot et al., 2009). Recent epidemiological evidence suggests that a relatively
unexplored mechanism, systemic hypoxia, may drive some of the adverse cardiovascular
effects associated with exposure to air pollution. DeMeo et al. (2004) found associations
between increased PM2.5 levels and decreased oxygen saturation in older individuals with
cardiopulmonary disease. Pope et al. (1999) found negative associations between PM10 levels
and blood oxygen saturation in 80-year-old males. In clinical exposure studies, Gong et al.
(2004; 2005) found that exposure to concentrated ambient particulates in healthy elderly
volunteers also caused a drop in blood oxygen saturation. Despite these associations, a direct
link between hypoxia and air pollution-induced adverse cardiovascular effects has not been
established.
In mammals, the response to systemic hypoxia is controlled by the carotid body, a
major sensory organ located at the bifurcation of the carotid artery that is responsible for
sensing changes in arterial blood oxygen levels and initiating reflex cardiopulmonary
changes to maintain homeostasis. In response to hypoxia, the carotid body triggers reflex
increases in sympathetic tone that in turn trigger increases in blood pressure (BP),

91
ventilation, heart rate (HR), and arrhythmogenic risk (Roux et al., 2000; Liu et al., 2003;
Lopez-Barneo et al., 2008). Repeated cycles of hypoxia, as happens in individuals with
obstructive sleep apnea, have been shown to cause hypertension (Freet et al., 2013).
Hypoxia has also been shown to cause atrial fibrillation, AV block, ventricular tachycardia,
and changes in autonomic balance associated with ventricular arrhythmias (Davies and
Wedzicha, 1993). Parallels between carotid body-mediated effects and the cardiovascular
responses associated with air pollution exposure suggest a linkage is plausible.
We have previously demonstrated that exposure to particulate or gaseous air
pollutants causes exaggerated cardiovascular effects in rat models of hypertension and heart
failure (Carll et al., 2012; Farraj et al., 2011; Hazari et al., 2009; Lamb et al., 2012).
Recently, we found that exposure to acrolein, an unsaturated aldehyde and mucosal irritant
found in cigarette smoke, diesel exhaust, and power plant emissions, causes apnea (Hazari et
al., 2008), increases blood pressure (BP) and modifies responses to a physiologic stressor in
rats (Perez et al., 2013). In addition, Wang et al. (2012) demonstrated that cardiac
arrhythmias in particulate-exposed heart failure mice were associated with altered carotid
body sensitivity. These findings suggest that exposure to air pollution may trigger adverse
cardiovascular responses through a hypoxia-driven mechanism. Hypoxia sensing is
dependent on the activity of the H2S-generating enzyme cystathionine γ-lyase (CSE) within
the carotid body (Peng et al., 2010). The purpose of this study was to determine if the
cardiovascular effects of acrolein inhalation were mediated by hypoxia. We hypothesized
that 1) exposure to acrolein will cause decreases in blood oxygen levels in hypertensive rats,
a strain with exaggerated sensitivity to acrolein (Perez et al., 2013) and 2) inhibition of
carotid body sensing of hypoxia via CSE inhibition will prevent the cardiovascular responses

92
to acrolein exposure. HR, BP, the electrocardiogram, and heart rate variability, an indicator
of autonomic tone, were monitored before, during, and after exposure. Arterial blood was
obtained during acrolein exposure to measure oxygen content and saturation among other
parameters. In addition, left ventricular pressure, cardiac contractility, and lusitropy were
assessed one day after acrolein exposure.
Materials and Methods
Drugs
Rats in exposure groups including carotid body inhibition were treated with the
cystathionine γ-lyase enzyme (CSE) inhibitor DL-propargylglycine (PAG) (Sigma; 200
mg/kg) administered intraperitoneally immediately before exposures. All solutions with
drugs were prepared fresh before every experiment. Rats not treated with DL-
propargylglycine (PAG) were treated with an equivalent volume of saline administered
intraperitoneally immediately before exposures.
Animals
Twelve week-old male Spontaneously Hypertensive (SH) (n = 28) (Charles River,
Raleigh, NC) were housed in plastic cages (one per cage), maintained on a 12-hr light/dark
cycle at approximately 22°C and 50% relative humidity in our Association for Assessment
and Accreditation of Laboratory Animal Care-approved facility, and held for a minimum of 1
week before exposure. Food (Prolab RMH 3000; PMI Nutrition International, St. Louis, MO)
and water were provided ad libitum, and all rats were randomized by weight. All rats were
assigned to one of four treatments groups: air exposure and saline injection; acrolein
93
exposure and saline injection; air exposure and PAG injection; and acrolein exposure and
PAG injection. After all experiments were performed, rats were deeply anesthetized with an
intraperitoneal injection of Euthasol (200 mg/kg Na pentobarbital and 25 mg/kg phenytoin;
Virbac Animal Health, Fort Worth, TX) and euthanized by exsanguination. The Institutional
Animal Care and Use Committee of the U.S. Environmental Protection Agency (US EPA)
approved all protocols.
Telemeter Implantation
Animals were implanted with radiotelemetry transmitters to monitor heart rate (HR),
blood pressure (BP), and heart rhythms and electrocardiographic intervals (Model TL11M2-
C50-PXT; Data Science International, Inc., St. Paul, MN). Charles River Laboratories
performed all telemetry implantation surgeries in accordance with methods specified by the
vendor (Charles River Laboratories, 2005). Animals were shipped to the US EPA 10 days
after implantation surgeries, and animals were allowed to recover for 1 week at the US EPA
before exposures began.
A separate cohort of SH (n = 20) and WKY (n = 5) rats were implanted with femoral
artery catheters in accordance with methods specified by the vendor (Charles River
Laboratories, 2005). Animals were shipped to the US EPA within 1 week of surgery. The
catheters were flushed with saline, locked with heparin and plugged immediately upon
arrival and every two days thereafter until exposure began.
94
Acrolein Exposure
Rats were assigned to exposure groups (air exposure and saline injection; acrolein
exposure and saline injection; air exposure and PAG injection; acrolein exposure and PAG
injection) and acclimated to exposure chambers for 1 hour once per day beginning two days
before exposure. On the exposure day, rats received an intraperitoneal injection of saline or
PAG and were allowed to acclimate to the chambers for 30 minutes and then baseline data
was recorded for the next 30 minutes. All exposures (air and acrolein) took place in whole
body plethysmography chambers (WBP; Model PLY3213, Buxco Electronics, Inc,
Wilmington, NC), which continuously and non-invasively monitor ventilatory parameters in
conscious animals. SH rats were then exposed to filtered air or 3 ppm acrolein for 3 hours.
The concentration of acrolein (3 ppm) is higher than ambient levels, but it may represent
concentrations in high combustion areas (Hazari et al., 2008). In addition, cigarette smoke
contains up to 90 ppm acrolein (Esterbauer et al., 1991), and acrolein levels in sidestream
tobacco smoke are as high as 10 ppm (Esterbauer et al., 1991). Acrolein gas was metered
from a 1000 ppm cylinder into a glass mixing chamber where the gas was mixed with dry
filtered dilution air to achieve a final concentration of 3 ppm of acrolein with a total flow of 6
L/min. The actual chamber concentration was measured using an HP5890 gas
chromatograph (GMI Inc., Ramsey, MN) equipped with manual injection, a flame ionization
detector and a DB-VRX capillary column. The plethysmograph pressure was monitored
using Biosystems XA software (Buxco Electronics, Inc, Wilmington, NC). Using
respiratory-induced fluctuations in ambient pressure, respiratory parameters including tidal
volume, breathing frequency, inspiratory time and expiratory time were calculated and
recorded on a breath-by-breath basis and averaged over 10 second intervals. HR, systolic and

95
diastolic BP, ECG waveforms, and ventilatory data were collected during the exposure, and
animals were returned to their home cages after exposure. Rats underwent left ventricular
pressure readings 24 hours after exposure.
Left Ventricular Pressure Readings 24 Hours Post Exposure
All rats exposed to air or acrolein with or without PAG injection underwent left
ventricular pressure (LVP) readings to measure cardiac function 24 hours after exposure.
Left ventricular pressure readings were performed as previously described (Carll et al., to be
submitted). Briefly, rats were anesthetized with urethane (1.5 mg/kg i.p., Sigma) and
prepared for LVP measurement by right carotid arterial catheterization with a 2-French
transducer (SPR-320, Millar Instruments). The LV probe was connected via a Pressure
Control Unit (Model 2000, Millar Instruments) to a receiver (Powerlab 4/30, ADInstruments)
and a computer acquiring data at 1000 Hz. The probe was advanced into the LV for a 5 min
baseline. Rats exposed to air with saline injection and acrolein with saline injection then
underwent a dobutamine stress test followed by vagotomy which will be described in the
next section. Rats exposed to air with PAG injection and acrolein and PAG injection were
then euthanized by exsanguination. Acquisition software (LabChart Pro version 7.3.2,
ADInstruments) generated pressure at end diastole and end systole (EDP and ESP) and the
maximum and minimum pressure slopes (dP/dtmax and dP/dtmin, respectively) per beat,
indicative of contractility and relaxation rate (lusitropy), respectively.

96
Left Ventricular Pressure Readings with Dobutamine Stress Test, and Vagotomy
Rats exposed to air with saline injection and acrolein with saline injection were
prepared for left ventricular pressure readings as described above, and the left jugular vein
was cannulated for cardiac stress test by sympathomimetic infusion (dobutamine) before the
probe was inserted into the carotid artery. The probe was advanced into the LV, and after a 5
min baseline, freshly diluted dobutamine hydrochloride (dissolved in 0.9% NaCl saline at 20
µg/ml and infused at a dose of 10 µg/kg/min i.v.) was infused for 2 min. Rats were observed
for 10 min after infusion cessation, which allowed adequate time for recovery to resting heart
rate and dP/dtmax. Animals then received bilateral vagotomy by suture occlusion followed by
a stabilization period (3 min), another 2-min dobutamine infusion at the same dose and a
post-infusion observation period (2.5 min). Rats were then euthanized by exsanguination.
Acquisition software (LabChart Pro version 7.3.2, ADInstruments) generated pressure at end
diastole and end systole (EDP and ESP) and the maximum and minimum pressure slopes
(dP/dtmax and dP/dtmin, respectively) per beat, indicative of contractility and relaxation rate
(lusitropy), respectively.
Blood Gas Parameter Measurements During Acrolein Exposure
Changes in blood gas parameters during acrolein exposure were determined in a
separate cohort of rats. All rats were assigned to one of four treatments groups: air exposure
and saline injection; acrolein exposure and saline injection; air exposure and PAG injection;
and acrolein exposure and PAG injection. Rats implanted with femoral artery catheters were
acclimated to whole body plethysmography chambers (WBP; Model PLY3213, Buxco
Electronics, Inc, Wilmington, NC), for 1 hour on the two days prior to exposure. On the day
97
of exposure, the rats were received an intraperitoneal injection of either saline or PAG. The
exteriorized catheter was extended with a 1 ml PE50 catheter attached to a 23 gauge adapter
and run through a pre-measured hole in the wall of the plethysmograph to allow for blood
draws outside of the sealed exposure chamber. Rats were acclimated to the exposure
chambers for 30 minutes and then were exposed to either filtered air or acrolein as described
previously. For all exposure groups, a baseline 250µl blood sample was taken after
acclimation. For air exposed rats, additional 250 µl blood samples were taken 30 minutes
after baseline, 1 hour after baseline, and 1 hour 15 min after baseline. For acrolein exposed
rats, additional 250 µl blood samples were taken 30 minutes after the start of acrolein, 1 hour
after the start of acrolein, and 15 minutes after the end of acrolein exposure. For each blood
draw, the pin was removed from the tip of the catheter, and the heparin was allowed to exit
the catheter. When only blood remained, a 23-gauge adapter attached to a 1 ml syringe was
placed on the end of the catheter and used to draw a 250µl sample. The blood sample was
immediately read on an OPTI CCA-TS Blood Analyzer (OPTI Medical Systems, Inc.) using
the OPTI Cassette E-Ca which measures blood pH, PCO2, PO2, Na+, K
+, Ca
2+, total
hemoglobin (tHb), oxygen saturation (SaO2), and hematocrit (Hct). The catheter was flushed
with saline and locked with heparin after each blood draw.
Whole-body Plethysmograph Data Acquisition and Analysis
All exposures were performed in whole-body plethysmography chambers (Buxco
Electronics, Sharon, CT). The plethysmography methodology permitted continuous
monitoring of breathing frequency, tidal volume, minute volume, inspiratory time and
expiratory time. Animals were acclimated to plethysmographs for 1 hour each day on the two

98
days prior to exposure before both air and acrolein exposure. Plethysmography chambers
(model PLY3213; Buxco Electronics) were calibrated each day before every animal loading.
A bias flow regulator delivered fresh air (1.8 L/min) to each cylindrical chamber, preventing
CO2 buildup within the chamber. Unrestrained animals were placed in individual cylindrical
plethysmograph boxes containing a built-in reference chamber for measuring respiration-
induced pressure fluctuations. Data were channeled to computer software (BioSystem XA;
Buxco Electronics) that calculated respiratory parameters. Data were collected continuously
for each parameter, and automated breath-by-breath analyses were performed using a
rejection algorithm to eliminate breaths that were outside a given range. On exposure day,
animals were acclimated to the chambers for 30 minutes before any readings were taken.
After acclimation, 30 minutes of baseline data were taken, and animals were exposed to
either filtered air or 3 ppm acrolein for 3 hours. After exposure, rats were removed and
returned to home-cages.
Radiotelemetry Data Acquisition
Radiotelemetry methodology (Data Sciences International, Inc.) enabled constant
monitoring of ECG data in unrestrained, un-anesthetized rats from implantation until
euthanasia. Remote receivers (DataART3.01; Data Sciences International, Inc.) positioned
under the home cages, and under the plethysmographs during exposure collected the ECG
data and transferred it to the computer for storage. In home cages, sixty-second segments of
ECG waveforms were acquired and saved at 15 minute intervals from surgical recovery
through euthanasia not including the exposure period. Pre-exposure baseline data were
collected from home cages, as well as a 30 minute baseline in exposure cages after a 30
99
minute acclimation period. During the 3 hour exposure, sixty-second segments were
acquired and saved at 5 minute intervals. After exposure, rats were monitored in home cages
until euthanasia, approximately 12 hours after the end of the final hypoxia challenge. HR
and BP were automatically obtained from the ECG and BP waveforms, respectively, with
data acquisition software (DataART3.01; Data Sciences International, Inc.).
Electrocardiogram, Arrhythmia Identification and Heart Rate Variability (HRV) Analysis
ECGAuto software (EMKA Technologies, Falls Church, VA) was used for automated
analyses of ECG wave amplitudes and segment durations and areas, as well as for the visual
identification and enumeration of cardiac arrhythmias. Several parameters were determined
for each ECG waveform: PR interval; R amplitude and duration; QRS area; ST interval,
amplitude, and area; and T-wave amplitude and
area; QT interval, and heart
rate-corrected QT
interval (QTc). ECG parameters during exposure were analyzed in terms of baseline (30
minute recordings while in the exposure chambers immediately before the beginning
of
exposure) and Hours 1–3 (constituting the entire exposure period between 8:00 AM and
11:00 AM).
Cardiac arrhythmic events were identified in part by using the Lambeth conventions
(Walker et al., 1988) as a guideline for the identification of arrhythmias in rats. Arrhythmias
were identified as atrial premature beats (APB), ventricular premature beats (VPB), sinoatrial
blocks (SAB), atrioventricular blocks (AVB), or ventricular tachycardia (VT). Arrhythmias
were quantified, counted and totaled over an 18 hour period prior to exposure (this
corresponded to the same times assessed after exposure), during the 4 hour exposure period,
or during the 18 hour period beginning immediately after exposure. Total arrhythmia counts
100
during exposure were quantified (total of 48 two-minute segments during 3 hour exposure
period) and expressed as counts per minute.
For the analysis of HRV, thorough visual inspection was conducted to identify and
exclude arrhythmias, artifacts, and 1 minute ECG waveforms lacking distinguishable R
waves for more than 30 seconds. The analysis of HRV generated heart rate (HR) and
time-
domain measures, including mean time between adjacent QRS complex peaks (the RR
interval), a standard deviation of the RR interval (SDNN), SDNN normalized for the effects
of heart rate [SDNN/(RR interval x 100)], and the square root of the mean of
squared
differences of adjacent RR intervals (RMSSD). The SDNN represents overall HRV, whereas
RMSSD represents parasympathetic influence over HR. The analysis of HRV also calculated
frequency domain parameters, particularly low frequency (LF) and high frequency (HF), and
the ratio of these two frequency domains (LF/HF). LF is generally believed to represent a
mixture of sympathetic and parasympathetic tone, whereas HF indicates cardiac
parasympathetic (vagal) tone, and LF/HF serves as an index of sympathovagal balance.
Statistics
The statistical analyses of the Buxco, ECG and HRV data in this study used SAS
version 9.2 software (SAS Institute Inc, Cary NC). We used PROC MIXED of SAS since it
offers greater flexibility for the modeling of repeated measures data than PROC GLM. It is
also suitable for analysis of large, unbalanced data with missing data at random. A linear
mixed model with restricted maximum-likelihood estimation analysis, least squares means
and repeated measures ANOVA was used to determine which TIME*TRT interactions were
statistically significant between baseline and exposure. Multiple comparison adjustment for
101
the p values and confidence limits for the differences between the least squares means was
done using adjust=Tukey HSD (Honest Significant Difference) test. All blood gas data were
analyzed using GraphPad Prism (GraphPad Software, Inc., La Jolla, CA) with a one-way
analysis of variance (ANOVA) model examining the main effects of each model.
All strain comparisons were performed using GraphPad Prism (GraphPad Software, Inc., La
Jolla, CA) with a student t-test. Trend analysis of SDNN data during exposure and HR data
during hypoxia challenge was performed using GraphPad Prism (GraphPad Software, Inc.,
La Jolla, CA) with a one-way ANOVA followed by a post-hoc test for linear trend between
mean and column number. P < 0.05 was considered statistically significant.
Results
Effects of Acrolein on Blood Parameters
In rats exposed to acrolein with saline injection, pO2 decreased from baseline levels
of 101.43 ± 1.67 mmHg to 91.00 ± 3.59 mmHg 30 minutes into exposure, to 90.20 ± 1.16
mmHg one hour into exposure, and continued to decrease to 89.80 mmHg after exposure
ended (p < 0.05; Fig. 4.1A). Rats exposed to acrolein with saline injection and acrolein with
PAG injection had significant increases in pCO2 during acrolein exposure. For rats exposed
to acrolein with saline injection, pCO2 increased from baseline levels of 38.57 ± 1.15 mmHg
to 41.85 ± 1.40 mmHg 30 minutes into exposure, to 42.00 ± 1.63 mmHg one hour into
exposure, and remained high at 41.80 ± 1.39 mmHg after exposure ended (p < 0.05; Fig.
4.1B). For rats exposed to acrolein with PAG injection, pCO2 increased from baseline levels
of 36.50 ± 1.06 mmHg to 41.25 ± 0.43 mmHg 30 minutes into exposure, to 40.20 ± 0.58
mmHg one hour into exposure (p < 0.05; Fig. 4.1B). Rats exposed to acrolein with saline
102
injection had significant decreases in K+ during and after exposure. Baseline K
+ levels of
6.64 ± 0.74 mmol/L decreased to 4.37 ± 0.24 30 minutes into exposure, to 4.63 ± 0.38 one
hour into exposure, and increased slightly to 5.46 ± 0.54 mmol/L after exposure ended (p <
0.05; Fig. 4.1C).
pH, SaO2, and Na+ were not affected by acrolein exposure or PAG injection (Data not
shown). WKY rats exposed to air or acrolein had no significant changes in any blood
parameters measured (Table 4.1).
Effects of Acrolein on Ventilatory Parameters
Rats exposed to acrolein had significant decreases in breathing frequency in the first
30 seconds of exposure. Breathing frequency decreased significantly from 288.70 ± 23.22
breaths/min at baseline to 153.63 ± 14.99 breaths/min 20 seconds into acrolein exposure
(Figure 4.2A). In addition, acrolein exposed rats had significant increases in expiratory time
(Te), a measure of apnea within the first 20 seconds of exposure. Te increased from baseline
levels of 0.16 ± 0.038 seconds to 0.28 ± 0.037 seconds at 10 seconds into acrolein exposure
and 0.28 ± 0.023 seconds 20 seconds into acrolein exposure (Figure 4.2B). Decreased
breathing frequency and increased expiratory time were not seen in PAG treated rats (Data
not shown). There were no significant changes in minute volume, tidal volume, or inspiratory
time in rats treated with saline of PAG.
103
Effects of Carotid Body Inhibition on Blood Pressure, Heart Rate, and Temperature during
Acrolein Exposure
Rats exposed to acrolein with saline injection had significant increases in mean
arterial blood pressure (MAP), systolic blood pressure, and diastolic blood pressure during
acrolein exposure compared to the other exposure groups (Fig. 4.3).
For MAP at hour 2, rats exposed to acrolein with saline injection had a 3.94 ± 1.26 %
decrease from baseline compared to rats exposed to air with saline injection (13.11 ± 1.80 %
decrease from baseline) (p < 0.05; Data not shown). At hour 3, rats exposed to acrolein with
saline injection had a 13.40 ± 2.53 % increase from baseline compared to rats exposed to air
with saline injection (11.33 ± 3.37 % decrease from baseline) and rats exposed to air with
PAG injection ( 3.75 ± 3.54 % decrease form baseline) (p < 0.05; Data not shown).
For systolic blood pressure at hour 2, rats exposed to acrolein with saline injection
had a 3.28 ± 1.97 % decrease from baseline compared to rats exposed to air with saline
injection (12.03 ± 1.74 % decrease from baseline) (p < 0.05; Fig. 4.3A). At hour 3, rats
exposed to acrolein with saline injection had a 13.80 ± 2.24 % increase from baseline
compared to rats exposed to air with saline injection (9.85 ± 2.78 % decrease from baseline),
rats exposed to air with PAG injection (2.65 ± 3.33 % decrease form baseline), and rats
exposed to acrolein wih PAG injection (1.73 ± 2.34 % increase from baseline) (p < 0.05; Fig.
4.3A).
For diastolic blood pressure at hour 3, rats exposed to acrolein with saline injection
had a 13.10 ± 2.61 % increase from baseline compared to rats exposed to air with saline
injection (13.98 ± 3.72 % decrease from baseline), rats exposed to air with PAG injection

104
(5.57 ± 4.02 % decrease form baseline), and rats exposed to acrolein wih PAG injection (1.09
± 3.74 % increase from baseline) (p < 0.05; Fig. 4.3B).
Rats had no significant changes in heart rate during exposure regardless of exposure
group or PAG injection (Fig. 4.3C).
Rats exposed to acrolein with saline injection had a significantly smaller decrease in
temperature during hour 2 of acrolein exposure (Fig. 4.3D). Temperature decreased from
baseline levels of 38.45 ± 0.13 oC to 37.62 + 0.19
oC at hour 2 in rats exposed to acrolein
with saline injection compared to rats exposed to air with saline injection (38.59 ± 0.24 oC at
baseline to 37.33 ± 0.18 oC at hour 2), rats exposed to air with PAG injection (37.93 ± 0.10
oC at baseline to 36.95 ± 0.14
oC at hour 2), and rats exposed to acrolein with PAG injection
(37.88 ± 0.28 oC at baseline to 36.59 ± 0.29
oC at hour 2). For rats exposed to acrolein with
saline injection, this constituted a 0.019 ± 0.004 % decrease from baseline at hour 2
compared to a 0.041 ± 0.005 % decrease from baseline in rats exposed to air with saline
injection (p < 0.05; Fig. 4.3D).
Differences in Measurements of Contractility 24 Hours after Acrolein Exposure
Rats exposed to acrolein with saline injection had a significant decrease in dP/dTmax,
a measure of cardiac contractility, 24 hours after exposure compared the control air exposure
with saline injection. Rats exposed to acrolein with saline injection had dp/dTmax levels of
5672.56 ± 630.63 mmHg/s compared to rats exposed to air with saline injection (8992.40 ±
971.39 mmHg/s) (p < 0.05; Fig.4.4). This decrease was eliminated with PAG injection (Fig.
4.4).
105
The Effect of Acrolein Exposure on Measurements of Cardiac Function
Rats exposed to acrolein had significant decreases in baseline dP/dTmax 24 hours after
exposure that were reversed with bilateral vagotomy. At baseline, rats exposed to acrolein
with saline injection had average dP/dTmax values of 5672.56 ± 630.63 mmHg/s compared to
8992.40 ± 971.39 mmHg/s in air exposed rats with saline injection (p < 0.05; Fig. 4.5A).
After bilateral vagotomy, acrolein exposed rats with saline injection had baseline dP/dTmax
values of 14365.65 ± 1243.72 mmHg/s compared to 11588.65 ± 1305.35 mmHg/s in air
exposed rats with saline injection (Fig. 4.5A). Rats exposed to acrolein had significant
increases in dP/dTmax during dobutmaine infusion I. Acrolein exposed rats had a 111.37 ±
16.19 % increase from baseline compared to a 58.68 ± 12.66 % increase from baseline in rats
exposed to air (p < 0.05; Fig. 4.5). This increase in dP/dTmax was eliminated after vagotomy
(Fig. 4.5B)
Discussion
The current study demonstrates four major points: 1) that acrolein exposure-induced
apnea is associated with decreases in arterial pO2 and increases in pCO2 in SH rats,
suggesting hypoxemia, 2) hypoxemia was only evident in acrolein-exposed SH rats, but not
rats with normal blood pressure, 3) acrolein exposure-induced cardiovascular responses
including increased blood pressure and diminished contractility and elevated core body
temperature are prevented by pharmacologic blockade of the carotid body, the hypoxia
sensing organ, and 4) carotid body-mediated cardiovascular responses are associated with an
oscillating autonomic pattern characterized by an early increase in sympathetic tone followed
by a rebound increase in parasympathetic tone. Decreases in pO2 during acrolein exposure
106
demonstrate the potential for hypoxemia and downstream peripheral chemoreceptor-
mediated responses to hypoxia. Acrolein exposure alone caused significant increases in mean
arterial, systolic, and diastolic blood pressure that were prevented with carotid body
inhibition. Acrolein exposure caused significant reductions in baseline dP/dTmax, a measure
of cardiac contractility, which was reversed with carotid body inhibition. Bilateral vagotomy
one day after exposure reversed significant decreases in baseline contractility, demonstrating
that the reduction in contractility was likely mediated by increases in parasympathetic tone.
Acrolein exposure significantly decreased pO2 in hypertensive rats, suggesting that
the animals were hypoxic. Acrolein, like other environmental pollutants, stimulates airway
irritant sensory nerves (Lee et al., 1992; Oortgiesen et al., 2000), especially chemosensitive
bronchopulmonary C-fibers, in part by activation of transient receptor potential vanilloid 1
cation channels (TRPV1) present on the peripheral terminals of these fibers (Hazari et al.,
2008). Upon activation of these fibers, a chemorflex is elicited that is characterized by apnea
and bronchospasm (Coleridge and Coleridge, 1994), which in part may explain the responses
observed. We found significant decreases in breathing frequency in SH rats immediately
after the start of acrolein as well as significant increases in expiratory time, a marker of
apnea, consistent with our previous findings (Hazari et al., 2008). While this may explain the
initial drop in pO2, the apnic response was transient, lasting only 30 seconds. Thus, apnea
alone likely does not explain the decrease in pO2 that was detected up to an hour into
exposure and that persisted for 30 minutes after a 1-hour exposure to acrolein. Other
potential explanations include inflammatory and edematous responses, although such
responses are common at higher concentrations. Janssens et al. (1994) reported decreases in
arterial pO2 after acrolein smoke exposure in sheep and attributed the responses to acrolein-

107
induced airway resistance and edema. Acrolein exposure has been shown to increase lung
lymph flow and extracellular lung water coupled with airway damage and pulmonary edema
(Hales et al., 1992). While acrolein exposure decreased pO2 in SH rats, no such change was
evident in similarly exposed WKY rats and may be related to underlying differences in
sensitivity to air pollution. Previous studies have shown that the SH rat responds with greater
airway inflammation, edema, and injury after air pollution exposure than WKY rats (Farraj et
al., 2009; Kodavanti and Costa, 2001). In addition, SH rats have larger carotid bodies
(Habeck et al., 1985) and are more sensitive to the effects of hypoxia as evidenced by
increased carotid sinus nerve activity and intracellular Ca2+ changes (Weil et al., 1998).
Although there were significant reductions in pO2 with acrolein exposure in SH rats,
there were no significant changes in blood oxygen saturation (i.e. SaO2). pO2 is a measure of
dissolved oxygen in plasma, while SaO2 measures the percentage of hemoglobin sites bound
with oxygen. The discrepancy in pO2 and SaO2 is likely due to the fact that SaO2 is well
buffered from rapid decreases due to the sigmoidal nature of the oxy-hemoglobin
dissociation curve (Urbano and Mohsenin, 2006). Because a large drop in pO2 is required to
alter SaO2,, reductions in pO2 may be a more sensitive indicator of a pollutant’s effect on
blood oxygen levels. Additionally, epidemiological studies linking reduction in SaO2 and
pollutant exposure are based on pulse oximetry recordings (Gong et al., 2004; Gong et al.,
2005) derived from light absorbance readings of a sensor usually placed on a finger. This
measurement is not as sensitive as direct analysis of arterial blood, and demonstrates the
increased sensitivity of the system used in this study. Decreases in arterial pO2 were coupled
with significant increases in pCO2. Importantly, the body is significantly more sensitive to
systemic changes in pCO2 and the magnitude of the change in pCO2 with acrolein exposure
108
in this study has been demonstrated to be sufficient to trigger activation of the carotid body
(Iturriaga et al., 2005). Thus, the small but significant decrease in pO2 and the increase in
pCO2 during acrolein exposure suggest that carotid body activation took place.
In addition to changes in arterial blood gas parameters, acrolein exposure
significantly decreased K+ in hypertensive rats. Hypokalemia, defined as less than
3.5mmol/L K+ in arterial blood, may occur in diseases with high aldosterone levels such as
hypertension and is a result of abnormal renal regulation of K+
(Halperin and Kamel, 1998).
SH rats are known to have kidney dysfunction (Hulstrom, 2012), but there are no reports of
acrolein causing hypokalemia in humans or rodent models. Although it is unclear why
acrolein exposure causes decreases in K+, acute hypokalemia has been shown to sensitize the
heart to hypoxic injury (Shapiro et al., 1998). We did not see reductions in K+ to the level of
hypoxemia, but reduced K+ has been shown to have multiple adverse effects of
cardiovascular function including cardiac arrhythmias, acceleration of kidney disease
progression, and exacerbated hypertension (Asmar et al., 2012). Hypokalemia can lead to
elevated aldosterone levels and increased blood pressure (Abad-Cardiel et al., 2013), and rats
fed a high salt diet had increased sensitivity of the carotid body that was attributed to low
potassium levels (Elias et al., 2004). Reductions in K+ during acrolein exposure may be a
potential driver of increased blood pressure and may influence the carotid body response to
hypoxia following acrolein exposure.
Acrolein-induced blood pressure and temperature changes may be related to early
decreases in arterial pO2 and increases in pCO2, as has been demonstrated in other studies.
For example, acute exposure to high altitudes with low oxygen tension in humans increases
systemic arterial blood pressure and precipitates acute mountain sickness (Rhodes et al.,

109
2011). Also, cats exposed to short term anoxia had decreased pO2 and increased pCO2
coupled with significant increases in arterial blood pressure (Yang et al., 1994). In addition,
acrolein exposure-induced decreases in pO2 in sheep were accompanied by increases in
pulmonary arterial pressure and pulmonary vascular resistance (Janssens et al., 1994). Such
blood pressure increases may have been triggered by increased sympathetic tone mediated by
the carotid body in response to hypoxia. Although HRV assessments have not yet been
analyzed, acrolein exposure in our previous study caused an increase in LF, the low
frequency domain parameter indicative of sympathetic tone (Perez et al., 2013). On the other
hand, blood pO2 levels below 60 mm Hg are required for significant activation of the carotid
body in humans suggesting that carotid body sensing of pO2 may not be the driver for these
responses. While the changes in pO2 may not have reached threshold levels necessary for
activation of the carotid body, the carotid body may have been impacted to a greater extent
by acrolein-induced increases in pCO2. The carotid body is much more sensitive to changes
in pCO2 and increases in pCO2 as small as 5 mmHg have been shown to activate the carotid
body (Whipp, 1994). In addition to blood pressure increases, acrolein exposure resulted in an
increase in body temperature compared to control animals. Although the reason for this
finding is unclear, sympathetic activation has been shown to increase body temperature by
stimulating vasoconstriction (Constanzo, 2006). In addition, Loyola et al. (1991) reported
that increases in core body temperature activate chemosensory discharges from the carotid
nerve, suggesting that acrolein induced increases in body temperature may be related to
carotid body signaling during exposure. In mammals, the response to systemic hypoxia is
controlled by the carotid body, and blood pressure and temperature responses following
decreases in arterial pO2 may be controlled by the carotid body chemoreceptor response.
110
Pharmacological inhibition of carotid body sensing prevented acrolein-induced
increases in MAP, systolic, and diastolic blood pressure during exposure and the reduction in
cardiac contractility one day after exposure. These responses suggest that carotid body
signaling may be influencing the cardiovascular response to acrolein. Carotid body signal
transduction is dependent on hydrogen sulfide production by the cystathionine γ-lyase (CSE)
enzyme that generates hydrogen sulfide from cysteine (Peng et al., 2010). PAG
pharmacologically inhibits the carotid body through inhibition of the CSE enzyme, and it has
been shown to inhibit responses to hypoxia in the carotid body of rats (Peng et al., 2010).
The prevention of acrolein-induced blood pressure increases in PAG-treated rats is of great
interest because hypoxia is associated with increased myocyte apoptosis and is implicated in
cardiac remodeling and progression to heart failure (Bao et al., 2011). In addition, hypoxia
has been shown to cause atrial fibrillation, AV block, and ventricular tachycardia as well as
changes in autonomic balance associated with ventricular arrhythmias (Davies and
Wedzicha, 1993). Oral exposure to acrolein in mice has been shown to cause inflammation
and dilated cardiomyopathy characterized by increased left ventricular dilation (increased
end diastolic volume), contractile dysfunction (decreased dp/dTmax), and impaired relaxation
(Ismahil et al., 2011). Recent work by Wang et al. (2012) demonstrated that cardiac
arrhythmias in particulate-exposed heart failure mice were in part due to altered sensitivity of
the carotid body. Furthermore, exposures to the air pollutants tobacco smoke (Adgent,
2006), sulfur dioxide and nitrogen dioxide (Hoppenbrouwers et al., 1981) have been linked
to abnormal cardiopulmonary sensitivity responses to hypoxia. Collectively, these finds
provide plausibility for a role for hypoxia in the mediation of some of the adverse
cardiovascular effects of air pollution.
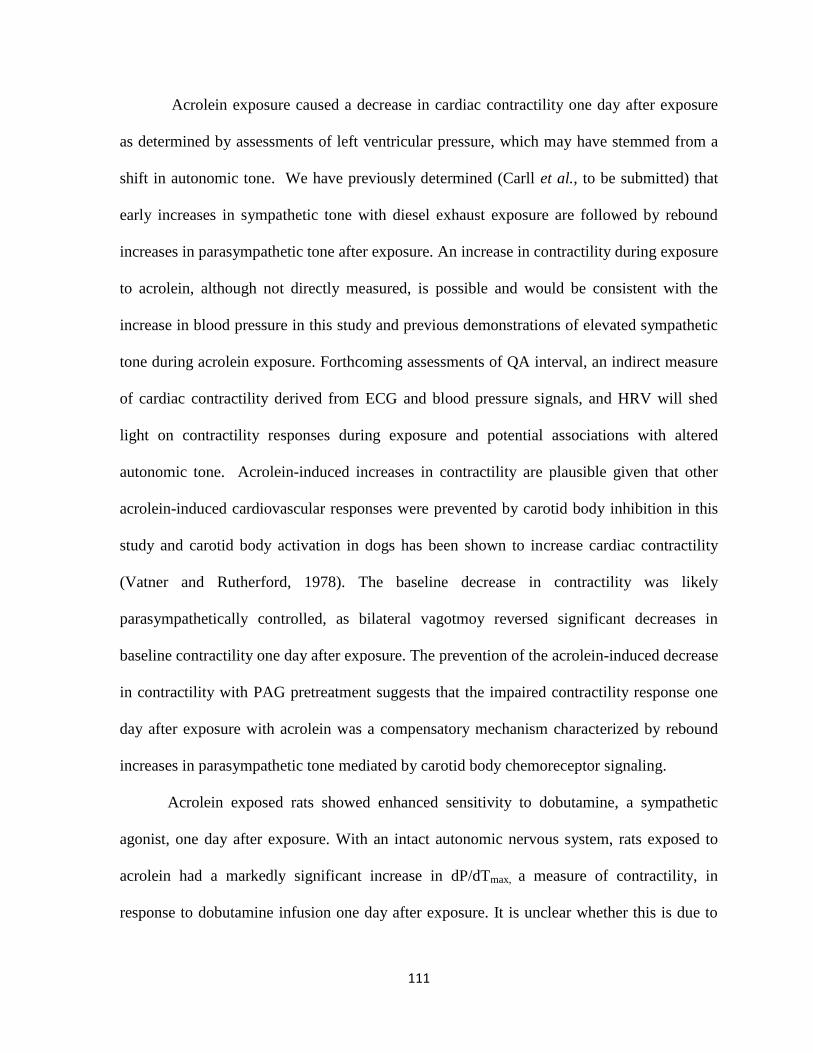
111
Acrolein exposure caused a decrease in cardiac contractility one day after exposure
as determined by assessments of left ventricular pressure, which may have stemmed from a
shift in autonomic tone. We have previously determined (Carll et al., to be submitted) that
early increases in sympathetic tone with diesel exhaust exposure are followed by rebound
increases in parasympathetic tone after exposure. An increase in contractility during exposure
to acrolein, although not directly measured, is possible and would be consistent with the
increase in blood pressure in this study and previous demonstrations of elevated sympathetic
tone during acrolein exposure. Forthcoming assessments of QA interval, an indirect measure
of cardiac contractility derived from ECG and blood pressure signals, and HRV will shed
light on contractility responses during exposure and potential associations with altered
autonomic tone. Acrolein-induced increases in contractility are plausible given that other
acrolein-induced cardiovascular responses were prevented by carotid body inhibition in this
study and carotid body activation in dogs has been shown to increase cardiac contractility
(Vatner and Rutherford, 1978). The baseline decrease in contractility was likely
parasympathetically controlled, as bilateral vagotmoy reversed significant decreases in
baseline contractility one day after exposure. The prevention of the acrolein-induced decrease
in contractility with PAG pretreatment suggests that the impaired contractility response one
day after exposure with acrolein was a compensatory mechanism characterized by rebound
increases in parasympathetic tone mediated by carotid body chemoreceptor signaling.
Acrolein exposed rats showed enhanced sensitivity to dobutamine, a sympathetic
agonist, one day after exposure. With an intact autonomic nervous system, rats exposed to
acrolein had a markedly significant increase in dP/dTmax, a measure of contractility, in
response to dobutamine infusion one day after exposure. It is unclear whether this is due to

112
effects by the autonomic nervous system, or if the increases in contractility are the result of
other factors. This response may be due to increased vascular resistance, as has been found
with exposure to acrolein (Green and Egle, 1983), and may not be the result of exaggerated
sympathetic tone. Alternatively, acrolein activates TRP fibers/receptors (Hazari et al., 2008),
which are plentiful in the heart, suggesting that the enhanced sensitivity may be occurring
only at the level of the heart. Increases in contractility during dobutamine infusion were
eliminated with bilateral vagotomy. Although the mechanism causing the responses one day
after exposure are difficult to decipher, the body has many ways to respond to air pollutants,
and it is likely that more than one mechanism is activated upon inhalation of different
pollutants. Future studies will include pharmacological block of parasympathetic nerve
activity to the heart with atropine to fully gauge the role of the parasympathetic response. It
is conceivable that the carotid body mediated physiologic responses to hypoxia trigger
sympathetic-driven cardiovascular responses during exposure followed by parasympathetic-
driven responses after acrolein exposure (Figure 4.6).
The present findings demonstrate for the first time that acrolein exposure may
cause changes in blood pressure and cardiac function through carotid body chemoreceptor
signaling. In addition, exposure to irritants known to illicit apnea can affect blood gas
concentrations and stimulate chemorecepter activation with downstream cardiovascular
consequences. These findings also highlight the previously underexplored role of hypoxia
signaling during air pollution exposure and reveal the complex interplay between
chemoreceptor signaling and the autonomic nervous system.

113
Table 4.1. Arterial blood parameters during acrolein exposure in WKY rats. Means and
standard errors are reported.
Exposure pO2
(mmHg)
pCO2
(mmHg)
SaO2
(%)
pH K+
(mmol/L)
Na+
(mmol/L)
Baseline 109 ± 2.77 36.6 ± 1.86 94.8 ±
0.66
7.27 ±
0.05
7.66 ±
1.10
149.8 ±
2.96
30 minutes 101.4 ± 4.53 36.7 ± 2.09 94.4 ±
0.24
7.28 ±
0.04
7.36 ±
0.81
147.2 ±
1.98
1 Hour 102.6 ± 4.71 35.4 ± 1.47 93.40 ±
0.68
7.27 ±
0.05
6.70 ±
0.72
152.2 ±
1.47
Post
Exposure
98 ± 2.19 36.7 ± 0.68 93.4 ±
0.40
7.41 ±
0.02
5.70 ±
0.49
143.6 ±
0.51
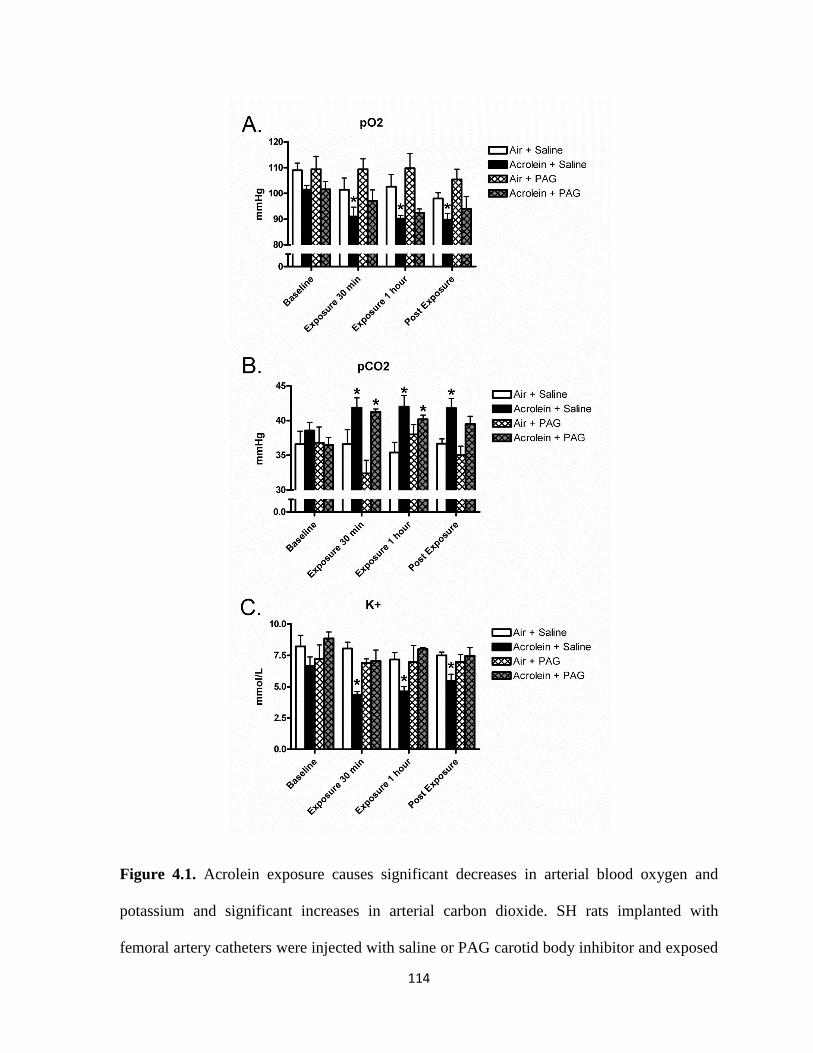
114
Figure 4.1. Acrolein exposure causes significant decreases in arterial blood oxygen and
potassium and significant increases in arterial carbon dioxide. SH rats implanted with
femoral artery catheters were injected with saline or PAG carotid body inhibitor and exposed

115
to 3 ppm acrolein or air control. Panel A, B, and C refer to pO2, pCO2, and K+, respectively,
measured at baseline, 30 minutes into acrolein exposure, 1 hour into acrolein exposure, and
15 minutes post exposure. Means and standard errors are reported. Significant differences
from baseline values (p < 0.05) are denoted with a *.

116
Figure 4.2. Acrolein exposure causes significant decreases in breathing frequency and
significant increases in expiratory time immediately after the beginning of exposure. Panels
A and B refer to breathing frequency and expiratory time, respectively. Means and standard
errors are reported. Significant differences from baseline (p < 0.05) are denoted with a *.

117
Figure 4.3. Carotid body inhibition attenuates blood pressure and temperature increases
during acrolein exposure. Panel A, B, C, and D refer to systolic blood pressure, diastolic
blood pressure, heart rate, and core body temperature respectively. Means and standard errors
are reported. Significant differences between groups (p < 0.05) are denoted with a *.
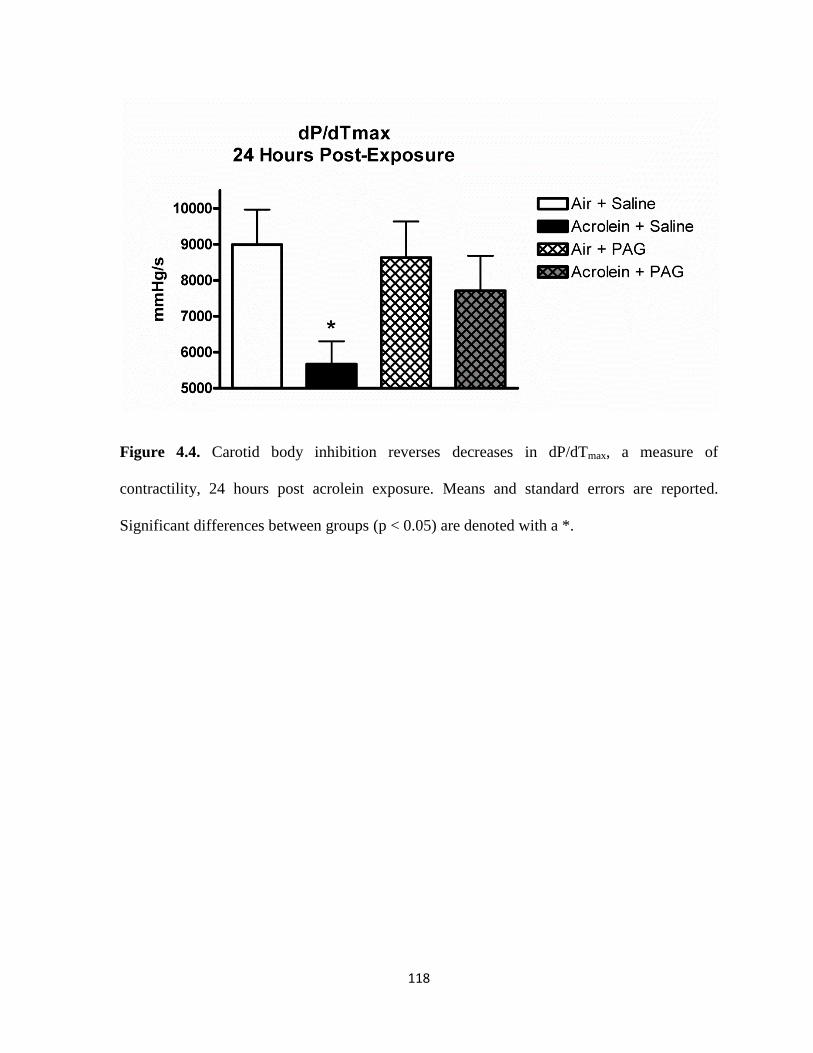
118
Figure 4.4. Carotid body inhibition reverses decreases in dP/dTmax, a measure of
contractility, 24 hours post acrolein exposure. Means and standard errors are reported.
Significant differences between groups (p < 0.05) are denoted with a *.

119
Figure 4.5. Decrease contractility one day after exposure is likely mediated by the
parasympathetic nervous system, while dobutamine infusion reveals significant increases in
contractility that is reversed by vagotomy. Panel A refers to baseline values of dP/dTmax 24
hours post exposure. Means and SEMs are reported. Significant differences (p < 0.05) from
air exposed rats with saline injection are denoted with a *. Panel B refers to dP/dTmax values
24 hours post exposure during 2 minute dobutamine infusion. Percent change values from
baseline and SEMs are reported. Significant differences between groups (p < 0.05) are
denoted with a *.
120
Acrolein-Induced Cardiovascular Dysfunction is Mediated by Carotid Body Sensing of Hypoxia
A crolein
Hypoxia (Low PO2)
Increased Sympathetic Activity
Carotid Body Brainstem
•Increased Blood Pressure•Increase Heart Rate•Increased Temperature
Cardiac effects
Effect s During Exposure Effect s 24 Hou rs A fter Exposure
Compensatory Increase in Parasympathetic Activity
•Decreased Cardiac ContractilityCardiac effects
Figure 4.6. Acrolein-induced cardiovascular dysfunction is mediated by carotid body sensing
of hypoxia. We propose that adverse cardiovascular events following acrolein exposure are
likely due to the carotid body response to hypoxia leading to increased sympathetic tone and
downstream cardiac effects.

Chapter 5
Conclusions and Implications
This dissertation research project sought to uncover the potential mechanisms
responsible for the adverse cardiovascular events associated with air pollution exposure. This
goal is predicated on a wealth of epidemiological studies showing that exposure to air
pollution causes increased cardiovascular morbidity and mortality, especially in individuals
with underlying cardiopulmonary diseases. Because epidemiological and experimental data
exists that suggest that hypoxia may play a role in the adverse cardiovascular effects of air
pollution, we tested the hypothesis that hypoxia mediates in part the cardiovascular effects of
air pollution. Spontaneously Hypertensive (SH) rats were used to model humans with
hypertension, a subgroup with acute sensitivity to the effects of air pollution exposure. A
number of studies were carried out in the SH rat to determine 1) if exposure to whole or
filtered DE and the toxic DE component acrolein cause adverse cardiovascular responses in
hypertensive rats compared to normotensive controls, 2) if a hypoxia stress test reveals
altered sensitivity in the hypertensive rat following acrolein exposure, 3) if acrolein exposure
itself causes decreases in blood oxygen levels, and 4) if the adverse cardiovascular effects of
acrolein are mediated by chemoreflex signaling in the carotid body.
122
Divergent Responses to Whole and Filtered Diesel Exhaust Inhalation in Spontaneously
Hypertensive Rats.
The initial set of experiments was a characterization study that examined the effects
of two concentrations of whole and filtered DE exposure in hypertensive (SH) and normal
(WKY) rats. Exposure to fDE, but not wDE, caused immediate electrocardiographic
alterations in cardiac repolarization (ST depression) and atrioventricular conduction block
(PR prolongation) as well as bradycardia in SH rats. Exposure to wDE, but not fDE, caused
post-exposure ST depression and increased sensitivity to the pulmonary C fiber agonist
capsaicin in SH rats. The divergent responses of fDE and wDE highlight the real challenge
of studying complex pollutants such as DE. It is apparent from this study that the gaseous
and particulate components of DE may be functioning through separate mechanisms and
therefore eliciting different responses. This is of great importance in epidemiological studies
because human exposures are rarely confined to a single pollutant exposure, and this study
demonstrates that multiple pollutants have the ability to interact and cause multiple
responses. Most of the responses in this study were seen with exposure to the gaseous
components of DE. It is possible that gases trigger immediate pulmonary effects through
nasal irritation. Gases will also quickly react with pulmonary receptors and elicit
cardiovascular responses such as bradycardia. Another possibility is that in wDE exposure,
particles and gases interact and alter the chemistry of the pollutant itself, leading to altered
responses compared to separate components alone. This demonstrates the need to model
multipollutant environments to understand interactions of constituents.
Notably, the responses to fDE occurred with the low concentration (150µg/m3),
showing the importance of modeling lower concentrations in experimental designs. Although

123
seemingly counterintuitive, lower concentrations of pollutants may cause more effects than
higher concentrations because lower doses of pollutants may activate receptors while higher
doses can overload the sensory network and blunt downstream responses. In a study that
examined causes for emergency room visits for elevated blood pressure, ambient levels of
NO2, SO2, PM2.5, and PM10 all had significant associations with increased hypertension-
related hospitalizations (Szyszkowicz et al., 2012). Researchers are becoming more and more
interested in environmentally relevant concentrations, and the most recent American Heart
Association statement on particulate matter air pollution and cardiovascular disease includes
recommendations that experimental studies better “describe the physiological relevance in
humans and the fundamental details of the mechanisms underlying the intermediate general
mediating pathways” (Brook et al., 2010). Future studies should take into account actual
exposure concentrations of human populations and extrapolate those concentrations to the
animal model.
One of the important findings of this study was that the gaseous components of DE
caused significant ST depression, a finding associated with myocardial ischemia. Although
myocardial ischemia was not directly measured, the potential of reduced oxygen availability
was of great interest and influenced the direction of subsequent studies. It turns out that
several studies have found decreases in oxygen saturation in humans following exposure to
PM and CAPs (DeMeo et al., 2004; Gong et al., 2004; Gong et al., 2005), which spurred our
interest in examining arterial blood oxygen levels in the final study. These findings were in
the development of the hypothesis that hypoxia is a mechanism by which the adverse
cardiovascular responses following air pollution exposure take place. Another major
conclusion from this study that affected the direction of the research was the finding that SH

124
rats were more sensitive to the effects of DE compared to WKY rats. Multiple
epidemiological studies have demonstrated that adverse events following PM exposure are
heightened in susceptible populations such as the elderly (Pope et al., 2002) and individuals
with diabetes (Zanobetti and Schawart, 2001), preexisting heart disease (Katsouyanni et al.,
2001) or heart failure (Goldberg et al., 2001). Clinically, hypertension can be a major risk
factor for adverse responses to air pollution. There may be several reasons for this including
inability to alter heart rate variability to respond to stressors as well as increased risk of
arrhythmia with hypertension that could predispose to more severe responses to air
pollutants. Hypertension is associated with several remodeling events that can lead to
heightened susceptibility including increased protein synthesis such as myosin and collagen,
mutations in genes encoding ion channels that lead to increased action potential duration,
altered calcium homeostasis leading to changes in cellular energetics, and decreased
sensitivity of β-adrenergic receptors (Swynghedauw, 1999). These changes may explain why
hypertension predisposes to adverse responses to air pollution seen clinically. Our studies
used the SH rat to model hypertension. The SH rat is an excellent model for hypertension,
and has been shown to develop increased vascular resistance, high systemic blood pressure,
and increased activation of the rennin-angiotensin system (Kodavanti et al., 2000).
Clinically, there are several different causes of hypertension including aging, obesity, and
insulin resistance. This is important to remember when extrapolated results from the SH rats.
In addition, SH rats have larger carotid bodies (Habeck et al., 1985) and are more sensitive to
the effects of hypoxia as evidenced by increased carotid sinus nerve activity and intracellular
Ca2+ changes (Weil et al., 1998). Despite hypertension originating in the kidney of the SH
rat, it can still be used as a model for humans because increased blood pressure leads to

125
similar phenotypes seen in diverse human populations such as high blood pressure, evidence
of cardiac remodeling, and vascular dysfunction.
Modern diesel engines have much stricter emissions criteria, creating much cleaner
exhaust emissions and limiting some of the more toxic air pollutants created by older diesel
engines (EPA Diesel, http://www.epa.gov/otaq/marine.htm). The diesel engine used in this
study was an older Yanmar L70 V diesel generator that did not have the more stringent
emission standards. Despite more efficient and cleaner engines in our modern diesel vehicles,
this study is still extremely relevant because diesel engines have an extremely long life span,
so many older, less efficient engines are on the road today and will be for decades to come.
In addition, the use of the newer diesel engines has not been adopted in the majority of the
developing world where air pollution is a major public health concern and particulate matter
levels are significantly higher than those in the United States. In addition, our studies found
that the gaseous components of DE causes most of the responses, so even fuel that greatly
reduces the sulfur content and particulate matter levels could still create emissions that
contain toxic gases. Because most of the responses observed in this study occurred with the
gaseous components of DE in hypertensive rats, we decided to focus on the effects of
acrolein, a key toxic gas found in DE, for future studies.
Acrolein Exposure Causes Significant Increases in Heart Rate and Blood Pressure in
Hypertensive Rats.
DE is a chemically complex source of ambient PM and thus defining modes of action
is challenging. In addition to PM, DE also consists of a mixture of gases including nitrogen
oxides (NOx), sulfur oxides (SOx), carbon monoxide (CO), and volatile organics including

126
aldehydes, benzene, and polycyclic aromatic hydrocarbons. The previous study with DE
revealed the importance of the gaseous components in driving the majority of cardiovascular
responses during exposure. Because of the complexity of DE and the importance of the
gaseous components in driving the cardiovascular responses, we decided to focus on a toxic
gaseous component of DE for future studies to explore the mechanisms controlling
cardiovascular responses to air pollution exposure. Acrolein is an α,β-unsaturated aldehyde
that is formed during the combustion of organic materials and is a toxic component of
cigarette smoke and internal combustion engine exhaust (Baeuchamp et al., 1985). Acrolein
exposure in SH rats increased heart rate, blood pressure, breathing frequency, minute
volume, and the heart rate variability parameter LF, suggesting a potential role for increased
sympathetic tone. Increased sympathetic tone is associated with an elevated risk of heart
disease (Pope et al., 2001) and may have driven the adverse cardiovascular effects of
acrolein. Green and Egle (1983) found that intravenous injection of acrolein in rats causes
significant increases in blood pressure that are reversed with guanethidine, a sympatholytic
drug. The acrolein concentration used in the study was 3ppm. In ambient air, 0.04 - 0.08 ppm
acrolein have been measured (Costa and Amdur, 1996), but cigarette smoke contains up to 90
ppm acrolein (Esterbauer et al., 1991), and acrolein levels in sidestream tobacco smoke are
as high as 10 ppm (Esterbauer et al., 1991). Acrolein is a highly reactive gas that will react
with any nucleophile it contacts in the airway. Acrolein may react with cysteine residues of
TRP channels that activate pulmonary C fibers (Takahashi and Mori, 2011). Pulmonary C
fiber activation in the lung can lead to reflex cardiac responses, characterized by apnea and
bradycardia (Widdicombe and Lee, 2001). It is clear from the data, however, that acrolein
exposure also causes hypoxia, which through the carotid body led to reflex increases in heart
127
rate and blood pressure among other changes. It is likely that both responses are occurring
with the irritant response initiated first as evidenced by the immediate ventilatory responses
with exposure. Signals from the pulmonary receptors, baroreceptors, and chemoreceptors
will all be integrated in the brain stem, and it is likely that interpreting multiple signals leads
to diverse responses in autonomic tone to balance conflicting input. The hypertensive rat was
clearly more susceptible to the effects of acrolein, a finding that supports our previous
findings with DE as well as epidemiological data. Although acrolein exposure alone
suggested enhanced sensitivity in hypertensive rats, we decided to conduct a stress test to
further delineate the enhanced susceptibility in rats with underlying hypertension. A stress
test is a common way to reveal enhanced sensitivity or the potential for adverse responses
because increased cardiovascular effort causes reduced oxygen availability to tissues and
may provoke autonomic imbalance (Goldberger et al., 2006). Numerous studies have shown
that stress tests trigger many adverse cardiovascular effects including increased cardiac
arrhythmias and deleterious changes in heart rate (HR), heart rate variability (HRV), an
indirect indicator of cardiac autonomic tone, and ECG parameters (Watanabe et al., 2001).
Multiple studies have shown that hypertensive individuals have abnormal responses to high
altitude with low atmospheric oxygen. In addition, exposures to the air pollutants tobacco
smoke (Adgent, 2006), sulfur dioxide and nitrogen dioxide (Hoppenbrouwers et al., 1981)
have been linked to abnormal cardiopulmonary sensitivity responses to hypoxia. These
findings suggest that exposure to hypoxia may be a useful stress test to unmask the latent
effects of air pollution.

128
Hypoxia Stress Test Reveals Exaggerated Cardiovascular Effects in Hypertensive Rats after
Exposure to the Air Pollutant Acrolein
The studies with DE and acrolein revealed heightened sensitivity in SH rats, but we
wanted to further determine the importance of underlying susceptibility in adverse
cardiovascular events 24 hours after acrolein exposure. Epidemiological studies indicate that
effects of air pollution exposure are not always immediate, usually manifesting some time
after exposure. For example, Peters et al. (2004) showed that humans exposed to traffic were
more susceptible to myocardial infarction up to 24 hours after exposure. In addition, patients
with implanted cardioverter defibrillators had increased incidence of life-threatening
arrhythmias up to 2 days after air pollution exposure (Peters et al., 2000). These findings
suggest that techniques that help manifest latent responses may be useful in uncovering
subtle subclinical effects of air pollution exposure. This approach is predicated on the idea
that air pollution primes the cardiovascular system to exaggerated responses to subsequent
nonspecific stressors and has been put to practice in the form of exercise stress testing in
humans (Gold et al., 2005) and dobutamine and isoproterenol pharmacologic challenge in
rats (Hazari et al., 2012; Andre et al., 2011). A novel stress test was developed that set out to
mimic the heightened sensitivity of individuals with hypertension to sub-atmospheric oxygen
as happens at high altitude. In order to determine latent responses of acrolein exposure, we
developed an acute hypoxia stress test that involved short-term exposure to a 10% oxygen
atmosphere. The hypoxia stress test after acrolein exposure revealed increased diastolic blood
pressure only in hypertensive rats and increased minute volume and expiratory time only in
normotensive rats. The hypoxia stress test further demonstrated the enhanced susceptibility
of the hypertensive rat and created an additional stress test to determine enhanced sensitivity
129
to air pollutants. Importantly, hypoxia stress test caused ventilatory responses in WKY rats
that were absent in the SH rat. Researchers often assume that enhanced susceptibility means
a greater response, but it can also mean the lack of a response when one is expected or
required to compensate for an environmental insult. This is critical to remember when
defining susceptibility and looking for risk factors in the clinic. Future studies should
incorporate additional pollutants to further define the usefulness of this stress test. Given that
acrolein induced blood pressure and heart rate changes are preceded by apnea in hypertensive
rats (Hazari et al., 2008), we explored the possibility that acrolein exposure causes drops in
blood oxygen levels.
Acrolein Exposure Causes Significant Decreases in pO2 and Significant Increases in pCO2 in
Hypertensive Rats.
Acrolein exposure caused significant decreases in arterial blood pO2 and significant
increases in arterial blood pCO2 in hypertensive rats. While we did not see significant
reductions in SaO2 as found in humans exposed to air pollution, this is likely due to the fact
that SaO2 is well buffered from rapid decreases due to the sigmoidal nature of the oxy-
hemoglobin dissociation curve (Urbano and Mohsenin, 2006). Additionally, the
epidemiological studies linking reduction in SaO2 and pollutant exposure were based on
pulse oximetry recordings (Gong et al., 2004; Gong et al., 2005). These measurements are
not as sensitive as direct analysis of arterial blood, as used in this study. This is important to
note as reductions in pO2 may be a more sensitive indicator of a pollutant’s effect on blood
oxygen levels because a large drop in pO2 is required to alter SaO2. Normal pO2 levels in
humans and rats range from 80-100 mmHg, and a drop in partial pressure below 60 mmHg is
130
required for hypoxemia. Although we did not see a decrease to this extent, small decreases in
pO2 as well as small increases in pCO2 are able to activate the carotid body. Acrolein
exposure also caused an increase in pCO2 and increases in pCO2 as small as 5 mmHg have
been shown to activate the body’s response to hypoxia (Whipp, 1994). Importantly, hypoxia
is associated with increased sympathetic tone and increased blood pressure, which were both
observed in our exposure studies with acrolein. In addition to these changes, SH rats also had
significant decreases in K+ during acrolein exposure. The reason for this is unclear, but it
may be related to increased aldosterone levels in the SH rat from acrolein-induced increases
in blood pressure. Changes in blood gas parameters only occurred in SH rats. Future studies
should treat SH rats with antihypertensive drugs and determine if the blood gas levels remain
unchanged with acrolein exposure. This would allow us to determine if underlying
hypertension is responsible for the reduction in pO2. This could be extremely important in
clinical studies looking at the effects of air pollutants on oxygen saturation because
susceptible populations could have a more severe decrease in SaO2 and be potentially more
susceptible to harmful effects. The fact that acrolein exposure resulted in decreased pO2,
increased pCO2, and significant increases in blood pressure and heart rate suggests that the
carotid body may be mediating some of the cardiovascular responses to acrolein, a possibility
that was examined in the final study.
Pharmacological Inhibition of the Carotid Body Attenuates Blood Pressure Increases during
Acrolein Exposure.
In order to determine if the cardiovascular effects of acrolein exposure are mediated
by the chemoreflex response to hypoxia, we pharmacologically inhibited the carotid body
131
prior to acrolein exposure using the CSE-inhibitor PAG . Control rats exposed to acrolein
had significant increases in MAP, systolic, and diastolic blood pressure, consistent with our
previous study with acrolein (Perez et al., 2013). Pretreatment with the CSE-inhibitor PAG
blocked acrolein-induced blood pressure increases, suggesting that the carotid body is at least
in part mediating the cardiovascular response to acrolein. Acrolein also diminished cardiac
contractility one day after exposure; this response was also blocked by pre-treatment with
PAG. The prevention of the acrolein-induced decrease in contractility with PAG pretreatment
suggests that the impaired contractility response one day after exposure with acrolein was a
compensatory mechanism characterized by rebound increases in parasympathetic tone
mediated by carotid body chemoreceptor signaling. Early autonomic responses triggered by
the carotid were likely characterized by increased sympathetic tone during exposure, which
were followed by rebound increases in parasympathetic tone after exposure. This explanation
is strengthened by the fact that bilateral vagotomy reversed decreases in contractility 24
hours after exposure, suggesting parasympathetic mediation. While these findings combined
with the blood oxygenation data strongly suggest a role for the carotid body, mediation by
the carotid body may be further demonstrated by measuring carotid body nerve impulse
formation during exposure to acrolein to confirm increased carotid body activity. Another
option is to look at activation of the sympathetic trunk. Carotid body signaling leads to
increased sympathetic activation, which increases blood pressure, ventilation, heart rate, and
arrhythmogenicity (Lopez-Barneo et al., 2008). Measurement of sympathetic nerve activity
during or immediately following acrolein exposure would further strengthen the hypothesis
that the carotid body is mediating the cardiovascular response. Acrolein served as an
excellent positive control pollutant in this study, but it may be useful to repeat the
132
experiments with a less irritating air pollutant to determine if the carotid body is still
involved. Because acrolein reacts so quickly with the lung and causes a significant irritant
response, exposure to a less irritating air pollutant may determine if carotid body activation is
related to the irritant response or separate mechanisms. We are currently analyzing ECG,
HRV, and arrhythmogenesis, and these results will give more insight into the potential
importance of the carotid body in the response to acrolein exposure and may provide
additional evidence of autonomic modulation.
We also looked at the effects of dobutamine, a sympathomimetic, on contractility one
day after acrolein exposure. Acrolein exposed rats showed enhanced sensitivity to
dobutamine one day after exposure. This response may be due to increased vascular
resistance, as has been found with exposure to acrolein, and may not be the result of
exaggerated sympathetic tone. Increases in contractility during dobutamine infusion were
eliminated with bilateral vagotomy. Although the mechanism causing the responses one day
after exposure are difficult to decipher, the body has many ways to respond to air pollutants,
and it is likely that more than one mechanism is activated upon inhalation of different
pollutants. The type, size, shape, and reactivity of the pollutant as well as the duration of
exposure and underlying susceptibility of the individual or animal will determine the
differential activation of pulmonary reflex responses, baroreceptor reflex responses,
chemoreceptor reflex responses and other physiological responses. These responses,
particularly in a multipollutant setting as evident from our findings with whole and filtered
DE can often times lead to opposing effects.
133
Summary and Broad Perspective of Findings.
There are several postulated mechanisms of action explaining the cardiovascular
effects associated with exposure to air pollution including irritant or sensory receptor
activation leading to changes in autonomic balance, activation of systemic inflammatory
pathways that impact vascular function, and direct effects of translocated air pollution
components (Brook et al., 2010). Based on our findings, air pollutant-induced hypoxia is a
potential mechanism controlling adverse cardiac responses. This study provides evidence that
exposure to air pollution, especially irritants like acrolein, may cause decreases in blood
oxygen levels that activate the carotid body and lead to increased blood pressure and heart
rate and impaired contractility. This is of potentially great interest to the field of air pollution
epidemiology because the potential repercussions of decreased oxygen availability in cardiac
morbidity and mortality following exposure to air pollution are underexplored.
This research also helps fill significant data gaps in our current understanding of the
effects of air pollution on cardiovascular health. The American Heart Association (AHA)
scientific statement on PM air pollution and cardiovascular disease states that mechanistic
studies should “investigate the interaction between preexisting traditional cardiovascular risk
factors and PM exposure, as well as the potential of air pollutants to exacerbate or worsen
these risk factors” (Brook et al., 2010). All of the studies focus on a rat model of
hypertension, a known susceptibility factor for humans exposed to air pollution (Dong et al.,
2013). We found heightened sensitivity to DE and acrolein in hypertensive rats compared to
normotensive controls. The hypertensive phenotype was associated with increased
electrocardiographic abnormalities, increased sensitivity to hypoxia stress test, and
significant changes to blood pressure and heart rate with air pollutant exposure. Importantly,
134
decreased pO2 and carotid body activation were only observed in the hypertensive rat,
suggesting that hypertensive individuals may be at risk through previously understudied
mechanisms. This research adds a wealth of new data that better characterizes hypertension
as a risk factor for cardiac dysfunction in air pollution exposures. These findings are
consistent with epidemiological data and suggest further exploration of the interactions
between air pollutants and the physiological and biological sequelae in hypertension. In
addition, the AHA recommends that exposure studies “expand our knowledge related to the
“responsible” PM pollution constituents (eg, metals, organic compounds, semiquinones,
endotoxin, and VOC and SVOC compounds), size fractions (eg, UFPs), sources (eg, traffic,
power generation, and biomass combustion), and mixtures of pollutants” (Brook et al.,
2010). Our studies with DE examined the separate effects of whole (particles + gases) and
filtered (gases alone) components and found that greater toxicity (PR prolongation and ST
depression) was associated with the gaseous components of DE. This study demonstrated for
the first time that whole DE and particulate-free DE from the same diesel engine source
trigger divergent electrocardiographic responses. Subsequent studies revealed enhanced
sensitivity to the pulmonary irritant acrolein and suggest that the toxic gases found in DE
may be responsible for some of the cardiac responses following exposure.
All of the epidemiological studies that examine changes in oxygen saturation
following air pollution exposure relied on pulse oximetry measurements (Gong et al., 2004;
Gong et al., 2005), a device placed on the finger that measures arterial blood oxygen
saturation using light absorbance. This measurement is not as sensitive as direct analysis of
arterial blood and demonstrates the increased sensitivity of the system used in this study.
This presents a great strength of our mechanistic studies, and shows that even with small

135
decreases in SaO2 in humans during air pollution exposure, the potential reductions in pO2
may be significantly greater. Therefore, little to no changes in SaO2 may underestimate the
cardiovascular risk associated with hypoxic responses attributed to air pollution exposure. In
addition, we found significant cardiac effects during exposure to DE at a relatively low
concentration (150 µg/m3). This finding is significant because responses may not follow
conventional dose-response relationships, thus complicating standard setting. In addition,
most of the adverse cardiac effects we found were in the filtered DE, suggesting that gaseous
components of DE may be driving some of the responses. There are currently no NAAQS
standards for most of the gaseous components of DE. This presents a potential gap in current
human risk factor settings because diesel components such as acrolein are known to cause
adverse effects, even at low doses. Furthermore, whole DE with its full complement of
particulate and gaseous constituents elicited fewer effects than DE gases alone. This suggests
the possibility that constituents interact and/or elicit divergent and potentially opposing
mechanisms of toxicity, which may complicate the hazard identification and risk assessment
of multipollutant air sheds. This research provides important information for risk assessment
and fills data gaps in our knowledge of pollutant effects on the heart, but it also raises
additional questions and provides future study directions in animal models and humans.
Multiple questions still exist regarding the role of hypoxia in air pollutant-induced
cardiovascular dysfunction. Our studies utilized pharmacologic inhibition of the carotid body
with PAG, but there are additional methods that may more reliably inhibit carotid body
signaling. Peng et al. (2010) used the CSE knockout mouse which has a genetic deletion of
the CSE enzyme and therefore has a severely impaired carotid body response to hypoxia.
Although PAG has been shown to inhibit the carotid body in rats (Peng et al., 2010), we did
136
not directly measure carotid body signaling, so similar findings to our inhibition studies in a
knockout model would provide additional evidence for carotid-body mediation of the
cardiovascular effects of acrolein exposure. In addition, the role of the vasculature was not a
focus of this research, but vasoconstriction following acrolein exposure could be a potential
driver of the sustained decreases in oxygen we found during exposure. Hypoxia is known to
cause pulmonary vasoconstriction (Voelkel et al., 2013), and studies have found that acrolein
causes increased blood pressure and vasoconstriction as well as depletion of antioxidants
(Yousefipour et al., 2005). Measurements of vascular tone could provide potential
explanations for sustained decreases in oxygen and large increases in blood pressure
observed in these studies. Also, the role of pulmonary receptors in driving the irritant
response to acrolein is an important avenue to consider. Acrolein elicits a host of responses in
pulmonary cells including epithelial damage, activation of stress kinases, induction of mucus
secretion, and altered production of inflammatory mediators (Moretto et al., 2012).
Pharmacological inhibition or knock out models of specific pulmonary receptors such as
TRPV receptors may reveal that the downstream cardiac responses to acrolein are mediated
by a primary response in the lung. Finally, there are several epidemiological studies linking
exposure to air pollutants with decreased oxygen saturation (Gong et al., 2004; Gong et al.,
2005), but all of these studies used pulse oximetry to measure SaO2. Pulse oximetry is not as
sensitive as direct analysis of arterial blood and small changes in SaO2 may be coupled with
large decreases in pO2 due to the sigmoidal shape of the oxy-hemoglobin dissociation curve.
Ideally, serial blood draws in humans exposed to air pollution would provide more robust
measurements of changes in blood gases during exposure. This may reveal even more
significant decreases in oxygen levels during exposure and would add tremendous strength to

137
the hypothesis that air pollutant-induced hypoxia is driving the cardiac responses during
exposure.
Taken together, the findings of these studies further characterize the effects of DE and
acrolein exposure on cardiac health, suggest divergent responses with gaseous constituents of
DE relative to whole DE, demonstrate that underlying disease confers greater susceptibility
to adverse cardiac responses following air pollution exposure, and provide evidence that the
adverse cardiovascular effects of acrolein exposure are due, at least in part, to carotid body
reflex signally leading to increased sympathetic tone followed by rebound increases in
parasympathetic tone. The findings described in this research dissertation provide biological
plausibility to the epidemiological findings that link air pollution to adverse cardiovascular
effects, which may reduce uncertainty in standard setting and facilitate risk assessment.

138
Bibliography
Abad-Cardiel, M., Alvarez-Álvarez, B., Luque-Fernandez, L., Fernández, C., Fernández-
Cruz, A., Martell-Claros, N. (2013). Hypertension caused by primary hyperaldosteronism:
increased heart damage and cardiovascular risk. Rev. Esp. Cardiol. 66, 47-52.
Adgent, M.A. (2006). Environmental tobacco smoke and sudden infant death syndrome: a
review. Birth Defects Res. B. Dev. Reprod. Toxicol. 77, 69-85.
Al Haddad, H., Mendez-Villanueva, A., Bourdon, P.C., Buchheit, M. (2012). Effect of acute
hypoxia on post-exercise parasympathetic reactivation in healthy men. Front Physiol. 3, 289.
Amancio, C.T., Nascimento, L.F. (2012). Association of sulfur dioxide exposure with
circulatory system deaths in a medium-sized city in Brazil. Braz. J. Med. Biol. Res. 45(11),
1080-1085.
André, L., Gouzi, F., Thireau, J., Meyer, G., Boissiere, J., Delage, M., Abdellaoui, A.,
Feillet- Coudray, C., Fouret, G., Cristol, J.P., Lacampagne, A., Obert, P., Reboul, C.,
Fauconnier, J., Hayot, M., Richard, S., Cazorla, O. (2011). Carbon monoxide exposure
enhances arrhythmia after cardiac stress: involvement of oxidative stress. Basic Res. Cardiol.
106, 1235-1246.
Anselme, F., Loriot, S., Henry, J.P., Dionnet, F., Napoleoni, J.G., Thuillez, C., and Morin,
J.P. (2007). Inhalation of diluted diesel engine emission impacts heart rate variability and
arrhythmia occurrence in a rat model of chronic ischemic heart failure. Arch. Toxicol. 81,
299-307.
Asmar, A., Mohandas, R., Wingo, C.S. (2012). A physiologic-based approach to the
treatment of a patient with hypokalemia. Am. J. Kidney Dis. 60, 492-497.
Bao, M.H., Dai, W., Li, Y.J., Hu, C.P. (2011). Rutaecarpine prevents hypoxia-reoxygenation-
induced myocardial cell apoptosis via inhibition of NADPH oxidases. Can. J. Physiol.
Pharmacol. 89, 177-186.
Bartoli, C.R., Wellenius, G.A., Diaz, E.A., Lawrence, J., Coull, B.A., Akiyama, I., Lee,
L.M., Okabe, K., Verrier, R.L., Godleski, J.J. (2009). Mechanisms of inhaled fine particulate
air pollution-induced arterial blood pressure changes. Environ. Health Perspect. 117, 361-
366.
Berger, A., Zareba, W., Schneider, A., Rückerl, R., Ibald-Mulli, A., Cyrys, J., Wichmann,
H.E., and Peters, A. (2006). Runs of ventricular and supraventricular tachycardia triggered by
air pollution in patients with coronary heart disease. J. Occup. Environ. Med. 48, 1149-1158.
Bernardo, B.C., Weeks, K.L., Pretorius, L., and McMullen, J.R. (2010). Molecular
distinction between physiological and pathological cardiac hypertrophy: experimental
findings and therapeutic strategies. Pharmacol. Ther. 128, 191-227.
http://www.ncbi.nlm.nih.gov/pubmed?term=Andr%C3%A9%20L%5BAuthor%5D&cauthor=true&cauthor_uid=21822772
http://www.ncbi.nlm.nih.gov/pubmed?term=Abdellaoui%20A%5BAuthor%5D&cauthor=true&cauthor_uid=21822772
http://www.ncbi.nlm.nih.gov/pubmed?term=Lacampagne%20A%5BAuthor%5D&cauthor=true&cauthor_uid=21822772
139
Bigger, J.T., Fleiss, J.L., Rolnitzky, L.M., Steinman, R.C. (1993). The ability of several
short-term measures of RR variability to predict mortality after myocardial infarction.
Circulation. 88, 927-934.
Brook, R.D., and Rajagopalan, S. (2009). Particulate matter, air pollution, and blood
pressure. J. Am. Soc. Hypertens. 3, 332-350.
Brook, R.D., Franklin, B., Cascio, W., Hong, Y., Howard, G., Lipsett, M., Luepker, R.,
Mittleman, M., Samet, J., Smith, S.C,, Tager, I. (2004). Air pollution and cardiovascular
disease: a statement for healthcare professionals form the expert panel on population and
prevention science of the American Heart Association. Circulation. 109, 2566-2671.
Brook, R.D., Rajagopalan, S., Pope, C.A. III, Brook, J.R., Bhatnagar, A., Diez-Roux, A.V.,
Holguin, F., Hong, Y., Luepker, R.V., Mittleman, M.A., Peters, A., Siscovick, D., Smith,
S.C. Jr., Whitsel, L., and Kaufman, J.D. (2010). Particulate matter air pollution and
cardiovascular disease: An update to the scientific statement from the American Heart
Association. Circulation. 121, 2331-2378.
Burnett, R.T., Smith-Doiron, M., Stieb, D., Raizenne, M.E., Brook, J.R., Dales, R.E. (2001).
Association between ozone and hospitalization for acute respiratory diseases in children less
than 2 years of age. Am. J. Epidemiol. 153, 444–452.
Campen, M.J., Babu, N.S., Helms, G.A., Pett, S., Wernly, J., Mehran, R., and McDonald,
J.D. (2005). Nonparticulate components of diesel exhaust promote constriction in coronary
arteries from ApoE-/- mice. Toxicol. Sci. 88, 95-102.
Carll, A.P., Haykal-Coates, N., Winsett, D.W., Rowan, W.H. III, Hazari, M.S., Ledbetter,
A.D., Nyska, A., Cascio, W.E., Watkinson, W.P., Costa, D.L., and Farraj, A.K. (2010).
Particulate matter inhalation exacerbates cardiopulmonary injury in a rat model of
isoproterenol-induced cardiomyopathy. Inhal. Toxicol. 22, 355-68.
Carll, A.P., Hazari, M.S., Perez, C.M., Krantz, Q.T., King, C.J., Winsett, D.W., Costa, D.L.,
Farraj, A.K. (2012). Whole and particle-free diesel exhausts differentially affect cardiac
electrophysiology, blood pressure, and autonomic balance in heart failure-prone rats. Toxicol.
Sci. 128, 490-499.
Carll, A.P., Hazari, M.S., Perez, C.M., Krantz, Q.T., King, C.J., Haykal-Coates, N., Winsett,
D.W., Costa, D.L., Farraj, A.K. (To be submitted). Diesel Exhaust-Induced Cardiac
Dysfunction Is Mediated by Sympathetic Dominance in Heart Failure-Prone Rats.
Charles River Laboratories (2005). Charles River Surgical Capabilities Reference Paper. 13,
#1.
Chen, B., Kan, H. (2008). Air pollution and population health: a global challenge. Environ.
Health Prev. Med. 13, 94–101.
140
Chen, H., Goldberg, M.S., Burnett, R.T., Jerrett, M., Wheeler, A.J., Villeneuve, P.J. (2013).
Long-Term Exposure to Traffic-Related Air Pollution and Cardiovascular Mortality.
Epidemiology. 24, 35-43.
Choi, M., Curriero, F.C., Johantgen, M., Mills, M.E.C., Sattler, B., Lipscomb, J. (2011).
Association between ozone and emergency department visits: an ecological study. Int. J.
Environ. Health Res. 21, 201–221.
Coleridge, H.M., Coleridge, J.C. (1994). Neural regulation of bronchial blood flow. Respir.
Physiol. 98, 1-13.
Coleridge, H.M., Coleridge, J.C., Poore, E.R., Roberts, A.M., Schultz, H.D. (1984). Aortic
wall properties and baroreceptor behaviour at normal arterial pressure and in acute
hypertensive resetting in dogs. J. Physiol. 350, 309-326.
Conde, S.V., Monteiro, E.C. (2004). Hypoxia induces adenosine release from the rat carotid
body. J. Neurochem. 89, 1148-1156.
Conklin, D.J., Bhatnagar, A., Cowley, H.R., Johnson, G.H., Wiechmann, R.J., Sayre, L.M.,
Trent, M.B., Boor, P.J. (2006). Acrolein generation stimulates hypercontraction in isolated
human blood vessels. Toxicol Appl Pharmacol. 217, 277-288.
Constanza, L.O. (2006). Cardiovascular Physiology. In Physiology. 4th
ed. Chapter 5.
Corey, L.M., Baker, C., Luchtel, D.L. (2006). Heart-rate variability in the apolipoprotein E
knockout transgenic mouse following exposure to Seattle particulate matter. J. Toxicol.
Environ. Health A. 69, 953-965.
Costa, D.L., and Amdur, M.O. (1996). Air Pollution. In Casarett & Doull’s Toxicology, 5th
ed., pp. 857-882.
Davies, S.W., Wedzicha, J.A. (1993). Hypoxia and the heart. Br. Heart J. 69, 3-5.
DeMeo, D.L., Zanobetti, A., Litonjua, A.A., Coull, B.A., Schwartz, J., Gold, D.R. (2004).
Ambient air pollution and oxygen saturation. Am. J. Respir. Crit. Care Med. 170, 383-387.
Dickens, C. Bleak House. Syndicate Trading Company. New York, New York.
Dockery, D.W., Luttmann-Gibson, H., Rich, D.Q., Link, M.S., Mittleman, M.A., Gold, D.R.,
Koutrakis, P., Schwartz, J.D., and Verrier, R.L. (2005). Association of air pollution with
increased incidence of ventricular tachyarrhythmias recorded by implanted cardioverter
defibrillators. Environ. Health Perspect. 113, 670-674.
Dockery, D.W., Pope, C.A. III. (1994). Acute respiratory effects of particulate air pollution.
Annu. Rev. Public Health 15, 107–132.

141
Dockery, D.W., Pope, C.A., Xu, X., Spengler, J.D,, Ware, J.H., Fay, M.E., Ferris, B.G.,
Speizer, F.E. (1993). An association between air pollution and mortality in six U.S. cities. N.
Engl. J. Med. 329, 1753-1759.
Dominici, F., Peng, R., Bell, M., Pham, L., McDermott, A., Zeger, S. and Samet, J. (2006).
Fine Particulate Air Pollution and Hospital Admission for Cardiovascular and Respiratory
Diseases. JAMA 295, 1127-1134.
Donaldson, K., Stone, V., Seaton, A., MacNee, W. (2001). Ambient particle inhalation and
the cardiovascular system: potential mechanisms. Environ. Health Perspect. 4, 523-527.
Dong, G.H., Qian, Z.M., Xaverius, P.K., Trevathan, E., Maalouf, S., Parker, J., Yang, L.,
Liu, M.M., Wang, D., Ren, W.H., Ma, W., Wang, J., Zelicoff, A., Fu, Q., Simckes, M.
(2013). Association between long-term air pollution and increased blood pressure and
hypertension in china. Hypertension. 61, 578-584.
Downing, S.E., Remensnyder, J.P., Mitchell, J.H. (1962). Cardiovascular responses to
hypoxia stimulation of the carotid bodies. Circulation Research. 10, 676-685.
Elias, S.O., Dina, T., Sofola, O.A. (2004). Carotid chemoreceptor reflexes following dietary
salt loading in rats. Blood Press. 13, 316-320.
El-Mas, M.M., and Abdel-Rahman, A.A. (2005). Longitudinal studies on the effect of
hypertension on circadian hemodynamic and autonomic rhythms in telemetered rats. Life Sci.
76, 901-915.
Esterbauer, H., Schaur, R.J., Zollner, H. (1991). Chemistry and biochemistry of 4-
hydroxynonenal, malonaldehyde and related aldehydes. Free Radic. Biol. Med. 11, 81–128.
Farraj, A.K., Haykal-Coates, N., Winsett, D.W., Hazari, M.S., Carll, A.P., Rowan, W.H.,
Ledbetter, A.D., Cascio, W.E., and Costa, D.L. (2009). Increased non-conducted P-wave
arrhythmias after a single oil fly ash inhalation exposure in hypertensive rats. Environ.
Health Perspect. 117, 709-715.
Farraj, A.K., Hazari, M.S., and Cascio, W.E. (2011). The Utility of the Small Rodent
Electrocardiogram in Toxicology. Toxicol. Sci. 121:11-30.
Farraj, A.K., Hazari, M.S., Haykal-Coates, N., Lamb, C., Winsett, D.W., Ge, Y., Ledbetter,
A.D., Carll, A.P., Bruno, M., Ghio, A., and Costa, D.L. (2011). ST Depression, Arrhythmia,
Vagal Dominance, and Reduced Cardiac Micro-RNA in Particulate-Exposed Rats. Am. J.
Respir. Cell Mol. Biol. 44, 185-196.
Faustini, A., Stafoggia, M., Berti, G., Bisanti, L., Chiusolo, M., Cernigliaro, A., Mallone, S.,
Primerano, R., Scarnato, C., Simonato, L., Vigotti, M.A., Forastiere, F. (2011). The
142
relationship between ambient particulate matter and respiratory mortality: a multi-city study
in Italy. Eur. Respir. J. 38, 538-547.
Firket, J. (1936). Fog along the Meuse Valley. Trans. Faraday Soc. 32, 1192-1196.
Fuks, K., Moebus, S., Hertel, S., Viehmann, A., Nonnemacher, M., Dragano, N.,
Möhlenkamp, S., Jakobs, H., Kessler, C., Erbel, R., Hoffmann, B., Heinz Nixdorf Recall
Study Investigative Group. (2011). Long-term urban particulate air pollution, traffic noise,
and arterial blood pressure. Environ. Health Perspect. 119, 1706-1711.
Fullerton, D.G., Bruce, N., Gordon, S.B. (2008). Indoor air pollution from biomass fuel
smoke is a major health concern in the developing world. Trans. R. Soc. Trop. Med. Hyg.
102, 843–851.
Freet, C.S., Stoner, J.F., Tang, X. (2013). Baroreflex and chemoreflex controls of
sympathetic activity following intermittent hypoxia. Auton. Neurosci. 174, 8-14.
Ghio, A.J., Cohen, M.D. (2005). Disruption of iron homeostasis as a mechanism of biologic
effect by ambient air pollution particles. Inhal Toxicol. 17, 709 –716.
Ghio, A.J., Suliman, H.B., Carter, J.D., Abushamaa, A.M., and Folz, R.J. (2002).
Overexpression of extracellular superoxide dismutase decreases lung injury after exposure to
oil fly ash. Am. J. Physiol. Lung Cell Mol. Physiol. 283, 211-218.
Goldberg, M.S., Burnett, R.T., Bailar, J.C., Tamblyn, R., Ernst, P., Flegel, K., Brook, J.,
Bonvalot, Y., Singh, R., Valois, M.F., Vincent, R. (2001). Identification of persons with
cardiorespiratory conditions who are at risk of dying from the acute effects of ambient air
particles. Environ. Health Perspect. 109, 487–494.
Gong, H., Linn, W.S., Clark, K.W., Anderson, K.R., Geller, M.D., Sioutas, C. (2005).
Respiratory responses to exposures with fine particulates and nitrogen dioxide in the elderly
with and without COPD. Inhal. Toxicol. 17, 123-132.
Gong, H., Linn, W.S., Terrell, S.L., Anderson, K.R., Clark, K.W., Sioutas, C., Cascio, W.E.,
Alexis, N., Devlin, R.B. (2004). Exposures of elderly volunteers with and without chronic
obstructive pulmonary disease (COPD) to concentrated ambient fine particulate pollution.
Inhal. Toxicol. 16, 731-744.
Gold, D.R., Litonjua, A.A., Zanobetti, A., Coull, B.A., Schwartz, J., MacCallum, G., Verrier,
R.L., Nearing, B.D., Canner, M.J., Suh, H., and Stone, P.H. (2005). Air pollution and ST-
segment depression in elderly subjects. Environ. Health Perspect. 113, 883-887.
Goldberger, J. J., Le, F. K., Lahiri, M., Kannankeril, P. J., Ng, J. and Kadish, A. H. (2006).
Assessment of parasympathetic reactivation after exercise. Am. J. Physiol. Heart Circ.
Physiol. 290, H2446-52.
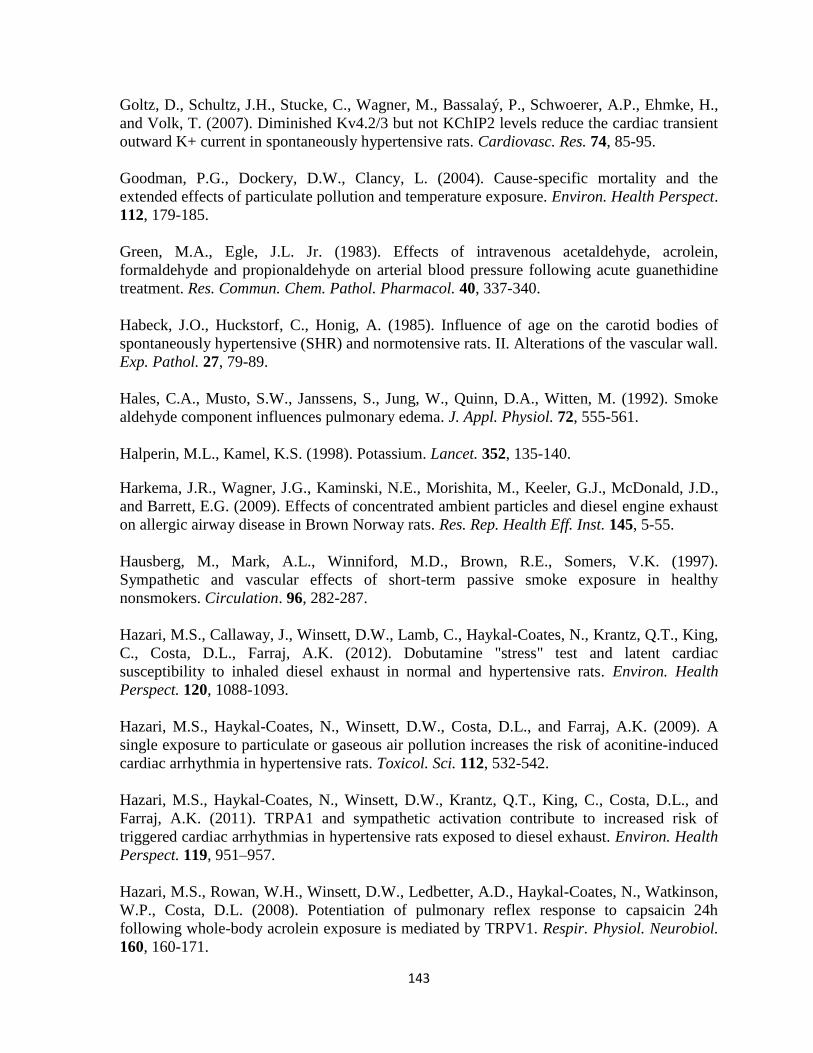
143
Goltz, D., Schultz, J.H., Stucke, C., Wagner, M., Bassalaý, P., Schwoerer, A.P., Ehmke, H.,
and Volk, T. (2007). Diminished Kv4.2/3 but not KChIP2 levels reduce the cardiac transient
outward K+ current in spontaneously hypertensive rats. Cardiovasc. Res. 74, 85-95.
Goodman, P.G., Dockery, D.W., Clancy, L. (2004). Cause-specific mortality and the
extended effects of particulate pollution and temperature exposure. Environ. Health Perspect.
112, 179-185.
Green, M.A., Egle, J.L. Jr. (1983). Effects of intravenous acetaldehyde, acrolein,
formaldehyde and propionaldehyde on arterial blood pressure following acute guanethidine
treatment. Res. Commun. Chem. Pathol. Pharmacol. 40, 337-340.
Habeck, J.O., Huckstorf, C., Honig, A. (1985). Influence of age on the carotid bodies of
spontaneously hypertensive (SHR) and normotensive rats. II. Alterations of the vascular wall.
Exp. Pathol. 27, 79-89.
Hales, C.A., Musto, S.W., Janssens, S., Jung, W., Quinn, D.A., Witten, M. (1992). Smoke
aldehyde component influences pulmonary edema. J. Appl. Physiol. 72, 555-561.
Halperin, M.L., Kamel, K.S. (1998). Potassium. Lancet. 352, 135-140.
Harkema, J.R., Wagner, J.G., Kaminski, N.E., Morishita, M., Keeler, G.J., McDonald, J.D.,
and Barrett, E.G. (2009). Effects of concentrated ambient particles and diesel engine exhaust
on allergic airway disease in Brown Norway rats. Res. Rep. Health Eff. Inst. 145, 5-55.
Hausberg, M., Mark, A.L., Winniford, M.D., Brown, R.E., Somers, V.K. (1997).
Sympathetic and vascular effects of short-term passive smoke exposure in healthy
nonsmokers. Circulation. 96, 282-287.
Hazari, M.S., Callaway, J., Winsett, D.W., Lamb, C., Haykal-Coates, N., Krantz, Q.T., King,
C., Costa, D.L., Farraj, A.K. (2012). Dobutamine "stress" test and latent cardiac
susceptibility to inhaled diesel exhaust in normal and hypertensive rats. Environ. Health
Perspect. 120, 1088-1093.
Hazari, M.S., Haykal-Coates, N., Winsett, D.W., Costa, D.L., and Farraj, A.K. (2009). A
single exposure to particulate or gaseous air pollution increases the risk of aconitine-induced
cardiac arrhythmia in hypertensive rats. Toxicol. Sci. 112, 532-542.
Hazari, M.S., Haykal-Coates, N., Winsett, D.W., Krantz, Q.T., King, C., Costa, D.L., and
Farraj, A.K. (2011). TRPA1 and sympathetic activation contribute to increased risk of
triggered cardiac arrhythmias in hypertensive rats exposed to diesel exhaust. Environ. Health
Perspect. 119, 951–957.
Hazari, M.S., Rowan, W.H., Winsett, D.W., Ledbetter, A.D., Haykal-Coates, N., Watkinson,
W.P., Costa, D.L. (2008). Potentiation of pulmonary reflex response to capsaicin 24h
following whole-body acrolein exposure is mediated by TRPV1. Respir. Physiol. Neurobiol.
160, 160-171.
http://www.ncbi.nlm.nih.gov/pubmed?term=Ledbetter%20AD%5BAuthor%5D&cauthor=true&cauthor_uid=17950047
http://www.ncbi.nlm.nih.gov/pubmed?term=Watkinson%20WP%5BAuthor%5D&cauthor=true&cauthor_uid=17950047

144
Henneberger, A., Zareba, W., Ibald-Mulli, A., Rückerl, R., Cyrys, J,. Couderc, J.P., Mykins,
B., Woelke, G., Wichmann, H.E., Peters, A. (2005). Repolarization changes induced by air
pollution in ischemic heart disease patients. Environ Health Perspect. 113, 440-446.
Hoek, G., Brunekreef, B., Goldbohm, S., Fischer, P., and van den Brandt, P.A. (2002).
Association between mortality and indicators of traffic related air pollution in the
Netherlands: a cohort study. Lancet 360, 1203–1209.
Hoffmann, B., Moebus, S., Stang, A., Beck, E.M., Dragano, N., Möhlenkamp, S.,
Schmermund, A., Memmesheimer, M., Mann, K., Erbel, R., and Jöckel, K.H. (2006).
Residence close to high traffic and prevalence of coronary heart disease. Eur. Heart J. 27,
2696– 2702.
Houle, M.S., Billman, G.E. (1999). Low-frequency component of the heart rate variability
spectrum: a poor marker of sympathetic activity. Am. J. Physiol. 276, 215-223.
Hoppenbrouwers, T., Calub, M., Arakawa, K., Hodgman, J.E. (1981). Seasonal relationship
of sudden infant death syndrome and environmental pollutants. Am. J. Epidemiol. 113, 623-
635.
Hultström M. (2012). Development of structural kidney damage in spontaneously
hypertensive rats. J. Hypertens. 30, 1087-1091.
Ismahil, M.A., Hamid, T., Haberzettl, P., Gu, Y., Chandrasekar, B., Srivastava, S.,
Bhatnagar, A., Prabhu, S.D. (2001). Chronic oral exposure to the aldehyde pollutant acrolein
induces dilated cardiomyopathy. Am. J. Physiol. Heart Circ. Physiol. 301, 2050-2060.
Iturriaga, R., Rey, S., Del Rio, R. (2005). Cardiovascular and ventilatory acclimatization
induced by chronic intermittent hypoxia: A role for the carotid body in the pathophysiology
of sleep apnea Biol. Res. 38, 335-340.
Janssens, S.P., Musto, S.W., Hutchison, W.G., Spence, C., Witten, M., Jung, W., Hales, C.A.
(1994). Cyclooxygenase and lipoxygenase inhibition by BW-755C reduces acrolein smoke-
induced acute lung injury. J. Appl. Physiol. 77, 888-895.
Jun, K. (2009). Case study of air pollution episodes in meuse valley of Belgium, Donora of
Pennsylvania, and London, U.K. Environmental Toxicology and Human Health. 1, 1-3.
Kamm, S., Möhler O., Naumann, K.H., Saathoff, H., and Schurath, U. (1999). The
heterogeneous reaction of ozone with soot aerosol. Atmos. Environ. 33, 4651-4661.
Katsouyanni K, Touloumi G, Samoli E, Gryparis, A., Le Tertre, A., Monopolis, Y., Rossi,
G., Zmirou, D., Ballester, F., Boumghar, A., Anderson, H.R., Wojtyniak, B., Paldy, A.,
Braunstein, R., Pekkanen, J., Schindler, C., Schwartz, J. (2001). Confounding and effect
http://www.ncbi.nlm.nih.gov/pubmed?term=Haberzettl%20P%5BAuthor%5D&cauthor=true&cauthor_uid=21908791
http://www.ncbi.nlm.nih.gov/pubmed?term=Srivastava%20S%5BAuthor%5D&cauthor=true&cauthor_uid=21908791
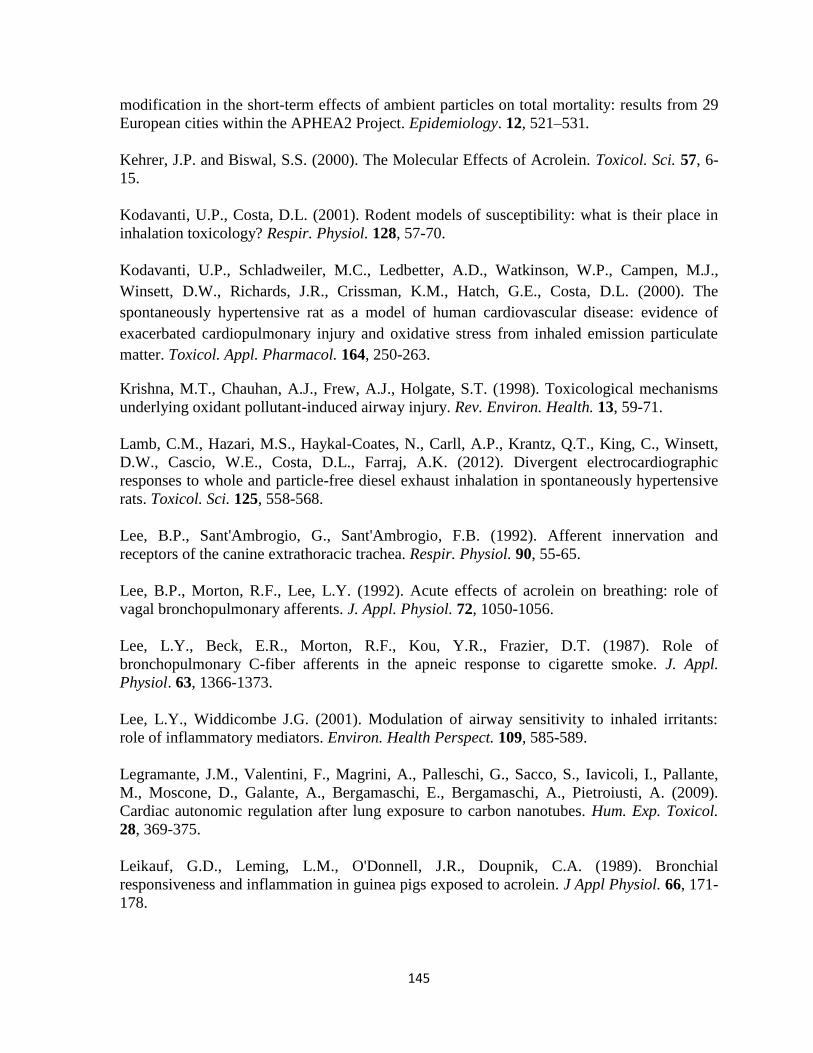
145
modification in the short-term effects of ambient particles on total mortality: results from 29
European cities within the APHEA2 Project. Epidemiology. 12, 521–531.
Kehrer, J.P. and Biswal, S.S. (2000). The Molecular Effects of Acrolein. Toxicol. Sci. 57, 6-
15.
Kodavanti, U.P., Costa, D.L. (2001). Rodent models of susceptibility: what is their place in
inhalation toxicology? Respir. Physiol. 128, 57-70.
Kodavanti, U.P., Schladweiler, M.C., Ledbetter, A.D., Watkinson, W.P., Campen, M.J.,
Winsett, D.W., Richards, J.R., Crissman, K.M., Hatch, G.E., Costa, D.L. (2000). The
spontaneously hypertensive rat as a model of human cardiovascular disease: evidence of
exacerbated cardiopulmonary injury and oxidative stress from inhaled emission particulate
matter. Toxicol. Appl. Pharmacol. 164, 250-263.
Krishna, M.T., Chauhan, A.J., Frew, A.J., Holgate, S.T. (1998). Toxicological mechanisms
underlying oxidant pollutant-induced airway injury. Rev. Environ. Health. 13, 59-71.
Lamb, C.M., Hazari, M.S., Haykal-Coates, N., Carll, A.P., Krantz, Q.T., King, C., Winsett,
D.W., Cascio, W.E., Costa, D.L., Farraj, A.K. (2012). Divergent electrocardiographic
responses to whole and particle-free diesel exhaust inhalation in spontaneously hypertensive
rats. Toxicol. Sci. 125, 558-568.
Lee, B.P., Sant'Ambrogio, G., Sant'Ambrogio, F.B. (1992). Afferent innervation and
receptors of the canine extrathoracic trachea. Respir. Physiol. 90, 55-65.
Lee, B.P., Morton, R.F., Lee, L.Y. (1992). Acute effects of acrolein on breathing: role of
vagal bronchopulmonary afferents. J. Appl. Physiol. 72, 1050-1056.
Lee, L.Y., Beck, E.R., Morton, R.F., Kou, Y.R., Frazier, D.T. (1987). Role of
bronchopulmonary C-fiber afferents in the apneic response to cigarette smoke. J. Appl.
Physiol. 63, 1366-1373.
Lee, L.Y., Widdicombe J.G. (2001). Modulation of airway sensitivity to inhaled irritants:
role of inflammatory mediators. Environ. Health Perspect. 109, 585-589.
Legramante, J.M., Valentini, F., Magrini, A., Palleschi, G., Sacco, S., Iavicoli, I., Pallante,
M., Moscone, D., Galante, A., Bergamaschi, E., Bergamaschi, A., Pietroiusti, A. (2009).
Cardiac autonomic regulation after lung exposure to carbon nanotubes. Hum. Exp. Toxicol.
28, 369-375.
Leikauf, G.D., Leming, L.M., O'Donnell, J.R., Doupnik, C.A. (1989). Bronchial
responsiveness and inflammation in guinea pigs exposed to acrolein. J Appl Physiol. 66, 171-
178.
http://www.ncbi.nlm.nih.gov/pubmed?term=Kodavanti%20UP%5BAuthor%5D&cauthor=true&cauthor_uid=11535263
http://www.ncbi.nlm.nih.gov/pubmed?term=Kodavanti%20UP%5BAuthor%5D&cauthor=true&cauthor_uid=10799335
http://www.ncbi.nlm.nih.gov/pubmed?term=Ledbetter%20AD%5BAuthor%5D&cauthor=true&cauthor_uid=10799335
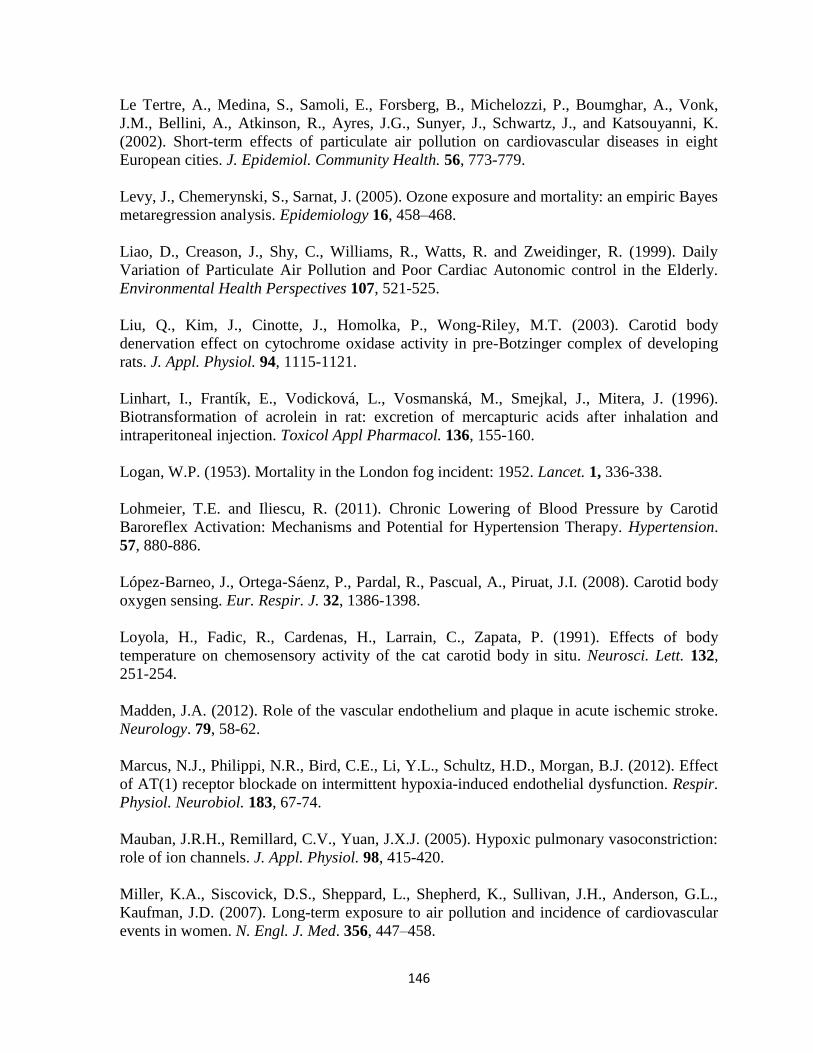
146
Le Tertre, A., Medina, S., Samoli, E., Forsberg, B., Michelozzi, P., Boumghar, A., Vonk,
J.M., Bellini, A., Atkinson, R., Ayres, J.G., Sunyer, J., Schwartz, J., and Katsouyanni, K.
(2002). Short-term effects of particulate air pollution on cardiovascular diseases in eight
European cities. J. Epidemiol. Community Health. 56, 773-779.
Levy, J., Chemerynski, S., Sarnat, J. (2005). Ozone exposure and mortality: an empiric Bayes
metaregression analysis. Epidemiology 16, 458–468.
Liao, D., Creason, J., Shy, C., Williams, R., Watts, R. and Zweidinger, R. (1999). Daily
Variation of Particulate Air Pollution and Poor Cardiac Autonomic control in the Elderly.
Environmental Health Perspectives 107, 521-525.
Liu, Q., Kim, J., Cinotte, J., Homolka, P., Wong-Riley, M.T. (2003). Carotid body
denervation effect on cytochrome oxidase activity in pre-Botzinger complex of developing
rats. J. Appl. Physiol. 94, 1115-1121.
Linhart, I., Frantík, E., Vodicková, L., Vosmanská, M., Smejkal, J., Mitera, J. (1996).
Biotransformation of acrolein in rat: excretion of mercapturic acids after inhalation and
intraperitoneal injection. Toxicol Appl Pharmacol. 136, 155-160.
Logan, W.P. (1953). Mortality in the London fog incident: 1952. Lancet. 1, 336-338.
Lohmeier, T.E. and Iliescu, R. (2011). Chronic Lowering of Blood Pressure by Carotid
Baroreflex Activation: Mechanisms and Potential for Hypertension Therapy. Hypertension.
57, 880-886.
López-Barneo, J., Ortega-Sáenz, P., Pardal, R., Pascual, A., Piruat, J.I. (2008). Carotid body
oxygen sensing. Eur. Respir. J. 32, 1386-1398.
Loyola, H., Fadic, R., Cardenas, H., Larrain, C., Zapata, P. (1991). Effects of body
temperature on chemosensory activity of the cat carotid body in situ. Neurosci. Lett. 132,
251-254.
Madden, J.A. (2012). Role of the vascular endothelium and plaque in acute ischemic stroke.
Neurology. 79, 58-62.
Marcus, N.J., Philippi, N.R., Bird, C.E., Li, Y.L., Schultz, H.D., Morgan, B.J. (2012). Effect
of AT(1) receptor blockade on intermittent hypoxia-induced endothelial dysfunction. Respir.
Physiol. Neurobiol. 183, 67-74.
Mauban, J.R.H., Remillard, C.V., Yuan, J.X.J. (2005). Hypoxic pulmonary vasoconstriction:
role of ion channels. J. Appl. Physiol. 98, 415-420.
Miller, K.A., Siscovick, D.S., Sheppard, L., Shepherd, K., Sullivan, J.H., Anderson, G.L.,
Kaufman, J.D. (2007). Long-term exposure to air pollution and incidence of cardiovascular
events in women. N. Engl. J. Med. 356, 447–458.

147
Mills, N.L., Törnqvist, H., Gonzalez, M.C., Vink, E., Robinson, S.D., Söderberg, S., Boon,
N.A., Donaldson, K., Sandström, T., Blomberg, A., and Newby, D.E. (2007). Ischemic and
thrombotic effects of dilute diesel-exhaust inhalation in men with coronary heart disease. N.
Engl. J. Med. 357, 1075-1082.
Mills, N.L., Miller, M.R., Lucking, A.J., Beveridge, J., Flint, L., Boere, A.J., Fokkens, P.H.,
Boon, N.A., Sandstrom, T., Blomberg, A., Duffin, R., Donaldson, K., Hadoke, P.W., Cassee,
F.R., and Newby, D.E. (2011a). Combustion-derived nanoparticulate induces the adverse
vascular effects of diesel exhaust inhalation. Eur. Heart J. 32, 2660-2671.
Mills, N.L., Finlayson, A.E., Gonzalez, M.C., Törnqvist, H., Barath, S., Vink, E., Goudie, C.,
Langrish, J.P., Söderberg, S., Boon, N.A., Fox, K.A., Donaldson, K., Sandström, T.,
Blomberg, A., and Newby, D.E. (2011b). Diesel exhaust inhalation does not affect heart
rhythm or heart rate variability. Heart 97, 544-550.
Mohammad, M.K., Avila, D., Zhang, J., Barve, S., Arteel, G., McClain, C., Joshi-Barve, S.
(2012). Acrolein cytotoxicity in hepatocytes involves endoplasmic reticulum stress,
mitochondrial dysfunction and oxidative stress. Toxicol. Appl. Pharmacol. 265, 73-82.
Møller, P., Jackobsen, N.R., Folkmann, J.K., Danielsen, P.H., Mikkelsen, L., Hemmingsen,
J.G., Vesterdal, L.K., Forchhammer, L., Wallin, K., Loft, S. (2010). Role of oxidative
damage in toxicity of particulates. Free Radic Res. 44, 1– 46.
Moretto, N., Bertolini, S., Iadicicco, C., Marchini, G., Kaur, M., Volpi, G., Patacchini, R.,
Singh, D., Facchinetti, F. (2012). Cigarette smoke and its component acrolein augment IL-
8/CXCL8 mRNA stability via p38 MAPK/MK2 signaling in human pulmonary cells. Am. J.
Physiol. Lung Cell Mol. Physiol. 303, 929-398.
Moretto, N., Volpi, G., Pastore, F., Facchinetti, F. (2012). Acrolein effects in pulmonary
cells: relevance to chronic obstructive pulmonary disease. Ann. N .Y. Acad. Sci. 1259, 39-46.
Muhlfeld, C., Rothen-Rutishauser, B., Blank, F., Vanhecke, D., Ochs, M., Gehr, P. (2008).
Interactions of nanoparticles with pulmonary structures and cellular responses. Am J Physiol
Lung Cell Mol Physiol. 294, L817–L829.
Mulvany, M.J., and Halpern, W. (1977). Contractile properties of small arterial resistance
vessels in spontaneously hypertensive and normotensive rats Circ. Res. 41, 19-26.
NAAQS. National Ambient Air Quality Standards, US EPA. http://www.epa.gov/air/
criteria.html.
NATA. 2005 National-Scale Air Toxics Assessment. http://www.epa.gov/ttn/atw/nata2005/.
National Center for Environmental Assessment Office of Research and Development. May
2002. Health Assessment Document for Diesel Engine Exhaust. EPA/600/8-90/057F.
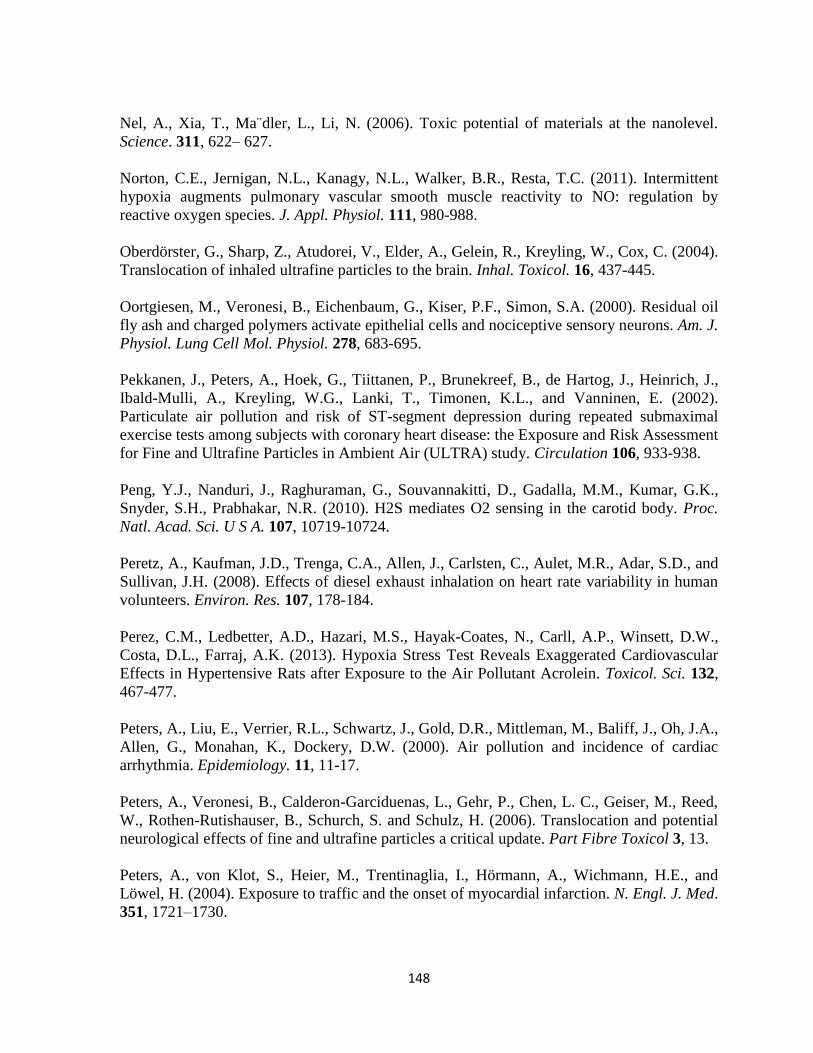
148
Nel, A., Xia, T., Ma¨dler, L., Li, N. (2006). Toxic potential of materials at the nanolevel.
Science. 311, 622– 627.
Norton, C.E., Jernigan, N.L., Kanagy, N.L., Walker, B.R., Resta, T.C. (2011). Intermittent
hypoxia augments pulmonary vascular smooth muscle reactivity to NO: regulation by
reactive oxygen species. J. Appl. Physiol. 111, 980-988.
Oberdörster, G., Sharp, Z., Atudorei, V., Elder, A., Gelein, R., Kreyling, W., Cox, C. (2004).
Translocation of inhaled ultrafine particles to the brain. Inhal. Toxicol. 16, 437-445.
Oortgiesen, M., Veronesi, B., Eichenbaum, G., Kiser, P.F., Simon, S.A. (2000). Residual oil
fly ash and charged polymers activate epithelial cells and nociceptive sensory neurons. Am. J.
Physiol. Lung Cell Mol. Physiol. 278, 683-695.
Pekkanen, J., Peters, A., Hoek, G., Tiittanen, P., Brunekreef, B., de Hartog, J., Heinrich, J.,
Ibald-Mulli, A., Kreyling, W.G., Lanki, T., Timonen, K.L., and Vanninen, E. (2002).
Particulate air pollution and risk of ST-segment depression during repeated submaximal
exercise tests among subjects with coronary heart disease: the Exposure and Risk Assessment
for Fine and Ultrafine Particles in Ambient Air (ULTRA) study. Circulation 106, 933-938.
Peng, Y.J., Nanduri, J., Raghuraman, G., Souvannakitti, D., Gadalla, M.M., Kumar, G.K.,
Snyder, S.H., Prabhakar, N.R. (2010). H2S mediates O2 sensing in the carotid body. Proc.
Natl. Acad. Sci. U S A. 107, 10719-10724.
Peretz, A., Kaufman, J.D., Trenga, C.A., Allen, J., Carlsten, C., Aulet, M.R., Adar, S.D., and
Sullivan, J.H. (2008). Effects of diesel exhaust inhalation on heart rate variability in human
volunteers. Environ. Res. 107, 178-184.
Perez, C.M., Ledbetter, A.D., Hazari, M.S., Hayak-Coates, N., Carll, A.P., Winsett, D.W.,
Costa, D.L., Farraj, A.K. (2013). Hypoxia Stress Test Reveals Exaggerated Cardiovascular
Effects in Hypertensive Rats after Exposure to the Air Pollutant Acrolein. Toxicol. Sci. 132,
467-477.
Peters, A., Liu, E., Verrier, R.L., Schwartz, J., Gold, D.R., Mittleman, M., Baliff, J., Oh, J.A.,
Allen, G., Monahan, K., Dockery, D.W. (2000). Air pollution and incidence of cardiac
arrhythmia. Epidemiology. 11, 11-17.
Peters, A., Veronesi, B., Calderon-Garciduenas, L., Gehr, P., Chen, L. C., Geiser, M., Reed,
W., Rothen-Rutishauser, B., Schurch, S. and Schulz, H. (2006). Translocation and potential
neurological effects of fine and ultrafine particles a critical update. Part Fibre Toxicol 3, 13.
Peters, A., von Klot, S., Heier, M., Trentinaglia, I., Hörmann, A., Wichmann, H.E., and
Löwel, H. (2004). Exposure to traffic and the onset of myocardial infarction. N. Engl. J. Med.
351, 1721–1730.
http://www.ncbi.nlm.nih.gov/pubmed?term=Oortgiesen%20M%5BAuthor%5D&cauthor=true&cauthor_uid=10749745
http://www.ncbi.nlm.nih.gov/pubmed?term=Eichenbaum%20G%5BAuthor%5D&cauthor=true&cauthor_uid=10749745
http://www.ncbi.nlm.nih.gov/pubmed?term=Raghuraman%20G%5BAuthor%5D&cauthor=true&cauthor_uid=20556885
http://www.ncbi.nlm.nih.gov/pubmed?term=Prabhakar%20NR%5BAuthor%5D&cauthor=true&cauthor_uid=20556885
149
Pope, C.A. III, Eatough, D.J., Gold, D.R., Pang, Y., Nielsen, K.R., Nath, P., Verrier, R.L.,
Kanner, R.E. (2001). Acute exposure to environmental tobacco smoke and heart rate
variability. Environ. Health Perspect. 109, 711-716.
Pope, C.A., Burnett, R.T., Thun, M.J., Calle, E.E., Krewski, D., Ito, K., Thurston, G.D.
(2002). Lung cancer, cardiopulmonary mortality, and long-term exposure to fine particulate
air pollution. JAMA. 287, 1132–1141.
Pope, C.A., Burnett, R.T., Thurston, G.D., Thun, M.J., Calle, E.E., Krewski, D., Godleski,
J.J. (2004). Cardiovascular mortality and long-term exposure to particulate air pollution:
epidemiological evidence of general pathophysiological pathways of disease. Circulation
109, 71-77.
Pope, C.A., Dockery, D.W., Kanner, R.E., Villegas, G.M., Schwartz, J. (1999). Oxygen
saturation, pulse rate, and particulate air pollution: a daily time-series panel study. Am. J.
Respir. Crit. Care Med. 159, 365–372.
Pope, C.A. 3rd, Muhlestein, J.B., May, H.T., Renlund, D.G., Anderson, J.L., Horne, B.D.
(2006). Ischemic heart disease events triggered by short-term exposure to fine particulate air
pollution. Circulation. 114, 1863-1872.
Pys-Roberts, C., Greene, L.T., Meloche, R., Foex, P. (1971). Studies of anesthesia in relation
to hypertension. II: Haemodynamic consequences of induction and endotracheal intubation.
Br. J. Anaesth. 43, 531-547.
Quan, S.F., Gersh, B.J.; National Center on Sleep Disorders Research; National Heart, Lung,
and Blood Institute. (2004). Cardiovascular consequences of sleep-disordered breathing: past,
present and future: report of a workshop from the National Center on Sleep Disorders
Research and the National Heart, Lung, and Blood Institute. Circulation. 109, 951-957.
Reboul, C., Thireau, J., Meyer, G., André, L., Obert, P., Cazorla, O., Richard, S. (2012).
Carbon monoxide exposure in the urban environment: an insidious foe for the heart? Respir.
Physiol. Neurobiol. 184, 204-212.
Rhodes, H.L., Chesterman, K., Chan, C.W., Collins, P., Kewley, E., Pattinson, K.T., Myers,
S., Imray, C.H., Wright, A.D.; Birmingham Medical Research Expeditionary Society. (2011).
Systemic blood pressure, arterial stiffness and pulse waveform analysis at altitude. J. R. Army
Med. Corps. 157, 110-113.
Richard, N.A., Koehle, M.S. (2012). Differences in cardio-ventilatory responses to hypobaric
and normobaric hypoxia: a review. Aviat. Space Environ. Med. 83, 677-684.
Ris, C. (2007). U.S. EPA health assessment for diesel engine exhaust: a review. Inhal.
Toxicol. 1, 229-239.
http://www.ncbi.nlm.nih.gov/pubmed?term=Andr%C3%A9%20L%5BAuthor%5D&cauthor=true&cauthor_uid=22705012
http://www.ncbi.nlm.nih.gov/pubmed?term=Chesterman%20K%5BAuthor%5D&cauthor=true&cauthor_uid=21465920
150
Roman, A., Saundry, P. (2007). American Meteorological Society (AMS). Air Pollution
Control Act of 1955, United States. Encyclopedia of Earth. July 5, 2007; Retrieved
December 30, 2012 <http://www.eoearth.org/article/Air_Pollution_Control_Act_of_1955,_
United_States>.
Roux, J.C., Peyronnet, J., Pascual, O., Dalmaz, Y., Pequignot, J.M. (2000). Ventilatory and
central neurochemical reorganisation of O2 chemoreflex after carotid sinus nerve transection
in rat. J. Physiol. 522, 493-501.
Rowan, W.H. 3rd, Campen, M.J,, Wichers, L.B., Watkinson, W.P. (2007). Heart rate
variability in rodents: uses and caveats in toxicological studies. Cardiovasc. Toxicol. 7, 28-
51.
Sapire, D.W., Shah, J.J., and Black, I.F. (1979). Prolonged atrioventricular conduction in
young children and adolescents. The role of increased vagal tone. S. Afr. Med. J. 55, 669-
763.
Schulz, H., Harder, V., Ibald-Mulli, A., Khandoga, A., Koenig, W., Krombach, F.,
Radykewicz, R., Stampfl, A., Thorand, B., Peters, A. (2005). Cardiovascular effects of fine
and ultrafine particles. J. Aerosol. Med 18, 1-22.
Schwartz, J. and Morris, R. (1995). Air Pollution and Hospital Admissions for
Cardiovascular Disease in Detroit, Michigan. American Journal of Epidemiology 142, 23-35.
Shapiro, J.I., Banerjee, A., Reiss, O.K., Elkins, N. (1998). Acute and chronic hypokalemia
sensitize the isolated heart to hypoxic injury. Am. J. Physiol. 274, 1598-1604.
Singh, R., Cornelissen, G., Weydahl, A., Schwartzkopff, O., Katinas, G., Otsuka, K.,
Watanabe, Y., Yano, S., Mori, H., Ichimaru, Y., Mitsutake, G., Pella, D., Fanghong, L.,
Zhao, Z., Rao, R., Gvozdjakova, A. and Halberg, F. (2003). Circadian heart rate and blood
pressure variability considered for research and patient care. International Journal of
Cardiology 87, 9-28.
Sinnreich, R., Kark, J.D., Friedlander, Y., Sapoznikov, D., Luria, M.H. (1998). Five minute
recordings of heart rate variability for population studies: repeatability and age-sex
characteristics. Heart. 80, 156-162.
Srebot, V., Gianicolo, E.A., Rainaldi, G., Trivella, M.G., Sicari, R. (2009). Ozone and
cardiovascular injury. Cardiovasc. Ultrasound. 7, 30-38.
Srivastava, S., Sithu, S.D., Vladykovskaya, E., Haberzettl, P., Hoetker, D.J., Siddiqui, M.A.,
Conklin, D.J., D'Souza, S.E., Bhatnagar, A. (2011). Oral exposure to acrolein exacerbates
atherosclerosis in apoE-null mice. Atherosclerosis. 215, 301-308.
Swynghedauw, B. (1999). Molecular mechanisms of myocardial remodeling. Physiol. Rev.
79, 215-262.
http://www.ncbi.nlm.nih.gov/pubmed?term=Watkinson%20WP%5BAuthor%5D&cauthor=true&cauthor_uid=17646680
http://www.ncbi.nlm.nih.gov/pubmed?term=Friedlander%20Y%5BAuthor%5D&cauthor=true&cauthor_uid=9813562
http://www.ncbi.nlm.nih.gov/pubmed?term=Gianicolo%20EA%5BAuthor%5D&cauthor=true&cauthor_uid=19552797
http://www.ncbi.nlm.nih.gov/pubmed?term=Srivastava%20S%5BAuthor%5D&cauthor=true&cauthor_uid=21371710
http://www.ncbi.nlm.nih.gov/pubmed?term=Haberzettl%20P%5BAuthor%5D&cauthor=true&cauthor_uid=21371710

151
Szyszkowicz, M., Rowe, B.H., Brook, R.D. (2012). Even low levels of ambient air pollutants
are associated with increased emergency department visits for hypertension. Can. J. Cardiol.
28, 360-366.
Takahashi, N. and Mori, Y. (2011). TRP channels as sensors and signal integrators of redox
satus changes. Frontiers in Pharmacology 2, 1-11.
Urbano, F., Mohsenin, V. (2006). Chronic obstructive pulmonary disease and sleep: the
interaction. Panminerva Med. 48, 223-230.
US EPA. History of the US EPA. http://epa.gov/air/caa/caa_history.html
US EPA. Diesel. http://www.epa.gov/otaq/marine.htm
Utell, M.J., Frampton, M.W., Zareba, W., Devlin, R.B., Cascio, W.E. (2002). Cardiovascular
effects associated with air pollution: potential mechanisms and methods of testing. Inhal.
Toxicol. 14, 1231-1247.
Vallejo, M., Ruiz, S., Hermosillo, A.G., Borja-Aburto, V.H., Cárdenas, M. (2006). Ambient
fine particles modify heart rate variability in young healthy adults. J. Expo. Sci. Environ.
Epidemiol. 16, 125-130.
Van Hee, V.C., Adar, S.D., Szpiro, A.A., Barr, R.G., Bluemke, D.A., Diez Roux, A.V., Gill,
E.A., Sheppard, L., and Kaufman, J.D. (2009). Exposure to traffic and left ventricular mass
and function: the Multi-Ethnic Study of Atherosclerosis. Am. J. Respir. Crit. Care Med. 179,
827-834.
Vatner, S.F. and Rutherford, J.D. (1978). Control of the Myocardial Contractile State by
Carotid Chemo- and Baroreceptor and Pulmonary Inflation Reflexes in Conscious Dogs. J.
Clin. Invest. 61, 1593–1601.
Voelkel, N.F., Mizuno, S., Bogaard, H.J. (2013).The role of hypoxia in pulmonary vascular
diseases: a perspective. Am. J. Physiol. Lung Cell. Mol. Physiol. 304, 457-465.
Walgenbach, S.C. & Shepherd, J.T. (1984). Role of arterial and cardiopulmonary
mechanoreceptors in the regulation of arterial pressure during rest and exercise in conscious
dogs. Mayo Clin. Proc. 59, 467–475.
Walker, M.J., Curtis, M.J., Hearse, D.J., Campbell, R.W., Janse, M.J., Yellon, D.M., Cobbe,
S.M., Coker, S.J., Harness, J.B., Harron, D.W., and et al. (1988). The Lambeth Conventions:
guidelines for the study of arrhythmias in ischaemia infarction, and reperfusion. Cardiovasc.
Res. 22, 447-455.
Wang, A.L., Blackford, T.L., Lee, L.Y. (1996). Vagal bronchopulmonary C-fibers and acute
ventilatory response to inhaled irritants. Respir. Physiol. 104, 231-239.
152
Wang, T., Lang, G.D., Moreno-Vinasco, L., Huang, Y., Goonewardena, S.N., Peng, Y.J.,
Svensson, E.C., Natarajan, V., Lang, R.M., Linares, J.D., Breysse, P.N., Geyh, A.S., Samet,
J.M., Lussier, Y.A., Dudley, S., Prabhakar, N.R., Garcia, J.G. (2012). Particulate matter
induces cardiac arrhythmias via dysregulation of carotid body sensitivity and cardiac sodium
channels. Am. J. Respir. Cell Mol. Biol. 46, 524-531.
Watanabe, J., Thamilarasan, M., Blackstone, E. H., Thomas, J. D. and Lauer, M. S. (2001).
Heart rate recovery immediately after treadmill exercise and left ventricular systolic
dysfunction as predictors of mortality: the case of stress echocardiography. Circulation 104,
1911-1916.
Watkinson, W.P., Wiester, M.J., and Highfill, J.W. (1995). Ozone toxicity in the rat. I. Effect
of changes in ambient temperature on extrapulmonary physiological parameters. J. Appl.
Physiol. 78, 1108-1120.
Weil, J.V., Stevens, T., Pickett, C.K., Tatsumi, K., Dickinson, M.G., Jacoby, C.R., Rodman,
D.M. (1998). Strain-associated differences in hypoxic chemosensitivity of the carotid body in
rats. Am. J. Physiol. 274, 767-774.
Wellenius, G.A., Coull, B.A., Godleski, J.J., Koutrakis, P., Okabe, K., Savage, S.T.,
Lawrence, J.E., Murthy, G.G., Verrier, R.L. (2003). Inhalation of concentrated ambient air
particles exacerbates myocardial ischemia in conscious dogs. Environ. Health Perspect. 111,
402-408.
Whipp, B.J. (1994). Carotid bodies and breathing in humans. Thorax 49, 1081-1084.
Yang, J.M., Ho, C.W., Lin, R.H., Lin, R.T., Lin, M.T., Yin, T.H., Chai, C.Y. (1992).
Reduction of blood PO2 decrease and PCO2 increase during asphyxia by paramedian
reticular nucleus in cats. Brain Res. Bull. 29, 573-579.
Widdicombe, J., Lee, L.Y. (2001) Airway reflexes, autonomic function, and cardiovascular
responses. Environ. Health Perspect. 109, 579-584.
Yousefipour, Z., Ranganna, K., Newaz, M.A., Milton, S.G. (2005). Mechanism of acrolein-
induced vascular toxicity. J. Physiol. Pharmacol. 56, 337-353.
Yu, B.H., Mills, P.J., Ziegler, M.G., Dimsdale, J.E. (1999). Sympathetic and respiratory
responses to hypoxia in essential hypertension. Clin. Exp. Hypertens. 21, 249-262.
Zanobetti, A., Canner, M.J., Stone, P.H., Schwartz, J., Sher, D., Eagan-Bengston, E., Gates,
K.A., Hartley, L.H., Suh, H., and Gold, D.R. (2004). Ambient pollution and blood pressure in
cardiac rehabilitation patients. Circulation 110, 2184-2189.
Zanobetti, A., Gold, D.R., Stone, P.H., Suh, H.H., Schwartz, J., Coull, B.A., Speizer, F.E.
(2010). Reduction in heart rate variability with traffic and air pollution in patients with
coronary artery disease. Environ. Health Perspect. 118, 324-330.

153
Zanobetti, A., Schawart, J. (2001). Are diabetics more susceptible to the health effects of
airborne particles? Am. J. Respir. Crit. Care Med. 164, 831–833.
Zhu, Y., Hinds, W.G., Kim, S., Shen, S., and Sioutas, C. (2002). Study of ultrafine particles
near a major highway with heavy-duty diesel traffic. Atmos. Environ. 36, 4323–4335.