The Role of Health Care Providers in Addressing the Childhood Obesity Epidemic · ·...
31
Suzanne Bennett Johnson 2012 APA President [email protected] The Role of Health Care Providers in Addressing the Childhood Obesity Epidemic http://www.healthjockey.com/2010/04/07/world-health-day-childhood- obesity-is-more-serious-than-thought/
Transcript of The Role of Health Care Providers in Addressing the Childhood Obesity Epidemic · ·...
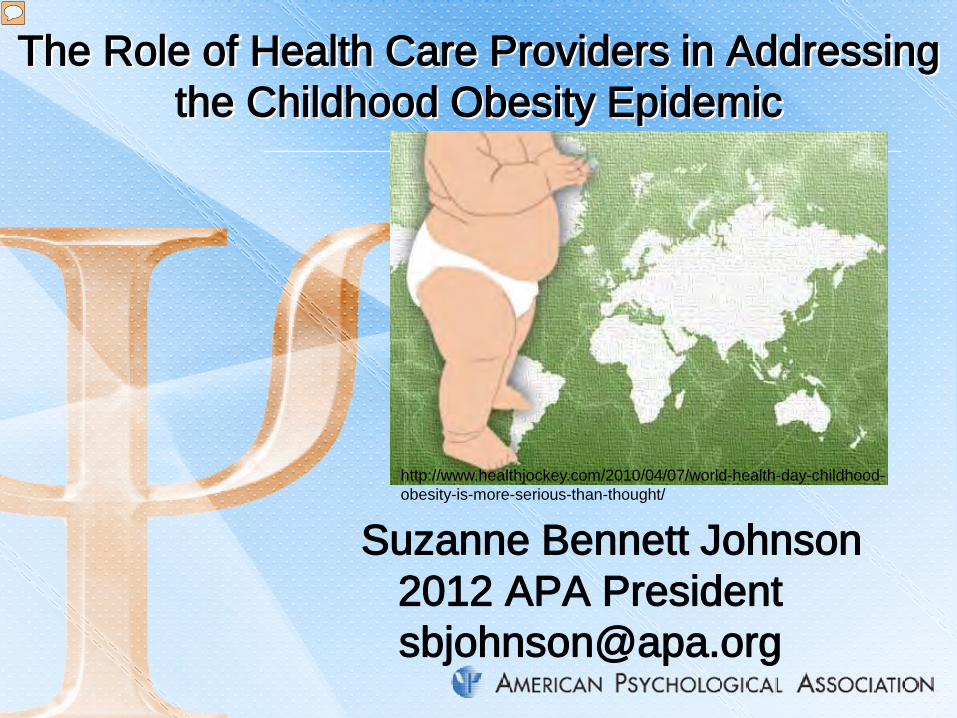
Suzanne Bennett Johnson 2012 APA President [email protected]
The Role of Health Care Providers in Addressing the Childhood Obesity Epidemic
http://www.healthjockey.com/2010/04/07/world-health-day-childhood-obesity-is-more-serious-than-thought/
Presenter
Presentation Notes
Image available at: http://www.healthjockey.com/2010/04/07/world-health-day-childhood-obesity-is-more-serious-than-thought/

Presentation Overview
Epidemiology of childhood obesity Consequences of childhood obesity Factors underlying the childhood
obesity epidemic The role of health providers in
addressing the childhood obesity epidemic

Presenter
Presentation Notes
Obesity is becoming a global problem

Obesity: U.S. Leads the World Adult Obesity
Childhood Obesity
Presenter
Presentation Notes
Two thirds of US adults are overweight’; one third are obese
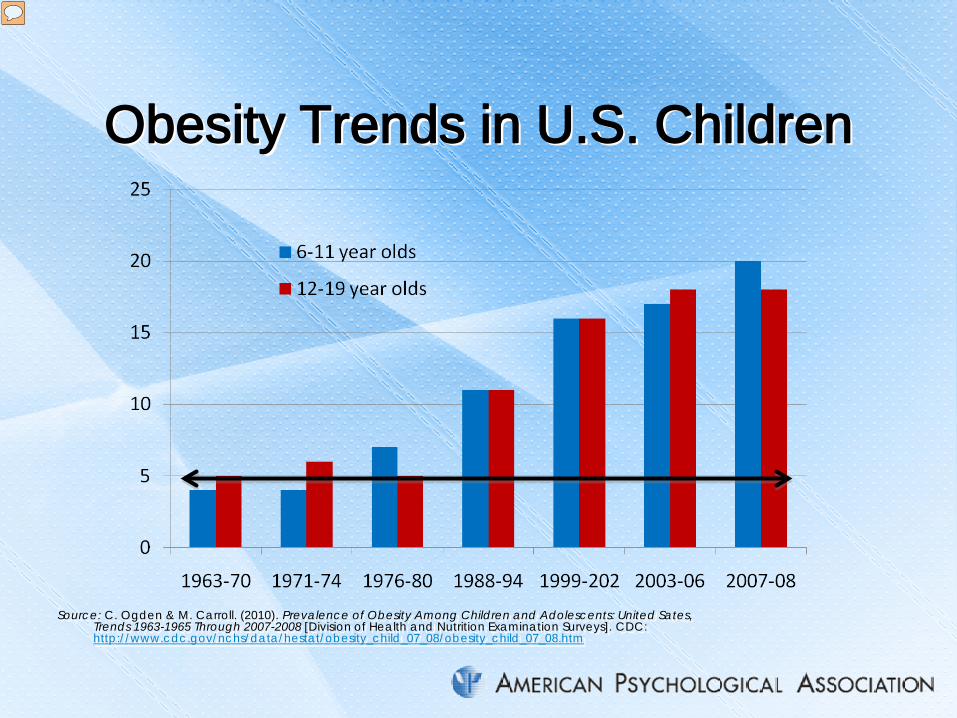
Obesity Trends in U.S. Children
Source: C. Ogden & M. Carroll. (2010). Prevalence of Obesity Among Children and Adolescents: United Sates, Trends 1963-1965 Through 2007-2008 [Division of Health and Nutrition Examination Surveys]. CDC: http://www.cdc.gov/nchs/data/hestat/obesity_child_07_08/obesity_child_07_08.htm
Presenter
Presentation Notes
Approximately 17% (or 12.5 million) of US children and adolescents aged 2—19 years are obese. This has not always been the case. In the 1960’s and 1970’s, approximate 5% of children were obese; a statistic within the normal range. However, by the 1980’s, obesity rates rapidly escalated �

U.S. Adolescent Obesity: Gender and Ethnicity
NHANES 2007-2008
Presenter
Presentation Notes
Obesity rates are elevated for all U.S. children, but are particularly high for Hispanic boys and Black girls
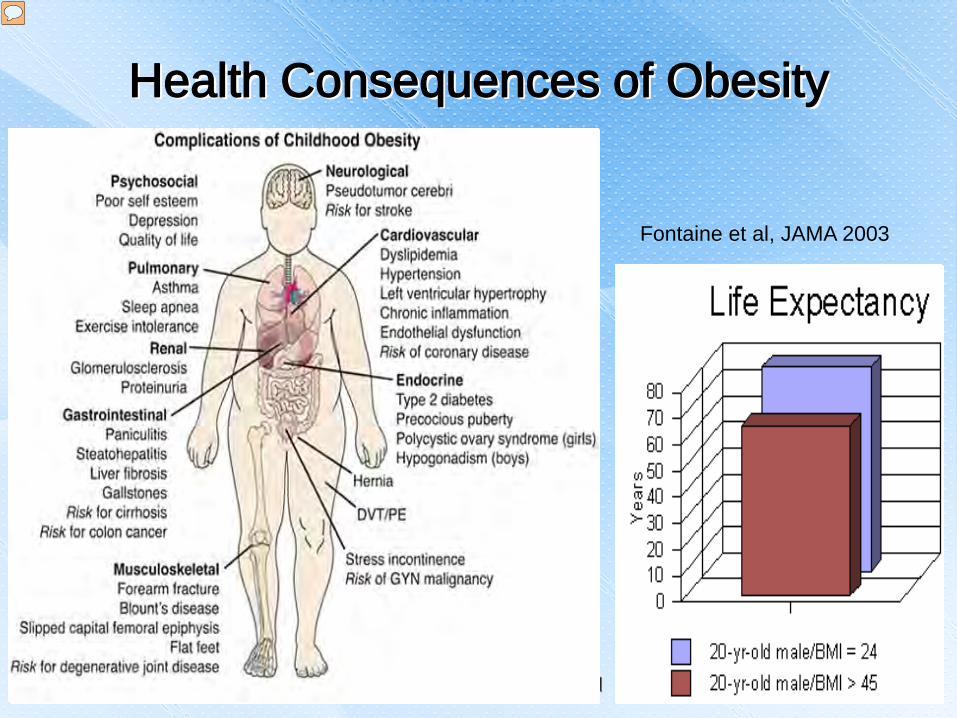
Health Consequences of Obesity
Fontaine et al, JAMA 2003
Presenter
Presentation Notes
Health consequences of obesity in childhood are considerable; some many obese children grow up to be obese adults, childhood obesity can affect not only quality of life but life expectancy Life expectancy chart is from Fontaine KR, Redden DT, Wang C, Westfall AO, Allison DB. Years of life lost due to obesity. JAMA 2003; 289(2): 187-193: years of life lost due to obesity is especially large for those who are obese at young age: 13 years for very obese young white men and 20 years for very obese young black men

Percent Above Normal Weight Individuals’ Annual Health Care Costs by Obesity Status and Gender
Andreyeva et al, Obesity Research, 2004
Presenter
Presentation Notes
Health care for obese individuals is more costly than for normal weight individuals and the costs increase with increasing levels of obesity. Those who suffer from extreme obesity have annual health care cost more than twice that of a normal weight person. Overweight: 25 < BMI <30 Moderate obesity: 30 < BMI < 35 Severe obesity: 35 < BMI < 40 Extreme obesity: BMI >40 Ref: Andreyeva T, Sturm R, Ringel J. Moderate and severe obesity have large differences in health care costs. Obesity Research, 2004, 12: 1936-1943
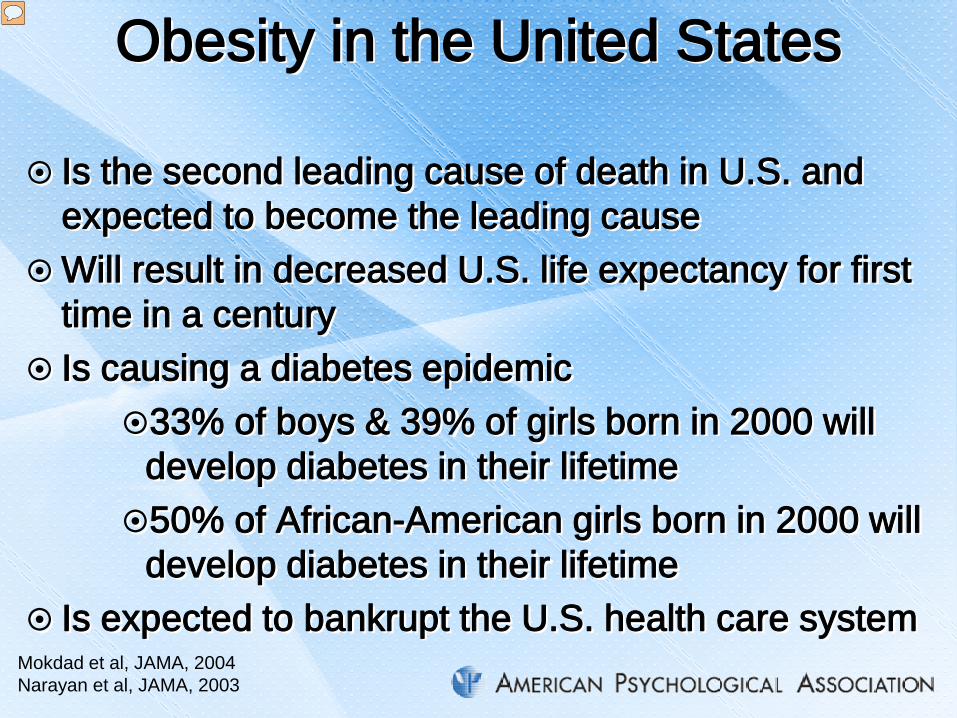
Obesity in the United States
Is the second leading cause of death in U.S. and expected to become the leading cause
Will result in decreased U.S. life expectancy for first time in a century
Is causing a diabetes epidemic 33% of boys & 39% of girls born in 2000 will
develop diabetes in their lifetime 50% of African-American girls born in 2000 will
develop diabetes in their lifetime Is expected to bankrupt the U.S. health care system
Mokdad et al, JAMA, 2004 Narayan et al, JAMA, 2003
Presenter
Presentation Notes
Sources: A. H. Mokdad, J. S. Marks, D. F. Stroup, & J. L. Gerberding. (2004). Actual causes of death in the United States, 2000. JAMA, 291, 1238–1245. K. M. Narayan, J. P. Boyle, T. J. Thompson, S. W. Sorensen, & D. F. Williamson (2003). Lifetime risk for diabetes mellitus in the United States. JAMA, 290, 1884–1890.

The U.S. Childhood Obesity Epidemic: How Did This Happen?
Bouchard, Int J Obesity, 2007
Presenter
Presentation Notes
The U.S. obesity epidemic is not the result of changing biology or genetics It is the result of changing human behavior in response to a changing social and built environment In this model, human biology or genetics has NOT changed. All persons, regardless of biologic predisposition are affected by this obesogenic environment. However, those with biological predispostion toward obesity will be affected more. The biological predisposition to obesity: beyond the thrifty genotype scenario C Bouchard1International Journal of Obesity (2007) 31, 1337–1339; doi:10.1038/sj.ijo.0803610; published online 13 March 2007

The Obesogenic Environment: A Socio-Ecological Perspective
http://depts.washington.edu/waaction/plan/append/a.html
Presenter
Presentation Notes
The socio-ecological perspective places the individual within a set of environmental influences that include not only the family, but peers, community, institutions like schools and health care systems, and the larger macro-environment that includes media advertising as well as governmental regulation and tax policy. Ref: http://depts.washington.edu/waaction/plan/append/a.html

Factors Promoting Increased Calorie Consumption: Increase in US Working Mothers
Presenter
Presentation Notes
Since the 1970’s there has been a large increase in working mothers and many of these mothers are the primary breadwinner; Since more mothers are spending more time working outside the home, they have less time to devote to meal preparation U.S. Bureau of Labor Statistics, U.S. Department of Labor. (2010). Women in the Labor Force:A Databook. Report 1026. Available at: http://www.bls.gov/cps/wlf-databook2010.htm

Factors Promoting Increased Calorie Consumption: Rise of the US Fast Food Industry
Number of per capita fast food restaurants doubled between 1972 and 1997 in the U.S.
% family’s food budget spent on dining out: 1960’s: 21% 2008: 42%
30% of US children eat fast food every day Per capita calories in the U.S. 1970: 3250 per day 1997: 3800 per day
http://www.bls.gov/news.release/cesan.nr0.htm http://www.bls.gov/mlr/1990/03/art3full.pdf Chou et al, J of Health Economics, 2004 Bowman et al, Pediatrics, 2003
Presenter
Presentation Notes
Chou, S-I., Grossman, M. & Saffer, H. (2004). An economic analysis of adult obesity: results from the Behavioral Risk Factor Surveillance System. Journal of Health Economics, 23(3), 565-587. Jacobs, E. & Shipp, S. (1990). How family spending has changed in the U.S. Monthly Labor Review, March, 20-27. Available at: http://www.bls.gov/mlr/1990/03/art3full.pdf U.S. Bureau of Labor Statistics. (2011). Economic news release: Consumer expenditures 0 1010. Available at: http://www.bls.gov/news.release/cesan.nr0.htm Bowman, S.A., Gortmaker, S.L., Ebbeling, C.B., Pereira, M.A., & Ludwig, D.S. (2003). Effects of fast-food consumption on energy intake and diet quality among children in a national household survey. Pediatrics, 113, 112-118.

Factors Promoting Increased Calorie Consumption: Rise of the US Soda Industry
Presenter
Presentation Notes
The consumption of high fructose corn syrup – the mainstay of soft drinks and other sweetened beverages - has increased from 38.2 pounds in 1980 to 868 pounds in 1998 (Chou et al., 2004). In 1942, annual US production of soft drinks was 90 8 oz servings per person; in 2000 it was 600 servings (Jacobson, 2005). Soft drinks and juice drinks make up 6% of all calories consumed for 2-5 year olds, 7% for 6-11 year olds, and more than 10% for 12-19 year olds. While children 2-11 years old get more of their calories from milk than soda, the opposite is true for youth 12-19 years old. Female teens get 11% of their total calories from sodas or juice drinks but only 6% of their calories from milk (Troiano, Brefel, Carroll, & Bialostosky, 2000). Sodas and other sweetened beverages are readily available in US schools. Vending machines are placed in almost all US middle and high schools (Weicha, Finkelstein, Troped, Fragala, & Peterson, 2006) and are in approximately 40% of US elementary schools (Fernandes, 2008). Chou, S-I., Grossman, M. & Saffer, H. (2004). An economic analysis of adult obesity: results from the Behavioral Risk Factor Surveillance System. Journal of Health Economics, 23(3), 565-587. Jacobson, M.F. (2005). Liquid candy: how soft drinks are harming American’s health. Center for Science in the Public Interest. Available at: http://www.cspinet.org/new/pdf/liquid_candy_final_w_new_supplement.pdf Troiano, R.P., Briefel, R.R., Carroll, M.D., & Bialostosky, K. (2000). Energy and fat intakes in children and adolescents in the United States: data from the National Health and Nutrition Examination Surveys. American Journal of Clinical Nutrition, 72, 124S-153S. Wiecha, J.L., Finkelstein, D., Troped, P.J., Fragala, M. & Peterson, K..E. (2006). School vending machines use and fast –food restaurant use are associated with sugar-sweetened beverage intake in youth. Journal of the American Dietetic Association, 106, 1624-1630. Fernandes, M. (2008). The effect of soft drink availability in elementary schools on consumption. Journal of the American Dietetic Association, 108, 1445-1452.
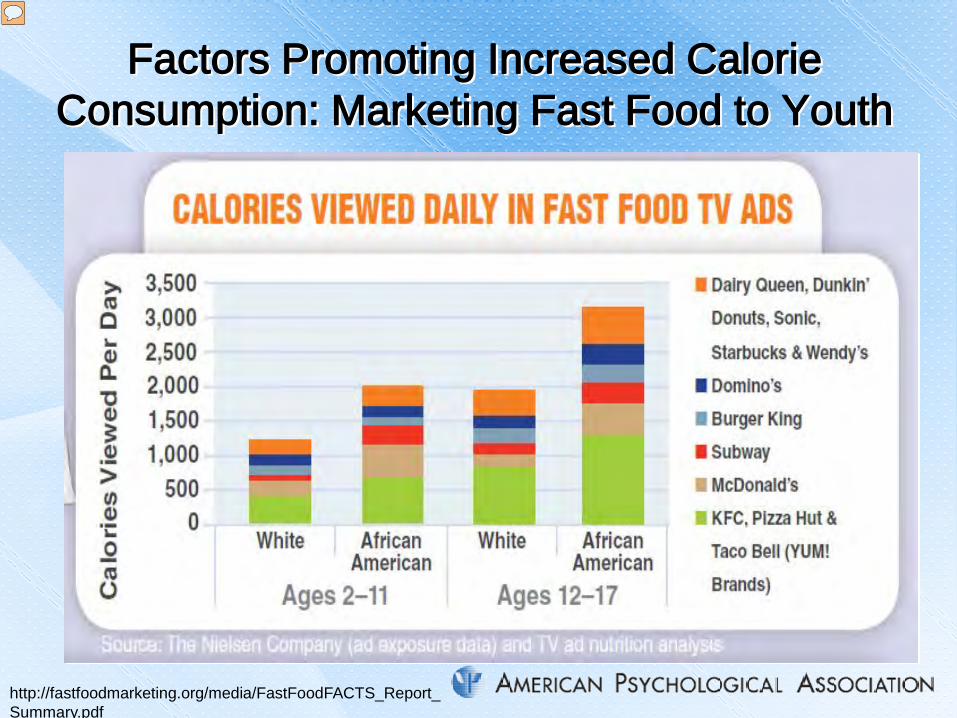
Factors Promoting Increased Calorie Consumption: Marketing Fast Food to Youth
http://fastfoodmarketing.org/media/FastFoodFACTS_Report_Summary.pdf
Presenter
Presentation Notes
In 2009, the US fast food industry spent > 4 billion US dollars on fast food ads for children. Further, they market more to ethnic minority youth (Harris, Schwartz, & Brownell, 2010). As you know, ethnic minority youth have the highest obesity rates in the US. Harris, J.L., Schwartz, M.B., & Brownell, K.D. (2010). Fast Food FACTS: Evaluating fast food nutrition and marketing to youth. Rudd Center for Food Policy & Obesity. Available at: http://fastfoodmarketing.org/media/FastFoodFACTS_Report_Summary.pdf

Factors Promoting Increased Calorie Consumption: US Farm Subsidies US farm subsidies result in mega farms
producing so much corn and soybeans that high fructose corn syrup, hydrogenated fats from soybeans, and corn-based feed is kept artificially low, resulting in low prices for fast food, corn-fed beef and pork, and soda
No such subsidies exist for fresh fruits and vegetables which are produced in much lower quantities at higher cost to the public
Fields, Environmental Health Perspectives, 2004
Presenter
Presentation Notes
Fields, S. (2004). The fat of the land: Do agricultural subsidies foster poor health? Environmental Health Perspectives, 112, A820-823.

Factors Associated with Decreased Physical Activity: Suburban Living
United States
Australia and Canada
Europe
Far East, Russia
Population Density
Per Capita Petroleum
Use
Urban Task Force Partnership: Toward an Urban Renaissance, 1999
US Dept of Transportation, 2008
Presenter
Presentation Notes
During the second half of the twentieth century, there was a wholesale movement of Americans from the cities to the suburbs; one half of all Americans now live in the suburbs. Low density neighborhoods were attractive but these homogenous residential enclaves, with no mixed-use commercial access, meant that a car was required to buy a newspaper or a quart of milk. The US turned into a nation of drivers; only 1% of all trips are on bicycles and 9% are on foot. Approximately 25% of all US trips are less than 1 mile but 75% of these are by car (Frumkin, 2002). The US has the highest number of vehicles per capita and the highest per capita petroleum use in the world. Frumkin, H. Urban sprawl and public health. (2002). Public Health Reports, 117, 201-217. Urban Task Force Partnership. Towards an urban Renaissance, 1999. Vehicles – (2008) U.S.: U.S. Department of Transportation, Federal Highway Administration, Highway Statistics 2008, Washington, D.C. 2009.

Factors Associated with Decreased Physical Activity: School Transportation
Percent of US Children Walking or Biking to School
CDC, 2005 CDC, 2002
Presenter
Presentation Notes
In 1969, approximately half of US children walked or biked to school and 87% of those living within one mile of their school did so. Today, less than 15% of US school children walk or bike to school (Centers for Disease Control, 2005) and among those who live within 1 mile of their school, only 31 percent walk and for those living ≤ 2 miles from the school, only 2% bike to school. A third of US children go to school on a bus and half are taken by private vehicle (Centers for Disease Control, 2002). Centers for Disease Control. (2002). Barriers to children walking or bikeing school – United States,1999. Morbidity and Mortality Weekly Report, 51,701-704. Available at: http://www.cdc.gov/mmwr/preview/mmwrhtml/mm5132a1.htm Centers for Disease Control. (2005). Barriers to children walking to or from school – United States, 2004. Morbidity and Mortality Weekly Report, 54, 949-952. Available at: http://www.cdc.gov/mmwr/preview/mmwrhtml/mm5438a2.htm
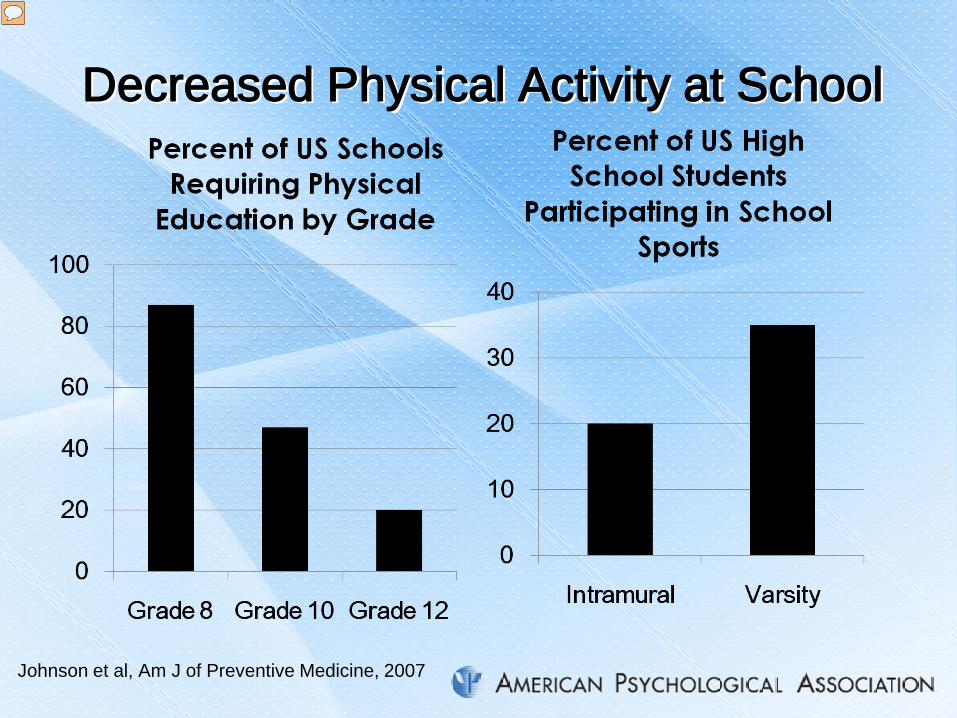
Decreased Physical Activity at School
Johnson et al, Am J of Preventive Medicine, 2007
Presenter
Presentation Notes
Opportunities for physical activity used to be a common component of each child’s school day. Unfortunately, these opportunities are declining especially in US secondary schools. While 87% of schools require physical education in grade 8, this declines to 47% in grade 10 and only 20% in grade 12. A minority of youth participate in intramural sports or activity clubs (<20%) or varsity sports (~35%). Further, ethnic minority youth and those from poverty backgrounds are significantly less likely to participate in any type of sport or activity club (Johnson, Delva, & O’Malley, 2007). Johnson, L.D. Delva, J. & O’Malley, P.M. (2007). Sports participation and physical education in American secondary schools. American Journal of Preventive Medicine, 33, S195-S207.
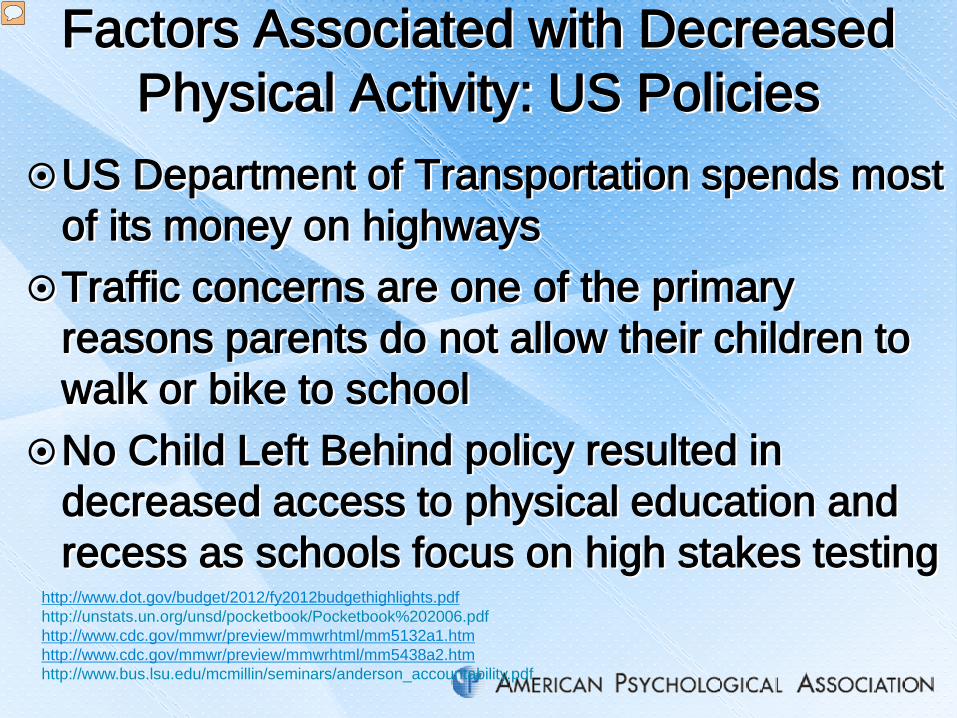
Factors Associated with Decreased Physical Activity: US Policies
US Department of Transportation spends most of its money on highways
Traffic concerns are one of the primary reasons parents do not allow their children to walk or bike to school
No Child Left Behind policy resulted in decreased access to physical education and recess as schools focus on high stakes testing
http://www.dot.gov/budget/2012/fy2012budgethighlights.pdf http://unstats.un.org/unsd/pocketbook/Pocketbook%202006.pdf http://www.cdc.gov/mmwr/preview/mmwrhtml/mm5132a1.htm http://www.cdc.gov/mmwr/preview/mmwrhtml/mm5438a2.htm http://www.bus.lsu.edu/mcmillin/seminars/anderson_accountability.pdf
Presenter
Presentation Notes
The US government spends most of its transportation dollars on highways (Department of Transportation, 2012) and the US has the highest number of vehicles per capita in the world (United Nations, 2007). Further, traffic concerns are one of the primary reasons parents do not allow their children to walk or bike to school (Centers for Disease Control, 2002, 2005). Some have argued that the No Child Left Behind policy has resulted in decreased access to recess and physical education in our nation’s schools, as teachers and school districts focus on high stakes testing (Anderson, Butcher, & Schanzenbach, 2010). Department of Transportation. (2012). Fiscal Year 2012 Budget Highlight. Available at: http://www.dot.gov/budget/2012/fy2012budgethighlights.pdf United Nations. (2007). World Statistics Pocketbook, 2006. Available at: http://unstats.un.org/unsd/pocketbook/Pocketbook%202006.pdf Centers for Disease Control. (2002). Barriers to children walking or bikeing school – United States,1999. Morbidity and Mortality Weekly Report, 51,701-704. Available at: http://www.cdc.gov/mmwr/preview/mmwrhtml/mm5132a1.htm Centers for Disease Control. (2005). Barriers to children walking to or from school – United States, 2004. Morbidity and Mortality Weekly Report, 54, 949-952. Available at: http://www.cdc.gov/mmwr/preview/mmwrhtml/mm5438a2.htm Anderson, P.M., Butcher, K.F., & Schanzenbach, D.W. (2010). The effect of school accountability policies on children’s health. Available at: http://www.bus.lsu.edu/mcmillin/seminars/anderson_accountability.pdf
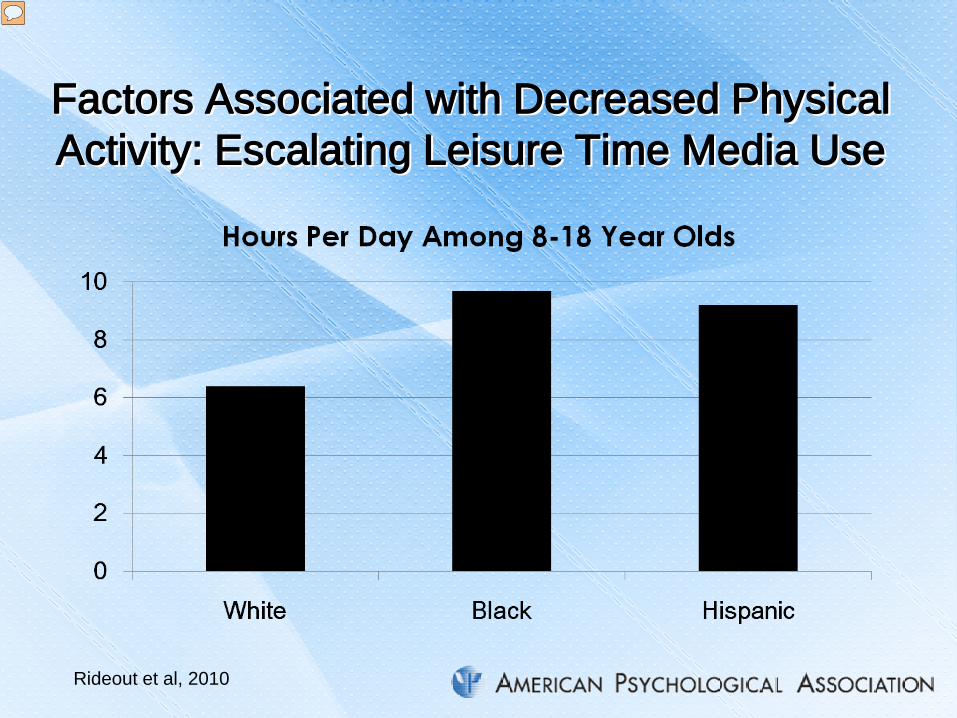
Factors Associated with Decreased Physical Activity: Escalating Leisure Time Media Use
Rideout et al, 2010
Presenter
Presentation Notes
A recent report by the Kaiser Family Foundation (Rideout, Foehr, & Roberts, 2010) noted the explosion in media content use of all types (TV, music/audio, computer, video games, cell phones) from more than 6 hours per day in 1999 to more than 7 hours per day in 2009. Most notable were the large discrepancies found between minority and majority youth; Black and Hispanic youth average > 9 hour of media use per day compared to 6 hours among white children. Rideout, V., Foehr, U. & Roberts, D. (2010). Generation M2: Media in the Lives of 8-to-18 Year Olds. Kaiser Family Foundation. Available at: http://www.kff.org/entmedia/upload/8010.pdf
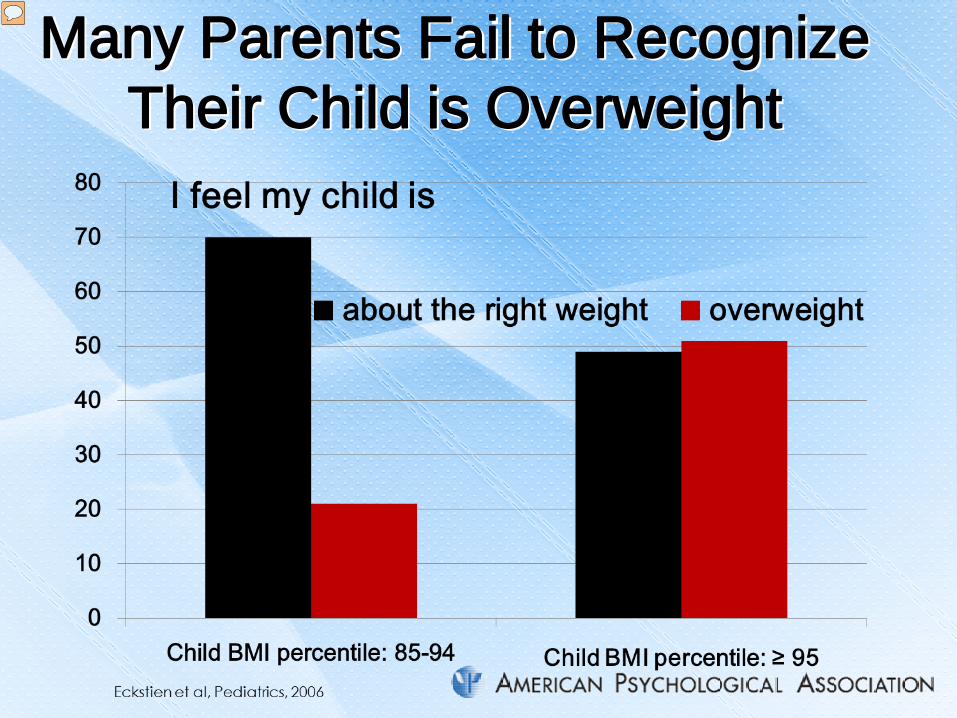
Many Parents Fail to Recognize Their Child is Overweight
Presenter
Presentation Notes
223 parents provided their perceptions of their child’s weight status at a well-child visit. The children ranged in age from 2-17. most parents of overweight children thought they were about the right weight; only half of obese children’s parents thought they were overweight.

Many Health Providers Fail to Monitor Child BMI

Informing Parents of Their Child’s Overweight May Make a Difference
Child’s Weight Classification % of Parents Who Recalled their Child as
Overweight (BMI %: ≥ 85)
At-risk for Overweight (BMI %: 85-94)
Normal (BMI %: 5-84)
Underweight (BMI %: <5)
Overweight 64.9 28.6 3.7 6.4 At-risk for Overweight 13.5 40.5 11.1 2.1 Normal 10.8 23.8 74.1 21.3 Underweight 2.7 0 7.4 68.1 Don’t know 8.1 7.1 3.7 2.1 Johnson et al, J of School Health, 2009
Presenter
Presentation Notes
Interviewed 219 parents by phone; ≥ 50 in each group about their recall of a letter sent home by the child’s school providing height, weight, BMI. BMI percentile, BMI category (see above) and recommendations. Parents did not recall the details of the child’s height weight BMI or BMI percentile but were quite accurate in recalling the child’s BMI percentile category

Informing Parents of Their Child’s Overweight May Make a Difference
Presenter
Presentation Notes
These data suggest that if health providers informed parents of their child’s weight status, it could empower parents of oveweight children to take action

Informing Parents of Their Child’s Overweight May Make a Difference
Predictors of Parent Intent to Take Action
P value
Child age Older the child, more likely the parent was to take action
0.014
Child weight When the child was overweight or obese, the parent was more likely to take action
0.001
Provider discussed child’s weight
Parents who reported the provider discussed the child’s weight were more likely to take action
0.010
Parent concern Parents concerned about the child’s weight are more likely to take action
0.001
Rosado et al, 2012
Presenter
Presentation Notes
This study was conducted in Immokolee FL in a CHC serving migrant families; 472 parents and their children participated. After a well- child visit, parents were interviewed in spanish about their perceptions of their child’s weight, any concerns they may have about the child’s weight, any actions they plan to take and whether or not the provider had discussed the child’s weight with the parent.

Childhood Obesity Can Be Prevented &Treated 2011 Cochrane Review found “strong evidence to
support beneficial effects of child obesity prevention programmes on BMI, particularly for programmes targeted to children six to 12 years”
Particularly promising are interventions that: increase physical activity and improve quality of
food at school target environments and cultural practices to
increase healthier food consumption and daily physical activity
support parents to increase activity, decrease screen time, and eat healthier foods Waters et al, 2011, Issue 12, http://www.thecochranelibrary.com
Presenter
Presentation Notes
Waters E, de Silva-Sanigorski A, Hall BJ, Brown T, Campbell KJ, Gao Y, Armstrong R, Prosser L, Summerbell CD. Interventions for preventing obesity in children (Review). 2011, Issue 12 http://www.thecochranelibrary.com

The Role of Health Care Providers: AAP Recommendations
Prevention (all patients): promote breastfeeding, family meals, limited screen time, regular physical activity, yearly BMI monitoring
Prevention Plus (children with BMI percentiles of 85-94): 5 fruits/vegetable servings, 0 sugary drinks, ≤ 2 hours of screen time, ≥ 1 hr physical activity, healthy breakfast , home food preparation and limited eating out
The Role of Health Care Providers: AAP Recommendations
Structured Weight Management (children with BMI percentiles of 95-98 or children for whom Prevention Plus has not been effective): more frequent follow-up, written diet/exercise plans
Comprehensive Multidisciplinary Intervention (if 3-6 months of Structured Weight Management has been ineffective): team based intervention including dietary and behavioral specialists.

The Role of the Health Care Provider: Key Recommendations
Regularly monitor child’s BMI & communicate with the parent & older child about the child’s weight
Emphasize prevention – promote healthy lifestyles from birth
Avoid child & parent blaming – acknowledge that this is a systems problem
Empower parents & families to promote healthy lifestyles within their community
Serve as a role-mode and community leader – the obesity epidemic will not be solved solely in the confines of the health provider’s office

This presentation is available at www.apa.org/president