the role of governance on growth in least developed - World Bank
92
T.C. MARMARA ÜNİVERSİTESİ SOSYAL BİLİMLER ENSTİTÜSÜ İKTİSAT (İNG) ANABİLİM DALI İKTİSAT (İNG) BİLİM DALI THE ROLE OF GOVERNANCE ON GROWTH IN LEAST DEVELOPED COUNTRIES Yüksek Lisans Tezi ADEM GÖK İSTANBUL, 2012
Transcript of the role of governance on growth in least developed - World Bank

T.C.
MARMARA ÜNİVERSİTESİ
SOSYAL BİLİMLER ENSTİTÜSÜ
İKTİSAT (İNG) ANABİLİM DALI
İKTİSAT (İNG) BİLİM DALI
THE ROLE OF GOVERNANCE ON GROWTH IN
LEAST DEVELOPED COUNTRIES
Yüksek Lisans Tezi
ADEM GÖK
İSTANBUL, 2012
T.C.
MARMARA ÜNİVERSİTESİ
SOSYAL BİLİMLER ENSTİTÜSÜ
İKTİSAT (İNG) ANABİLİM DALI
İKTİSAT (İNG) BİLİM DALI
THE ROLE OF GOVERNANCE ON GROWTH IN
LEAST DEVELOPED COUNTRIES
Yüksek Lisans Tezi
ADEM GÖK
Danışman: PROF. DR. ALİ SUUT DOĞRUEL
İstanbul, 2012


i
Name Surname : Adem Gök
Field : Economics
Program : Economics (English Medium)
Supervisor : Prof. Dr. Ali Suut Doğruel
Degree Awarded and Date : MA – June 2012
Keywords : Governance, Institutions, LDCs, Growth, Difference GMM
ABSTRACT
This dissertation addresses the issue of the low level of GDP per capita growth in Least
Developed Countries (LDCs), with special emphasis on the role of governance as a main
determinant of growth. Based on the existing literature; especially Aysan, Nabli and Varoudakis
(2006), the study categorizes what types of governance institutions promote growth.
When the aggregate governance indicators of LDCs are compared with High Income
OECD countries, LDCs have performed worse. The positive correlations between aggregate
governance indicators and GDP per capita suggest that better governance leads to higher
income per capita, thus growth. The separate block dispersion of corresponding LDCs and High
Income OECD countries also illustrates the hypothesis that rich countries can afford better
institutions. The evolution of governance quality in LDCs is evaluated to identify whether there is
a convergence or divergence in these countries and also to specify which countries that are
deteriorated or improved with respect to aggregate governance indicators.
In order to determine the role of aggregate governance indicators together with the role
of control variables; “lag of GDP per capita”, “human capital”,” import penetration”,” trade
openness” and “net official development assistance and official aid received”, two alternative
difference GMM techniques are applied in panel regressions. According to estimation results, it
was found that governance quality as an overall aggregate index has positive significant effect on
GDP per capita growth. This result is particularly true in the case of “administrative quality”
and “political stability”. Evidence in favor of “democratic accountability public voice” seems
less robust. Estimation results also stress that lag of income per capita and human capital have
positive significant effect on growth. The results for other control variables are less robust.
ii
İsim ve Soyadı : Adem Gök
Ana Bilim Dalı : İngilizce İktisat
Programı : İngilizce İktisat
Tez Danışmanı : Prof. Dr. A. Suut Doğruel
Tez Türü ve Tarihi : Yüksek Lisans – Haziran 2012
Anahtar Kelimeler : Yönetişim, Kurumlar, EAGÜ, Büyüme, Fark GMM
ÖZET
Bu tez, En Az Gelişmiş Ülkeler’ de (EAGÜ) büyümenin ana belirleyicisi olan yönetişimin
kişi başına düşen düşük seviyeli milli gelirdeki büyüme üzerine etkisini incelemektedir. Bu
çalışma, literatürdeki kaynaklara; özellikle Aysan, Nabli ve Varoudakis (2006) makalesine
dayanarak, ekonomik büyümeyi arttıran yönetişim kurumlarını kategorize etmektedir.
EAGÜ ile Yüksek Gelirli OECD ülkelerinin toplu yönetişim göstergeleri
karşılaştırıldığında, EAGÜ’ in daha düşük performans gösterdiği görülmektedir. Kişi başına
düşen Gayri Safi Yurtiçi Hasıla (GSYİH) ile toplu yönetişim göstergeleri arasındaki pozitif
korelasyonlar, daha kaliteli yönetişimin daha yüksek kişi başına düşen milli gelire, dolayısıyla
ekonomik büyümeye yol açtığını göstermektedir. EAGÜ ve Yüksek Gelirli OECD ülkelere karşılık
gelen iki ayrı blok halinde yayılmış kişi başına düşen milli gelir ve yönetişim performansları
zengin ülkelerin daha iyi yönetişim kurumlarına sahip oldukları hipotezini desteklemektedir.
EAGÜ’ deki yönetişim kalitesinin değişimi, bu ülkelerin yönetişim kalitelerinde zaman içersinde
birbirlerine yakınsama mı yoksa ıraksama mı olduğunu, ayrıca ıraksayan yönetişim göstergeleri
için bu ülkelerden hangilerinin daha iyi yada daha kötü yönetişime sahip olduğunu
göstermektedir.
Panel regresyonlarda iki alternatif “Fark GMM” tekniği kullanılarak, toplu yönetişim
göstergelerinin diğer kontrol değişkenleri; “önceki dönem kişi başına düşen GSYİH”, “beşeri
sermaye”, “ithalat nüfuz endeksi”, “ticari açıklık” ve “net resmi kalkınma desteği ve gelen resmi
yardımlar” ile birlikte ekonomik büyüme üzerine olan etkisi incelenemiştir. Regresyon
sonuçlarına göre, toplu yönetişim kalitesini gösteren birleştirilmiş yönetişim göstergesinin
“kişibaşına düşen GSYİH” üzerine önemli pozitif etkisi olduğu bulunmuştur. Bu sonuç, “idari
yönetim kalitesi” ve “politik istikrar” için de aynı çıkmıştır. Bir diğer birleştirilmiş yönetişim
göstergesi olan “demokratik hesap verilebilirlik söz hakkı” nın ekonomik büyüme üzerine etkisi
ise belirsiz çıkmıştır. “Önceki dönem kişi başına düşen milli gelir” ve “beşeri sermaye” nin
ekonomik büyüme üzerine önemli pozitif etkisi olduğu, diğer kontrol değişkenlerinin ise ekonomik
büyüme üzerine olan etkilerinin belirsiz olduğu bulunmuştur.

iii
TABLE OF CONTENTS
ABSTRACT………………………………………………………………………………………. i
ÖZET………………………………………………………………………………………...…... ii
TABLE OF CONTENTS………………………………………………………………………. iii
TABLE LIST……………………………………………………………………………….…… vi
FIGURE LIST………………………………………………………………………………….. vii
ABBREVIATIONS……………………………………………………………………………. viii
CHAPTER 1: INTRODUCTION………………………………………………………………. 1
CHAPTER 2: CATEGORIZATION OF LDCS………………………………………………. 4
2.1. Criteria and Procedure for Inclusion……………………………………………...……… 4
2.1.1. Initial Criteria for Inclusion…………………………..…………………………… 5
2.1.2. Latest Criteria for Inclusion…………………….…………………………..…….. 5
2.1.2.1. GNI per Capita…………………………………………………………… 5
2.1.2.2. Human Assets Index (HAI) ……………………………………...……… 7
2.1.2.3. Economic Vulnerability Index (EVI)……………….…....…………...… 9
2.1.3. Procedure for Inclusion…………………………………………………………... 12
2.2. Rules and Procedure for Graduation……………………………………………………. 12
2.2.1. Rules for Graduation…………………………………………………………...… 12
2.2.2. Procedure for Graduation and Smooth Transition……………………………….. 13
CHAPTER 3: SPECIAL SUPPORT MEASURES FOR THE LDCS…………………...…. 15
3.1. International Trade…………………………………………………………………….... 16
3.1.1. Preferential Market Access………………………………………………………. 18
3.1.2. Other Trade-Related Measures…………………………………………...……… 19
3.2. International Aid………………………………………………………...…….…...…… 20
3.2.1. Bilateral Assistance………………………………………….…………………... 20
3.2.2. Multilateral Assistance………………………………………………….……..… 23
3.2.2.1. Global Environment Facility (GEF).……………………………………. 23
3.2.2.2. The United Nations Capital Development Fund (UNCDF)….…………. 23
3.2.2.3. World Food Programme (WFP)…..…………………………………….. 23
3.2.2.4. World Meteorological Organization (WMO)………….………………... 24
3.3. Other Forms of Support Measures………………………………………………….…... 24
iv
CHAPTER 4: CLASSIFICATION OF GOVERNANCE INSTITUTIONS………….….… 26
4.1. Literature on Classification of Governance Institutions………………………………... 27
4.1.1. Kaufmann, Kraay and Mastruzzi (2003).………………………………………... 27
4.1.2. World Bank (2003)……………………………….……………………………… 28
4.1.3. Aysan, Nabli and Varoudakis (2006)…………….………….…………………... 28
4.1.4. Economic Commission for Africa (ECA) project……………………………...... 28
4.1.5. Asian Development Bank/Viet Nam………………………………...…………... 29
4.1.6. African Peer Review Mechanism (APRM) ……………………………………... 29
4.2. Classification of Governance Institutions in the Study…………………………….…... 30
4.2.1. Administrative Quality Index (AQI) …………………………………..………... 30
4.2.1.1. Corruption……………………………………………………...…….….. 31
4.2.1.2. Bureaucracy Quality………………………………...…………………... 31
4.2.1.3. Investment Profile………………………………………………...….….. 31
4.2.1.4. Law and Order…………………………………………………………... 31
4.2.2. Political Stability Index (PSI) …………………………………………….….….. 32
4.2.2.1. Government Stability…………………………………………………..... 32
4.2.2.2. Internal Conflict……………………………………………………...….. 32
4.2.2.3. External Conflict………………………………………………….….….. 32
4.2.2.4. Ethnic Tensions……………………………………………………....….. 32
4.2.2.5. Religious Tensions……………………………………………….…..….. 32
4.2.3. Democratic Accountability Public Voice Index (DAPVI) …………………..….. 33
4.2.3.1. Democratic Accountability…………………………………….…….….. 33
4.2.3.2. Military in Politics……………………………………………….…….... 33
4.2.3.3. Political Rights………………………………………...………….….….. 33
4.2.3.4. Civil Liberties……………………………………………….…….…….. 33
4.2.4. Governance Quality Index (GOVI) ……………………………………….…….. 34
CHAPTER 5: GOVERNANCE IN LDCS…………………………………………………… 35
5.1. Comparison of Governance and Growth in LDCs and High Income OECD
Countries……………………………………………………………………………….. 38
5.2. The Evolution of Governance in LDCs………………………………….…………….. 40
5.2.1. Administrative Quality Index (AQI) ……………………………..……………... 40
5.2.2. Political Stability Index (PSI) …………………………………………………... 41
5.2.3. Democratic Accountability Political Voice Index (DAPVI) …………………… 42
5.2.4. Aggregate Governance Index (GOVI)…………………………………………... 43
CHAPTER 6: EMPIRICAL ANALYSIS……………………………………………………. 45
6.1. Methodology: Arellano-Bond (1991) Difference GMM ………………………..…….. 45
6.2. Data…………………………………………………………………………………….. 47
6.3. Empirical Models………………………………………………………..……………... 52
6.4. Estimation Results……………………………………………….……………………... 54
CHAPTER 7: CONCLUSION……………………………………………………………….. 60
REFERENCES……………………………………………………………………………...… 63

v
APPENDIX 1…………………………………………………………………………………. 66
APPENDIX 2…………………………………………………………………………………. 67
APPENDIX 3…………………………………………………………………………………. 68

vi
TABLE LIST
Page No.
Table 1: Colonial Origins and Last Disturbances on Governance in LDCs………….…… 70
Table 2: Income per capita and Governance Comparison of LDCs and High
Income OECD Countries……………………………………………….………. 76
Table 3: Variables and Sources…………………………………………………………… 78
Table 4: First Generation Panel Unit Root Tests……………………………………..…… 49
Table 5: Second Generation Panel Unit Root Tests…………………………………….… 51
Table 6: Summary Statistics of All Variables In Panel Regressions (1991-2010) ……….. 80
Table 7: Estimation Results of Model 1………………………………………………...… 57
Table 8: Estimation Results of Model 2………………………………………………...… 58
vii
FIGURE LIST
Page No.
Figure 1: GNI per capita ($) of LDCs (Atlas Method)……………………………...…… 6
Figure 2: Human Assets Index (HAI) of LDCs…………………………………..……… 8
Figure 3: Economic Vulnerability Index (EVI) of LDCs……………………………..… 11
Figure 4: Merchandise Exports by LDCs as a Percentage of World Exports,
1948–2008……………………………………………………………………. 17
Figure 5: Official Development Assistance (ODA) to LDCs, Value and Percentage
of GNI of DAC Member Countries, 1990- 2006………………………...…… 21
Figure 6: Averages of Income per Capita and Governance of LDCs and
High Income OECD Countries………………………………………………... 39
Figure 7: Evolution of AQI in LDCs……………………………………………………. 41
Figure 8: Evolution of PSI in LDCs…………………………………………………….. 42
Figure 9: Evolution of DAPVI in LDCs………………………………………………… 43
Figure 10: Evolution of GOVI in LDCs………………………………………………..… 44
Figure 11: Foreign Trade in LDCs (1985-2010) ………………………………………… 59
viii
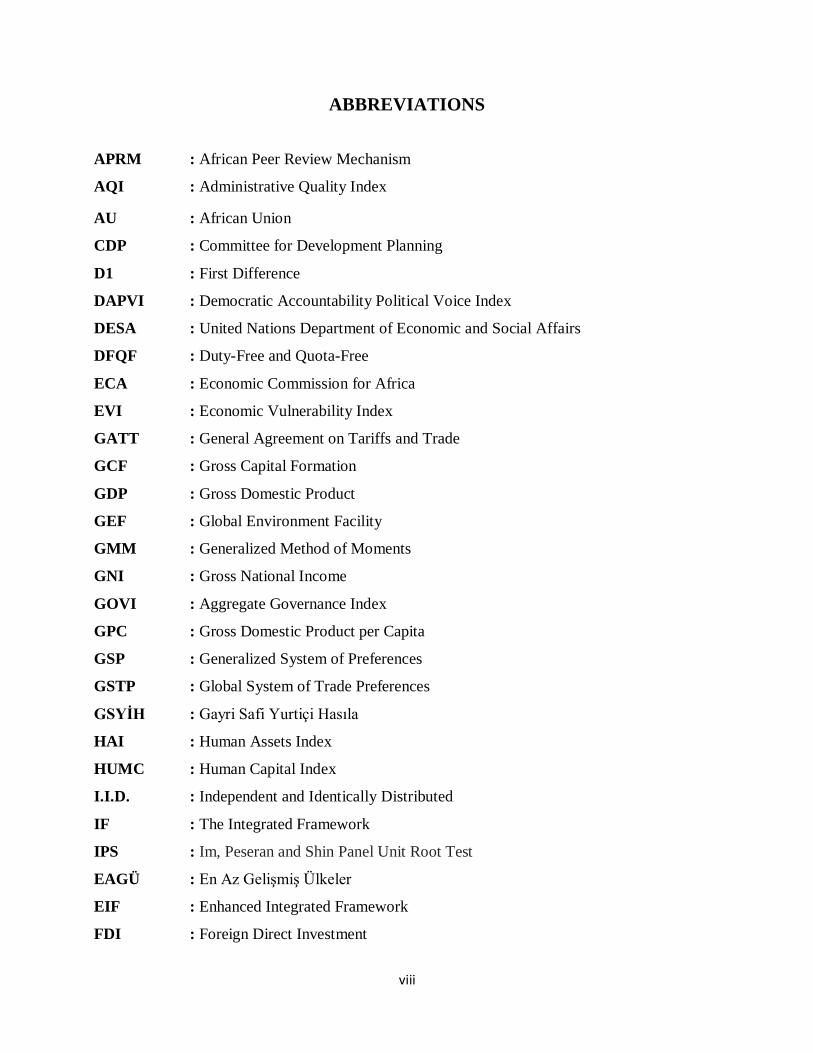
ABBREVIATIONS
APRM : African Peer Review Mechanism
AQI : Administrative Quality Index
AU : African Union
CDP : Committee for Development Planning
D1 : First Difference
DAPVI : Democratic Accountability Political Voice Index
DESA : United Nations Department of Economic and Social Affairs
DFQF : Duty-Free and Quota-Free
ECA : Economic Commission for Africa
EVI : Economic Vulnerability Index
GATT : General Agreement on Tariffs and Trade
GCF : Gross Capital Formation
GDP : Gross Domestic Product
GEF : Global Environment Facility
GMM : Generalized Method of Moments
GNI : Gross National Income
GOVI : Aggregate Governance Index
GPC : Gross Domestic Product per Capita
GSP : Generalized System of Preferences
GSTP : Global System of Trade Preferences
GSYİH : Gayri Safi Yurtiçi Hasıla
HAI : Human Assets Index
HUMC : Human Capital Index
I.I.D. : Independent and Identically Distributed
IF : The Integrated Framework
IPS : Im, Peseran and Shin Panel Unit Root Test
EAGÜ : En Az Gelişmiş Ülkeler
EIF : Enhanced Integrated Framework
FDI : Foreign Direct Investment

ix
L1 : First Lag
LDCF : Least Developed Countries Fund
LDCs : Least Developed Countries
LIFDCs : Low-Income Food-Deficit Countries
LLC : Levin, Lin and Chu Panel Unit Root Test
LN : Natural Logarithm of Aggregate Governance Index
IMPEN : Import Penetration Index
MDGs : Millennium Development Goals
MFN : Most Favored Nation
NAPAs : National Adaptation Programmes of Action
NMHSs : National Meteorological and Hydrological Services
OECD : Organization of Economic Development
p. : Page
PSI : Political Stability Index
SDT : Special and differential treatment
TROP : Trade Openness Index
UN : United Nation
UNCDF : United Nations Capital Development Fund
UNFCCC : United Nations Framework Convention on Climate Change
UNCTAD : United Nations Conference on Trade and Development
WFP : World Food Programme
WMO : World Meteorological Organization
WTO : World Trade Organization

1
CHAPTER 1: INTRODUCTION
The most fundamental question concentrated on the field of growth and development is
“What are the reasons behind the large differences in the welfare of states?” which is being
motted as “Why are some countries much poorer than others?” (Acemoglu, Johnson and
Robinson, 2005, p.338) or more specifically “What are the fundamental causes of the large
differences in income per capita across countries?” (Acemoglu, Johnson and Robinson, 2001,
p.1369)
The dissertation looks for the answer to this historical question by concentrating on the most
vulnerable poor countries which are classified as “Least Developed Countries” (LDCs) by the
United Nations (UN) classification. The main issue of this study is the low level of growth in the
LDCs, with special emphasis on the role of governance institutions as a main determinant of
growth.
A broad consensus among growth economists, development experts and aid donors views
‘good governance’ as a pre-requisite for sustained increase in living standards of the society.
Although this literature has made important advances in uncovering the political, institutional and
social determinants of development, the new political economy of growth is not without
problems. Econometric works show that institutions are the key determinant of economic
performance. However, the new political economy of growth still lacks a proper grasp of the
channels through which institutions affect growth and the political sources of good institutions.
(Avellaneda, 2009) The study is attempted to fill this gap in the literature by concentrating on the
growth incapability of LDCs especially resulting from bad governance as a main structural
impediment to growth.
Although the traditional neoclassical growth models consider the economic environment in
which institutions are embedded as in the form of well-defined property rights which encourage
the “animal spirit” of “homo economicus” and the market mechanism which is the fundamental
institutions of overall pure capitalist system, the differences in the welfare of the states proxied
by differences in income per capita between states and also the economic growth leading to
overall development of the state has not been explained by the variation in institutions even in the

2
simple form of pure capitalist economy. Instead, the differences in income per capita are
explained in terms of different paths of factor accumulation by Solow, Cass and Koopmans (eg.,
Solow, 1956, Cass, 1965 and Koopmans, 1965, cited in Acemoglu et al., 2005, p.338) or in
terms of externalities from physical and human capital accumulation by Romer and Lucas (eg.,
Romer, 1986 and Lucas, 1988, cited in Acemoglu et al., 2005, p.338). Even though Romer,
Grossman and Helpman, Aghion and Howitt endogenized steady-state growth and technical
progress, they could not go beyond the previous explanations of income per capita differences
between countries (eg., Romer, 1990, Grossman and Helpman, 1991 and Aghion and Howitt,
1992, cited in Acemoglu et al., 2005, p.338).
The real contribution to the literature is ”the factors we have listed (innovation, economies of
scale, education, capital accumulation, etc.) are not the causes of growth; they are growth”
(North and Thomas,1973, p.2). According to Acemoglu et al. (2005), factor accumulation and
innovation or the technical progress can only be proximate causes of growth. Hence the
fundamental reason and the explanation of the difference between the welfare of states; thus the
touchstone of the differing paths of economic growth leading to more or less developed status of
states, is the quality of institutions. Countries that have well-established governance institutions
will invest more in both physical and human capital by using these factors more efficiently in
order to achieve greater level of income per capita (eg., North and Thomas, 1973, Jones, 1981,
North, 1981, cited in Acemoglu et al., 2001).
As North and Thomas (1973) argued, the fundamental explanation of comparative growth is
the differences in institutions and their governance which alters our perceptions about the quality
of those institutions.
For the LDCs, the main differences in institutions and thus governance are not mainly based
on the colonial origin of these countries but on the last disturbances in these countries emanating
from invasions, wars, civil wars, coupes, regime changes, etc., after they won their indepence
from colonial regimes as in Table 1. (Only two of the LDCs; Ethiopia and Nepal are not ex-
colonies.) That is why the study has concentrated on relatively short-run period rather than very-
long period starting from colonial origin suggested by Acemoglu et al. (2001). But the reason for
concentrating on this relatively short-run period is not because of the difficulty of overcoming the
econometric problems such as reverse causality and multicollinearity resulting in endogeneity

3
problem as in Dollar and Kraay (2002), but because these countries are no more colonies; but
independent states.
The study is organized as follows. The second chapter explains the categorization of LDCs
based on the criteria, rules and procedures for inclusion in and graduation from LDC category. It
gives a visual representation of LDCs with respect to three main criteria determining their
inclusion or graduation. The third chapter introduces the special support measures for LDCs
regarding the international trade, development assistance and aid from donor countries and
international communities. The fourth chapter examines the previous classification of governance
institutions in the literature and introduces the classification of aggregate governance clusters
developed by the author mainly based on the categorization of Aysan, Nabli and Varoudakis
(2006). The fifth chapter compares governance and growth in LDCs and High Income OECD
countries and the evolution of governance institutions in LDCs according to the aggregate
governance clusters developed in the previous chapter. The sixth chapter introduces the
characteristics of data, panel unit root tests for the variables in first differences, the methodology
of difference GMM and finally it represents the estimation results according to two empirical
models based on two alternative estimation techniques of difference GMM. The last chapter
presents the conclusion.

4
CHAPTER 2: CATEGORIZATION OF LDCs
In order to alleviate the problems of underdevelopment of the poorest countries, the category
of LDCs was first advocated in the 1960s to attract special support measures for the most
disadvantaged economies in the world. The responsible body of the UN; the Committee for
Development Planning (CDP) took the responsibility to carry out a comprehensive examination
of the special problems facing the LDCs and to recommend special measures for dealing with
those problems. CDP proposed an initial list of 25 LDCs based on a simple set of criteria at its
seventh session in 1971. CDP has been responsible for undertaking a review of the list in every
three years, regarding countries which should be included in or graduated from the list. Even
though the indicators composing the criteria are evolved over time as a “measurement of long-
term structural weaknesses”, the underlying principle of identifying LDCs has essentially
remained as “low-income countries that face structural handicaps to growth”. (CDP, 2008, p.V)
According to criteria that evolved over time, the initial list of LDCs covering 25 countries is
expanded into 48 countries which are scattered around three continents as of today. (For the
current list of LDCs, see Appendix 1)
2.1. Criteria and Procedure for Inclusion
Indicators reflecting the structural handicaps of low-income countries for growth are the high
vulnerability of the countries’ economies and their low level of human capital. (CDP, 2008, p.1)
CDP selected indicators that are proved to be sufficiently stable over time to minimize the
likelihood of easy reversibility of status from LDC to non-LDC and vice versa owing to dramatic
fluctuations in any single criterion. (CDP, 2008, p.5)
“In its choice of statistical indicators, the Committee attempts to identify those that most
closely reflect or capture the features that are of relevance for the classification of an
LDC.”(CDP, 2008, p.4)
5
2.1.1. Initial Criteria for Inclusion
The initial criteria for inclusion in the LDCs list was accepted by the Committee’s seventh
session in 1971 as:
• per capita GDP which indicates the level of income in a given country
• share of manufacturing in GDP which indicates the degree of industrialization since high
degree of industrialization was seen to be the structural characteristic of developed
countries (CDP, 2008, p.3)
• adult literacy rate which indicates a country’s level of human capital development (CDP,
2008, p.3)
Even though the underlying principle of identifying LDCs as “low-income countries that face
structural handicaps to growth” has essentially remained, a number of improvements have been
introduced into the criteria to identify least developed countries as data availability on
development indicators for developing countries continued to improve. (CDP, 2008, p.5)
2.1.2. Latest Criteria for Inclusion
CDP defines the category of the LDCs as comprising those low-income countries suffering
from structural handicaps to economic development. The eligibility criteria for LDCs have
evolved into the three types as “Gross National Income (GNI) Per Capita”, “Human Assets
Index” (HAI) and “Economic Vulnerability Index” (EVI).
The Committee determined in 1991 that countries with a population exceeding 75 million
should not be considered for inclusion in the list of LDCs.
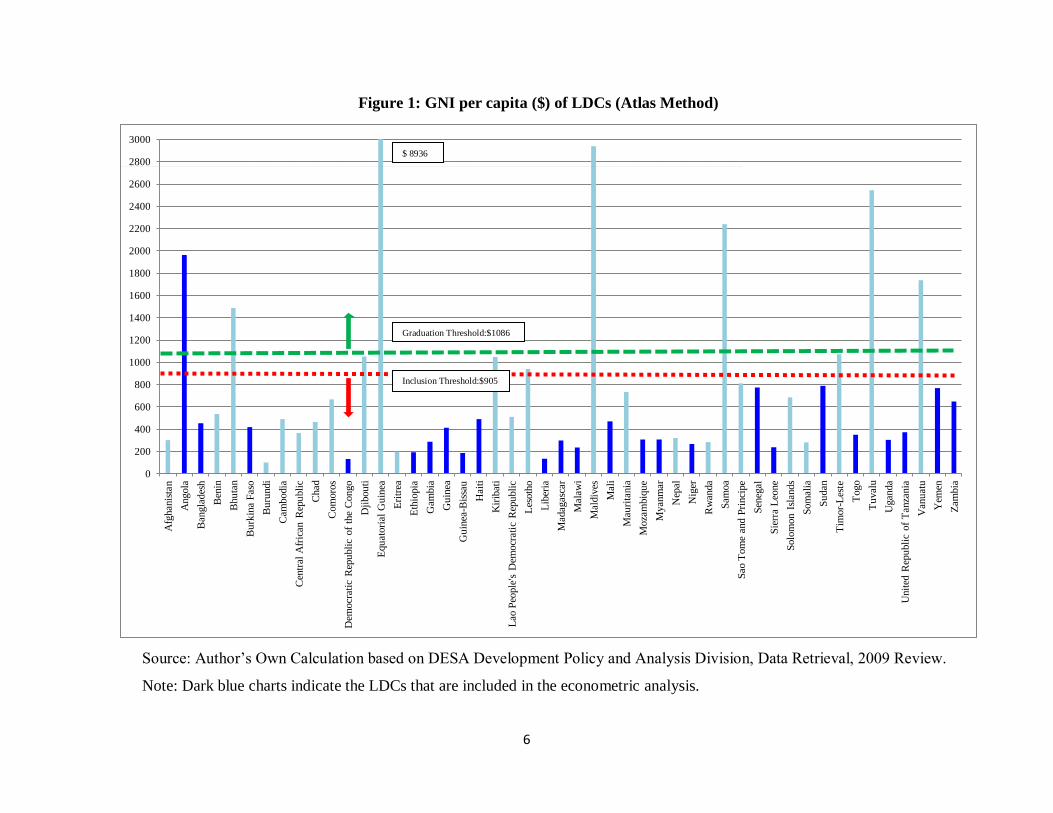
2.1.2.1. GNI Per Capita
GNI per capita can provide an indication of the income position of a country vis-à-vis other
developing countries and it also gives a rough idea of the productive capacity of an economy and
its ability to provide requisite services. (CDP, 2008, p.39)
The threshold for graduation is set at a higher level as $900 which is about 20 per cent above
the $745 threshold for inclusion. (CDP, 2008, p.39)
6
0
200
400
600
800
1000
1200
1400
1600
1800
2000
2200
2400
2600
2800
3000
Afg
han
ista
n
Angola
Ban
gla
des
h
Ben
in
Bhu
tan
Bu
rkin
a F
aso
Bu
rundi
Cam
bodia
Cen
tral
Afr
ican
Rep
ubli
c
Chad
Com
oro
s
Dem
ocr
atic
Rep
ubli
c of
the
Congo
Dji
bou
ti
Equ
atori
al G
uin
ea
Eri
trea
Eth
iopia
Gam
bia
Gu
inea
Gu
inea
-Bis
sau
Hai
ti
Kir
ibat
i
Lao
Peo
ple
's D
emocr
atic
Rep
ubli
c
Les
oth
o
Lib
eria
Mad
agas
car
Mal
awi
Mal
div
es
Mal
i
Mau
rita
nia
Moza
mbiq
ue
Myan
mar
Nep
al
Nig
er
Rw
anda
Sam
oa
Sao
Tom
e an
d P
rinci
pe
Sen
egal
Sie
rra
Leo
ne
Solo
mon I
slan
ds
Som
alia
Su
dan
Tim
or-
Les
te
Togo
Tu
val
u
Ugan
da
Unit
ed R
epu
bli
c of
Tan
zania
Van
uat
u
Yem
en
Zam
bia
Figure 1: GNI per capita ($) of LDCs (Atlas Method)
Source: Author’s Own Calculation based on DESA Development Policy and Analysis Division, Data Retrieval, 2009 Review.
Note: Dark blue charts indicate the LDCs that are included in the econometric analysis.
$ 8936
Graduation Threshold:$1086
Inclusion Threshold:$905

7
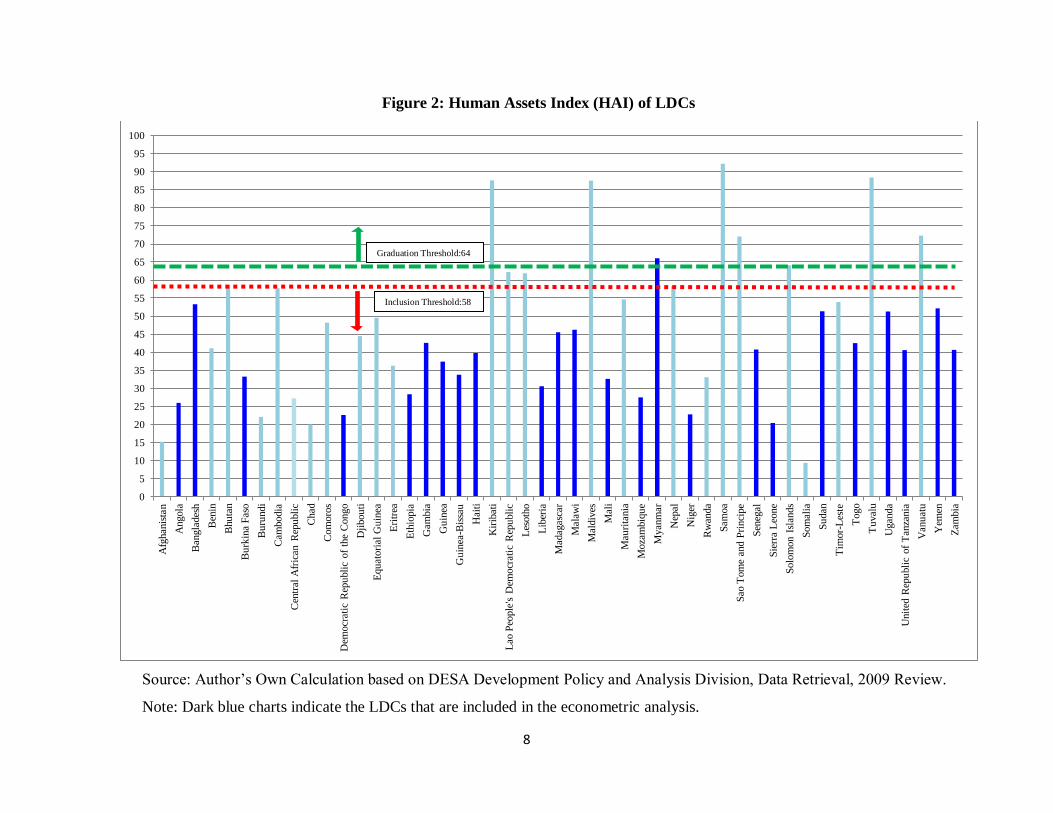
2.1.2.2. Human Assets Index (HAI)
The HAI provides information on the level of development of human capital by focusing on
achievements in health and education as an indication of the capacity countries have to take
advantage of opportunities for development. It has two indicators for health and nutrition; “the
percentage of population that is undernourished” and “the rate of mortality for children aged five
years and under” and two indicators for education; “the gross secondary school enrolment ratio”
and “the adult literacy rate”. (CDP, 2008, p.45)
Undernourishment and mortality rate have an important negative impact on productivity.
They reflect the social, economic and environmental conditions in a society. For low-income
countries, differences in life expectancy of population tend to be strongly influenced by
differences in the levels of child mortality rates. A low level of education is a major obstacle to
development as it implies an overall shortage of skills for the organization and functioning of the
economy and reflects a low capacity to absorb technological advances. The adult literacy rate
indicates the size of the base available for enlarging the trained and skilled human resources
needed for development and the gross secondary enrolment ratio complements that information
by providing an indication of the share of population with a certain level of skills. (CDP, 2008,
p.46)
8
Figure 2: Human Assets Index (HAI) of LDCs
Source: Author’s Own Calculation based on DESA Development Policy and Analysis Division, Data Retrieval, 2009 Review.
Note: Dark blue charts indicate the LDCs that are included in the econometric analysis.
0
5
10
15
20
25
30
35
40
45
50
55
60
65
70
75
80
85
90
95
100
Afg
han
ista
n
Angola
Ban
gla
des
h
Ben
in
Bhu
tan
Bu
rkin
a F
aso
Bu
rundi
Cam
bodia
Cen
tral
Afr
ican
Rep
ubli
c
Chad
Com
oro
s
Dem
ocr
atic
Rep
ubli
c of
the
Congo
Dji
bou
ti
Equ
atori
al G
uin
ea
Eri
trea
Eth
iopia
Gam
bia
Gu
inea
Gu
inea
-Bis
sau
Hai
ti
Kir
ibat
i
Lao
Peo
ple
's D
emocr
atic
Rep
ubli
c
Les
oth
o
Lib
eria
Mad
agas
car
Mal
awi
Mal
div
es
Mal
i
Mau
rita
nia
Moza
mbiq
ue
Myan
mar
Nep
al
Nig
er
Rw
anda
Sam
oa
Sao
Tom
e an
d P
rinci
pe
Sen
egal
Sie
rra
Leo
ne
Solo
mon I
slan
ds
Som
alia
Su
dan
Tim
or-
Les
te
Togo
Tu
val
u
Ugan
da
Unit
ed R
epu
bli
c of
Tan
zania
Van
uat
u
Yem
en
Zam
bia
Inclusion Threshold:58
Graduation Threshold:64

9
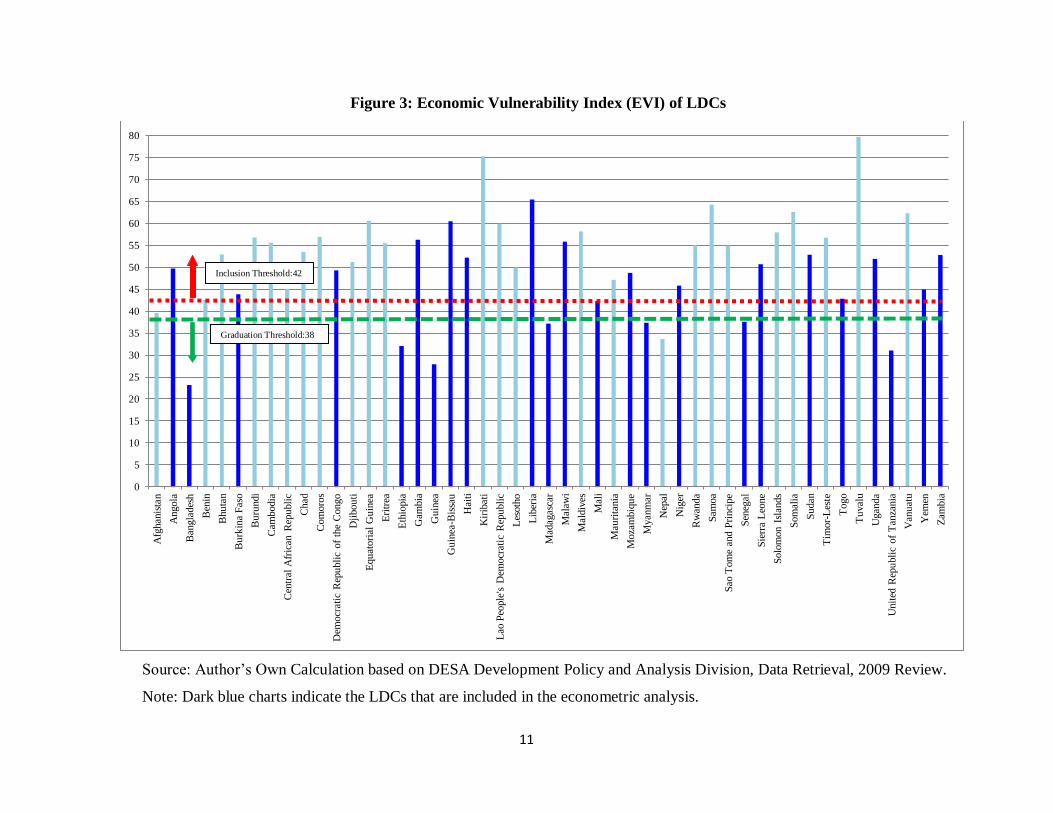
2.1.2.3. Economic Vulnerability Index (EVI)
EVI reflects the possible negative and long-lasting effects of the shocks that have on growth
and development in order to express information on the magnitude of countries’ economic
vulnerability. It takes the structural characteristics of the country into consideration which
concerns the degree to which it is exposed to such shocks and the country’s capacity to react to
shocks. The criterion in designating countries as LDCs, there is a need to focus on those sources
of vulnerability that “accentuate or perpetuate underdevelopment”, “are not the result of
misguided policies but instead are such that they limit policymakers’ capacity to respond to
shocks” and “are beyond a country’s control”. (CDP, 2008, p.48)
Seven indicators are grouped into simple, unweighted averages of two components as
“exposure index” and “shock index”.
Exposure index is composed of “smallness”, “location index” and “structural index”.
Smallness is proxied by the logarithm of the size of its population in which smaller size is often
associated with a persistent lack of structural diversification and dependence on external markets
and small economies experience higher exposure to natural shocks. The main argument behind
the location index (remoteness) is that the countries isolated from main markets have difficulty in
diversifying their economies and remoteness is a structural obstacle to trade and growth and a
possible source of vulnerability when shocks occur. (CDP, 2008, p.50) The structural index is
composed of “merchandise export concentration” considering the fact that export concentration
increases a country’s exposure to trade shocks and “share of agriculture, forestry and fisheries in
gross domestic product” in which a larger share implies higher exposure to shocks both in
relation to terms of trade and to natural disasters. (CDP, 2008, p.52)
Shock index is composed of “natural shock index” and “trade shock index”. Natural shock
index is defined as the simple average of two components as “homelessness due to natural
disasters” and “the instability of agricultural production”. (CDP, 2008, p.52) Natural disasters
have a negative impact on economic development and are an important source of vulnerability
for low-income countries. The homelessness index conveys information on the average share of
the population that is displaced by natural disasters over a period of time. (CDP, 2008, p.53)

10
Trade shock index is measured by “instability of exports of goods and services” which is
based on the idea that low-income countries, particularly heavily dependent on agricultural
exports or the provision of tourism services, instability of export resourcing mainly from climatic
events or changes in policies of major importing markets proceeds is a source of vulnerability.
(CDP, 2008, p.54)
11
Figure 3: Economic Vulnerability Index (EVI) of LDCs
Source: Author’s Own Calculation based on DESA Development Policy and Analysis Division, Data Retrieval, 2009 Review.
Note: Dark blue charts indicate the LDCs that are included in the econometric analysis.
0
5
10
15
20
25
30
35
40
45
50
55
60
65
70
75
80
Afg
han
ista
n
Angola
Ban
gla
des
h
Ben
in
Bhu
tan
Bu
rkin
a F
aso
Bu
rundi
Cam
bodia
Cen
tral
Afr
ican
Rep
ubli
c
Chad
Com
oro
s
Dem
ocr
atic
Rep
ubli
c of
the
Congo
Dji
bou
ti
Equ
atori
al G
uin
ea
Eri
trea
Eth
iopia
Gam
bia
Gu
inea
Gu
inea
-Bis
sau
Hai
ti
Kir
ibat
i
Lao
Peo
ple
's D
emocr
atic
Rep
ubli
c
Les
oth
o
Lib
eria
Mad
agas
car
Mal
awi
Mal
div
es
Mal
i
Mau
rita
nia
Moza
mbiq
ue
Myan
mar
Nep
al
Nig
er
Rw
anda
Sam
oa
Sao
Tom
e an
d P
rinci
pe
Sen
egal
Sie
rra
Leo
ne
Solo
mon I
slan
ds
Som
alia
Su
dan
Tim
or-
Les
te
Togo
Tu
val
u
Ugan
da
Unit
ed R
epu
bli
c of
Tan
zania
Van
uat
u
Yem
en
Zam
bia
Graduation Threshold:38
Inclusion Threshold:42
12
2.1.3. Procedure for Inclusion
The expert group, consisting of CDP members in the triennial reviews of the list of the LDCs,
analysis the economic and social conditions in all low-income countries according to the most
recent available data and the preliminary results of the application of the criteria. It prepares a
preliminary list of countries identified for inclusion satisfying the inclusion threshold levels with
respect to all three criteria. The United Nations Department of Economic and Social Affairs
(DESA) will prepare a country assessment note on the basis of the group’s finding of eligibility
by means of statistical evidence and it will incorporate other relevant information for presentation
to the CDP. Particular consideration will be given to the reasons for the recent deterioration of
economic and social conditions in the country in order to determine whether that deterioration is
due to structural or transitory factors. Then, DESA notifies the government of that country of this
conclusion and the findings considered by the CDP at its forthcoming triennial review. On receipt
of the assessment note, the country may submit a written statement to the CDP, expressing its
views on its possible inclusion in the list, including any objections to such inclusion. (CDP, 2008,
p.9)
If the country does not express a formal objection to inclusion in the list of LDCs, the CDP
will make an appropriate recommendation in its report to the Council. If the country has
expressed a formal objection, the finding of eligibility as well as the country’s objection will be
recorded in the report and no recommendation for inclusion will be made. (CDP, 2008, p.9)
Once the Council endorses the recommendation for inclusion after the acceptance of country,
the country will be formally added to the list of LDCs. (CDP, 2008, p.9)
2.2. Rules and Procedure for Graduation
2.2.1. Rules for Graduation
A country must cease to meet two out of the three inclusion criteria.
• A country is eligible for the graduation, if its GNI increases to at least twice the
graduation threshold level, even if that country has not met both HAI and EVI criteria.
Since higher levels of GNI per capita are often required to improve a country’s human

13
assets and to confront existing economic vulnerabilities, and it indicates greater
availability of resources for the implementation of those policies.
• Eligibility for graduation has to be observed over 2 consecutive triennial reviews.
• Graduation takes place only after 3 years, in order to give the country time to prepare
itself for a smooth transition from the list
Graduation does not require approval from the country concerned.
The graduation rules are established in 1991 with additional principles to ensure that
graduation takes place only after a country’s development prospects have significantly improved
and the graduated country can sustain its development path. (CDP, 2008, p.5)
2.2.2. Procedure for Graduation and Smooth Transition
By analyzing the most recent available data on the economic and social conditions in all low-
income countries and the preliminary results of the application of the criteria, the expert group
prepares a preliminary list of countries identified for graduation in the triennial reviews of the list
of LDCs. In its report, the CDP will notify the Council of all LDCs that meet the graduation
criteria, and those countries that are confirmed eligible for the second consecutive time are
recommended for graduation.
As in the inclusion process, DESA will inform the country concerned of the findings of
eligibility for graduation after the first review. Then, UNCTAD will prepare a vulnerability
profile giving an overall background of the economic and development situation of that country
and it will compare the values of the indicators used in the CDP criteria with relevant national
statistics. UNCTAD will further assess other vulnerabilities that the country is facing which are
not covered by the EVI, as well as other structural features of the country that are of relevance for
the graduation decision (CDP, 2008, p.11)
In cooperation with UNCTAD, DESA will prepare an ex ante impact assessment of the likely
consequences of graduation for the country’s economic growth and development by identifying
potential risk factors, or gains, that the country may face after graduation. With the cooperation
of the country concerned as well as its development partners, DESA will focus on the expected
14
implications of a loss of LDC status, in particular with regard to development financing,
international trade and technical assistance. (CDP, 2008, p.13)
When a country meets the graduation criteria for the second consecutive time, the CDP may
recommend the country for graduation in its report to the Council after considering all relevant
quantitative and qualitative information at its disposal. If the Council endorses the
recommendation, graduation will take effect three years after the General Assembly takes note of
the recommendation. During the three-year period before graduation takes effect, the country
concerned may prepare a transition strategy in cooperation with its development partners. (CDP,
2008, p.13)
After the country has officially graduated, the strategy aims at ensuring that the phasing out
of support measures resulting from its change of status will not disrupt the country’s continued
development efforts. The CDP will monitor the development progress of those countries whose
graduation has not become effective and include its findings in its annual report to the Council in
order to identify any signs of reversal in the development progress of the country concerned
during the post-graduation period and bring them to the attention of the Council as early as
possible. The CDP will report to the Council on the findings of the monitoring exercise as a
complement to the triennial review of the list of LDCs. (CDP, 2008, p.14)
(See Appendix 1 for the countries that are graduated and rejected to be enlisted as LDC)

15
CHAPTER 3: SPECIAL SUPPORT MEASURES FOR THE LDCS
The structural impediments to growth in LDCs are so pervasive that they prompt the
international community consisting of the bilateral donors and multilateral organizations to
extend special support measures in the form of financial, institutional and technical support and
also a higher degree of preferential trade-related treatment. (CDP, 2010, p.1)
Each of the ten year UN Programmes of Action (PoAs) cover the framework for international
cooperation by outlining the development strategies, the priority areas for policy intervention and
the special support measures envisaged for LDCs. (CDP, 2010, p.1)
The first PoA launched in 1981 had two defining features. The first was an emphasis on
poverty alleviation through food self-sufficiency and the second was a reliance on development
planning in order to mobilize and utilize resources effectively. It was planned to increase the
share of manufacturing in gross domestic product (GDP), particularly through the development
of agro-processing industries. Expansion of the manufacturing capacity was needed not only to
meet domestic demand but also to increase exports since the low export revenue was seen as a
major constraint to the capacity of these countries to import. (CDP, 2010, p.3) But as seen from
the Figure 11, the exports of LDCs did not increase while the imports were throughout the 1980s,
leading to huge trade deficits for most of the LDCs.
The second PoA in 1990 relied on unleashing free markets for the efficient reallocation of
resources and on promoting the role of the private sector in economic growth by handling adverse
effects of import controls, tariffs, direct price controls and other regulations imposed by the State
to enhance market access and to gain export diversification. LDCs were advised to downsize
State interventions, deregulate markets, restore and maintain macroeconomic stability and
liberalize their economies, so that markets could send the right price signals for private initiatives
to pursue profit-making activities. The creation of a domestic policy environment conducive to
growth was designed to minimize the structural constraints facing LDCs and to help them embark
upon a path of sustained and sustainable growth. (CDP, 2010, p.4)
The third PoA was adopted in 2001 stating its key objectives to carry out the Millennium
Development Goals (MDGs) and to increase the share of LDCs in global trade, finance and

16
investment. It was the first time the Committee drives a great deal of attention to good
governance, especially the effective rule of law and participation in political and economic
activities by civil society, institutional reform and the provision of social services. 30 specific
objectives are identified to be achieved by means of fostering pro-poor growth, building
institutional and human capabilities, reducing inequality and promoting greater popular
participation, especially of women, and ensuring the rule of law, property rights and respect for
internationally recognized human rights. Access to developed-country markets for LDC exports
were received greater attention than previous PoAs and provisions were included to ensure that
the pace of integration of the LDCs into the multilateral trading system would be commensurate
with their structural weaknesses. (CDP, 2010, p.5)
The objectives contained in these three PoAs have not been fully met because of the
following reasons: the goals set by the PoAs were too ambitious in relation to the measures
introduced to achieve them; even where reasonable goals were set, inadequate external support,
misguided domestic policies and unforeseen shocks such as natural disasters and conflicts made
it difficult to implement the strategies and projects according to the original plans; the PoAs
overemphasized international measures whose impact on development in general and on poverty
reduction in particular has not been compellingly demonstrated and the international support
measures, while necessary, may not be sufficient to address the structural impediments facing the
LDCs. (CDP, 2010, p.V)
These special support measures offered to LDCs in order to overcome their structural
weaknesses to grow fall into three main areas as “international trade”, “official development
assistance (ODA), including development financing and technical cooperation” and “other forms
of assistance”. (CDP, 2008, p.15)
3.1. International Trade
The share of LDCs in world exports of goods decreased from 3 per cent in 1950 to 1.5
percent in 1971. Since the establishment of the category in 1971, the share of LDCs in world
trade has steadily decreased even to the designated PoAs which gives special support measures to
LDCs in order to increase their trade performance. It had declined to 0.75 percent in 1980, and to
0.56 percent in 1990 and it hit its lowest level of 0.47 percent in 1995. After 1995, it was
17
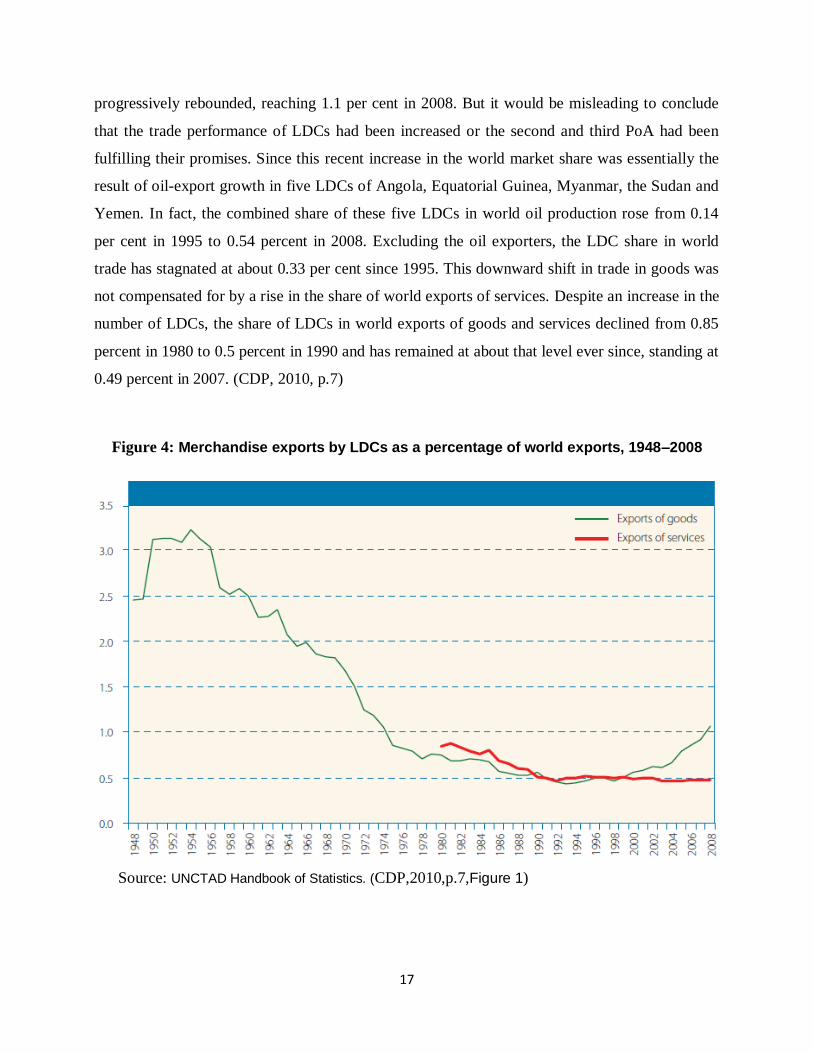
progressively rebounded, reaching 1.1 per cent in 2008. But it would be misleading to conclude
that the trade performance of LDCs had been increased or the second and third PoA had been
fulfilling their promises. Since this recent increase in the world market share was essentially the
result of oil-export growth in five LDCs of Angola, Equatorial Guinea, Myanmar, the Sudan and
Yemen. In fact, the combined share of these five LDCs in world oil production rose from 0.14
per cent in 1995 to 0.54 percent in 2008. Excluding the oil exporters, the LDC share in world
trade has stagnated at about 0.33 per cent since 1995. This downward shift in trade in goods was
not compensated for by a rise in the share of world exports of services. Despite an increase in the
number of LDCs, the share of LDCs in world exports of goods and services declined from 0.85
percent in 1980 to 0.5 percent in 1990 and has remained at about that level ever since, standing at
0.49 percent in 2007. (CDP, 2010, p.7)
Figure 4: Merchandise exports by LDCs as a percentage of world exports, 1948–2008
Source: UNCTAD Handbook of Statistics. (CDP,2010,p.7,Figure 1)

18
3.1.1. Preferential Market Access
It allows exporters from developing countries to pay lower tariffs or to have duty- and quota-
free access to third-country markets in order to facilitate export growth under two general
preferential schemes as non-reciprocal “Generalized System of Preferences“(GSP) and reciprocal
“Global System of Trade Preferences” (GSTP). (CDP, 2008, p.15)
Special trade preferences to developing countries through a temporary waiver to the General
Agreement on Tariffs and Trade (GATT) rules began in 1971. (CDP, 2010, p.8)
The GSP is signed in 1968 at the second session of the UNCTAD to increase the export
earnings of developing countries, promote industrialization and accelerate their rate of growth.
By the “Enabling Clause” in 1979, selected products exported from developing countries would
be granted zero or reduced tariff rates instead of the Most-Favored-Nation (MFN) rates of duty
allowing wider product coverage and deeper tariff cuts for LDCs. But only a small number of
developing countries have introduced duty-free and quota-free (DFQF) access to exports from
LDCs during the 2000s. Also preferences are eroded when further trade liberalization occurs in
the importing market. For countries or regions that extend different preferential treatment to other
trading partners, the actual magnitude of preferential access offered to LDCs needs to be
measured in relation to the effective tariff paid by all other exporters to that market, rather than in
relation to the MFN tariff. When preferential access is measured in this way, the preference
margins enjoyed by the LDCs are found to be very small and the level of preference extended
therefore seems to be quite small on average. (CDP, 2008, p.16 and CDP, 2010, p.8)
The GSTP entered into force in 1989 as an agreement among 43 participants on cooperation
on tariffs, para-tariffs, non-tariff measures, direct trade measures and sectoral agreements to
extend concrete preferential treatment measures and concessions especially for current seven
members of LDCs. (CDP, 2008, p.16)
There are other regional or bilateral trade agreements and/or non-reciprocal market access
schemes offering market access concessions to LDCs as “South Asian Free Trade Agreement“
(SAFTA), “Everything But Arms” (EBA) initiative that is initiated by the European Union (EU).
(CDP, 2008, p.17)
19
Despite these preferential market accesses offered, LDCs continue to experience important
obstacles to the full utilization of trade preferences including supply-side constraints, rules of
origin restrictions, non-tariff barriers complying with product standards, sanitary measures and
eco-labeling and subsidies in developed countries. (CDP, 2008, p.17) Especially, supply
constraints constitute a major obstacle affecting the exporting capacity of most LDCs not only in
terms of the lack of adequate trade infrastructure but also in terms of their own narrow production
base. Supply capacity is often negatively affected by weak or inadequate institutional and
governance structures which verify that the governance is the most important structural
impediments to growth in LDCs as mentioned before. (CDP, 2010, p.11)
3.1.2. Other Trade-Related Measures
In addition to preferential market access, LDCs benefit from other “special and differential
treatment” (SDT) related to the disciplines of WTO agreements and have access to the
“Integrated Framework” (IF) and “Enhanced Integrated Framework” (EIF) for trade-related
technical assistance to LDCs. (CDP, 2010, p.11)
SDTs for LDCs are expected to facilitate the integration of LDCs into the multilateral trade
regime by exempting them from having to comply with certain disciplines or by giving them
extended periods or technical assistance, or both, to implement the measures. (CDP, 2010, p.11)
The impact of SDTs on the growth of LDCs is debatable since exemptions to WTO
obligations may not benefit LDCs in the long run if STDs lead them to postpone the reforms
necessary for creating more open economies. Most LDCs have small economies and cannot
develop without being open to outside markets, and high protectionist barriers would hinder
productivity growth and the strengthening of their competitiveness. It is also not clear whether
WTO disciplines are compatible with the current stage of development in LDCs. These countries
are structurally vulnerable to external shocks and need a careful examination of flexible outward-
oriented measures and supports are required. Since SDTs alone cannot accelerate development in
LDCs, measures are needed to increase the resilience of the LDCs to external shocks, which
include insurance mechanisms, shock-smoothing facilities and capacity-building, together with
the other specific measures discussed in the previous section. (CDP, 2010, p.13)
20
Some of these provisions have already expired or are no longer applicable such as; the longer
period extended to LDCs for implementing certain WTO agreements has expired; special
provisions for LDCs for the “Agreement on Textiles and Clothing” (ATC), are no longer
applicable.
The IF was created in 1997 aiming to deliver technical assistance to improve the capacity of
LDCs to formulate, negotiate and implement trade policies so as to facilitate and derive greater
benefits from their integration into the multilateral trading system. Since only modest results
were accomplished during the early years, it was strengthened in 2007 as the enhanced Integrated
Framework. The EIF aims to achieve qualitative goals such as mainstreaming trade into
development policies and improving policy-making processes. (CDP, 2010, p.13)
3.2. International Aid
3.2.1. Bilateral Assistance
The United Nations PoAs for LDCs grants provisions for giving priority to LDCs in the
allocation of official development assistance (ODA). It started with the first United Nations
Conference on the LDCs in 1981 stating that the members of the Development Assistance
Committee of the Organization for Economic Cooperation and Development (OECD/DAC)
committed themselves to allocating 0.15 per cent of their total gross national income (GNI) to
LDCs, including funds that are channeled through international organizations, while there are no
targets for individual LDCs. The ratio has fluctuated between 0.08 and 0.1 per cent since the first
LDC Conference and stood at 0.09 per cent in 2008. In turn, aid to LDCs as a share of total aid
fluctuated around the 30 percent despite an increase in the number of LDCs since 1971. (CDP,
2010, p.14)
The introduction of the LDC category in 1971 drew the attention of donors to the these
countries in a way that the average growth rate of ODA to LDCs nearly trebled to 23.7 per cent
per year during the 1970s, from an average annual rate of growth of 8.4 per cent of ODA to the
same countries in the 1960s. In contrast, ODA to other developing countries grew on average by
10 per cent per year in the 1970s from 3.4 per cent in the 1960s. (CDP, 2010, p.14)

21
This favorable allocation of aid to LDCs was reversed during the 1980s and 1990s. The
average annual rate of growth of ODA flows to LDCs slowed down to about 6.9 per cent in the
1980s and even contracted by an annual rate of 3.7 percent in the 1990s. In contrast, aid to other
developing countries grew by 7.9 percent during the 1980s, 1 percentage point higher than aid to
LDCs, and declined only marginally, about 0.5 percent per year during the 1990s. ODA flows to
LDCs recovered in the 2000s as it can be seen in Figure 6, but were comparable to the recovery
observed in flows directed to other developing countries. It suggests that belonging to the
category of LDC does not necessarily imply that an LDC will receive a relatively greater amount
of bilateral aid than other developing countries even to the United Nations conferences and
international communities that promised to favor LDCs to overcome their structural weaknesses
to grow. (CDP, 2010, p.14)
Figure 5: Official development assistance (ODA) to LDCs, value and percentage of GNI of
DAC member countries, 1990- 2006
Source: OECD Development Database on Aid from DAC Members. (CDP, 2008, p.27, Figure
II.1)

22
The contribution of ODA to the growth of LDC economies is generally difficult to assess
since the literature has not yet reached a consensus on what makes aid more effective, although it
tends to confirm that aid itself is generally an important tool for enhancing the development
prospects of poor nations in specific contexts. It is argued that aid flows have a significant impact
on the growth of countries that are structurally more vulnerable, particularly countries that
experience high instability in their export earnings. This implies that, in countries where GNI per
capita and the human assets index (HAI) are similar, aid is more effective in the country with
higher economic vulnerability especially resulting from the negative effects of shocks. (CDP,
2010, p.15)
The results of an econometric analysis by Guillaumont and Chauvet (2001) who consider the
three criteria used to classify countries as LDCs, indicate that there is a statistically significant,
negative relationship between per capita ODA and per capita income of the recipient LDC.
Hence, it can be concluded that aid allocation seems to favor those LDCs that are further away
from the graduation threshold in terms of per capita GNI. In other words, poorer countries get
more aid. Also a similar relationship is observed between ODA per capita and the HAI, implying
that LDCs with fewer human assets tend to get more ODA. There is a statistically insignificant,
positive correlation between the economic vulnerability index (EVI) and ODA per capita. So,
there does not seem to be a systematic effort by donors to use aid to mitigate economic
vulnerability once GNI per capita and HAI have been taken into account.. (CDP, 2010, p.16)
Development assistance for the LDCs needs to be increased in quantity and made more
effective through improved coordination among donors with the development strategies of
recipient LDCs. The potential for increasing aid effectiveness should be unleashed through
untying of aid, aligning of support with country priorities, giving more aid as budget support on
long-term commitments, and harmonizing donor policies and practices in all forms of aid
delivery, reducing the uncertainty and unpredictability of aid flows through long-term
commitments. (CDP, 2004, p.8)
Donors should also increase the share of ODA in the form of grants, particularly to countries
with high economic vulnerability to ensure that the debt of LDCs is sustainable in the long term.
(CDP, 2004, p.7)

23
3.2.2. Multilateral Assistance
Several multilateral organizations carry out programmes specially designed for providing
assistance to the LDCs. (CDP, 2008, p.30)
3.2.2.1. Global Environment Facility (GEF)
The GEF with the assistance of its implementing agencies, UNDP, UNEP and the World
Bank manages the United Nations Framework Convention on Climate Change (UNFCCC) for
LDCs to support projects addressing the urgent and immediate adaptation needs of the LDCs as
identified by their national adaptation programmes of action (NAPAs). The Least Developed
Countries Fund (LDCF) responds to the unique circumstances of the LDCs, which are the low
capacity and highly vulnerable to the adverse impacts of climate change. These LDCs are in need
of immediate and urgent support in starting to adapt to current and projected adverse effects of
climate change. LDCF provide support for the preparation and implementation of NAPAs that
propose activities whose further delay could increase vulnerability or lead to increased costs at a
later stage. To date, 15 donor countries are contributing to the LDCF on a voluntary basis have
pledged to the LDCF: Canada, Denmark, Finland, France, Germany, Ireland, Italy, the
Netherlands, New Zealand, Norway, Portugal, Spain, Sweden, Switzerland and the United
Kingdom and Northern Ireland. The total amount pledged is $120 million. (CDP, 2008, p.31)
3.2.2.2. The United Nations Capital Development Fund (UNCDF)
The United Nations General Assembly adopted a resolution requesting the UNCDF to
concentrate its investments, first and foremost, in the LDCs in 1973. UNCDF is now active on
the ground in 37 of the 48 LDCs by focusing in support to decentralized public investments and
support to private investments through micro-financing. The approach of UNCDF is to support
the LDCs in piloting small-scale investments that can be replicated on a larger scale with the
assistance of other development partners who can bring additional financial support. (CDP, 2008,
p.31)
3.2.2.3. World Food Programme (WFP)
The WFP allocates at least 50 percent of its development resources to LDCs and at least 90
percent to low-income food-deficit countries (LIFDCs) including LDCs. Up to 10 per cent of

24
resources will remain available to meet either the additional needs of these countries or the
special needs of non-LIFDCs. The WFP will increase the level of development activities in LDCs
by investing in their capacity to implement food aid programmes including training or support for
non-food inputs and essential services, providing up to 20 per cent of resources for food fund
facilities and experimental projects, and supporting the maintenance of infrastructure and basic
public services on a trial basis, as long as phase-out plans are specified and results closely
monitored. (CDP, 2008, p.31)
3.2.2.4. World Meteorological Organization (WMO)
The WMO established a programme for LDCs in 2003 by a trust fund to receive voluntary
cash contributions from members, bilateral and multilateral funding agencies and other
cooperating partners. The WMO programme aims to enhance and strengthen the capacities of the
National Meteorological and Hydrological Services (NMHSs) of LDCs so that they can meet the
national, regional and global needs in relation to weather, climate and water. (CDP, 2008, p.31)
3.3. Other Forms of Support Measures
The United Nations provides financial support for the participation of representatives of
LDCs in annual sessions of the General Assembly by paying the travel, but not subsistence
expenses as follows; up to five representatives per LDC attending a regular session of the General
Assembly, one representative per LDC attending a special or emergency session of the General
Assembly, and one member of a permanent mission in New York designated as a representative
or alternate to a session of the General Assembly. (CDP, 2008, p.32)
A number of United Nations organizations and conventions have also established financial
mechanisms to fund the participation of LDCs in their processes as follows; the specific trust
fund for the travel and daily subsistence allowance of two representatives from each LDC to
attend the annual review of the third PoA, the voluntary trust fund to assist developing countries,
in particular LDCs, small island developing States and landlocked developing States, to attend
meetings of the United Nations Consultative Process on Oceans and the Law of the Sea by
covering the costs of travel and daily subsistence allowance and the United Nations Framework
Convention on Climate Change (UNFCCC) special Trust Fund for Facilitating the Participation
of Parties in the UNFCCC Process provides funding to LDCs. (CDP, 2008, p.32)
25
Overall, existing international support measures for LDCs have generated rather limited
results because of the following reasons: the goals set by the strategies may have been
excessively ambitious suggesting a lack of coherence between the objectives and the policy
measures instituted to achieve them; even where goals were reasonable, there were difficulties in
implementing the strategy owing to inadequate external support, misguided domestic policies,
poor governance or random shocks; the measures turned out to be inadequate because the LDC
strategy had overemphasized those international measures whose impact on growth, poverty
alleviation; and eventually graduation had not been convincingly demonstrated and the strategies
include measures which may be “necessary” but not “sufficient” to address the structural
handicaps affecting the LDCs as many important domestic and international obstacles to
development were neglected. (CDP, 2010, p.19)
26
CHAPTER 4: CLASSIFICATION OF GOVERNANCE
INSTITUTIONS
According to North (1991), institutions are the humanly devised constraints that structure
political, economic and social interaction in order to create order and reduce uncertainty in
exchange. They define the choice set and therefore determine transaction and production costs
and hence the profitability and feasibility of engaging in economic activity. They provide the
incentive structure of an economy; as that structure evolves, it shapes the direction of economic
change towards growth, stagnation, or decline.
Governance is defined as the management of society by the traditions and institutions that
determine how authority is exercised in a particular country. (Kaufmann, Kraay and Lobatón,
2000 and CDP, 2004, p.9)
Currently, there are two distinct streams of discourse on good governance as one is rooted in
academic research and the other is donor-driven. Academic discourse has dealt mainly with the
way in which power and authority relations are structured in different contexts as in the aggregate
governance clusters in the study, whereas the donor-driven discourse has focused more on state
structures designed to ensure accountability, due processes of law, and related safeguards.
Academic discourse is directed mainly towards better understanding of institutional linkages
among the State, civil society and the private sector. Donor-driven discourse is oriented towards
enhancing policy effectiveness as in the PoAs and CDP reports. (CDP, 2004, p.9)
There exist two propositions for the effect of governance on growth; theoretical proposition
and normative proposition namely. Theoretical proposition argues that institutions and economic
policies of a country are decisive for its economic performance and normative proposition argues
that any poor countries that adopt relatively good economic policies and institutions enjoy rapid
catch-up growth. (Avellaneda, 2009)
The concept of good governance is first considered in donor discourse in 1990, when the
World Bank adopted it as a condition for lending to developing countries. In the beginning, the
notion was rather apolitical and focused primarily on improving the quality of public sector
management in recipient countries. By the mid-1990s, concept of good governance had expanded
27
to include the notions of transparency, accountability and participation and the aspect of
predictability was added to the mix in the wake of the financial crises of the late 1990s, along
with calls for improvements in corporate governance and international financial market stability.
Currently, the concept of good governance is being explored at three separate, interacting levels
as: the national level which covers all of the standard elements of a political, economic and
administrative nature; the global level which encompasses all of those elements introduced by the
process of globalization, including the regulation of global public goods and stability in capital
flows and the corporate level. (CDP, 2004, p.10) The study is concentrated on the national level.
The Committee focused its attention on governance at the national level and the concept of
good governance is currently predicated upon mutually supportive and cooperative relationships
among government, civil society and the private sector assume critical importance. (CDP, 2004,
p.10) Successful implementation of the objectives, policies, commitments and measures at the
national level among other things should be supported by good governance through transparent,
accountable, and efficient institutions and practices within the Government, the private sector and
civil society. (UN Conference, 2001)
4.1. Literature on Classification of Governance Institutions
Various authors have aggregated certain indices to better capture the common features of the
governance institutions under main clusters that are reflecting different aspects of governance
institutions.
How to measure good governance, as well as which indicators to select, is based on analytical
frameworks that are normative in character since the same indicator may elicit different
interpretations depending on which value judgments are utilized and different sets of indicators
may be used to measure governance, depending on the nature of the ends in question. (CDP,
2004, p.10)
4.1.1. Kaufmann, Kraay and Mastruzzi (2003)
In order to measure different aspects of governance, they categorized governance institutions
in 6 broad groups based on 194 variables drawn from 17 different sources. They defined
governance as the traditions and institutions by which authority in a country is exercised. The
28
ability of the government to formulate and implement sound policies is summarized in
“Government Effectiveness” and “Regulatory Quality” indices . The respect of citizens and the
state for the institutions which govern their interactions is categorized as “Rule of Law” and
“Control of Corruption”. "Political Stability and Absence of Violence" measure perceptions of
likelihood that the government in power will not be destabilized and indicate the continuity of
policies. “Voice and Accountability” captures the process by which citizens of a country are able
to participate in the selection of their government.
4.1.2. World Bank (2003)
For the MENA region, the World Bank (2003) used principal component analysis (PCA)
which is performed on 22 indicators of governance to derive three broad indexes as “Index of
Public Accountability (IPA), which aggregates 12 indicators”, “Index of Quality of
Administration (IQA), which aggregates 10 indicators” and “Index of Governance Quality (IGQ),
which aggregates all 22 indicators.
4.1.3. Aysan, Nabli and Varoudakis (2006)
For the MENA region, they categorized the governance variables which are likely to affect
individual investors’ decision into 3 broad clusters: “Quality of Administration” (QA) which
aggregates 4 indicators, “Public Accountability” which aggregates 2 indicators (PA), and
“Political Stability” (PS) which aggregates 4 indicators.
The Committee also reviewed several approaches to the measurement of good governance at
the national level where the goals of social equality and poverty reduction had been explicitly
included in the construction of questionnaires and self-assessment methodologies. Three projects
for the measurement of good governance models for LDCs are offered: (CDP, 2004, p.11)
4.1.4. Economic Commission for Africa (ECA) Project
In order to monitor the progress towards good governance in a sample of 28 countries in the 5
sub-regions of Africa, 6 components of good governance that yield data on 83 indicators have
been identified as: political system that encourages input from all groups of civil society;
impartial and credible electoral administration, and an informed and active citizenry;
strengthened public sector legislative and administrative institutions; transparency, predictability,
29
and accountability in decisions by government and public bodies; effective public sector
management with stable macroeconomic conditions, effective resource mobilization, and
efficient use of public resources; and adherence to the rule of law in a manner that protects
personal and civil liberties and gender equity, and ensures public safety and security with equal
access to justice for all. (CDP, 2004, p.11)
4.1.5. Asian Development Bank/Viet Nam
The Poverty Task Force of the Asian Development Bank has produced a proposal for the
implementation of the Comprehensive Poverty Reduction and Growth Strategy of the
Government of Viet Nam. Five areas of governance have been identified for improvement as:
more efficient public service; more transparent public financial management; wider access to
justice and ensuring its universal application; more participative and responsive government; and
a government that fights corruption at all levels. Eight outcome and process indicators have been
developed to assess progress in the five areas, namely: level of information publicly available
regarding services, policies and planning arrangements at all levels; extent of access of the poor
to such basic government services as health, education, infrastructure, water and power at the
local level; level of budget transparency regarding provincial and local taxation, budgeting and
spending patterns in each sector; extent to which, at the national level, the level of expenditure
that is targeted to pro-poor purposes is predictable from year to year; extent to which the
decisions and verdicts of courts and tribunals are publicly available; extent to which local
government is responsive and follows up on service delivery problems that are brought to its
attention by the poor; extent to which the Grass-roots Democracy Decree has been implemented
in each commune so as to improve opportunities for public participation; and extent to which
laws combating corruption are effective. (CDP, 2004, p.12)
4.1.6. African Peer Review Mechanism (APRM)
It is a self monitoring mechanism, intended to foster the adoption of policies, standards and
practices that will lead to political stability, sustainable development and regional and continental
integration through sharing of experiences and of successful best practices, including identifying
deficiencies and assessing the need for capacity building, voluntarily acceded to by the member
States of the African Union (AU). The APRM focuses on four main areas with specific
30
objectives, standards and codes, criteria and indicators in terms of which the programmes and
policies of the participating countries will be assessed as: political governance; economic
governance; corporate governance; and socio-economic development. They use different
indicators to reflect different dimensions of governance with a great deal of variation in the
specification of measures for cross-national comparisons and rankings and also for tracking the
development record of a country over time. (CDP, 2004, p.13)
4.2. Classification of Governance Institutions in the Study
The main categorization of governance clusters developed by Aysan, Nabli and Varoudakis
(2006) are used in the study by adding two more governance indicators to “Political Stability”
and changing the name of “Public Accountability” as “Democratic Accountability Public Voice
Index” by adding one more governance indicators to this cluster.
Three aggregate governance clusters are composed as Aysan et al. (2006)’s governance
categorizations considering;
Although these indices are subjective and outcome-based rather than representing the quality
of actual institutions, deficiencies in these governance perceptions depending on experts’ views
and surveys do not constitute a severe problem in analyzing the effects of governance on growth
since especially the private investors and donor countries or WTO takes these kinds of
governance data into consideration for investment or aid decisions for these countries at the time
of investment or aid. Thus like a self-fulfilling prophecy, the true governance perceptions is
realized according to these possibly subjective deficient governance perceptions.
4.2.1. Administrative Quality Index (AQI)
AQI assesses the capability of the public administration to formulate and implement sound
policies and the respect for the institutions governing interactions between citizens and
government. (World Bank, 2003, p. xix)
“The process by which governments are selected, monitored and replaced”, “the
capacity of the government to effectively formulate and implement sound policies”,
and the respect of citizens and the state for the institutions that govern economic and
social interactions among them”. (Kaufman and Kraay, 2002, p.5)
31
AQI consists of four indicators from ICRG Database (2010) named as “Corruption”,
“Bureaucracy Quality”, “Investment Profile” and “Law and Order”.
4.2.1.1. Corruption
Corruption has negative effects on economic growth by rising risks in business environment,
leading popular discontent, leading to unrealistic and inefficient controls on the economy and
encouraging the development of black market. (World Bank, 2003, p.183) This index is in the
form of “control over corruption” meaning that high scores corresponding less corruption
perceptions. Thus it is expected that good performance in control over corruption leads to growth
by tackling problems above.
4.2.1.2. Bureaucracy Quality
It assesses the degree of strength and expertise the bureaucrats have and the ability of them to
manage public services. Good performance on this index suggests that autonomous bureaucracies
established which are free from political pressures and an established mechanism for recruitment
and training. (World Bank, 2003, p.184)
4.2.1.3. Investment Profile
It assesses the attitude of the government to inward investment by considering contract
viability, taxation, labor costs, profit repatriation and risk to operations including start-up and
operating costs. (Aysan, 2006) Good performance in this index as tackling the problems of
overregulation and over-taxation which deter investments enhances growth. (World Bank, 2003,
p.184)
4.2.1.4. Law and Order
It assesses both the strength and impartiality of the legal system and popular observance of
the law. (Aysan, 2006) Good performance for this index suggests that the institutions ensure
equitable and consistent rule of law protecting private property.

32
4.2.2. Political Stability Index (PSI)
PSI consists of five indicators from ICRG Database (2010) as “Government Stability”,
“Internal Conflict”, “External Conflict”, “Ethnic Tensions” and “Religious Tensions”.
4.2.2.1. Government Stability
It assesses the ability of government to carry out its declared program(s) and to stay in office
by considering the type of governance, the unity of the government, approach of an election, and
command of the legislature and popular approval of government policies. (Aysan, 2006 and
ICRG Variables, 2012)
4.2.2.2. Internal Conflict
It assesses the political violence in the country and its actual or potential impact on
governance by considering civil war, civil disorder and terrorism within borders. Highest
performance suggests that both of no armed opposition to government and no arbitrary violence
to the citizens by the government. (Aysan, 2006 and ICRG Variables, 2012)
4.2.2.3. External Conflict
It assesses both the risk to the incumbent government and to inward investment, ranging from
trade restrictions and embargoes through geopolitical disputes, armed threats and warfare, cross-
border conflicts and foreign-supported insurgency. (ICRG Variables, 2012)
4.2.2.4. Ethnic Tensions
It assesses the degree of tension attributable to racial, national, or language divisions. Lower
performance scores are given to countries where tensions are high because of intolerant and
uncompromising opposing groups. (ICRG Variables, 2012)
4.2.2.5. Religious Tensions
It assesses the degree of religious tensions arising from the domination or a desire of
domination of society by a single religious group to replace civil law by religious law and to
exclude other religions from the political or social processes by suppressing religious freedom or
expressions of religious identity. (ICRG Variables, 2012)

33
4.2.3. Democratic Accountability Public Voice Index (DAPVI)
DAPVI consists of two indicators from the International Country Risk Guide (ICRG, 2010) as
“Democratic Accountability” and “Military in Politics” and two indicators from Freedom House
(FRH) as “Political Rights” and “Civil Liberties”.
4.2.3.1. Democratic Accountability
It assesses the degree of free and fair elections and the responsiveness of government to
citizens.
4.2.3.2. Military in Politics
It assesses the degree of the military's involvement in politics stemming from an external or
internal threat, or be a full-scale military takeover. (ICRG Variables, 2012)
4.2.3.3. Political Rights
It assesses the degree of not only the free and fair elections of head of the state, government
and legislative representatives but also the fair electoral laws. It also questions whether the people
have the ability to organize in different political parties or groups of their choice that increse their
support or gain power through elections. (World Bank 2003, p.180)
4.2.3.4. Civil Liberties
It assesses the degree of freedom of press, assembly, demonstration, equality of citizens under
the law, nondiscriminatory judiciary, protection from unjustified imprisonment, exile or torture,
free businesses or cooperatives, personal social freedom including gender equality, property
rights, freedom of movement and the equality of opportunity for the citizens.
Contrary to the ratings of ICRG (2010), the ratings of Freedom House for “Political Rights”
and Civil Liberties” are originally decreases as performance of the corresponding country
increases. Thus, these ratings of FRH were revised in a way that higher ratings correspond to
higher performances.

34
4.2.4. Governance Quality Index (GOVI)
This overall governance index summarizes all three aspects of governance. Instead PCA, the
averages of three aggregate governance indices of AQI, PSI and DAPVI are taken since all the
possible correlations among single governance indices are consumed by creating these three
aggregate governance clusters.

35
CHAPTER 5: GOVERNANCE IN LDCs
CDP (2008) states that the underlying principle of identifying LDCs as “low-income
countries that face structural handicaps to growth” has essentially remained, although the
indicators composing the criteria are evolved over time as a “measurement of long-term structural
weaknesses”.
Governance is one of the ignored structural handicaps that the study attempts to contribute to.
Even though governance has never been considered as an indicator for the identifying criteria of
LDCs, the importance of good governance institutions have always been considered especially
for poverty reduction. The CDP considers in 2003 triennial review that good governance could be
instrumental for achieving the goals of poverty reduction only if the process of measurement and
assessment is not biased in favor of external criteria relevant to the donors, investors and
international monitoring bodies, as opposed to the internal perspective of the country. In
designing institutions and mechanisms for good governance in LDCs, an interactive process
between donors and recipient countries is essential. Although recipient countries need assistance
from donors to bring their institutions and social, political and economic processes closer to those
required by good governance, measures imposed by donors consider the cultural and historical
characteristics of recipient countries to be succeed. LCDs should be invited to participate in the
deliberations of institutions where global norms and standards for aspects of good governance are
established. (CDP, 2004, p.iii)
For LDCs, good governance is a necessary condition for expanding their ability to generate
income and reduce poverty in the future. Good governance enhances economic efficiency and
reduces transaction costs through the effective application of the rule of law, transparency in
government and corporate management, and accountability for every institution and individual in
society. To the extent that good governance catalyses civil society to increase the rate of physical
and human capital accumulation, it can also help to reduce dependency and vulnerability of
LDCs, and even ameliorate the impact of economic vulnerability they face. LDCs should
continue to participate in the discourse on good governance and should develop expertise and
capacity in this area. Improving governance should be part of their national policy agenda and
should be implemented in ways that are relevant to their particular conditions. International

36
institutions that establish global norms and standards for aspects of good governance should
involve LDCs in their deliberations. Moreover, such bodies should themselves be subject to good
governance principles. (CDP, 2004, p.13)
Weaknesses in governance, such as lack of transparency and accountability in the public
sector and occurrences of corruption, reduce the ability of LDCs to participate in the global
marketplace through trade, attract foreign direct investment (FDI) and obtain external assistance
as well. LDCs should strive for governance systems that are characterized by participation in and
transparency of decision-making processes and that embody pro-poor policies, social safety nets,
policies for the sustainable use of resources and effective monitoring. (CDP, 2004, p.6)
Despite efforts by LDCs, their governance goals have not yet been achieved. These efforts
need to be pursued, with the support of the international community as an essential factor. In
LDCs, many institutions and processes are inadequately developed, reflecting low overall levels
of socio-economic development. It should be recognized that promoting good governance in
these countries needs to be approached with a long-term view. (UN Conference, 2001)
Governance issues at the international level and international economic decision making
processes that affect the development of LDCs, including issues of their effective participation,
should be addressed. Multilateral policy and regulatory issues that affect the development efforts
of LDCs should also be addressed. The circumstances and interests of LDCs should be taken
fully into account in multilateral institutions and processes. Adequate attention must be paid to
checking unfair business practices and corruption by multinational companies, domestic firms
and any other business entities. (UN Conference, 2001)
Committee advised that an interactive process between donors and recipient countries is
essential while designing institutions and mechanisms for good governance in developing
countries. “The importance of the assistance that are needed by recipient countries from donors to
bring their institutions and social, political and economic processes closer to those required by
good governance”, “weaknesses in governance, such as lack of transparency and accountability
in the public sector and occurrences of corruption, reduce the ability of LDCs to participate in the
global marketplace through trade, attract FDI and, increasingly, obtain external assistance as
well” and “bad policies and bad governance in recipient countries were considered largely

37
responsible for the aid being ineffective in achieving its objectives” were emphasized in 2004
triennial review. The Committee proposed that LDCs be invited to participate in the deliberations
of institutions where global norms and standards for aspects of good governance are established.
CDP (2004) states that good governance has become a condition for development assistance from
donor agencies in the third PoA for the LDCs (2001-2010)
But the main significance of governance institutions in LDCs, or the role of deficient
governance institutions causing to less developed status of LDCs by other words, has never been
emphasized neither by the CDP nor the involving parties at the triennial reviews that are
organized by CDP in every three years since 1971. This point; “the role of governance
institutions on growth in LDCs” measured by the author’s own governance indicators will be
another contribution of this thesis to the literature. By classifying aggregate governance indices
each reflecting distinct sphere of governance, we are able to discuss what types of governance
institutions bear the utmost importance for growth in LDCs.
Since the early 1990s, the notion of good governance, as being necessary for sustainable
development and poverty reduction has gained widespread currency, especially among
international organizations. Market-based structural adjustment policies had failed to rekindle
economic growth in many countries, and concern that aid was often ineffective in achieving its
objectives. Bad policies and bad governance in recipient countries were considered largely
responsible for these failures. Hence, good governance has become a condition for development
assistance from donor agencies.
Throughout this chapter, all the aggregate governance indices are calculated by Principal
Component Analysis (PCA) instead of natural logarithm of simple averages in order to depict the
huge difference in governance performance between LDCs and High Income OECD Countries.

38
5.1. Comparison of Governance and Growth in LDCs and High Income
OECD Countries
As it can be seen from the Table 2 for individual countries or Figure 1 for country groupings,
the LDCs can be characterized by a clear deficit in “good” governance institutions. (See Chapter
3 for the categorization of governance clusters and their sub indices) “Economies that are
different for a variety of differences will differ both in their institutions and in their per capita
income” (Acemoglu et al., 2001, p.1369) as in the case of High Income OECD countries and
LDCs in Figure 1.
We can analyze Figure 1 as relationships between governance quality and per capita incomes
or governance quality and growth in the very long run, “since initial per capita incomes in the
distant path were not very different across countries, the current dispersion in per capita incomes
on the vertical axis reflects differences across countries in growth in the very long run”.
(Kaufman and Kraay, 2002, p.1) The positive correlations between our aggregate governance
indicators and GDP per capita suggest that better governance leads to higher income per capita
thus growth. The separate block dispersion of corresponding High Income OECD and LDC
scores in Figure 1 also illustrates the hypothesis that “Rich countries can afford better
institutions” (Acemoglu et al., 2001, p.1369) with exception of Israel, which has a low score of
political stability index because of external conflict, ethnic and religious tensions. Since Israel
established its state after WWII, it does not have long-lived or established institutions as other
developed countries. Thus it has inadequate governance quality and can be considered as an
outlier in the group of high income OECD countries. Figure 1 also shows that the relationship
between natural logarithm of GDP per capita and aggregate governance indicator is more
divergent in LDCs.

39
y = 0.6858x - 5.8867 R² = 0.8577
-3
-2.5
-2
-1.5
-1
-0.5
0
0.5
1
1.5
2
0 5 10 15 AQ
I
ln (GDP per capita, PPP, 2005 $)
Averages of Administrative Quality
Index and GDP per capita (1985-2010)
HIGH
INCOME OECD
LDC
SUD
HAI CON
ANG
GAM
LIB
y = 0.3644x - 3.1276 R² = 0.5498
-3
-2.5
-2
-1.5
-1
-0.5
0
0.5
1
1.5
0 3 6 9 12 PSI
ln (GDP per capita, PPP, 2005 $)
Averages of Political Stability Index and
GDP per capita (1985-2010)
ISR
SUD
TAN CON
LIB
MOZ GAM
ANG LDC
HIGH
INCOME OECD
y = 0.8864x - 7.6087 R² = 0.8204
-4
-3
-2
-1
0
1
2
3
0 3 6 9 12
DA
PV
I
ln (GDP per capita, PPP, 2005 $)
Averages of Democratic Accountability
Political Voice Index and GDP per capita
(1985-2010)
HIGH
INCOME OECD
ANG
MYA
SUD TAN CON
ZAM ISR
LDC
Figure 6: Averages of Income and Governance of LDCs and High Income OECD Countries
Source: Author’s Own Calculations based on World Bank, World Development Indicators
(2012) and ICRG Data (2010).
Even though LDCs are no longer colonized countries, they still have both lower per capita
income and inadequate GDP per capita growth rates compared with the developed countries, as it
can be seen in last two columns of Table 2. Even the corresponding growth rates between 1991
and 2009 seem to be high for some of the LDCs, their GDP per capita are very low. So it will be
y = 0.6455x - 5.541 R² = 0.831
-3
-2.5
-2
-1.5
-1
-0.5
0
0.5
1
1.5
2
0 5 10 15 GO
VI
ln (GDP per capita, PPP, 2005 $)
Averages of Aggregate Governance
Index and GDP per capita (1985-2010)
ISR
SUD
HIGH
INCOME OECD
LDC
TAN CON
ANG

40
misleading to conclude that some of the LDCs have high growth rates. Altough Angola which
has a current GDP per capita of 5390 (current USD), it is approximately thirty two percent of that
of Poland, which has the lowest GDP per capita among high income OECD countries (as of
2009). The situation is more severe for other LDCs which has GDP per capita between 298 and
2267 (current USD).
Since the PoA for the LDCs (2001-2010) by the UN stated that recipient LDCs need
assistance from donors to bring their institutions and social, political and economic processes
closer to those required by good governance and also the donor countries and the other countries
that extend financial aid to LDCs are mostly OECD countries, the quality of governance
institutions of LDCs were compared with the quality of governance institutions of High Income
OECD countries according to the aggregate governance indices which are calculated by PCA as
mentioned above.
5.2. The Evolution of Governance in LDCs
The following four descriptive statistics are evaluated for twenty four LDCs and for twenty
seven High Income OECD countries:
• The evolution of the standard deviation of each aggregate governance indicator,
• The average index values of each aggregate governance indicator of LDCs compared with
High Income OECD countries,
• For the diverging aggregate governance indicators, the evolution of LDCs which are
above or below one standard deviation of the average governance indicators.
5.2.1. Administrative Quality Index (AQI)
The decreasing trend in the standard deviation of AQI indicates the convergence of LDCs
with respect to this indicator. The increasing trend in the average value together with the
convergence shows that LDCs have generally improved with respect to this indicator. (See Figure
7)
Compared with the High Income OECD countries, LDCs have poor performance in
administrative quality index because of inadequate control over corruption leading to unrealistic
and inefficient controls on the economy and encouraging the development of black market, low

41
0
0.1
0.2
0.3
0.4
0.5
0.6
0.7
0.8
0.9
19
91
19
92
19
93
19
94
19
95
19
96
19
97
19
98
19
99
20
00
20
01
20
02
20
03
20
04
20
05
20
06
20
07
20
08
20
09
20
10
Standart Deviation of AQI
AQI
-2
-1.5
-1
-0.5
0
0.5
1
1.5
2
19
91
19
92
19
93
19
94
19
95
19
96
19
97
19
98
19
99
20
00
20
01
20
02
20
03
20
04
20
05
20
06
20
07
20
08
20
09
20
10
Averages of AQI
HIGH INCOME OECD LDC
bureaucracy quality indicating deficient public services, high political pressures on bureaucrats
and inefficient mechanism for recruitment and training (World Bank, 2003, p.184), low
investment profile indicating to high risks for business environment in the form of lack of
contract viability, overregulation and over-taxation and poor performance on law and order
indicates the weak, partial, unequal, inconsistent legal system and also the common disobedience
to the law which protecting private property. (Aysan et al., 2006)
Figure 7: Evolution of AQI in LDCs
Source: Author’s Own Calculations based on ICRG Data (2010).
5.2.2. Political Stability Index (PSI)
The decreasing trend in the standard deviation of PSI indicates the convergence of LDCs with
respect to this indicator. The increasing trend in the average value together with the convergence
shows that LDCs were generally improved with respect to this indicator. (See Figure 8)
Compared with the High Income OECD countries, although the performance of LDCs seem
to have improved, they are still behind the High Income OECD countries in political stability
index because of the inability of governments in LDCs to carry out their declared program(s),
popular disapproval of government policies, trade restrictions and embargoes, political violence
arising from civil war, civil disorder, terrorism, warfare, ethnic and religious tensions. (Aysan et
al., 2006 and ICRG Variables, 2012)

42
-2.5
-2
-1.5
-1
-0.5
0
0.5
1
1.5
19
91
19
92
19
93
19
94
19
95
19
96
19
97
19
98
19
99
20
00
20
01
20
02
20
03
20
04
20
05
20
06
20
07
20
08
20
09
20
10
Averages of PSI
HIGH INCOME OECD LDC
0
0.2
0.4
0.6
0.8
1
1.2
19
91
19
92
19
93
19
94
19
95
19
96
19
97
19
98
19
99
20
00
20
01
20
02
20
03
20
04
20
05
20
06
20
07
20
08
20
09
20
10
Standart Deviation of PSI
PSI
Figure 8: Evolution of PSI in LDCs
Source: Author’s Own Calculations based on ICRG Data (2010).
5.2.3. Democratic Accountability Political Voice Index (DAPVI)
The non-decreasing trend in the standard deviation of DAPVI indicates the divergence of
LDCs with respect to this indicator. The increasing trend in the average value together with the
divergence shows that while some LDCs have improved, some of the others have worsened with
respect to this indicator. The main problem is to identify the countries that improved or
worsened. (See Figure 9)
While the performance of Mali and Zambia improved one standard deviation of the mean,
Congo Democratic Republic, Myanmar, Sudan and Tanzania are deteriorated one standard
deviation of the mean with respect to this index, especially after 1992.
Compared with the High Income OECD countries, LDCs, especially those four LDCs
mentioned above, have poor performance in this index because of unfair elections and electoral
laws, irresponsiveness of governments to their citizens, coups and dicta regimes, inability of
people to organize in different political parties or groups, partial press, inequality of citizens
under the law, unjustified imprisonments, gender inequality, less freedom of movement and
inequality of opportunity for the citizens. (ICRG Variables, 2012)

43
-2.5
-2
-1.5
-1
-0.5
0
0.5
1
1.5
2
19
91
19
92
19
93
19
94
19
95
19
96
19
97
19
98
19
99
20
00
20
01
20
02
20
03
20
04
20
05
20
06
20
07
20
08
20
09
20
10
Averages of DAPVI
HIGH INCOME OECD LDC
0
0.2
0.4
0.6
0.8
1
1.2
1.4
19
91
19
92
19
93
19
94
19
95
19
96
19
97
19
98
19
99
20
00
20
01
20
02
20
03
20
04
20
05
20
06
20
07
20
08
20
09
20
10
Standart Deviation of DAPVI
DAPVI
-4
-3.5
-3
-2.5
-2
-1.5
-1
-0.5
0
0.5
1
19
91
19
92
19
93
19
94
19
95
19
96
19
97
19
98
19
99
20
00
20
01
20
02
20
03
20
04
20
05
20
06
20
07
20
08
20
09
20
10
LDCs Improved or Worsened w.r.t. DAPVI
Zambia
Mali
Congo,DR
Tanzania
Sudan
Myanmar
Figure 9: Evolution of DAPVI in LDCs
Source: Author’s Own Calculations based on ICRG Data (2010) and FRH Database (2012).
5.2.4. Aggregate Governance Index (GOVI)
The decreasing trend in the standard deviation of GOVI indicates the convergence of LDCs
with respect to this indicator. The increasing trend in the average value together with the
convergence shows that the governance quality in LDCs generally improved. (See Figure 10)
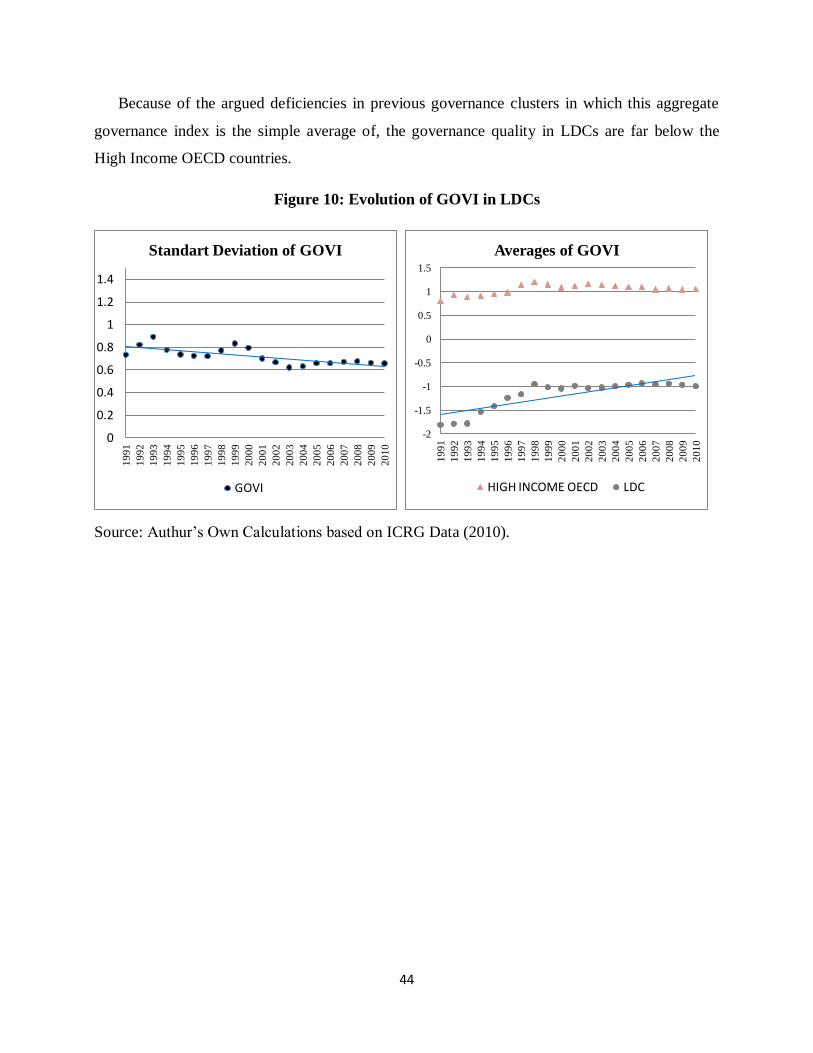
44
-2
-1.5
-1
-0.5
0
0.5
1
1.5
19
91
19
92
19
93
19
94
19
95
19
96
19
97
19
98
19
99
20
00
20
01
20
02
20
03
20
04
20
05
20
06
20
07
20
08
20
09
20
10
Averages of GOVI
HIGH INCOME OECD LDC
0
0.2
0.4
0.6
0.8
1
1.2
1.4
19
91
19
92
19
93
19
94
19
95
19
96
19
97
19
98
19
99
20
00
20
01
20
02
20
03
20
04
20
05
20
06
20
07
20
08
20
09
20
10
Standart Deviation of GOVI
GOVI
Because of the argued deficiencies in previous governance clusters in which this aggregate
governance index is the simple average of, the governance quality in LDCs are far below the
High Income OECD countries.
Figure 10: Evolution of GOVI in LDCs
Source: Authur’s Own Calculations based on ICRG Data (2010).

45
CHAPTER 6: EMPIRICAL ANALYSIS
6.1. Methodology: Arellano-Bond (1991) Difference GMM
According to Roodman (2006), the difference GMM estimators are designed for panel
analysis that embodies the following assumptions about the data-generating process as:
The process may be dynamic, with current realizations of the dependent variable are
influenced by the past ones.
There may be arbitrarily distributed fixed individual effects in the dynamic model, so that the
dependent variable consistently changes faster for some observational units than others. This
argues against cross-section regressions, which must essentially assume fixed effects away, and
in favor of a panel set-up, where variation over time can be used to identify parameters.
• The idiosyncratic disturbances, those apart from the fixed effects, may have individual-
specific patterns of heteroscedasticity and serial correlation.
• The idiosyncratic disturbances are uncorrelated across individuals.
• Some regressors may be predetermined but not strictly exogenous; even if independent of
current disturbances, are still influenced by past ones. The lagged dependent variable is an
example.
• Some regressors may be endogenous.
• Finally, since the estimators are designed for general use, they do not assume that good
instruments are available outside the immediate data set. In effect, it is assumed that the
only available instruments are “internal”—based on lags of the instrumented variables.
The general model studied is as followed in the matrix form ;
yit = αyi,t-1 + x’it β + εit
εit = µi + νit
E [µi] = E [νit] = E [µiνit] = 0
i indicates the country and t represents the time of the variable.
i = 1,2,.....,24 (Number of LDCs)

46
t = 1,2,.....,20 (Years from 1991 to 2010)
The disturbance term (εit) has two orthogonal components as the fixed effects (µi) and the
idiosyncratic shocks (νit).
The application of OLS to this empirical model gives rise to “dynamic panel bias” since yi,t-1
is endogenous to the fixed effects (µi) in the error term (εit). The positive correlation between a
regressor and the error violates a necessary assumption for the consistency of OLS. In order to
work around this endogeneity, difference GMM transforms the data to remove the fixed effects.
(Roodman, 2006)
Applying the “first difference transformation” thus “difference GMM”;
∆yit = α∆yi,t-1 + ∆x’it β + ∆νit
Though the fixed effects are gone, the lagged dependent variable is still endogenous, since the
yi,t-1 term in ∆yit = yi,t-1 - yi,t-2 correlates with the νit-1 in ∆νit = νit - νit-1. Likewise, any
predetermined variables in x that are not strictly exogenous become potentially endogenous
because they too may be related to νit-1. But deeper lags of the regressors remain orthogonal to the
error, and available to be used as instruments. (Roodman, 2006)
Since the balanced panel is used in the study, the first-difference transformation does not have
a weakness arising from the missing values of ∆yit and ∆yit-1 in the case of missing values of yit.
The deeper lags of the lagged dependent variable become uncorrelated with the transformed
error term and remain as instruments for the transformed lagged dependent variable. First and
deeper than first lags of endogenous variables were used as instruments in the level equations.
The first differences of exogenous variables were used as instrumental variables in the first-
difference equations.

47
6.2. Data
The study uses yearly data for the natural logarithm of the variables of income per capita
(lngpc), lag of income per capita (lngpcL1), aggregate governance indices (lngovi, lnaqi, lnpsi
and lndapvi), human capital index (lnhumc), import penetration index (lnimpen), trade openness
index (lntrop) and net official development assistance and official aid received (lnaa). Twenty-
four of LDCs are included in the analysis because of data limitations. (See Appendix 4 for the list
of the LDCs included in the analysis). The data is a balanced panel and it covers the 1991-2010
period. In order to construct a balanced panel, linear interpolation and extrapolation techniques
are applied for unavailable 1466 data points which make less than % 13 of all 11976 data points.
The dependent variable is the natural logarithm of GDP per capita (lngpc) which is used as a
proxy for both the income performance of the LDCs in the corresponding year and also the
economic growth in the very long-run since in the distant past, there is no significant difference
in the income level of countries as explained in the Introduction section.
The lag of the dependent variable (lngpcL1) is also used as an independent variable to decide
whether there is convergence or divergence in the income level of LDCs in the short-run or in the
growth in the very long-run.
Administrative Quality Index (lnaqi) is the natural logarithm of the simple average of four
indicators from ICRG Database (2010) named as “Corruption”, “Bureaucracy Quality”,
“Investment Profile” and “Law and Order”.
Political Stability Index (lnpsi) is the natural logarithm of the simple average of five
indicators from ICRG Database (2010) named as “Government Stability”, “Internal Conflict”,
“External Conflict”, “Ethnic Tensions” and “Religious Tensions”.
Democratic Accountability Political Voice Index (lndapvi) is the natural logarithm of the
simple average of four indicators; two from the International Country Risk Guide (ICRG, 2010)
as “Democratic Accountability” and “Military in Politics” and two from Freedom House (FRH)
as “Political Rights” and “Civil Liberties”.
The scores of each index both from ICRG and FRH is converted to 0-100 scale before taking
natural logarithm in which higher values reflects better governance quality.
48
Governance Quality Index (lngovi) summarizes all three aspects of governance. It is the
natural logarithm of simple average of three aggregate governance indices.
Human Capital Index (lnhumc) is the natural logarithm of the average of two sub-indices.
Education sub-index is the simple average of “adult literacy rate”, ”gross primary enrollment
rate”, ”gross secondary enrollment rate” and ”gross tertiary enrollment rate”. Health sub-index is
the simple average of “life-expectancy at birth”, 100-(“mortality rate under 5 years old”/10) and
100-“prevalence of undernourishment”. Mortality rate and prevalence of undernourishment are
revised in the previous formula representing that a higher percentage reflects better performance.
Import penetration Index (lnimpen) is the natural logarithm of the ratio of imports to total
demand (GDP – Exports + Imports).
Trade Openness Index (lntrop) is natural logarithm of the share of total exports and imports
of good and services in GDP.
lnaa is the natural logarithm of the “net official development assistance and official aid
received”.
For the sources of the variables, see Table 3 and for the statistical properties of the variables,
see Table 6.
Table 4 reports the results of LLC and IPS first generation panel unit root tests for the first
differences of all variables since difference GMM uses first-difference transformation. According
to the LLC test, none of the variables have unit root. Thus according to LLC test, it can be
concluded that all of the variables are stationary. According to IPS test, all variables except
lnhumcD1 are stationary. But lnhumcD1 is stationary at % 10 significance level for the case of
constant. Thus, all the variables could be considered as stationary according to IPS test.
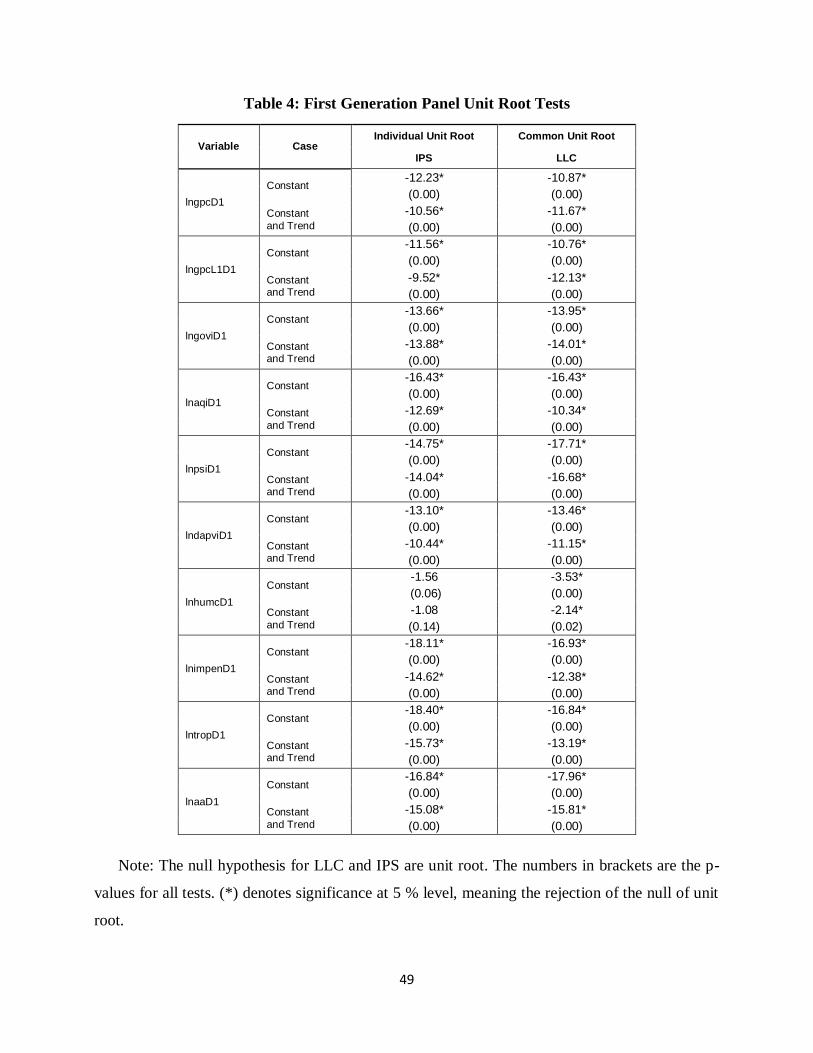
49
Table 4: First Generation Panel Unit Root Tests
Variable Case Individual Unit Root Common Unit Root
IPS LLC
lngpcD1
Constant -12.23* -10.87*
(0.00) (0.00)
Constant
and Trend
-10.56* -11.67*
(0.00) (0.00)
lngpcL1D1
Constant -11.56* -10.76*
(0.00) (0.00)
Constant and Trend
-9.52* -12.13*
(0.00) (0.00)
lngoviD1
Constant -13.66* -13.95*
(0.00) (0.00)
Constant and Trend
-13.88* -14.01*
(0.00) (0.00)
lnaqiD1
Constant -16.43* -16.43*
(0.00) (0.00)
Constant
and Trend
-12.69* -10.34*
(0.00) (0.00)
lnpsiD1
Constant -14.75* -17.71*
(0.00) (0.00)
Constant and Trend
-14.04* -16.68*
(0.00) (0.00)
lndapviD1
Constant -13.10* -13.46*
(0.00) (0.00)
Constant and Trend
-10.44* -11.15*
(0.00) (0.00)
lnhumcD1
Constant -1.56 -3.53*
(0.06) (0.00)
Constant
and Trend
-1.08 -2.14*
(0.14) (0.02)
lnimpenD1
Constant -18.11* -16.93*
(0.00) (0.00)
Constant and Trend
-14.62* -12.38*
(0.00) (0.00)
lntropD1
Constant -18.40* -16.84*
(0.00) (0.00)
Constant and Trend
-15.73* -13.19*
(0.00) (0.00)
lnaaD1
Constant -16.84* -17.96*
(0.00) (0.00)
Constant
and Trend
-15.08* -15.81*
(0.00) (0.00)
Note: The null hypothesis for LLC and IPS are unit root. The numbers in brackets are the p-
values for all tests. (*) denotes significance at 5 % level, meaning the rejection of the null of unit
root.

50
Table 5 reports the results of the second generation panel unit root tests. According to the
Moon and Perron test, none of the variables have unit root, hence all are stationary. According to
the Pesaran test, all the variables except lnhumcD1 are stationary. lnhumcD1 is stationary at % 10
significance level for the case of constant when p takes the value of one. So it would not be a
mistake to consider all of the variables stationary.

51
Table 5: Second Generation Panel Unit Root Tests
Variable Case Moon and Perron Test Statistics Pesaran CIPS Test Statistics
k=1 k=4 k=6 p=1 p=2
lngpcD1
Constant ta* -25.98* -28.37* -26.56*
-2.90* -2.71* tb* -7.29* -13.10* -11.84*
Constant and Trend
ta* -15.61* -14.29* -11.84* -3.62* -3.38*
tb* -17.27* -13.66* -10.19*
lngpcL1D1
Constant ta* -47.70* -54.30* -49.72*
-3.16* -3.10* tb* -14.99* -16.14* -14.76*
Constant and Trend
ta* -19.61* -24.05* -20.81* -3.24* -3.26*
tb* -17.88* -23.23* -18.78*
lngoviD1
Constant ta* -37.99* -47.55* -43.22*
-3.48* -3.28* tb* -16.15* -19.20* -16.08*
Constant
and Trend
ta* -20.76* -22.93* -26.05* -3.49* -3.87*
tb* -18.48* -21.41* -25.21*
lnaqiD1
Constant ta* -35.65* -52.83* -53.77*
-3.91* -3.35* tb* -14.66* -23.94* -25.11*
Constant
and Trend
ta* -22.51* -25.48* -25.85* -3.74* -3.29*
tb* -23.84* -24.70* -26.95*
lnpsiD1
Constant ta* -52.11* -52.59* -63.62*
-3.85* -3.60* tb* -24.25* -22.91* -25.26*
Constant and Trend
ta* -32.60* -35.82* -31.86* -3.98* -3.77*
tb* -31.17* -39.12* -32.80*
lndapviD1
Constant ta* -37.26* -47.11* -49.90*
-3.01* -2.74* tb* -13.31* -18.20* -15.71*
Constant and Trend
ta* -16.32* -24.01* -22.85* -3.14* -2.92*
tb* -14.32* -25.38* -20.51*
lnhumcD1
Constant ta* -1.26 -1.37 -1.85*
-2.12 -2.04 tb* -1.56 -3.08* -3.04*
Constant and Trend
ta* -1.95* -4.98* -4.42* -1.91 -1.84
tb* -1.92* -5.50* -4.77*
lnimpenD1
Constant ta* -42.83* -54.08* -58.61*
-3.29* -3.22* tb* -12.42* -17.65* -19.69*
Constant and Trend
ta* -24.94* -35.76* -36.72* -3.45* -3.41*
tb* -19.82* -39.20* -38.94*
lntropD1
Constant ta* -42.60* -61.17* -57.55*
-3.23* -3.21* tb* -11.50* -18.41* -20.51*
Constant and Trend
ta* -25.15* -32.82* -33.93* -3.37* -3.40*
tb* -20.12* -31.33* -36.03*
lnaaD1
Constant ta* -50.98* -57.27* -50.69*
-3.33* -3.28* tb* -16.02* -17.47* -16.10*
Constant
and Trend
ta* -21.84* -25.56* -23.13* -3.42* -3.45*
tb* -19.84* -24.75* -22.17*
Note: The null hypothesis for Pesaran is unit root. (*) denotes significance at 5 % level,
meaning the rejection of the null of unit root. For CIPS test, the critical value in the case of a
constant is -2.15 and in the case of a constant and trend is -2.67 at 5% significance level.

52
6.3. Empirical Models
Since the positive correlations between our aggregate governance indicators and GDP per
capita suggest that better governance leads to higher income per capita thus growth and the
separate block dispersion of corresponding scores of high income OECD countries and LDCs in
Figure 6 also illustrates the hypothesis that “Rich countries can afford better institutions”
(Acemoglu et al., 2001, p 1369) indicating the reverse causality problem, the aggregate
governance indicators are endogenous in the growth equation. Chong and Calderon (2000),
Acemoglu (2001), Przeworski (2004) and Dollar and Kraay (2002) found strong evidence of
causation running in both directions, from institutions to growth, and from growth to institutional
quality. (eg., Chong and Calderon, 2000, Acemoglu, 2001 and Przeworski, 2004 cited in
Avellaneda, 2009) By contrast, Kaufmann and Kraay (2002) found no evidence of a positive
effect of incomes on the quality of institutions, calling into question the often-heard argument
that only wealthy countries can afford good governance. Glaeser, Porta, Silanes and Shleifer
(2004) question the validity of these instruments and show that ‘the evidence that institutions
cause economic growth, as opposed to growth improving institutions, is non-existent. (eg.,
Kaufmann and Kraay, 2002 and Glaeser et al., 2004 cited in Avellaneda, 2009)
Two models are estimated in the study for four regressions of the aggregate governance
indicators. First model includes import penetration index and second model includes trade
openness index. Each of the four regressions, one aggregate governance index is used for the
panel regressions.
Model 1;
lngpcit = αlngpcit-1 + β1lngovit + β2lnhumcit + β3lnimpenit + β4lnaait + εit
lngov corresponds to lngovi, lnaqi, lnpsi, lndapvi in each of the four regressions.
Model 2;
lngpcit = αlngpcit-1 + β1lngovit + β2lnhumcit + β3lntropit + β4lnaait + εit
lngov corresponds to lngovi, lnaqi, lnpsi, lndapvi in each of the four regressions.
The lag of the dependent variable, lngpcL1, is included in the empirical models in order to
capture the convergence effect of the Solow growth model. Countries with lower GDP per capita

53
are presumed to gradually catch up with the more developed counterparts. Hence, a negative sign
on the coefficient of lag of GDP per capita is expected.
The relationship between the aggregate governance indices and growth is expected to be
positive since the main argument in the study is that the lack of quality in governance institutions
is the main structural impediment to growth in LDCs.
Human capital index is also endogenous since higher quality of human capital leads to higher
growth while higher per capita income indicates greater available resources that can be employed
to enhance the human capital. Hence a positive sign on the coefficient of the human capital
(lnhumc) is expected.
There is a strong consensus within the economics profession of a positive relationship
between trade openness and economic growth in the long-run. According to the Washington
Consensus, trade openness is expected to have significant positive role on growth since it argues
that the trade-openness promotes growth in LDCs. (Sarkar, 2007) Another argument is the
protection of infant industries in least developed countries. In this case protectionist trade policies
can boost domestic firms’ prices and profitability, facilitating their investment in capital and
technology. (Slaughter, 2004) If this is the case, then negative relationship is expected between
trade openness and growth.
High rank of import penetration in the sense that increased foreign competition followed by
significant trade liberalizations in LDCs lead to increase in the volume of international trade
resulting in a higher per capita income thus growth in LDCs, considering that the domestic
sectors in these countries are capable to compete with foreign goods and services.
According to the poverty trap argument in the literature, it is expected that the aid has a
significant positive role on growth in LDCs by transferring of resources from rich countries could
set LDCs, especially those with good policies and institutions, on the path to growth. (Rajan and
Subramanian, 2005)

54
6.4. Estimation Results
Two difference GMM techniques are employed in the panel regressions for both models as
“one step robust difference GMM” and “two step difference GMM”. In the second technique, the
error terms are not assumed independent and identically distributed (i.i.d.), but νit are. The
orthogonal deviation transformation is used considering the heteroscedasticity. (Roodman, 2006)
In the first technique, heteroscedasticity is controlled for robust analysis. The one-step and two-
step difference GMM estimators differ with respect to weighting matrix used in the estimation.
For one-step estimation, the code “robust” specifies that the robust estimator of the covariance
matrix of the parameter estimates be calculated. The resulting standard error estimates are
consistent in the presence of any pattern of heteroscedasticity and autocorrelation within panels.
In two-step estimation, the standard covariance matrix is already robust in the theory, but it
typically yields standard errors that are downward biased that may result to significant
coefficients which actually are not significant according to first technique. Windmeijer’s finite-
sample correction for the two-step covariance matrix has not been applied.
Table 6 and Table 7 presents the estimation results for the three governance indicators taken
separately (lnaqi, lnpsi and lndapvi) in columns 2 to 4 for first technique and in columns 6 to 8
for second technique, as well as for the aggregate governance index (lngovi) in column 1 for first
technique and in column 5 for second technique.
According to the estimation results for both models whether first or second technique is used,
the coefficient of lag of per capita income is significant and have positive value against the initial
prediction. Hence, it can be concluded that there is no convergence effect in LDCs with respect to
Solow Growth Model. That is also the explanation of the inability of these low income countries
to gradually catch-up with more developed countries.
Estimation results for both of the models confirms that the governance institutions matter for
economic growth in the difference equation or better governance quality leads to higher per
capita income in the level equation since all the coefficients of governance indicators except
lndapvi in one-step difference GMM for both models are significant at % 5 or % 10 and have
positive values and all the coefficients of governance indicators in two-step difference GMM for

55
both models are significant at % 1 or % 5 and have positive values. Thus, the increase in the
governance performance enhances growth in LDCs by increasing income per capita.
A higher rank of “administrative quality” in the sense of low level of corruption, better
quality of bureaucracy quality, a sound and safe investment profile lowering risks for business
environment and better law and order leads to growth in LDCs according to the estimation results
of both models. This result holds for “political stability” in the sense that more cohesive
government, low ethnic and religious tensions together with diminishing internal and external
conflicts decreasing the occurrence of political violence leading to devotion of resources to
favorable economic objectives resulting in growth in LDCs. Mauro (1995) and Alesina (1998)
found that the sub-indices of administrative quality index in this study; bureaucratic efficiency,
absence of corruption, protection of property rights, and the rule of law are important for growth.
The insignificant coefficient of “democratic accountability political voice index” in both
models when the first technique is applied confirms the argument of skeptical school in the sense
that there is no systematic relationship exists between democracy and economic growth. On the
contrary, the estimation results of both models when the second technique is applied confirms the
argument of compatibility school in the sense that democracy enhances economic growth,
because the existence of fundamental civil liberties and political rights generates the social
conditions most conducive to economic growth. These conflicting results may due to the fact that
there is a downward bias in the standard deviations of the coefficient in second technique leading
to assignment of significance while it is actually insignificant. But, it is also possible that the
insignificance of the coefficient may be the result of counteracting effects of sub indices
(democratic accountability, military in politics, political rights and civil liberties) composing the
aggregate index. In both case the results deny the argument of conflict school favoring that
democracy hinders economic growth, mainly in LDCs, by creating consumption pressures,
fuelling distributional conflicts and inhibiting capital accumulation. (eg., Feng, 2003 cited by
Avellaneda, 2009)
A high rank of overall governance quality index leads to growth in LDCs in both models
whether first or second techniques are used. Even the insignificant result found for democratic
accountability political voice index when first technique is applied do not suppress the
significance of other aggregate governance indices.
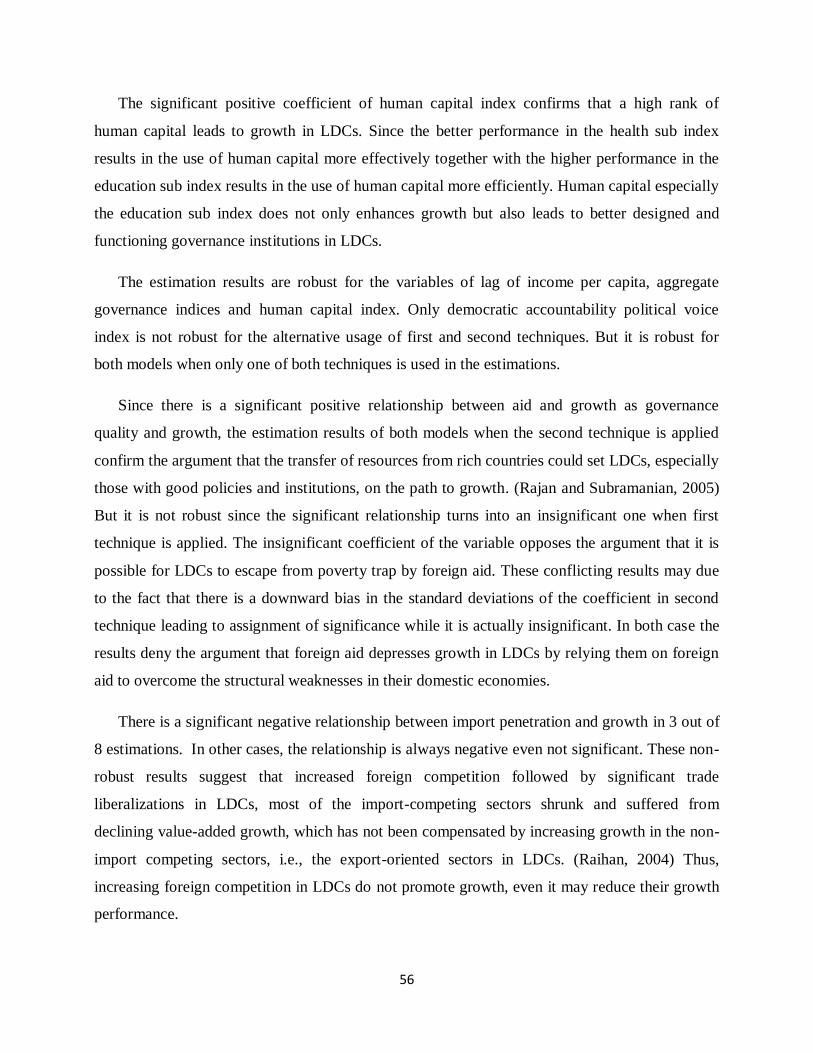
56
The significant positive coefficient of human capital index confirms that a high rank of
human capital leads to growth in LDCs. Since the better performance in the health sub index
results in the use of human capital more effectively together with the higher performance in the
education sub index results in the use of human capital more efficiently. Human capital especially
the education sub index does not only enhances growth but also leads to better designed and
functioning governance institutions in LDCs.
The estimation results are robust for the variables of lag of income per capita, aggregate
governance indices and human capital index. Only democratic accountability political voice
index is not robust for the alternative usage of first and second techniques. But it is robust for
both models when only one of both techniques is used in the estimations.
Since there is a significant positive relationship between aid and growth as governance
quality and growth, the estimation results of both models when the second technique is applied
confirm the argument that the transfer of resources from rich countries could set LDCs, especially
those with good policies and institutions, on the path to growth. (Rajan and Subramanian, 2005)
But it is not robust since the significant relationship turns into an insignificant one when first
technique is applied. The insignificant coefficient of the variable opposes the argument that it is
possible for LDCs to escape from poverty trap by foreign aid. These conflicting results may due
to the fact that there is a downward bias in the standard deviations of the coefficient in second
technique leading to assignment of significance while it is actually insignificant. In both case the
results deny the argument that foreign aid depresses growth in LDCs by relying them on foreign
aid to overcome the structural weaknesses in their domestic economies.
There is a significant negative relationship between import penetration and growth in 3 out of
8 estimations. In other cases, the relationship is always negative even not significant. These non-
robust results suggest that increased foreign competition followed by significant trade
liberalizations in LDCs, most of the import-competing sectors shrunk and suffered from
declining value-added growth, which has not been compensated by increasing growth in the non-
import competing sectors, i.e., the export-oriented sectors in LDCs. (Raihan, 2004) Thus,
increasing foreign competition in LDCs do not promote growth, even it may reduce their growth
performance.
57
Table 7: Estimation Results of Model 1 (All of the Variables are in First Differences)
Dependent Variable: lngpc
Independent Variables Difference GMM 1 Step Robust Difference GMM 2 Step
lngpcL1 0.845*** 0.846*** 0.849*** 0.807*** 0.804*** 0.785*** 0.802*** 0.776***
(0.051) (0.059) (0.051) (0.050) (0.031) (0.034) (0.039) (0.031)
Lngovi 0.131* 0.115***
(0.066) (0.025)
Lnaqi 0.070** 0.055***
(0.030) (0.018)
Lnpsi 0.105* 0.093***
(0.056) (0.017)
Lndapvi 0.057 0.063***
(0.056) (0.020)
Lnhumc 0.450** 0.551*** 0.495*** 0.685*** 0.575*** 0.751*** 0.688*** 0.734***
(0.163) (0.174) (0.164) (0.176) (0.111) (0.114) (0.127) (0.096)
Lnimpen -0.040 -0.036 -0.033 -0.046* -0.007 -0.036** -0.045*** -0.028
(0.026) (0.028) (0.023) (0.024) (0.021) (0.014) (0.012) (0.024)
Lnaa 0.009 0.009 0.011 0.007 0.011*** 0.009*** 0.009*** 0.009**
(0.010) (0.010) (0.009) (0.014) (0.003) (0.002) (0.003) (0.004)
Number of obs. 432 432 432 432 432 432 432 432
AR(1) test (p-value) 0.006 0.004 0.005 0.006 0.009 0.010 0.009 0.011
AR(2) test (p-value) 0.861 0.687 0.773 0.961 0.815 0.696 0.788 0.987
Hansen test of over-identification (p-value) 1.000 1.000 1.000 1.000 1.000 1.000 1.000 1.000
Diff-in-Hansen tests of exogeneity (p-value) 1.000 0.695 0.561 0.334 1.000 0.695 0.561 0.334
Notes: Standard errors are in parenthesis. ***, ** and * denote significance levels at % 1, % 5 and % 10 respectively. AR(1) and
AR(2) are tests for first-order and second-order serial correlation in the first-differenced residuals, under the null of no serial
correlation. Hansen test of over-identification is under the null that all instruments are valid. Diff-in-Hansen tests of exogeneity is
under the null that instruments used for the equations in levels are exogenous.lngpcL1, lngovi, lnaqi, lndapvi and lnhumc were treated
endogenously. First and deeper than first lags were used as instruments in the level equations. lnimpen and lnaa were treated
exogenously. Their first differences were used as instruments in the first-difference equations.

58
Table 8: Estimation Results of Model 2 (All of the Variables are in First Differences)
Notes: Standard errors are in parenthesis. ***, ** and * denote significance levels at % 1, % 5 and % 10 respectively. AR(1) and
AR(2) are tests for first-order and second-order serial correlation in the first-differenced residuals, under the null of no serial
correlation. Hansen test of over-identification is under the null that all instruments are valid. Diff-in-Hansen tests of exogeneity is
under the null that instruments used for the equations in levels are exogenous.lngpcL1, lngovi, lnaqi, lndapvi and lnhumc were treated
endogenously. First and deeper than first lags were used as instruments in the level equations. lnimpen and lnaa were treated
exogenously. Their first differences were used as instruments in the first-difference equations.
Dependent Variable: lngpc
Independent Variables Difference GMM 1 Step Robust Difference GMM 2 Step
lngpcL1 0.862*** 0.862*** 0.865*** 0.829*** 0.822*** 0.781*** 0.815*** 0.795***
(0.047) (0.054) (0.046) (0.046) (0.030) (0.040) (0.041) (0.033)
Lngovi 0.135* 0.129***
(0.071) (0.019)
Lnaqi 0.070** 0.047**
(0.032) (0.020)
Lnpsi 0.107* 0.094***
(0.059) (0.018)
Lndapvi 0.061 0.064***
(0.058) (0.022)
Lnhumc 0.410** 0.513*** 0.454*** 0.630*** 0.549*** 0.751*** 0.665*** 0.676***
(0.164) (0.166) (0.163) (0.173) (0.099) (0.125) (0.147) (0.114)
Lntrop -0.030 -0.025 -0.023 -0.033 -0.033** -0.024* -0.036*** -0.019
(0.024) (0.025) (0.020) (0.023) (0.013) (0.013) (0.013) (0.023)
Lnaa 0.010 0.010 0.011 0.008 0.008*** 0.009*** 0.009*** 0.010***
(0.010) (0.009) (0.009) (0.014) (0.003) (0.002) (0.003) (0.004)
Number of obs. 432 432 432 432 432 432 432 432
AR(1) test (p-value) 0.007 0.005 0.006 0.007 0.013 0.018 0.010 0.012
AR(2) test (p-value) 0.835 0.662 0.749 0.959 0.844 0.677 0.762 0.977
Hansen test of over-identification (p-value) 1.000 1.000 1.000 1.000 1.000 1.000 1.000 1.000
Diff-in-Hansen tests of exogeneity (p-value) 0.488 1.000 0.392 1.000 0.488 1.000 0.392 1.000

59
0
20
40
60
80
100
120
140
160
180
1985
1986
1987
1988
1989
1990
1991
1992
1993
1994
1995
1996
1997
1998
1999
2000
2001
2002
2003
2004
2005
2006
2007
2008
2009
2010
Billions, $
Exports of Goods Exports of Services Imports of Goods Imports of Services
There is a significant negative relationship between trade openness and growth in 3 out of 8
estimations. In other cases, the relationship is always negative even not significant. Even, these
results are not robust; they lead to serious doubts on one aspect of neo-liberal paradigm of the
Washington Consensus which argues that the trade-openness promotes growth. (Sarkar, 2007)
The results support the argument of protectionist trade policies especially for infant industries in
LDCs.
The reason for both increased trade openness and foreign competition have no significant
positive effect on growth is that the huge trade deficits in both the goods and service sectors in
LDCs as in Figure 11. These huge trade deficits especially for the deficit in goods sector are
based on two facts. First; the manufacturing sectors in LDCs are so insufficient; they export
labor-abundant products and natural resources to foreign countries in exchange of technologically
advanced capital-abundant products. Second; the gaps between imports and exports are actually
more serious considering the oil-export growth in five LDCs of Angola, Equatorial Guinea,
Myanmar, the Sudan and Yemen since the combined share of these five LDCs in world oil
production rose from 0.14 per cent in 1995 to 0.54 percent in 2008.
Figure 11: Foreign Trade in LDCs (1985-2010)
Source: Author’s Own Calculation based on World Bank, World Development Indicators (2012)

60
CHAPTER 7: CONCLUSION
The positive correlations between our aggregate governance indicators and GDP per capita
suggest that better governance leads to higher income per capita thus growth. The separate block
dispersion of corresponding High Income OECD and LDC scores in Figure 1 also illustrates the
hypothesis that “Rich countries can afford better institutions”. (Acemoglu et all, 2001, p 1369)
When the aggregate governance indicators of LDCs are compared with High Income OECD
countries, LDCs have performed worse. This result also justifies the rationale behind the
categorization of these countries as LDCs.
The decreasing trend in the standard deviation of “administrative quality” indicates the
convergence of LDCs with respect to this indicator. The increasing trend in the average value
together with the convergence shows that LDCs were generally improved with respect to this
indicator. Compared with the high income OECD countries, LDCs have poor performance in
administrative quality index because of inadequate control over corruption leading to unrealistic
and inefficient controls on the economy and encouraging the development of black market, low
bureaucracy quality indicating deficient public services, high political pressures on bureaucrats
and inefficient mechanism for recruitment and training (World Bank, 2003, p.184), low
investment profile indicating to high risks for business environment in the form of lack of
contract viability, overregulation and over-taxation and poor performance on law and order
indicates the weak, partial, unequal, inconsistent legal system and also the common disobedience
to the law which protecting private property. (Aysan et al., 2006)
The decreasing trend in the standard deviation of “political stability” indicates the
convergence of LDCs with respect to this indicator. The increasing trend in the average value
together with the convergence shows that LDCs were generally improved with respect to this
indicator. Compared with the High Income OECD countries, even the performance of LDCs
seem to be improved they are still behind the High Income OECD countries in political stability
index because of the inability of governments in LDCs to carry out their declared program(s),
popular disapproval of government policies, trade restrictions and embargoes, political violence

61
arising from civil war, civil disorder, terrorism, warfare, ethnic and religious tensions. (Aysan et
al., 2006 and ICRG Variables, 2012)
The non-decreasing trend in the standard deviation of “democratic accountability public
voice” indicates the divergence of LDCs with respect to this indicator. The increasing trend in the
average value together with the divergence show that while some LDCs are improved, some of
the others are deteriorated with respect to this indicator. Compared with the high income OECD
countries, LDCs have poor performance in this index because of unfair elections and electoral
laws, irresponsiveness of governments to their citizens, coups and dicta regimes, inability of
people to organize in different political parties or groups, partial press, inequality of citizens
under the law, unjustified imprisonments, gender inequality, less freedom of movement and
inequality of opportunity for the citizens. (ICRG Variables, 2012)
This study empirically shows that the governance institutions have positive significant effect
on income per capita growth in the long-run or income per capita in the short-run in LDCs with
the control variables of lag of per capita income, human capital, trade openness, import
penetration and net official development assistance and official aid received for a panel of 24
LDCs between the period of 1991 and 2010.
According to the estimation results it was found that overall governance quality together with
“administrative quality” and “political stability” as aggregate governance indices have positive
significant effect on growth when one-step robust difference GMM was applied and all the
aggregate governance indices have positive significant effect on growth when the two-step
difference GMM was applied. A high rank for “administrative quality” corresponding to low
level of corruption, better quality of bureaucracy quality, a sound and safe investment profile
lowering risks for business environment and better law and order and a high rank for “political
stability” corresponding to more cohesive government, low ethnic and religious tensions together
with diminishing internal and external conflicts decreasing the occurrence of political violence
leading to devotion of resources to favorable economic objectives resulting in growth in LDCs.
The estimation results deny the argument of conflict school favoring that democracy hinders
economic growth, mainly in less developed countries, by creating consumption pressures,
fuelling distributional conflicts and inhibiting capital accumulation. (eg., Feng, 2003 cited by
Avellaneda, 2009).
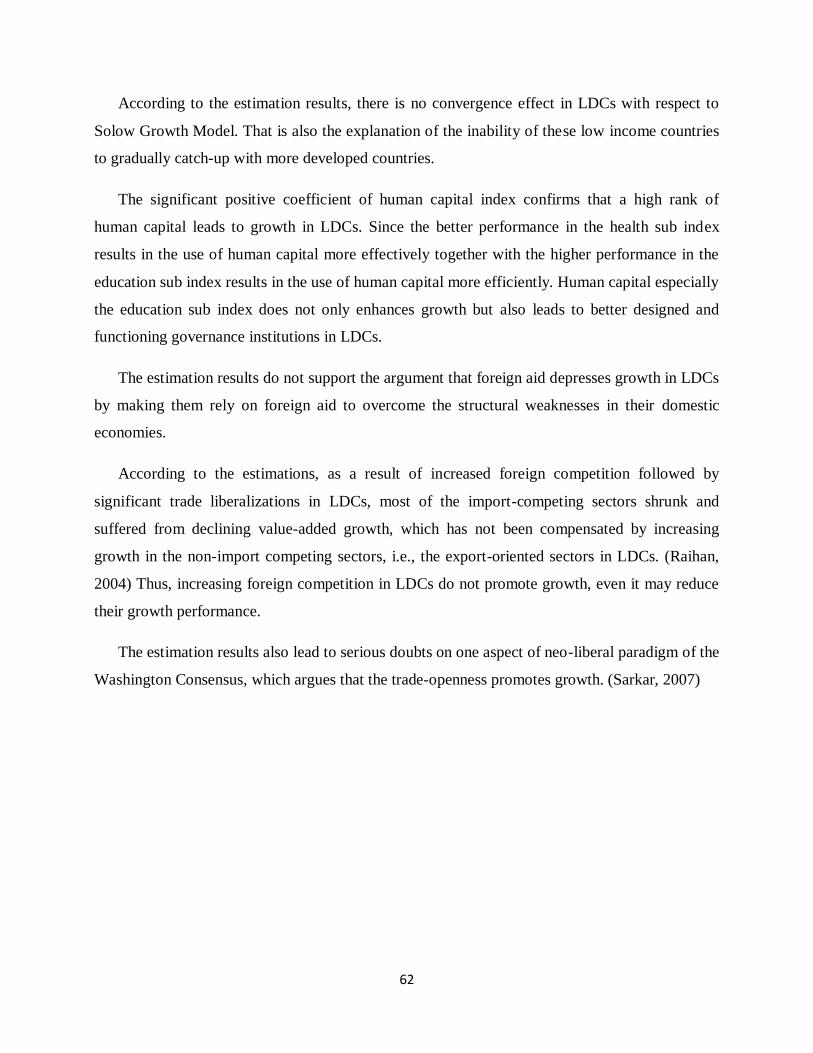
62
According to the estimation results, there is no convergence effect in LDCs with respect to
Solow Growth Model. That is also the explanation of the inability of these low income countries
to gradually catch-up with more developed countries.
The significant positive coefficient of human capital index confirms that a high rank of
human capital leads to growth in LDCs. Since the better performance in the health sub index
results in the use of human capital more effectively together with the higher performance in the
education sub index results in the use of human capital more efficiently. Human capital especially
the education sub index does not only enhances growth but also leads to better designed and
functioning governance institutions in LDCs.
The estimation results do not support the argument that foreign aid depresses growth in LDCs
by making them rely on foreign aid to overcome the structural weaknesses in their domestic
economies.
According to the estimations, as a result of increased foreign competition followed by
significant trade liberalizations in LDCs, most of the import-competing sectors shrunk and
suffered from declining value-added growth, which has not been compensated by increasing
growth in the non-import competing sectors, i.e., the export-oriented sectors in LDCs. (Raihan,
2004) Thus, increasing foreign competition in LDCs do not promote growth, even it may reduce
their growth performance.
The estimation results also lead to serious doubts on one aspect of neo-liberal paradigm of the
Washington Consensus, which argues that the trade-openness promotes growth. (Sarkar, 2007)

63
REFERENCES
Acemoglu, D., Johnson, S. and Robinson, J. A., 2001. “The Colonial Origins of Comparative
Development: An Empirical Investigation” The American Economic Review. Vol.91,
No.5, pp. 1369-1401. <http://economics.mit.edu/files/4123> (accessed 23 April 2012)
Acemoglu, D., Johnson, S. and Robinson, J. A., 2005. “Institutions as a Fundamental
Cause of Long-Run Growth” in Aghion, P. and. Durlauf, S. N. (Eds.) Handbook of
Economic Growth, Volume IA. Elsevier B.V. pp. 385-472.
<http://economics.mit.edu/files/4469> (accessed 23 April 2012)
Alesina, A., 1998. “The Political Economy of High and Low Growth,” in Pleskovic, B. and
Stiglitz, J. (Eds.) Annual World Bank Conference on Development Economics 1998.
World Bank, Washington, D.C.
Arellano, M. and Bond, S., 1991. “Some Tests of Specification for Panel Data: Monte Carlo
Evidence and an Application to Employment Equations,” The Review of Economic
Studies, Vol. 58, No. 2, pp. 277-297.
Avellanada, S. D., 2009. “Good Governance, Institutions and Economic Development:
Beyond the Conventional Wisdom” Cambridge University Press, B.J.Pol.S. 40, 195–224.
Aysan, A. F., Nabli, M. K. and Varoudakis, M. A. V., 2006. “Governance and Private Investment
in the Middle East and North Africa” CERDI, Etudes et Documents, E 2006.27.
http://www-wds.worldbank.org/servlet/WDSContentServer/WDSP/IB/2006/05/30/
000016406_20060530161214/Rendered/PDF/wps3934.pdf (accessed 1 May 2012)
CDP, 2004. “Report on the Sixth Session (29 March-2 April 2004)” United Nations Economic
and Social Council Official Records, No. 13.
<http://www.un.org/special-rep/ohrlls/ldc/E-2004-33.pdf> (accessed 1 May 2012)
CDP, 2008. “Handbook on the Least Developed Country Category: Inclusion, Graduation and
Special Support Measures” United Nations Publication, New York. No.E.07.II.A.9.
<http://www.un.org/en/development/desa/policy/cdp/cdp_ldcs_handbook.shtml>
(accessed 25 February 2012)
CDP, 2010. “Strengthening International Support Measures for the Least Developed Countries”
United Nations Publication, Sales No. E.10.II.A.14.
Dollar, D. and Kraay, A., 2002. “Institutions, Trade, and Growth” The World Bank. ,Washington,
D.C. <http://s12.middlebury.edu/ECON0424A/dollar2.pdf>-(accessed 1 May 2012)
FRH Online Database, 2012. “Civil Liberties and Political Voice Index” Freedom House,
Washington. D.C. <http://www.freedomhouse.org/>-(accessed 2 January 2012)

64
Guillaumont, P. and Chauvet, L., 1999. “Aid and Performance: A Reassessment” Journal of
Development Studies, 37, pp. 66-92.
ICRG Database, 2010. “International Country Risk Guide” The PRS Group, New York.
ICRG Variables, 2012. “Guide to Data Variables” The PRS Group, New York.
<http://www.prsgroup.com/VariableHelp.aspx> (accessed 16 April 2012)
Kaufmann, D., Kraay, A. and Lobaton,P.Z., 2000. “Governance Matters: From Measurement to
Action”. Finance & Development, 37. <http://siteresources.worldbank.org/ INTWBIGO
VANT CORINSPA/Resources/1745261-1163704849223/fandd_english.pdf>
(accessed 1 May 2012)
Kaufmann, D and Kraay, A., 2002. “Growth Without Governance” The World Bank,
Washington, D.C. <http://siteresources.worldbank.org/INTWBIGOVANTCOR/
Resources/growthgov.pdf>. (accessed 1 May 2012)
Kaufmann, D., Kraay, A. and Mastruzzi, M., 2003. “Governance Matters III: Governance
Indicators for 1996-2002” The World Bank. ,Washington, D.C.
<http://siteresources.worldbank.org/INTWBIGOVANTCOR/Resources/govmatters3_wbe
r.pdf> (accessed 1 May 2012)
Mauro, P., 1995. “Corruption and Growth” The Quarterly Journal of Economics.Vol. 110, No. 3,
pp. 681-712. <http://homepage.ntu.edu.tw/~kslin/macro2009/Mauro%201995.pdf>
(accessed 1 May 2012)
North, D. C. and Thomas, R. P., 1973. “The Rise of the Western World: A New Economic
History” Cambridge University Press,1976.
North, D. C., 1991. “Institutions” The Journal of Economic Perspectives, Vol. 5, No. 1,
pp. 97-112. <http://www.econ.uchile.cl/uploads/documento/94ced618aa1aa4d59bf48
a17b1c7f605cc9ace73.pdf> (accessed 1 May 2012)
Raihan, S., 2004. “Foreign Competition and Growth Nexus: A Study in the context of
Bangladesh Manufacturing Industries” The World Bank. ,Washington, D.C.
<http://siteresources.worldbank.org/INTCOMPLEGALDB/Resources/raihan.pdf>
(accessed 9 May 2012)
Rajan, R. G. and Subramanian,A., 2005. “Aid and Growth: What Does the Cross-Country
Evidence Really Show?” IMF Working Paper, WP/05/127.
Roodman, D., 2006. “How to Do xtabond2: An Introduction to Difference and System GMM
in Stata” Center for Global Development,103.
Sarkar, P., 2007. “Trade Openness and Growth: Is There Any Link?” MPRA Paper, No. 4997.
<http://mpra.ub.uni-muenchen.de/4997/> (accessed 16 April 2012)

65
Slaughter, M. J., 2004. “Infant-Industry Protection and Trade Liberalization in Developing
Countries” USAID Research Report, Washington, Task Order 13.
<http://www.nathaninc.com/sites/default/files/Infant%20Industries%20Paper%20(Final).
pdf> (accessed 1 May 2012)
UN Conference, 2001. “Programme of Action for the Least Developed Countries”
United Nations General Assembly, Brussels, Belgium, 14-20 May 2001,A/CONF.191/11.
World Bank, 2003. “Mena Development Report, Enhancing Inclusiveness and Accountability”
The International Bank for Reconstruction and Development. The World Bank,
Washington D.C.
World Development Indicators (WDI), 2012. “Data” The World Bank, Washington, D.C.
<http://data.worldbank.org/indicator> (accessed 23 April 2012)
66
APPENDIX 1
CURRENT LIST OF LDCs
Africa (33)
Angola Ethiopia Niger
Benin Gambia Rwanda
Burkina Faso Guinea São Tomé and Príncipe
Burundi Guinea-Bissau Senegal
Central African Republic Lesotho Sierra Leone
Chad Liberia Somalia
Comoros Madagascar Sudan
Democratic Republic of the Congo Malawi Togo
Djibouti Mali Uganda
Equatorial Guinea Mauritania United Republic of Tanzania
Eritrea Mozambique Zambia
Asia (14)
Afghanistan Lao People’s Democratic Republic Timor-Leste
Bangladesh Myanmar Tuvalu
Bhutan Nepal Vanuatu
Cambodia Samoa Yemen
Kiribati Solomon Islands
Latin America and the Caribbean (1)
Haiti
COUNTRIES GRADUATED FROM THE LIST OF THE LDCs
Botswana (1994) Cape Verde (2007) Maldives (2011)
COUNTRIES REJECTED TO BE ENLISTED AS LDC
Ghana Papua New Guinea Zimbabwe

67
APPENDIX 2
LIST OF LDCS COVERED IN THE STUDY
Africa (20 of 33)
Angola Liberia Sierra Leone
Burkina Faso Madagascar Sudan
Democratic Republic of the Congo Malawi Togo
Ethiopia Mali Uganda
Gambia Mozambique United Republic of Tanzania
Guinea Niger Zambia
Guinea-Bissau Senegal
Asia (3 of 14)
Bangladesh Myanmar Yemen
Latin America and the Caribbean (1 of 1)
Haiti
LIST OF HIGH INCOME OECD COUNTRIES COVERED IN THE STUDY
27 of 31 Countries
Australia Hungary New Zealand
Austria Iceland Norway
Belgium Ireland Poland
Canada Israel Portugal
Denmark Italy Spain
Finland Japan Sweden
France Korea, South Switzerland
Germany Luxembourg United Kingdom
Greece Netherlands United States

68
APPENDIX 3
Administrative Quality Index (AQI)
Component Eigenvalue Cumulative R
2
P1 3.047 0.762
P2 0.627 0.919
P3 0.174 0.962
P4 0.152 1
Loadings P1 P2 P3 P4
Corruption 0.499 -0.499 0.654 0.273
Bureaucracy Quality 0.540 -0.073 -0.122 -0.829
Investment Profile 0.415 0.855 0.270 0.156
Law and Order 0.536 -0.124 -0.696 0.462
AQI = P1 * 0.762 + P2 * 0.157 + P3 * 0.043 + P4 * 0.038
Political Stability Index (PSI)
Component Eigenvalue Cumulative R
2
P1 3.032 0.606
P2 0.805 0.768
P3 0.547 0.877
P4 0.424 0.962
P5 0.192 1
Loadings P1 P2 P3 P4 P5
Government Stability 0.333 0.851 0.367 0.028 0.170
Internal Conflicts 0.527 0.044 -0.192 -0.145 -0.814
External Conflicts 0.463 -0.008 -0.603 0.552 0.343
Ethnic Tensions 0.479 -0.233 -0.043 -0.723 0.437
Religious Tensions 0.409 -0.468 0.681 0.388 0.010
PSI = P1 * 0.606 + P2 * 0.161 + P3 * 0.109 + P4 * 0.085 + P5 * 0.038

69
Democratic Accountability Political Voice Index (DAPVI)
Component Eigenvalue Cumulative R
2
P1 3.607 0.902
P2 0.182 0.947
P3 0.157 0.987
P4 0.054 1
Loadings P1 P2 P3 P4
Democratic Accountability 0.494 0.032 0.868 0.025
Political Rights 0.506 -0.459 -0.290 0.670
Civil Liberties 0.510 -0.356 -0.256 -0.740
Military in Politics 0.490 0.813 -0.310 0.054
DAPVI = P1 * 0.902 + P2 * 0.046 + P3 * 0.039 + P4 * 0.014
Governance Index (GOVI)
GOVI = (AQI + PSI + DAPVI) / 3
Note: Principal Component Analysis (PCA) is a statistical technique used for data reduction
that uses an orthogonal transformation to convert a set of observations of possibly correlated
variables into a set of values of linearly uncorrelated variables called principal components. The
number of principal components is less than or equal to the number of original variables. This
transformation is defined in such a way that the first principal component has the largest possible
variance (that is, accounts for as much of the variability in the data as possible), and each
succeeding component in turn has the highest variance possible under the constraint that it be
orthogonal to (i.e., uncorrelated with) the preceding components. The leading eigenvectors from
the eigen decomposition of the correlation or covariance matrix of the variables describe a series
of uncorrelated linear combinations of the variables that contain most of the variance. In addition
to data reduction, the eigenvectors from a PCA are often inspected to learn more about the
underlying structure of the data.
Source: Wikipedia - PCA and Stata 10 – Help - Contents - PCA

70
Table 1: Colonial Origins and Last Disturbances on Governance in LDCs
Country Date of
Colonial Origin Historical Events Affecting Governance Type of Government Freedom
Afghanistan 1919 British Colony in 1800s Marxist Revolution in 1978 Islamic republic since 1992
Soviet Invasion in 1979 Civil War in 1989-1992, 1992-1996 and 1996-2001 Communist regime in 1978-1992
Angola 1975 Portuguese Colony in 1500s Civil War in 1975-2002 Unitary presidential republic
since 1992
Bangladesh 1971 British Colony in 1800s Coup in 1982 Unitary state and parliamentary
Pakistan Invasion in 1947 democracy since 1990
Dicta regime in 1982-1990
Benin 1960 French Colony in 1800s Coup in 1972 Republic with multiparty democracy
since 1990
Marxist-Leninist dicta regime in
1972-1990
Bhutan 1907 British Colony in 1800s Wangchuk Dynasty in 1907 Unitary parliamentary democracy and
Britain Power on Foreign Relations in 1949 Constitutional monarchy since 2007
Constitutional Monarchy in 2007
Burkina Faso 1960 French Colony in 1800s Coup in 1966, 1980, 1983 and 1987 Semi-presidential parliamentary
republic since 1991
Dicta regime in 1966-1970
Burundi 1962 Belgian Mandate after WWI Genocide of Hutus in 1972 Presidential representative democratic
Coup in 1976 and 1996 republic since 1998
Overthrown in 1987
Civil War in 1992
Genocide of Tutsi in 1993
Cambodia 1953 French Colony in 1800s Coup in 1970 Unitary parliamentary democracy and
Japanese Occupation in Civil War in 1970-1975 Constitutional monarchy since 1993
WWII Genocide in 1975-1979 Maoist dictatorship in 1975-1979
Central African 1960 French Colony in 1800s Coup in 1965, 1979 and 1981 Presidential republic since 2003
Republic Overthrown in 2003 Dicta regime in 1981-1985
Source: CIA The World Factbook (2012), Wikipedia (2012) and History World (2012)
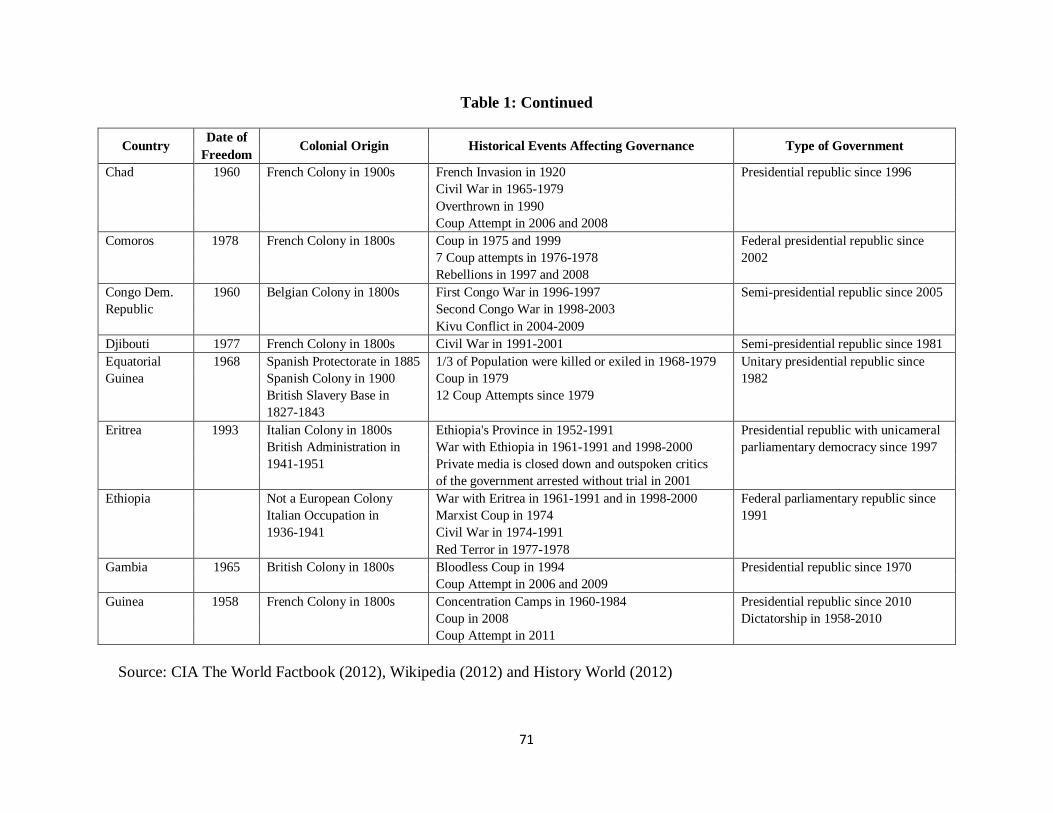
71
Table 1: Continued
Country Date of
Colonial Origin Historical Events Affecting Governance Type of Government Freedom
Chad 1960 French Colony in 1900s French Invasion in 1920 Presidential republic since 1996
Civil War in 1965-1979
Overthrown in 1990
Coup Attempt in 2006 and 2008
Comoros 1978 French Colony in 1800s Coup in 1975 and 1999 Federal presidential republic since
7 Coup attempts in 1976-1978 2002
Rebellions in 1997 and 2008
Congo Dem. 1960 Belgian Colony in 1800s First Congo War in 1996-1997 Semi-presidential republic since 2005
Republic Second Congo War in 1998-2003
Kivu Conflict in 2004-2009
Djibouti 1977 French Colony in 1800s Civil War in 1991-2001 Semi-presidential republic since 1981
Equatorial 1968 Spanish Protectorate in 1885 1/3 of Population were killed or exiled in 1968-1979 Unitary presidential republic since
Guinea Spanish Colony in 1900 Coup in 1979 1982
British Slavery Base in 12 Coup Attempts since 1979
1827-1843
Eritrea 1993 Italian Colony in 1800s Ethiopia's Province in 1952-1991 Presidential republic with unicameral
British Administration in War with Ethiopia in 1961-1991 and 1998-2000 parliamentary democracy since 1997
1941-1951 Private media is closed down and outspoken critics
of the government arrested without trial in 2001
Ethiopia Not a European Colony War with Eritrea in 1961-1991 and in 1998-2000 Federal parliamentary republic since
Italian Occupation in Marxist Coup in 1974 1991
1936-1941 Civil War in 1974-1991
Red Terror in 1977-1978
Gambia 1965 British Colony in 1800s Bloodless Coup in 1994 Presidential republic since 1970
Coup Attempt in 2006 and 2009
Guinea 1958 French Colony in 1800s Concentration Camps in 1960-1984 Presidential republic since 2010
Coup in 2008 Dictatorship in 1958-2010
Coup Attempt in 2011
Source: CIA The World Factbook (2012), Wikipedia (2012) and History World (2012)

72
Table 1: Continued
Country Date of
Colonial Origin Historical Events Affecting Governance Type of Government Freedom
Guinea Bissau 1974 Portuguese Colony in 1800s Independence War in 1963-1974 Semi-presidential republic since 1994
Coup Attempt in 1998 Revolutionary Council in 1974-1984
Civil War in 1998
Coup in 1999 and 2003
Military Unrest in 2010
Haiti 1825 Spanish Colony in 1500s Coup Attempts in 1949 and 1950 Unitary semi-presidential republic
French Colony in 1600s Coup in 2004 since 1990
US Occupation in 1915-1934 Dictatorship in 1957-1986
Kiribati 1979 British Colony in 1800s Shut Down of Newspapers in 2002 Parliamentary republic since 1979
Japanese Invasion in WWII
Laos 1953 French Colony in 1800s Civil War in 1953-1975 Unitary communist and single-party-
Japanese Occupation in US Bombardment in 1964-1973 Vietnam War led state since 1975
WWII Overthrown in 1975 Constitutional monarchy in 1954-1975
Lesotho 1966 British Colony in 1800s Coup in 1986 and 1994 Unitary parliamentary democracy and
Constitutional monarchy since 1993
Liberia 1847 American Colony in 1800s Coup in 1980 Unitary presidential constitutional
Coup Attempt in 1985 republic since 1986
Civil War in 1989-1996 and 1999-2003
Madagascar 1960 French Colony in 1800s Rebellion against France in 1947-1948 Semi presidential representative
Coup in 2009 leading to Political Crisis democratic multi-party republic since
1992
Malawi 1964 British Colony in 1800s Multi-party democracy since 1993
Single party state in 1966-1993
Mali 1960 French Colony in 1800s Coup in 1968 and 1991 Unitary semi-presidential republic
Rebellion in 2012 leading to internal conflict since 1992
Mauritania 1960 French Colony in 1800s Coup Attempt in 1987 Islamic republic with multi-party
War with Senegal in 1989-1991 elections since 1991
Massacre of 1990-1991 Single party state in 1960-1978
Coup in 2005 and 2008 Military governments in 1978-1984
Source: CIA The World Factbook (2012), Wikipedia (2012) and History World (2012)

73
Table 1: Continued
Country Date of
Colonial Origin Historical Events Affecting Governance Type of Government Freedom
Mozambique 1975 Portuguese Colony in 1500s Civil War in 1977-1992 Presidential republic with multi-party
democracy since 1990
Myanmar 1948 British Colony in 1800s Coup in 1962 Unitary presidential republic since 2011
(Burma) Japanese Rule in 1942-1945 Uprising against regime in 1988 Democratic republic in 1948-1962
Civil Resistance in 2007-2008 Socialist republic in 1974-1988
Military junta in 1988-2011
Nepal 2007 Not a European Colony Civil War in 1996-2006 Federal democratic republic as of 2008
Royal Massacre in 2001 Kingdom of Nepal in 1768-2007
Niger 1960 French Colony in 1800s Coup in 1999 and 2010 Semi-presidential republic since 1999
Military Unrest in 2002 Military rule in 1961-1991 and 1996-1999
Republic with multi-party system in
1991-1996
Rwanda 1962 German Colony in 1800s Civil War in 1990-1993 Unitary parliamentary democracy and
Belgium Colony in 1900s 800,000 killed in Genocide of 1994 Presidential republic since 2003
Samoa 1962 German and New Zealand Parliamentary republic since 2007
Colony in 1900s Constitutional monarchy in 1962-2007
Sao Tome and 1975 Portuguese Colony in 1500s Coup Attempt in 2009 Democratic semi-presidential republic
Principe since 1990
Senegal 1960 French Colony in 1500s Separatist movement since 1982 Semi-presidential republic since 1983
Youth opposition movements in 2011
Sierra Leone 1961 British Colony in 1700s Coup in 1967, 1968, 1996 and 1997 Unitary presidential constitutional
Coup Attempt in 1971, 1987 and 1992 republic since 1991
Nationwide student demonstration against One-party state in 1968-1985
government in 1977 Military junta in 1992-1996 and 1997-1998
Civil War in 1991-2002 Multi-party constitution in 1991-2001
Solomon Islands
1978 British Colony in 1800s Ethnic tensions leading to Civil War in 1998-2001 Parliamentary democracy and a
Commonwealth realm since 1978
Source: CIA The World Factbook (2012), Wikipedia (2012) and History World (2012)

74
Table 1: Continued
Country Date of
Colonial Origin Historical Events Affecting Governance Type of Government Freedom
Somalia 1960 British Colony in 1800s Assassination of president 1969 Transitional parliamentary federal
Italian Colony in 1900s Coup in 1969 government since 1991
War with Ethiopia in 1977-1978 Totalitarian communist rule in 1969-1991
Civil War since 1991
Sudan 1956 British Colony in 1800s Civil War in 1955-1972 and 1983-2005 Federal presidential republic since 2005
Coup in 1969 and 1989 Islamic authoritarian single party
480,000 deaths in Genocide in 2003-2006 system in 1993-2005
Conflict with Chad in 2005-2007
Tanzania 1964 German Colony in 1800s War with Uganda in 1978-1979 Federal presidential constitutional
British Mandate in 1900s republic
Timor-Leste 1975 Portuguese Colony in 1500s Coup Attempt in 1975 Unitary parliamentary democracy and
2002 Japanese Invasion in WWII Massacre of 1991 Democratic republic since 2002
Indonesian Occupation in Anti-independence militia attacks on civilians in 1999
1975-1999 Assassination attempt to president in 2008
Togo 1960 German Colony in 1800s Coup in 1963 and 1967 Republic under transition to multiparty
French Colony in 1900s Political Violence in 2004 democratic rule since 2005
Tuvalu 1978 British Colony in 1800s Parliamentary democracy and a
Commonwealth realm since 1978
Uganda 1962 British Colony in 1800s Coup in 1971 Democratic republic dominant-party
War with Tanzania in 1978-1979 system since 2005
Military rule in 1971-1979
Commonwealth realm in 1962-1967
Vanuatu 1980 British and French Colony in Clash with Papua New Guinea in 1980 Unitary parliamentary republic since
1900s Political Instabilities of 1990s leading to more 1997
decentralized government
Coup Attempt in 1996
Source: CIA The World Factbook (2012), Wikipedia (2012) and History World (2012)

75
Table 1: Continued
Country Date of
Colonial Origin Historical Events Affecting Governance Type of Government Freedom
Yemen 1990 British Colony in 1800s North Yemen Civil War in 1962-1970 Unitary presidential system since 1990
Independence of North Civil War in 1994 Communist governmental system in
Yemen from Ottoman in 1918 Uprising in 2007 1970-1990
Independence of South Revolution in 2011-2012
Yemen from UK in 1967
Unification in 1990
Zambia 1964 British Colony in 1800s Riots in 1990 Presidential representative democratic
Coup Attempt in 1990 republic since 1991
One-party state in 1964-1991
Source: CIA The World Factbook (2012), Wikipedia (2012) and History World (2012)
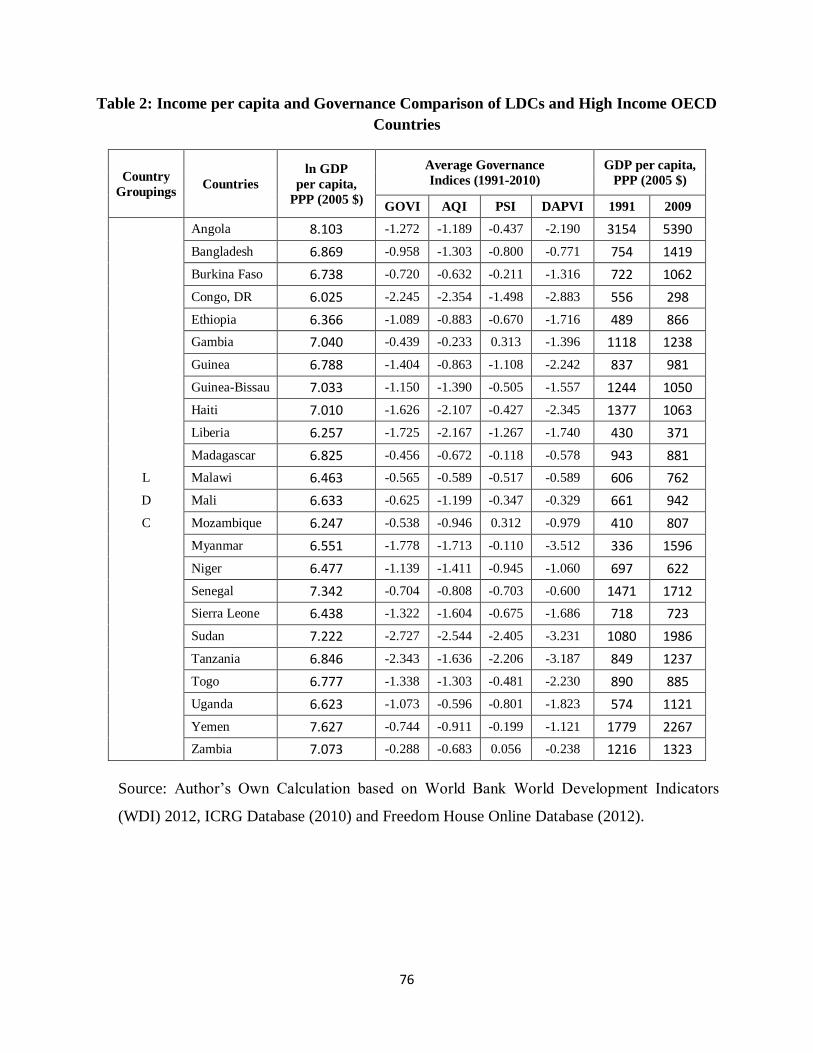
76
Table 2: Income per capita and Governance Comparison of LDCs and High Income OECD
Countries
Country
Groupings Countries
ln GDP
per capita,
PPP (2005 $)
Average Governance
Indices (1991-2010)
GDP per capita,
PPP (2005 $)
GOVI AQI PSI DAPVI 1991 2009
Angola 8.103 -1.272 -1.189 -0.437 -2.190 3154 5390
Bangladesh 6.869 -0.958 -1.303 -0.800 -0.771 754 1419
Burkina Faso 6.738 -0.720 -0.632 -0.211 -1.316 722 1062
Congo, DR 6.025 -2.245 -2.354 -1.498 -2.883 556 298
Ethiopia 6.366 -1.089 -0.883 -0.670 -1.716 489 866
Gambia 7.040 -0.439 -0.233 0.313 -1.396 1118 1238
Guinea 6.788 -1.404 -0.863 -1.108 -2.242 837 981
Guinea-Bissau 7.033 -1.150 -1.390 -0.505 -1.557 1244 1050
Haiti 7.010 -1.626 -2.107 -0.427 -2.345 1377 1063
Liberia 6.257 -1.725 -2.167 -1.267 -1.740 430 371
Madagascar 6.825 -0.456 -0.672 -0.118 -0.578 943 881
L Malawi 6.463 -0.565 -0.589 -0.517 -0.589 606 762
D Mali 6.633 -0.625 -1.199 -0.347 -0.329 661 942
C Mozambique 6.247 -0.538 -0.946 0.312 -0.979 410 807
Myanmar 6.551 -1.778 -1.713 -0.110 -3.512 336 1596
Niger 6.477 -1.139 -1.411 -0.945 -1.060 697 622
Senegal 7.342 -0.704 -0.808 -0.703 -0.600 1471 1712
Sierra Leone 6.438 -1.322 -1.604 -0.675 -1.686 718 723
Sudan 7.222 -2.727 -2.544 -2.405 -3.231 1080 1986
Tanzania 6.846 -2.343 -1.636 -2.206 -3.187 849 1237
Togo 6.777 -1.338 -1.303 -0.481 -2.230 890 885
Uganda 6.623 -1.073 -0.596 -0.801 -1.823 574 1121
Yemen 7.627 -0.744 -0.911 -0.199 -1.121 1779 2267
Zambia 7.073 -0.288 -0.683 0.056 -0.238 1216 1323
Source: Author’s Own Calculation based on World Bank World Development Indicators
(WDI) 2012, ICRG Database (2010) and Freedom House Online Database (2012).

77
Table 2: Continued
Country
Groupings Countries
ln GDP
per capita,
PPP (2005 $)
Average Governance
Indices (1991-2010)
GDP per capita,
PPP (2005 $)
GOVI AQI PSI DAPVI 1991 2009
Australia 10.226 1.236 1.269 0.757 1.683 23608 34139
Austria 10.289 1.253 1.431 0.777 1.552 26012 34681
Belgium 10.248 0.992 1.054 0.357 1.565 25461 32377
Canada 10.319 1.249 1.511 0.558 1.677 26021 34516
Denmark 10.285 1.315 1.527 0.736 1.683 25708 32063
Finland 10.154 1.483 1.599 1.167 1.683 21633 30755
H France 10.184 0.860 0.921 0.311 1.347 24444 29367
I Germany 10.262 1.146 1.253 0.747 1.438 27006 32176
G Greece 9.913 0.590 0.363 0.433 0.972 17683 25162
H Hungary 9.547 0.835 0.701 0.446 1.358 11560 16710
Iceland 10.269 1.337 1.298 1.030 1.683 25258 34093
I Ireland 10.197 1.144 1.089 0.696 1.648 17844 35733
N Israel 9.953 -0.076 0.639 -1.530 0.662 18115 25325
C Italy 10.152 0.669 0.402 0.430 1.176 24123 26539
O Japan 10.225 0.951 0.898 0.744 1.210 26914 29372
M Korea, South 9.748 0.551 0.314 0.474 0.863 12337 25525
E Luxembourg 10.899 1.511 1.631 1.273 1.631 45758 68188
Netherlands 10.332 1.299 1.572 0.640 1.683 26705 36570
O New Zealand 9.979 1.280 1.453 0.730 1.657 18237 24649
E Norway 10.595 1.230 1.362 0.645 1.683 32958 47118
C Poland 9.373 0.756 0.489 0.482 1.296 7581 16708
D Portugal 9.830 1.086 0.856 0.851 1.551 16944 21392
Spain 10.041 0.806 0.828 0.268 1.323 20219 27075
Sweden 10.228 1.327 1.460 0.887 1.635 24127 32251
Switzerland 10.428 1.303 1.287 0.939 1.683 32673 36978
UK 10.223 1.080 1.309 0.406 1.524 23295 32004
US 10.505 1.054 1.218 0.495 1.450 31393 41378
Source: Author’s Own Calculation based on World Bank World Development Indicators
(WDI) 2012, ICRG Database (2010) and Freedom House Online Database (2012).
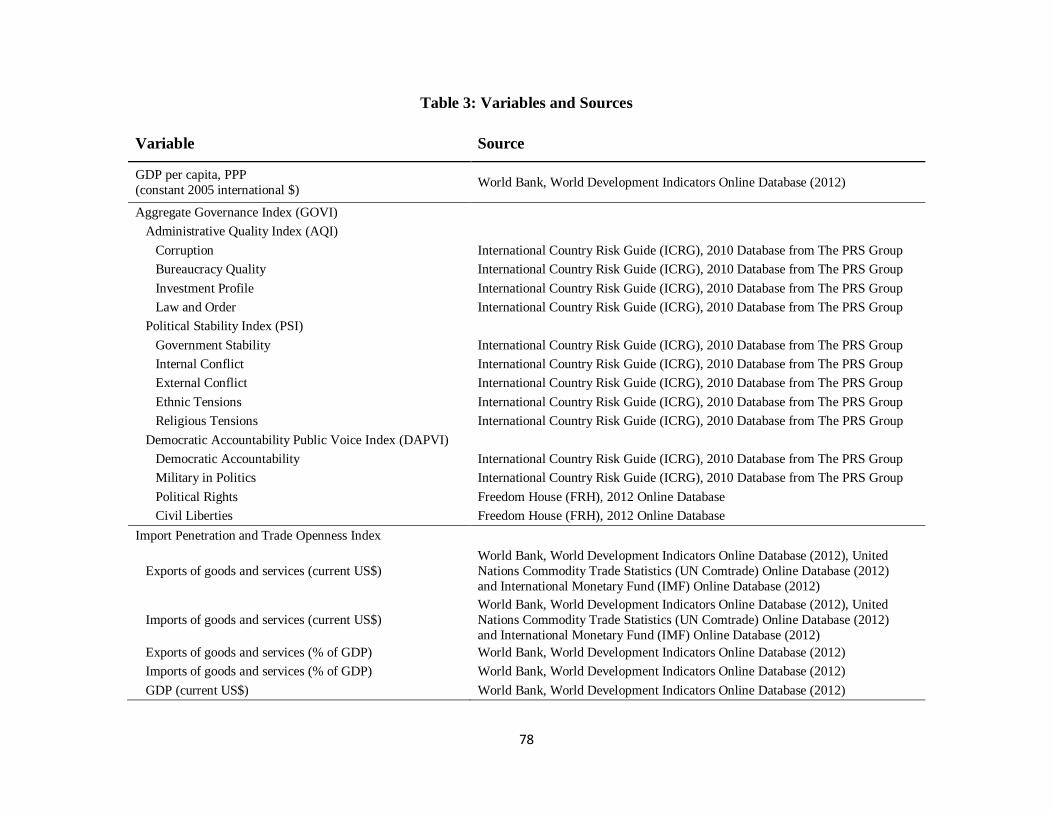
78
Table 3: Variables and Sources
Variable Source
GDP per capita, PPP
(constant 2005 international $) World Bank, World Development Indicators Online Database (2012)
Aggregate Governance Index (GOVI)
Administrative Quality Index (AQI)
Corruption International Country Risk Guide (ICRG), 2010 Database from The PRS Group
Bureaucracy Quality International Country Risk Guide (ICRG), 2010 Database from The PRS Group
Investment Profile International Country Risk Guide (ICRG), 2010 Database from The PRS Group
Law and Order International Country Risk Guide (ICRG), 2010 Database from The PRS Group
Political Stability Index (PSI)
Government Stability International Country Risk Guide (ICRG), 2010 Database from The PRS Group
Internal Conflict International Country Risk Guide (ICRG), 2010 Database from The PRS Group
External Conflict International Country Risk Guide (ICRG), 2010 Database from The PRS Group
Ethnic Tensions International Country Risk Guide (ICRG), 2010 Database from The PRS Group
Religious Tensions International Country Risk Guide (ICRG), 2010 Database from The PRS Group
Democratic Accountability Public Voice Index (DAPVI)
Democratic Accountability International Country Risk Guide (ICRG), 2010 Database from The PRS Group
Military in Politics International Country Risk Guide (ICRG), 2010 Database from The PRS Group
Political Rights Freedom House (FRH), 2012 Online Database
Civil Liberties Freedom House (FRH), 2012 Online Database
Import Penetration and Trade Openness Index
Exports of goods and services (current US$)
World Bank, World Development Indicators Online Database (2012), United
Nations Commodity Trade Statistics (UN Comtrade) Online Database (2012)
and International Monetary Fund (IMF) Online Database (2012)
Imports of goods and services (current US$)
World Bank, World Development Indicators Online Database (2012), United
Nations Commodity Trade Statistics (UN Comtrade) Online Database (2012)
and International Monetary Fund (IMF) Online Database (2012)
Exports of goods and services (% of GDP) World Bank, World Development Indicators Online Database (2012)
Imports of goods and services (% of GDP) World Bank, World Development Indicators Online Database (2012)
GDP (current US$) World Bank, World Development Indicators Online Database (2012)

79
Table 3: Continued
Variable Source
Human Capital Index
Health Index
Life expectancy at birth, total (years) World Bank, World Development Indicators Online Database (2012) and World Health Organization (WHO) Online Database (2012)
Prevalence of undernourishment
(% of population)
World Bank, World Development Indicators Online Database (2012) and
World Health Organization (WHO) Online Database (2012)
Mortality rate, under-5 year old (per 1,000) World Bank, World Development Indicators Online Database (2012) and
World Health Organization (WHO) Online Database (2012)
Education Index
Literacy rate, adult total
(% of people ages 15 and above)
World Bank, World Development Indicators Online Database (2012) and
United Nations Educational, Scientific and Cultural Organization (UNESCO)
Online Database (2012)
School enrollment, primary (% gross)
World Bank, World Development Indicators Online Database (2012) and
United Nations Educational, Scientific and Cultural Organization (UNESCO)
Online Database (2012)
School enrollment, secondary (% gross)
World Bank, World Development Indicators Online Database (2012) and
United Nations Educational, Scientific and Cultural Organization (UNESCO)
Online Database (2012)
School enrollment, tertiary (% gross)
World Bank, World Development Indicators Online Database (2012) and
United Nations Educational, Scientific and Cultural Organization (UNESCO)
Online Database (2012)
Net official development assistance and official aid received
(constant 2009 US$) World Bank, World Development Indicators Online Database (2012)

80
Table 6: Summary Statistics of All Variables In Panel Regressions (1991-2010)
Variable # Obs Mean Std. Dev. Min Max
lngpc 480 6.78 0.55 4.94 8.62
lngpcL1 456 6.77 0.54 4.94 8.61
lngovi 480 3.82 0.33 2.33 4.31
lnaqi 480 3.56 0.45 1.43 4.17
lnpsi 480 4.12 0.29 2.46 4.49
lndapvi 480 3.61 0.56 1.97 4.43
lnhumc 480 4.09 0.10 3.82 4.31
lnimpen 480 3.22 0.97 -2.70 4.47
lntrop 480 3.83 0.98 -1.71 5.50
lnaa 480 20.09 0.97 17.55 22.68