and cardiac energetics of blood-perfused isolated canine heart
THE Slc2a5 (Glut5) IS ESSENTIAL FOR THE ABSORPTION OF FRUCTOSE IN THE INTESTINE AND GENERATION OF FRUCTOSE-INDUCED HYPERTENSION
Sharon Barone1,2*, Stacey L. Fussell1,2*, Anurag Kumar Singh3, Fred Lucas4, Jie Xu1,2, Charles Kim1, Xudong Wu5, Yiling Yu5, Hassane Amlal1,2, Ursula Seidler3, Jian Zuo5,
and Manoocher Soleimani1, 2,6
From 1Center on Genetics of Transport and Epithelial Biology and the Departments of Medicine2 and Pathology4, University of Cincinnati, Cincinnati, OH; 3Department of Gastroenterology,
Hepatology and Endocrinology, Hannover Medical School, Hannover, Germany; 5Department of Developmental Neurobiology, St. Jude Children's Research Hospital, Memphis, TN; 6Research
Services, Veterans Affairs Medical Center, Cincinnati, OH.Running head: Role of Glut5 in fructose absorption and fructose-induced hypertension
Address correspondence to: M. Soleimani, M.D., Department of Internal Medicine, University of Cincinnati, 231 Albert Sabin Way, MSB G259, Cincinnati, OH 45267-0585. Fax: 513 558-
4309; E-mail: [email protected] *The first two authors contributed equally.
The identity of the transporter responsible
for fructose absorption in the intestine in vivo and its potential role in fructose-induced hypertension remain speculative. Here we demonstrate that Glut5 (Slc2a5) deletion reduced fructose absorption by ~75% in the jejunum and decreased the concentration of serum fructose by ~90% relative to wild type mice on increased dietary fructose. When fed a control (60% starch) diet, Glut5 mice had normal blood pressure and displayed normal weight gain. However, whereas Glut5 mice showed enhanced
-/-
+/+
salt absorption in their jejuna in response to luminal fructose and developed systemic hypertension when fed a high fructose (60% fructose) diet for 14 weeks, Glut5 mice did not display fructose
-/-
-stimulated salt absorption in their jejuna, and they experienced a significant impairment of nutrient absorption in their intestine with accompanying hypotension as early as 3-5 days after the start of a high fructose diet. Examination of the intestinal tract of Glut5 mice fed a high-fructose diet revealed massive dilatation of the caecum and colon, consistent with severe malabsorption, along with a unique adaptive
-/-
upregulation of ion transporters. In contrast to the malabsorption of fructose, Glut5-/- mice did not exhibit an absorption defect when fed a high glucose (60% glucose) diet. We conclude that Glut5 is essential for the absorption of fructose in the intestine and plays a fundamental role in the generation of
fructose-induced hypertension. Deletion of Glut5 results in a serious nutrient absorptive defect and volume depletion only when the animals are fed a high fructose diet and is associated with compensatory adaptive up-regulation of ion-absorbing transporters in the colon.
Fructose is a monosaccharide and is one of the three most important blood sugars along with glucose and galactose (1-3). It plays an essential role in vital metabolic functions in the body, including glycolysis and gluconeogenesis (4-6). Fructose is predominantly metabolized in the liver. A high flux of fructose to the liver perturbs glucose metabolism and leads to a significantly enhanced rate of triglyceride synthesis. In addition, fructose can be metabolized in the liver to uric acid, a potent antioxidant (7, 8).
The classical model of sugar absorption indicates that Sglt1 (sodium glucose cotransporter 1) and Glut5 absorb glucose and fructose, respectively, from intestinal lumen to cytosol, and Glut2 transports both glucose and fructose from the cytosol to the blood (9-19). Glut2 has high affinity for glucose and a moderate affinity for fructose whereas Glut5 predominantly transports fructose with very low affinity for glucose (9-19; reviews in 14, 17-19). The expression of Glut5 or Glut2 in the small intestine increases in rats or mice fed a diet high in fructose or perfused with increased fructose concentration (11-14, 18, 19).
Glut2 is predominantly found on the
http://www.jbc.org/cgi/doi/10.1074/jbc.M808128200The latest version is at JBC Papers in Press. Published on December 17, 2008 as Manuscript M808128200
Copyright 2008 by The American Society for Biochemistry and Molecular Biology, Inc.
by guest on July 26, 2018http://w
ww
.jbc.org/D
ownloaded from

basolateral membrane and in the cytoplasm of enterocytes at basal state but is thought to be recruited to the apical membrane in the presence of increased glucose or fructose in the intestinal lumen (11, 19). Given the fact that both Glut5 and Glut2 can transport fructose in vitro and given the ability of Glut2 to traffic to the apical membrane, the contribution of Glut5 to the absorption of fructose in vivo and systemic fructose homeostasis remains speculative.
The marked increase in dietary fructose consumption in the form of high fructose corn syrup, a common sweetener used in the food industry, table sugar and fruits correlates with the increased incidence of Metabolic Syndrome, which is reaching an epidemic proportion in developed countries and is a major contributor to premature morbidity and mortality in our society (20-22). Increased dietary fructose intake recapitulates many aspects of metabolic syndrome, including dyslipemia, insulin resistance and hypertension in rat and mouse (23-26). Recent studies demonstrate that fructose-induced hypertension is initiated by increased absorption of salt and fructose in the intestine (27) however, the molecule(s) (Glut2, Glut5, Glut7 or Sglt1) that is (are) responsible for the absorption of fructose in the intestine remain speculative. Further, while Glut7, Glut5 and Glut2 can transport fructose in vitro, the role of Glut5 in in vivo fructose absorption remains unknown. In order to ascertain the role of Glut5 in fructose absorption in the intestine in vivo and fructose-induced hypertension, mice lacking the Glut5 gene (Glut5-/-
) were placed on either high fructose or normal diet and compared to their wild-type littermates (Glut5 ). +/+
Experimental Procedures
Animal models and experimental diets-
Glut5-/- mice were generated as described (34). Briefly, Glut5 floxed construct was generated by inserting one loxP site upstream of the predicted promoter and exon 1 and another loxP site downstream of exon 4 of the Glut5 gene which has 14 exons. After establishing germline transmission, intercrosses between Glut5floxed/+ and an ubiquitous Cre expressing line EIIA-Cre (35) resulted in offspring with the expected global deletion of the floxed exons 1-4 of Glut5 (34).
Glut5-/- mice have normal growth and are fertile. For the experiments, wild-type (Glut5+/+)
and Glut5 knockout (Glut5-/-) mice were divided into two groups. One group was fed a diet high in fructose (60% fructose) and the other group received a control diet (60% starch). Diets were custom made at Harlan Teklad (Madison, WI). In separate studies, animals were fed a diet high in glucose (60% glucose).
All mice had free access to food and water. Mice were housed 3 to 4 mice/cage, in a temperature-controlled room (72 ± 1˚F) that maintained a cycle of 12 hours dark and 12 hours light. All experimental maneuvers were performed according to protocols approved by the Animal Care Committee at The University of Cincinnati or University of Hannover. In parallel studies, Glut5+/+ mice were pair fed at 1.5 gm/day of control or high fructose diet for 5 days. Animals had free access to water. RNA Isolation and Northern Blot Hybridization- Total cellular RNA was extracted from various mouse tissues, including duodenum, jejunum, ileum, caecum, proximal and distal colon, and kidney, according to established methods, quantitated spectrophotometrically; and
stored at -80 °C. Hybridization was performed according to established protocols (36). The following DNA fragments were used as specific probes for Northern hybridization: for NHE3, a fragment encoding nucleotides 1883-2217; for DRA (Slc26a3), a 400-bp cDNA from the mouse DRA cDNA (EcoR I-EcoR I fragment); for Glut2 a fragment encoding nucleotides 64-501 (accession number NM_031197); for colonic H,K-ATPase, three pooled PCR products from rat (nucleotides 135-515, 2369-2998, and 3098-3678); and for Glut7, a fragment encoding nucleotides 1 to 1578 (accession number NM_001085529). Each Northern hybridization was performed on 4 separate samples from 4 different animals.
Expression of Glut5 and Glut2 in COS7 cells by RT-PCR- The expression of Glut5 on RNA isolated from COS7 cells was determined by RT-PCR using the following primers: ACT CTC CAG CCC TGC TCA TG (sense), and CAG CTT CAG CAC CGA GAT G (antisense), which encodes the nucleotides 132 to 817 (Genebank accession # DC642055). The expression of Glut2 was examined using the following primers: CAC TAT GCT CTG GTC CCT GTC (sense), and TCG
2
by guest on July 26, 2018http://w
ww
.jbc.org/D
ownloaded from
GTA GCT GGA AGT GGT G (antisense), which encode the nucleotides 591-1215 (Genebank accession # XM_001088382). The cycling parameters were as follows: 94oc 1 min, followed by 94oc 30s, then 62oc 30s, 68oc 1 min 35 cycles.
Luminal membrane vesicle preparation- Membrane vesicles were prepared from jejunal or proximal colon mucosa by the Mg2+ aggregation/differential centrifugation technique (37). Mucosa from three mice was pooled for each membrane preparation. Protein content was measured using bovine serum albumin as the protein standard.
Immunofluorescence labeling and immunoblot analysis- Immunofluorescence
labeling on sections from jejunum was performed as described (38, 39) using Glut5 or Glut2 antibodies in jejunum. For immunoblot analysis, microsomal membranes from the proximal colon were resolved by SDS-PAGE, membranes were blotted with anti-DRA or anti-NHE3 antibodies, and the reactions were visualized using chemiluminescence and captured on light sensitive imaging film (Kodak). Primary antibodies were polyclonal Glut5 antibodies (40), DRA antibodies (28), NHE3 antibodies, Glut2 antibodies (Chemicon International Inc, Temecula, CA) and monoclonal Glut5 antibodies (Alpha Diagnostic, San Antonio, TX).
Blood pressure measurement- Systolic blood pressure in conscious mice was measured by tail cuff using a BP-2000 (Visitech Systems). Measurements for each mouse represent mean value of three consecutive recordings performed in the last week of experiments.
Histolopathogic analysis of intestine- Microscopic analysis of hematoxylin and eosin staining of sections from duodenum, jejunum, caecum, proximal and distal colon was performed according to established methods.
Measurement of fluid (salt) absorption in jejunum- Glut5+/+ and Glut5-/- mice were anesthetized by the administration of 10 µL/g intraperitoneal (IP) haloperidol/midazolam/ fentanyl cocktail (haloperidol 12.5 mg/Kg, fentanyl 0.325 mg/Kg and midazolam 5 mg/Kg body weight). Abdomen was opened and a 10-15 cm segment from jejunum with an intact blood supply was isolated, gently flushed and then perfused (Perfusor compact, BRAUN) in vivo, as described from our laboratories (27). The
perfusate was collected in a pre-weighed 4.5 ml collecting tube. After a 30 min period, the tube was weighed again and the difference of the two was taken as the amount of fluid recovered. To examine the effect of luminal fructose, the jejunal segment was perfused with isotonic solution NaCl + fructose (130 mM NaCl + 40 mM fructose) or NaCl alone (150 mM NaCl) as control. At the end of the experiments, mice were sacrificed by cervical dislocation and length of jejunum was measured.
Fructose assay- Blood fructose concentration was measured according to established methods. Blood samples were immediately frozen in a -20˚C freezer after euthanasia. To eliminate interference from glucose in the samples, 100µl of sample (plasma or hemolyzed blood) was mixed with 100µl of saline and 0.5 U of glucose oxidase was added in 2µl (0.86 mg/ml 25 mM Tris Buffer, pH 8.1). Two hundred µl of the sample mixture was then transferred to an Eppendorf tube and 31µl of 3N-HClO4 was added and the tubes were placed in an ice bath for 15-20 min to precipitate proteins. After centrifugation (19,600 x g, 30 min, 4 oC), 140µl of the supernatant was neutralized by adding 27µl 2.5N KHCO3. Fructose was measured using an enzymatic-fluorometric procedure assaying the last step of fructose metabolism, which involves the conversion of glucose-6-phosphate and NADP to 6-phosphate gluconolactone and NADPH by glucose-6-phosphate dehydrogenase (41). Fructose concentration is determined by the subtraction of glucose prior to isomerization from total glucose at the end of the assay. All enzymes (HK, G6PDH and PGluI) were purchased from Roche Applied Science (Indianapolis, IN). Fluorescence was detected using a FL600 fluorometric plate-reader from BioTek (Winooski, VT). The assay was based on the reduction of NADP to NADPH, which was detected fluorometrically (excitation: 460 nm, emission: 530 nm). All assays were against standard series of analytical grade fructose.
Histopathological examination of intestine- Mice were euthanized, and tissues were harvested within 10 min. Tissues were fixed in Amsterdam solution and then processed and embedded in paraffin blocks using standard methods. Sections were cut and stained using hematoxylin/eosin.
3
by guest on July 26, 2018http://w
ww
.jbc.org/D
ownloaded from

Real-time quantitative PCR- The real time PCR was performed in a 7300 Sequence
Detector from Applied Biosystems. Primers and probe sets were purchased from Applied Biosystem TaqMan Gene Expression Master Mix (P/N 4369016), and include Glut 2 (Assay ID Mm00446224_m1), Glut 5 (Assay ID Mm00600311_m1), Sglt-1 (Assay ID Mm00451203_m1), and GAPDH (Assay ID Mn_99999915_g1) TaqMan Gene Expression Assays. The real time PCR was carried out in triplet in a final volume of 20 ul containing TaqMan® Universal PCR Master Mix at 10 ul, 20X TaqMan Gene Expression Master Mix at 1 ul and cDNA diluted in RNase-free Water at 9 ul. Samples were heated for 50°C 2 minutes, 95°C 10 minutes, and then for 40 cycle of 50 seconds at 95°C and 60°C 1 minute. Results were presented as cycle threshold (CT). The CT values of each transporter were individually calibrated to GAPDH. The changes in mRNA expression for Glut5, Glut2 and Sglt1 in high fructose or high glucose diet were determined relative to the respective control groups of mice on regular (control) diet after normalization to the GAPDH housekeeping gene.
Radiolabeled uptake assays- 14C-Fructose
and 14C-glucose uptake was assayed in cultured cells and in luminal membrane vesicles from jejunum according to established methods (42, 43).
Transient transfection of Glut5 in cultured cells- Cultured COS7 cells were transiently transfected with human or mouse Glut5 cDNA. Full-length human and mouse Glut5 cDNAs (Genebank accession numbers NM_003039 and NM_019741, respectively) were amplified from human and mouse small intestine RNA by RT-PCR using specific primers and subcloned into mammalian expression vector.
Statistical analysis- Descriptive statistics
were expressed as means ± SEM, with the number of experiments given in parentheses. The statistical analyses were performed using Student’s t test for unpaired data and analysis of variance for paired data. Results were considered significant at p < 0.05.
Materials- [32P]dCTP was purchased from
Perkin-Elmer Life Sciences. 14 C-Fructose and 14C-glucose were purchased from Amersham Biosciences, Piscataway, NJ. Nitrocellulose filters and other chemicals were purchased from Sigma. The RadPrime DNA labeling kit was purchased from Invitrogen.
RESULTS
Expression of Glut5 in the intestine and
kidney in Glut5+/+ and Glut5-/- mice. As shown in Fig. 1a, Glut5 mRNA expression is highly abundant in the small intestine, with lower levels in the kidney in wild-type animals. However, the expression of Glut5 was completely absent in the intestine and kidney of Glut5 null mice. Immunofluorescence labeling with Glut5 antibody demonstrated apical labeling of jejunal villi in wild-type animals but did not detect any labeling in Glut5 null mice (Fig. 1b).
14C-Fructose uptake in cultured cells and in luminal membrane vesicles from jejunum. The 10 min influx of 14C fructose into transiently transfected COS-7 cells was measured. As shown in Fig. 1c (left panel), Glut5-expressing cells demonstrated a robust 14C-fructose uptake relative to sham transfected cells. Glut5-expressing cells did not transport 14C-glucose (Fig. 1c, middle panel). The residual 14C-fructose uptake or elevated baseline 14C-glucose uptake in sham-transfected COS7 cells could be mediated via endogenous Glut2 but not Glut5, as RT-PCR experiments detected the expression of Glut2 but not Glut5 (data not shown).
To ascertain the role of Glut5 in fructose uptake in the intestine, 14 C -fructose influx was assayed in luminal membrane vesicles isolated from jejunum. 14C-Fructose uptake at 30 sec decreased by ~75% in Glut5-/- mice (p<0.05, n=4) (Fig. 1d, left panel). The 14C-glucose uptake was not significantly altered in luminal membrane vesicles isolated from small intestine of Glut5-/- ko mice (Fig. 1d, right panel).
Role of Glut5 in dietary fructose absorption. To examine the role of Glut5 in fructose absorption in the intestine, Glut5+/+ and Glut5-/- mice were fed either a high fructose (60% fructose) or a normal (60% starch) diet for 5-7 days.
Body Weight. Food intake in Glut5+/+ and
4
by guest on July 26, 2018http://w
ww
.jbc.org/D
ownloaded from
Glut5-/- mice on control diet was similar (3.11 ± 0.4 and 3.23 ± 0.6 g/day in Glut5+/+ and Glut5-/- mice, respectively; n=5, p>0.05), however, food intake in Glut5-/- mice on high fructose diet was significantly decreased relative to Glut5+/+ mice (3.43 ± 0.5 g/day in Glut5+/+ mice and 1.56 ± 0.20 g/day in Glut5-/- mice, n=5, p<0.01). These measurements represent average daily intake for the first three days of the experiments. For accurate comparison, a separate Glut5+/+ mice group was fed at a reduced rate of 1.4 ± 0.15 gm food per day/mouse, which was comparable to the food intake in Glut5-/- mice fed a high fructose diet.
As noted in Fig. 2a (left and right panels), Glut5+/+ mice remained stable with constant body weight after 5-7 days on ad lib high fructose diet relative to control diet. However, Glut5-/- mice experienced significant weight loss on high fructose diet over the same period relative to the control diet (Fig. 2a, left panel). Glut5-/- mice showed ~28% reduction in body weight on high fructose diet (Fig. 2a, left panel). The Glut5+/+ mice on restricted control or high fructose diet showed 13 and 15% reduction in their body weight, respectively, over the duration of experiment (Fig. 2a, right panel). These results indicate that Glut5-/- mice on high fructose diet demonstrate significant weight loss, far and above what can be explained on the basis of reduced food intake.
Fructose absorption. The concentration of fructose in the blood significantly increased in Glut5+/+ mice when fed an ad lib high fructose diet relative to control diet, with fructose concentration of 44 ±8 µM/dl in mice on control diet and 175 ± 19 micromole/dl in mice on high fructose diet (p<0.05, n=4) (Fig. 2b, left two bars). However, fructose concentration did not increase in Glut5-/- mice on high fructose diet relative to control diet, with concentrations of 26 ± 5 µM /dl in mice on control diet and 37 ± 6 on high fructose diet (p>0.05, n=4) (Fig. 2b, right two bars). The blood fructose concentration in Glut5+/+ mice on restricted control or high fructose intake was 29 ± 4 and 126 ± 10 µM/dl, respectively. These results demonstrate that Glut5+/+ is essential for the absorption of fructose in the intestine.
Glut5 deletion causes malabsorption in mice only when fed a diet high in fructose. We next examined the gastrointestinal tract of Glut5-/- mice
to determine the nature and mechanism of the malabsorption relative to Glut5+/+ mice.
Gross morphology of intestinal tract. Autopsy revealed that Glut5+/+ and Glut5-/- mice on control diet and Glut5+/+ mice on high fructose diet had normal looking intestines (Fig. 3a, bottom panels and left top panel). However, to our surprise, Glut5-/- mice on high fructose diet had extremely distended colon and its contents appeared to contain both fluid and gas (Fig. 3a, top right panel). All segments of the intestinal tract of Glut5−/− mice on high fructose diet were enlarged compared to those of Glut5+/+ mice (Fig. 3b). The caecum and proximal colon showed the highest degree of dilatation (Fig. 3, a and b). The cecal contents in Glut5-/- mice was significantly increased (~10-fold) as compared to Glut5+/+ mice on high fructose diet (Fig. 3c). The length of small intestine was comparable in Glut5+/+ and Glut5-/- mice on normal diet, but increased in Glut5-/- mice on high fructose diet relative to Glut5+/+ mice (Fig. 3d). Similarly, the area of caecum and length of colon were significantly increased in Glut5-/- mice on high fructose diet relative to Glut5+/+ mice (Fig. 3d). The length of small intestine and colon and area of caecum were not different in Glut5+/+ mice on ad lib or restricted high fructose diet (Fig. 3d). The stool in Glut5-/- mice on high fructose diet was not watery. It is worth mentioning that these dramatic changes occurred in only 5-7 days after the start of high fructose diet.
Regulation of Glut2 and Sglt1 in the small intestine by high fructose or high glucose diet in Glut5+/+ and Glut5-/- mice. Glut2 mRNA expression in the jejunum increased in Glut5+/+ mice fed a diet high in fructose relative to control but remained the same in Glut5-/- mice on control or high fructose diet (Fig. 4a, left panel). The mRNA expression of Glut7 remained low in Glut5-/- mice and was comparable to Glut5+/+ animals on control diet and did not change in Glut5-/- or Glut5+/+ mice on high fructose diet (data not shown). The expression of Sglt1 increased significantly in the small intestine of Glut5+/+ mice on high fructose diet (Fig. 4a. right panel) but increased mildly in Glut5-/- mice on high fructose diet relative to their littermates on control diet (Fig. 4a. right panel). Quantitative RT-PCR on RNA samples from experimental groups showed a ~70% and ~140% increase in Glut2 and Sglt1,
5
by guest on July 26, 2018http://w
ww
.jbc.org/D
ownloaded from
respectively, in Glut5+/+ mice on high fructose diet relative to control diet (Fig. 4b, left and right panels). In contrast the expression of Glut2 and Sglt1 increased by only ~10 and 30%, respectively, in Glut5-/- mice on high fructose diet relative to control diet (Fig. 4b, left and right panels).
To examine the distribution and regulation of Glut2, immunofluorescence labeling was performed in jejunum of Glut5+/+ and Glut5-/- mice on control or high fructose diet. The results are shown in Fig. 4c and demonstrate the absence of Glut2 labeling on the apical membrane of jejunal villi in Glut5+/+ mice on control diet (left top panel). Glut2 was only detected on the basolateral membrane in control animals (left top panel). In addition to the basolateral membrane, Glut2 was also detected on the apical membrane of jejunum in Glut5+/+ mice fed a diet high in fructose (Fig. 4c, right top panel). In contrast, Glut2 labeling was detected on both the apical and basolateral membrane of jejunum in Glut5-/- mice fed a control diet (Fig. 4c, left bottom panel). The apical localization of Glut2 as also evident in Glut5-/- mice fed a diet high in fructose (Fig. 4c, right bottom panel).
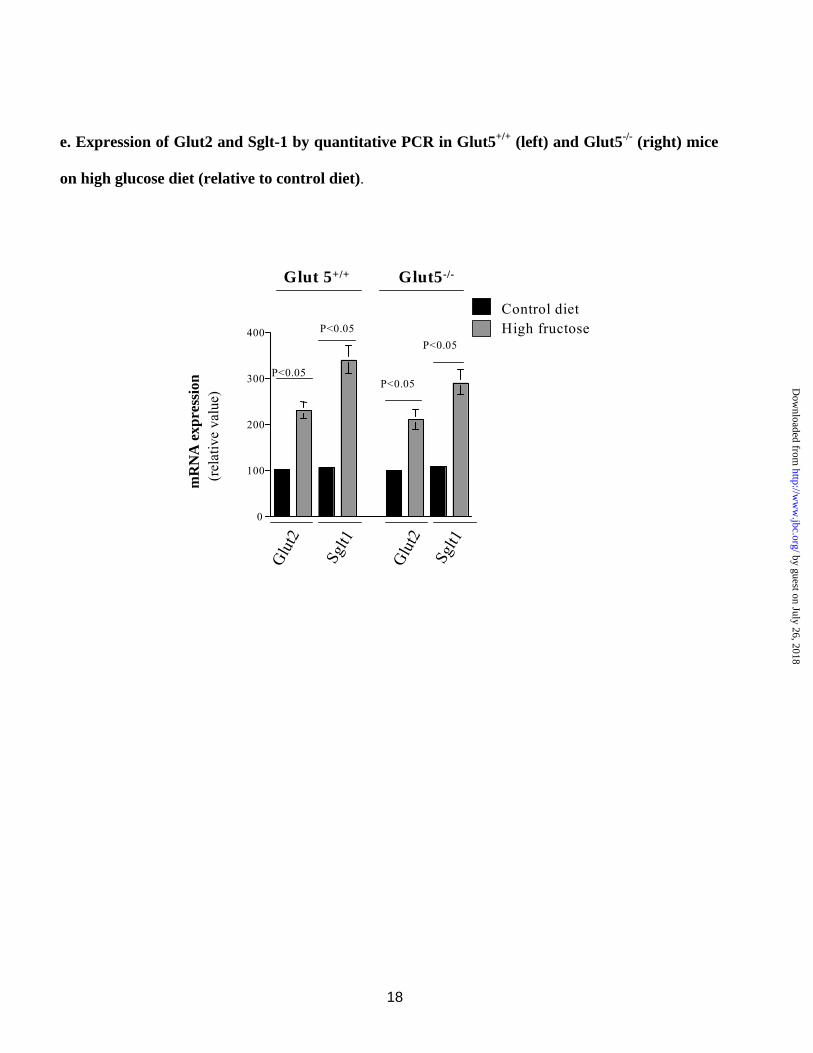
Contrary to fructose malabsorption, Glut5-/- mice displayed normal growth and weight gain relative to Glut5+/+ mice when fed a high glucose (60% glucose) diet for 7 days. Further, there was no intestinal enlargement or caecal dilatation (data not shown). Northern hybridizations demonstrated that the expression of Glut2 and Sglt1 increased significantly and comparably in Glut5+/+ and Glut5-/- mice on high glucose diet for 7 days (Fig. 4d, left and right panels).
Quantitative RT-PCR on RNA samples showed ~130 and ~240% increase in Glut2 and Sglt1, respectively, in Glut5+/+ mice on high glucose diet relative to control diet (Fig. 4e). The expression levels of Glut2 and Sglt1 increased by ~110 and ~190%, respectively, in Glut5-/- mice on high glucose diet relative to control diet (Fig. 4e).
Effect of luminal fructose on salt absorption and Glut5 expression in jejunum and fructose-induced hypertension. We next examined the effect of luminal fructose on salt absorption in
jejunum. As shown in Fig. 5a, perfusion of jejunum with 40 mM fructose in vivo resulted in a significant increase in fluid (salt) absorption in Glut5+/+ mice (p<0.05, n=4). However, fructose-stimulated salt absorption was completely absent in Glut5-/- mice jejuna (p>0.05, n=4). Interestingly, basal fluid absorption seems to be increased in jejuna of Glut5-/- mice.
Glut5+/+ mice fed a diet high in fructose for 14 weeks demonstrated significant upregulation of Glut5 expression in their jejunum, consistent with increased capacity to absorb fructose (Fig. 5b). Lastly, we show that Glut5+/+ thrived and developed systemic hypertension after 14 weeks on high fructose diet (Fig. 5c). Interestingly and contrary to Glut5+/+ mice, the blood pressure in Glut5-/- mice on high fructose diet decreased significantly several days after the start of the experiment. This occurred as early as 5 days into the course of fructose feeding (Fig. 5d). Systolic blood pressure in Glut5-/- mice on control diet was 103 ± 2 mm Hg and in Glut5+/+ mice on control or high fructose diet for 5 days was 101 ± 3 or 103 ± 3 mm Hg, respectively (p>0.05, n=5 for each group). Glut5-/- mice developed severe hypovolemic shock and died after 7 to 10 days of increased dietary fructose intake. Blood pressure in other experimental groups was normal (Fig. 5d).
Histological analysis of intestine. H and E staining revealed that epithelial cells in the caecum and proximal colon in Glut5-/- mice on high fructose diet displayed significantly distended mucosal goblet cells in their caecum and proximal colon. The histology in Glut5+/+ mice on high fructose diet appeared normal. Whether the changes in Glut5-/- mice on high fructose diet are secondary to excessive bowel fluid transport associated with hyperosmolar loading or unique to Glut5-/- mice on increased dietary fructose intake remain to be determined.
Expression of ion transporter in intestine of Glut5-/- mice on high fructose diet. Adaptive regulation of ion transporters in the colon in Glut5-/- mice on increased dietary fructose intake. Despite the dilated colon and watery luminal content in the caecum and proximal colon in Glut5-/- mice fed a high fructose diet (Fig. 3), stool was reasonably formed, strongly suggesting adaptive regulation of electrolyte-absorbing transporters in the colon. This issue was investigated. Northern hybridization demonstrated
6
by guest on July 26, 2018http://w
ww
.jbc.org/D
ownloaded from
that the expression of the apical Na+/H+ exchanger NHE3 (Slc9a3) and the Cl-/HCO3
- exchanger DRA (Slc26a3) was significantly increased in the proximal colon of Glut5-/- mice when fed a high fructose diet (Fig. 6a). The expression of NHE3 and DRA in the colon remained unchanged in Glut5+/+ mice on high fructose diet relative to control diet and was comparable to Glut5-/- mice on control diet (Fig. 6a).
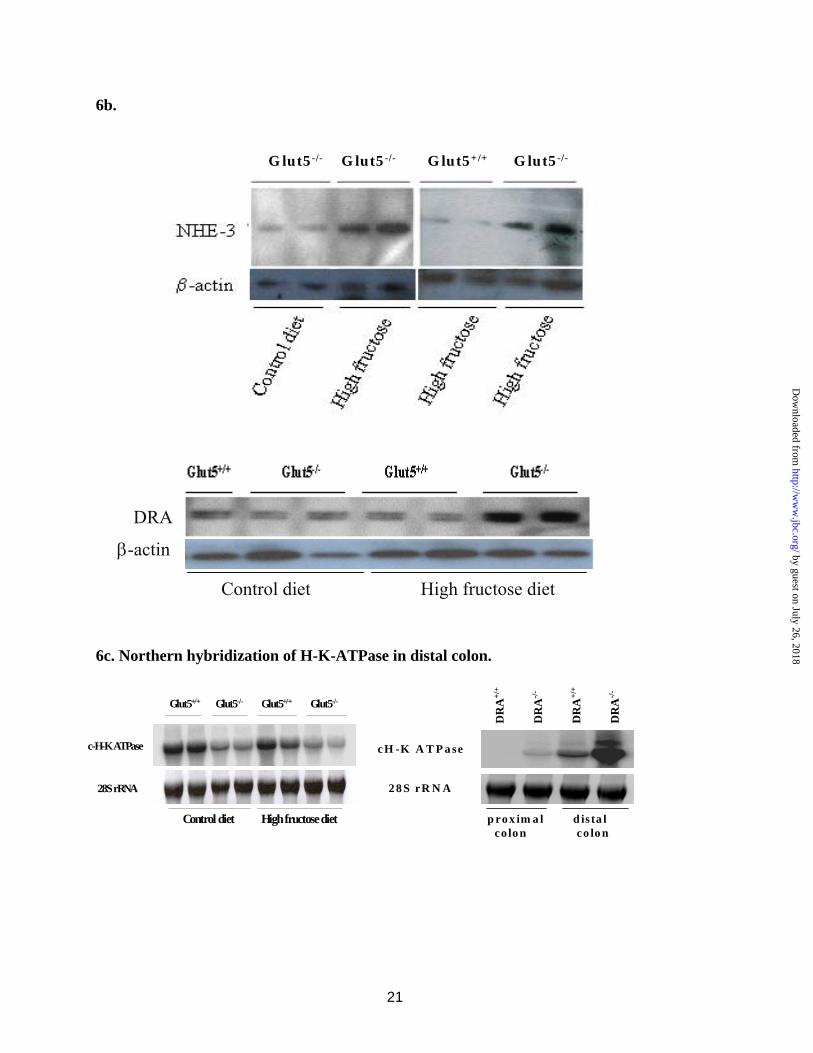
Immunoblot analysis with NHE3 and DRA antibodies on membrane proteins isolated from proximal colon of Glut5-/- and Glut5+/+ mice indicated that the abundance of NHE3 and DRA significantly increased in the proximal colon of Glut5-/- mice fed a high fructose diet relative to Glut5+/+ mice on the same diet (Fig. 6b). The abundance of NHE3 or DRA specific band, when adjusted for β-actin intensity as loading control, was increased by ~320 and ~210%, respectively, in Glut5-/- mice fed a diet high in fructose (p<0.05 vs. Glut5+/+ on high fructose or control diet and Glut5-/- mice on control diet, n=4 in each group).
The expression of NHE3 and DRA increased in the distal colon in Glut5-/- mice fed a high fructose diet as compared to Glut5+/+ mice (data not shown). Surprisingly, colonic H-K-ATPase expression did not show any upregulation in the distal colon of Glut5-/- mice on high fructose diet relative to control diet (Fig. 6c, left panel). Further, the expression of H-K-ATPase was actually decreased by 42% in Glut5-/- mice relative to Glut5+/+ mice on normal diet (Fig. 6c, left panel). This is in distinct contrast to the significant upregulation of colonic H-K-ATPase in the distal colon of DRA (Slc26a3) ko mice which have diarrhea and dilatation of colon (28 and Fig. 6c, right panel). These results indicate that Glut5-/- mice display distinct adaptive regulation of ion transporters in their colon that is unique to this animal model and different from other reported models of diarrhea or increased delivery of fluid to the large intestine.
Luminal pH in caecum and the kidney function in Glut5-/- mice on high fructose diet. The luminal pH in the caecum was similar in both groups, with the pH of 6.4 ± 0.3 in Glut5+/+ and 6.2 ± 0.4 in Glut5-/- mice (p>0.05), suggesting that the non-absorbed fructose in the small intestine was not metabolized to short chain fatty acids in the time period examined in the experiments. Glut5-/- mice on high fructose diet showed signs of
volume depletion as evident by a ~2.5 fold increase in the concentration of blood urea nitrogen (BUN) relative to Glut5-/- mice on control diet or Glut5+/+ mice on high fructose or control diet.
DISCUSSION
The present studies provide convincing evidence that Glut5 is essential for the absorption of fructose in the intestine (Figs. 1-3). Glut5 null mice displayed ~75% reduction in radiolabeled fructose uptake in luminal membranes from jejunum and showed no increase in blood fructose concentration when fed a diet high in fructose (Fig. 1). Glut5 null mice developed severe malabsorption when fed a high fructose diet, which presented as decreased nutrient absorption in the small intestine, distended caecum and colon resulting from increased delivery of nutrients to the colon, decreased vascular volume (hypovolemia), hypotension and eventually shock (Figs. 3 and 5), all hallmarks of profound fructose malabsorption. To the best of our knowledge, this is the first report of nutrient malabsorption in a genetically engineered mouse model.
Examination of the gastrointestinal tract revealed that all segments of the intestinal tract in Glut5−/− mice on high fructose diet were enlarged compared to those of Glut5+/+ mice (Fig. 3). The histological examination of the colon supported this conclusion (Results). The caecum was massively enlarged in Glut5-/- mice on high fructose diet as shown in Fig. 3, due to increased delivery of unabsorbed fluid from the small intestine. In addition to malabsorption, another contributing factor to the weight loss in Glut5-/- mice on high fructose diet is decreased food intake. However, Glut5+/+ mice on restricted high fructose diet did not develop bowel dilatation and did not display as much weight loss as Glut5-/- mice (Fig. 2), indicating that the intestinal phenotype in Glut5-/- mice on high fructose diet is not due to reduced food intake. Glut5-/- mice exhibited relatively formed stool when fed a high fructose diet and Glut5+/+ mice on control or high fructose diet and Glut5-/- mice on control diet all had formed, solid stool. Glut5-/- mice on high fructose diet displayed vascular volume depletion and reduced kidney function, as measured by BUN (blood urea nitrogen) concentration in animals on high fructose diet for 7 days.
7
by guest on July 26, 2018http://w
ww
.jbc.org/D
ownloaded from
The results of the present studies indicate that the role of Glut2 in fructose absorption in the intestine is minimal, at least under the current experimental protocols. This is supported by several lines of evidence: First, the uptake of 14C-fructose in luminal membrane vesicles from jejunum was almost abolished in Glut5-/- mice; second, the concentration of fructose in the blood did not increase in Glut5-/- mice fed a high fructose diet relative to control diet (Fig. 1). The generation of massive malabsorption in Glut5 null mice fed a diet high in fructose strongly suggests that Glut2 does not compensate for the lack of Glut5 in the intestine, specifically when it relates to the absorption of increased fructose load. This issue deserves further emphasis, as Glut2 was clearly detected on the apical membrane of the intestinal villi in Glut5-/- mice (Fig. 4c), therefore discounting any possibility of impaired Glut2-/- trafficking as the reason for fructose malabsorption. Our results further demonstrated that contrary to its essential role in fructose absorption, Glut5 does not play a significant role in glucose absorption in the intestine. This is specifically highlighted by the normal weight gain, lack of caecum and colon dilatation and appropriate upregulation of Glut2 and Sglt1 in Glut5-/- mice fed a diet high in glucose (Results).
The reduction in the food intake in Glut5-/- mice on high fructose diet relative to Glut5+/+ mice (Results) was evident from the very first day. The reason for the decreased appetite, which was specific only to fructose-containing diet and not to glucose or starch-containing diet, remains speculative. RT-CR and Northern hybridization demonstrated abundant expression of Glut5 in the tongue (data not shown). Whether the ablation of Glut5 affects the taste perception of fructose or its sweetness in the diet remains speculative and warrants investigation.
The adaptive regulation of ion transporters in the colon in Glut5-/- mice fed a high fructose diet was distinct from other reported models of diarrhea or increased delivery of fluid to the large intestine. Decreased absorption of fluid in the small intestine and its increased delivery to the
colon causes robust adaptive upregulation of colonic H-K-ATPase and ENaC in NHE3 or DRA null mice (24, 25). However, the expression of colonic H-K-ATPase was actually decreased in the distal colon of Glut5-/- mice fed a high fructose diet (Fig. 6c), despite increased delivery of fluid to the colon (Figs. 1-3). The reasons for the differential regulation of H-K-ATPase in the colon of Glut5-/- mice vs. DRA or NHE3 null mice warrant further investigation.
Metabolic syndrome, which is manifested by visceral obesity, hypertension, glucose intolerance, insulin resistance, and atherogenic dyslipidemia (20-22), is reaching epidemic proportions worldwide, with over 40 million in the United States alone. Its increased incidence correlates with marked increase in the amount of dietary fructose consumption from high fructose corn syrup (30-33). Recent studies demonstrated that fructose stimulates salt absorption in the small intestine and kidney and causes hypertension by upregulating the expression of the chloride and sodium-absorbing transporters PAT1 (Slc26a6) and NHE3 (27). The present studies demonstrate that fructose-stimulated salt absorption is abolished in Glut5-/- mice jejunum (Fig. 6) and Glut5-/- mice develop hypotension rather than hypertension when fed a diet high in fructose (Figs. 2 and 6). Taken together, these results indicate that Glut5 plays a fundamental role in the pathogenesis of fructose-induced hypertension. The basis and impact of enhanced salt absorption at basal state and in the absence of fructose in Glut5-/- jejuna (Fig. 5) remains speculative, and additional studies are needed to ascertain the significance of this finding.
In conclusion, our studies strongly suggest that Glut5 is essential for the absorption of fructose in the intestine and the generation of fructose-induced hypertension. Our results further indicate that the role of Glut2 in the absorption of fructose in the intestine from fructose-rich diets is minimal. Inhibitors of Glut5 could play an important role in the prevention of hypertension and subsequent kidney damage in fructose-induced hypertension.
8
by guest on July 26, 2018http://w
ww
.jbc.org/D
ownloaded from
REFERENCES 1. Hirabayashi, J. On the origin of elementary hexoses. (1996) Q. Rev. Biol. 71(3), 365-3802. Bollen, M., Keppens, S., and Stalmans, W. (1998) Specific features of glycogen metabolism in the
liver. Biochem. J. 336(Pt.1), 19-313. Macdonald, I. A. Carbohydrate as a nutrient in adults: range of acceptable intakes. (1999) Eur. J.
Clin. Nutr. 53Suppl 1, S101-S1064. Rumessen, J. J. Fructose and related food carbohydrates. Sources, intake, absorption, and clinical
implications. (1992) Scand. J. Gastroenterol. 27, 819-8285. Van den Berghe, G. (1994) Inborn errors of fructose metabolism. Annu. Rev. Nutr. 14, 41-58 6. Van den Berghe, G. (1996) Disorders of gluconeogenesis. J. Inherit. Metab. Dis. 19(4), 470-477
Review. 7. Hallfrisch, J. (1990) Metabolic effects of dietary fructose. F.A.S.E.B. J. 4(9), :2652-2660 8. Mayes, P. A. (1993) Intermediary metabolism of fructose. Am. J. Clin. Nutr. 58(5 Suppl), 754S-765S. 9. Kayano, T., Burant, C. F., Fukumoto, H., Gould, G. W., Fan, Y. S., Eddy, R. L., Byers, M. G., Shows,
T. B., Seino, S., and Bell, G. I. (1990) Human facilitative glucose transporters. Isolation, functional characterization, and gene localization of cDNAs encoding an isoform (GLUT5) expressed in small intestine, kidney, muscle, and adipose tissue and an unusual glucose transporter pseudogene-like sequence (GLUT6). J. Biol. Chem. 265(22), 13276-13282.
10. Rand EB, Depaoli AM, Davidson NO, Bell GI, Burant CF. (1993). Sequence, tissue distribution, and functional characterization of the rat fructose transporter GLUT5. Am. J. Physiol. 264, G1169-76.
11. Helliwell, P. A., Richardson, M., Affleck, J., and Kellett, G. L. (2000) Stimulation of fructose transport across the intestinal brush-border membrane by PMA is mediated by GLUT2 and dynamically regulated by protein kinase C. Biochem. J. 350(Pt 1), 149-154.
12. Shu, R., David, E. S., and Ferraris, R. P. (1997) Dietary fructose enhances intestinal fructose transport and GLUT5 expression in weaning rats. Am. J. Physiol. 272(3 Pt 1), G446-G453
13. Corpe, C. P., Basaleh, M. M., Affleck, J., Gould, G., Jess, T. J., and Kellett, G. L. (1996) The regulation of GLUT5 and GLUT2 activity in the adaptation of intestinal brush-border fructose transport in diabetes. Pflugers. Arch. 432(2), 192-201
14. Wright, E. M., Hirayama, B. A., and Loo, D. F. (2007) Active sugar transport in health and disease. J. Intern. Med. 261, 32-43
15. Wright, E. M., and Turk, E. (2004) The sodium/glucose cotransport family SLC5. Pflugers. Arch. 447, 510-518.
16. Merediz EF, Dyer J, Salmon KS, Shirazi-Beechey SP. (2004). Molecular characterisation of fructose transport in equine small intestine. Equine Vet. J. 36, 532-8.
17. Schürmann A. 2008. Insight into the "odd" hexose transporters GLUT3, GLUT5, and GLUT7. Am J Physiol Endocrinol Metab. 295, E225-6.
18. Douard V, Ferraris RP. (2008). Regulation of the fructose transporter GLUT5 in health and disease. Am J Physiol Endocrinol Metab. 295, E227-37. Review.
19. Kellett GL, Brot-Laroche E, Mace OJ, Leturque A. (2008). Sugar absorption in the intestine: the role of GLUT2. Annu Rev Nutr. 28, 35-54. Review.
20. Sacks FM. (2004) Metabolic syndrome: epidemiology and consequences. J. Clin. Psychiatry. 65(Suppl 18), 3-12
21. Obunai, K., Jani, S., and Dangas, G. D. (2007) Cardiovascular morbidity and mortality of the metabolic syndrome. Med. Clin. North. Am. 91(6), 1169-1184
22. Batsis, J. A., Nieto-Martinez, R. E., and Lopez-Jimenez, F. (2007) Metabolic syndrome: from global epidemiology to individualized medicine. Clin. Pharmacol. Ther. 82(5), 509-524
23. Sanchez-Lozada, L. G., Tapia, E., Jimenez, A., Bautista, P., Cristobal, M., Nepomuceno, T., Soto, V., Avila-Casado, C., Nakagawa, T., Johnson, R. J., Herrera-Acosta, J., and Franco, M. (2007) Fructose-induced metabolic syndrome is associated with glomerular hypertension and renal microvascular damage in rats. Am. J. Physiol. Renal. Physiol. 292(1), F423-F429
9
by guest on July 26, 2018http://w
ww
.jbc.org/D
ownloaded from

24. Nagai, Y., Nishio, Y., Nakamura, T., Maegawa, H., Kikkawa, R., and Kashiwagi, A. (2002) Amelioration of high fructose-induced metabolic derangements by activation of PPARalpha. Am. J. Physiol. Endocrinol. Metab. 282, E1180-E1190
25. Lee, D. H., Lee, J. U., Kang, D. G., Paek, Y. W., Chung, D. J., and Chung, M. Y. (2001) Increased vascular endothelin-1 gene expression with unaltered nitric oxide synthase levels in fructose-induced hypertensive rats. Metabolism. 50(1), 74-78
26. Higashiura, K., Ura, N., Takada, T., Agata, J., Yoshida, H., Miyazaki, Y., and Shimamoto, K. (1999) Alteration of muscle fiber composition linking to insulin resistance and hypertension in fructose-fed rats. Am. J. Hypertens. 12(6), 596-602
27. Singh, A. K., Amlal, H., Haas, P. J., Dringenberg, U., Fussell, S., Barone, S., Engelhardt, R., Zuo, J., Seidler, U., and Soleimani, M. (2008). Fructose-induced hypertension: essential role of chloride and fructose absorbing transporters PAT1 and Glut5(accepted for publication in Kidney International. .
28. Schweinfest, C. W., Spyropoulos, D. D., Henderson, K. W., Kim, J. H., Chapman, J. M., Barone, S., Worrell, R. T., Wang, Z., and Soleimani, M. (2006) Slc26a3 (dra)-deficient mice display chloride-losing diarrhea, enhanced colonic proliferation, and distinct up-regulation of ion transporters in the colon. J. Biol. Chem. 281, 37962-37971
29. Schultheis, P. J., Clarke, L. L., Meneton, P., Miller, M. L., Soleimani, M., Gawenis, L. R., Riddle, T. M., Duffy, J. J., Doetschman, T., Wang, T., Giebisch, G., Aronson, P. S., Lorenz, J. N., and Shull, G. E. (1998) Renal and intestinal absorptive defects in mice lacking the NHE3 Na+/H+ exchanger. Nat. Genet. 19(3), 282-285
30. Miller, A., and Adeli, K. (2008) Dietary fructose and the metabolic syndrome. Curr. Opin. Gastroenterol. 24(2), 204-209
31. Basciano, H., Federico, L., and Adeli, K. (2005) Fructose, insulin resistance, and metabolic dyslipidemia. Nutr. Metab. (Lond). 2(1), 5-8
32. Johnson, R. J., Segal, M. S., Sautin, Y., Nakagawa, T., Feig, D. I., Kang, D. H., Gersch, M. S., Benner, S., and Sánchez-Lozada, L. G. (2007) Potential role of sugar (fructose) in the epidemic of hypertension, obesity and the metabolic syndrome, diabetes, kidney disease, and cardiovascular disease. Am. J. Clin. Nutr. 86, 899-906
33. Elliott, S. S., Keim, N. L., Stern, J. S., Teff, K., and Havel, P. J. (2002) Fructose, weight gain, and the insulin resistance syndrome. Am. J. Clin. Nutr. 76(5), 911-922
34. Wu, X., Wang, X., Gao, J., Yu, Y., Jia, S., Zheng, J., Dallos, P., He, D. Z., Cheatham, M. and Zuo, J. (2008) Glucose transporter 5 is undetectable in outer hair cells and does not contribute to cochlear amplification. Brain. Res. 1210, 20-28
35. Lakso, M., Pichel, J. G., Gorman, J. R., Sauer, B., Okamoto, Y., Lee, E., Alt, F. W. and Westphal H. (1996) Efficient in vivo manipulation of mouse genomic sequences at the zygote stage. Proc. Natl. Acad. Sci. U. S. A. 93, 5860-5865
36. Church, G. M., and Gilbert, W. (1984) Genomic sequencing. Proc. Natl. Acad. Sci. U. S. A. 81, 1991-1995
37. Van den Berghe, N., Nieuwkoop, N. J., Vaandrager, A. B., and de Jonge, H. R. (1991) Asymmetrical distribution of G-proteins among the apical and basolateral membranes of rat enterocytes. Biochem. J. 278, 565-571.
38. Petrovic, S., Wang, Z., Ma, L., Seidler, U., Forte, J. G., Shull, G. E., and Soleimani, M. (2002) Colocalization of the apical Cl-/HCO3- exchanger PAT1 and gastric H-K-ATPase in stomach parietal cells. Am. J. Physiol. Gastrointest. Liver. Physiol. 283, G1207-G1216
39. Petrovic, S., Ju, X., Barone, S., Seidler, U., Alper, S. L., Lohi, H., Kere, J., and Soleimani, M. (2003) Identification of a basolateral Cl-/HCO3- exchanger specific to gastric parietal cells. Am. J. Physiol. Gastrointest. Liver. Physiol. 284, G1093-G1103
40. Wu, X., Currall, B., Yamashita, T., Parker, L. L., Hallworth, R., and Zuo, J. (2007) Prestin-prestin and prestin-GLUT5 interactions in HEK293T cells. Dev. Neurobiol. 67(4), 483-497
41. Campbell, J. A., Hansen, R. W., and Wilson, J. R. (1999) Cost-effective colorimetric microtitre plate enzymatic assays for sucrose, glucose and fructose in sugarcane tissue extracts. J. Sci. Food. Agric.
10
by guest on July 26, 2018http://w
ww
.jbc.org/D
ownloaded from

79, 232-236 42. Soleimani, M., Lesoine, G. A., Bergman, J. A., and McKinney, T. D. (1991) A pH modifier site
regulates activity of the Na+:HCO3- cotransporter in basolateral membranes of kidney proximal tubules. J. Clin. Invest. 88, 1135-1140
43. Soleimani, M., and Howard, R. L. (1994) Presence of chloride-formate exchange in vascular smooth muscle and cardiac cells. Circ. Res. 74, 48-55
FOOTNOTES
These studies were supported by NIH grant DK 62809 and a Merit Review Award (to MS), grants DC06471, CA21765 and ALSAC (to JZ), Grants from Deutsche Forschungsgemeinschaft Se 460/9-5 (to US) and research funds from the Hartwell Foundation (JZ) and DCI, Inc. (to MS and HA). The photographic work of Sheida Soleimani in preparing images is greatly appreciated.
FIGURE LEGENDS Fig. 1. Expression of Glut5 in small intestine and kidney of Glut+/+ and Glut5-/- mice. a. Northern hybridization. Expression of Glut5 was completely absent in small intestine and kidney of Glut5-/- mice. b. Immunofluorescence labeling. Glut5 labeling was completely absent in jejunum of Glut5-/- mice. c. Transient expression of Glut5 in cultured cells: 14C-Fructose or Glucose uptake. COS-7 cells were transiently transfected with the Glut5 cDNA. The uptake of 50 µmol 14C-fructose or 14C-glucose was measured in cultured cells at 10 minutes (left and middle panels). d. 14C-Fructose or 14C-Glucose influx in luminal membrane vesicles from jejunum. The membrane vesicles were preincubated in a solution that contained 10 mM HEPES-Tris, and 135 mM NaCl, pH 7.5. The uptake started by adding 10 µl of BBMV to 30 µl of medium containing 10 mM HEPES-Tris, 135 mM NaCl, at pH 7.5 and 50 µmol of unlabeled fructose or glucose and 14C-fructose or 14C-glucose tracer. The uptake experiments were assayed at room temperature in triplicate by the rapid filtration technique. Fig. 2. Role of Glut5 in dietary fructose absorption. a. Body weight in Glut5+/+ and Glut5-/- mice fed a high fructose or control diet. Unlike Glut5+/+ mice, Glut5-/- mice experienced significant weight loss on high fructose diet. b. Blood fructose concentration in Glut5+/+ and Glut5-/- mice fed a high fructose or control diet. Unlike Glut5+/+ mice, fructose concentration did not increase in Glut5-/- mice on high fructose diet.
Fig. 3. Glut5 deletion causes malabsorption in mice fed a high fructose diet. a. Colon dilatation in mice on high fructose. Top right panel shows Glut5-/- mice on high fructose diet had distended caecum and proximal colon. Glut5+/+ mice on high fructose (Top left) and Glut5+/+ and Glut5-/- mice on control diet (Bottom panels) display normal bowel morphology. b. Gross anatomy of intestinal tract in mice on high fructose. All segments of the intestinal tract showed enlargement and the caecum and colon showed distension in Glut5-/- mice on high fructose diet due to increased amount of luminal contents resulting from malabsorption. c. Cecal contents. The content of caecum in Glut5-/- mice is significantly increased (~10-fold) as compared to Glut5+/+ mice on high fructose diet. d. Intestinal segment size. Mean lengths (small intestine and colon) or area (caecum) of intestinal segments of Glut5+/+ and Glut5−/−
mice on control or high fructose diet. Fig. 4. Regulation of Glut2 and Sglt1 in the small intestine by high fructose or high glucose diet in Glut5 null mice. a. Northern hybridization of Glut2 and Sglt1 in the small intestine of Glut5+/+ and Glut5-/- mice on control or high fructose diet. Glut2 expression increased significantly (~80%) in jejunum of Glut5+/+ mice on high fructose diet but did not show any upregulation in Glut5-/- mice on control or high fructose diet. Sglt1 expression increased by 130% in Glut5+/+ but by only ~ 25% in Glut5-/- mice on high fructose diet relative to control diet. b. Expression of Glut2 and Sglt1 by quantitative PCR in the
11
by guest on July 26, 2018http://w
ww
.jbc.org/D
ownloaded from

small intestine of Glut5+/+ and Glut5-/- mice on control or high fructose diet. Glut2 expression increased by ~70% in jejunum of Glut5+/+ mice on high fructose diet but showed no increase in jejunum of Glut5-/- mice on high fructose diet. Sglt1 expression enhanced significantly (~140%) in jejunum of Glut5+/+ mice on high fructose diet but showed only a mild upregulation (~30%) in jejunum of Glut5-/- mice on high fructose diet. c. Immunofluorescence labeling of Glut2 in jejuna of Glut5+/+ and Glut5-/- mice on control or high fructose diet. Glut2 was localized on the basolateral membrane of intestinal villi in Glut5+/+ mice on control diet but was recruited to the apical membrane domain in Glut5+/+ mice on high fructose diet. Glut2 was detected on both the apical and basolateral membrane in Glut5-/- mice on control or high fructose diet. d. Northern hybridization of Glut2 and Sglt1 in the small intestine of Glut5+/+ and Glut5-/- mice on control or high glucose diet. Glut2 and Sglt1 expression increased significantly and comparably in jejunum of Glut5+/+ and Glut5-/- mice on high glucose diet. e. Expression of Glut2 and Sglt1 by quantitative PCR in the small intestine of Glut5+/+ and Glut5-/- mice on control or high glucose diet. Glut2 and Sglt1 expression enhanced by ~130 and 240%, respectively, in jejunum of Glut5+/+ and by ~110 and ~190%, respectively, in jejunum of Glut5-/- mice on high glucose diet.
Fig. 5. Effect of luminal fructose on salt absorption in jejunum and fructose-induced hypertension. a. Basal and fructose-induced jejunal fluid absorption in Glut5+/+ and Glut5-/- mice. Forty (40) mM fructose in the perfusate elicited ~a 40% increase in fluid absorption in Glut5+/+ mice jejunum but had no effect in Glut5-/- mice. # p < 0.01 as compared to NaCl control in Glut5+/+ mice. b. Glut5 upregulation in jejunum of Glut5+/+ mice fed a high fructose diet for 14 weeks. The expression of Glut5 increased by ~8 folds in jejunum of Glut5+/+ mice fed a high fructose diet. c. Fructose-induced hypertension in Glut5+/+ mice. Systolic blood pressure increased significantly in Glut5+/+ mice on increased dietary fructose intake for 14 weeks. d. Effect of high fructose diet on blood pressure in Glut5-/- mice. The systolic blood pressure in Glut5-/- mice was significantly decreased after 5 days on high fructose diet. Glut5-/- mice developed hypovolemic shock on high fructose diet for 7-10 days and died.
Fig. 6. Adaptive regulation of ion transporters in the proximal and distal colon in Glut5-/- mice on increased dietary fructose intake. a. Northern hybridization of NHE3 and DRA in proximal colon. The expression of NHE3 and DRA in the proximal colon increased in Glut5-/- mice on high fructose diet. Densitometric analysis of NHE3 and DRA expression is shown relative to 28S rRNA. b. Immunoblot analysis of NHE3 and DRA in proximal colon. The expression of NHE3 and DRA increased by ~320 and 210% in the proximal colon of Glut5-/- mice on high fructose diet relative to Glut5+/+ mice on the same diet. β-actin blots are shown as index of protein loading. c. Northern hybridization of colonic H-K ATPase in distal colon. The expression of H-K-ATPase decreased in Glut5-/- mice on high fructose or control diet relative to Glut5+/+ mice (left panel). However, the expression of H-K-ATPase increased in distal colon of DRA null mice (right panel).
12
by guest on July 26, 2018http://w
ww
.jbc.org/D
ownloaded from

Figures.
Fig. 1. Expression of Glut5 in small intestine and kidney of Glut+/+ and Glut5-/- mice.
a. Glut5 Northern hybridization. b. Glut5 immunofluorescence labeling in jejunum. G
lut5
+/+
Glu
t5-/-
Glu
t5-/-
Glu
t5+/
+ Glut5+/+ Glut5-/-
c. Functional expression of Glut5 in cultured cells : fructose and glucose uptake.
14C
-Fru
ctos
e (nm
oles
/mg
pro/
10 m
in)
P <0 .03
con trol G lu t50
50
100
150
control Glut5
P>0.05
14C
-Glu
cose
(nm
oles
/mg
prot
)
d. Fructose and glucose uptake in luminal membrane vesicles.
0
50
100
150
14C
-Gluc
ose i
nflux
(pmo
les/m
g pro
tein)
Glut5+/+ Glut5-/-
P>0.05
0
2 5
5 0
7 5
1 0 0
14C
-Fru
ctos
e in
flux
(pm
ole/
mg
prot
ein)
G l u t 5 + / + G l u t 5 - / -
P < 0 .0 5
13
by guest on July 26, 2018http://w
ww
.jbc.org/D
ownloaded from

Figure 2. Role of Glut5 in dietary fructose absorption.
a. Body weight in mice on high fructose diet.
. Blood fructose concentration.
-10
-7.5
-5
-2.5
0
2.5
0 3 5 7
Glut5+/+ control diet, ad lib
Glut5-/- high fructose, ad lib
Glut5-/- control diet, restricted
Glut5+/+ high fructose, restricted
Days (on control or high fructose diet)
Bod
y w
eigh
t cha
nge
(gm
)
-40
-30
-20
-10
0
10
% c
hang
e in
bod
y w
eigh
t
G lut5+/+ on control diet, ad lib
Glut5+/+ on high fructose, ad lib
Glut5+/+ on high fructose, restrictedGlut5+/+ on control, restricted
Glut5-/+-on high fructose
Glut5-/- on control diet, ad lib
b
0
50
100
150
200
Blo
od F
ruct
ose
(µM
/dl)
P<0.05
control diethigh fructose
Glut5+/+ Glut5-/-
14
by guest on July 26, 2018http://w
ww
.jbc.org/D
ownloaded from

Figure 3. Glut5 deletion causes malabsorption in mice fed a high fructose diet.
a. Colon dilatation in Glut5-/- mice b. Gross anatomy of intestinal tract in Glut5-/- and
on high fructose diet Glut5 + mice on high fructose diet
d. Intestinal segment size
+/
c. Cecal contents. .
of
Glut5+/+ Glut5-/-
Contro
l di
Hig
h fr
ucto
seC
ontr
ol
Glut5+/+ Glut5-/-
Small intestine(length cm)
Large intestine(length cm)
Caecum(area cm2)
Glut5+/+
Glut5 +
Glut5-/-
Glut5
Control diet
et
HF die
Cec
alco
nten
ts w
t/bod
y w
t (X
100
0)
+/
-/-High fructose diet
37.6 + 1.9
38.1 + 2.1
39.2 + 2.0
50.4 + 2.9*
*p<0.05 vs. others
8.5 + 0.6
8.3 + 0.8
9.1 + 0.9
14.3 + 1.2*
1.1 + 0.2
1.2 + 0.2
1.1 + 0.2
5.25 + 0.7**
*p<0.05 vs. others **p<0.01 vs. others
t control diet 36.4 +
high fructose diet
Ad lib food intake:
Glut5+/+ on restricte food intake:d
1.7 6.3 + 0.5
6.7 + 0.7
0.9 + 0.2
1.15 + 0.238.7 + 1.5
15
by guest on July 26, 2018http://w
ww
.jbc.org/D
ownloaded from

Figure. 4. Regulation of Glut2 and Sglt1 in the small intestine by high fructose or high glucose diet
a. Northern hybridization of Glut2 (left panel) and Sglt-1 expression (right panel) in animals on
high fructose diet.
b. Expression of Glut2 and Sglt-1 by quantitative PCR in Glut5+/+ (left) and Glut5-/- (right) mice
Glut 5
Glut 2
in Glut5 null mice.
28S rRNA
Glut5+/+ Glut5+/+Glut5-/- Glut5-/-
28S rRNA
Sglt-1
Control diet High fructose diet
Glut5+/+ Glut5+/+ Glut5-/-Glut5-/-
Control diet High fructose diet
on high fructose diet (relative to control diet).
0
150
200
250
300
pres
sion
(rel
ativ
e va
lue)
16
50
100
mR
NA
ex
Glut5+/+ Glut5-/-
Glut
2
Sglt1
Sglt1
Glut
2
Control dietHigh fructoseP<0.05
P<0.05
by guest on July 26, 2018http://w
ww
.jbc.org/D
ownloaded from

c. Immunofluorescence labeling of Glut2 in animals on control or high fructose diet.
d. Northern hybridizations of Glut2 (left panel) and Sglt-1 expression (right panel) in animals on
high glucose diet.
Glut 2
28S rRNA
Glut5+/+ Glut5-/-
control high glucose control high glucose
28S rRNA
Sglt-1
Control High glucose
Glut5+/+ Glut5-/-
High glucose Control
Glu
t5+/
+G
lut5
-/-Control diet High fructose diet
17
by guest on July 26, 2018http://w
ww
.jbc.org/D
ownloaded from
e. Expression of Glut2 and Sglt-1 by quantitative PCR in Glut5+/+ (left) and Glut5-/- (right) mice
on high glucose diet (relative to control diet).
0
100
mR
NA
(rel
a
200
300
400
exp
ress
ion
tive
valu
e)
Glut 5+/+ Glut5-/-Gl
ut2
Sglt1
Sglt1
Glut
2
Control dietHigh fructose
P<0.05
P<0.05
P<0.05
P<0.05
18
by guest on July 26, 2018http://w
ww
.jbc.org/D
ownloaded from
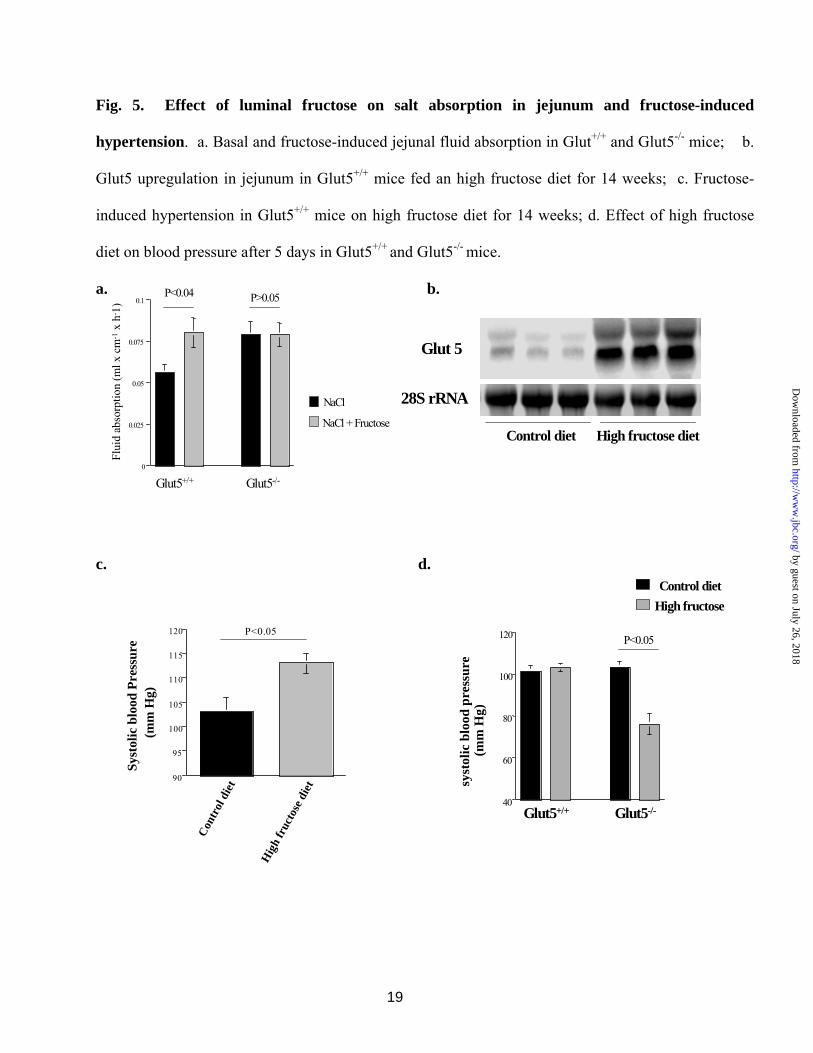
Fig. 5. Effect of luminal fructose on salt absorption in jejunum and fructose-induced
hypertension. a. Basal and fructose-induced jejunal fluid absorption in Glut+/+ and Glut5-/- mice; b.
Glut5 upregulation in jejunum in Glut5+/+ mice fed an high fructose diet for 14 weeks; c. Fructose-
induced hypertension in Glut5+/+ mice on high fructose diet for 14 weeks; d. Effect of high fructose
diet on blood pressure after 5 days in Glut5+/+ and Glut5-/- mice.
a. b.
c. d.
0
0.025
Flui
d ab
Glut5+/+ Glut5-/-
0.05
0.075
0.1
sorp
tion
(ml x
cm
-1x
h-1)
P<0.04 P>0.05
NaCl
Glut 5
28S rRNANaCl + Fructose
Control diet High fructose diet
High fructoseControl diet
90
95
100
105
110
115
120 P<0
Co
igh
frunt
rol d
iet
H
ctos
e diet
.05
Syst
olic
blo
od P
ress
ure
(mm
Hg)
40
120
60
80
100
syst
olic
blo
od p
ress
ure
(mm
Hg)
P<0.05
Glut5+/+ Glut5-/-
19
by guest on July 26, 2018http://w
ww
.jbc.org/D
ownloaded from
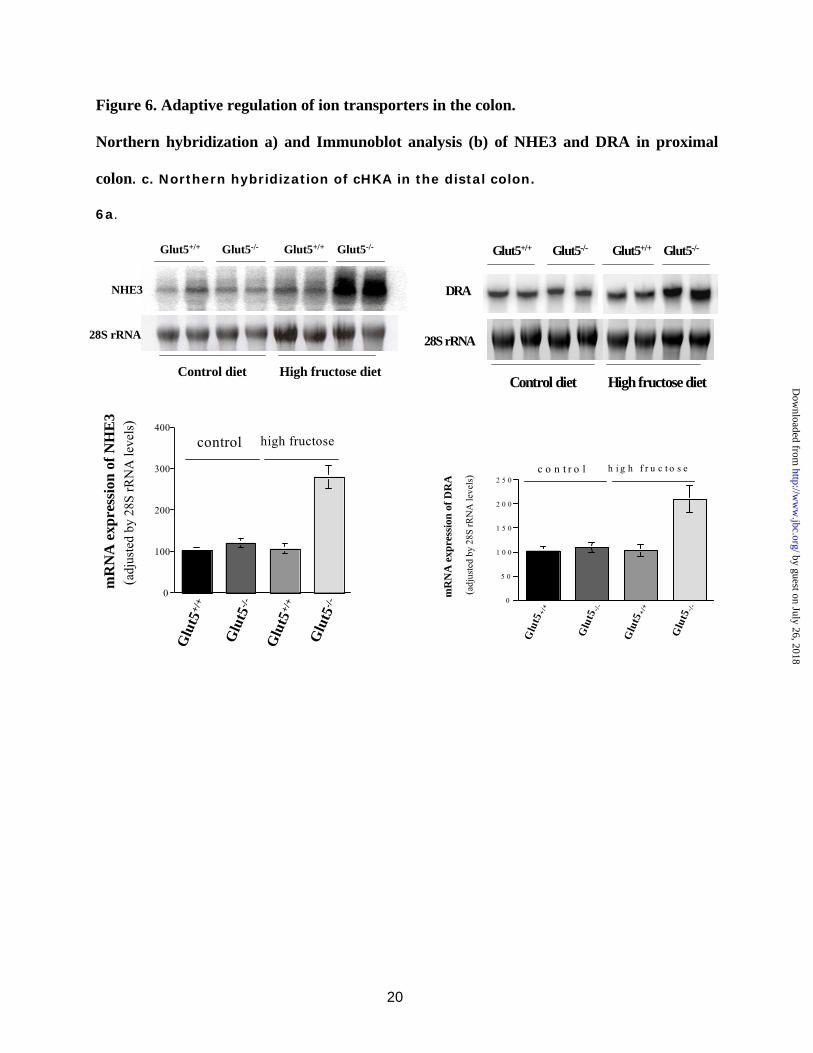
Figure 6. Adaptive regulation of ion transporters in the colon.
Northern hybridization a) and Immunoblot analysis (b) of NHE3 and DRA in proximal
colon. c. Northern hybridization of cHKA in the distal colon.
6a.
20
0
100
400
(adj
d A
ls)
200
300
ress
ion
by 2
8S rR
Nm
RN
A e
xpus
teof
NH
E3
leve high fructosecontrol
Glu
t5+/
+
Glu
t5-/-
Glu
t5+/
+
Glu
t5-/- 0
5 0
1 0 0
2 0 0
mR
NA
exp
ress
ion
of D
RA
( adj
uste
d by
28S
rle
1 5 0
2 5 0R
NA
vels
)h i g h f r u c t o s ec o n t r o l
Glu
t5+/
+
Glu
t5- / -
Glu
t5+/
+
Glu
t5- / -
NHE3
28S rRNA
Control diet High fructose diet
Glut5+/+ Glut5+/+Glut5-/- Glu -/-t5
DRA
28S rRNA
Control diet High fructose diet
Glut5+/+ Glut5+/+Glut5-/- Glut5-/-
by guest on July 26, 2018http://w
ww
.jbc.org/D
ownloaded from
6b.
c. Northe
cH -K A T P a se
2 8 S rR N A
6 rn hybridization of H-K-ATPase in distal colon.
p rox im a l d is ta l
n
DR
A+/
+
DR
A-/-
DR
A-/-
DR
A+/
+
c-H-K ATPase
28S rRNA
Control diet High fructose diet
Glut5+/+ Glut5+/+Glut5-/- Glut5-/-
DRA
β-actin
Control diet High fructose diet
G lut5-/- G lut5 -/-G lut5 -/- G lut5+/+
co lo n co lo
21
by guest on July 26, 2018http://w
ww
.jbc.org/D
ownloaded from
SoleimaniXudong Wu, Yiling Yu, Hassane Amlal, Ursula Seidler, Jian Zuo and Manoocher
Sharon Barone, Stacey L Fussell, Anurag Kumar Singh, Fred Lucas, Jie Xu, Charles Kim,generation of fructose-induced hypertension
The Slc2a5 (Glut5) is essential for the absorption of fructose in the intestine and
published online December 17, 2008J. Biol. Chem.
10.1074/jbc.M808128200Access the most updated version of this article at doi:
Alerts:
When a correction for this article is posted•
When this article is cited•
to choose from all of JBC's e-mail alertsClick here
by guest on July 26, 2018http://w
ww
.jbc.org/D
ownloaded from