The role of environment in increasing growth and reducing ...€¦ · The Role of Environment in...
120
The role of environment in increasing growth and reducing poverty in Uganda Technical Report: Final Gil Yaron and Yakobo Moyini with David Wasike, Maxwell Kabi and Mildred Barungi February 2004 ema Consult GY Associates [email protected] [email protected]
Transcript of The role of environment in increasing growth and reducing ...€¦ · The Role of Environment in...

The role of environment in increasing growth and re ducing poverty in Uganda
Technical Report: Final
Gil Yaron and Yakobo Moyini with David Wasike, Maxwell Kabi and Mildred Barungi
February 2004
ema Consult GY Associates [email protected] [email protected]
Technical Report: Final Draft
ii
Contents 1 ABBREVIATIONS AND ACRONYMS ................................................................. 6
1 Introduction.............................................................................................................. 7
2 Land degradation..................................................................................................... 9
2.1Introduction ........................................................................................................ 9 2.2 The Cost of Soil Erosion and Productivity Loss in Uganda ..............................10
2.2.1 Local evidence on soil degradation – the Slade and Weitz 1991 study.....10 2.2.2 Local evidence on soil degradation – the IFPRI 1999-2003 study.............11 2.2.3 International evidence on soil erosion .......................................................12
2.3 Land degradation and fast and sustainable economic growth and ..................14 structural transformation ........................................................................................14 2.4 Land degradation and governance and security ..............................................15 2.5 Land degradation and the increased ability of the poor to raise their incomes...............................................................................................................................16 2.6 Land degradation and quality of life of the poor ...............................................17 2.7 Policy and Performance Indicators ..................................................................17 2.8 Policy Recommendations by PEAP Pillar ........................................................19 2.9 Priorities for future research.............................................................................20
a. Fisheries.............................................................................................................21
3.4.1 Background ...............................................................................................31 3.4.2 Increasing the bargaining power of the poor .............................................31 3.4.3 Gender issues and intra-household poverty ..............................................32 3.4.4 Aquaculture and the poor ..........................................................................32
3.7 A summary of recommendations by PEAP Pillar .............................................38 4 The Forestry Sub-Sector ........................................................................................40
4.1 Introduction ......................................................................................................40 4.2 Status...............................................................................................................42 4.3 Contribution to the Ugandan Economy ............................................................43
4.3.1 Introduction................................................................................................43 4.3.2 Contribution to Gross Domestic Product ...................................................44 4.3.3 Energy Source...........................................................................................47 4.3.4 Employment ..............................................................................................50 4.3.5 Exports ......................................................................................................52 4.3.6 Public Revenue .........................................................................................53
4.4 Rural Livelihood ...............................................................................................54 4.4.1 The Value of Indirect Outputs....................................................................55
4.5 Challenges .......................................................................................................56 4.5.1 Introduction................................................................................................56 4.5.2 Fast economic growth and transformation.................................................57 4.5.3 Export trade...............................................................................................57 4.5.4 Private sector investment ..........................................................................58 4.5.5 Low revenue collection. .............................................................................58 4.5.6 Employment ..............................................................................................58 4.5.7 Lack of valuation of ecological services.....................................................59 4.5.8 Governance and security...........................................................................59 4.5.9 The management of and access to forestry resources..............................60 4.5.10 Limited district capacity and community involvement ..............................62
Technical Report: Final Draft
iii
4.5.11 Gender relations and forest resources. ...................................................62 4.5.12 Limited financial resources for forest management .................................63 4.5.13 Increasing incomes of the poor................................................................63 4.5.14 Improving quality of life of the poor..........................................................64 4.5.15 Forest degradation and clearance...........................................................64 4.5.16 Indoor air pollution ...................................................................................64
4.6 Opportunities....................................................................................................65 4.6.1 General......................................................................................................65 4.6.2 Specific Opportunities................................................................................65
4.7 Monitoring ........................................................................................................66 4.7.1 Introduction................................................................................................66 1.1.1 Indicators .............................................................................................67
5 Wetland Sub-Sector ...............................................................................................68
5.1 Introduction ......................................................................................................68 5.2 Resource Status and Values............................................................................69 5.3 Contribution to the Economy............................................................................72
5.3.1 Fast Economic Growth and Structural Transformation ..............................72 5.3.2 Domestic and International Trade in Wetland Products.............................73 5.3.3 Employment ..............................................................................................73 5.3.4 Livelihoods ................................................................................................74
5.4 Challenges .......................................................................................................76 5.4.1 Introduction................................................................................................76 5.4.2 Contribution to Market Economy ...............................................................76 5.4.3 Property rights ...........................................................................................77 5.4.4 Financing wetland management................................................................77 5.4.5 Market Development .................................................................................79 5.4.6 Sustainable Use Guidelines ......................................................................79 5.4.7 Wetland Degradation.................................................................................80
5.5 Opportunities....................................................................................................80 5.5.1 Introduction................................................................................................80 5.5.2 Export promotion .......................................................................................81 5.5.3 Innovative Financing..................................................................................81 5.5.4 Better Product Pricing................................................................................81 5.5.5 More Effective legislation...........................................................................81
5.6 Monitoring ........................................................................................................82 5.6.1 Introduction................................................................................................82 5.6.2 Indicators...................................................................................................82
6 The Wildlife and Tourism Sub-Sector .....................................................................83
6.1 Introduction ......................................................................................................83 6.2 Status...............................................................................................................83 6.3 Contribution to the Ugandan Economy ............................................................85
6.3.1 Contribution to GDP and National Income.................................................85 6.3.2 Export Earnings.........................................................................................86 6.3.3 Employment ..............................................................................................88 6.3.4 Government Revenue ...............................................................................88 6.3.5 Community Benefits ..................................................................................88
6.4 Challenges .......................................................................................................89 6.4.1 Introduction................................................................................................89 6.4.2 Limited Promotion and Marketing..............................................................89

Technical Report: Final Draft
iv
6.4.3 Insecurity ...................................................................................................90 6.4.4 High Management Costs ...........................................................................90 6.4.5 Limited Community Involvement................................................................91 6.4.6 Wildlife Costs.............................................................................................91
6.5 Opportunities....................................................................................................93 6.5.1 Introduction................................................................................................93 6.5.2 Key Actions ...............................................................................................93 6.6.1 Institution ...................................................................................................94 6.6.2 Indicators...................................................................................................95
7 Payment for environmental services...................................................................96
7.1 Background .................................................................................................96 7.2 PES and fast and sustainable economic growth ..............................................97 7.3 PES and good governance and security ..........................................................98 7.4 PES and the increased ability of the poor to raise their incomes ....................99 7.5 PES and increased quality of the life of the poor ...........................................101
8 Adjusted net savings (genuine savings) ...............................................................102
8.1 What it actually means ...................................................................................102 8.2 Uganda’s Adjusted Net Savings (ANS) rate...................................................103
9 Further priority issues ...........................................................................................105
9.1 Understanding the link between agriculture, growth and poverty reduction ...105 9.2 The need for pro-poor growth ........................................................................105 9.3 Projections of the agricultural sector’s demise ...............................................106 9.4 Growth and environmental protection ............................................................106
10 Quality Assurance for ENR economic impact data .............................................108
10.1 Background..................................................................................................108 10.2 Recommended Actions ................................................................................108
11 Communications strategy and institutional analysis ...........................................109
11.1 Background..................................................................................................109 11.2 Recommended Actions ................................................................................109
12 Conclusions and recommendations....................................................................111
12.1 Links to agriculture .......................................................................................111 12.2 Links to fisheries, forestry, wetlands and tourism.........................................111 12.3 ENR and governance and security...............................................................111
12.4 Building capacity for environmental governance ......................................112 12.5 Reforming local taxation ...........................................................................112 12.6 ENR and an increased ability of the poor to raise their incomes ..............112 12.7 ENR and the quality of life of the poor ......................................................112
13 Cross-cutting actions ..........................................................................................113
13.1 Strengthen performance indicators ..............................................................113 13.2 Priority areas for future research..................................................................113
References ..............................................................................................................114
Annex 2. Recommendations by Pillar .....................................................................120

Technical Report: Final Draft
v
This report has been prepared for the PEAP sub-committee and the ENR Sector Working Group. It has been funded by the Department for International
Development. The views expressed in this paper are those of the authors and do not necessarily reflect those of DFID or any other organisation.

Technical Report: Final Draft
6
1 ABBREVIATIONS AND ACRONYMS
CSOs Civil Society Organisations
DWD Directorate of Water Development
ENR Environment and Natural Resource
FACE Forests Absorbing Carbon dioxide Emissions
GDP Gross Domestic Product
LGDP Local Government Development Program
LSSP Land Sector Strategic Plan
MAAIF Ministry of Agriculture, Animal Industries and Fisheries
MFPED Ministry of Finance Planning and Economic Development
MTCS Medium Term Competitive Strategy
MTEF Medium Term Expenditure Framework
MSY Maximum Sustainable Yield
NAADS National Agricultural Advisory Services
NARS National Agricultural Research System
NEMA National Environment Management Authority
PEAP Poverty Eradication Action Plan
PMA Plan for the Modernisation of Agriculture
UBOS Uganda Bureau of Statistics
UIA Uganda Investment Authority
UWA Uganda Wildlife Authority
WID Wetlands Inspection Division
WSSP Wetland Sector Strategic Plan

The Role of Environment in increasing economic growth and reducing Poverty in Uganda. Technical Report: Final
Gil Yaron, Yakobo Moyini, David Wasike, Maxwell Kabi, and Mildred Barungi 7
1 Introduction The current PEAP revision provides an opportunity to consider the linkage of environment and natural resources (ENR) and poverty-reducing growth. This link with poverty reduction rests on the:
• vital role of ENR in GDP • ability of GDP growth to reach the poor • need for sustainable growth
While the contribution of the ENR sector is recognised to some extent within the PEAP, the current revision offers the chance to improve this. A review of the treatment of the environment in 40 PRSPs by the World Bank found that Uganda scored better than many countries but far lower than the best in sub-Saharan Africa. One of the reasons for this is the lack of data that allows the linkage between ENR and poverty reduction to be clearly articulated to policy makers. Other reasons may include the way existing data and arguments have been presented and an institutional structure that limits environmental messages getting through to the PEAP. In the light of the above, DFID has funded a short study to produce summary and technical papers for the PEAP sub-committee and the ENR sector working group. This document is the final technical report from this study. There is no unique definition of the ENR sector. Following international practice1, the ENR sector can be said to include:
• Natural environment • Fisheries • Forestry and wildlife • Wetlands • Water quality • Meteorology • Disaster planning and mitigation • Urban and regional development planning • Energy and minerals
The focus of ENR policy is typically on securing natural capital and regulating its use rather than commercial opportunities arising from this use. Hence, commercial agriculture, irrigation and oil refining are outside the sector but trying to ensure each uses natural capital in a sustainable way is part of the ENR remit. Rather than try and cover all possible ENR areas, we have focussed on those:
• that are particularly important for achieving the PEAP objectives; and
1 See the discussion of environmental projects by UNDP for example, http://www.undp.org.vn/undp/docs/1996/envprojs/part1.htm

The Role of Environment in increasing economic growth and reducing Poverty in Uganda. Technical Report: Final
Gil Yaron, Yakobo Moyini, David Wasike, Maxwell Kabi, and Mildred Barungi 8
• where we can demonstrate this linkage and (to a large extent) quantify it The primary purpose of this document is to support the policy conclusions and recommendations given in the summary report. While this report contains detailed technical evidence we have attempted to present this in terms of contributions to the four PEAP pillars. We also identify priority areas for future research beyond the current PEAP revision timeframe.

The Role of Environment in Increasing Economic growth and Reducing Poverty in Uganda. Technical Report- Final
Gil Yaron, Yakobo Moyini, David Wasike, Maxwell Kabi, and Mildred Barungi 9
2 Land degradation
2.1Introduction Agriculture is the backbone of Uganda’s economy and the productivity of the land is the country’s lifeblood. The following facts should be noted:
around 88% of Ugandans live in rural areas2 and are involved in agriculture; and agriculture accounts for 41% of GDP3 and employs some 80% of the population.
Sustaining or improving the productivity of agricultural land is crucial to increasing growth (PEAP pillar 1) and raising the incomes of the poor (pillar 3). The quality of life of subsistence farmers will be increased by reducing their vulnerability to climatic variation. Food security for the poor itself depends on their ability to cope with the climatic cycle. Land quality plays a direct role in this and therefore affects the quality of life of the poor (pillar 4 of the PEAP as well. Land degradation that results in a reduction in agricultural productivity and ultimately, desertification, threatens the growth required to deliver poverty reduction in the PEAP. The most prevalent form of land degradation in Uganda is soil erosion (National Environment Action Plan, 1995) and water erosion and nutrient depletion pose the greatest threat to land productivity in the country. Soil erosion is a major contributor to nutrient losses since most soil nutrients in tropical agriculture are in the top 5 to 10 cm of the soil. The National Environment Action Plan – NEAP - (1995) process identified the most seriously affected areas to include the steep slopes of Kabale, Kisoro, Bundibugyo, Mbale and Kapchorwa districts. It was also indicated that even in the relatively flat areas such as Iganga, Kamuli, Tororo and Kumi, soil erosion continues to occur at an alarming rate largely through rill and sheet erosion, leading to gradual but steadily increasing losses in soil productivity. Soil erosion is worse in the dry sub-humid and semi-arid areas of Uganda where the naturally fragile vegetation cover has been degraded by overgrazing under nomadic pastoralism. One of the causes of this soil erosion is population pressure and the sub-division of farm land held under mailo and freehold tenancy without any improvement in farming practice. Indeed, in highly populated areas such as Kabale, Kisoro and Mbale, fallow periods have become extremely short which has made soil productivity fall faster.
2 Census 2002 3 UBOS, 2002

The Role of Environment in Increasing Economic growth and Reducing Poverty in Uganda. Technical Report- Final
Gil Yaron, Yakobo Moyini, David Wasike, Maxwell Kabi, and Mildred Barungi 10
2.2 The Cost of Soil Erosion and Productivity Loss in Uganda There are three sources of information we can draw on:
1. A study of environmental issues and options in Uganda by Slade and Weitz (1991) – this is widely quoted but appears to rely mainly on secondary data
2. Recent studies in Uganda by IFPRI that combine farmer interviews and measurement of soil nutrient losses – relevant publications include Nkonya and Pender (2003) and Nkonya and Kaizzi (2003).
3. International evidence on the costs of soil erosion
2.2.1 Local evidence on soil degradation – the Slad e and Weitz 1991 study The study by Slade and Weitz (1991)4 has been extensively quoted in GoU documents and reports that mention the importance of soil erosion in Uganda. This study estimates the damage caused by soil erosion in terms of the value of lost nutrients to farmers and how much it costs to replace these with chemical fertilizers. It has proved remarkably difficult to get hold of the original working paper but the quoted5 impact is a loss of 4-12% of total GDP. As the share of agriculture in GDP has fallen from 51% to 41% over the period 1991 to 20026, the implied cost of soil erosion should presumably be 3-10% of current GDP to maintain a constant share of agricultural GDP (8-24%). This seems to have been neglected in all reports that have used the Slade and Weitz results. Nonetheless, if these figures are correct, the sums involved are highly significant. At the lower end of the scale, the annual cost of soil erosion would be some US$190m - considerably more than Uganda’s total projected tourism income for 20027. At the upper end of the scale nearly US$600m, around the total value of manufacturing output.
4 Slade, G., and Weitz, K., 1991, ‘Uganda: Environmental issues and options’, Center for Resource and Environmental Policy Research Working Paper #91-3, School of Forestry and Environmental Studies, Duke University 5 See Emerton and Muramira (1999) and NEMA (2000), for example. 6 World Bank Tables, 1991 Figures quoted in http://www.unu.edu/unupress/unupbooks/uu33pe/uu33pe0m.htm , 2001/2002 figures from Bevan et al (2003) 7 United Nations Development Programme/World Trade Organisation. 1993. Integrated Tourism Master Plan (Final Report). Republic of Uganda. UNDP/WTO UGA 91/010

The Role of Environment in Increasing Economic growth and Reducing Poverty in Uganda. Technical Report- Final
Gil Yaron, Yakobo Moyini, David Wasike, Maxwell Kabi, and Mildred Barungi 11
2.2.2 Local evidence on soil degradation – the IFPR I 1999-2003 study Nkonya and Kaizzi (2003) report that 58 households across four villages were selected for an intensive soil fertility study aimed at determining the nutrient balances of each household. The sites are located in eastern Uganda along a transect which captures variability in rainfall, soil productivity, land use intensity and agricultural potential. Thus there is a reasonable case for extrapolating to Uganda as a whole – particularly as we do so on the basis of low and high potential agricultural areas. The IFPRI study calculated that 95% of farmers were taking out more nutrients from the soil than they (and nature) were putting back. By measuring how much nitrogen (N), potassium (P) and phosphorus (K) was being mined, the study team calculated that if the loss in soil fertility was to be fixed by adding chemical fertilizer it would cost an average of 21% of the total current value of maize production (US$153 per household). Table 1 below uses the data presented by Nkonya and Kaizzi (2003) and subsequent discussions with the authors to estimate what we consider to be the most accurate value of erosion currently available for Uganda.
Table 1 - soil productivity loss in Uganda – 2001/2 figures
NPK loss (kg/ha)
Cost of NPK replacement/ Household
Population Census 2002
Households8 Agricultural Households9
% with negative nutrient balance
Total cost (million)
Low potential agricultural area
-69.95 $106.72 12612128 2,615,126 2,296,081 95% $232
High potential agricultural area
-126.20 $192.56 11787645 2,444,169 2,145,981 95% $392
Average or total
-100.01 $152.60 24399773 4,442,061 95% $625
Urbanisation rate
12.20%
Source: Nkonya and Kaizzi (2003), Nkonya pers. com and auth or’s calculation
The value of soil nutrient loss caused by soil erosion itself largely the result of poor farming practices is calculated to be approximately US$625 million each year (in 2001/2 prices). This is a truly enormous loss to Uganda – more than the entire value of manufacturing. It corresponds to an 11% share of GDP10.
8 Ratio of rural/average household size from UNHS 1999/2000 x average household size 2002 Census 9 Households x (1-average urbanisation rate from 2002 Census) 10 Using a 2001/2 GDP figure of $5.7 Bn.

The Role of Environment in Increasing Economic growth and Reducing Poverty in Uganda. Technical Report- Final
Gil Yaron, Yakobo Moyini, David Wasike, Maxwell Kabi, and Mildred Barungi 12
Moreover, this is a cost that is paid by the poor and it is paid year after year. It is equivalent to payments on a debt of US$ 4.7bn over a 20 year period11. This is a loss in Uganda’s wealth in a very real sense, as we shall see in the Section on Adjusted Net Savings. Finally, it is important to note that there is an equity issue involved in using up large amounts of precious natural capital. To the extent that crops are produced by the poor and sold to the non-poor in Uganda and abroad, nutrient mining transfers resources from the poor to the rich. As we have seen, the average small farmer in Uganda is calculated to “give away” the value of US$153 per household each year.
2.2.3 International evidence on soil erosion The first point to note is that soil erosion has been found to be the largest environmental cost in other developing countries. For example, in Ghana, Convery (1995) reports on-site soil erosion as accounting for almost two-thirds of estimated environmental damage – see Figure 1 below.
Figure 1 - Estimated environmental costs in Ghana
Source: Convery and Tutu (1990) quoted in Convery (1995), figures are in 1989-90 prices As Table 2 below shows, the economic cost of soil erosion in Africa has usually been estimated to be a much lower proportion of GDP than that found by Slade and Weitz or ourselves for Uganda. The Stocking estimates for Zimbabwe and the Convery estimates for Ghana – which use the same nutrient replacement value methodology - are a similar magnitude to the Uganda figures (as is a detailed study of the impact of soil erosion on the Nicaraguan economy by Alfsen et al (1996) which found a loss of 4-7% of GDP over a ten year period).
11 At 12% cost of capital.

The Role of Environment in Increasing Economic growth and Reducing Poverty in Uganda. Technical Report- Final
Gil Yaron, Yakobo Moyini, David Wasike, Maxwell Kabi, and Mildred Barungi 13
In the other cases, a different methodology has often been used. Rather than value the replacement cost of the nutrients that have been lost, researchers have estimated the loss in crop production value that results.
Table 2 - international evidence on the value of so il erosion
As subsistence grown maize is the typical crop it is not surprising that the value of lost production is lower than the cost of chemical fertilizer to replace lost nutrients. The difficulty with estimating the agricultural productivity loss from soil erosion is that it depends on the specific soil type, slope, vegetation cover and crop being grown. As Tengberg and Stocking (1997) demonstrate, this results in a dramatic variation in maize yield declines in Eastern Africa – halving in two or ten years depending on the mix of soil type and vegetation cover. The current data available for Uganda does not permit the calculation of a reliable estimate of agricultural production loss from soil erosion. Even if it did, there is an argument to say that valuing lost productivity in terms of subsistence maize production

The Role of Environment in Increasing Economic growth and Reducing Poverty in Uganda. Technical Report- Final
Gil Yaron, Yakobo Moyini, David Wasike, Maxwell Kabi, and Mildred Barungi 14
understates the economic opportunity cost. Using chemical fertilizer costs to calculate the cost of replacing lost nutrients reflects the financial cost of sustaining on-site productivity for farmers that use chemical fertilizer. Very few Ugandan small farmers currently do so although the PMA has a vision of much greater fertilizer use in future. Hence this is a measure of potential value rather than current financial cost. 2.3 Land degradation and fast and sustainable econo mic growth and structural transformation While Pender et al (2001) and Sserunkuuma et al (2001) report survey evidence from Uganda that indicates low and declining yields of food crops, the actual loss in agricultural productivity as a result of land degradation in Uganda is not known and we have used on-site nutrient losses as a proxy for this. What we do know is that economic growth projections are based on increasing agricultural productivity and hence land degradation is a direct threat to achieving economic growth. CGE analysis of Uganda’s Agriculture by Dorosh, El-Said and Lofgren (2002) illustrates the impact of changes in agricultural total factor productivity (TFP) across the economy. A decline in crop productivity from soil erosion not only hurts farmers but raises commodity prices for urban households (making them effectively poorer) and lowers returns to capital (as demand for non-agricultural commodities falls). Research currently underway by IFPRI should provide an estimate of crop yield losses from soil erosion in Uganda (based on plot level data and computer simulation). This will be available in mid-200412. It will be particularly useful to link these results with the CGE model used by Dorosh et al (2002) to quantify the negative impact this will have on growth. In the meantime, household and plot level surveys conducted with 451 households across 107 communities in Uganda provide some extremely useful information on interventions that increase agricultural productivity and reduce soil erosion. The success of NAADs is threatened by the step-by-step approach to yield enhancing technologies that farmers appear to have. Nkonya and Pender (2003) find that farmers typically adopt improved seeds (which are relatively familiar to them) without adopting fertilizers or farming practices to raise soil fertility (as these are unfamiliar and carry some costs). However, the package as a whole needs to be adopted to generate sustainable growth and this is a message that NAADs needs to get across. The findings of Nkonya and Pender (2003) also challenge some of the assumptions implicit in the PMA. Improving market access by itself simply increases the opportunity for increased short-run production that depletes the soil. Fertilizer use does not rise anything like as fast as market access improves and access itself does not encourage the uptake of farming practices to improve soil fertility. A demand driven approach is not
12 E. Nkonya pers.com.

The Role of Environment in Increasing Economic growth and Reducing Poverty in Uganda. Technical Report- Final
Gil Yaron, Yakobo Moyini, David Wasike, Maxwell Kabi, and Mildred Barungi 15
going to solve this problem as the demand for advice to reverse yield declines will only arise when the situation is too far advanced to make use of easy wins or investments that take some years to produce results. An interesting finding from the survey data is that NGOs are relatively successful in helping farmers to change farming practices to reduce soil erosion (but not increase income) while more traditional agricultural extension and training raise the value of crop production (but have little impact on soil erosion). The challenge facing NAADs is to combine these delivery mechanisms to produce sustainable growth. Finally, it is important to note that land degradation is a problem for the ASARECA Region, and there is considerable regional experience in developing farming techniques to minimise soil erosion and maximise yields. Both Kawanda Agricultural Research Institute and Makerere University - Department of Soil Science are involved in the regional Soil and Water Management Network. The challenge is to communicate relevant lessons to farmers – a central idea of the PMA – and it will be necessary to get practical implementation of these regional lessons within the PMA.
2.4 Land degradation and governance and security One of the established causes of conflict is increased competition over declining natural resources. Hence in certain circumstances, land degradation can have a direct impact on governance and security. In general, however, the link is between poor levels of governance and land degradation. Yaron and Brett (2002) drawing on NRSP-funded research note that environmental policy in Ghana is rarely implemented at the village level. If this is to change it is going to be necessary to build capacity within district authorities to monitor and enforce environmental regulation13. Our discussion of forestry and fisheries in Uganda, reaches similar conclusions and the view that similar weaknesses in decentralized governance apply widely in the ENR Sector is supported by Ellis and Bahiigwa (2001) and EDA et al. (2003). This suggests that legislative measures to limit soil erosion that require monitoring and enforcement at a local level are unlikely to succeed with current levels of local capacity. An issue that affects both land degradation and governance is local agricultural taxation (see Box 1 below). The current local taxation system tends to discourage the use of purchased inputs as farmers have to pay a high share of marketed crop value in transactions costs. Given the problems identified in Box 1, reform of local taxation could potentially lower the costs paid by farmers bring crops to market and increase the tax revenue taken by government. However, as we have seen in the previous sub-section, increasing the returns to small-scale commercial agriculture (from improved market access, for example) has typically led to increased nutrient mining rather than fertilizer use to increase sustainable yields. This highlights the vital importance of using NAADs and other tools within the PMA to deliver a holistic package that helps farmers to increase the sustainable return to agriculture. Encouraging fertilizer use and farming 13 Conclusions of DFID, NRSP project R7577
The Role of Environment in Increasing Economic growth and Reducing Poverty in Uganda. Technical Report- Final
Gil Yaron, Yakobo Moyini, David Wasike, Maxwell Kabi, and Mildred Barungi 16
practices to maintain soil health should form part of this package and will require coordinated interventions by government and NGOs under the PMA.
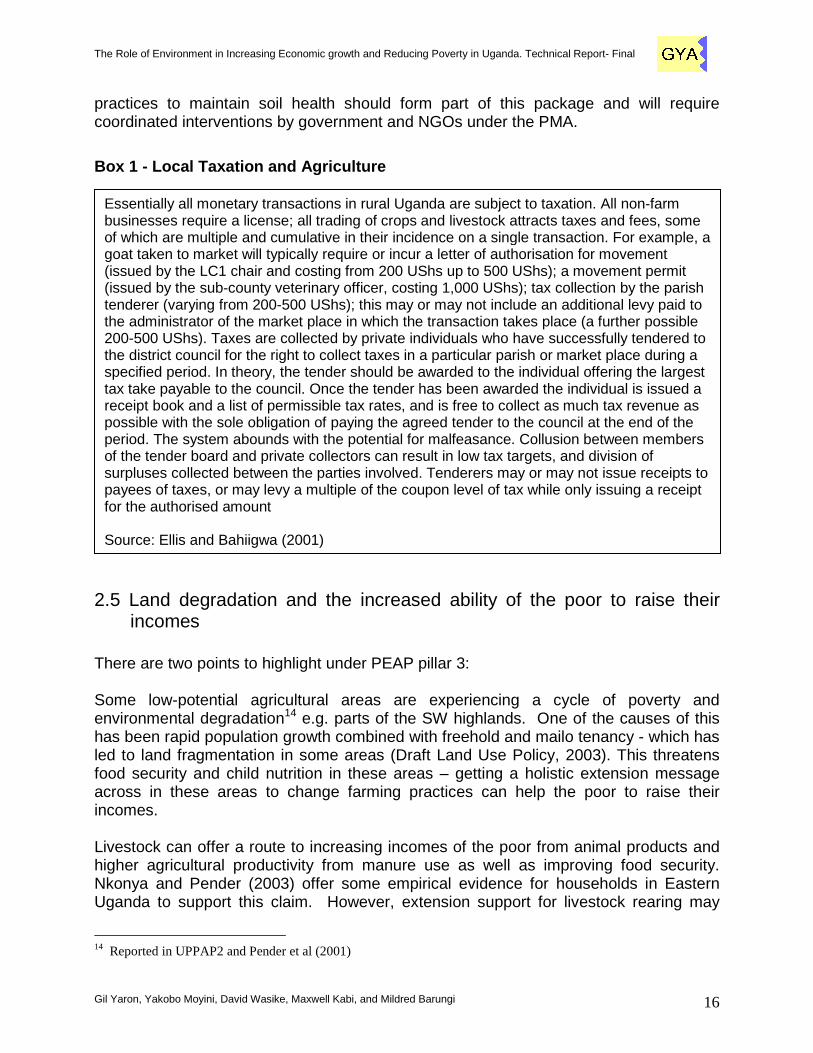
Box 1 - Local Taxation and Agriculture
2.5 Land degradation and the increased ability of the poor to raise their incomes
There are two points to highlight under PEAP pillar 3: Some low-potential agricultural areas are experiencing a cycle of poverty and environmental degradation14 e.g. parts of the SW highlands. One of the causes of this has been rapid population growth combined with freehold and mailo tenancy - which has led to land fragmentation in some areas (Draft Land Use Policy, 2003). This threatens food security and child nutrition in these areas – getting a holistic extension message across in these areas to change farming practices can help the poor to raise their incomes. Livestock can offer a route to increasing incomes of the poor from animal products and higher agricultural productivity from manure use as well as improving food security. Nkonya and Pender (2003) offer some empirical evidence for households in Eastern Uganda to support this claim. However, extension support for livestock rearing may
14 Reported in UPPAP2 and Pender et al (2001)
Essentially all monetary transactions in rural Uganda are subject to taxation. All non-farm businesses require a license; all trading of crops and livestock attracts taxes and fees, some of which are multiple and cumulative in their incidence on a single transaction. For example, a goat taken to market will typically require or incur a letter of authorisation for movement (issued by the LC1 chair and costing from 200 UShs up to 500 UShs); a movement permit (issued by the sub-county veterinary officer, costing 1,000 UShs); tax collection by the parish tenderer (varying from 200-500 UShs); this may or may not include an additional levy paid to the administrator of the market place in which the transaction takes place (a further possible 200-500 UShs). Taxes are collected by private individuals who have successfully tendered to the district council for the right to collect taxes in a particular parish or market place during a specified period. In theory, the tender should be awarded to the individual offering the largest tax take payable to the council. Once the tender has been awarded the individual is issued a receipt book and a list of permissible tax rates, and is free to collect as much tax revenue as possible with the sole obligation of paying the agreed tender to the council at the end of the period. The system abounds with the potential for malfeasance. Collusion between members of the tender board and private collectors can result in low tax targets, and division of surpluses collected between the parties involved. Tenderers may or may not issue receipts to payees of taxes, or may levy a multiple of the coupon level of tax while only issuing a receipt for the authorised amount Source: Ellis and Bahiigwa (2001)

The Role of Environment in Increasing Economic growth and Reducing Poverty in Uganda. Technical Report- Final
Gil Yaron, Yakobo Moyini, David Wasike, Maxwell Kabi, and Mildred Barungi 17
benefit larger owners rather than the poor and large numbers of small stock (in particular) can undermine sustainable agriculture in sensitive areas. The environmental dimension in this discussion needs to be brought out more clearly in the PMA.
2.6 Land degradation and quality of life of the poor There is considerable qualitative evidence that the poor depend particularly on natural resources – see UPPAP2 for example – and that vulnerability to drought or flood is closely related to land degradation. The current IFPRI research and the agricultural census will allow this linkage to be examined in more detail.
2.7 Policy and Performance Indicators The draft land use policy states that impacts will be measured against set performance indicators modelled around the following:
• Sustainable use of land resources
• Maintenance of adequate strategic resources such as forests, wetlands,
and protected areas.
• Contribution of sustainable land use to job creation and poverty
reduction.
• Coordination of planning, policy implementation and legal reforms in all
sectors related to land use.
• Integration of gender concerns in the general land use planning in the
country.
Deriving appropriate indicators (SMART and cost-effective) to meet these targets should be a high priority of the Government. NEMA (2002) proposed a set of land-related indicators reproduced in Figure 2 below. None of these were subsequently included in those recommended for poverty monitoring. However, given the overwhelming importance of land degradation we believe that some key land-use indicators should form part of regular poverty monitoring in Uganda.

The Role of Environment in Increasing Economic growth and Reducing Poverty in Uganda. Technical Report- Final
Gil Yaron, Yakobo Moyini, David Wasike, Maxwell Kabi, and Mildred Barungi 18
Figure 2 – NEMA’s Proposed Land Indicators DRIVING FORCE STATE RESPONSE • Population density in
fragile/mountainous areas (⇔ or �)
• Number of households cultivating fragile river banks and lakeshores (�)
• % of the population cultivating 1ha or less of land (⇔ or �, or tend to desirable?)
• area of degraded wetland as % of total wetland area (note: substitute for area of wetlands in PMS)
• % of hh applying soil conservation (�)
As we have noted in other Sections of this study, stakeholders from the ENR Sector will need to develop a set of performance indicators that meet best practice criteria. All we can do here is suggest some potential core indicators and data sources to monitor them. We suggest considering:
1. % of farming households cultivating <=0.5ha and <=1 ha of land – data from the UNHS could be used to monitor this. While it is notoriously difficult to get accurate farm sizes from respondents, all we need farmers to do is identify whether they fall into these categories. The proposed agricultural census should provide accurate data on farm sizes but this is too infrequent for regular monitoring.
2. % of farming households using practices likely to r educe soil erosion – in
this case it is easier to monitor outputs (farming practices) than outcomes (soil erosion). Regular survey information (perhaps from an agriculture module of the UNHS) could be used to identify this at a national level. However, this indicator would actually be more useful at a sub-county level as soil erosion problems are often highly localised. It may only be possible to pick this up with the agricultural census.
The Role of Environment in Increasing Economic growth and Reducing Poverty in Uganda. Technical Report- Final
Gil Yaron, Yakobo Moyini, David Wasike, Maxwell Kabi, and Mildred Barungi 19
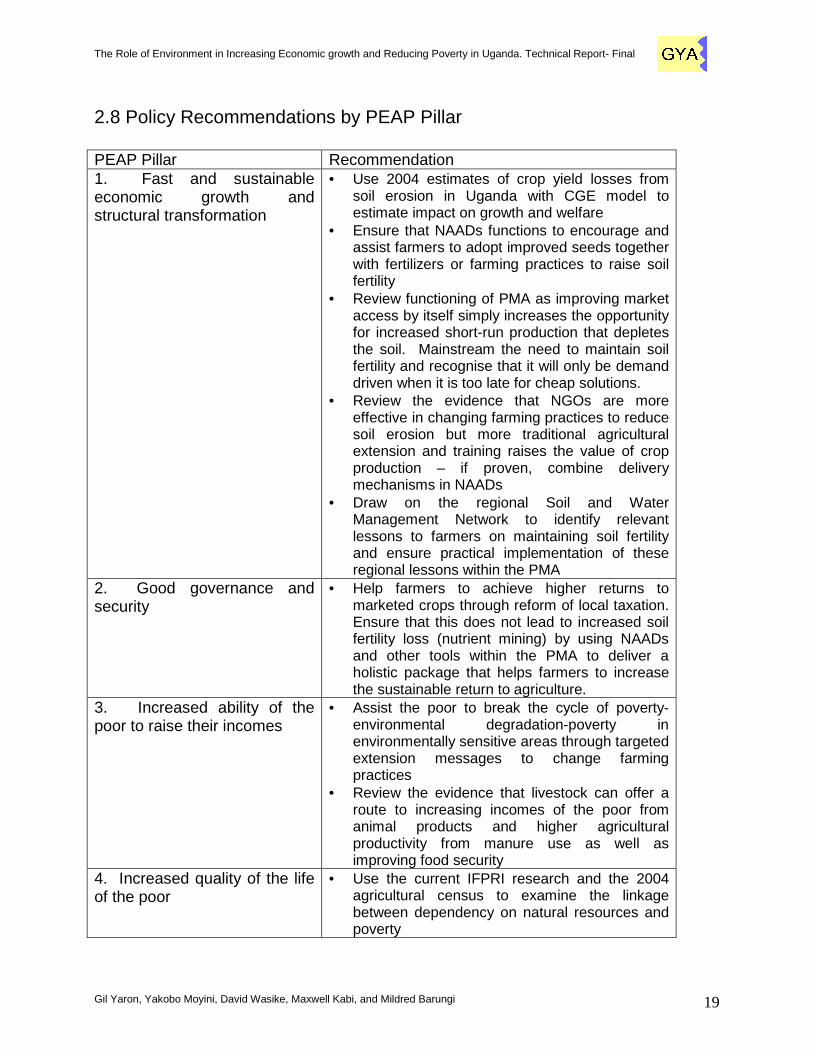
2.8 Policy Recommendations by PEAP Pillar PEAP Pillar Recommendation 1. Fast and sustainable economic growth and structural transformation
• Use 2004 estimates of crop yield losses from soil erosion in Uganda with CGE model to estimate impact on growth and welfare
• Ensure that NAADs functions to encourage and assist farmers to adopt improved seeds together with fertilizers or farming practices to raise soil fertility
• Review functioning of PMA as improving market access by itself simply increases the opportunity for increased short-run production that depletes the soil. Mainstream the need to maintain soil fertility and recognise that it will only be demand driven when it is too late for cheap solutions.
• Review the evidence that NGOs are more effective in changing farming practices to reduce soil erosion but more traditional agricultural extension and training raises the value of crop production – if proven, combine delivery mechanisms in NAADs
• Draw on the regional Soil and Water Management Network to identify relevant lessons to farmers on maintaining soil fertility and ensure practical implementation of these regional lessons within the PMA
2. Good governance and security
• Help farmers to achieve higher returns to marketed crops through reform of local taxation. Ensure that this does not lead to increased soil fertility loss (nutrient mining) by using NAADs and other tools within the PMA to deliver a holistic package that helps farmers to increase the sustainable return to agriculture.
3. Increased ability of the poor to raise their incomes
• Assist the poor to break the cycle of poverty- environmental degradation-poverty in environmentally sensitive areas through targeted extension messages to change farming practices
• Review the evidence that livestock can offer a route to increasing incomes of the poor from animal products and higher agricultural productivity from manure use as well as improving food security
4. Increased quality of the life of the poor
• Use the current IFPRI research and the 2004 agricultural census to examine the linkage between dependency on natural resources and poverty

The Role of Environment in Increasing Economic growth and Reducing Poverty in Uganda. Technical Report- Final
Gil Yaron, Yakobo Moyini, David Wasike, Maxwell Kabi, and Mildred Barungi 20
2.9 Priorities for future research
• Draw on existing regional and national research to identify changes in farming practices that provide yield increases to poor farmers and reduce soil nutrient losses
• Undertake pilot studies to see how existing NGO (soil erosion) and government (yield increase) projects can be brought together
• Develop appropriate performance indicators and data source
The Role of Environment in Increasing Economic growth and Reducing Poverty in Uganda. Technical Report- Final
Gil Yaron, Yakobo Moyini, David Wasike, Maxwell Kabi, and Mildred Barungi 21
a. Fisheries 3.1 Introduction Fisheries in Uganda relate directly to each pillar of the PEAP. If used wisely, fisheries will make a significant contribution to:
1. Fast and sustainable economic growth and structural transformation 2. Good governance and security 3. Increased ability of the poor to raise their incomes 4. Increased quality of the life of the poor
This section of the report provides the evidence for these linkages. 3.2 Fisheries, fast and sustainable economic growth and structural
transformation 3.2.1 The current contribution of the fisheries sub -sector Uganda’s fisheries currently directly employ around 500,000 people (Keizire, 2001). Of this, around 100,000 are defined as fishers and a further 400,000 as secondary and tertiary workers. Export earnings from fisheries have increased dramatically over the past decade from US$1.4 million in 1990 to US$85.8 million in 2002 (see Figure 3 below). Fish exports were Uganda’s most important export industry in 2002 and will vie with coffee for the top position in 2003. Much of the benefit to the economy is derived from the capture fisheries in Lakes Victoria and Kyogo which together account for almost 90 % of the catch. The contribution of other lakes is not fully known. Lakes Albert, Edward and George are presently recorded as producing less than 12 % of the total production. The indication is that these lakes also provide considerable potential for the sector15.
15 See Banks (2003)

The Role of Environment in Increasing Economic growth and Reducing Poverty in Uganda. Technical Report- Final
Gil Yaron, Yakobo Moyini, David Wasike, Maxwell Kabi, and Mildred Barungi 22
Figure 3 - The value of Uganda's fish exports
0102030405060708090
US$m
1990 1998 2002
Source: Banks (2003), Keizire (2003) There is a strong case for arguing that the contribution of fisheries to the national economy is not currently reflected in the official GDP statistics or in the PEAP. Fisheries are reported as contributing 2.2% to total GDP16 – the financial value of goods and services produced in Uganda. However, Emerton and Muramira (1999) argue that the official statistics fail to:
• use market prices to value the fish catch; and • include the value of the catch from minor lakes and rivers
In light of this, Banks (2003) quantifies the catch value from all main sources and estimates the value added in transport, trading and processing. This is summarised in Table 3 below. Combining this data with UBOS GDP data (at current factor prices) for 2001/2 implies that fisheries contribute 5.8% of GDP17 18.
16 UBOS 17 http://www.ubos.org gives 2001/2 GDP as 9,352 Bn Ugsh at current factor prices 18 Banks actually calculates a 12.5% share of GDP using, what appears to be, an erroneous GDP figure.

The Role of Environment in Increasing Economic growth and Reducing Poverty in Uganda. Technical Report- Final
Gil Yaron, Yakobo Moyini, David Wasike, Maxwell Kabi, and Mildred Barungi 23
Table 3 – The contribution of fisheries to GDP in 2 002
Bn Ugsh US$M % fisheries GDP Fisher sales Lake Victoria 276.3 153.5 51.0 Other Lakes 97.1 54.0 17.9 Aquaculture 0 0 0 Value added Transporters 40.7 22.6 7.5 Boat traders 67.6 37.6 12.4 Shore processors 28.7 15.9 5.3 Export processors 30.9 17.1 5.6 Total fisheries GDP 541.3 300.7 100.0 Source: Banks (2003) Appendix 2 Having identified that fisheries already contribute far more to the national economy than is currently recognised, we now ask:
• What opportunities are there to contribute to growth in future? • What constraints threaten this growth?
3.2.2 Opportunities for growth
Aquaculture Aquaculture currently accounts for less than 1% of all Uganda’s fish production19. Nonetheless, it is the main option available to meet the estimated 90,000 tons/year of extra fish per year that will be required to meet the needs of a growing population as well as maintaining exports in ten years’ time20. Fish stocking of reservoirs is a new national initiative actively promoted by DFR with the aim of increasing fish production as well as increasing livelihood options in rural areas, increasing incomes of resource users and improving food security and nutrition. This intervention is currently being funded by the Strategic Export Initiative (Stratex). At least 28 reservoirs and small lakes have been identified for stocking and 20 have already been stocked with 3 million fish fingerlings21. This type of culture-based fisheries may eventually provide in the order of 10,000 tonnes of additional fish production. In order to be sustainable, economic viability needs to be demonstrated and the technique mainstreamed into government programmes (for common property fisheries) and transferred to the private sector (where access is privately controlled).
19 Banks (2003) estimates 2,360 tons from aquaculture and 287,089 tons total production. 20 Rick Gregory pers. communication. 21 MAAIF (2002)

The Role of Environment in Increasing Economic growth and Reducing Poverty in Uganda. Technical Report- Final
Gil Yaron, Yakobo Moyini, David Wasike, Maxwell Kabi, and Mildred Barungi 24
Another “easy-win” is the ingenious scheme demonstrated by the Fisheries Resource Research Institute (FIRRI) and DFR to encourage urban or peri-urban fish-farming using poultry processing waste. In general, however, large commercial fish farms that use existing lakes, rivers and wetlands offer the greatest potential to increase fish production and, especially, fish production for export. Using this as an instrument for sustainable growth is not going to be easy and there are real dangers for existing artisanal fisheries. The international experience to date certainly suggests a precautionary approach22. All we can do in this report is to flag up some issues that the GoU should address before promoting this option.
• How will transparent and effective EIAs be carried out for new fish farming sites in
Uganda? • A tax on kg/fish produced is likely to be the best means of extracting the resource
rent from commercial fish farms (and it is proportional to environmental damage) but how will the appropriate level of this tax be negotiated?
• Herbivorous tilapia is likely to be a much more environmentally friendly species for caged fish farming than carnivorous Nile perch but the export market is currently for Nile perch.
• Fish cage technology is modular and scaleable and potentially could be the basis of out grower schemes in fisher communities – but this has not been tested or proven to our knowledge.
• The impact on the poor of alternative commercialisation options for the cheap “mukene” fish (Rastrineobola argentea) they currently consume. In addition to the potential as feedstock for Nile Perch export farming23, Nsimbe-Bulega, Kankwasa and Keizire (2003) illustrate the considerable potential this fish has for processing and direct sales for local and regional consumption.
Capture fisheries There are two broad approaches that provide opportunities for growth within the capture fisheries sub-sector. The first is to raise the productivity of existing exploited fish stocks through some form of management intervention. The second is to develop new fisheries based on under-exploited stocks. The first option provides by far the greatest single opportunity in Uganda. Improved productivity reflected in increased fisheries catch, value and employment can be achieved in a variety of ways on different lakes and for different fish species, but all are dependent on the underpinning establishment of a co-management approach using new legally empowered community Beach Management Units (BMUs).
22 “The Promise of a Blue revolution”, The Economist 7/8/03 - http://www.economist.com/business/displayStory.cfm?story_id=1974103 23 Commercial Tilapia farming in cages or ponds, is also likely to increase demand for Mukene as this will use formulated feeds that will have around 20% fish meal in them.
The Role of Environment in Increasing Economic growth and Reducing Poverty in Uganda. Technical Report- Final
Gil Yaron, Yakobo Moyini, David Wasike, Maxwell Kabi, and Mildred Barungi 25
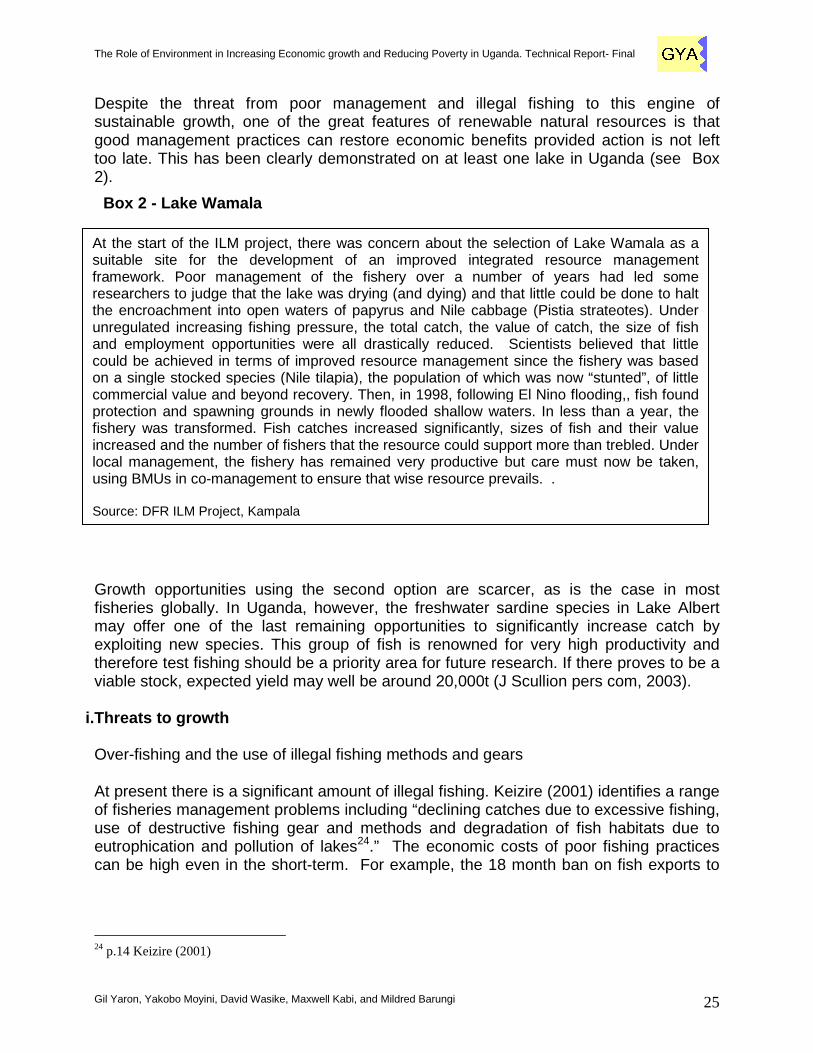
At the start of the ILM project, there was concern about the selection of Lake Wamala as a suitable site for the development of an improved integrated resource management framework. Poor management of the fishery over a number of years had led some researchers to judge that the lake was drying (and dying) and that little could be done to halt the encroachment into open waters of papyrus and Nile cabbage (Pistia strateotes). Under unregulated increasing fishing pressure, the total catch, the value of catch, the size of fish and employment opportunities were all drastically reduced. Scientists believed that little could be achieved in terms of improved resource management since the fishery was based on a single stocked species (Nile tilapia), the population of which was now “stunted”, of little commercial value and beyond recovery. Then, in 1998, following El Nino flooding,, fish found protection and spawning grounds in newly flooded shallow waters. In less than a year, the fishery was transformed. Fish catches increased significantly, sizes of fish and their value increased and the number of fishers that the resource could support more than trebled. Under local management, the fishery has remained very productive but care must now be taken, using BMUs in co-management to ensure that wise resource prevails. . Source: DFR ILM Project, Kampala
Despite the threat from poor management and illegal fishing to this engine of sustainable growth, one of the great features of renewable natural resources is that good management practices can restore economic benefits provided action is not left too late. This has been clearly demonstrated on at least one lake in Uganda (see Box 2).
Box 2 - Lake Wamala
Growth opportunities using the second option are scarcer, as is the case in most fisheries globally. In Uganda, however, the freshwater sardine species in Lake Albert may offer one of the last remaining opportunities to significantly increase catch by exploiting new species. This group of fish is renowned for very high productivity and therefore test fishing should be a priority area for future research. If there proves to be a viable stock, expected yield may well be around 20,000t (J Scullion pers com, 2003).
i.Threats to growth
Over-fishing and the use of illegal fishing methods and gears At present there is a significant amount of illegal fishing. Keizire (2001) identifies a range of fisheries management problems including “declining catches due to excessive fishing, use of destructive fishing gear and methods and degradation of fish habitats due to eutrophication and pollution of lakes24.” The economic costs of poor fishing practices can be high even in the short-term. For example, the 18 month ban on fish exports to
24 p.14 Keizire (2001)

The Role of Environment in Increasing Economic growth and Reducing Poverty in Uganda. Technical Report- Final
Gil Yaron, Yakobo Moyini, David Wasike, Maxwell Kabi, and Mildred Barungi 26
the European Union for failing to comply with international standards is estimated by MFPED to have cost US$30 million in lost exports25. Illegal domestic and international fish trade Banks (2003) estimates that as much as 21% of the fish caught in Uganda is being illegally transported abroad. This implies an enormous cost to the Government of Uganda and the local communities that are entitled to a share of resource rents. Using the data in Table 3 we can see that with a catch value of some US$42 million, more than US$4 million is lost in value added from local processing alone. It is very likely that at least another US$4 million of potential resource rent is also lost through illegal exports each year26. Failure to capture and wisely use resource rents Keizire (2001) reviewing the international literature notes that potential economic rents in fisheries typically range from 10-60% of the gross value of landings. From Table 3 we have the gross value of landings in Uganda as at least US$200 million. Hence, potential rents should be at least US$20 million and quite possibly as high as or higher than US$100 million annually. In contrast, the tax take from fisheries has been minimal leading Norconsult (2002) to conclude that “In Uganda, although, as has been described, fishing is still artisanal in nature, it is clear that fishing, fish processing and marketing are very profitable businesses that are presently operating virtually tax free” p98. Sustainable growth is threatened by the failure to capture resource rents from fisheries and to use these to effectively regulate and manage the sector. These rents are also required to provide vital infrastructure at landing sites that currently is lacking. Underlying causes of problems The causes of the current problems relating to fish capture and trade have been identified in a number of studies27 and include:
• Inadequate involvement of local fisheries stakeholders in fisheries planning and
management (UPPAP2 report) • Inadequate policy and legal frameworks for managing and developing the sub-
sector • Inadequate system of collecting fisheries information for planning and
management purposes • Insufficient understanding by central policy makers of the significance of fisheries
to national poverty reduction and economic growth
25 ibid 26 Resource rents from fisheries internationally are 20-60% of the catch value and a significant proportion of potential rents will be lost to Uganda if processing is undertaken abroad. 27 Norconsult (2002), Keizire (2001)

The Role of Environment in Increasing Economic growth and Reducing Poverty in Uganda. Technical Report- Final
Gil Yaron, Yakobo Moyini, David Wasike, Maxwell Kabi, and Mildred Barungi 27
• Insufficient understanding by local governments of the significance of fisheries and the need for well planned resource management
• An inefficient system for collecting fish catch and marketing licence fees The underlying problems have resulted in the following adverse outcomes:
• Inadequate management and regulatory capacity - at both national and local levels
• Inadequate central government budget allocation to the fisheries sector • Inadequate reinvestment of revenue into fisheries management by local
governments • Inadequate service provision in terms of infrastructure and public service support
at fish landing sites 3.2.4 New Developments to address underlying proble ms Fortunately, the 2003 National Fisheries Policy and 2003 Fisheries Sector Strategic Plan now at least provide a framework to address these issues. Significant institutional and policy changes are underway and the Beach Management Unit (BMU) approach together with a revised legal framework offer considerable potential. There is no doubt that a great deal of capacity building will be needed to allow the BMUs to fulfil this potential. Moreover, the GoU continues to face the challenge of replacing the current licensing system and strengthening local governance (discussed in more detail in Section 3.3 below). 3.3 Fisheries, good governance and security 3.3.1 Fisheries taxation We have already seen that the government has failed to effectively capture resource rents from fisheries sub-sector and what has been captured has not been used to strengthen management or infrastructure in the sub-sector. At the central government level, there are two main fiscal instruments: the industrial processing license and the health inspection certificate. There are currently proposals to put a 3% levy (cess) on fish exports to generate rents that would run the affairs of the fisheries sub-sector. In terms of governance, however, the key issue for fisheries is likely to be local fisheries taxation. Districts’ own independent revenues from fisheries come from the graduated tax (the main source), tendering fish landing and market dues (second most important), licences and other permits. Graduated tax is collected by the sub-counties. Fishing boat landing fees and market dues are collected by tenderers who are contracted on a quarterly or annual basis to operate at markets and landing sites. Fishing licences and permits are collected by local government officers, usually fisheries staff.

The Role of Environment in Increasing Economic growth and Reducing Poverty in Uganda. Technical Report- Final
Gil Yaron, Yakobo Moyini, David Wasike, Maxwell Kabi, and Mildred Barungi 28
In addition to formal taxes, Bahiigwa, Mugambe and Keizire (2003) note there are also many informal charges made when fishing boats land their catch. These charges are usually in the form of fish taken from each boat, or occasionally in cash. Many of these charges operated under fish landing site committees. These are groups formed, under government encouragement, and composed of the more powerful boat owners and fish traders at fish landings. Other charges are also made illegally by local fisheries staff.
Box 3 – levels of licence fees are very low
Inefficiencies in the local taxation system result in:
• Very low revenues for local and central government (see Box 3) • Taxation revenues could and should be used to improve local infrastructure,
lowering costs for fisheries businesses as well as management of the fisheries resource. Public expenditure, local businesses and local communities can win from improving local fisheries taxation.
• Opportunities to manipulate the current system for personal and political purposes. While fisheries provides the source of rents for these activities, the failure of local taxation at the district and sub-county level that is demonstrated in the tendering system, for example, undermines governance at these levels more generally.
The daily dues exacted by tenderers at landing sites are derisory in relation to the value of the fish. For instance a charge of Shs.1000 on a boat landing 50 Nile Perch weighing approximately 2 kg and upward each, represents Shs10 per kg or 1% assuming an average price of Shs.1000 per kg and less when the price is higher. While the dues imposed on lorries are much more substantial than that on fish landed, nevertheless it is not also specifically related to the value or quantity of fish. A lorry carrying 10 tonnes for instance (i.e. fish valued at Shs.14,000,000) pays approximately Shs.100,000 in various dues at the landing site i.e.0.7%. Source: Norconsult (2002)
The Role of Environment in Increasing Economic growth and Reducing Poverty in Uganda. Technical Report- Final
Gil Yaron, Yakobo Moyini, David Wasike, Maxwell Kabi, and Mildred Barungi 29
Tendering produces particular problems. In theory the system should be efficient. The tender holder is obliged to pay the local government a monthly sum fixed by his/her bid for the tender, in return for the right to collect specific taxes on behalf of the local government. Collection in excess of the value bid is the tender holder’s profits while collection less than the bid results in a loss to the tender holder. In practice, Wilson, Keizire and Brown (2002) and Norconsult (2002) identify lack of information and transparency in awarding of tenders, failure to set appropriate reserve prices and requiring sub counties to manage tender holders without any input into their selection. With this in mind, the proposal by Bahiigwa, Mugambe and Keizire (2003) for the BMU to collect taxation as well as regulate must be very carefully considered as it increases the incentive for local elites to capture the BMU. One study on this issue (as well as general international practice) has concluded that regulation and taxation functions should be separate28. Nonetheless there is a recognised need to reform the current system and the GoU will need to review the experience of local CPR resource rent taxation in other countries to identify the best options. What is clear from studies undertaken on lakes George, Kyoga and Victoria, is that there is sufficient revenue leakage to outside the fisheries sector in the form of tenderers' profits that could be used to fund local fisheries management. 3.3.2 Empowering local people and local institution al coordination MAAIF (2003) note that a key feature of the new fisheries co-management approach is the formation of legally empowered community Beach Management Units (BMUs) at fish landing sites for fisheries planning and management. BMUs will explicitly involve women and the poor in decision-making structures and processes to ensure their interests are included in the management and sustainable use of the resources, thereby reducing the vulnerability of poorer stakeholders within fisherfolk communities. BMUs will also play a role in development planning, with the aim of improving facilities, and environmental management. BMUs can also serve as the entry point through which HIV/AIDS awareness raising and support initiatives can be effectively channelled. Around 500-700 BMUs are in the process of being formed, covering 1000 landing sites, with nearly 300,000 members. BMUs offer an institutional framework to allow inter-sectoral planning at the local level. This is important because many of the environmental factors that adversely influence the health and sustainability of inland fisheries resources arise from outside the aquatic system, often in the catchment itself. For example, fishing communities often need to take an interest in the forestation of catchment areas to limit siltation and, sometimes, to ensure wood is available for smoking fish. As Bahiigwa, Mugambe and Keizire (2003) note, the BMU law provides for collaboration and association with other BMUs to form higher level BMUs and association with lake wide management organisations. The first such totally Uganda lake wide management body has been established on Lake George and is known as the Lake George Basin
28 Wilson, Keizire and Brown (2002)

The Role of Environment in Increasing Economic growth and Reducing Poverty in Uganda. Technical Report- Final
Gil Yaron, Yakobo Moyini, David Wasike, Maxwell Kabi, and Mildred Barungi 30
Integrated Management Organization (LAGBIMO). A similar organisation will be formed on Lake Kyoga in early 2004 and known as the Lake Kyoga Integrated Management Organization (LAKIMO). These new institutional arrangements together with the proposed reform of the Fisheries Department into an autonomous Authority offer a real opportunity to empower local communities and link them to work closely with local governments in the integrated co-management of natural resources.

The Role of Environment in Increasing Economic growth and Reducing Poverty in Uganda. Technical Report- Final
Gil Yaron, Yakobo Moyini, David Wasike, Maxwell Kabi, and Mildred Barungi 31
3.4 Fisheries and the increased ability of the poor to raise their incomes
3.4.1 Background MAAIF (2003) estimates suggest that more than 1,000,000 livelihoods depend on fisheries and a majority of the 300,000 community members targeted by BMUs will be poor. The evidence produced by the participatory analysis in six fishing communities as part of UPPAP2 indicates both high levels of absolute poverty within fishing communities and significant differences between those working as crew in boats, those owning boats and those involved in fish trading.
3.4.2 Increasing the bargaining power of the poor As noted in the discussion above, there are a number of actions and policy reforms – on tax and infrastructure spending - that can increase the returns to local communities as a whole from fisheries. We already know from Table 3 that around two-thirds of the total value added from fisheries goes to the catching sector. This mainly gets distributed between those who own boats and licences and those labouring as fishers. So a highly pertinent issue is how much of this revenue actually makes its way to the poor? While we do not have empirical evidence to answer this, we do know that a high proportion of fishers are poor and that the creation of BMUs as an inclusive institution to mediate access to a common property resource (CPR) may well increase the relative bargaining power of the poor and hence their share of the revenues that are generated from fisheries. There is some international experience to backup this cautiously optimistic view. The evidence from inland fisheries in Bangladesh is that capacity building in consensus building methodologies for CPR use (with the support of NGOs) can have large pay-offs to the poor. There is considerable scope to build on the DFID-funded international research in this area29. Actually making this happen will require the kind of “joined-up” support from government and NGOs that the PMA is supposed to provide. Fisheries will have to be mainstreamed into the PMA and linked to the National Agricultural Advisory Delivery Services (NAADs) – a vehicle of the PMA designed to provide publicly funded, privately delivered demand-driven advisory services to farmers and fishers for this to happen. The new National Fisheries Policy presented to Cabinet in 2003 highlights the need to link directly with NAADs and the sector has established a NAADS/Fisheries Taskforce, but much remains to be done.
29 See NRSP project R8103, for example, at www.nrsp.co.uk

The Role of Environment in Increasing Economic growth and Reducing Poverty in Uganda. Technical Report- Final
Gil Yaron, Yakobo Moyini, David Wasike, Maxwell Kabi, and Mildred Barungi 32
3.4.3 Gender issues and intra-household poverty There are important gender issues in the empowerment of local communities to reduce poverty through sustainable fishing. Women need adequate representation and decision making power in BMUs to ensure that this new system delivers benefits to the community as a whole. Box 4 in the following Section also illustrates how women in fishing communities are particularly dependent on natural resources to secure family livelihoods. Gender issues will also need to be recognised if aquaculture - that uses women’s labour to produce cash that may not be accessible by women - is to produce effective poverty reduction for all members of the household. We would also highlight the importance of increasing the number of female boat owners as a means of improving the effectiveness of fishing in reducing intra-household poverty. Currently, survey evidence shows that many (male) boat owners do not actually fish.
3.4.4 Aquaculture and the poor Aquaculture was identified as a major opportunity for generating economic growth from fisheries. Given the capital requirements of large-scale caged fisheries, the poor will not find it easy to raise their incomes directly from commercial aquaculture. However, there is considerable scope for small-scale production as well – provided the necessary extension advice is available. Once again, this highlights the critical importance of integrating fisheries within the PMA and NAADs. This will require a clear understanding of the key issues governing fisheries management. The key areas that need focus are given in Annex 1. It is also worth mentioning the potential for aquaculture out-grower schemes30. This may be a way for individual households to effectively participate in large-scale commercial caged fisheries. One possibility would be for the GoU to restrict cage aquaculture to certain areas by only allowing cages to be set up at “public cage mooring facilities”. This would function in the same way as fish only being able to be brought ashore at legal landing sites. As well as preventing unregulated development, this could encourage small out-growers to become involved as they would not have to invest so heavily in infrastructure. Pilot work with BMUs and interested commercial producers will be needed to validate this idea. 3.5 Fisheries and an increased quality of the life of the poor UPPAP2 provides a number of case studies that illustrate the dependence of the poor on the natural environment and the vicious circle of poverty-environmental degradation-deeper poverty that can arise. The vital importance of natural resources to fishing communities is well illustrated by the UPPAP2 case study of Katunguru B parish in Bushenyi District (see Box 4).
30 We are grateful to Rick Gregory, DFID Aquaculture adviser for the suggestions in this sub-section.

The Role of Environment in Increasing Economic growth and Reducing Poverty in Uganda. Technical Report- Final
Gil Yaron, Yakobo Moyini, David Wasike, Maxwell Kabi, and Mildred Barungi 33
In this case study, poor management of natural capital has led to increased poverty. Yet evidence from many fishing communities also suggests that fish provide vital protein and micro-nutrients in the diet of the poor that are likely to be missing in equally poor agrarian communities31. It is certainly the case that capture fisheries contribute significantly to food security in the 20 districts adjacent to the major water bodies32. As nutrition is a key determinant of infant mortality, fish consumption also helps in this area. Research is needed to confirm this. There is likely to be a growing demand for cheap fish currently consumed by the poor. Nile perch aquaculture, poultry feed and the export of high value species will raise domestic demand for Mukene – currently consumed by the poor. This will tend to offset some of the benefits this group will obtain from the increasing commercialisation of the fisheries sector. It will be important to monitor how the outcome of this process is affecting the poor. In the short-term it would also be useful to undertake a CGE analysis of this process to identify what share of fish catch, transport and processing is required to offset price rise effects. 3.6 Performance indicators Table 4 below summarised the ENR Sector Goals, Targets and Indicators proposed by MAAIF for the PEAP revision. This is a powerful tool for planning the activities and securing the outputs necessary to deliver the specified targets and goals. In order to monitor progress against these targets it will be necessary to regularly monitor output and intermediate outcome indicators. This is an area where some further thought and discussion could be very useful. Following the recent support to the water
31 Discussions with Jim Scullion and Fiona Nunan, ILM project. 32 Banks (2003)
Over-fishing in Katunguru B has followed the use of undersized nets and the use of a “tycoon” technique to scare all fish in an area into the nets. As fish catches have declined, women who used to earn a living from smoking and selling fish have had to find new livelihoods. They still rely on natural resources, this time harvesting and weaving papyrus from local wetlands although the returns are low and this is thought to have disrupted fish breeding. After the closure of the Pelican fishing plant, people increased local fish smoking. Unfortunately, there was no system for using local forest resources sustainably and all the acacia trees on the communities land have now been cleared. Moreover, the loss of fishing income has led to a collapse of many local small businesses run by women. Increasing poverty has led to the practice of forced marriages for young girls. Source: UPPAP2 (2003), Bushenyi District Report
Box 4 – Increasing poverty with over-fishing

The Role of Environment in Increasing Economic growth and Reducing Poverty in Uganda. Technical Report- Final
Gil Yaron, Yakobo Moyini, David Wasike, Maxwell Kabi, and Mildred Barungi 34
sector in Uganda to improve performance monitoring33, the ENR sector should seek assistance to define:
1. Indicators that are SMART34 and that best capture the levels of performance that need to be measured
2. Which sources of existing information are best suited to monitor these indicators 3. What are the most cost-effective means of filling the data gaps 4. Which institutional arrangements (UBOS surveys etc) will deliver this 5. How can performance against a range of indicators best be summarised and
presented to stakeholders? In terms of the fisheries sub-sector, there is some question as to how feasible it is to collect data on the functioning of each BMU. It is also not clear how we should measure “operating effectively”. This makes it difficult to monitor the “number of BMUs operating effectively and committee members trained (by gender)” – Output indicator 1. Likewise, the “Number of lake management organisations operating effectively”. It is also not clear how “HIV/AIDS programme support to a BMU” should be defined – the level of support may vary from effectively zero to very meaningful. These are simply examples that illustrate the task that is faced and, as Box 5 indicates, many international organisations have struggled with similar issues.One option to consider is whether BMUs can demonstrate that they are functioning effectively by their actions- allowing this outcome to be monitored. We would suggest that the “number of BMUs that supply data in the required format on fish catches ” could be an example of this kind of indicator.
33 DFID-funded support provided by WEDC, Delta, GY Associates and Reev Consult 34 Specific – aim for clear rather than vague targets; Measurable – do not try and measure something you have no way of measuring and use data that is available at an acceptable cost; Achievable – targets should be challenging but attainable; Realistic - performance measures need to relate to project outputs and be relevant; and Time-bound – say “by when” you expect results and measure changes over time.

The Role of Environment in Increasing Economic growth and Reducing Poverty in Uganda. Technical Report- Final
Gil Yaron, Yakobo Moyini, David Wasike, Maxwell Kabi, and Mildred Barungi 35
Box 5 - A non-SMART indicator
The initial attempt by the UN to define civil and political rights in the CCA indicator framework is recognised by the agencies concerned as flawed. Leete (1999) notes that the following is an example of why the civil and political rights indicators in the CCA Indicator Framework need to be revisited. One of the indicators under the administration of justice is:
CONFERENCE GOAL
TARGET
INDICATOR
Fair administration of justice (World Conference on Human Rights)
Effective legislative framework, law enforcement, prosecutions, legal profession, and fair trials in conformity with international standards
- Recognition in law of guarantees for an independent and impartial judiciary and fair trial
Since law and practice are often different, a better indicator would be “the average length of time between detention and the case coming to court” because this is a quantitative indicator that would provide a clear figure for further examination.
Another weak indicator is “the extent to which there is an independent judiciary.” This question is too vague for statisticians and would imply some sort of subjective judgement on the part of the user. It was therefore suggested that universal, quantitative indicators that can be interpreted in a relatively straightforward way should be identified. Source: R. Leete (1999)

The Role of Environment in Increasing Economic growth and Reducing Poverty in Uganda. Technical Report- Final
Gil Yaron, Yakobo Moyini, David Wasike, Maxwell Kabi, and Mildred Barungi 36
Table 4 - PEAP Indicators for Fisheries Proposed by MAAIF
Goal Target Monitoring Indicators Input Process Output Intermediate
Outcome Impact
Establish, and build the capacity of, a nationwide network of at least 700 BMUs for fisheries co-management to improve productivity and livelihoods through sustainable use and management of aquatic resources
PAF funding committed Funding secured
Capacity building programme developed and implemented Strategies to reduce incidence and impact of HIV/AIDS developed and implemented
Number of BMUs operating effectively and committee members trained (by gender) Number of BMUs with HIV/AIDS programme support
Increased fish catch and value Reduced incidence of, and impacts from, HIV/AIDS within fisheries communities
Improved livelihoods, including income, for poor fisheries stakeholders Improved livelihoods for poor fisheries stakeholders
Lake management organisations established and operational on the 5 major lakes for integrated and sustainable management and improved livelihoods
Funding secured to support establishment and operations
Costed integrated lake management plans
Number of lake management organisations operating effectively
Increased fish catch and value
Improved livelihoods, including income, for poor fisheries stakeholders
Poverty in fisheries communities eradicated and the sector contribution to national economic growth maximised
Improved infrastructure for landing sites
Funding secured Landing sites where facilities are poor identified and prioritised
Number of landing sites with feeder roads, water supplies and sanitation, and fish handling and marketing facilities for quality assurance
Post-harvest fish loss reduced Disease incidence from poor environmental conditions amongst landing site communities reduced
Increased income from fish exports Improved livelihoods, including income, for poor fisheries stakeholders

The Role of Environment in Increasing Economic growth and Reducing Poverty in Uganda. Technical Report- Final
Gil Yaron, Yakobo Moyini, David Wasike, Maxwell Kabi, and Mildred Barungi 37
Effective MCS programme developed and implemented by national government and co-management institutions
Funding secured MCS programme developed
Number of patrols Reduced illegalities and improved fish catch and value
Increased income from fish exports Improved livelihoods, including income, for poor fisheries stakeholders
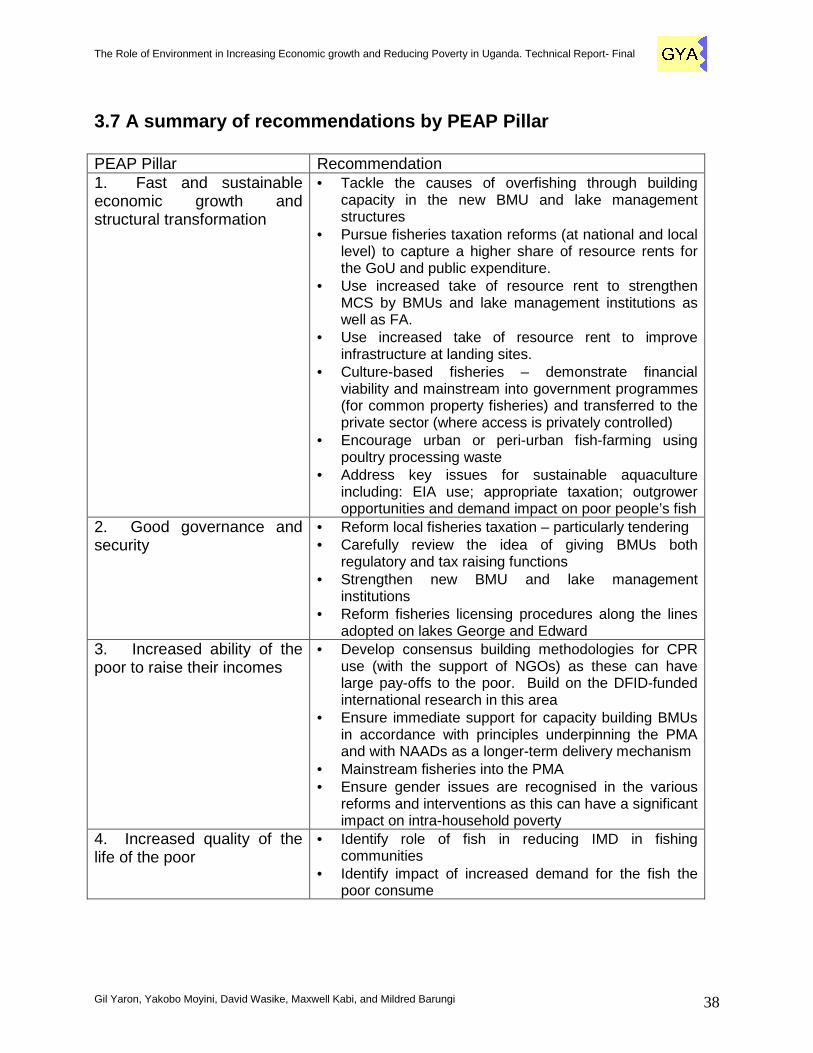
The Role of Environment in Increasing Economic growth and Reducing Poverty in Uganda. Technical Report- Final
Gil Yaron, Yakobo Moyini, David Wasike, Maxwell Kabi, and Mildred Barungi 38
3.7 A summary of recommendations by PEAP Pillar PEAP Pillar Recommendation 1. Fast and sustainable economic growth and structural transformation
• Tackle the causes of overfishing through building capacity in the new BMU and lake management structures
• Pursue fisheries taxation reforms (at national and local level) to capture a higher share of resource rents for the GoU and public expenditure.
• Use increased take of resource rent to strengthen MCS by BMUs and lake management institutions as well as FA.
• Use increased take of resource rent to improve infrastructure at landing sites.
• Culture-based fisheries – demonstrate financial viability and mainstream into government programmes (for common property fisheries) and transferred to the private sector (where access is privately controlled)
• Encourage urban or peri-urban fish-farming using poultry processing waste
• Address key issues for sustainable aquaculture including: EIA use; appropriate taxation; outgrower opportunities and demand impact on poor people’s fish
2. Good governance and security
• Reform local fisheries taxation – particularly tendering • Carefully review the idea of giving BMUs both
regulatory and tax raising functions • Strengthen new BMU and lake management
institutions • Reform fisheries licensing procedures along the lines
adopted on lakes George and Edward 3. Increased ability of the poor to raise their incomes
• Develop consensus building methodologies for CPR use (with the support of NGOs) as these can have large pay-offs to the poor. Build on the DFID-funded international research in this area
• Ensure immediate support for capacity building BMUs in accordance with principles underpinning the PMA and with NAADs as a longer-term delivery mechanism
• Mainstream fisheries into the PMA • Ensure gender issues are recognised in the various
reforms and interventions as this can have a significant impact on intra-household poverty
4. Increased quality of the life of the poor
• Identify role of fish in reducing IMD in fishing communities
• Identify impact of increased demand for the fish the poor consume
The Role of Environment in Increasing Economic growth and Reducing Poverty in Uganda. Technical Report- Final
Gil Yaron, Yakobo Moyini, David Wasike, Maxwell Kabi, and Mildred Barungi 39
3.8 Suggested priorities for future research 35
• Exploratory light fishing trials to determine the potential of sardine stocks in lake Albert.
• Fish cage technology is modular and scaleable and potentially could be the basis
of out grower schemes in fisher communities. This needs to be tested through pilot schemes and analysis undertaken of the likely benefits and feasibility of restricting cage aquaculture to certain areas by only allowing cages to be set up at public cage mooring facilities.
• Identifying the impact on the poor of alternative commercialisation options for the
cheap “mukene” fish they currently consume, e.g. feed stock for Nile Perch export farming or processing and direct sales for local and regional consumption. This is likely to require some computable general equilibrium (CGE) modelling. In addition, as we currently have only a very limited idea of the current scale of mukene harvesting for commercial livestock feeds, this should be identified and the extra demand that commercial fish farming is likely to bring should be calculated.
• Identify the role of fish in reducing IMD in fishing communities by providing micro-
nutrients. This could use household data from the UDHS – if this included questions on fish consumption. Data on the poor in fishing communities versus other poor households can be tracked using the UNHS where this records fish consumption.
• Assist the ENR sector in performance monitoring. Specifically, to define:
o Indicators that are SMART and that best capture the levels of performance that need to be measured
o Which sources of existing information are best suited to monitor these indicators
o What are the most cost-effective means of filling the data gaps o Which institutional arrangements (UBOS surveys etc) will deliver this o How can performance against a range of indicators best be summarised
and presented to stakeholders?
35 The Lake Victoria Environment Management Project (LVEMP) has undertaken a number of research studies but these will only be published in 2004. It is unfortunate that these have not been timed to feed into the PEAP revision but we note that these studies may raise additional research issues.

The Role of Environment in Increasing Economic growth and Reducing Poverty in Uganda. Technical Report- Final
Gil Yaron, Yakobo Moyini, David Wasike, Maxwell Kabi, and Mildred Barungi 40
4 The Forestry Sub-Sector
4.1 Introduction The forestry sub-sector is part of the overall environment and natural resources (ENR) sector. It encompasses all aspects of the establishment, management and use of forest, woodlands, bushland, farmland with trees, woodlots, and trees in urban areas. The sub-sector includes: the primary processing and use of roundwood; the primary processing of some non-timber forest products; and the use of the broader benefits of forests, such as watershed protection and climate management, which are sometimes called environmental services. In this sense, forestry is closely linked to other sub-sectors such as: metereology; land; fisheries; wildlife and tourism; and energy. The key stakeholders in the forestry sub-sector are:
• farmers and other rural households who use fuelwood, poles and non- timber forest products (NTFPs) for subsistence;
• people who gather fuelwood to sell, including charcoal makers and
traders; • people who collect and do the primary processing of NTFPs to sell; • people who harvest and do the primary processing of roundwood, such
as pitsawyers and sawmill workers; • the entrepreneurs and business people in all these trades; • the professional people such as foresters who provide management
expertise; and
• all relevant central and local government staff (MWLE, 2001) Forests and forest products are important to the people of Uganda and the economy. Forests also provide environmental services that are often of global value. Around 95%of Ugandans depend on woodfuel (firewood and charcoal) for their basic energy needs. In addition, many people are employed – directly or indirectly – in the forest sector. Finally, the forests are also a significant source of non-tax revenue to the various levels of government. As a result of the foregoing – diverse stakeholder groups, rural nature, and multiple products and services – the forestry sub-sector has an important role to play in Uganda’s attainment of poverty eradication goals as specified in the PEAP. The relevance of the forestry sub-sector to the four pillars of PEAP are
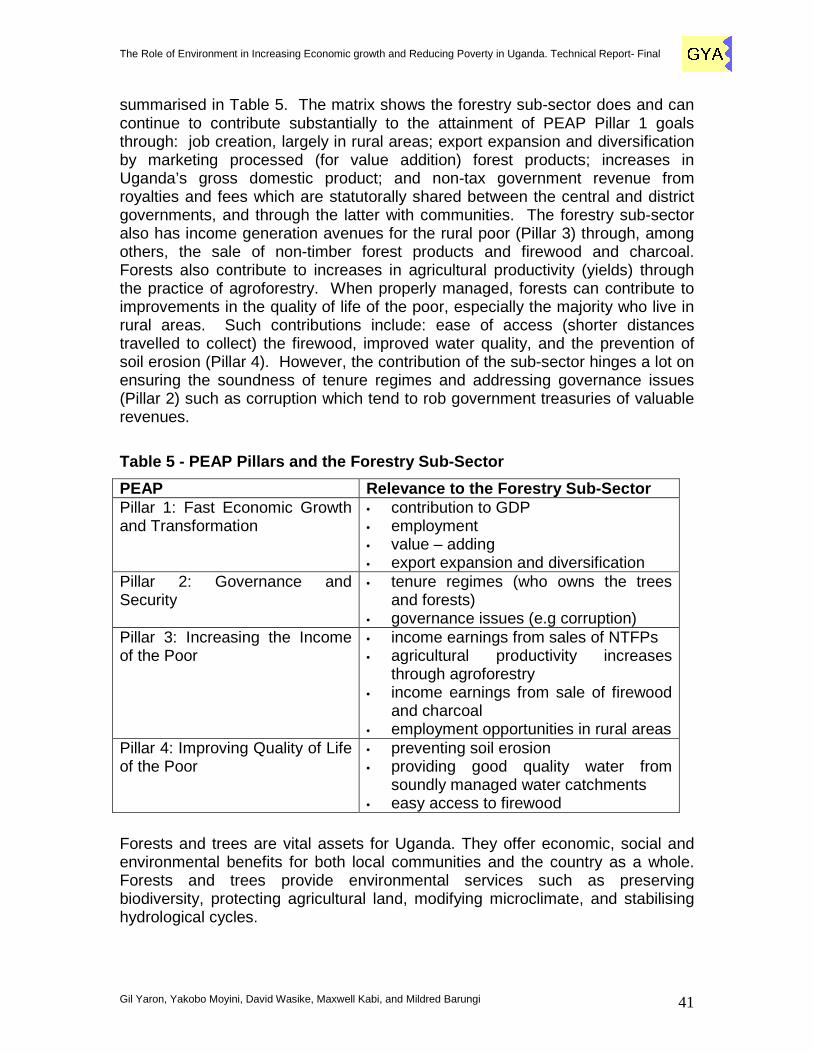
The Role of Environment in Increasing Economic growth and Reducing Poverty in Uganda. Technical Report- Final
Gil Yaron, Yakobo Moyini, David Wasike, Maxwell Kabi, and Mildred Barungi 41
summarised in Table 5. The matrix shows the forestry sub-sector does and can continue to contribute substantially to the attainment of PEAP Pillar 1 goals through: job creation, largely in rural areas; export expansion and diversification by marketing processed (for value addition) forest products; increases in Uganda’s gross domestic product; and non-tax government revenue from royalties and fees which are statutorally shared between the central and district governments, and through the latter with communities. The forestry sub-sector also has income generation avenues for the rural poor (Pillar 3) through, among others, the sale of non-timber forest products and firewood and charcoal. Forests also contribute to increases in agricultural productivity (yields) through the practice of agroforestry. When properly managed, forests can contribute to improvements in the quality of life of the poor, especially the majority who live in rural areas. Such contributions include: ease of access (shorter distances travelled to collect) the firewood, improved water quality, and the prevention of soil erosion (Pillar 4). However, the contribution of the sub-sector hinges a lot on ensuring the soundness of tenure regimes and addressing governance issues (Pillar 2) such as corruption which tend to rob government treasuries of valuable revenues.
Table 5 - PEAP Pillars and the Forestry Sub-Sector
PEAP Relevance to the Forestry Sub-Sector Pillar 1: Fast Economic Growth and Transformation
• contribution to GDP • employment • value – adding • export expansion and diversification
Pillar 2: Governance and Security
• tenure regimes (who owns the trees and forests)
• governance issues (e.g corruption) Pillar 3: Increasing the Income of the Poor
• income earnings from sales of NTFPs • agricultural productivity increases
through agroforestry • income earnings from sale of firewood
and charcoal • employment opportunities in rural areas
Pillar 4: Improving Quality of Life of the Poor
• preventing soil erosion • providing good quality water from
soundly managed water catchments • easy access to firewood
Forests and trees are vital assets for Uganda. They offer economic, social and environmental benefits for both local communities and the country as a whole. Forests and trees provide environmental services such as preserving biodiversity, protecting agricultural land, modifying microclimate, and stabilising hydrological cycles.

The Role of Environment in Increasing Economic growth and Reducing Poverty in Uganda. Technical Report- Final
Gil Yaron, Yakobo Moyini, David Wasike, Maxwell Kabi, and Mildred Barungi 42
The overarching objective of the forestry sub-sector is sustainable forest management (SFM). However, to some extent this objective is being hampered by lack of criteria and indicators for SFM, applicable management systems and relevant experience. In addition, the sub-sector has to contend with: subsidies in adjacent sectors which indirectly encourage deforestation; current concession and timber pricing policies which do not create strong incentives for sustainable management; and the lack of adequate and transparent information on the state and use of forest resources. One way Uganda has addressed the obstacles hindering SFM has been to encourage the establishment of both softwood and hardwood plantations as a means of supplying wood and fibres for the domestic and export markets.
4.2 Status The table below shows the ownership of Uganda’s forests. Out of 20.4 million ha, 17.4 million ha or about 85%% of the total is owned privately or under customary tenure. The balance constitutes central and local government reserves (about 1.2 million ha) and national parks and wildlife reserves (1.9 million ha). The distribution of the forest resources varies regionally. Tropical High Forests (THFs) are largely found in the western part of the country, around the shores and islands of Lake Victoria and in the east around Mt. Elgon. Woodlands occupy the drier parts of the country, in the north and at the centre. The northern region has by far the most forested area, but this consists mostly of woodlands. While THFs are an important source of timber, the woodlands are important sources of non-timber forest products. The data also show that the vast majority of private forests are woodland. On the other hand, the total area of tropical high forest is 924,000 ha, containing valuable hardwoods and other important forest products, and this resource is equally distributed between private owners, the Forest Department (FD), and the Uganda Wildlife Authority (UWA).
Table 6 - Approximate Areas (in hectares) of Forest and woodland under Different ownership
National Parks and Wildlife Reserves
Central and Local Forest Reserves (FD & Local Authority)
(UWA)
Private and Customary Land
Total
Tropical High Forest
345,976 350,895 351,000 1,047,871
Woodlands 780,642 304,323 3,102,000 4,186,965 Plantations 20,038 2,273 11,000 33,311 Total Forest 1,146,656 657,491 3,464,000 5,268,147 Other cover types 414,000 1,167,000 13,901,000 15,482,000 Total land 1,560,656 1,824,491 17,365,000 20,750,147
Source : FD, (2002)

The Role of Environment in Increasing Economic growth and Reducing Poverty in Uganda. Technical Report- Final
Gil Yaron, Yakobo Moyini, David Wasike, Maxwell Kabi, and Mildred Barungi 43
4.3 Contribution to the Ugandan Economy
4.3.1 Introduction The forestry sub-sector makes important contributions, both formally and informally, to the economy of Uganda. The rural location of most forests means that any economic activities in the sub-sector are ideally suited for the attainment of poverty eradication goals. Unfortunately, the sub-sector is more difficult to characterise than most other productive and commercial modern sectors. In Uganda, the value of the sub-sector in terms of its contribution to national welfare or even contribution to gross domestic product (GDP) is very difficult to measure due to: un-recorded outputs that go into subsistence consumption meeting basic needs of rural populations (energy, food); informal trading, illegal trading to evade taxes and fees; and difficulties associated with valuing ecological services (Falkenberg and Sepp, 1999). On the international scene, a review by CIFOR (2003) of the relevant literature linking forestry to poverty has highlighted the following key points:
• in exploring the link from forests to poverty alleviation, two key questions arise: What role can forests and forestry play in the efforts to reduce poverty in developing countries? And to what extent do forests help prevent extreme hardship, even when they don’t reduce poverty;
• a striking gap exists between, on the one hand, the neglect of forests in
economic development and poverty reduction strategies and on the other, the high (and sometimes unrealistic) expectations regarding the role for forest products in parts of the forest literature;
• from a macro-level perspective, economic growth normally does trickle
down to the poor, at least over time and at aggregate scales. The forest literature tends to ignore this effect including the impact of forest rents flowing into other sectors;
• non-timber forest products (NTFPs) serve sub-sistence needs, can have
important ‘gap filling’ functions and sometimes provide regular cash income. However, there is a strong association between poverty and NTFP dependence. Paradoxically, the same characteristics that make NTFPs important and attractive to the poor, also limit their potential for increasing incomes;
• timber has traditionally been the rich man’s lot but the current trends of
increased local control over natural forests, smallholder tree growing and small scale, wood-based enterprises may somewhat modify this picture;

The Role of Environment in Increasing Economic growth and Reducing Poverty in Uganda. Technical Report- Final
Gil Yaron, Yakobo Moyini, David Wasike, Maxwell Kabi, and Mildred Barungi 44
• the realm of payments for ecological services is expanding rapidly and has a huge potential but the extent to which the poor will benefit remains uncertain;
• the choices relating to livelihood and poverty definitions, concepts and
indicators clearly influence policy and project design, as well as research results and interpretations; and
• particularly promising topics for future study are identified within the fields
of: assessing current forest-based benefits to the poor; exploring emerging market opportunities; and evaluating cross-cutting institutional and extra-sectoral issues.
4.3.2 Contribution to Gross Domestic Product According to the European Commission (2002), globally, forest services and products contribute around 2% of gross domestic product (GDP). For Africa, the equivalent is 6% of GDP. The officially reported figure for Uganda is about 1.9% of GDP, close to the one of the world average, but below that of Africa. The contribution of the forestry sub-sector to the economy of Uganda is increasing in absolute amounts (Figure 4.), although a large share of that contribution is in the non-monetary sector. The contribution to the monetary sector is about 0.7% of GDP; while the one of the non-monetary sector is 1.2%, giving a total contribution of 1.9%. Despite its smaller share the monetary component is growing much faster than its non-monetary counterpart (Figure 5).

The Role of Environment in Increasing Economic growth and Reducing Poverty in Uganda. Technical Report- Final
Gil Yaron, Yakobo Moyini, David Wasike, Maxwell Kabi, and Mildred Barungi 45
Figure 4
Forestry sub-sector GDP at factor cost at constant (1997/98) prices (million shillings),calender years 1997-2001
0
20,000
40,000
60,000
80,000
100,000
120,000
140,000
160,000
1997 1998 1999 2000 2001
Calender years
For
estr
y su
b-se
ctor
GD
P
Non-monetary
Monetary
Source: UBOS (2002)

The Role of Environment in Increasing Economic growth and Reducing Poverty in Uganda. Technical Report- Final
Gil Yaron, Yakobo Moyini, David Wasike, Maxwell Kabi, and Mildred Barungi 46
Figure 5 - Forestry Sub-Sector Percentage Growth Ra tes
0
1
2
3
4
5
6
7
8
9
10
1 2 3 4
GDP
Monetary forestry
Non-Monetaryforestry
PEAP target
Inflation
Source : UBOS (2002) The conventional measure of GDP tends to underestimate the true economic contribution of the forestry sub-sector. For one, it does not take into account such contributions as the value of fuel for subsistence and the protection of soil and water for agriculture and fisheries (MWLE, 2001), important considerations for Uganda’s poor. Falkenberg and Sepp (1999) showed that when necessary adjustments are made to the official GDP estimates, the actual contribution of the forestry sub-sector should be somewhere around 6.1% compared to the 1.9% quoted in official statistics. The incremental contribution comes from the informal sector (2.75% of GDP); and non-marketable outputs such as watershed benefits, carbon sequestration, biodiversity option values, erosion control and groundwater recharge (1.45% of GDP), as shown in the figure below. Even then, according to Falkenberg and Sepp (1999), the foregoing adjustments to the official GDP estimates do not include the important contribution forest products make to the GDP of the manufacturing sector. This is so because ‘forestry’ is defined for this purpose as the value of wood production at the forest gate; that is the factor costs, excluding taxes and value adding activities, for wood products (Falkenberg and Sepp 1999). If the value adding activities were to be included, they would typically cover sawmilling, charcoal production, other primary wood processing, transport and trade, all of which in the current Government statistics are included in the contribution of other sectors to GDP, and not the forestry sub-sector.
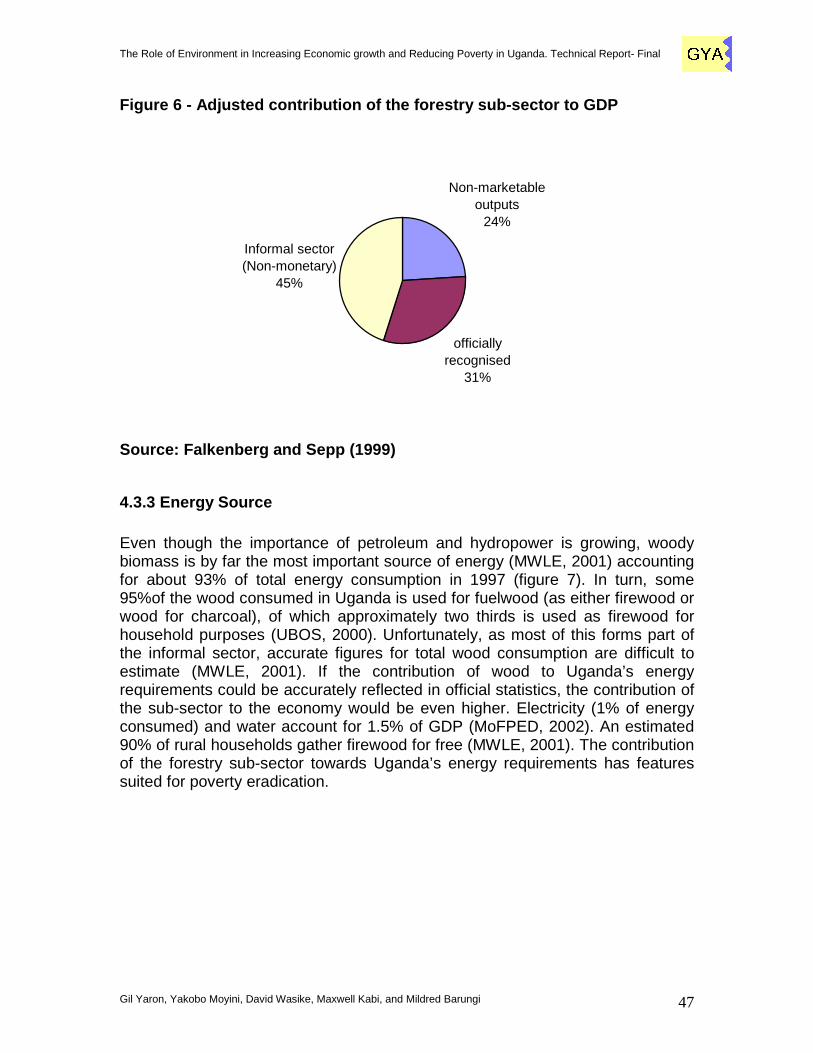
The Role of Environment in Increasing Economic growth and Reducing Poverty in Uganda. Technical Report- Final
Gil Yaron, Yakobo Moyini, David Wasike, Maxwell Kabi, and Mildred Barungi 47
Figure 6 - Adjusted contribution of the forestry su b-sector to GDP
Non-marketable outputs
24%
officially recognised
31%
Informal sector (Non-monetary)
45%
Source: Falkenberg and Sepp (1999)
4.3.3 Energy Source Even though the importance of petroleum and hydropower is growing, woody biomass is by far the most important source of energy (MWLE, 2001) accounting for about 93% of total energy consumption in 1997 (figure 7). In turn, some 95%of the wood consumed in Uganda is used for fuelwood (as either firewood or wood for charcoal), of which approximately two thirds is used as firewood for household purposes (UBOS, 2000). Unfortunately, as most of this forms part of the informal sector, accurate figures for total wood consumption are difficult to estimate (MWLE, 2001). If the contribution of wood to Uganda’s energy requirements could be accurately reflected in official statistics, the contribution of the sub-sector to the economy would be even higher. Electricity (1% of energy consumed) and water account for 1.5% of GDP (MoFPED, 2002). An estimated 90% of rural households gather firewood for free (MWLE, 2001). The contribution of the forestry sub-sector towards Uganda’s energy requirements has features suited for poverty eradication.

The Role of Environment in Increasing Economic growth and Reducing Poverty in Uganda. Technical Report- Final
Gil Yaron, Yakobo Moyini, David Wasike, Maxwell Kabi, and Mildred Barungi 48
Figure 7 - Energy consumption by source in Uganda (1997)
Firewood88%
Petroleum6%
Charcoal5%
Electricity1%
First, wood is the main source of energy in rural areas and among the poor. Only 1-2% of the rural population had access to electricity as of 2000. Second, the extraction and supply of firewood is an important source of income and employment. Third, the use of firewood is vital for food security and facilitates better nutrition. Fourth, the widespread use of firewood reduces dependence on foreign currency and imported fossil fuels
Source: MWLE (2001)

The Role of Environment in Increasing Economic growth and Reducing Poverty in Uganda. Technical Report- Final
Gil Yaron, Yakobo Moyini, David Wasike, Maxwell Kabi, and Mildred Barungi 49
Box 6 - Cost of Woodfuel Substitution
The figure 8 shows projected trends in energy consumption to the year 2015. The message is clear, the demand for woody biomass as the major source of energy will continue at least over the next 10 years or more. The data further suggest that even if the entire 200 MW hydroelectric potential in Uganda is fully utilised, the forestry sub- sector would still supply 75% of the projected total energy consumption by 2015 (MWLE 2001).
The ESD Woody Biomass Derived Energy Supplies Study (1996) shows, woody biomass play a more important role in Uganda’s energy economy than all other fuel sources combined. If it were necessary to substitute petroleum products for the charcoal alone consumed in Uganda, the country’s import bill would increase by the equivalent of over US$ 80 million per annum or 6% (1997).* If we include substitutes for fuelwood (charcoal and firewood), the necessary increase in imports would total US$ 101.5 million per annum or 9% (formal sector only) and US$ 239.6 million per annum or 20% (formal and informal sector), respectively.
*Assumes a charcoal end use efficiency of 20% and a kerosene end use efficiency of 60%. The landed price at Kampala depot is assumed to be US$ 500 per tonne of Kerosene Source: Falkenberg and Sepp (1999)

The Role of Environment in Increasing Economic growth and Reducing Poverty in Uganda. Technical Report- Final
Gil Yaron, Yakobo Moyini, David Wasike, Maxwell Kabi, and Mildred Barungi 50
Figure 8 - Energy consumption by energy source in U ganda 1997
Source: MWLE (2001) As far as charcoal is concerned, 70% is consumed by urban households. About 3% of rural households use charcoal. By 1999, approximately 526,000 metric tonnes of charcoal was consumed. Despite being unlicensed, charcoal production is one of Uganda’s most important economic activities. Annually, charcoal is estimated to be contributing over UShs 16,000 million (or US$ 8 million) into the economy every year of which 25% goes to rural landholders and 25% to Government in taxes and revenues (MWLE, 2001). Charcoal production is estimated to employ over 20,000 people on a full-time basis; while thousands more are employed in transport, distribution and marketing. The popularity with charcoal is that among others, its real price fell by 50% over the period 1989-1994 and has decreased ever since against every major consumer commodity (MWLE, 2001). The explanation could be increased supply caused by conversion of woodlands into agriculture. It could also be due to an increasing number of households going into charcoal production.
4.3.4 Employment Most employment in Uganda is self-employment, with people farming their own land. This will not change over-night, but the forestry sub-sector is already and can even make more impact in formal employment with more investment in the sub-sector which by its very nature is labour-intensive. Over time, investment in labour-intensive activities drives the wage rate up. This is why workers in the export-oriented economies of East Asia experienced major benefits to their incomes and why incomes in these economies tended to become more equal, not less, during their economic expansion (MoFPED, 2001). An increase in the
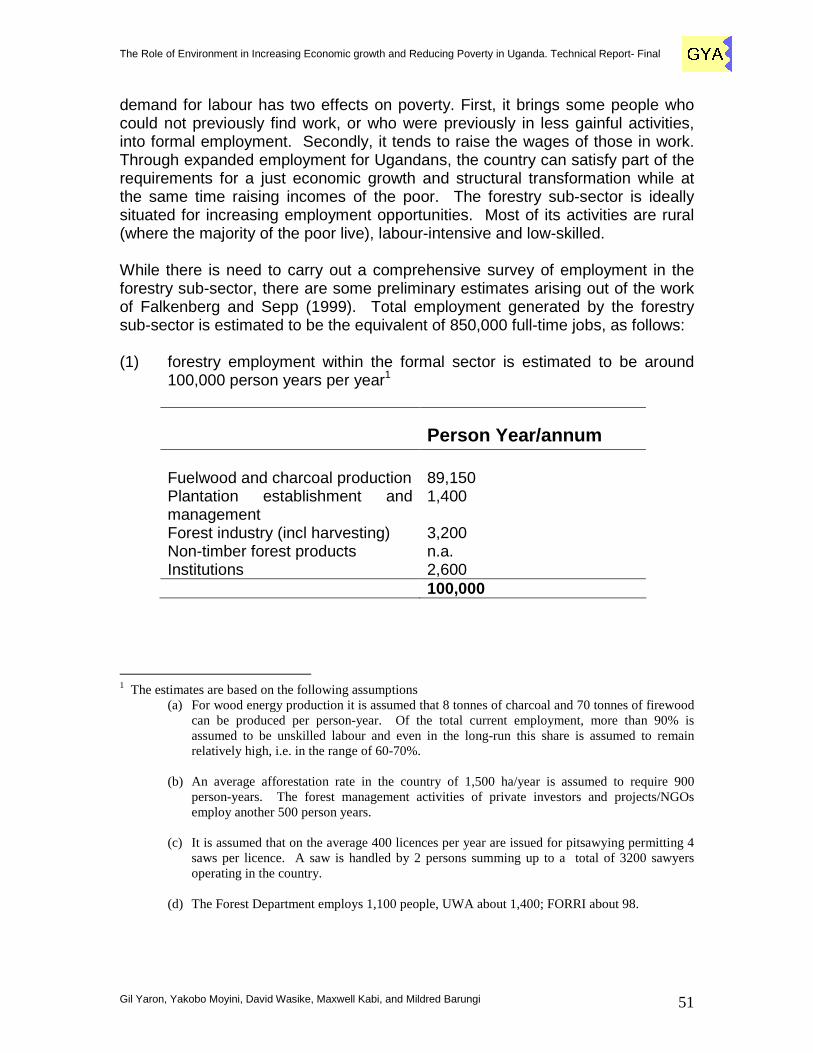
The Role of Environment in Increasing Economic growth and Reducing Poverty in Uganda. Technical Report- Final
Gil Yaron, Yakobo Moyini, David Wasike, Maxwell Kabi, and Mildred Barungi 51
demand for labour has two effects on poverty. First, it brings some people who could not previously find work, or who were previously in less gainful activities, into formal employment. Secondly, it tends to raise the wages of those in work. Through expanded employment for Ugandans, the country can satisfy part of the requirements for a just economic growth and structural transformation while at the same time raising incomes of the poor. The forestry sub-sector is ideally situated for increasing employment opportunities. Most of its activities are rural (where the majority of the poor live), labour-intensive and low-skilled. While there is need to carry out a comprehensive survey of employment in the forestry sub-sector, there are some preliminary estimates arising out of the work of Falkenberg and Sepp (1999). Total employment generated by the forestry sub-sector is estimated to be the equivalent of 850,000 full-time jobs, as follows: (1) forestry employment within the formal sector is estimated to be around
100,000 person years per year1
Person Year/annum
Fuelwood and charcoal production
89,150
Plantation establishment and management
1,400
Forest industry (incl harvesting) 3,200 Non-timber forest products n.a. Institutions 2,600 100,000
1 The estimates are based on the following assumptions
(a) For wood energy production it is assumed that 8 tonnes of charcoal and 70 tonnes of firewood can be produced per person-year. Of the total current employment, more than 90% is assumed to be unskilled labour and even in the long-run this share is assumed to remain relatively high, i.e. in the range of 60-70%.
(b) An average afforestation rate in the country of 1,500 ha/year is assumed to require 900
person-years. The forest management activities of private investors and projects/NGOs employ another 500 person years.
(c) It is assumed that on the average 400 licences per year are issued for pitsawying permitting 4
saws per licence. A saw is handled by 2 persons summing up to a total of 3200 sawyers operating in the country.
(d) The Forest Department employs 1,100 people, UWA about 1,400; FORRI about 98.

The Role of Environment in Increasing Economic growth and Reducing Poverty in Uganda. Technical Report- Final
Gil Yaron, Yakobo Moyini, David Wasike, Maxwell Kabi, and Mildred Barungi 52
(2) the employment in the informal sector is estimated at about 747,000 person years, distributed across the main activities:
Person Year/annum • Firewood collection by
households • Firewood production for
commerce and industry
710,000 36,000
• Pole production 1,000
Total Informal 747,000
4.3.5 Exports Uganda’s balance of trade is still a critical factor in development. Uganda has achieved some success in reducing the negative balance of trade. For example, over the 1990/1 to 1997/8 fiscal years non-traditional exports rose from US$ 35 million to US$ 149 million. Unfortunately, Uganda’s exports of wood products are negligible as a result of a deliberate policy measure which banned the exports of timber and timber products. The ban was to curb an alarming rate of forest clearance at the time when management effectiveness was practically nil. Once the ban is removed, it is hoped some exports of timber and timber products can begin. Globally, trade in forest products and services account for about 3% of merchandise trade (EC, 2002). Although, the direct contribution to exports is almost nil, the forestry sub-sector has some significant indirect influences. According to Falkenberg and Sepp (1999), three examples illustrate the role the forestry sub-sector plays in facilitating Uganda’s exports. They are: • two major commodities, tea and tobacco, rely heavily on wood products. In
the case of tobacco production it is not conceivable to replace woodfuel with other fuels in the short and medium-term. The industry average is 5.5 kg of firewood per kg of cured tobacco (MWLE, 2001); and for tea, 1m3 of wood per 250 kg of made tea. According to Falkenberg and Sepp (1999), this important contribution of wood to export earnings in the tea and tobacco industries should be valued, for example, as a share of the respective foreign exchange earning amounting to US$ 45.727 million in 1997. The authors assumed a 10% - 15% share. Hence, the contribution of the forestry sub-sector would have been about US$ 4.5 and 6.8 million;

The Role of Environment in Increasing Economic growth and Reducing Poverty in Uganda. Technical Report- Final
Gil Yaron, Yakobo Moyini, David Wasike, Maxwell Kabi, and Mildred Barungi 53
• the value of foreign exchange saved from use of woody biomass instead of fossil fuel imports (Section 3.3 for details); and
• Uganda’s tourism is largely eco-tourism and based on forests. Tourist
revenues are mostly captured through the activities of UWA and usually not attributed to the forestry sector. Six national parks established around 1991 – 1993 were conversions from forest reserves. Two of these, Bwindi and Mgahinga are the only homes of the Mountain Gorilla in Uganda and house over half of the world’s population of these great apes. The two parks generate about 33% of the revenues of UWA.
4.3.6 Public Revenue Currently, sources of public revenue from the forestry sub-sector include: • sale of forest products, licenses and concession fees; • taxes levied on charcoal makers; • rent for land in forest reserves; • fees for trade and transport/movement permits for charcoal, firewood and
some non-timber forest products; and • value added tax (VAT) at 17% , and 15% for saw millers and pit sawyers
whose operations fall below the VAT threshold. Of the revenues collected at district office it is a legal requirement that 60% is transferred directly to the treasury and 40% transferred to the relevant districts. Revenues generated by the Forest Department increased from UShs 100 million (US$ 50,000) in 1990 to UShs 1,000 million (or US$ 5 million) for the fiscal year 1999/2000 (MWLE, 2001). Figure 6 shows the trends in revenue collection for the period 1990 to 2000. However, inspite of this increase, there is evidence to suggest that the revenue collected does not tally with the volume of wood products being removed. The corresponding revenues are much lower. According to MWLE (2001), less than 10% (and possibly less than 5%) of money which should be collected by the Forest Department actually reaches either the treasury or the relevant districts. The rest is lost through tax evasion, misappropriation of economic rent by forestry and other government officials. Falkenberg and Sepp (1999) estimated the potential revenues from wood utilisation on the basis of the estimated 1999 production and royalties according to rates in Schedule 4 of April 1994. The authors suggested that based on wood consumption in the formal sector, potential revenue was estimated at UShs 17,000 million or about US$ 8.5 million (UShs 8,900 million from sawlogs, UShs 600,000 from poles, and UShs 7,500 million from firewood).

The Role of Environment in Increasing Economic growth and Reducing Poverty in Uganda. Technical Report- Final
Gil Yaron, Yakobo Moyini, David Wasike, Maxwell Kabi, and Mildred Barungi 54
Figure 9: Forest Department Revenue Collected 1990-2000
0
200,000,000
400,000,000
600,000,000
800,000,000
1,000,000,000
1,200,000,000
1989
/90
1996
/97
1997
/98
1998
/99
1999
/200
0
Fiscal year
Tot
al R
even
ue
4.4 Rural Livelihood While there is no quantitative data on the role the forestry sub-sector plays in enhancing food security, anecdotal evidence suggests that particularly during dry seasons, rural households obtain a significant amount of their nutritional requirements from forest resources, be they fruits, vegetables, mushrooms, honey or herbs. The extent to which the poorest segments of society depend on forests is presented in Box 7. Key features of the importance of the forestry sub-sector to sustainable rural livelihoods are: improved food security; energy supply; increased income; improved quality of life; water; cultural sustenance and social capital; and reduced vulnerability (MWLE, 2001).
Source: MWLE (2001)

The Role of Environment in Increasing Economic growth and Reducing Poverty in Uganda. Technical Report- Final
Gil Yaron, Yakobo Moyini, David Wasike, Maxwell Kabi, and Mildred Barungi 55
Box 7 - The poorest people depend most on forest an d tree resources
1.1
4.4.1 The Value of Indirect Outputs In principle, GDP and other standard economic calculations refer only to marketable outputs. However, as noted by Falkenberg and Sepp (1999), the forestry sub-sector provides a number of other outputs, which improves the welfare of the people and the nation. These outputs are essentially positive externalities. These factors occur both at local and global scales. At the local level, positive externalities include the contribution of the forestry sub-sector to: • groundwater recharge and the improvement in the quality of drinking water; • soil stabilisation and fertility – especially through the practice of agroforestry;
• The landless use forests for food production, firewood, wild food, employment and income. • Poor women, especially widows and female headed families, use forest resource as alternative or
supplementary land for food production, for firewood, income generation and for food, water and herbal medicine. For example in Moyo District, poor women engage in fish smoking, rope-making, basket weaving, baking, beer brewing, and selling firewood or charcoal, in other to supplement their income (UPPAP, 2000).
• Poor smallholder farmers use forest resources for fodder, green manure, firewood, building
materials, wild food and medicine, seasonal employment and income during lean seasons. • Cattle keepers in draught – prone areas use forest resources especially during the dry season when
they experience shortages in fodder and water. Cattle keepers seasonally use forest and game reserves in Karamoja, Masindi and Kabarole.
• Minority ethnic groups, forest dwellers (such as the Batwa) and communities living adjacent to
the forests are usually isolated, with poor access to social services. Forests provide sanctuary, food, recreation and cultural and spiritual sustenance.
• Fishermen and women use forest and trees for constructing canoes and as fuel for fish smoking. • The formerly un employed youth use forests as sources of employment and income from e.g.
charcoal, brick and lime production. • For the internally displaced (400,000 in 1998), refugees (180,000 in 1998) and those living in
areas prone to natural disasters, forests offer shelter, firewood, food security from wild foods and the possibility of transitional employment.
• Only 20% of urban households have access to electricity and, coupled with the high cost of living in
cities, this creates a high demand for charcoal and firewood, especially among the urban poor, for cooking, heating, lighting and beer brewing.
Source: MWLE (2001)

The Role of Environment in Increasing Economic growth and Reducing Poverty in Uganda. Technical Report- Final
Gil Yaron, Yakobo Moyini, David Wasike, Maxwell Kabi, and Mildred Barungi 56
• shade and windbreaks – to protect crops and homesteads, schools and other
institutional infrastructure; and • biodiversity which makes an enormous contribution to human well-being.
According to Emerton and Muramira (1999), the value of Uganda’s biodiversity, including the one housed by the forestry sub-sector is about U.Shs 1,112,000 million per year. Using the prevailing exchange rate in 1999 of US $ 1 to Ushs. 1,600, biodiversity value was estimated at US $ 700.0 million/year of which US $ 512.5 million or 73% was direct benefits while US $ 187.5 million or 27% represented indirect benefits. These values are for total and not just forestry biodiversity.
At the global level, the forestry sub-sector is an important carbon sink, helping to reduce accumulation of greenhouse gases and hence global warming which would lead to adverse changes in climate. According to Howard (1994), the service rendered by Uganda’s forestry sub-sector to the economy through its impact on carbon sequestration is estimated at US$ 17.4 million/year.
4.5 Challenges
4.5.1 Introduction
As indicated in the earlier sections of the report, the forestry sub-sector has been making quite important contributions to the economic growth of Uganda and hence poverty reduction, paucity and quality of data notwithstanding. Some of the key challenges facing the sub-sector are summarised in the table below.

The Role of Environment in Increasing Economic growth and Reducing Poverty in Uganda. Technical Report- Final
Gil Yaron, Yakobo Moyini, David Wasike, Maxwell Kabi, and Mildred Barungi 57
Table 7 - Key Challenges and the PEAP Pillars.
PEAP Pillars Key Challenges
Pillar 1 � Low revenue collection. � Ban on logging and timber trade. � Low level of private sector investment. � Lack of valuation for ecological services � Limited employment opportunities.
Pillar 2 � Management of and access to forestry resources by the poor.
� Limited district capacity and community involvement
� Inequitable Gender relations Pillar 3 � Few opportunities for employment in forest
management and primary wood processing activities.
� Undeveloped markets for non-timber forest products.
Pillar 4 � Deforestation.
4.5.2 Fast economic growth and transformation
With respect to PEAP Pillar 1, the forestry sub-sector is not generating the full potential it is capable of, mainly due to: constrained export trade; low level of private sector investment; limited employment opportunities; and non-capture of the value of ecological services.
4.5.3 Export trade
Due to the previous ban on timber and timber products exports, Uganda has not been able to enter into niche overseas markets for some of its unique species such as Cyanometra alexandrii (iron wood). Furthermore, while countries such as those in Southeast Asia have benefited from exports of non-wood forest products (such as rattan furniture, crafts, fruits, and orchids and other forest based flowers), very little export originates from Uganda. Yet, the promotion of the exports of non-wood forest products is of particular relevance to the rural poor especially women because of the ease of harvesting and processing.

The Role of Environment in Increasing Economic growth and Reducing Poverty in Uganda. Technical Report- Final
Gil Yaron, Yakobo Moyini, David Wasike, Maxwell Kabi, and Mildred Barungi 58
4.5.4 Private sector investment
There is limited involvement of the private sector in forest land management. Paradoxically, over 70% of the total area of natural forests and woodlands are in the hands of private landowners and communities. To a large extent these areas are held as “reserve” agricultural land and not as productive assets for forestry. To date, there has been very little interest by the owners to invest in sustainable forest management Communities typically regard these natural forests and woodlands as common property resources often resulting in Hardin’s ‘tragedy of the commons’. Private land owners appear to be more interested in converting forests into agriculture or rangelands where they expect higher economic rents per unit area. Consequently, resource depletion rates and deforestation are highest in the community and privately owned forests. According to FD (2002), it is observed that the present 317 million metric tonnes of biomass held in private lands will face a deficit of 846,000 tonnes by the year 2025, unless corrective actions such as afforestation, and appropriate pricing policies and regulatory frameworks are put in place.
4.5.5 Low revenue collection.
Falkenberg and Sepp (1999) and MWLE (2001) have all described the low rate of revenue collection as evidenced by the dramatic improvement in the values collected as the system is being improved. There are many categories of rent-seekers (forestry officials, political leaders, unscrupulous business operators, etc). There is need to eliminate these windfall profits. Based on the 1999/2000 revenue of US $20 million and the 1990 revenue of US $50,000, one could argue that the leakage of public revenue from the forestry sub-sector could have been a whopping US $199.5million. Yet management of forestry resources suffers from a chronic lack of funds for operations and capital expenditures. Typically, the district forest officers receive only 5% of their annual requisitions for recurrent expenditure and none of development capital from the central Government (Moyini, 2002). In some cases, the shortfall has been met by development assistance.
4.5.6 Employment
Before the expulsion of the Asians by the Amin regime, there were several well-managed sawmills and plywood operations owned by them. The wood industry subsequently collapsed and has yet to recover. Otherwise, enterprises such as Budongo and Kalinzu sawmills were major employers in the rural areas. In the area of forest management, the focus in the 1960s and early 1970s was on plantation forestry countrywide, which offered significant employment opportunities during nursery operations, tree planting, weeding, pruning, thinning and finally logging. These plantations were established to be managed on

The Role of Environment in Increasing Economic growth and Reducing Poverty in Uganda. Technical Report- Final
Gil Yaron, Yakobo Moyini, David Wasike, Maxwell Kabi, and Mildred Barungi 59
sustainable basis. Around the late 1970s up to the present, there was a paradigm shift in forestry. Greater attention was focused on conservation of natural forests that generated limited direct employment opportunities in the rural areas.
4.5.7 Lack of valuation of ecological services
Notwithstanding the difficulties in estimating their values, the ecological services provided by the forestry sub-sector have traditionally been taken for granted or regarded free public goods. However, the categories of benefits from ecological services of the forestry sub-sector have values because they contribute to economic activity and enhance human welfare. To enjoy any of the values, some resources have to be given up in terms of opportunity costs. Unfortunately, it is the rural poor who bear a disproportionate share of the costs, with minimal or no compensation mechanism in place. Fortunately, in more recent times, there is an increasing global interest in capturing some rents from the carbon sequestration and watershed values of forests. In Uganda, some projects have been implemented on the carbon sequestration values of the country’s forests such as the UWA-FACE Project. However, communities living near watershed protection forests do not receive any benefits from downstream users. Yet, they are often denied entry into these protection forests.
Box 8 - UWA and Dutch support for forest conservati on and carbon sequestration
4.5.8 Governance and security
Governance and security concerns of the forestry sub-sector relate to: the management of and access to forestry resources by the poor; limited district capacity; and unequal gender relations.
Since 1994, the FACE Foundation and UWA have been working jointly on reforestation projects in Mt.Elgon and Kibale National Parks. The FACE Foundation was set up by the Dutch Electricity Board to compensate for some of the CO2 emissions from coal-fired Dutch power stations by means of reforestation and afforestation. FACE negotiates a contract with the landowner under which FACE provides finance for tree planting. The landowner becomes the owner of the trees and forest products. In Uganda, FACE will eventually establish or regenerate 25,000 ha in Mt. Elgon National Park and 10,000 ha in Kibale National Park. By mid 1999, some 7,400 ha were reported to have been planted. Source: Jacovelli and Carvalho (1999)

The Role of Environment in Increasing Economic growth and Reducing Poverty in Uganda. Technical Report- Final
Gil Yaron, Yakobo Moyini, David Wasike, Maxwell Kabi, and Mildred Barungi 60
4.5.9 The management of and access to forestry reso urces.
At present, all sectors of the government except forestry have fully decentralised the delivery of services to the District and Local councils. However, only 5,000 ha of small forests gazetted in the 1940s as “Local Forest Reserves,” have been legally transferred to the Districts and Local Councils. The large forests gazetted in the 1940s as “Central Government Forest Reserves” have been retained at the centre. These large, economically viable forest reserves are, however, to be transferred to the proposed National Forest Authority - a semi-autonomous, profit-oriented body established by an Act of Parliament. Once again, local institutions have been denied the chance to manage the economically viable forest resources and have been entrusted with only the small, degraded, and economically unviable forest areas. According to the Local Governments Act, the District Local Councils receive 40% of all revenue collected from Central Forest Reserves located in the district and 100% of all revenue collected from the Local Forest Reserves. The revenue collected in the district from forestry resources is not, however, often ploughed back into forestry activities. Instead of providing for more forest guards and forest rangers to carry out forest protection activities, these funds go to the general district budget. Furthermore, the funds are hardly invested to benefit the communities adjacent to forest areas. Illegal harvesting of forest products especially timber and charcoal appeared to be more rampant in forests located in remote areas far away from the district administrative centre. Infractions of use rules must be monitored and punished. Otherwise, highly valuable renewable resources such as forests may be so over-harvested that their capacity to regenerate is destroyed. Monitoring without sanctions increases appropriation from the common pool resource because appropriators see what others are doing and react by increasing their own appropriation rates. Illegal harvesting of forest produce in the districts is also revealed by the amount of illegal forest produce impounded at roadblocks mounted by the Uganda Revenue Authority (URA). Funds raised from the auctioning of impounded forest products are considered Central Government revenue and are still high compared to the revenue collected by the local councils from the sale of forest produce. Although the amount of impounded illegally harvested timber decreased from 200 million shillings in 1996/97 financial year to 70 million in 1998/99 financial year, that of charcoal increased threefold from 0.8 to 2.1 million shillings in the same period. The expectation was that local councils would be more effective in monitoring and rule enforcement thereby leading to a reduction in illegal harvesting of forest produce and improved forest conditions. Although no definitive conclusions can be made about the impact of decentralisation on forest conditions without time series data, interviews with

The Role of Environment in Increasing Economic growth and Reducing Poverty in Uganda. Technical Report- Final
Gil Yaron, Yakobo Moyini, David Wasike, Maxwell Kabi, and Mildred Barungi 61
local communities and local council leaders show that there is limited 'political will' by the elected councillors to implement the Local Governments Act 1997, with respect to forest management. Given that councillors (local politicians) are the actors charged with implementing decentralisation policies, one needs to understand the incentives and constraints these local politicians face. There is evidence to show that decentralisation of forest management is not yet very deep or real. For example, if decentralisation has worked, why would the distance from the local administrative centre to the forest affect the condition of the forest? This appears to show that enforcement by outsiders (the central government forest service) is still the most important method of forest control. In fact, one could argue that if decentralisation worked, the distance variable should be in the opposite direction -- that communities left alone with the power to manage their own forestry resources would have better not worse forests. There is continued confiscation of illegally harvested forest produce on roads leading to Kampala from the districts. One could argue that if decentralisation worked, there would be no illegally harvested forest produce on the market. This appears to suggest that there is ineffective monitoring and rule enforcement at the forest level by village and parish environment committees. So there is clearly a great deal left to be done with the decentralisation of forest management. However, the observed degradation of forests located in remote areas of the district also raises questions regarding the effectiveness of the centralisation policy whereby the central government forest service through the District Forest Office monitors and enforces forest rules in the entire district. In theory, the nested layers of local government administrative structure provides a platform for crafting and enforcing forest rules at the various levels of local governance. However, it appears that the elected Village, Parish and Sub-county Councils that would have been most important and effective for devolved forest management do not have the capacity to enforce forest bye-laws. Most of the powers of rule enforcement and sanctioning are vested with the LC 5 (the District Local Council). These powers gradually diminish at each successive lower level of governance. This may partly explain the decline in quality of forest patches located in remote villages where the only visible local government officials are the village and parish councillors. Authority is needed by the lower councils in order to be effective forest managers. Forest rules crafted by Local Councils at each level should be legally binding. The Local Governments Act 1997 empowers them to make legally binding ordinances at district level, and bye-laws at lower levels of local government. According to the 2001Forest Policy, the government intends to encourage more active participation of local communities and farmers in the management of the country’s forests and to enhance the role of cultural and traditional institutions in forest sector development. Community involvement in forest management may

The Role of Environment in Increasing Economic growth and Reducing Poverty in Uganda. Technical Report- Final
Gil Yaron, Yakobo Moyini, David Wasike, Maxwell Kabi, and Mildred Barungi 62
increase the motivation of individuals to protect the resource due to an enhanced sense of ownership and the anticipated increase in benefits.
4.5.10 Limited district capacity and community invo lvement
Decentralisation is now considered to be crucial for effective public policy, democracy and natural resources management. Decentralisation may be presented in the form of formal political structures and institutions or the informal rules of local communities. It is about empowering local actors to make management decisions, rules and regulations. Institutions may be defined as the human devised constraints that structure human interactions. Institutions play a big role in determining the condition of the forestry resources by directly mediating the effects of social and cultural norms, state policies, technological variables, level of market pressures, and demographic pressures. It is the absence of effective institutions to regulate resource use that allows deterioration of the condition of the forest. A forest with enforced rules that limit exploitation is most likely to be in better condition than the forest where rules are not enforced. Without effective institutions to limit and regulate harvesting levels and management practices, forest resources can be over-harvested and even irreversibly destroyed, as is often the case in ‘open access’ forests. In such a situation, resource use would be predicted by the optimal foraging theory of maximising economic returns while minimising costs. District and lower level local governments have inadequate capacity to carry out their mandate in forest resource management at present. They are constrained by inadequacies in human and financial resources. An attempt at decentralising forest management responsibilities in the early 1990s ended up with disastrous results. In their attempts to overcome short-term budgetary shortfalls and in some cases personal greed, they permitted over-harvesting in many forest areas. Subsequently, the major reserves reverted back to the central Government. Community involvement is seen as part of the answer to ‘command control’ system of governance. The idea is that community involvement is more sustainable and incurs lower transaction costs. Unfortunately, the communities, similar to local governments, have weak institutional capacities.
4.5.11 Gender relations and forest resources. Due to varying cultural and traditional norms, women and men have different relationships with forest resources; and as a result of division of labour by gender and other factors, as forest resources decline they are affected differently. According to MWLE (2001), women are primarily involved in collection of forestry resources for utilisation within the households (subsistence), whereas men are mainly involved in gathering forest resources for commercial value. This is so

The Role of Environment in Increasing Economic growth and Reducing Poverty in Uganda. Technical Report- Final
Gil Yaron, Yakobo Moyini, David Wasike, Maxwell Kabi, and Mildred Barungi 63
because women base their livelihood security on the subsistence side of the household economy, while the men base it on the cash side. There are a number of implications, including:
� declining availability of, and restricted access to, forest resources increase the workload of women and female children and may affect the nutritional status of their families, as a result of eating habits, food preparation and diet brought on by reduced time for food gathering and preparation;
� young men, especially those who are land insecure and unemployed, use forest resources as a major source of income and are often engaged in charcoal production;
� in general, the laws related to access, control, ownership and inheritance of land discriminate against women. Less than 10% of women control and own land in Uganda;
� women, especially widows and those heading households, are among the poorest and rely on forests for their livelihood; and
� women are generally excluded from decision-making processes, which means that decisions are made without them (MWLE, 2001).
4.5.12 Limited financial resources for forest manag ement
The financial resources for the management of the forestry sub-sector come from several sources. Both local and central governments have limited financial resources to enable the effective management of their respective reserves. The shortfall has been filled by development partners including civil society organisations. It is unlikely that this situation will change soon. The Government of Uganda’s budget for the forestry sub-sector over the period 2003 to 2013 has been estimated at Ushs 269,273 million (or about US$ 135 million). The Government of Uganda is expected to finance half of this amount, while the balance is to be met by development partners.
4.5.13 Increasing incomes of the poor Although forestry has intrinsic features that could facilitate eradication of poverty in rural areas, this potential is not being fully utilised. As a result, there are very few employment opportunities whether in forest management, primary wood processing or harvesting and processing of non-timber forest products. Part of the reason is historical mismanagement in the 1970s and early 1980s.The others are insufficient government support for the sub-sector, and lack of incentives for greater private sector participation in forest management and primary processing.
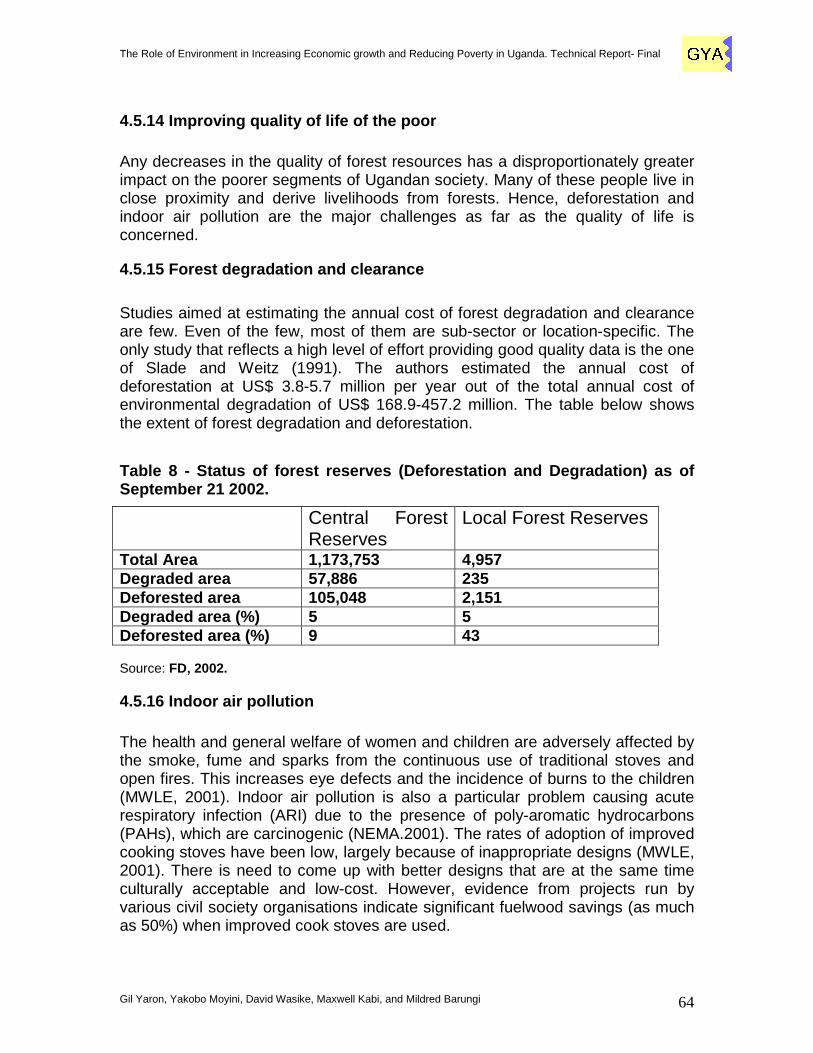
The Role of Environment in Increasing Economic growth and Reducing Poverty in Uganda. Technical Report- Final
Gil Yaron, Yakobo Moyini, David Wasike, Maxwell Kabi, and Mildred Barungi 64
4.5.14 Improving quality of life of the poor Any decreases in the quality of forest resources has a disproportionately greater impact on the poorer segments of Ugandan society. Many of these people live in close proximity and derive livelihoods from forests. Hence, deforestation and indoor air pollution are the major challenges as far as the quality of life is concerned.
4.5.15 Forest degradation and clearance
Studies aimed at estimating the annual cost of forest degradation and clearance are few. Even of the few, most of them are sub-sector or location-specific. The only study that reflects a high level of effort providing good quality data is the one of Slade and Weitz (1991). The authors estimated the annual cost of deforestation at US$ 3.8-5.7 million per year out of the total annual cost of environmental degradation of US$ 168.9-457.2 million. The table below shows the extent of forest degradation and deforestation. Table 8 - Status of forest reserves (Deforestation and Degradation) as of September 21 2002.
Central Forest Reserves
Local Forest Reserves
Total Area 1,173,753 4,957 Degraded area 57,886 235 Deforested area 105,048 2,151 Degraded area (%) 5 5 Deforested area (%) 9 43 Source: FD, 2002.
4.5.16 Indoor air pollution The health and general welfare of women and children are adversely affected by the smoke, fume and sparks from the continuous use of traditional stoves and open fires. This increases eye defects and the incidence of burns to the children (MWLE, 2001). Indoor air pollution is also a particular problem causing acute respiratory infection (ARI) due to the presence of poly-aromatic hydrocarbons (PAHs), which are carcinogenic (NEMA.2001). The rates of adoption of improved cooking stoves have been low, largely because of inappropriate designs (MWLE, 2001). There is need to come up with better designs that are at the same time culturally acceptable and low-cost. However, evidence from projects run by various civil society organisations indicate significant fuelwood savings (as much as 50%) when improved cook stoves are used.

The Role of Environment in Increasing Economic growth and Reducing Poverty in Uganda. Technical Report- Final
Gil Yaron, Yakobo Moyini, David Wasike, Maxwell Kabi, and Mildred Barungi 65
4.6 Opportunities
4.6.1 General Opportunities exist for the realisation of the full value of the forestry sub-sector for the poor and others who live in or near forests. The Ugandan economy can also benefit much more than it currently does from forests, including environmental and biodiversity benefits. While at the national level forests have an important role to play in sustaining economic growth and alleviating poverty, due to market failures and governance problems, this potential is at present rather limited. Consequently, forest values are not taken sufficiently into account by planners and policymakers concerned with economic growth and poverty reduction. Forests, through their vertical (backward and forward) and horizontal linkages have multiplier effects on other sectors of the Ugandan economy and thus can act as strong stimuli for poverty eradication by: • greater contribution to GDP; • encouraging employment through job creation in rural areas; • promoting biomass-based electricity production; • promoting industrial development in rural area - rural growth centers (RGCs)
through the establishment of primary wood and non-wood processing; and • expansion and diversification of exports.
4.6.2 Specific Opportunities Listed below are the specific opportunities that the forestry sub-sector can make towards significant contributions to poverty eradication.
PEAP Pillar 1: Fast economic growth and structural transformation
1. Facilitating forest products trade on the principle of sustainable forest
management.
2. Promoting private sector led labour – intensive forestry – based
employment through the establishment of industrial plantations. 3. Pricing forest products and services at their economic rent values. 4. Developing commercial markets for feasible ecological services (such as
carbon sequestration under the Kyoto Protocol).
PEAP Pillar 2: Security and governance 1. Improving access to forest resources by the poor.

The Role of Environment in Increasing Economic growth and Reducing Poverty in Uganda. Technical Report- Final
Gil Yaron, Yakobo Moyini, David Wasike, Maxwell Kabi, and Mildred Barungi 66
2. Eliminating gender bias in forestry resource ownership and control. 3. Strengthening the capacity of districts and lower level local governments
for effective forest management. 4. Ensuring equitable share of forestry revenues between the centre, local
governments and the communities. 5. Enhancing opportunities for joint or collaborative forest management
(JFM/CFM). 6. Assessing the feasibility of a water charge to be paid for better forest
management and as a reward to communities living adjacent to protection (watershed) forests.
Pillar 3: Increasing Incomes of the Poor 1. Promoting rural employment (see Pillar 1). 2. Promoting establishment of woodlots for firewood and building poles, and
planting of fruit trees for supplemental income. 3. Enhancing the value of, and developing domestic and international
markets for, non-timber forest products (handcrafts, furniture, ornamentals, herbs, fruits and honey).
4. Providing extension services for agroforestry to enhance agricultural
productivity.
Pillar 4: Improving the quality of life of the poor
1. Promoting change in attitudes in favour of conservation. 2. Promoting clean kitchen construction together with better-designed and
efficient cookstoves.
3. Promoting soil and water conservation.
4.7 Monitoring
4.7.1 Introduction Poverty monitoring is the activity of investigating levels, changes and causes of poverty, including the success or failure of public actions intended to reduce poverty, such as the actions in PEAP (MoFPED, 2002). The structure of poverty

The Role of Environment in Increasing Economic growth and Reducing Poverty in Uganda. Technical Report- Final
Gil Yaron, Yakobo Moyini, David Wasike, Maxwell Kabi, and Mildred Barungi 67
monitoring system is designed to clarify the relation of public actions to poverty reduction; and consists of analysing indicators at three levels - outcomes, outputs and inputs (MoFPED, 2002). It is therefore, imperative that suitable indicators are identified for monitoring the contribution of the forestry sub-sector to economic growth and poverty reduction. A few indicators have been suggested, grouped around the four pillars of the PEAP.
1.1.1 Indicators From the list of indicators presented in the National Forest Plan (MWLE, 2002), four indicators are proposed for Pillar 1, two for Pillar 2, three for Pillar 3 and an equal number for Pillar 4, giving a total of twelve. These indicators are presented in the table below.
Table 9 - Indicators
PEAP Indicators and Institutions Responsible 1. Value of commercial investment in forestry business (NFA/UIA, UBOS annual
national accounts
2. Volumes and values of forest products traded (domestic and international) – URA/UBOS
3. Employment in the forestry sub-sector disaggregated by gender, socioeconomic
group and geographic location (UBOS 5-year labourforce survey).
4. Value and % contribution of forestry to GDP (annual UBOS) Pillar 2 1. Number of effective CFM agreements in Forest Reserves (NFA annual report)
2. Number of illegal forest activities (NFA annual report)
Pillar 3 1. Percentage of household income derived from different forestry-related enterprises (UBOS in National Household Survey).
2. Number of poor people with tree growing permits in forest reserves
3. Number of farmers using improved agroforestry technologies (UBOS, NAADS)
Pillar 4 1. Distance to collect fuelwood (UBOS)
2. Rate of deforestation (NFA through the National Biomass Study reports)
3. Number of households and business using improved biomass energy technologies (UBOS, NFA, NAADS)

The Role of Environment in Increasing Economic growth and Reducing Poverty in Uganda. Technical Report- Final
Gil Yaron, Yakobo Moyini, David Wasike, Maxwell Kabi, and Mildred Barungi 68
5 Wetland Sub-Sector
5.1 Introduction Some 350 million years ago, wetlands produced and preserved many of the fossil fuels (coal and oil) upon which the world depends today (Barbier et al, 1997). Wetlands have been described as ‘kidneys of the landscape’ because of the functions they can perform in the hydrological and chemical cycles, and as ‘biological supermarkets’ because of the extensive food webs and rich biodiversity they support (Mitsch & Gosselink, 2000). Wetlands are among the world’s most productive ecosystems, with three groups of features, namely: components, functions and attributes (Barbier, et al, 1997). The components of the system are the biotic and non-biotic features, which include the soil, water, plants and animals. The interactions between the components express themselves as functions, including nutrient recycling and exchange of water between the surface and the groundwater and the surface and the atmosphere. The system also has attributes such as the diversity of species (Barbier, et al, 1997). What used to be called a swamp is now referred to as wetland. To a large extent, wetlands were referred to as wastelands. The Box below shows various definitions of wetlands. The Wetland Sub-sector of ENR prepared a Wetland Sector Strategic Plan (WSSP) in 2001 which is now eligible for Poverty Action Fund resources (MWLE, 2001). It is the only ENR sub-sector that has been able to qualify for PAF
Box 9 - Wetland Definition
Wetlands are “areas of marsh, fen, peat-land or water, whether natural or artificial, permanent or temporary, with water that is static or flowing, fresh, brackish or salt, including areas of marine water the depth of which at low tide does not exceed six metres” (Ramsar Convention, 1971). A wetland is “a vegetated area of land that is flooded permanently or seasonally” National Wetlands Conservation & Management Programme, 1998). Wetlands are “lands transitional between terrestrial (dry land) and aquatic (water) systems where the water table is usually near or at the surface, or the land is covered by shallow water (less than 6 metres deep); they contain animals and plants specially adapted to these waterlogged conditions” (National Wetlands Conservation & Management Programme, 2000; booklet no. 15). Source: HASKONING et al (2001)

The Role of Environment in Increasing Economic growth and Reducing Poverty in Uganda. Technical Report- Final
Gil Yaron, Yakobo Moyini, David Wasike, Maxwell Kabi, and Mildred Barungi 69
funding. Therefore, the purpose of this section is to present the contribution of wetlands to the economy of Uganda. Many studies have been carried out to characterise such contributions. Unfortunately, they are location or wetland specific. The relevance of the wetland sub-sector to economic growth and poverty reduction is shown in the Table below.
Table 10- PEAP and the Wetlands Sub Sector
PEAP • Relevance of Wetlands Pillar 1 • contribution to GDP
• export potential • employment
Pillar 2 • ownership, management and control Pillar 3 • income earnings from wetlands
products • support to rural livelihoods
Pillar 4 • as sources of food • as sources of clean water
5.2 Resource Status and Values Uganda’s wetlands are widespread and complex in terms of structure and function. Wetlands cover well above 30,000 km2 or 13% of the country. Wetlands play a vital role in the socio-economy of the country, providing goods and services, as well as performing other ecological functions. Wetlands also have intrinsic attributes. The functions of wetlands range from local through national to globe scales. Wetlands produce a number of environmental direct use goods including clay, sand, handcraft materials, medicines, water and various foods. They also provide a number of services including providing habitats to biodiversity, recharging groundwater and acting as cultural and aesthetic sites (Balirwa, 1998; Kadleck and Knight, 1996; Mitsch and Gossenlink, 2000). The cover distribution for wetlands in Uganda is summarised in the table below.
Table 11 - Wetland Areas by Ownership Categories
Location Management Area (ha) Protected area LFR FD 177 CFR FD Joint Management FD 5965 UWA 318 Animal Sanctuary UWA 20 Game Reserve UWA 4862 National park UWA 21256 Other Private land 451,439 Total 484,037
Source: FD, (1999)
The Role of Environment in Increasing Economic growth and Reducing Poverty in Uganda. Technical Report- Final
Gil Yaron, Yakobo Moyini, David Wasike, Maxwell Kabi, and Mildred Barungi 70
Some wetlands are located in CFRs, LFRs Game Reserves, National Parks and Bird sanctuary. They are as such accorded different levels of management intensity depending on where they happen to be located. In protected areas, management of wetlands may be under FD, UWA or under joint management between FD and UWA. Wetlands play a major role in providing livelihood for the rural communities. About 5 million people directly depend on wetland for survival. A wide range of products such as: food, medicine, water, construction materials, fish and materials for handcraft production are harvested from the wetlands by the adjacent human populations. Available data permit some of this use to be valued. Adjacent communities also rely heavily on wetlands for agricultural production. Wetlands are also important for their contribution to water supply through water purification. Macro-economic approaches recognise the role of environmental and biodiversity goods and services to society: social, economic and cultural aspects that encompass provision of daily household subsistence needs including food security to the overall contribution to national economy through trade, employment, health services, recreation and global services such as carbon sinks and reservoirs. There are however, difficulties in fixing exact monetary values especially to non-use and indirect benefits of environment. In most cases, such benefits and services have been undervalued or abused. There is a need for valuation of environmental and biodiversity goods and services of wetlands to enable better decision-making and provide for better management. Some effort has however been put in at least estimating some economic values of Uganda’s wetlands such as: Jinja urban wetland, Lake Nabugabo Ramsar site; and Pallisa but only a few case studies have been so far published. Wetlands include areas of seasonally flooded grassland, swamp forest, permanently flooded papyrus and grass swamp, and upland bog. Wetlands have intrinsic attributes, perform functions and produce goods and services. Some of these are of primary local interest, but others have regional, national, or international importance. Together, the wetlands represent considerable ecological, social and economic value (MWLE, 2001). Estimation of these values is difficult. Examples of attempts include the economic valuation of Nakivubo wetland in Kampala and assessment of the economic value of Pallisa District wetlands. At community level, many wetlands are at best common property areas. There is free entrance and free exit. This scenario has redefined the roles of wetlands as areas set aside for edge cultivation, fishing, grazing, and harvesting of natural products. While they provide significant livelihood enhancing measures for the rural poor, they have been considerably degraded because of the common property attribute that characterises most of them. According to (MoFPED, 1998), wetland users in Uganda access at-least one quarter of the 4,395 km2 of papyrus areas. If each hectare of papyrus swamp yields 20 tonnes of dry papyrus culms a year, and the market price of papyrus for construction materials is UShs 54/kg, the minimum economic value of papyrus to Ugandans is about UShs 6,000 million a year (Emerton, et al, 1999). The

The Role of Environment in Increasing Economic growth and Reducing Poverty in Uganda. Technical Report- Final
Gil Yaron, Yakobo Moyini, David Wasike, Maxwell Kabi, and Mildred Barungi 71
projection of the economic value of wetlands for papyrus is summarized in the table below. Table 12 - Value of Papyrus Utilisation 1998 (billi on UShs)
Region Area under papyrus sq km
Value of Papyrus
Central 1,400 1,887,887 Eastern 1,531 2,064 Northern 542 731 Western 922 1,242 Total 4,395 5,924 Source : Moyini and Muramira, (2002) Natural vegetation in wetlands and floodplains also provide an important source of dry season grazing for livestock. a total value of about UShs 18 billion/year to livestock production. (Table below) The assumption is that 10 percent of off-farm pasture fodder and forage intake is accounted for by wetlands vegetation, dry-season grazing (Emerton and Muramira 1999).
Table 13 - Value of Wetlands for Livestock 1998
Region Livestock population (TLUs)
Total Value of Production UShs mill
Value of Wetlands UShs mill
Central 1,090,570 74,043 1,747 Eastern 940,837 55,509 2,206 Northern 1,185,889 65,922 5,619 Western 2,087,854
169,925 8,542
TOTAL 5,305,090 365,399 18,114 Source Emerton and Muramira (1999) A study by Emerton et al., (1999) on the present economic value of Nakivubo urban wetland revealed that the combined resource and service values were in the range of $3,800 - $7,600/ha/year. Therefore, with 3 million ha of wetlands in Uganda and using the lower value estimate, the wetlands in the country potentially generate $11.400million annually. The areas traditionally known as swamps occupy 30% of total wetlands area, about 900,000 ha. Put at the lower value estimate, swamps alone generate $3.420 million/year.

The Role of Environment in Increasing Economic growth and Reducing Poverty in Uganda. Technical Report- Final
Gil Yaron, Yakobo Moyini, David Wasike, Maxwell Kabi, and Mildred Barungi 72
5.3 Contribution to the Economy
5.3.1 Fast Economic Growth and Structural Transform ation Contribution to GDP Official Government Statistics presented in the System of National Accounts (SNA) does not include the contribution of wetlands to gross domestic product (GDP). This is partly so because contributions of wetlands are captured in the statistics of other sectors and sub-sectors. In a pioneering work by HASKONING et al (2001), the value of all wetlands goods and services in a pilot area covering 125,205 ha or 4.2% of the national wetland area, was estimated at UShs 100 million or US $ 55.6 million per year. This value comprised the benefits of typical wetland goods and services as well as those of the non-typical ones (like agricultural cropping, livestock grazing, fishing, etc). The amount, when converted into economic prices was equivalent to UShs. 63,800 million or US $ 35.4 million per year. Based on these values, the contribution of all goods and services of wetlands in the pilot areas was estimated at 0.76% of total GDP. However, when consideration is given to the fact that some environmental goods and services are non-marketed and the foregoing is only applied to the monetary sector of GDP, in 1999, the wetlands of the pilot areas contributed 3.3% of this. Furthermore, the value of typical wetland goods and services (such as craft and construction materials from papyrus and the Phoenix palm, tertiary wastewater treatment, most option values and all non-use or ecological functions, was estimated at UShs 64,600 million per year or US $ 35.9 million, representing 65% of all wetland benefits. In economic terms, the value was equivalent to UShs. 41,227 million per year. Consequently, the economic value of typical wetland goods and services represented 2.1% of the national value of all non-monetary products (HASKONING et al, 1999). The distribution of typical wetland goods and services in the HASKONING et al (2001) pilot areas of US $ 35.9 million is shown in the Figure below.

The Role of Environment in Increasing Economic growth and Reducing Poverty in Uganda. Technical Report- Final
Gil Yaron, Yakobo Moyini, David Wasike, Maxwell Kabi, and Mildred Barungi 73
Figure 10- Percent Distribution of Annual Economic Values of Wetlands in Selected Pilot Areas Around and in L.Victoria
Option Values (16.4%)
20%
Direct Extractive (15.9%)
19%
Indirect Human Use (32.3%)
20%
Existence of non-Use Benefits (35.4%)
41%
Total Annual Value: US $ 35.9 million per year Source: HASKONING et al (2001)
5.3.2 Domestic and International Trade in Wetland P roducts Wetland products such as mats made from the Phoenix palm leaves and rattan are actively traded in the domestic market and could also find markets internationally. Uganda’s fish exports could also be boosted from sustainable aquaculture operations. The large share of rice production in Uganda consists of paddy rice. The sustainable production of paddy rice has a ready market on the domestic scene and could even be exported depending on the scale of operations. For example, according to Karanja et al (2001), the value of palm mats in Pallisa was estimated to be US$ 3,332/year;while the value of rice growing was US$ 4.5 million and rice milling US$ 3.4 million annually.
5.3.3 Employment Activities in wetland areas result in employment, but largely in the informal sector except for operations such as Uganda Clays Ltd in Kajjansi. As a result, most of this employment is unrecorded. The HAKONING et al (2001) study did attempt to make estimates of employment rates for each of the products harvested from wetlands in the pilot area. Review of the data illuminates on two things. First, each wetland is unique in its attributes, the activity and location. Table 14 was

The Role of Environment in Increasing Economic growth and Reducing Poverty in Uganda. Technical Report- Final
Gil Yaron, Yakobo Moyini, David Wasike, Maxwell Kabi, and Mildred Barungi 74
derived from the study and shows the varying unit levels of labour requirements between and even for the same activities. An extrapolation of employment levels in each of the pilot wetlands for selected economic activities is shown in Table 15. The data clearly shows for the selected activities in 4% of Uganda’s wetland areas, annual employment is in the order of about 318,000 persons.
Table 14 - Unit Labour Utilisation Rates Per ha (P erson days) for Selected Wetlands
Cropping Papyrus harvesting
Poles Harvesting
Cattle Grazing
Brick Making
Sand Digging
Fishing
Berkeley Bay/MacDonald Bay
270 - 0.30 0.37 - - 810
Napoleon Gulf 525 85 0.30 0.37 - - 810
Murchison Bay 525 85 0.30 0.37 616* 125**
840 -
Sango Bay 525 - 0.30 0.37 - - -
Ssese (Kalanga) Islands
525 - 0.30 0.37 - - -
• - urban rate; **
- rural rate •
Source: HASKONING et al (2001
Table 15 - Estimated Annual Employment in Selected Wetlands for Some Key Activities Cropping Papyrus
Harvesting Pole Harvesting
Cattle Herding
Sand Digging
Fishing TOTAL
Berkeley Bay/MacDonald Bay (19,717 haHA)
17,745 - 20 24 - - 53,236 71,025
Napoleon Gulf (2782 ha)
4,868 788 3 3 - - 7,511 13,173
Murchison Bay (12,404 ha)
21,707 3,514 12 15 15,257 34,731 - 75,236
Sango Bay (12, 404 ha)
150,234 - 86 106 - - - 150,426
Ssese Islands (4515 ha)
7,901 - 5 6 - - - 7,912
TOTAL 202,455 4,302 126 154 15,257 34,731 60,747 317,772 • - based on 300 working days per year. Source: derived from unit rates (Table 5 and area of each wetland – Based on work of HASKONING et al (2001).
5.3.4 Livelihoods The biggest contribution of wetlands to Uganda’s economy is in its support of rural and urban livelihoods. Several studies have illustrated this contribution clearly.

The Role of Environment in Increasing Economic growth and Reducing Poverty in Uganda. Technical Report- Final
Gil Yaron, Yakobo Moyini, David Wasike, Maxwell Kabi, and Mildred Barungi 75
For example, according to Karanja et al (2001), Pallisa District with 36% of its area covered by wetland areas, derives significant benefits annually. In monetary terms, the total value of wetland goods and services is UShs. 56,024 million or US$ 34.5 million per annum (Table below). Using a conversion factor of 0.83, this amount translates into annual economic benefit of about US$ 28.6 million. On a per hectare basis, the economic value is equivalent to US$ 402/ha/year (or in financial terms about US$ 485/ha/year). Table 16 - Summary of the economic value of wetland goods and services in Pallisa district
Economic value (UShs.) Wetland good/service Total value of wetland
Goods/services (Ushs/year) Equivalent in US$*
Yams cultivation wetland areas (Namatala alone)
17,324,412,500.00 10,694,081.79
Grass harvesting for roof thatching in Pallisa district
2,751,833,000.00 1,698,662.35
Value of the raw papyrus vegetation in Pallisa district
3,120,000,000.00 1,925,925.93
Papyrus mats at Budaka depot
10,665,000.00 6,583.33
Papyrus mats at Pallisa market
21,264,000.00 13,125.93
Papyrus mats at Iki Iki 1,536,500.00 948.46 Palm mats at Pallisa market 2,214,000.00 1,366.67 Palm mats at Budaka 3,184,200.00 1,965.56 Water transport at Kasoda 250,200,000.00 38,611.11 Fish value in Pallisa district 875,385,000.00 540,361.11 Wetland trees (Acacia) value in Pallisa district
12,368,780,096.00 7,635,049.44
Pottery value in Pallisa district
1,388,327,740.00 856,992.43
Sand harvesting at Limoto 858,385,000.00 529.94 Sugarcane revenues at Namatala
79,620,000.00 49,148.15
Rice growing value in Pallisa 7,353,910,000.00 4,539,450.77 Rice milling at Pallisa 5,564,100,000.00 3,434,629.63 Soil fertility maintenance value in Pallisa district
688,842,000.00 425,211.11
Water recharge (replacement cost)
3,293,120,000.00 2,032,790.12
Water treatment costs 926,320,000.00 571,802.47 Water irrigation value 15,000,000,000.00 9,259,259.26 Totals 56,024,572,776.00 34,467,236.28 * 1 US$ = UShs 1620.00 based on 2000 averages
Total wetland area in Pallisa (Ha)
71,100.00 71,100.00
Value of Pallisa district wetlands (UShs/Ha/Year)
787,968.67 484.77
Source: Karanja et al (2001)
The Role of Environment in Increasing Economic growth and Reducing Poverty in Uganda. Technical Report- Final
Gil Yaron, Yakobo Moyini, David Wasike, Maxwell Kabi, and Mildred Barungi 76
The HASKONING et al (2001) report on the economic value of wetland areas in and around L.Victoria came up with a unit financial value of US$ 278/ha/year, or US$ 231/ha/year in economic terms. Taking these examples which include both urban but largely rural wetlands, the economic value of all wetlands in Uganda would be an average of US$ 690 – 1,200 million/year if those areas we extrapolate to are as valuable as the wetlands in the L.Victoria area. 5.4 Challenges
5.4.1 Introduction Despite the significant contribution of wetlands to the economy of Uganda, the sub-sector faces several challenges, the key one being conversion into other uses. Wetlands, occupying 13% of the area of Uganda contribute fairly little to the market economy. Most of the contribution is in the non-monetary and informal sectors. Also, unclear property regimes are one of the reasons advanced for encroachment into wetlands; which in turn have raised the costs of managing the resource. For the rural poor, wetlands could, if well managed offer sustainable sources of income generation. To do so would require a well-developed market for wetland products. At present, market opportunities are limited. Some guidelines have been developed for the wise use of wetlands. Others need to be developed. Perhaps the greatest challenge wetlands face is degradation of the resource. Table below shows the foregoing challenges arranged to correspond to the four pillars of PEAP.
Table 17 - Challenges in the Wetland Sub-Sector
PEAP Challenges Pillar 1 • Limited contribution to the market
economy Pillar 2 • unclear property rights
• high management costs • limited market development and
promotion for wetlands products • few sustainable use guidelines
Pillar 4 • wetland degradation
5.4.2 Contribution to Market Economy The studies of Emerton et al (1999), Emerton and Muramira (1999), Karanja et al (2001) and HASKONING et al ( 2001) clearly show that the largest share of wetland values are the non-direct use ones. For example, Emerton et al (1999) estimated the direct value of Nakivubo Wetland at USh 165.61 million/year out of a total value of USh 1,763.49-2,479.64 million. This means direct values represent only 6.7-9.4 % of the total, and this in an urban wetland. The

The Role of Environment in Increasing Economic growth and Reducing Poverty in Uganda. Technical Report- Final
Gil Yaron, Yakobo Moyini, David Wasike, Maxwell Kabi, and Mildred Barungi 77
HASKONING et al (2001) study estimated direct extractive use at 15.9% of total value.
5.4.3 Property rights Previously, we have seen the distribution of wetlands by ownership class. The data indicate that less than 10% of Uganda’s wetlands are located in protected areas (forest reserves or wildlife areas). The rest occur on private or communal land. Where wetlands are on communal lands, they are generally considered common property resources. Up until the enactment of the Local Governments Act 1997, the wetlands of Uganda except those on private land had no clearly defined ownership. Now the law has specified that such wetlands are the responsibility of the districts. The unclear property regimes have to some extent contributed to higher management costs.
5.4.4 Financing wetland management Without intervention, Uganda’s wetland areas risk being further degraded or even lose their functions altogether. The Wetland Sector Strategic Plan has an indicative budget of US $ 28.1 million for the period 2001 to 2010 (MWLE, 2001). However, according to the Wetlands Inspection Division (WID), the budget should be considered a minimum requirement1.. Emerton et al (2001) in the valuation of Nakivubo Wetland proposed an innovative financing strategy (Box below). The authors call for innovative financing since there is little possibility that management costs can be entirely and adequately provided by Government.
1 . Paul Mafabi, Personal Communications

The Role of Environment in Increasing Economic growth and Reducing Poverty in Uganda. Technical Report- Final
Gil Yaron, Yakobo Moyini, David Wasike, Maxwell Kabi, and Mildred Barungi 78
Box 10 - Financing Nakivubo Wetland
Source : Emerton et al (1999).
Table 18 - Indicative Expenditure Budget by Major C ost Categories (US$
millions)
Cost category Year Year groups
2001 2002 2003 Total 2001-
3
Total 2001-
5
Total 2006-10
Total 2001-
2010
Institutional
support
0.04 0.03 0.04 0.11 0.11 0.18 0.28
Policy and
legislation
0.04 0.03 0.02 0.09 0.13 0.09 0.22
Awareness and 0.11 0.13 0.16 0.40 0.81 1.44 2.25
Wetland management requires a financing strategy. There is great potential for funding wetland management from existing water and sewerage fees. Mechanisms must be found to retain at least part of the revenues raised, and return them directly to the management of Nakivubo wetland. Funds will need to be raised to cover all the expenditures. There is little---if any---possibility that they can be met from existing government expenditures. Uganda already faces a severe public sector deficit and many other sectors of the economy compete with wetlands for scarce funds. It is likely that Nakivubo wetland will have to be financially sustaining, and raise its own funds to cover the management costs it incurs. The main potential for raising funds for the management of Nakivubo comes from the goods and services it yields. Despite their high economic value, those goods and services are currently received free of charge by wetland beneficiaries, including both resource users and the households and industries who depend on waste treatment and water purification activities---the groups who carry out those activities are already among the most economically marginalised sectors of Kampala’s population and the imposition of user fees is unlikely to be socially equitable, politically acceptable or practically implementable. There is however no reason why other recipients of wetland water treatment and purification services should not be charged for the benefits they receive.

The Role of Environment in Increasing Economic growth and Reducing Poverty in Uganda. Technical Report- Final
Gil Yaron, Yakobo Moyini, David Wasike, Maxwell Kabi, and Mildred Barungi 79
training materials
Wetland inventory
and monitoring
0.10 0.11 0.16 0.37 0.86 1.72 2.57
Community
management
planning
0.13 0.15 0.20 0.47 0.06 2.56 3.62
District support 0.10 0.13 0.18 0.40 0.94 2.31 3.2 5
Research 0.01 0.03 0.04 0.09 0.24 0.54 0.78
Staff development 0.07 0.06 0.06 0.19 0.30 0.18 0. 48
Wetland protection
& gazettement
0.10 0.13 0.16 0.38 0.82 1.73 2.55
Management and
operations
0.70 0.81 0.96 2.47 4.74 7.30 12.03
Total 1.40 1.61 1.96 4.97 10.09 17.99 28.10
Source: MWLE (2001)
5.4.5 Market Development Since 1986, Uganda has made steady progress towards export market diversification. Previously, Uganda’s exports were almost exclusively dependent on traditional commodities (coffee, cotton, tobacco and tea). By 2001, the traditional exports accounted for only 38.34% of total exports; while the non-traditional export items accounted for the rest, or 61.66% (MoFPED, 2002). Unfortunately, crafts such as mats and wicker furniture whose raw material is largely harvested from wetlands do not feature at all as significant export items.
5.4.6 Sustainable Use Guidelines The Wetlands Inspection Division through its National Wetlands Programme has developed a number of guidelines to help guide developers in the sustainable use of the resource. These include guidelines for rice farming and aquaculture. More of these guidelines are needed for the other wetland products.

The Role of Environment in Increasing Economic growth and Reducing Poverty in Uganda. Technical Report- Final
Gil Yaron, Yakobo Moyini, David Wasike, Maxwell Kabi, and Mildred Barungi 80
5.4.7 Wetland Degradation Wetlands are one of the major national assets that are faced with significant threats from both rural and urban activities. Over the last 20 years, the pressure on wetlands, both in urban and rural areas has been increasing. Currently, the wetlands in Jinja district are considered to be the most degraded in the country. In Soroti and Pallisa, extensive areas of seasonal wetlands have been brought under intensive cultivation. The National Environment Management Authority estimates that 64% of the total seasonal wetlands in Iganga and 68% in Pallisa have been reclaimed for rice cultivation (NEMA, 2001). In Kampala, many sections of wetlands have been converted to industrial use or have gradually been taken over by semi-urban residential housing and associated uses such as cultivation and waste management disposal (MWLE, 2001). Nationally, it is estimated that 2,376 sq. km of Uganda’s wetland areas have been drained. This represents an increase of 98.3% in area reclaimed since the 1960s (NEMA, 2001). The economic costs associated with wetland degradation need to be offset against any gains arising from its modification, whether for agricultural, industrial or residential purposes (Emerton, et al, 1999). Wetland degradation, as well as leading to economic costs in terms of goods and services, would have distributional implications (Emerton, et al, 1999). According to the authors, the impacts of wetland degradation for different groups must also be taken into account when developments are planned and implemented. Oftentimes the gains from wetland modification accrue to individual owners, whereas the economic impacts associated with degradation are broader social costs. They are reflected in subsistence, income and employment losses for some of the poorest segments of Ugandan society and as increased public expenditure for mitigations. The poorest segments of society already face pressing constraints in income and expenditure, and are not in a position to bear increased costs or additional expenditures (Emerton, et al, 1999). 5.5 Opportunities
5.5.1 Introduction Wetlands represent an important natural resource in Uganda. Their contributions to the national economy, particularly in the non-monetary and informal sector have been shown to be significant. They support rural livelihoods and are, therefore, important to the poorest segments of society. The question is, are there opportunities for Uganda’s wetlands resources to contribute additionally to economic growth and poverty reduction? The answer is a definite yes as further elaborated below. These opportunities concern or are related to:

The Role of Environment in Increasing Economic growth and Reducing Poverty in Uganda. Technical Report- Final
Gil Yaron, Yakobo Moyini, David Wasike, Maxwell Kabi, and Mildred Barungi 81
• promoting wetland products in the export market;
• introducing pro-poor innovative financing mechanisms;
• raising the wetland gate prices for products sold by the rural poor in an effort to increase their incomes; and
• improving upon the legal framework for wetland ownership, management and control.
5.5.2 Export promotion Many wetland products such as mats, wicker furniture and others are potentially exportable. However, production is diffuse with no established channels of marketing, while product supply is irregular. Product quality standards are also absent. These systems need to be put in place to enhance the contribution of wetland products to exports and thereby employment.
5.5.3 Innovative Financing Opportunities potentially exist for capturing some of the ecological values of wetlands. This is particularly so for urban wetlands which purify incoming sources of water and act as sinks for industrial and domestic effluents. A part of the money raised in this manner could be allocated for community-based wetland management activities to support the livelihoods of communities living adjacent to wetland areas.
5.5.4 Better Product Pricing Trade in wetland products in Uganda is largely monopsonistic. That is, many small producers selling to a few buyers. Often the price differential between the producers and the retailer are huge. A Phoenix palm mat which sells for UShs 1,500 at Sango Bay can easily fetch an average price of UShs 6,000 in Kampala. Better access and the development of efficient marketing channels should result in increased income for the producers of wetland products, the majority of whom are women.
5.5.5 More Effective legislation Globally, Uganda was only second to Canada in coming up with a national policy on wetland management and conservation; while in Africa it was the first (NEMA, 1999). Since the National Wetlands Management and Conservation Policy was introduced in 1996, WID has, through the National Wetlands Programme, drafted legislation to facilitate enforcement of the policy provisions and to clarify upon the ownership, management and control of the country’s wetlands. It is now time to

The Role of Environment in Increasing Economic growth and Reducing Poverty in Uganda. Technical Report- Final
Gil Yaron, Yakobo Moyini, David Wasike, Maxwell Kabi, and Mildred Barungi 82
continue with this process and ultimately obtain legislation that is specific to wetlands.
5.6 Monitoring
5.6.1 Introduction Wetland resources are important to the economy of Uganda and in supporting rural livelihoods. Therefore, this important resource needs to be used wisely. One of the tools to ensure that the attributes of wetlands are not impaired is to regularly monitor the status of the resource. To monitor requires a set of suitable indicators.
5.6.2 Indicators The following eight indicators are proposed for consideration for possible inclusion in the PEAP’s set of indicators. They have been grouped according to the four pillars of PEAP (Table below).
Table 19 - Proposed Wetland Monitoring Indicators
PEAP Indicator and Responsibilities Pillar 1 • % share of wetland products in
exports (WID, UBOS, UEPB) • % share of national employment
derived from wetland activities (UBOS 5 – year Manpower Survey)
Pillar2 • no. of critical wetlands gazetted (WID)
• no. of community wetland management plans prepared (WID)
• no of districts with District Wetland Plans (DWPs) – (WID)
• budget allocated for wetland as a % of district total (WID)
Pillar 3 • share of household income derived from wetlands (UBOS through National Household Survey)
Pillar 4 • % of wetland area degraded (NBS)

The Role of Environment in Increasing Economic growth and Reducing Poverty in Uganda. Technical Report- Final
Gil Yaron, Yakobo Moyini, David Wasike, Maxwell Kabi, and Mildred Barungi 83
6 The Wildlife and Tourism Sub-Sector
6.1 Introduction Although not as much as in the 1960s, Uganda does possess sizeable and in some cases (e.g. mountain gorilla) unique populations of wildlife both inside and outside protected areas. The wildlife resources, especially those inside protected areas, constitute the backbone of tourism in the country. The emphasis is on eco-tourism as opposed to mass tourism. According to UNDP/WTO (1993), tourism can bring many economic benefits by way of foreign exchange earnings and contributions to the balance of payments, income and employment generation as well as revenues for governments. Through tourism, regional development can be diversified and enhanced by creating a higher level of demand for intermediate goods and services; that is, through its multiplier effects (UNDP/WTO, 1993). With respect to the PEAP, the relevance of the sub-sector is presented in the Table below which in addition recognises household livelihood benefits from wildlife resources outside protected areas.
Table 20 - PEAP and the Tourism and Wildlife Sub-Se ctor
PEAP Relevance to PEAP Pillar 1 • export earning
• employment • multiplier effects on other sectors
Pillar 2 • decentralised management of wildlife outside protected areas
Pillar 3 • benefit/revenue sharing with the
local communities • opportunities for income
generation through Wildlife use Rights
Pillar 4 • cultural enrichment • contribution to better nutrition
6.2 Status The wildlife estate was rationalised during the 1997 – 2002 period through the EC – supported Protected Area Assessment Plan. An estimated 56,000 km2 is gazetted to ensure the protection of wildlife in Uganda. The Uganda Wildlife Authority (UWA) has the mandate to manage this estate. At present there are 10 national parks, 10 wildlife reserves, 7 wildlife sanctuaries, and 13 community wildlife areas. Collectively, these areas occupy 48,398 km2 of which 20,794 km2

The Role of Environment in Increasing Economic growth and Reducing Poverty in Uganda. Technical Report- Final
Gil Yaron, Yakobo Moyini, David Wasike, Maxwell Kabi, and Mildred Barungi 84
is protected under the management of UWA. The balance of the area of the estate falls under other categories. This wildlife estate is in large part the main attraction for tourists visiting Uganda. By 2001, the largest number of tourist visitors came from Kenya, followed by Britain, then United States of America (MTTI, 2001). Of the total number of tourists who visited Uganda in 2001, 22% stated that their main purpose of visit was holidaying (leisure and vacation) as shown in the Figure below. The majority of tourists who visited the wildlife protected areas during the 2000/01 period were Ugandans (42%), followed by foreign residents and foreign non-residents (each 20%), and then students (12%). Local communities accounted for 5% of the visitors to the wildlife protected areas (UWA, 2001).
0.30%
5%
3%
4%
22%
24.90%
41%
Percentage
Not stated
Other
Transit
Religious Pilgrimage
Holiday
Visiting Friends/relatives
Business
Pur
pose
of V
isit
Figure 11. Visual illustration of tourists to Ugan da by main purpose of visit
Source : MTTI (2001)
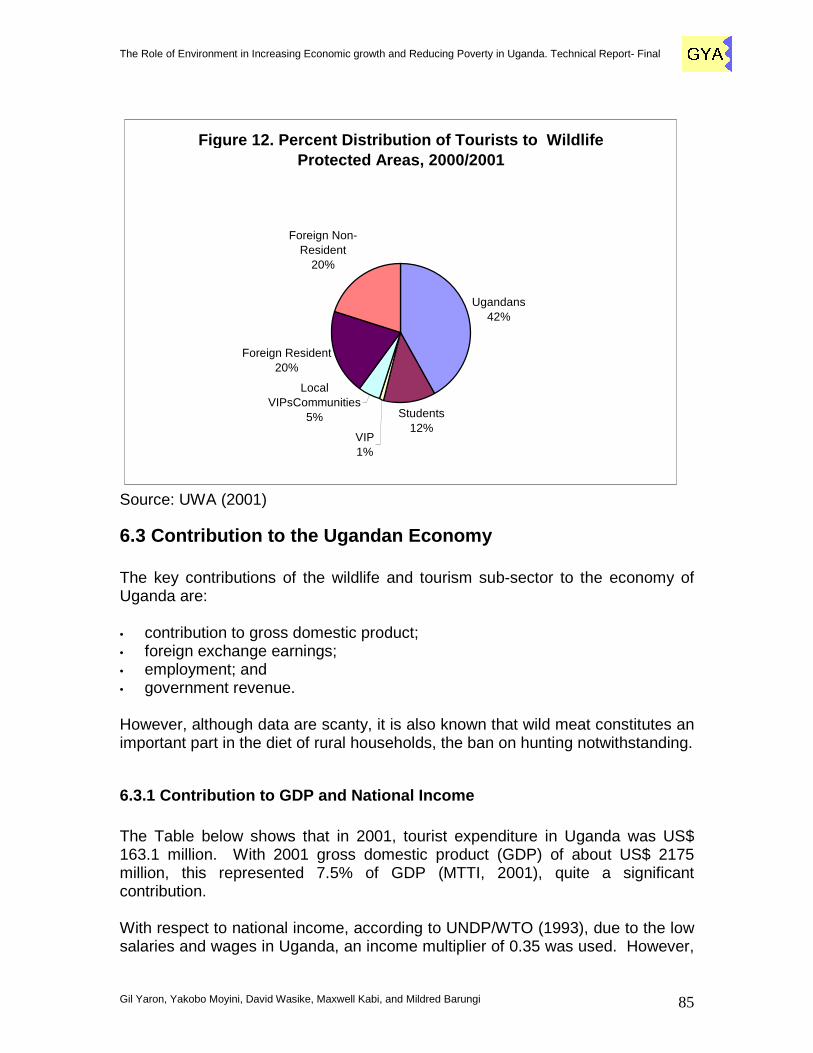
The Role of Environment in Increasing Economic growth and Reducing Poverty in Uganda. Technical Report- Final
Gil Yaron, Yakobo Moyini, David Wasike, Maxwell Kabi, and Mildred Barungi 85
Figure 12. Percent Distribution of Tourists to Wil dlife Protected Areas, 2000/2001
VIP1%
Local VIPsCommunities
5%
Foreign Resident20%
Foreign Non-Resident
20%
Ugandans42%
Students12%
Source: UWA (2001)
6.3 Contribution to the Ugandan Economy The key contributions of the wildlife and tourism sub-sector to the economy of Uganda are: • contribution to gross domestic product; • foreign exchange earnings; • employment; and • government revenue. However, although data are scanty, it is also known that wild meat constitutes an important part in the diet of rural households, the ban on hunting notwithstanding.
6.3.1 Contribution to GDP and National Income The Table below shows that in 2001, tourist expenditure in Uganda was US$ 163.1 million. With 2001 gross domestic product (GDP) of about US$ 2175 million, this represented 7.5% of GDP (MTTI, 2001), quite a significant contribution. With respect to national income, according to UNDP/WTO (1993), due to the low salaries and wages in Uganda, an income multiplier of 0.35 was used. However,

The Role of Environment in Increasing Economic growth and Reducing Poverty in Uganda. Technical Report- Final
Gil Yaron, Yakobo Moyini, David Wasike, Maxwell Kabi, and Mildred Barungi 86
UNDP/WTO expected this multiplier level to rise to about 0.45 by 2002. Moyini and Uwimbabazi (2000) reasoned that since Uganda experienced dramatic improvement in its economic growth between 1992 and 2000, an income multiplier of 0.50 represented a reasonable estimate. Going by this argument, for every US$ 100 spent by tourists in Uganda, an income of US$ 50 is generated. This means the tourist expenditure of US$ 163.1 million generated an income of about US$ 81.5 million. This income is more than double what UNDP /WTO had projected (US$ 44.0 million) for 2002. Even if one was to use the lower 0.35 and the forecasted 0.45 multiplier for 2002, the survey results of 2001 exceeded expectations.
Table 21 - Estimates of Ugandan’s Total Tourist Exp enditure for the Year 2001, Excluding Payments Made Abroad Month Total
Number of Tourists
Estimated Package Tourism (7.6%)
Estimated Independent Travelers (92.4%)
Estimated Package Tourist Expenditure
Estimated Independent Travelers’ Expenditure
Estimated Total Tourist Expenditure (US $)
January 16,678 1,268 15,410 1,967,203 10,926,025 12,893,228 February 16,158 1,228 14,930 1,905,868 10,585,364 12,491,233 March 18,315 1,392 16,923 2,160,291 11,998,450 14,158,740 April 22,166 1,685 20,481 2,614,524 14,521,301 17,135,825 May 23,874 1,814 22,060 2,815,986 15,640,239 18,456,225 June 16,483 1,253 15,230 1,944,203 10,798,277 12,742,480 July 16,264 1,236 15,028 1,918,371 10,654,807 12,573,178 August 17,893 1,360 16,533 2,110,515 11,721,991 13,832,506 September 15,869 1,206 14,663 1,871,780 10,396,036 12,267,816 October 15,640 1,189 14,451 1,844,769 10,246,014 12,090,784 November 13,264 1,008 12,256 1,564,515 8,689,459 10,253,974 December 18,392 1,398 16,994 2,169,373 12,048,893 14,218,267 Total
210,996 16,036 194,958 24,887,398 13,226,856 163,114,256
Source: MTTI (2001)
6.3.2 Export Earnings According to MTTI (2001), total gross foreign exchange earnings by the wildlife and tourism sub-sector were in the order of US$ 163.1 million. During the same year, the Bank of Uganda reported total export earnings (for both tangible and invisible exports) of US$ 656.9 million (MTTI, 2001). Therefore, in 2001, the wildlife and tourism sector accounted for 24.8% of total export earnings. This is a remarkable achievement when one considers that the UNDP/WTO (1993) projection was for tourism export earnings of US$ 97.8 million, and at best Us$ 112.8 million, in 2002. The 2001 earnings were 44.6% higher than the most optimistic scenario projected in 1993. The figure below illustrates this trend.

The Role of Environment in Increasing Economic growth and Reducing Poverty in Uganda. Technical Report- Final
Gil Yaron, Yakobo Moyini, David Wasike, Maxwell Kabi, and Mildred Barungi 87
Source: UNDP/WTO (1993); MTTI (2001)
1993 UNDP/WTO Projections
Actual 2001 data Although no scientific studies have been made with regard to multiplier effects in general, experience from other countries and knowledge of the Ugandan economy suggests that a relatively high proportion of foreign exchange earnings is retained within the country (UNDP/WTO, 1993). The reason is Uganda’s well developed agricultural sector and the high local labour content that can be expected in the operation of tourist facilities and construction (UNDP/WTO, 1993). On the other hand, the leakage factor is adversely affected by a large import content for such items as beverages, construction materials, furnishings and fuel. Consequently, UNDP/WTO estimated a leakage factor of 4.0% in 1993 and expected this to decline to 35% by 2002. The tremendous growth of the manufacturing sector since 1993 suggests that the leakage factor should infact be less than the percentage projected. However, even using a leakage factor of 35%, foreign exchange surplus in 2001 would have been US$ 106.0 million out of the gross of US$ 163.1 million reported.
Figure 13. Projected and Actual Tourism - Based Export Earnings, 1992 - 2002
22.5
47
163.1
97.8
112.8
1992 1997 2001 2002 (a) 2002 (b)
Year
US
$ m
illio
ns

The Role of Environment in Increasing Economic growth and Reducing Poverty in Uganda. Technical Report- Final
Gil Yaron, Yakobo Moyini, David Wasike, Maxwell Kabi, and Mildred Barungi 88
6.3.3 Employment Tourism is a labour – intensive industry. Unfortunately, data on employment levels in the tourism industry is not available. Projections by UNDP/WTO (1993) show employment should increase from 6,800 in 1992 to 10,600 by 2002. Moyini and Uwimbabazi (2000) estimated employment in gorilla tourism alone at 946 person years, split roughly equally between direct and indirect plus induced effects based on net annual foreign exchange earnings of about US$ 4.4 million, giving an earning of US$ 4,651 per person. This compared reasonably well with the estimates of UNDP/WTO of US$ 5,990 per person. Using the two estimates, employment level in the tourism industry in 2001 could have been about 7,000 – 23,000 (from net foreign exchange earnings of US$ 106.0 million)
6.3.4 Government Revenue Direct government revenue from tourism derives from five main sources:
• value added tax; (VAT); • corporate taxation of direct tourism – related enterprises and supplying
sectors; • personal income tax from those employed directly in tourism or indirectly
in the sectors supplying goods and services to the sector; • airport departure tax; and • visa fees
UNDP/WTO (1993) estimated government revenue at 0.26 of gross tourist expenditure. Therefore, the US$ 163. 114 million gross tourist expenditure should have generated government revenue of about US$ 42.2 million.
6.3.5 Community Benefits Communities living near wildlife protected areas receive a number of benefits from tourism, namely:
• a share of tourist expenditure for food and craft sales; and • 20% of park entrance fees as specified in the Wildlife Statute 1996.
An estimate of community level impacts of gorilla tourism in Mgahinga and Bwindi national parks is shown in Table below.

The Role of Environment in Increasing Economic growth and Reducing Poverty in Uganda. Technical Report- Final
Gil Yaron, Yakobo Moyini, David Wasike, Maxwell Kabi, and Mildred Barungi 89
Table 22 Economic impact of Gorilla tourism in Bwin di and Mgahinga
Economic Measures
Direct Effects Indirect + Induced Effects
Total Effects
Net Foreign Exchange
339,187 - 339,187
Sales Effects 339,187 339,187 678,374 Income 152,634 152,634 305,268 Government Revenue
1,357 1,356 2,713
Employment (person year)
37 36 73
Source: Moyini and Uwimbabazi (2000) According to MTTI (2001), the average amount spent per tourist on handcrafts and souvenirs was about US$ 101, or about 23% of total expenditure of US$ 439/tourist. What this means is that out of the US$ 163.114 million gross tourist expenditure in 2001, an amount of US$ 37.5 million was spent on handcrafts and souvenirs, some made in rural areas.
6.4 Challenges
6.4.1 Introduction Section 3.0 showed clearly that the wildlife and tourism sub-sector is making very significant contributions to the economy of Uganda and to rural communities adjacent to wildlife protected areas. Despite these positive contributions, the sub-sector is also faced with a number of challenges. These challenges relate to: insecurity; inadequate promotion and marketing; limited community involvement; and vermin and problem animals as shown in the Table below.
Table 23 - Key Challenges of the Wildlife and Touri sm Sub-Sector
Pillar 1 • limited promotion and marketing Pillar 2 • insecurity
• high management costs • limited community involvement
Pillar 3 • vermin and problem animals Pillar 4 • vermin and problem animals
6.4.2 Limited Promotion and Marketing Tourism promotion and marketing activities have been very limited because of insufficient Government funding combined with the poor situation of the private sector (MTTI, 2003). The insufficient funding for marketing and promotion activities, the lack of a financially – supported marketing strategy and the lack of

The Role of Environment in Increasing Economic growth and Reducing Poverty in Uganda. Technical Report- Final
Gil Yaron, Yakobo Moyini, David Wasike, Maxwell Kabi, and Mildred Barungi 90
resources at the Uganda Tourist Board (UTB) have resulted in overall inadequate marketing efforts to interest niche markets and mainstream tourist groups (MTTI, 2003). In addition, the private sector lacks capacity to initiate tourism development (MTTI, 2003).
6.4.3 Insecurity Insecurity has been the main reason Uganda’s tourism has not developed as much as its potential would suggest. What has held tourism back is the problem of insecurity and poor image of Uganda as a tourism destination. An example is the Bwindi massacre of foreign tourists. Also, insecurity in other parts the country forced some of the country’s most important national parks to close for the whole of 2001. Security improvement and change of the image of the country are therefore two crucial factors needed for tourism development (MTTI, 2003).
6.4.4 High Management Costs The management of the tourism assets, Uganda’s wildlife populations, continues to be of concern. The Uganda Wildlife Authority has been unable to raise enough revenue for its operations. For the fiscal year 1999/2000, UWA was able to raise only 28% of its recurrent and capital budget. The balance was financed through Government of Uganda (GoU) subvention (about 1.7%) and donor support and other grants (70.0%). The same happened in fiscal year 2000/2001 (Figure below).
Figure 14 Percent Contribution to UWA's Revenue, 2000/2001
Own Revenue27.7%
Gov't of Uganda15.7% Grants/Other Donors
5.8%
World Bank/IDA/GEF/PAMSU50.8%
Source: UWA (2001)

The Role of Environment in Increasing Economic growth and Reducing Poverty in Uganda. Technical Report- Final
Gil Yaron, Yakobo Moyini, David Wasike, Maxwell Kabi, and Mildred Barungi 91
6.4.5 Limited Community Involvement Districts and local communities often lack awareness and appreciation of their tourism resources and development potential. Communication between local communities and the central/national organisations is inadequate and communities participate only to a very limited extent in the tourism investments and developments. The lack of collaboration of the community associations within an umbrella association results in inconsistencies in product quality, and makes product branding and marketing difficult (MTTI, 2003). Communities have not played a significant role in respect of protection of natural and cultural resources in Uganda for one reason or another. In addition, problem animals like hippos, elephants chimpanzees and crocodiles continue to destroy life and property in different areas of the country. In several parts of the country, forests have been cut down, wetlands drained, and there has been widespread poaching of wildlife and encroachment into wild life reserves. This negative state of affairs has been caused by several factors including lack of awareness at the community level and the increasing demand for natural resources, low empathy for wildlife but most of all inadequate policies, institutional failures and poverty. The decentralisation policy, which provides for the direct involvement of local governments in resource protection and utilization is, however, expected to improve the situation (MTTI, 2003). The challenge, therefore, is to ensure that neighbouring communities realise benefits from the protected areas; and to develop strategies aimed at reducing human-wildlife conflicts and illegal activities.
6.4.6 Wildlife Costs While wildlife contributes to the economy of Uganda and rural livelihoods, its conservation also attracts a number of costs, borne largely by the rural poor. In the first place, conservation involves putting aside large areas of land in which case opportunity costs are incurred because the land could as well have been put to other productive uses such as agriculture. Thus the presence of wildlife incurs a range of economic costs, including: the direct costs of management and conservation (mainly accruing to GoU and UWA); the costs of damage caused by wildlife to humans, crops, livestock and built-up structures (mainly to neighbouring communities) and the opportunity costs of alternative land uses foregone or diminished by the presence of wildlife. There is no high quality data on the cost of wildlife damage nationally or for individual protected areas. However, several studies have attempted to come up with some estimates. Studies by Howard (1994) in Budongo, West Bugwe and Maruzi forests showed the cost of crop damage by vermin to be in the range of US$ 96 – 519/year. In Sango Bay, Kabi (2002) estimated the value of crop cost annually at US$ 1.8 million/year (or US$ 87/ha/year for Sango Bay Central Forest Reserve). Emerton

The Role of Environment in Increasing Economic growth and Reducing Poverty in Uganda. Technical Report- Final
Gil Yaron, Yakobo Moyini, David Wasike, Maxwell Kabi, and Mildred Barungi 92
and Muramira (1999) estimated the value of crop loss due to vermin at UShs 97,199 million/year nationally Table below.
Table 24- Regional Estimates for Crop Damage Due to Vermin
Region Crop Loss Value (UShs millions)
Central 33,633 Eastern 17,546 Northern 12,217 Western 33,803 Uganda Total 97,199 Source: Emerton and Muramira (1999) These estimates illustrate the impact of vermin on rural household income and nutrition. Another example was the elephant problem in Luwero District. The elephants caused havoc in the district, damaging crops and property. There was an international outcry. Both the European Union (EU) and the International Fund for Animal Welfare (IFAW) contributed US$ 250,000 and US$ 97,000, respectively to have the elephants translocated to Murchison Falls National Park (UWA, 2001). The amounts made available did not include compensations for crop damage, or loss of human life and injury. The responsibility for controlling vermin lies with districts, as specified in the Wildlife Statute 1996 and the Local Governments Act 1997. Where there are problems with wildlife in a given districts, the authorities may request UWA to declare the animals vermin. Once UWA does so, the ultimate control of vermin is the responsibility of the district. Unfortunately, most of the districts do not have the financial and human capacity to manage vermin. Only Masindi District, out of the 56 districts in the country has been able to establish a Wildlife Management Unit. So, most of the rural poor in Uganda continue to lose their assets and livelihoods including loss of life to vermin. Estimates of the cost of wildlife conservation are presented in Table below
Table 25 - Costs of Wildlife Conservation
Cost category Extension to Uganda (US$) 1. Total cost of wildlife Conservation 4.43 million/yr 2. Cost to livestock Production (disease Transmission)
772,000/yr
3. Damage to Humans and Built Structures • Livestock kills • Human injury • Local labour to Guard
2 million/yr 16,200/yr 39,300/yr
4. Opportunity Cost 29-200 million/yr Source: Moyini and Muramira (2002)
The Role of Environment in Increasing Economic growth and Reducing Poverty in Uganda. Technical Report- Final
Gil Yaron, Yakobo Moyini, David Wasike, Maxwell Kabi, and Mildred Barungi 93
6.5 Opportunities
6.5.1 Introduction
According to WTO (2003a), tourism has become a major sector of economic activity worldwide. That a substantial portion of Gross Domestic Product (GDP) and employment, especially in developing countries, is related to tourism, In 2001, worldwide, there were 693 million international tourist arrivals who in turn, generated earnings of US$ 462,000 million (WTO, 2003b). With this growth, a diversification of tourism products and destinations is taking place, with increased demand for nature-based tourism (WTO, 2003a). The question is, can Uganda capture some of these opportunities? The answer is an unqualified, yes. However, in order for the country to capture its fair share of the US$ 462,000 million global tourism industry, it must: • invest more in product diversification, marketing and promotion; • develop additional infrastructure; • curb insecurity within and along its borders; • promote community-based tourism; and strengthen institutional capacity. While the abovementioned actions will ensure increased contribution of the wildlife and tourism sub-sector to the economy, it is equally important that the adverse impacts of the presence of wildlife should also be addressed to the extent that the poorer segments of the Ugandan society bear a disproportionately larger share of the cost, of say, vermin.
6.5.2 Key Actions Product diversification is the responsibility of UWA. Unfortunately, UWA needs to access additional financial resources if it is to fulfil this mandate and others. Marketing and promotion is the responsibility of the Uganda Tourist Board. UTB has been doing limited marketing and promotion through the support of the European Union and the World Bank. New and sustainable financing sources are, therefore, necessary if Uganda is to increase tourism’s share of total exports. Additional infrastructure is needed to accommodate the expected increase in the number of tourist arrivals. More bed capacity, improved road infrastructure and rural electrification are some of the additional infrastructure required. This calls for partnership between Government and the private sector. Insecurity is the responsibility of all, although Government holds a larger share of it. Government needs to tackle the issue of insecurity if the significant contribution of the wildlife and tourism sub-sector is to be sustained and even increased.

The Role of Environment in Increasing Economic growth and Reducing Poverty in Uganda. Technical Report- Final
Gil Yaron, Yakobo Moyini, David Wasike, Maxwell Kabi, and Mildred Barungi 94
Private sector participation can be enhanced through incentives and secure concessions to invest in the tourism business. Community – based tourism has a real promise because of its low investment requirements. Also, the benefits will go towards increasing the incomes of the rural poor. Institutional capacity needs to be strengthened in UWA, UTB, and tourism – related private sector enterprises. Capacity enhancement should also include the setting of standards and classification of accommodation facilities. The capacity of districts to manage vermin, improve upon food security, increase rural incomes and realise better quality of life is needed. Equitable distribution of benefits between UWA and the communities will ensure better support for wildlife conservation. UWA is already sharing benefits with the communities (Tables below). However, the basis upon which revenue sharing was arrived at needs to be revisited.
Table 26 - Revenue Sharing Fund for calendar years 1998-2002
Year 1998 1999 2000 2001 2002 Amount (UShs)
162,685,664 233,307,324 298,628,365 410,159,023 512,383,102
Source (UWA records)
Table 27 - Revenue accrued to parishes around prote cted areas (parks and reserves)
Year 1999/2000 2000/2001 2001/02 2002/03 Amount (US$) 78,814 139,409 270,674 298,065
Source (UWA records) 6.6 Monitoring
6.6.1 Institution Both UWA’s annual reports and its MIST and MONIS monitoring systems (UWA, 2001) and the Expenditure and Monitoring Survey Report by the parent ministry (MTTI, 2001) are tools for monitoring the operations of the wildlife and tourism sub-sector. In the context of the PEAP however, additional indicators are suggested.

The Role of Environment in Increasing Economic growth and Reducing Poverty in Uganda. Technical Report- Final
Gil Yaron, Yakobo Moyini, David Wasike, Maxwell Kabi, and Mildred Barungi 95
6.6.2 Indicators A set of nine indicators for the wildlife and tourism sub-sector are proposed for inclusion in PEAP monitoring. These indicators have been grouped according to the four pillars of PEAP (Table below).
Table 28 - Wildlife and Tourism Sub-Sector Indicato rs
PEAP Indicators and Responsibility Pillar 1 • No of tourist arrivals (UBOS, UTB)
• % contribution to GDP (UBOS) • % share of exports (UBOS, BoU) • employment in wildlife and tourism (UBOS, UWA,
UTB) • no of tourists visiting protected areas (UWA)
Pillar 2 • no of community/ UWA/UTB MoUs (UWA, UTB) Pillar 3 • Volume of income going to communities (UWA)
• % of crop and livestock losses (districts) Pillar 4 • contribution to household nutrition (UBOS)
• no of cases of injury and loss of life districts, UWA)
The Role of Environment in Increasing Economic growth and Reducing Poverty in Uganda. Technical Report- Final
Gil Yaron, Yakobo Moyini, David Wasike, Maxwell Kabi, and Mildred Barungi 96
7 Payment for environmental services
7.1 Background FAO (2001) notes that markets that pay for environmental services, such as watershed protection, carbon storage and biodiversity conservation, already exist or look feasible in many countries. The central rationale is that those who benefit from the services that forest provide should pay those – often the rural poor – who maintain the forests. As we have noted in the Section on Forestry, since 1994, the FACE Foundation and UWA have been working jointly on reforestation projects in Mt. Elgon and Kibale National Parks as part of a private voluntary carbon offset agreement. This preceded the 1997 Kyoto Agreement and is one of the relatively few developing country forestry carbon offsets – as these have been seen as falling outside the Joint Implementation and Clean Development Mechanism arrangements. However, progress at the Conference of the Parties 6 and 7 and various new carbon trading schemes in Europe and the USA offer new opportunities. Payment for watershed protection requires that institutional arrangements be put in place to make beneficiaries pay as a group (to prevent free riding) and to have mechanisms for allocating benefits to the community members doing the conservation. On the beneficiary side this is relatively easy if they are all existing customers of NWSC, for example, but more complex if the group is split between NWSC and other suppliers. As watersheds often cross local government boundaries, government or national regulatory agencies often need to get involved in this process but the prime mover is often the private sector (e.g. water companies in industrialised countries) and NGOs. There are three types of payment mechanism that have been used internationally:
Voluntary Contractual Arrangements - made between buyers and sellers. The agreement between the FACE Foundation and UWA falls into this category as do many other developing country initiatives
Public payment schemes - in which government policy typically
establishes levels of payments and compensation, the priority areas for using these funds and how payments will be collected. While this approach is more often associated with industrialised nations there are a number of developing country examples. These include the Chinese government’s Forest Benefit Compensation Fund for restoring forests and Colombia’s environmental services tax levied on hydroelectric and water

The Role of Environment in Increasing Economic growth and Reducing Poverty in Uganda. Technical Report- Final
Gil Yaron, Yakobo Moyini, David Wasike, Maxwell Kabi, and Mildred Barungi 97
utilities and paid to private landowners for watershed management and to purchase sensitive lands.
Trading schemes – in which governments create demand for forest
services by establishing regulatory targets. This provides a basis for allocating individual emission quotas that can be traded and requires significant investment to establish and operate a full trading system. This is the fastest growing area with carbon trading markets now becoming established in the EU and US. The opportunity for developing countries is in the ability to reduce carbon emissions at lower cost than industrialised countries and to sell these services. Getting official recognition for these services or credits is the challenge.
Payments for environmental services (PES) have potential links with all four pillars although, as we shall see, the strongest link is with pillar 3 – raising the incomes of the poor. In order to achieve this it will be necessary to undertake specific actions – elaborated in Section 0 below. Fortunately these are entirely consistent with supporting agriculture and rural business in these communities under the PMA. In addition, there do appear to be some general lessons for the GoU on how to construct PES. Pagiola and Platais (2002) identify these as: Make payments continuous and open-ended. The benefits being sought will generally be enjoyed year after year, as long as appropriate land uses are maintained. Land users therefore must receive payments as long as they keep up the desired land use. Target payments. An undifferentiated payment system that pays everyone the same will be much more expensive than a targeted scheme. It will also make it difficult to tailor interventions to the particular requirements of given situations. A targeted payment scheme may, however, be more expensive to implement than a nontargeted one. A balance needs to be found between the efficiency advantages and the higher costs of better targeting. Avoid perverse incentives. For example, payments for reforestation can encourage land users to cut down standing trees so as to qualify.
7.2 PES and fast and sustainable economic growth The link with pillar 1 – fast and sustainable economic growth arises in two ways:
Providing new sources of local income and generating demand for local businesses via the resulting local spending. There are some international examples (see Johnson, White and Perot-Maitre, 2001) and Box 11 below in which community members are paid a significant amount of their total income for maintaining environmental services. This appears to be unusual. In the case study in Box 11, the payment of US$150 per rubber-

The Role of Environment in Increasing Economic growth and Reducing Poverty in Uganda. Technical Report- Final
Gil Yaron, Yakobo Moyini, David Wasike, Maxwell Kabi, and Mildred Barungi 98
tapping household reflects a high service value and a small number of producers in an isolated area. In other examples, much smaller payments are made to influence agricultural practice at the margin (e.g. the U.S. Conservation Reserve Program) or payments are made to improve the local natural environment rather than cash payments to individuals (e.g. the Chinese Forest Benefit Compensation Fund)
Improving the sustainability of growth by limiting environmental damage. Electricity companies that have voluntary agreements to pay to conserve forest cover typically believe this makes commercial sense, e.g. the additional payments are offset by lower risks of adverse hydrological conditions. Rojas and Aylward (2002) note that in the case of Costa Rica’s La Esperanza Hydropower Project, payments to a local NGO for forest conservation will rise from US$3/ha/year to US$10/ha/year over five years. The authors view this as providing a significant sum for forest conservation but observe that conservation has been achieved more cheaply by other hydropower companies.
7.3 PES and good governance and security Although PES can provide a model for other agreements with communities the link is generally between good governance and establishing PES. This is because PES are based on contractual agreements and the quality of governance will influence whether such agreements can actually be struck. As Landell-Mills and Poras (2002) note “Policy-makers have clear roles in fostering market establishment and shaping market form to maximise welfare. Services need to be identified and clearly linked to forestry activities that will ensure their delivery, costs and benefits evaluated and potential resistance pin-pointed, willingness to pay established, property rights and commodities defined and the trading infrastructure set up”. It is also worth noting that the international market for environmental services investment is competitive in the sense that there are many sellers. Uganda has to compete against many other developing countries for any carbon offset or biodiversity conservation funding. As Groosman and Yaron (1998) argue investors seek a trade-off between the maximum yield on sequestration investments and risk associated with the activity. Hence improvements in governance that strengthen the investment climate more generally also apply to environmental investments.
The Role of Environment in Increasing Economic growth and Reducing Poverty in Uganda. Technical Report- Final
Gil Yaron, Yakobo Moyini, David Wasike, Maxwell Kabi, and Mildred Barungi 99
7.4 PES and the increased ability of the poor to r aise their incomes PES can offer certain rural communities the chance to supplement their existing incomes. As Pagiola and Platais (2002) note in their review of PES for the World Bank, “many of the potential suppliers of environmental services are likely to be poor. The upper watersheds that are critical sources of water services, for example, are often inhabited by poor subsistence farmers, and payments for environmental services could be an important addition to their incomes”. As the example in Box 11 shows, this can provide a significant additional income source although the international literature we have cited suggests that typical benefits are a modest additional source of income or securing forest resources that contribute to the livelihoods of poor households (as in the Uganda Face project).
Box 11 - payment for environmental services – a cas e with high financial returns to the community
In Acre, Brazil, rubber-tappers are paid for their role as forest stewards. Acre has a one million ha extractive reserve, with an "extractive reserve" being defined as an official protected area where the rights of extractors to exploit rubber stands in a way that maintains the forest are formally recognized. Previous to the establishment of extractive reserves in Brazil in the 1990s, rubber-tappers had long resisted pressure on the forests from cattle ranchers and loggers, acting as forest stewards to guarantee the provision of environmental services. In Acre, under a 1998 law, rubber-tappers receive a subsidy equivalent to US$0.20 per kilogram of rubber collected. In 2001, 3,000 tons of rubber were produced in the reserve by 4,000 families who received a total of US$600,000 in payments. Because more of the rubber went through legal channels, the state also benefited, with 70% of the subsidy being returned through taxes. Benefits for the community included the return to the forest of 1,000 families living in miserable conditions in cities and the strengthening of social organization through producer associations. Source: Rosa (2002)

The Role of Environment in Increasing Economic growth and Reducing Poverty in Uganda. Technical Report- Final
Gil Yaron, Yakobo Moyini, David Wasike, Maxwell Kabi, and Mildred Barungi 100
As the market for environmental services increases, the challenge will be to ensure that the poor can participate effectively. There are various factors that make it difficult for the poor to achieve this including the:
Lack of clearly defined property rights Lack of information and skills to participate as a contracting party High transactions costs when dealing with isolated communities
There are solutions to each of these problems, in Costa Rica, for example, Pagiola and Platais (2002) find that a system of collective contracting has been developed through which groups of small farmers can join the PES program collectively rather than individually. Based on their review of many case studies, Landell-Mills and Poras (2002) suggest seven steps for promoting pro-poor markets – see Box 12 below. For the GoU, there are likely to be clear areas of overlap between actions to promote PES for poor communities and actions to strengthen their ability to increase their incomes from agricultural and rural small businesses more generally. This includes recommendations such as:
Formalising forest property rights held by poor people; Strengthening cooperative institutions Investing in training and education Establishing a market support centre Improving access to finance
Thus the link between the PMA and PES that benefit the poor is clear and direct. At the moment it is simply not articulated.

The Role of Environment in Increasing Economic growth and Reducing Poverty in Uganda. Technical Report- Final
Gil Yaron, Yakobo Moyini, David Wasike, Maxwell Kabi, and Mildred Barungi 101
• Formalise forest service property rights held by poor people. Formalisation of natural resource rights is essential to giving marginalised groups control over, and rights to, returns from environmental service sales. • Define appropriate commodities. Simple and flexible commodities that can be self-enforced, that fit with existing legislation and that suit local livelihood strategies need to be developed in poorer areas. • Devise cost-effective payment mechanisms. In areas where regulatory capacity is weak, trading skills in short-supply and market infrastructure underdeveloped (e.g. communication, information systems, transport, monitoring), simpler payment mechanisms are likely to be most effective. • Strengthen cooperative institutions. Cooperation is critical in allowing poor landowners and service beneficiaries to share the costs associated with market participation. It is also essential for achieving a minimum level of supply or demand, thereby permitting market participation. MES • Invest in training and education. Training in marketing, negotiation, management, financial accounting, contract formulation and conflict resolution are important prerequisites for effective participation. Technical skills relating to forest management for environmental services are also needed. • Establish a market support centre. Information is power. To improve poor people’s ability to participate in emerging markets, a central market support centre could offer free access to market information, a contact point for potential buyers, sellers and intermediaries, and an advice bureau to support the design and implementation of contracts. • Improve access to finance. Where finance is needed to negotiate and conclude environmental service deals, the government may have a role to play in supporting access to funds. Source: Landell-Mills and Poras (2002)
Box 12 - Potential ways forward in developing pro-p oor markets
7.5 PES and increased quality of the life of the po or As noted previously, one of the key objectives of PES is to secure the long-term conservation of the environmental resource providing these services. PES projects such as the Face scheme in Uganda can have direct benefits for the quality of life of the poor. To re-cap, there are three reasons for this:
1. The evidence from the Chapter on Forestry is that the poor rely on non-timber forest products (NTFPs) as one of their sources of income in good times and particularly when other income sources are limited (in very dry years, for example)
2. Women have to spend significantly longer collecting firewood in many areas as a result of deforestation.
3. PES projects can break the vicious cycle of poverty-environmental degradation and worsening poverty identified by UPPAP2.

The Role of Environment in Increasing Economic growth and Reducing Poverty in Uganda. Technical Report- Final
Gil Yaron, Yakobo Moyini, David Wasike, Maxwell Kabi, and Mildred Barungi 102
8 Adjusted net savings (genuine savings)
8.1 What it actually means The basic measure of national wealth is gross saving: GNP36 less public and private consumption. This tells us how much produced output is available for investment or foreign lending. Net saving modifies this figure for depreciation in productive assets. Positive net saving implies that the economy is getting richer in terms of produced assets. Attempts to define sustainable development by the Brundtland Commission in 1987 and the growing interest in sustainability issues led to a critical review of traditional national accounting. This led to the development of green national accounting that incorporates the value of net investments in human capital and the loss of natural resources and costs of pollution. Adjusted net savings (ANS) or genuine savings (as this used to be called) is defined as net saving plus net investments in human capital less the value of depleted natural resources and the cost of pollution damage (or abatement)37. Adjusted net savings rates are typically lower than net saving rates. An important aim of including ANS rates alongside traditional measures is to focus attention on the sustainability of national economic performance. As the World Bank (1997) puts it “For too long now ministries of finance and planning have paid scant attention to the exploitation of the natural resource base or the damaging effects of environmental pollution, while countries have been developing National Environmental Action Plans that read as if they were written by the environment ministry for the environment ministry, with no links to the economics ministries”. In terms of the ability of a country to improve the quality of life of its citizens over the period to 2020, ANS is a much better measure than GDP as it tells us about the assets the country can draw on. Countries that accumulate human capital and maintain their natural resource base are in a fundamentally better position to improve the quality of life of their citizens than those that run down their assets Pearce and Atkinson (1993) played a pioneering role in calculating genuine savings rates (with DFID funding) for 20 countries. These were extended and are reported in World Bank (1997), Hamilton and Clemens (1998) and, most recently, World Bank (2003).
36 GNP = GDP + value of goods & services produced by Ugandan firms abroad 37 For a detailed description and definitions of each term see Bolt, Matete and Clemens (2002)
The Role of Environment in Increasing Economic growth and Reducing Poverty in Uganda. Technical Report- Final
Gil Yaron, Yakobo Moyini, David Wasike, Maxwell Kabi, and Mildred Barungi 103
The data requirements of this exercise are substantial and the adjustments to savings measures for consumption of environmental resources have been limited by data availability to the following: (i) the valuation of resource rents for non-renewable resources; (ii) valuing depletion of forests beyond replacement levels; and (iii) valuing the marginal social costs of CO2 emissions. Hence certain important environmental costs such as the loss of agricultural productivity through soil erosion have not yet been incorporated in the international data.
8.2 Uganda’s Adjusted Net Savings (ANS) rate Uganda is one of the relatively few countries for which data exists for 1980-89. As Figure 15 shows, the ANS for these years shows massive negative savings rates in the early part of the period that were brought closer to zero by the late 1980s.
Figure 15 - Adjusted Net Savings in Uganda 1980-89
-60%
-50%
-40%
-30%
-20%
-10%
0%
10%
1980
1981
1982
1983
1984
1985
1986
1987
1988
1989
Source: Authors’ graph using data given in World Bank (2003) Drawing on data contained in World Bank (2003) we can illustrate the ANS for 1995-2001 for Uganda and some neighbouring countries since 1995. See the Figure below. It appears that Uganda has made progress over this period but the ANS remains below Kenya and Tanzania.
The Role of Environment in Increasing Economic growth and Reducing Poverty in Uganda. Technical Report- Final
Gil Yaron, Yakobo Moyini, David Wasike, Maxwell Kabi, and Mildred Barungi 104
Figure 16 - ANS rates for Uganda, Tanzania and Kenya 1995-2002
-5%
0%
5%
10%
15%
20%
1995
1996
1997
1998
1999
2000
2001
Uganda
Tanzania
Kenya
What is missing in this analysis is the inclusion of the impact of soil erosion – the largest source of environmental degradation. Drawing on the IFPRI soil nutrient loss studies, 2002 Census and other data, we calculate the value of soil nutrient loss in Uganda to be US$625million per annum (in 2001/2002 prices). The impact of including this in the ANS calculation is shown in Table 29 below. Once the loss of soil nutrients is taken into account, Uganda’s net saving is significantly negative. Current practices are not sustainable. The formation of physical and human capital is too slow to offset the loss of natural capital.
Table 29 - Adjusted Net Savings in Uganda including soil nutrient loss
2001 % of GNI Data source Gross National Investment 5556150784 1 Gross National Savings 765219200 13.77% 1 Consumption of fixed capital 420933715 7.58% 1 Education expenditure 107580353 1.94% 1 CO2 damage 9469189.72 0.17% 1 Value of net forest depreciation 344459083 6.20% 1 Value of mineral depletion 0 0.00% 1 Value of energy depletion 0 0.00% 1 ANS (excluding soil nutrient loss) 97937565 1.76% 1 Value of soil nutrient loss 625355848 11.26% 2 ANS (including soil nutrient loss) -527418283 -9.49 % 3 Data sources: 1. World Bank (2003) 2. IFRPI (2003), 2002 Census and author's calculations 3. Author's calculation

The Role of Environment in Increasing Economic growth and Reducing Poverty in Uganda. Technical Report- Final
Gil Yaron, Yakobo Moyini, David Wasike, Maxwell Kabi, and Mildred Barungi 105
9 Further priority issues
9.1 Understanding the link between agriculture, gro wth and poverty reduction In a recent paper Bevan, Adam, Okidi, and Muhumuza (2003), analyse Uganda’s prospects for growth and poverty reduction and use past international experience to draw some conclusions on likely structural transformation in the Ugandan economy. Some of those who have read this paper take the view that it implies a diminishing role for the ENR sector in poverty reducing growth. However, there are a number of reasons to believe that the opposite is true – that the ENR sector will become more important in reducing poverty - at least in the short and medium term.
9.2 The need for pro-poor growth The authors clearly identify the challenge of making growth more pro-poor and conclude that “the most realistic way of attempting this … is probably to revisit the strategy for agriculture and rural non-farm incomes”. Given the overwhelming concentration of poverty in rural areas and the dependence of the poor on agriculture, the most effective way to reduce poverty is to raise the returns to agriculture (through increasing productivity and the value of production). The opportunities for the rural poor are to increase their returns to agriculture (noted above), find rural industrial or service sector employment or to migrate38. Focussing on the rural industrial or service sector we have to ask what areas are most likely to see development? Experience in Uganda over the past decade of growth makes it clear that rural industry typically involves the primary processing of natural resources. As the Uganda Investment Authority in their advice to potential investors puts it39: “Uganda's existing comparative advantage is heavily concentrated in agriculture, forestry and mineral resources and their primary processing”. Profits made from these activities generate demand for services such as building and construction – which again rely heavily on the ENR sector.
38 Given the current state of urban infrastructure, large scale rural-urban migration is not an option for sustainable development in the short term. 39 http://www.ugandainvest.com/opport.htm

The Role of Environment in Increasing Economic growth and Reducing Poverty in Uganda. Technical Report- Final
Gil Yaron, Yakobo Moyini, David Wasike, Maxwell Kabi, and Mildred Barungi 106
9.3 Projections of the agricultural sector’s demise It is difficult to argue with the idea that employment in the agricultural sector will decline as the economy grows and that it will become relatively less important as the industry and service sectors expand. This is the classical process of industrialisation. As we have noted above, the ENR sector in Uganda plays a critical role in enabling this to occur. Indeed, there is international evidence to suggest that agricultural productivity growth is required for industrialisation to take place and that it is causally prior to growth in manufacturing and services but the reverse is not true40. What is less clear is if past experience will be a good guide to how fast the agricultural sector will intensify production, shed labour and shrink relative to the other sectors. The model of structural transformation presented by Bevan et al is based (as the authors clearly state) on the experience of nine countries that have made the transition from low to middle income status. This model simply shows what the major productive sectors of the economy will do if Uganda moves from its current position to becoming like the average of the nine example countries. Hence it assumes that manufacturing will be the fast growing sector - by definition it has to grow fast if it is to account for a much larger share of the larger economy in 20 years time. There seems to be a case for a more sophisticated analysis that takes into account increased export opportunities for Ugandan agriculture that will arise if the US and EU reduce trade barriers. Hence a recommendation for future work is that the model is re-run to explore the impact of two factors:
1. Using a smaller set of countries as targets that were more like Uganda when they were low income e.g. the share of agriculture in GDP should be similarly high to start with.
2. Consider an alternative scenario that reflects significantly increased export opportunities for agriculture.
9.4 Growth and environmental protection Some people may conclude that environmental regulation and taxation that raises the cost to investors in rural industry will slow growth and raise poverty. This is misguided. Lowering the price of a natural resource below its true economic value will encourage a faster rate of extraction. However, the gains from this accrue primarily to the holders of the fishery, forest or other concessions and the government or local communities lose the rents that should have been paid. This will disadvantage the poor if the private actors that get this rent spend it in a way that is less pro-poor than public expenditure. In today’s Uganda this is likely to be the case.
40 See the extensive reviews by Thirtle et al. (2001) and Mellor (2000).

The Role of Environment in Increasing Economic growth and Reducing Poverty in Uganda. Technical Report- Final
Gil Yaron, Yakobo Moyini, David Wasike, Maxwell Kabi, and Mildred Barungi 107
Allowing the “polluter not to pay” also gives the investor or concession holder an incentive to increase the scale of operation and hence employment now rather than in future. The cost of this is however, borne by society, typically the poor who live in the cheaper, degraded environment. In addition, the government loses the revenues that polluters would pay if environmental regulation was enforced (or if economic instruments were used to achieve the same objectives). Quite apart from ethical arguments (about inflicting environmental damage on future generations) or international obligations, this approach will only be pro-poor if the benefits to the poor from the extra jobs and profits created are greater than share of the costs of environmental externalities, lost public revenues and future productive opportunities borne by the poor. As in the case above, this is not likely if the government uses revenues to benefit the poor. It also runs counter to the Government’s commitment to sustainable development.

The Role of Environment in Increasing Economic growth and Reducing Poverty in Uganda. Technical Report- Final
Gil Yaron, Yakobo Moyini, David Wasike, Maxwell Kabi, and Mildred Barungi 108
10 Quality Assurance for ENR economic impact data
10.1 Background One of the consequences of limited primary environmental valuation data is that researchers and government officials in Uganda use a variety of estimates that are drawn from secondary sources. This has produced contradictions and significant inaccuracies41. In addition to reducing confidence in these figures, it tends to undermine the value of the detailed studies that have been undertaken. A simple step that could improve matters is for the ENR-SWG or UBOS to provide quality assurance and hold and update a database (in practice an Excel spreadsheet) with the key environmental valuation statistics to be used in official documents. Some of these are already compiled and are used, for example, by the World Bank in the “poverty and environmental indicators” series42. However, data on the cost of soil erosion and total forest and fishery benefits, for example, are not available. Once this is assembled it will only require occasional updating. Putting this on the UBOS web-site would allow this information to be accessed by a large number of users.
10.2 Recommended Actions ENR-SWG or UBOS to provide quality assurance and hold and update a database with the key environmental valuation statistics to be used in GoU documents Make this data publicly available e.g. on the UBOS website under an appropriate category – such as “environmental statistics”. Information on the sources of data and methods of calculation should also be given.
41 Details can be supplied on request. 42 http://lnweb18.worldbank.org/ESSD/envext.nsf/44ByDocName/EnvironmentalIndicatorsCurrentInitiativesTheLittleGreenDataBook2002

The Role of Environment in Increasing Economic growth and Reducing Poverty in Uganda. Technical Report- Final
Gil Yaron, Yakobo Moyini, David Wasike, Maxwell Kabi, and Mildred Barungi 109
11 Communications strategy and institutional analys is
11.1 Background A review of the treatment of the environment in 40 interim and full PRSPs by the World Bank found that Uganda ranked 11th out of 40 with a score of 1.1 out of 3 (average=0.9)43. This partly reflects the fact that Uganda had completed the full rather than interim PRSP as scores for these were nearly always significantly higher. The top scorer was Mozambique with 2.2. This raises the question “what other factors apart from reliable data on economic impact of ENR use determine the treatment of this sector in the PRSP?” Mozambique appears to have significantly less reliable data on value of the ENR sector in growth and poverty reduction than Uganda, but it seems that more effective use has been made of what there is. Clearly it is easier to make the case for the importance of the ENR sector in the PEAP process if arguments can be backed up with reliable data. Yet, it is also important to consider other factors that could help get this message across. These factors may include the way existing data and arguments have been presented and an institutional structure that limits environmental messages getting through to the PEAP. The task of getting the ENR message across is made more difficult in some ways by what Bevan et al. note as the concentration of capacity and responsibility in MFPED at the expense of line ministries44.
11.2 Recommended Actions Part of the answer lies in developing a strategy to make the best use of the ENR studies available. That is to say:
1. Defining who has to be reached 2. Identifying the medium to reach target groups (policy briefings, meetings,
workshops etc) 3. Making sure those who receive the message have confidence that it can
be defended While a number of studies have been produced as ENR Sector inputs to the PEAP revision process, none of these, to our knowledge, have set out a strategy for getting the ENR message across. It is beyond our current terms of reference 43 Bojö & Reddy (2002) 44 see Bevan et al page 32

The Role of Environment in Increasing Economic growth and Reducing Poverty in Uganda. Technical Report- Final
Gil Yaron, Yakobo Moyini, David Wasike, Maxwell Kabi, and Mildred Barungi 110
to do this but we note that there are a number of tried and tested communications techniques that could be used to help achieve the first two items on this list. This should be a priority area for future research 45
45 There are a number of recognised steps to decide how best to package particular messages for particular groups. DFID has funded materials for projects to develop communications strategies through the NRSP programme and these would be useful in this context.

The Role of Environment in Increasing Economic growth and Reducing Poverty in Uganda. Technical Report- Final
Gil Yaron, Yakobo Moyini, David Wasike, Maxwell Kabi, and Mildred Barungi 111
12 Conclusions and recommendations Given the overwhelming concentration of poverty in rural areas and the dependence of the poor on agriculture, the most effective way to reduce poverty is to raise the returns to agriculture (through increasing productivity and the value of production). This increases the benefit the poor gain directly from growth and creates demand for rural service and manufacturing industries that are typically based on natural resource use, thus giving pro-poor growth a rural, natural resource focus.
12.1 Links to agriculture There is a strong linkage between agricultural productivity, soil degradation and economic growth. Practical steps to reduce soil degradation are required and the strategy for achieving this should be explicitly defined in the Plan for the Modernisation for Agriculture (PMA) – the framework for transforming subsistence to commercial agriculture. A key tool for implementing the PMA is the National Agricultural Advisory Services (NAADS) programme that has so far only directly addressed soil degradation issues in a small minority of the 21 districts it is working in. As the PMA is formally linked to PEAP pillar 3 (incomes of the poor)
12.2 Links to fisheries, forestry, wetlands and tou rism The study demonstrated how fisheries and forestry sub-sectors make a significant unrecorded contribution to pro-poor economic growth in Uganda. This contribution is threatened by weak incentives for sustainable resource use and ineffective regulation. However, new policies and institutional structures in fisheries and forestry offer the potential to finance improved regulation, maintain yields and ensure the poor get an increased share of the resource rent. There is also scope to improve the economic returns that the poor get from sustainable use of forests and wetlands by improving access to export markets for certain products.
12.3 ENR and governance and security The analysis of the ENR sector in Uganda identifies a general weakness in decentralized governance. In forestry, part of the reason lies in the limited extent of decentralisation - most of the powers of rule enforcement and sanctioning are vested with the LC 5 (the District Local Council). These powers gradually diminish at each successive lower level of governance. In the fisheries sub-sector however, the recent development of Beach Management Units (BMUs) and lake management institutions presents a real opportunity for better local governance and improved resource use by local

The Role of Environment in Increasing Economic growth and Reducing Poverty in Uganda. Technical Report- Final
Gil Yaron, Yakobo Moyini, David Wasike, Maxwell Kabi, and Mildred Barungi 112
communities. These organisations require support to realise the potential. This innovation could be employed in the management of natural resources in other sub-sectors such as forestry, tourism, land etc. BMUs clearly show what could be done to involve communities in natural resource management. Environmental legislation covering issues such as bush-burning, use of wetlands and cutting of certain trees is frequently ignored. The lack of local capacity to enforce legislation is part of the story, there is also a need to review some of the legislation.
12.4 Building capacity for environmental governance For forestry and wetlands we recommend: developing a programme of capacity building in environmental management for the sub-district councils, identifying sustainable funding (from resource use levies) and empowering parish and sub-county councils to formulate and enforce by-laws. Government ministries that have a mandate for ENR issues should consider how they can improve their coordination across departments.
12.5 Reforming local taxation While reform is required across the ENR sector, there are particular opportunities in the fisheries sub-sector as studies have proposed detailed proposals relating to licensing, tendering and other resource levies (e.g. the “cess”). The need to plough back a greater portion of the revenue collected into conservation and management of ENR. Currently around 80% of Local Government Development Programme (LGDP) funds are conditional grants and exclude the ENR sector.
12.6 ENR and an increased ability of the poor to ra ise their incomes The incidence of income poverty in Uganda fell from 56% in 1992 to 34% in 2000 but rose to 38% in 2003. This reflects a decline in agricultural production by small farmers. Various factors are involved in this including declining soil fertility. Indeed, numerous case studies undertaken by UPAP2 identify declining soil fertility as a major cause of poverty.
12.7 ENR and the quality of life of the poor There is considerable qualitative evidence that Uganda’s poor depend heavily on natural resources. The analysis in the study suggests that there are cases where this should be reflected directly in PEAP pillar 4.

The Role of Environment in Increasing Economic growth and Reducing Poverty in Uganda. Technical Report- Final
Gil Yaron, Yakobo Moyini, David Wasike, Maxwell Kabi, and Mildred Barungi 113
13 Cross-cutting actions
13.1 Strengthen performance indicators In order to monitor progress against targets for the PEAP review specified by each ENR sub-sector it will be necessary to regularly monitor output and intermediate outcome indicators. The ENR SWG or UBOS should investigate how they can provide quality assurance and hold and update a database with the key environmental valuation statistics to be used in GoU documents.
13.2 Priority areas for future research • Establish performance indicators that are SMART and best capture the
levels of performance that need to be measured.

The Role of Environment in Increasing Economic growth and Reducing Poverty in Uganda. Technical Report- Final
Gil Yaron, Yakobo Moyini, David Wasike, Maxwell Kabi, and Mildred Barungi 114
References Alfsen, Knut H., Mario A. De Franco, Solveig Glomsrod, Torgeir Johnsen, 1996, “The Cost of Soil Erosion in Nicaragua,” Ecological Economics, Volume 16, pp. 129-145.
Amanor K.S. (2001). Notes on Natural Resource Management Programme in the Transitional Zone of Ghana. Draft Report November 2001. Legon, Ghana
Bahiigwa, Mugambe and Keizire (2003), Fiscal Reforms in Fisheries in Uganda, For Presentation at a Workshop on Fiscal Reforms in Fisheries to be held in Rome, October 13-15, 2003 Balirwa, J.S. 1998. Lake Victoria Wetlands and the Ecology of the Nile Tilapia, Oreochromis niloticus. Linne Balkema Publishers. Rotterdam, Netherlands pp: 18 – 24. Banks (2003), THE UGANDA FISHERIES AUTHORITY DRAFT BUSINESS PLAN, MINISTRY OF AGRICULTURE, ANIMAL INDUSTRY AND FISHERIES, Barbier, E.B.; M. Acreman; and D. Knowler. 1997. Economic Valuation of Wetlands: A Guide for Policymakers and Planners. Ramsar Convention Bureau. Gland, Switzerland.
Boaz Blackie Keizire (2003), IMPLEMENTATION OF POLICY RESPONSE PACKAGES to Promote Sustainable Management of Fisheries in Uganda, MAAIF, Kampala
Bojö, J. (1996), “The Costs of Land Degradation in Sub-Saharan Africa.” In
D. Bevan with C. Adam, J. Okidi, and F. Muhumuza (2003), Discussion Paper on Economic Growth, Investment and Export Promotion, prepared for the Poverty Eradication Action Plan Revision 2002/03, Kampala
Ellis and Bahiigwa (2001), Livelihoods and Rural Poverty Reduction in Uganda, LADDER Working Paper No.5, November 2001
Emerton and Muramira (1999), Uganda Biodiversity: Economic Assessment, February1999 IUCN
Emerton, L. and E. T. Muramira. 1999. Uganda Biodiversity: Economic Assessment. A Report Prepared for the National Environment Management Authority as part of the National Biodiversity Strategy and Action Plan process. IUCN EARO. Nairobi, Kenya. Emerton, L.; L. Iyango; L. Kiswam and A. Malinga. 1999. The Present Economic Value of Nakivubo Wetland, Uganda. Economics and Biodiversity Programme. IUCN EARO. Nairobi, Kenya.
Falkenberg and Sepp (2000), Economic Evaluation of the Forest Sector in Uganda. Contribution to the forest sector review, Kampala
FAO (2001), “Forestry can reduce poverty”, Interagency Forum on the Role of Forestry in Poverty Alleviation, September

The Role of Environment in Increasing Economic growth and Reducing Poverty in Uganda. Technical Report- Final
Gil Yaron, Yakobo Moyini, David Wasike, Maxwell Kabi, and Mildred Barungi 115
FD (Forest Department). 1999. Forest Nature Conservation Master Plan. Volume 1. Kampala, Uganda. FOR WATER SERVICES FROM FORESTS: ISSUES AND LESSONS FOR INNOVATORS,http://www.forest-trends.org/resources/pdf/Developing_Markets_for_Water_Services.pdf
Frank J. Convery. (1995). Applying Environmental Economics in Africa. Technical Paper No. 277. Africa Technical Series. Washington, D.C.: World Bank
Galpin, Dorward and Shepherd (2000), Participatory Farm Management
GoU (Government of Uganda). 1997. Local Governments Act 1997. Kampala, Uganda GoU 1996. Wildlife Statute 1996. Kampala, Uganda. Groosman and Yaron (1998) ,The potential use of carbon sequestration credits for forestry conservation and the relevance for the Mount Cameroon Project, A report for the Department of International Development (DFID), London, UK, mimeo HASKONING Consulting Engineers and Architects/Community Management Services/Delft Hydraulics. 2001. Lake Victoria Environment Management Project Cost Benefit Analysis of Wetlands Resources Uganda (Part I: Summary and Recommendations; and Part IV: Economic Analysis). Final Report. Lake Victoria Environment Management Programme (LVEMP) / Wetlands Inspection Division. Entebbe, Uganda.
Howard (1994). The Economics of protected Areas in Uganda. Costs, Benefits and policy Issues. MSc Thesis University of Edinburgh. U.K
http://www.forest-trends.org/keytrends/pdf/Taskforce%20pdfs/payments%20wrkshp_proceedings.pdf Johnson, White and Perot-Maitre, 2001, DEVELOPING MARKETS
K. Bolt, M. Matete and M. Clemens (2002), Manual for Calculating Adjusted Net Savings, Environment Department, World Bank
Kabi (2002). A community Level Economic Value Assessment of natural Resources. The case of Sango Bay Swamp Forest Ecosystem, Rakai District, Uganda. MSc. Thesis, Makerere University.
Kadleck, R.H. and R.L. Knight. 1996. Treatment Wetlands. Lewis Publishers. Karanja, F.; L. Emerton; J.Mafumbo; and Willy Kakuru. 2001. Assessment of the Economic Value of Pallisa District Wetlands, Uganda. Biodiversity Economics for Eastern Africa & Uganda’s National Wetlands Programme. IUCN EARO. Nairobi, Kenya. MAAIF (2002), DEPARTMENT OF FISHERIES RESOURCES, FISHERIES SECTOR AND THE PMA PROGRESS REPORT, NOVEMBER, 2002

The Role of Environment in Increasing Economic growth and Reducing Poverty in Uganda. Technical Report- Final
Gil Yaron, Yakobo Moyini, David Wasike, Maxwell Kabi, and Mildred Barungi 116
MAAIF (2003), Fisheries ENR PEAP submission, Kampala, mimeo March 2003
Marfo, K, Anchirinah V and Wiggins S (2001), A presentation of preliminary findings from Southern Ghana, Environmental policies and livelihoods in the forest margins of Brazil and Ghana, NRSP R7577
Mellor, 2000. Agricultural growth, rural employment, and poverty reduction – non-tradables, public expenditure and balanced growth. In Poverty or Prosperity: rural people in a globalized economy. Proceedings from the World Bank Rural Week, March 28-31, 2000, methods for agricultural research and extension, Reading University
Mitsch, , W.J. and J.G. Gosselink. 2000. Wetlands (2nd Edition). Van Nostrand Reinhold. New York, New York, USA. MoFPED 1998. Statistical Abstract 1998. Bureau of Statistics. Entebbe, Uganda. MoFPED (Ministry of Finance, Planning and Economic Development). 2002. Background to the Budget 2002/03. Kampala, Uganda. Moyini, Y. and B. Uwimbabazi.2000. Analysis of the Economic Significance of Gorilla Tourism in Uganda. International Gorilla Conservation Programme (IGCP) Kampala, Uganda. Moyini, Y. and E.T. Muramira. 2002. The Costs of Environmental Degradation and Loss to Uganda’s Economy, with Particular Reference to Poverty Eradication. IUCN EARO/IUCN – Co. Kampala, Uganda. MTTI (Ministry of Tourism, Trade and Industry). 2003. Tourism Policy for Uganda. Kampala, Uganda. MTTI 2001. Expenditure and Motivation Survey Report August – October 2001. ICB-PAMSU Project/EU Tourism Support. Kampala, Uganda. MWLE (Ministry of Water, Lands and Environment). 2001. Wetland Sector Strategic Plan. Wetlands Inspection Division. Kampala, Uganda.
Natasha Landell-Mills and Ina T. Porras (2002), Silver bullet or fools’ gold? A global review of markets for forest environmental services and their impact on the poor, IEED, London
NEMA 1999. State of the Environment Report for Uganda 1998. Kampala, Uganda. NEMA (National Environment Management Authority). 2001. State of the Environment Report for Uganda 2000. Kampala, Uganda.
NEMA(2000), State of the Environment Report, Kampala
Norconsult (2002), Analytical review of aspects relating to revenue collection from the Lake Victoria Fisheries, mimeo

The Role of Environment in Increasing Economic growth and Reducing Poverty in Uganda. Technical Report- Final
Gil Yaron, Yakobo Moyini, David Wasike, Maxwell Kabi, and Mildred Barungi 117
Nsimbe-Bulega, Kankwasa and Keizire (2003), Production And Marketing Of Value-Added Fishery Products In Eastern And Southern Africa, Cfc/Fao/Comesa Fishery Project, Dagaa - Mukene Fishery (Rastrineobola Argentea), Uganda Country Study – Draft Report, mimeo Pagiola and Platais (2002), Payments for Environmental Services, Environment Strategy Note No. 3, World Bank, http://lnweb18.worldbank.org/ESSD/envext.nsf/41ByDocName/EnvironmentStrategyNoteNo3PaymentsforEnvironmentalServicesInEnglish/$FILE/EnvStrategyNote32002.pdf
Pearce, D.W., and G. Atkinson. 1993. "Capital Theory and the Measurement of Sustainable Development: An Indicator of Weak Sustainability." Ecological Economics (8): 103–08.
R. Leete (1999), “Development Of The CCA Indicator Framework” in The OHCHR/UNDP Workshop On Civil And Political Rights Indicators, Geneva, 27-29 September 1999 Rojas and Aylward (2002), Cooperation between a small private hydropower producer and a conservation NGO for forest protection: The case of La Esperanza, Costa Rica, FAO, Rome, http://www.fao.org/landandwater/watershed/watershed/cases/costa2-pix.pdf Rosa, H. (2002), Payments for Environmental Services and Poor Rural Communities: Experiences and Lessons , paper given at Workshop on Payment Schemes for Environmental Services: April 22 – 23, 2002, Beijing CCICED Western China Forest Grasslands Task Force Tengberg and Stocking (1997), Erosion induced loss in soil productivity and its impacts on agricultural production and food security, FAO/Agritex
Thirtle, C, Irz, X, Lin, L, McKenzie-Hill, V and S. Wiggins (2001), “Relationship Between Changes in Agricultural Productivity and the Incidence of Poverty in Developing Countries”, Natural Resources Policy Research Programme Project R7946, DFID, mimeo
UNDP/WTO (United Nations Development Programme/World Tourism Organisation). 1993. Integrated Tourism Master Plan. Final Report. Volume 1: National Structure Plan for Tourism. Republic of Uganda. Ministry of tourism Wildlife and Antiquities UNDP/WTO UGA 91/010.
United Nations Development Programme/World Trade Organisation. 1993. Integrated Tourism Master Plan (Final Report). Republic of Uganda. UNDP/WTO UGA 91/010
UPAP2 (2003) , Poverty and Environment Case Study, Bushenyi District Report UWA (Uganda Wildlife Authority).2001. Annual Report 2000/2001. Kampala, Uganda.

The Role of Environment in Increasing Economic growth and Reducing Poverty in Uganda. Technical Report- Final
Gil Yaron, Yakobo Moyini, David Wasike, Maxwell Kabi, and Mildred Barungi 118
Wilson, Keizire and Brown (2002), Report on a study of fisheries related district tendering systems and implications for co-management of lake resources, DFR ILM project
World Bank (1997), Expanding the Measure of Wealth: Indicators of Environmentally Sustainable Development, World Bank Environment Department, Washington DC
World Bank (2003), http://lnweb18.worldbank.org/ESSD/envext.nsf/44ByDocName/GreenAccountingAdjustedNetSavings
WTO (World Tourism Organisation). 2003a. Nature-Related Tourism Continues to Exhibit Strong Growth. http://www.iucn.org/info and news/press/tbpa.pdf. WTO 2003b. Tourism Proves as a Resilient and Stable Economic Sector. WTO Newsroom/News Releases. File://A:WTO-4.htm.

The Role of Environment in Increasing Economic growth and Reducing Poverty in Uganda. Technical Report- Final
Gil Yaron, Yakobo Moyini, David Wasike, Maxwell Kabi, and Mildred Barungi 119
Annex 1 – PMA Priorities and relevance for fisherie s PMA PRIORITY FISHERIES RELEVANCE 1. Research and technology development
Vital to resource exploitation and aquaculture development
2. Advisory services Major support is required to deliver effective community management organisations
3. Agricultural education Appropriate training for service providers is difficult to find at present – change is needed
4. Access to rural finance Fisheries communities have a poor credit reputation; new approaches (women focused) are needed and diversification is essential
5. Natural resources management This an issue that underpins all livelihoods and aspirations to escape poverty
6. Agro-processing and marketing There is much scope for improving the value and benefits derived from catches
7. Physical infrastructure Landing sites, markets and roads are crucial to fisheries livelihoods, as are core public services
Source: Fisheries sector strategic plan (FSSP), GoU 2003

The Role of Environment in Increasing Economic growth and Reducing Poverty in Uganda. Technical Report- Final
Gil Yaron, Yakobo Moyini, David Wasike, Maxwell Kabi, and Mildred Barungi 120
Annex 2. Recommendations by Pillar Recommendation PEAP pillars Develop and implement a strategy with costed interventions for tackling soil degradation 1,3,4 Reform local taxation of natural resources and use increased revenues for local government expenditure and better monitoring, control & surveillance of fisheries, forestry & wetlands resources 1,2,3,4 Build capacity in community NR management institutions & use these more widely i.e. BMUs & lake management organisations in fisheries, Communal Land Associations (forestry, wetlands etc) 1,2,3 Strengthen capacity for ENR management in local government – develop a programme of capacity building for sub-district councils and empower parish and sub-county councils to formulate and enforce by-laws 1,2,4 NAADS to establish targets for extending ENR activities in all target districts and identify costs – innovative funding mechanism provides incentives for sub-counties to address ENR issues 1,2,3 Make the ENR sector eligible for LGDP funds – improve the incentive for local government to take ENR issues on board 1,2,3 Derive & implement consistent, SMART performance indicators for the ENR sector & sub-sectors 1,2,3,4 Promote exports of sustainably harvested non-wood forest and wetland products 1,3 Providing an enabling environment to facilitate NR-based businesses e.g. forestry plantations to be established on derelict land & expansion of wildlife tourism 1,3 Introduce technical innovations for natural resource management successfully used elsewhere 3,4 Strengthen support for local government environmental & agricultural officers to deliver ENR messages to farmers in non-NAADS districts 1,2,3 Improve coordination on ENR issues within government 1,2,3,4 Address gender issues – land ownership & poverty within the household 1,2,3,4 Undertake further research – 13 key areas are identified 1,2,3,4 Identify the scope for sustainable aquaculture and the potential of innovative schemes (e.g. out grower) for this to be pro-poor 1,3,4 Improve environmental legislation – replace prohibition with incentives for sustainable use, resolve land ownership issues in wetlands 2,3