The role of CONEVAL in monitoring and measuring equity and its impact on the development of...
18
The Role of CONEVAL in Monitoring and Measuring Equity and its Impact on the Development of Equitable Public Policies “Institutional Frameworks for Social Equity Monitoring and Improving the Effectiveness of Public Policies in Promoting Equity” Ricardo Aparicio Algeria December 15-16, 2014
-
Upload
unicef-algerie -
Category
Government & Nonprofit
-
view
227 -
download
1
Transcript of The role of CONEVAL in monitoring and measuring equity and its impact on the development of...

The Role of CONEVAL in Monitoring and Measuring Equity and its Impact on the
Development of Equitable Public Policies
“Institutional Frameworks for Social Equity Monitoring and Improving the Effectiveness of Public Policies in
Promoting Equity”
Ricardo Aparicio
AlgeriaDecember 15-16, 2014
Multidimensional poverty measurement: key elements
Relevant dimensions
• Constitutional rights
Unit of analysisIndividuals
• Human rights titularities
• (Universality Principle)
Poverty thresholds• At least
one social deprivation
• (IndivisibilityPrinciple)
Dimensions thresholds• Legal
standards
• Institutional criteria
Weightings
• Same importance dimensions
• (Interdependence Principle)
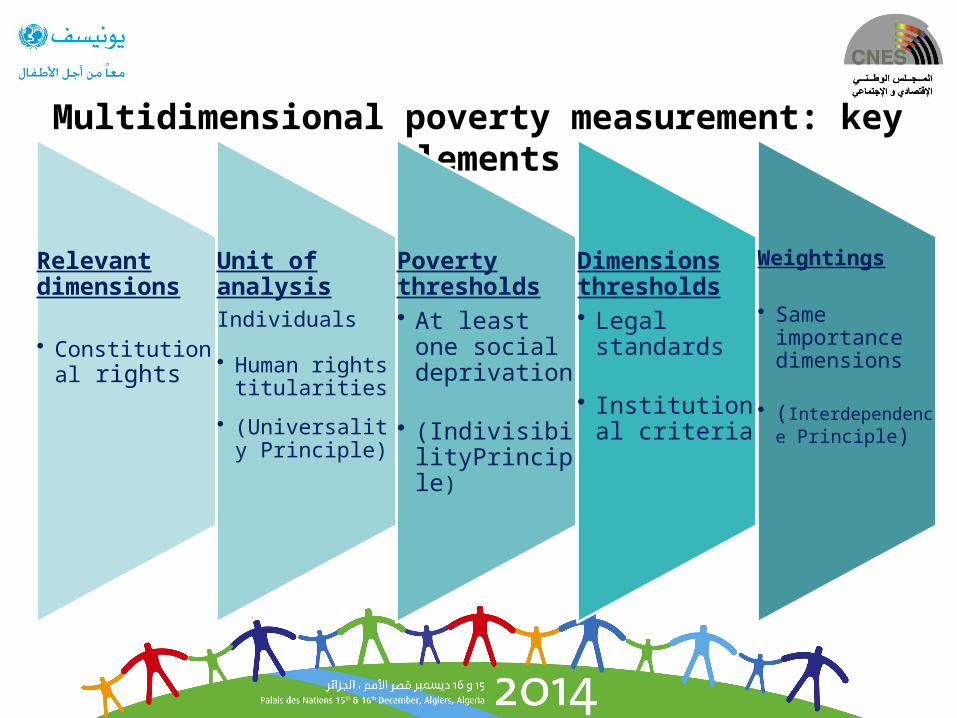
Multidimensional measurement: properties
Dimension decomposability
1Population groups decomposability
2Comparability across time
3
Identification of priority population
groups

• Children and adolescents
• Indigenous
• Elderly
• Gender
Priority population groups in promoting equity
• Federal
• State
• Municipality
• Place of residence
Population
Regions
Equity
All persons should
be included
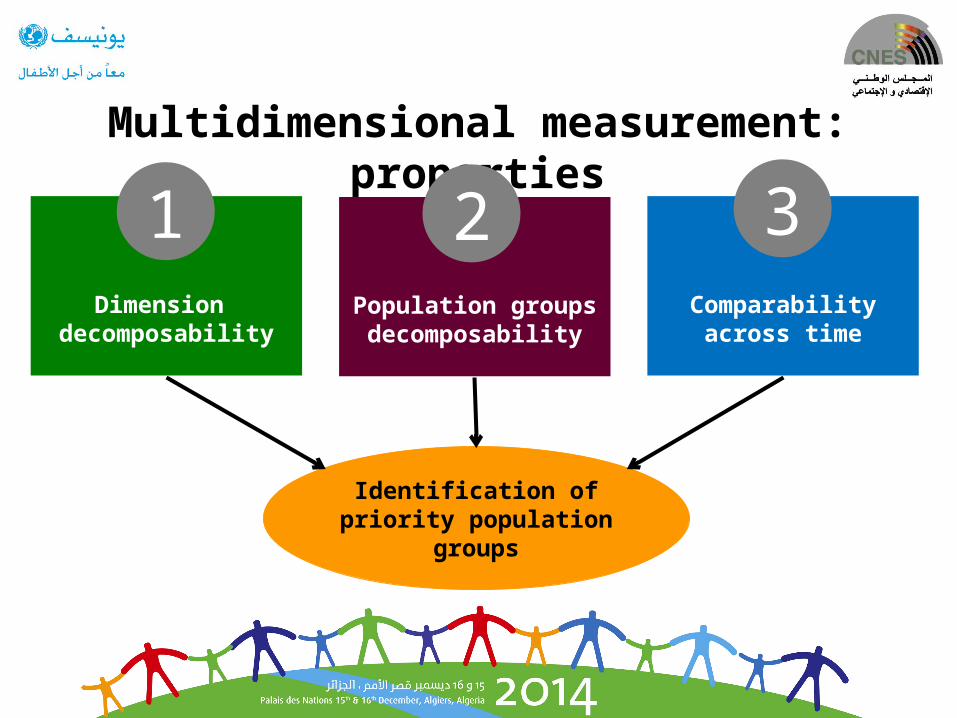
Poverty indicators, 2012
03
Vulnerable by social deprivation28.6 %
33.5 millionAverage: 1.8 social deprivations
Vulnerable by income6.2 %
7.2 million
5 24 16
Population not poor and not vulnerable
19.8 %23.2 million
Poverty
Urban = $1,125 Rural = $800
Urban = $2,329 Rural = $1,490
Moderate poor35.7%
41.8 millionAverage: 2.0
social deprivations
Extreme poor9.8%
11.5 millionsAverage: 3.7 social deprivations
MWL
Well-b
ein
gIn
com
e
EWL
Social rightsSocial deprivation 45.5 %
53.3 millionAverage: 2.4
social deprivations Source: CONEVAL estimations based on the MCS-ENlGH 2012
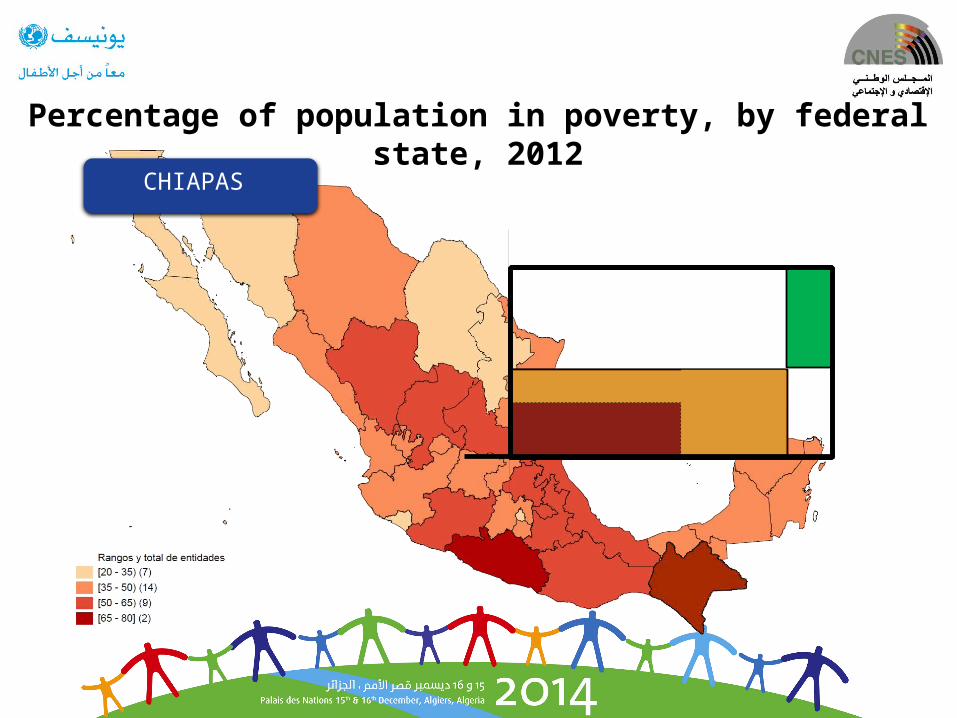
Percentage of population in poverty, by federal state, 2012
CHIAPAS
03
Vulnerable by social deprivation17.2%
869.7thousandsAverage: 2.0 social deprivations
Vulnerable by income1.7 %
87.6 thousands
5 24 16
Population not poor and not vulnerable
6.4 %324.5 thousands
Urban = $1,125 Rural = $800
Urban = $2,329 Rural = $1,490
Moderate poor42.5%
2,153.1 thousandsAverage: 2.2
social deprivations
Extreme poor32.2%
1,629.2 thousandsAverage: 3.8 social deprivations
MWL
Well-b
ein
gIn
com
e
EWL
Social rightsSocial deprivation
Source: CONEVAL estimations based on the MCS-ENlGH 2012
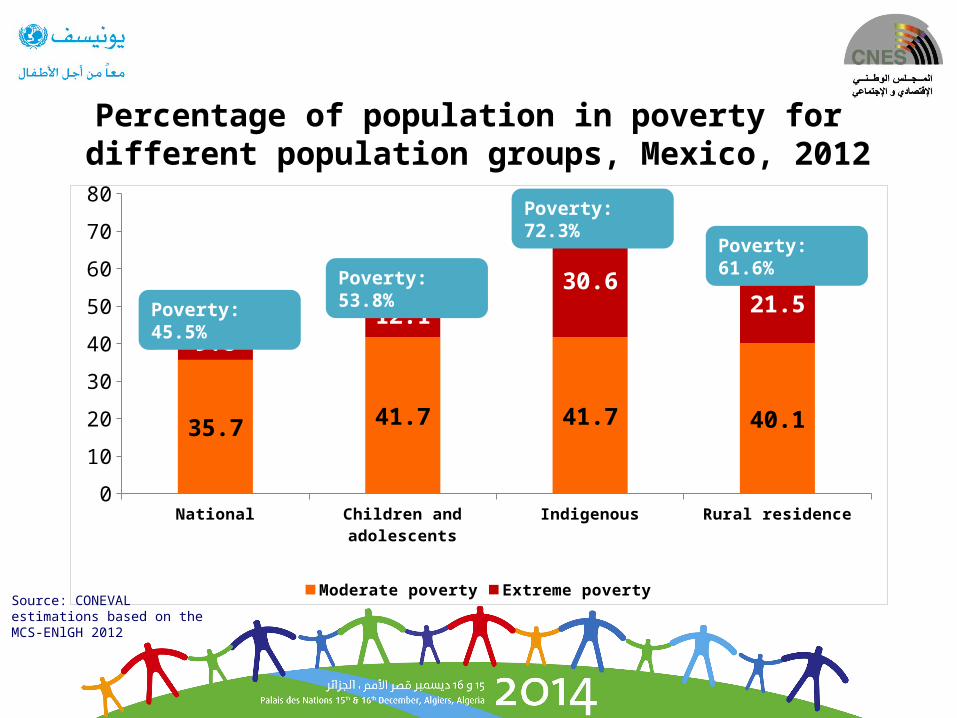
Percentage of population in poverty for different population groups, Mexico, 2012
National Children and adolescents Indigenous Rural residence0
10
20
30
40
50
60
70
80
35.7 41.7 41.7 40.1
9.812.1
30.621.5
Moderate poverty Extreme poverty
Poverty: 45.5%
Poverty: 53.8%
Poverty: 61.6%
Poverty: 72.3%
Source: CONEVAL estimations based on the MCS-ENlGH 2012
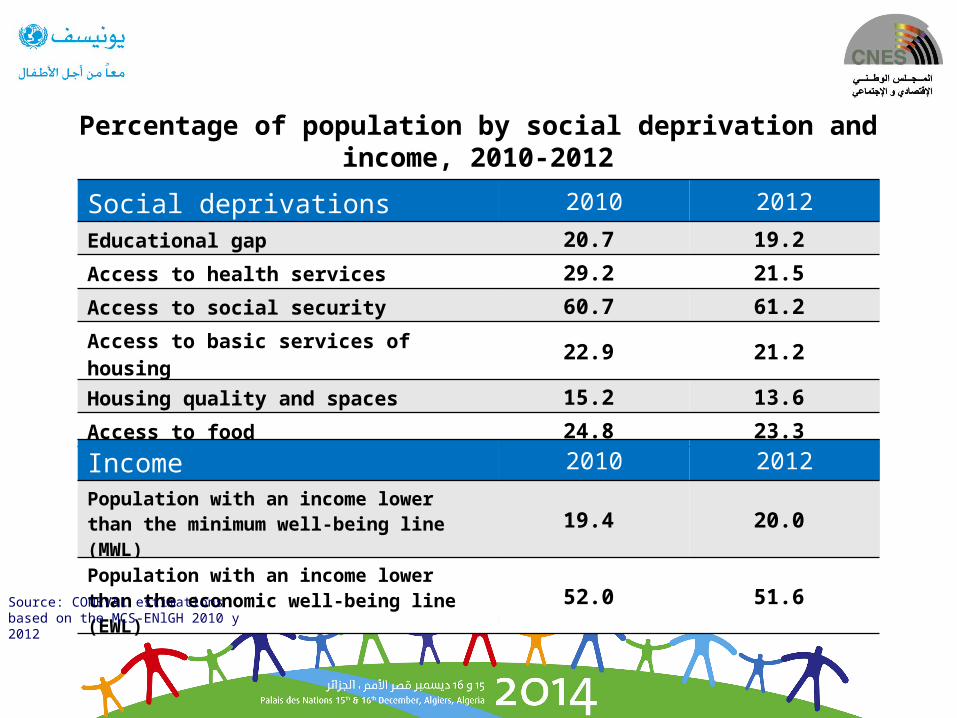
Percentage of population by social deprivation and income, 2010-2012
Social deprivations 2010 2012
Educational gap 20.7 19.2
Access to health services 29.2 21.5
Access to social security 60.7 61.2
Access to basic services of housing 22.9 21.2
Housing quality and spaces 15.2 13.6
Access to food 24.8 23.3
Income 2010 2012
Population with an income lower than the minimum well-being line (MWL) 19.4 20.0
Population with an income lower than the economic well-being line (EWL) 52.0 51.6
Source: CONEVAL estimations based on the MCS-ENlGH 2010 y 2012
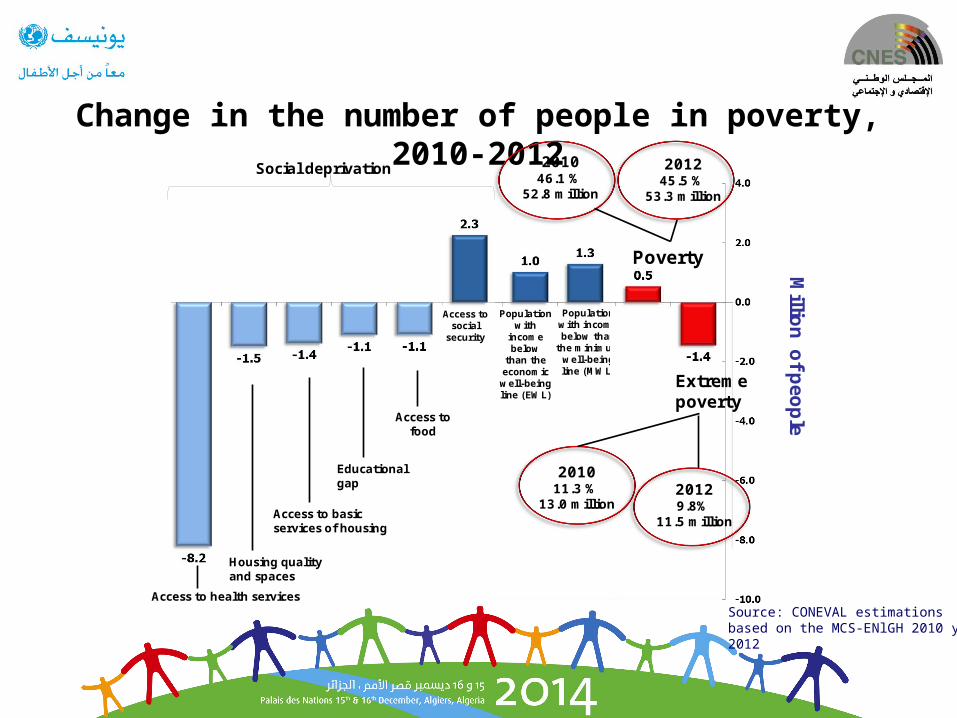
Change in the number of people in poverty, 2010-2012
Population with
income below
than the economic well-being line (EWL)
Population with income below than
the minimum well-being line (MWL)
Housing quality and spaces
Access to basic services of housing
Educational gap
Access to food
Access to social
security
Social deprivation
Access to health services
Millio
n o
f peo
ple
Poverty
201046.1 %
52.8 million
201245.5 %
53.3 million
Extreme poverty
201011.3 %
13.0 million20129.8%
11.5 million
Source: CONEVAL estimations based on the MCS-ENlGH 2010 y 2012

Poverty and extreme poverty by municipality, Mexico, 2010
Rangos
[ 0 - 30 ] [ 30 - 50 ] [ 50 - 70 ] [ 70 - 100 ]
Total de municipios
97 347 790 1222
Percentage of population in extreme poverty by municipality, México 2010
Percentage of population in poverty by municipality, Mexico 2010
Rangos
[ 0 - 20 ] [ 20 - 40 ] [ 40 - 60 ] [ 60 - 85 ]
Total de municipios
1250 668 390 148
2,012 municipalities: 50 percent or more of its population is poor.338 municipalities: most people are extremely poor.
Source: CONEVAL estimations based on the MCS-ENIGH 2010 and Sample Census of Population and Housing 2010.
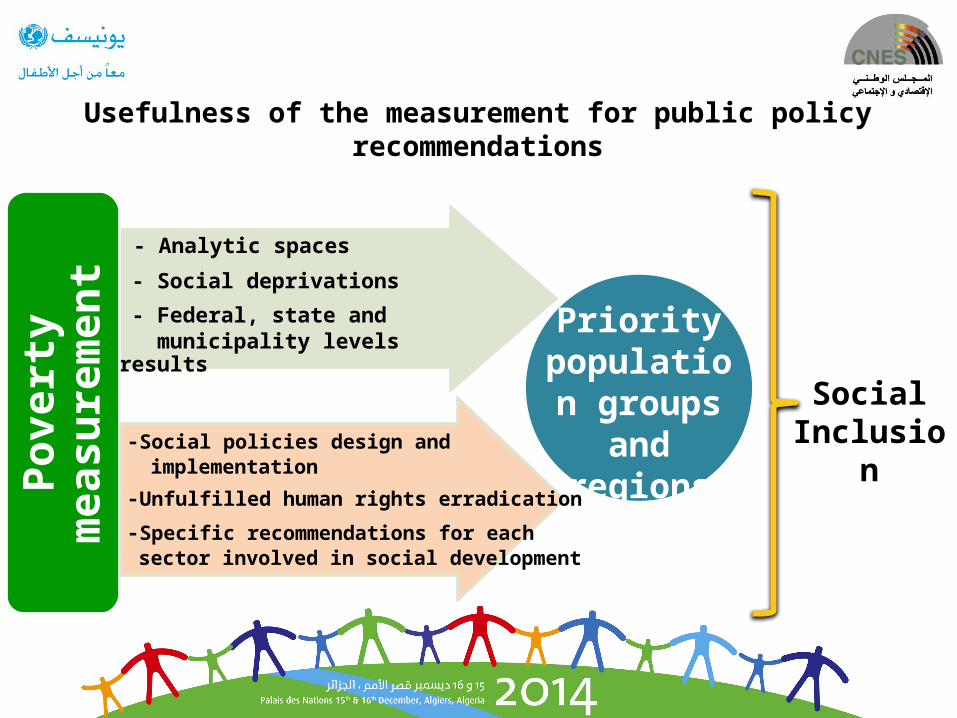
Usefulness of the measurement for public policy recommendations
Priority population groups
and regions
- Analytic spaces
- Social deprivations
- Federal, state and municipality levels results
Povert
y
measu
rem
en
t
-Social policies design and implementation
-Unfulfilled human rights erradication
-Specific recommendations for each sector involved in social development
SocialInclusion
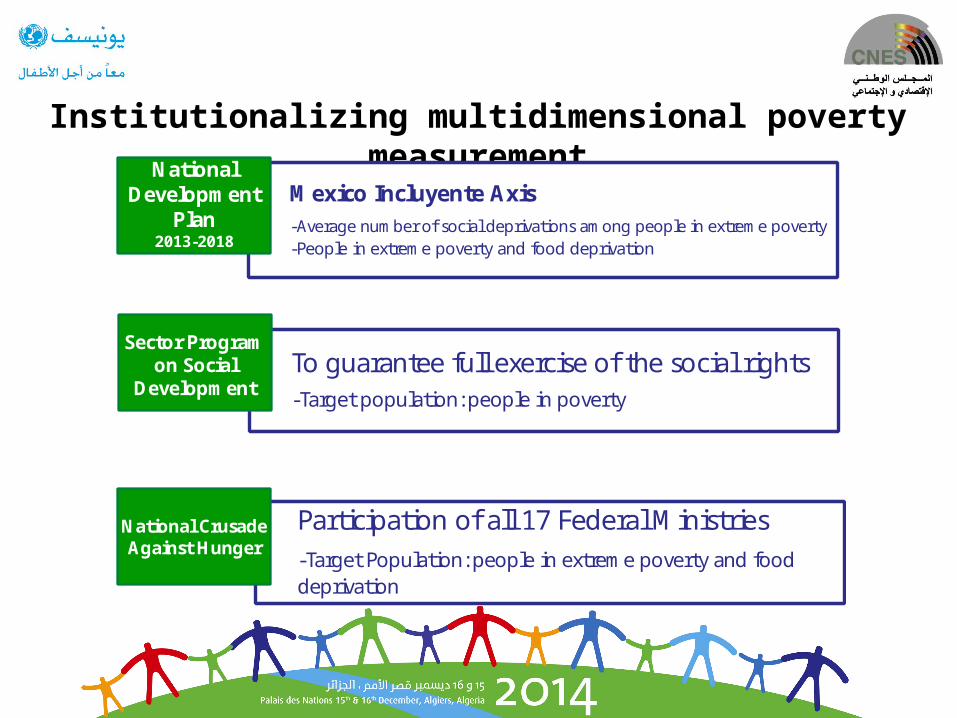
Institutionalizing multidimensional poverty measurement
To guarantee full exercise of the social rights -Target population: people in poverty
Participation of all 17 Federal Ministries-Target Population: people in extreme poverty and food deprivation
Mexico Incluyente Axis-Average number of social deprivations among people in extreme poverty-People in extreme poverty and food deprivation
NationalDevelopment
Plan 2013-2018
Sector Program on Social
Development
National CrusadeAgainst Hunger
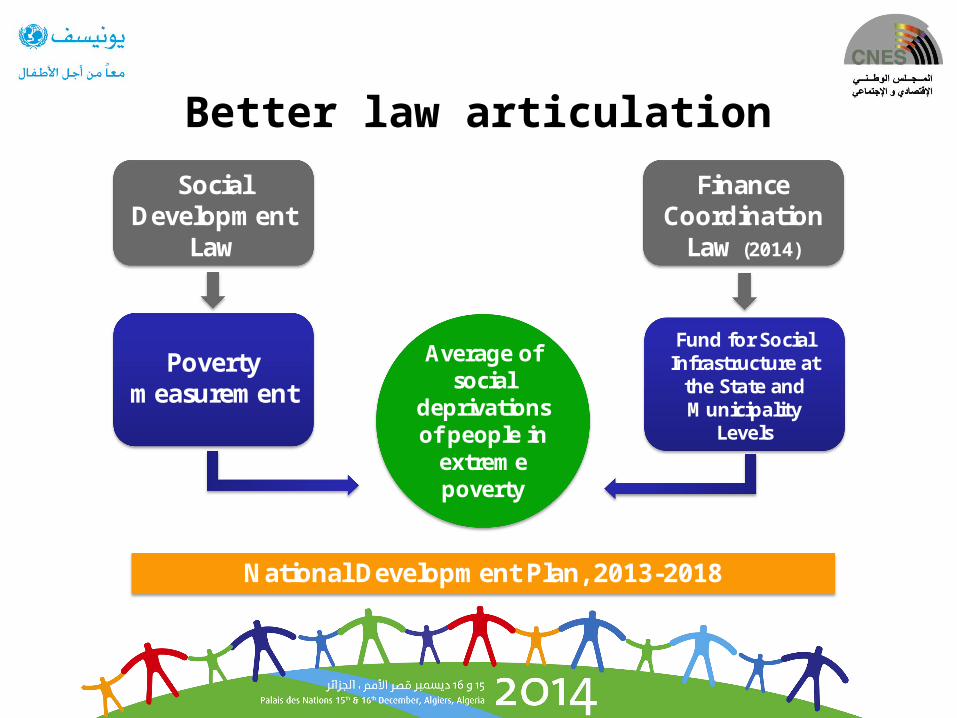
Better law articulation
National Development Plan, 2013-2018
Social Development
Law
FinanceCoordination
Law (2014)
Averageof social
deprivationsof peoplein
extreme poverty
Povertymeasurement
Fund for Social Infrastructure at
the State and Municipality
Levels

Constitutional Autonomy to ConevalConsolidate the autonomy and
independence of the government structures
Poverty measurem
ent
Social development policy
evaluation
Recommen-
dations
Report extreme poverty of food
Report complementary indicators
Mandatory use for federal, state and municipal authorities
Also…

Institutional collaboration: CONEVAL-UNICEF
General Law for Protection
of Children and
Adolescents
Evaluation by
CONEVAL
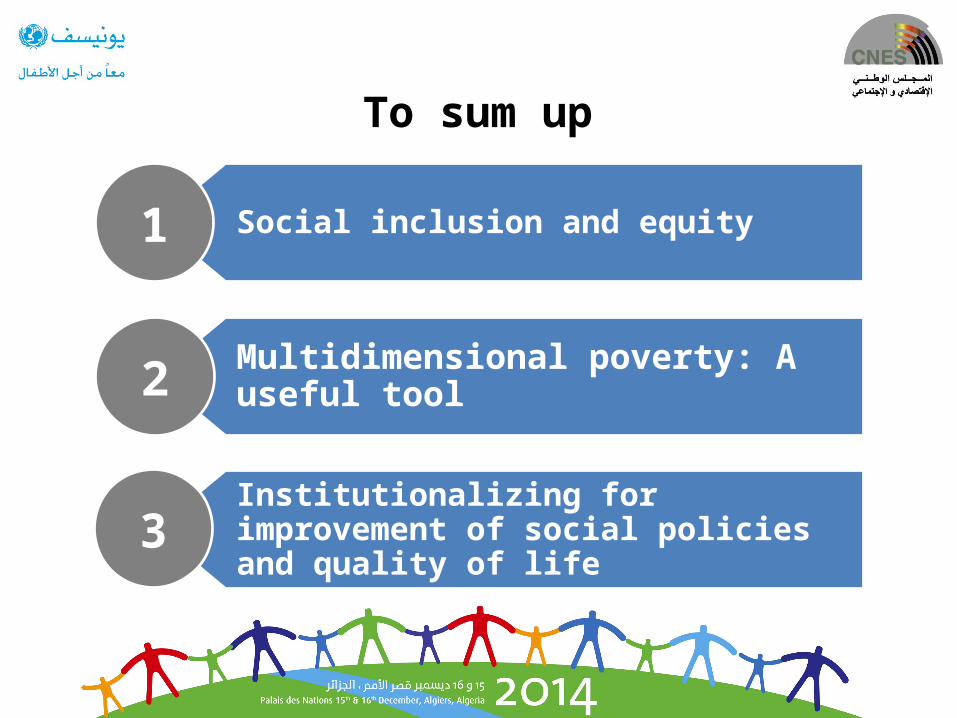
To sum up
Social inclusion and equity1
Multidimensional poverty: A useful tool
Institutionalizing for improvement of social policies and quality of life
2
3

¡Merci!
Thank you!
¡Gracias!
Contact information
Ricardo AparicioDirector, Poverty Analysis
Consejo Nacional de Evaluación de la Política de Desarrollo Social(CONEVAL)
Boulevard Adolfo López Mateos No.160. Coll. San Ángel Inn, Delegación Álvaro Obregón, C.P. 01060, México, D.F
www.coneval.gob.mx