The role of CMEs in the solar cycle and Evidence for a Floor in the Open Magnetic Flux
19
The role of CMEs in the solar cycle and Evidence for a Floor in the Open Magnetic Flux Nathan Schwadron, N. Crooker, M. J. Owens, C. W. Smith, D. E. Connick, T. S. Horbury, O. C. St Cyr, N. Gopalswamy, S. Yashiro, H. Xie
-
Upload
guy-william -
Category
Documents
-
view
26 -
download
4
description
The role of CMEs in the solar cycle and Evidence for a Floor in the Open Magnetic Flux. Nathan Schwadron, N. Crooker, M. J. Owens, C. W. Smith, D. E. Connick, T. S. Horbury, O. C. St Cyr, N. Gopalswamy, S. Yashiro, H. Xie. The Helisphere’s Hale Cycle. N- S+. N+ S-. N- S+. N- S+. N+ - PowerPoint PPT Presentation
Transcript of The role of CMEs in the solar cycle and Evidence for a Floor in the Open Magnetic Flux
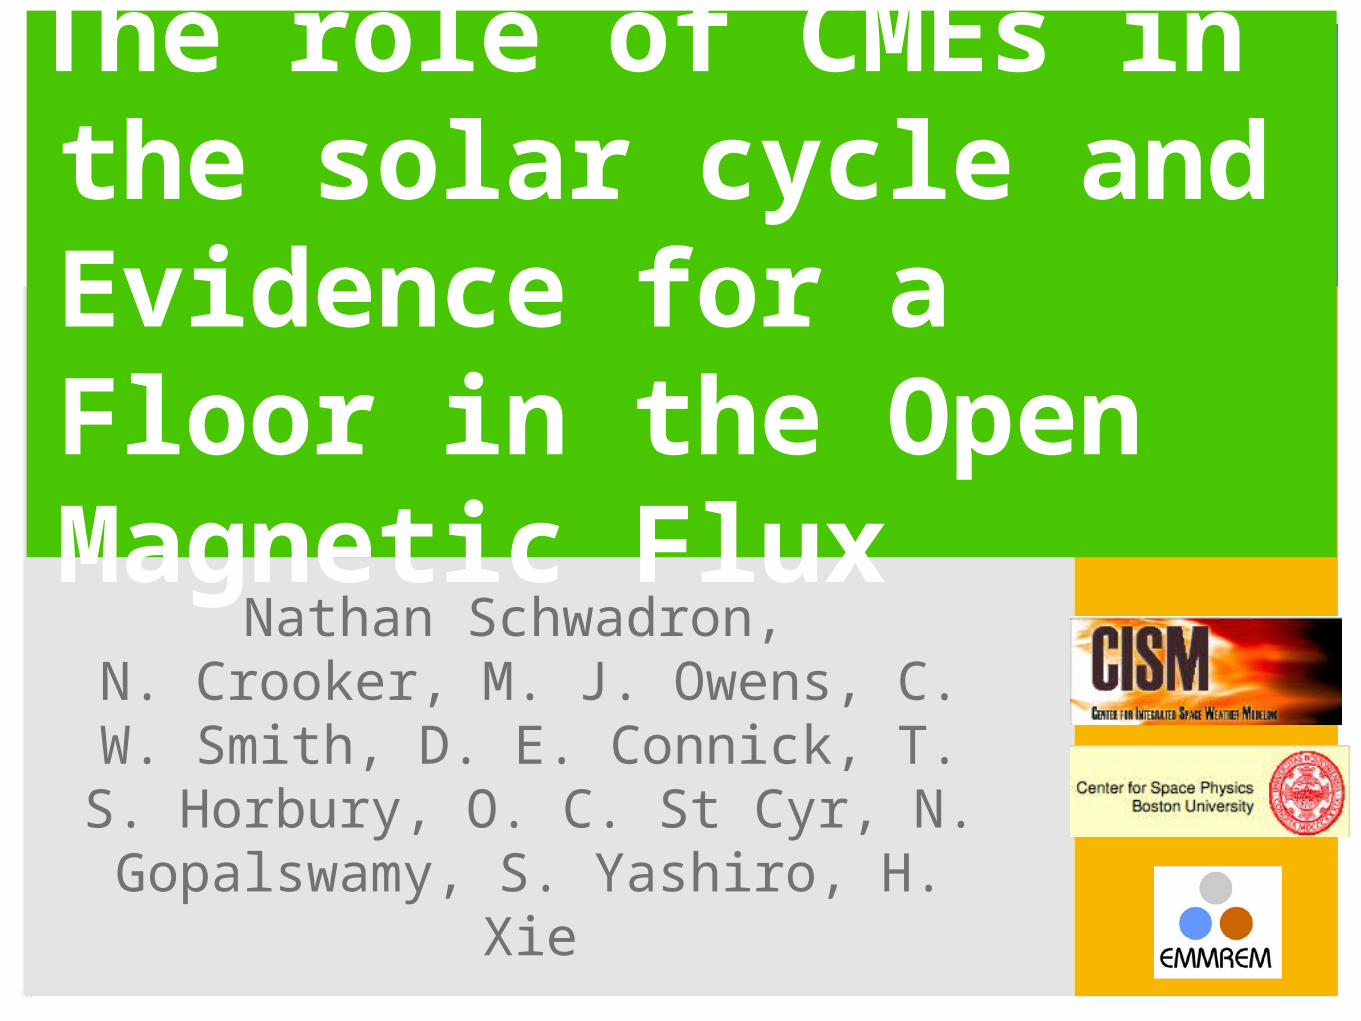
The role of CMEs in the solar cycle and Evidence for a Floor in the Open Magnetic Flux
Nathan Schwadron, N. Crooker, M. J. Owens, C. W.
Smith, D. E. Connick, T. S. Horbury, O. C. St Cyr, N.
Gopalswamy, S. Yashiro, H. Xie
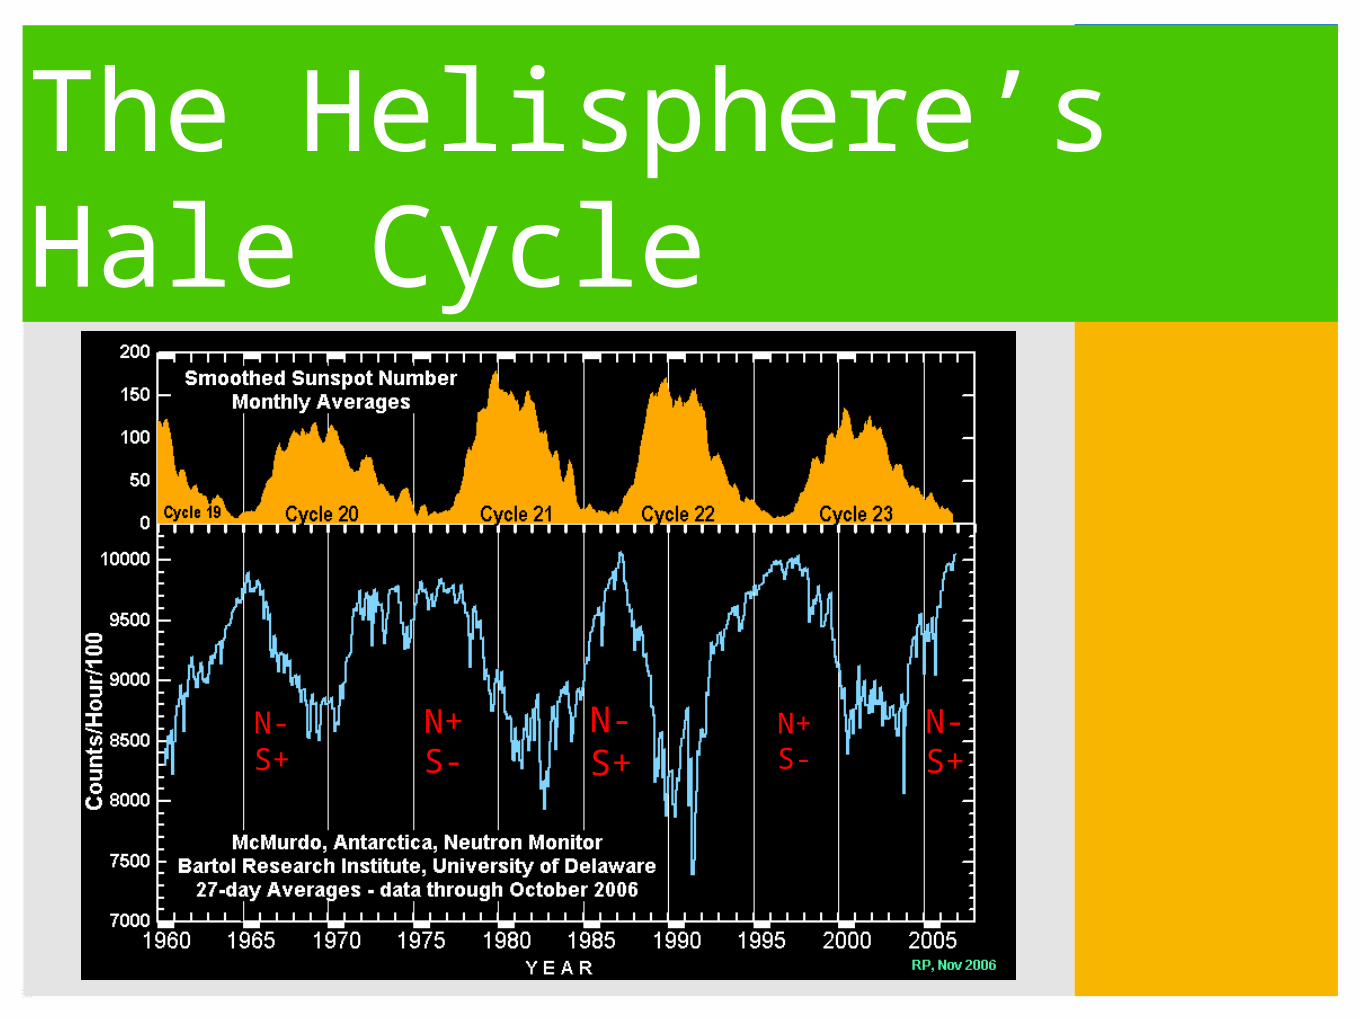
The Helisphere’s Hale Cycle
N+S-
N-S+
N+S-
N-S+
N-S+
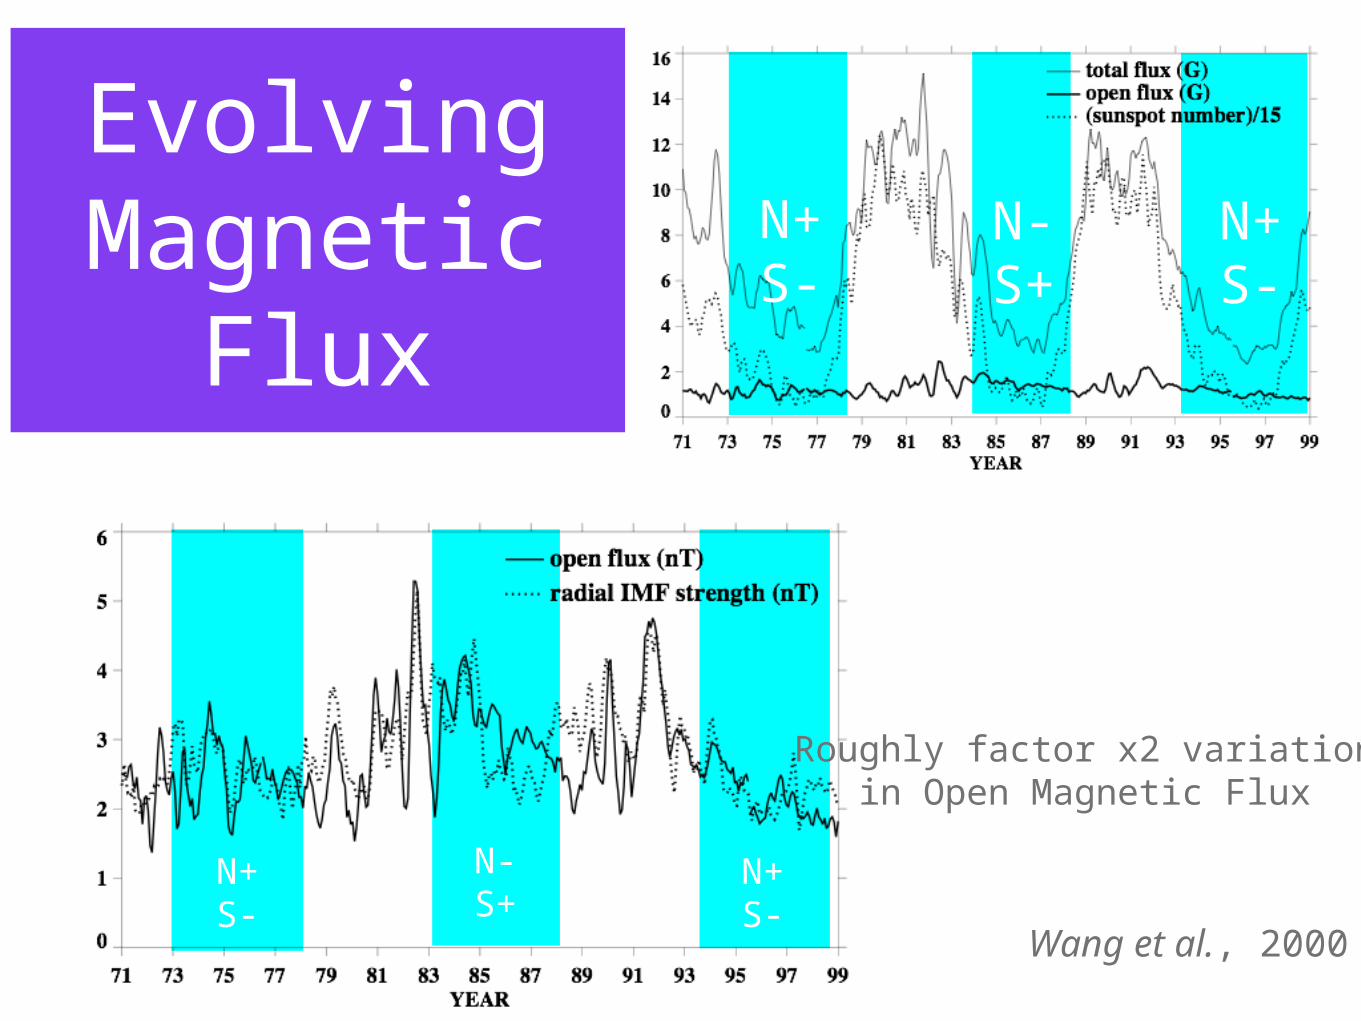
Evolving Magnetic
Flux
Wang et al., 2000
N+S-
N-S+
N+S-
N+S-
N-S+
N+S-
Roughly factor x2 variationin Open Magnetic Flux

The Role of CMEs
CMEs move flux via interchange reconnection
CMEs temporarily add closed magnetic flux,
increasing |B|, particularly during solar
max

Temporary Flux Addition by
CMEs
Black line shows the observed value of |B| at 1 AU from ACE/Wind
Red line shows simulated value of |B| at 1 AU using LASCO observed
CME rates
CME half-life 50 days
Model comparison validates open flux conservation during
CME ejections
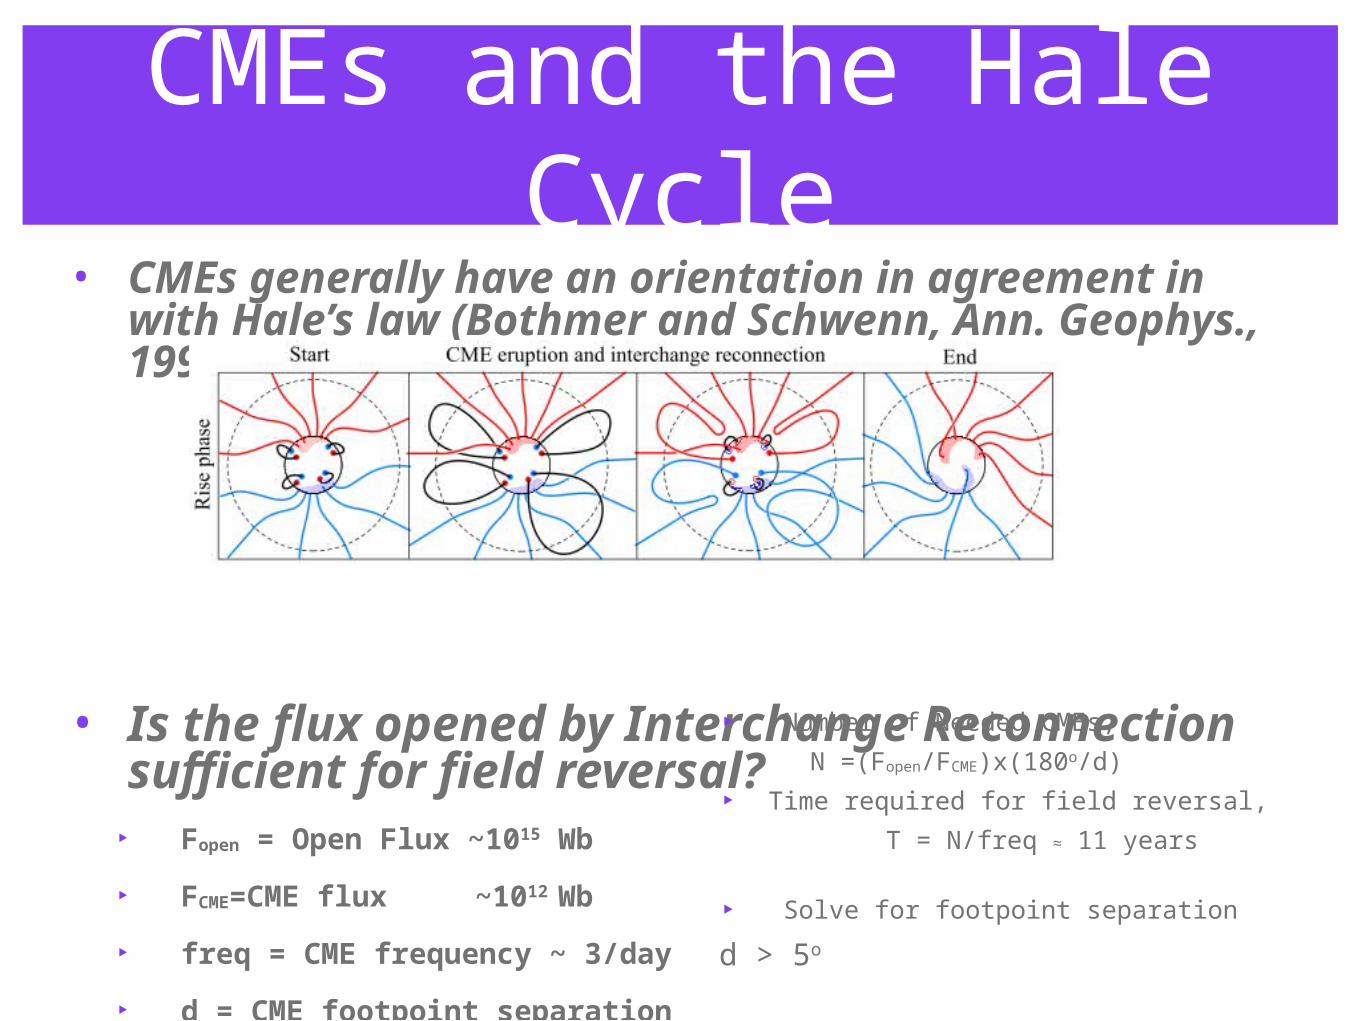
CMEs and the Hale Cycle
• CMEs generally have an orientation in agreement in with Hale’s law (Bothmer and Schwenn, Ann. Geophys., 1998)
• Is the flux opened by Interchange Reconnection sufficient for field reversal?
‣ Fopen = Open Flux ~1015 Wb
‣ FCME=CME flux ~1012 Wb
‣ freq = CME frequency ~ 3/day
‣ d = CME footpoint separation
‣ Number of Needed CMEs,
N =(Fopen/FCME)x(180o/d)
‣ Time required for field reversal,
T = N/freq ≈ 11 years
‣ Solve for footpoint separation
d > 5o
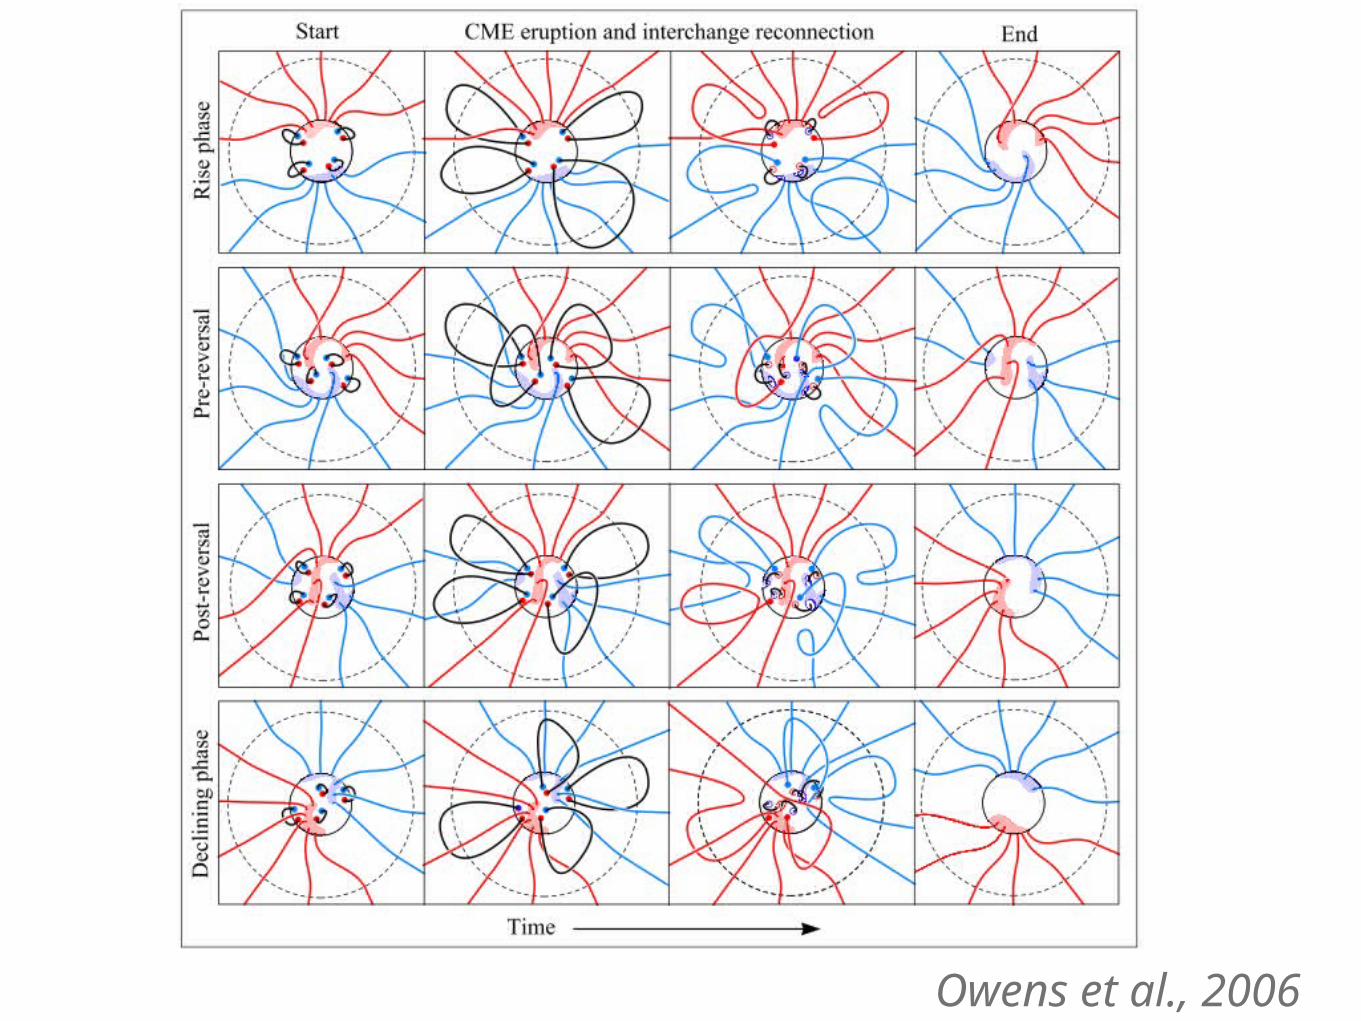
Owens et al., 2006

Cohen et al, 2009 – See Poster
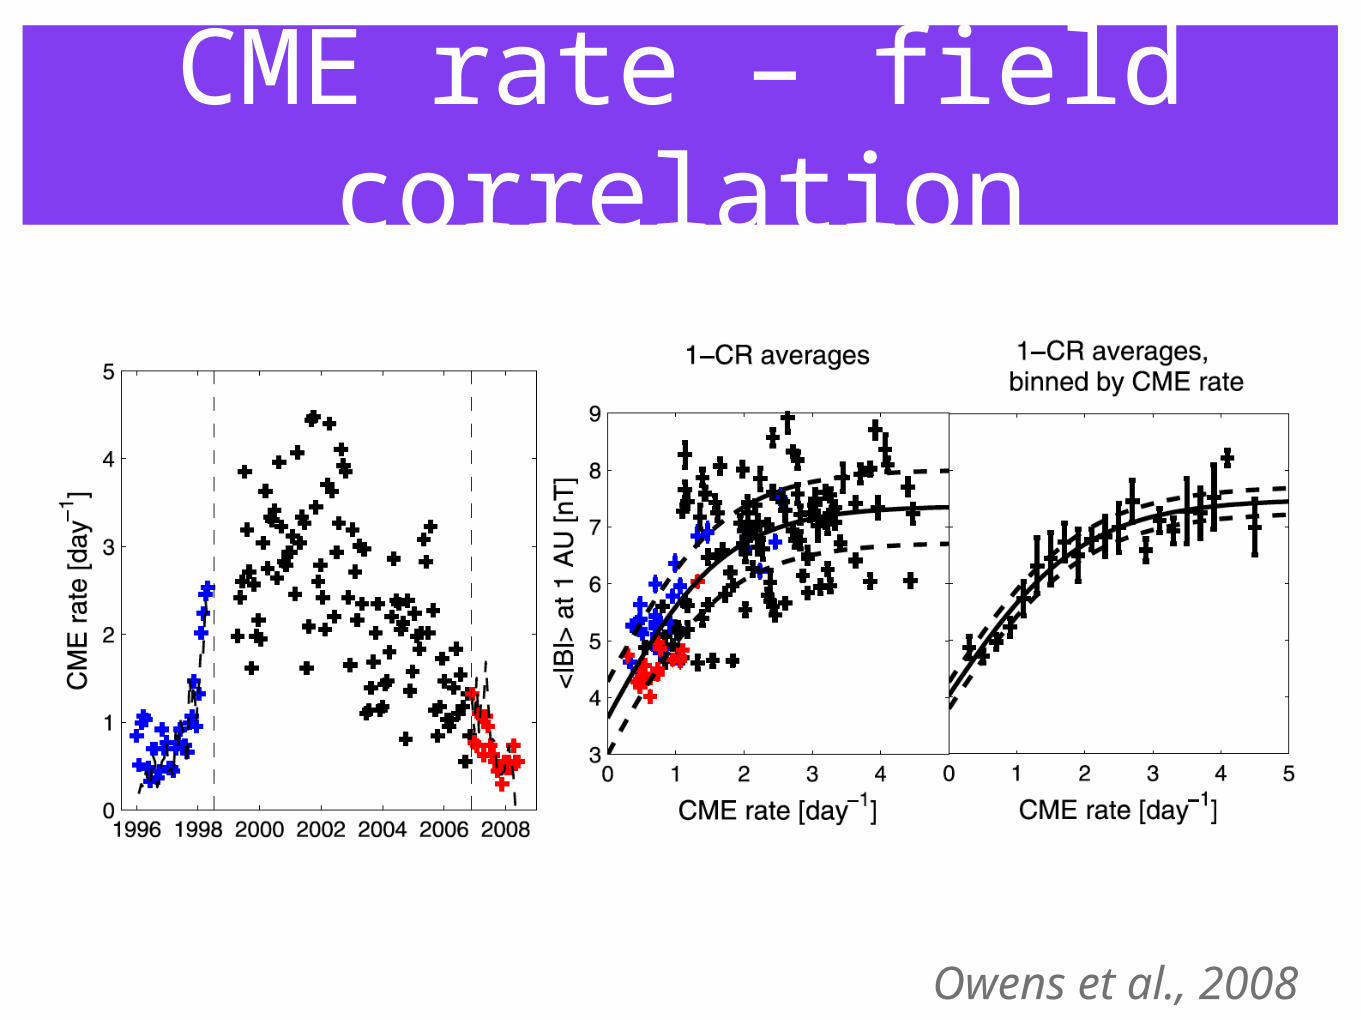
CME rate – field correlation
Owens et al., 2008

CME-rate |B| correlation
Owens et al., 2008
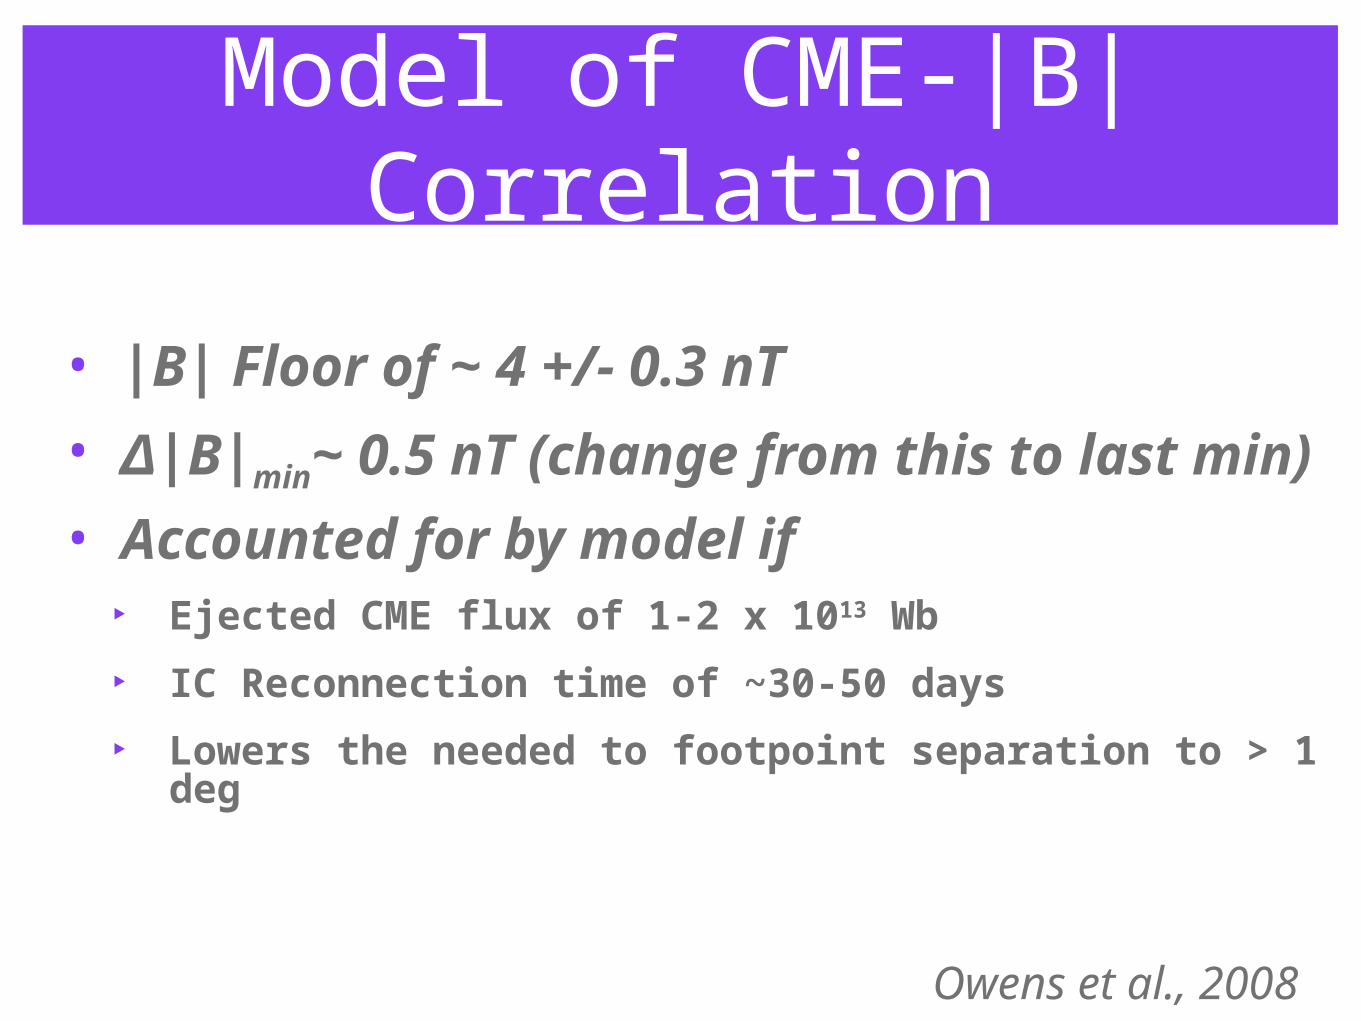
Model of CME-|B| Correlation
• |B| Floor of ~ 4 +/- 0.3 nT
• Δ|B|min~ 0.5 nT (change from this to last min)
• Accounted for by model if ‣ Ejected CME flux of 1-2 x 10¹³ Wb
‣ IC Reconnection time of ~30-50 days
‣ Lowers the needed to footpoint separation to > 1 deg
Owens et al., 2008
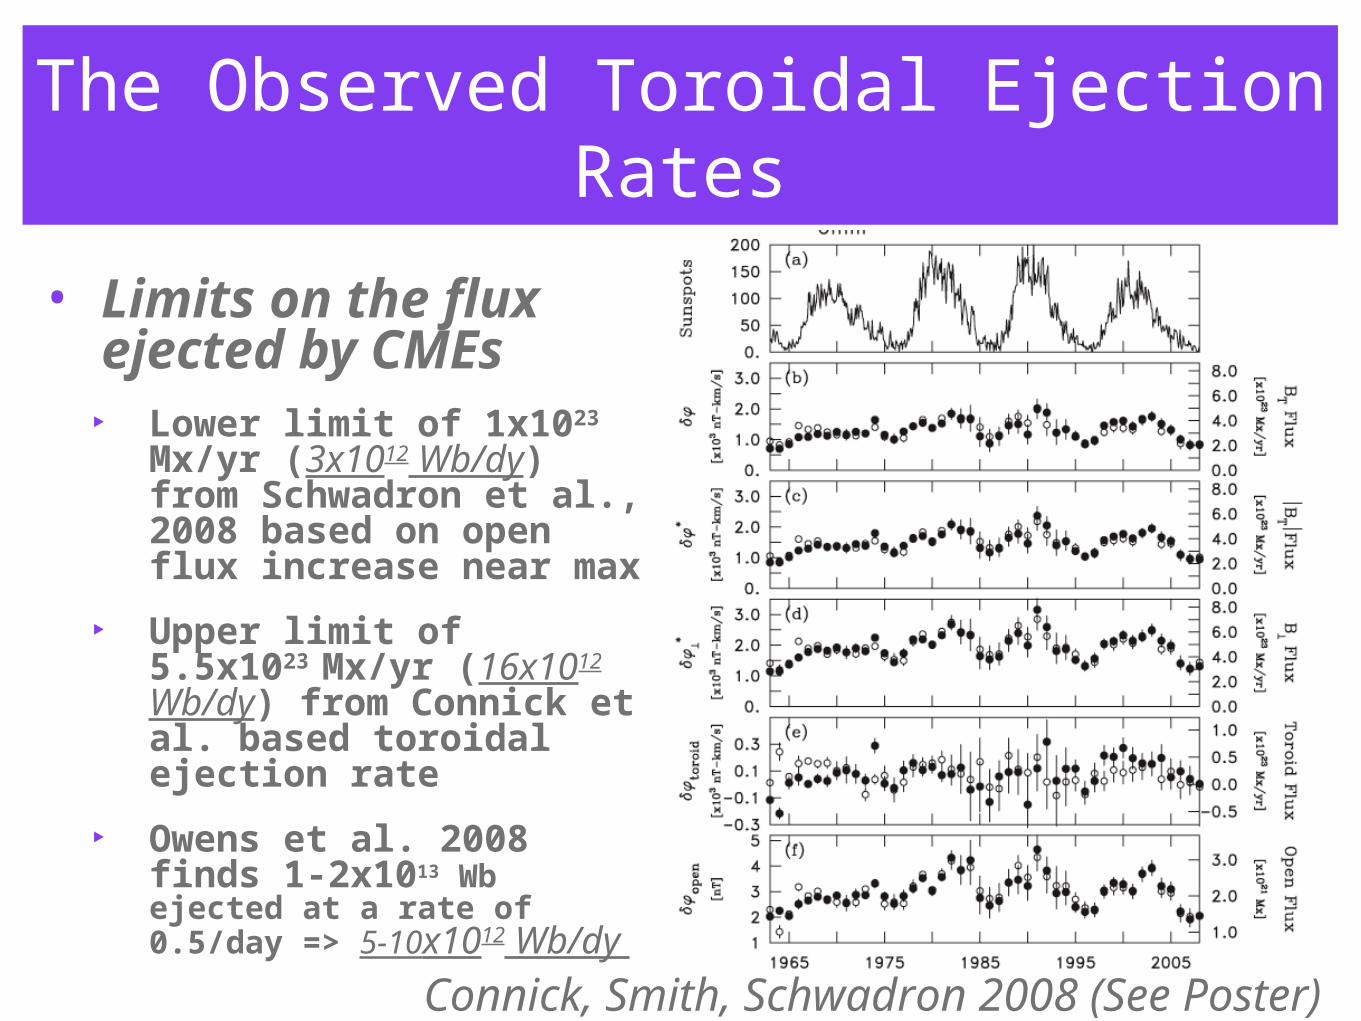
The Observed Toroidal Ejection Rates
• Limits on the flux ejected by CMEs
‣ Lower limit of 1x10²³ Mx/yr (3x10¹² Wb/dy) from Schwadron et al., 2008 based on open flux increase near max
‣ Upper limit of 5.5x10²³
Mx/yr (16x1012 Wb/dy) from Connick et al. based toroidal ejection rate
‣ Owens et al. 2008 finds 1-2x10¹³ Wb ejected at a rate of 0.5/day => 5-10x1012 Wb/dy
Connick, Smith, Schwadron 2008 (See Poster)
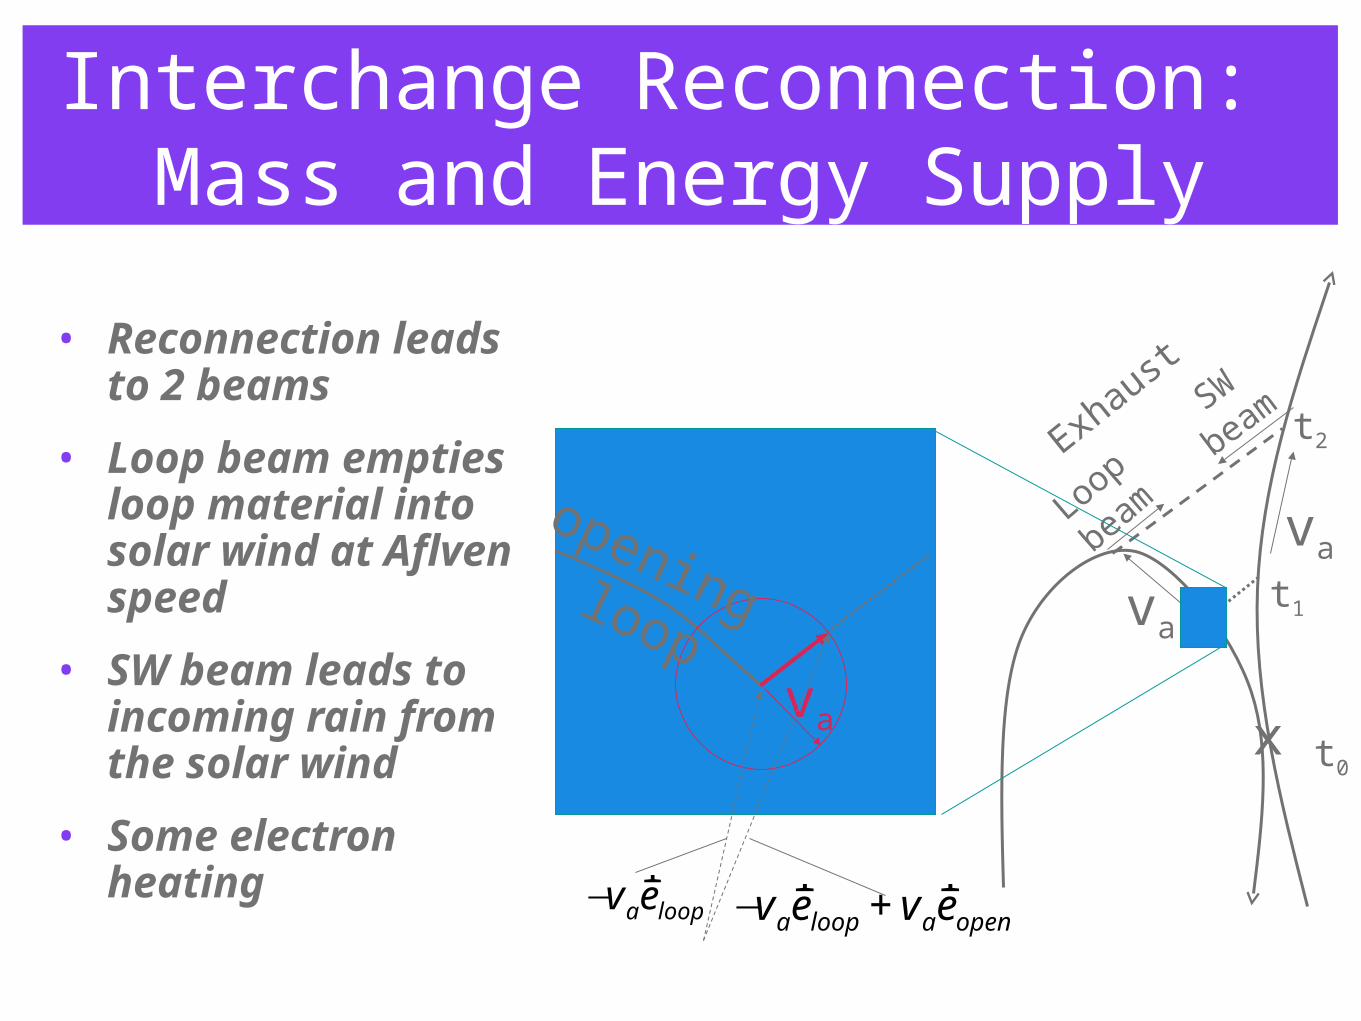
Interchange Reconnection: Mass and Energy Supply
• Reconnection leads to 2 beams
• Loop beam empties loop material into solar wind at Aflven speed
• SW beam leads to incoming rain from the solar wind
• Some electron heating
va
t0
t1
t2
va
Exhaust
va
Loop
beam
SW
beam
€
−va
r e loop
€
−va
r e loop + va
r e open
opening loop
x
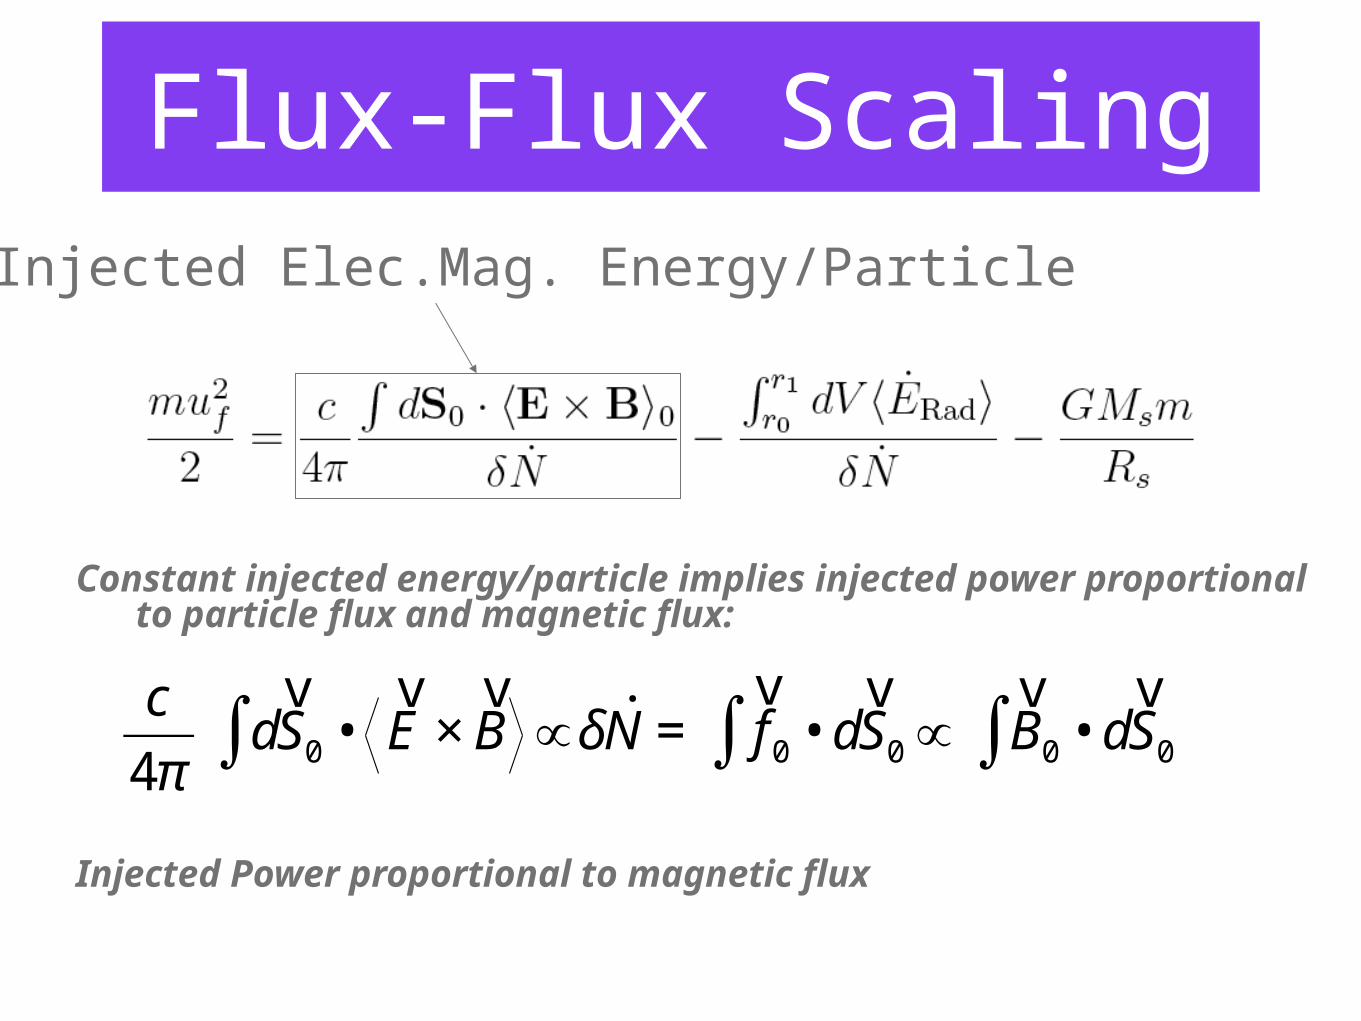
Flux-Flux Scaling
Constant injected energy/particle implies injected power proportional to particle flux and magnetic flux:
Injected Power proportional to magnetic flux
Injected Elec.Mag. Energy/Particle
€
c
4πd
v S 0∫ •
v E ×
v B ∝δ ˙ N =
v f 0 • d
v S 0∫ ∝
v B 0 • d
v S 0∫

Solar Wind Power and Mass Flux Decreases with Time

Long-Term Evolution
• Evidence of Open Flux Conservation over Large Timescales (Svalgaard and Cliver, 2007)

STEREO COR1 Preliminary CME Rate (12-Dec-2006 -to- 25-Jun-2009)
0
1
2
2050 2053 2056 2059 2062 2065 2068 2071 2074 2077 2080 2083
Carrington Rotation
[CM
Es/
day
]http://
cor1.gsfc.nasa.gov
Preliminary CME Catalogue
St. Cyr (Jan-Aug 2007)
Hong Xie (Sep 2007-Sep2008)
St. Cyr & Xie (Oct 2008-Jun2009)
SOHO LASCO
CME Rate in 1996-
1997 was ~0.5
CMEs/day
>400 CMEs

SOHO LASCO CME RateSOHO-LASCO 1996-1997-June1998 (841 CMEs)
0.0
1.0
2.0
3.0
4.0
1903 1908 1913 1918 1923 1928 1933 1938
Carrington Rotation Number
CM
E R
ate
[CM
Es/
day]

CMEs and the Solar Cycle
• Clear Correlation between Open Field Flux and CME rate
• Clear evidence for Interchange Reconnection
• IR with CMEs should help achieve the reversal
• Recent observations suggest consistent limits on flux ejection by CMEs
• The observed ejection rates easily support reversal over the 11 year solar cycle
• We are now in a prolonged depression in open field strength, ejection rate, solar wind mass flux and solar wind power‣ These are all likely regulated through
interchange reconnection with CMEs