The Role of Changing Utility in Product Search · 2020-01-07 · The Role of Changing Utility in...
49
1 The Role of Changing Utility in Product Search August 26, 2013 Daria Dzyabura NYU Stern School of Business 40 West 4 th Street New York, NY 10012 [email protected]
Transcript of The Role of Changing Utility in Product Search · 2020-01-07 · The Role of Changing Utility in...

1
The Role of Changing Utility in Product Search
August 26, 2013
Daria Dzyabura
NYU Stern School of Business
40 West 4th
Street
New York, NY 10012
2
The Role of Changing Utility in Product Search
Abstract
Consumers are often not fully aware of their preferences when they begin search. As
consumers examine products they clarify their preferences, and some attribute weights in their
utility function change. We develop a model of sequential search with changing utility weights,
and derive relevant implications. Specifically, we study the value of the accuracy of product
attribute information available to the user, and the impact of product recommendations on search
outcomes. Because preferences change as consumers examine products, the examined products
influence the products they will search in the future. In certain parts of the parameter space, more
accurate product information, on average, hurts consumers in the long run. Additionally, product
recommendations impact not only the user’s consideration of the recommended product, but also
the future search path. Therefore, the impact of a product recommendation on the user’s net
payoff is not necessarily directly related to the quality of the recommended product: consumers
can derive benefit from seeing an undesirable product, if that product exposes them to new
relevant features, and helps them be more efficient in the future search. Finally, we empirically
demonstrate that people change their preferences while searching for apartments.
Keywords: Constructed preferences, Decision making under uncertainty, Choice models,
Product recommendations, Search

3
Introduction
When making important choices, such as purchasing a house, deciding where to go to
college, or choosing a spouse or partner, novice decision makers often start with a search
objective that evolves as they search and become more expert. For example, a recent New York
Times article on real estate buyer behavior quotes an experienced real estate agent: “‘Often
people don’t know what they want. […] You may think you want X, but if you’re shown Y, you
may love Y better than you ever loved X’” (Rogers 2013). From the modeling perspective, they
start out with certain utility weights, which change as they search and evaluate homes. Similarly,
when high school students decide which college to attend, some of the most common mistakes
they make are only considering colleges that mom or dad attended, choosing a college based on
the quality of the school’s athletic teams, or applying only to nearby colleges. These mistakes do
not relate to being misinformed about a certain college’s attributes, but rather to over- or under-
weighting the importance of attributes. In fact, college counselors often suggest that “students
look at schools of various types for the express purpose of helping them refine their thinking
about what they want” (personal communication, November 2012). Even in dating, people don’t
always know what they desire in a potential partner, even though they usually think they do
(Finkel et al 2012). People often lack insight into what they desire in a potential mate, and
therefore the characteristics they seek out in an online profile may differ from those that will
create a connection in person.
In all three of these search processes (real estate search, college decisions, and online
dating) as people search and evaluate different options, they not only discover the evaluated
product’s attributes, but they also become aware of their own preferences. Additionally, in all
three settings, at relatively little cost, consumers can find information on product attributes
4
without actually experiencing the product. They search for products that they believe meet their
preferences and then go evaluate those products in person; which products they evaluate will
influence how their preferences will shift. The phenomenon on which we focus is building
preference awareness: consumers realize the correct importance weight of the evaluated
product’s features.
We study the impact of this two-way relationship between preferences and evaluated
products on the search process. We abstract away from other complexities that happen in real-
world markets to isolate preference awareness. For example, home buyers have to take into
account that houses can go on and off the market, the details of the transaction involve
negotiation, and the decision is often a group (e.g., family) effort in which the group members
may each have different preferences. Dating is a two-sided market in which participants have to
account for the possibility that the other person will not be interested in them. Similarly, college
applicants have to consider their chances of being accepted to the colleges. Naturally, specific
applications within a category will require modeling additional phenomena, but changing utility
is a common theme in all of these applications.
In this paper, we study preference awareness as it relates to product search. We develop a
formal model of sequential search in which utility weights change as consumers become more
aware of their preferences. When consumers are initially unaware of their preferences, they may
make sub-optimal choices because they have not yet learned the correct objective function: they
do not find the optimal product because they are looking for something different. We begin with
analytical results for a simplified parameter space. Because the model is quite complex, and
capturing a large, representative parameter space is important to get an accurate understanding of
the process, we use simulations to demonstrate other properties of the model.
5
Because the results in the paper rely on the assumption that some consumers’ utilities
change during the course of search, we undertake a study to demonstrate that this phenomenon is
prevalent in at least one product category (apartment search). Respondents participated in an
online, incentive-compatible study that asked them to provide a description of their preferences
for a rental apartment in New York City, before and after evaluating 12 apartments. We see that
about a third of respondents opted to write a substantive revision of their preferences after
looking at apartments. The most commonly revised attributes were location, amount of natural
light in the apartment, and having a gym in the building.
We demonstrate that consumers who exhibit this behavior can be better off with noisy,
rather than accurate, information about the available products. The intuition for this result is that
consumers who do not have knowledge of product attributes are likely to search more broadly,
which will, in turn, help them clarify their preferences, perhaps discovering some important
attributes of which they were previously unaware. Incomplete preference awareness is one
explanation for the growth of websites such as Minidates.com and CoffeeMeetsBagel.com,
which offer blind dating service. Daters get only minimal information about each other before
meeting in person. The idea is to encourage real-life interaction, instead of browsing through
many online profiles trying to find the optimal option. Our results suggest that one explanation
for the success of this low-information approach in the dating context is that many consumers are
not at all sure what they are looking for.
We account for the fact that consumers may not have perfect knowledge of individual
product attributes. Whereas some attribute values, such as a car’s fuel efficiency or the presence
of a balcony, can be accurately determined from the online product description, other attributes,
such as the condition of an apartment, the quality of the view, or a vehicle’s maneuverability can

6
only be determined with certainty by evaluating the product in person. The online description
may say “ocean view”, but the consumer cannot be fully certain of the exact quality of the view
without evaluating it. This attribute uncertainty is well established in the economics literature on
search. Product evaluation typically involves some cost to the consumer, which accounts for time
spent, travel costs, and so forth. We will refer to this cost as search cost1. Thus, through online
search, the consumer obtains a belief distribution on all available product attributes, with varying
degrees of uncertainty. Lower uncertainty corresponds to more accurate online attribute
descriptions, and vice versa. Consumers who know exactly what they want strictly benefit from
accurate product information, because it allows them to save on search costs: if they had perfect
information on the products, they would simply be able to take their utility-maximizing product
right away, and stop. This relationship is consistent with the success of online information
systems, such as Edmunds.com for cars, MLS for real estate, and match.com and eHarmony for
dating. As the CEO of CNET expressed in a press release, “standardized, detailed product
information is the power behind commerce”. We explore how consumers search if they are both
unaware of their preferences and have noisy information on products (to varying degrees), and
find that for preference-unaware consumers, having noisy attribute information is actually
optimal.
We also find that product recommendations affect preference-unaware consumers
differently than those consumers who know what they want. Sometimes, during the course of
search, consumers get external product recommendations, which may come from online
recommendation systems, such as Netflix or Amazon, salespeople, or friends. If consumer
preferences are fixed, the role of recommendations is simply to bring the product to the
1 We assume that the cost of obtaining product information online is negligible. The only search that results in
search cost is evaluating products in person.

7
consumer’s attention, thus saving the consumer time (search costs). If the product turns out to be
desirable, the consumer may purchase it; if not, the consumer just lost the lost search cost.
However, if the consumer is not fully preference aware, , a product recommendation can impact
the future search path by helping the consumer clarify his preferences on some key attributes that
will shift his future search to a better part of the product space. Even products that do not end up
getting purchased may prove to be good recommendations.
In this paper, we distinguish between two types of learning that occurs during search: (1)
learning about one’s preferences for product attributes, and (2) learning about the attribute values
of products available in the market. After reviewing the relevant literature in the next section, we
describe the lab study and in-depth interviews with real estate agents that ground our model of
the consumer search process in section 3. We then develop a formal model of product search
based on learned preferences in section 4 and present results in section 5. We close the paper in
section 6 by reviewing the results and suggesting future research directions.
Literature Review
The research in this paper builds on results in two literatures: consumer search and
constructed preferences. Both of these literatures are extensive. In this section, we review the
findings that are most relevant to the model developed in this paper.
Consumer Search
Marketing scholars have long recognized that consumers invest substantial time
searching prior to making a purchase, particularly in expensive durable goods categories.
Consumers engage in sequential search and the problem becomes an optimal stopping problem;
8
consumers continue searching only if the expected gain from searching outweighs the costs. This
formulation is a variant of the well-known “secretary problem,” first posed in Gilbert and
Mosteller (1966) and since extended and generalized in many different directions (for a review,
see Ferguson 1981). Early research focused on consumer search for products that differ on a
single vertical dimension (e.g., Stigler 1961, Weitzman 1979). Additionally, researchers have
used bandit-like models (e.g., Erdem and Keane 1996, Rothchild 1974), in which forward-
looking consumers trade off consumption with search for information, as they learn about the
distribution of product quality in the market, usually with application to frequently purchased
goods. More recent models (e.g., Adam 2001, Hauser, Urban, and Weinberg 1993; Kim,
Albuquerque and Bronnenberg 2010; Moorthy, Ratchford and Talukdar 1995) explore search on
horizontally differentiated products with multiple attributes. Consumers have a utility, or
objective, function, which they seek to maximize.
The literature has focused on consumers learning attribute values, and the problem of
learning the distribution of prices of alternatives, but assumes the parameters of the objective
function remain constant. This paper adapts the widely used standard sequential search and linear
additive utility assumptions but differs from the extant literature by allowing the search objective
to change depending on the products the consumer sees while searching.
Constructed Preferences
The proposed theory is based on three ideas that are established in the consumer behavior
literature. (1) The purchase decision rule is adaptive and learned. Rather than starting out with
well-articulated preferences, consumers form their preferences as they search and evaluate
products (e.g., Bettman, Luce, and Payne 1998, 2008; Feldman and Lynch 1988; Haubl, Dellaert
and Donkers 2010, Liechty, Fong, DeSarbo 2010; Payne, Bettman, and Johnson 1988, 1992;
9
Slovic, Griffin, and Tversky 1990; Ülkümen, Chakravarti, and Morwitz 2010). (2) Tasks that
force consumers to think deeply about their own preferences cause consumers to change their
preferences (Hauser, Dong, and Ding 2011; Huber et al 1993; Nordgren and Dijksterhuis 2008).
Articulated preferences change after self-reflection is induced. (3) As consumers learn and
evolve from novice to expert consumers (for the category), their preferences change and
eventually stabilize (Alba and Hutchinson 1987, 2000; Betsch et al. 2001; Brucks 1985). The
model used in this paper assumes the consumer is discovering his or her preferences, and that,
eventually, preferences converge toward a steady state. In addition to shifting attribute weights,
the model allows consumers to learn that attributes they did not previously consider are relevant.
Empirical Verification
The focus of our analysis is on changing utility during the course of search. Although we
expect this change occurs, in this section, we also provide evidence that the phenomenon is real
and substantial (in a lab study), and that agents who facilitate search are aware of the
phenomenon, and adjust their actions accordingly. First, we conducted a lab study that measures
subjects’ preferences for apartments before and after evaluating 12 example apartments. We see
a substantial change in preferences for 53% of subjects. Second, we conducted interviews with
real estate agents, and include relevant quotes. We chose to focus on real estate in these data, but
we expect the phenomenon generalizes to other categories (e.g., college search, choice of a
nanny for a young child, the search for one’s first automobile).
Apartment Study
We conducted a laboratory experiment to test whether subjects change their mind about
what they are looking for in an apartment after evaluating several example apartments. We chose

10
to focus on the market in and around New York City. This market exemplifies the setting we are
trying to capture: it contains a large variety of apartments, with many attributes, and many of
these attributes are ones the renter may not be initially considering. Subjects were screened for
being in the market for a rental apartment in New York City in the next year and received $10 in
cash for completing the study, which took about 30 minutes. We also selected one finalist to
receive an additional $100 in cash (for sure) and a 0.5% chance2 to win free rent for a year,
worth $20,000 (using prize indemnity insurance).
To measure preferences before and after evaluating the apartments, we need a non-
intrusive preference elicitation method. Most state-of-the-art preference-elicitation techniques
involve consumers evaluating products, which would interfere with our measurement of the
impact of product evaluation on preferences. Therefore, we measure preferences (before and
after evaluating the example apartments) using an unstructured direct elicitation (UDE) method,
which closely mimicked that of Ding et al. (2010). The apartment for which they would win free
rent if they won would be determined by the description they wrote in the study, which provides
incentive compatibility for the subjects to write an accurate description of their preferences. The
subjects were told two independent judges would read their descriptions and then choose an
apartment for them from a secret list (to avoid instructions being too specific, because the exact
apartment they wanted might not be on the secret list). If the rent for the apartment chosen for
them was less than $20,000, they would receive the rest in cash. The judges’ decisions would be
audited; if the two judges did not agree on which apartment would best fit the subject’s
preferences, a third judge would choose between their two selections.
2 An envelope drawing determined whether the finalist would receive the free rent: s/he would randomly
select 2 of 20 envelopes; if both envelopes contained a winning card, the finalist received the $20,000
prize
11
The study consisted of four main parts: (1) instructions and background information, (2)
preference elicitation task, (3) evaluation of several example apartments, and (4) option to revise
preference description.
Instructions. Subjects were first given the instructions for the task, specifically the rules
for winning free rent. The subjects also received these instructions verbally, to help ensure they
understood the task and the incentives. They were then asked several questions measuring how
far along they were in the apartment search. These questions asked about activities related to
apartment hunting in which the participants had previously engaged, such as going apartment
hunting, speaking to a real estate agent about renting an apartment, looking at listings online, and
so on.
Preference elicitation task. Subjects were then asked to write a description of their
preferences, in the form of an email: “Provide instructions to Dan and Emily who have been
hired to select an apartment for you if you win the lottery. They do not know anything about this
study, and will only read your instructions.” Subjects were also given suggestions about their
instructions, such as “State as many instructions as possible, so that the agents have the best
information of your preferences”. When they were done, they clicked “Submit my email”.
Evaluation of several example apartments. Subjects were shown 12 apartment
descriptions, one per page, which were actual apartment listings from Craigslist. They included
verbal descriptions and images. We identified the following list of feature levels through
discussions with potential respondents (university students and staff) and browsing through local
apartment listings:
Location: Brooklyn (Park Slope, Prospect Heights, Williamsburg), Manhattan (Upper
East Side, Kips Bay, Murray Hill, Gramercy Park, Chelsea, Hell’s Kitchen, Greenwich

12
Village, East Village, West Village, Union Square, SoHo, Tribeca), New Jersey (Jersey
City, Hoboken)
Laundry: In unit, in building, not in building (Laundromat)
Number of bedrooms: studio, 1, 2, 3
Elevator: yes and no
Floor: 1–5 (in no-elevator buildings)
Condition: poor, good, fancy
Commute to campus: walk, subway direct, subway transfer
Closet space: yes and no
Size of bedroom: fits full bed, fits queen bed, fits bed and desk
Amount of natural light: low, high
Kitchen: minimal, separate, fancy
Floors: hardwood, carpet
Doorman: yes and no
Price (per roommate)3: $800 - $1750
Outdoor space: none, balcony, roof deck, patio
We selected the apartments to span most of the set of available attributes. The set of
apartments is not an experimental design. Instead, we used real listings to make the setting as
realistic as possible to serve as a manipulation.
Subjects were asked to provide a rating of each apartment on a 5-point scale and had the
option of also providing “one or two reasons for [their] rating,” in order to get them to think
about the apartments carefully.
3 For example, if the judge selected a three bedroom apartment, they would receive a third of the rent, plus cash.
13
Preference revision task. After evaluating the apartments, subjects had the option to
revise their preference description. They were shown their original letter and were asked “Is
there anything about your response that could be improved to help the agent make a better
decision on your behalf?” They could select “YES, I would like to update these instruction to
better reflect my preferences,” or “NO, these instructions are accurate and complete”. If they
chose to revise, they could submit their revision as additional information, in which case the
judge would see both the original and new letter, or a new set of instructions.
This part of the experiment is essential to our study, because it allows us to measure
changes to the utility function in response to evaluating products. It is challenging in a lab
setting, because respondents had to opt in to write the extra revision, and many respondents are
unlikely to opt in to do extra work. The chance of winning the free-rent prize helps incentivize
the subjects to provide as accurate a description of their preferences as possible, enough that they
opted in to the revision. Additionally, because respondents were not told at the beginning that
they would have a chance to write a revision, the incentive of winning free rent ensured that they
think carefully when they wrote the first letter, to help us rule out alternative explanations for the
revision.
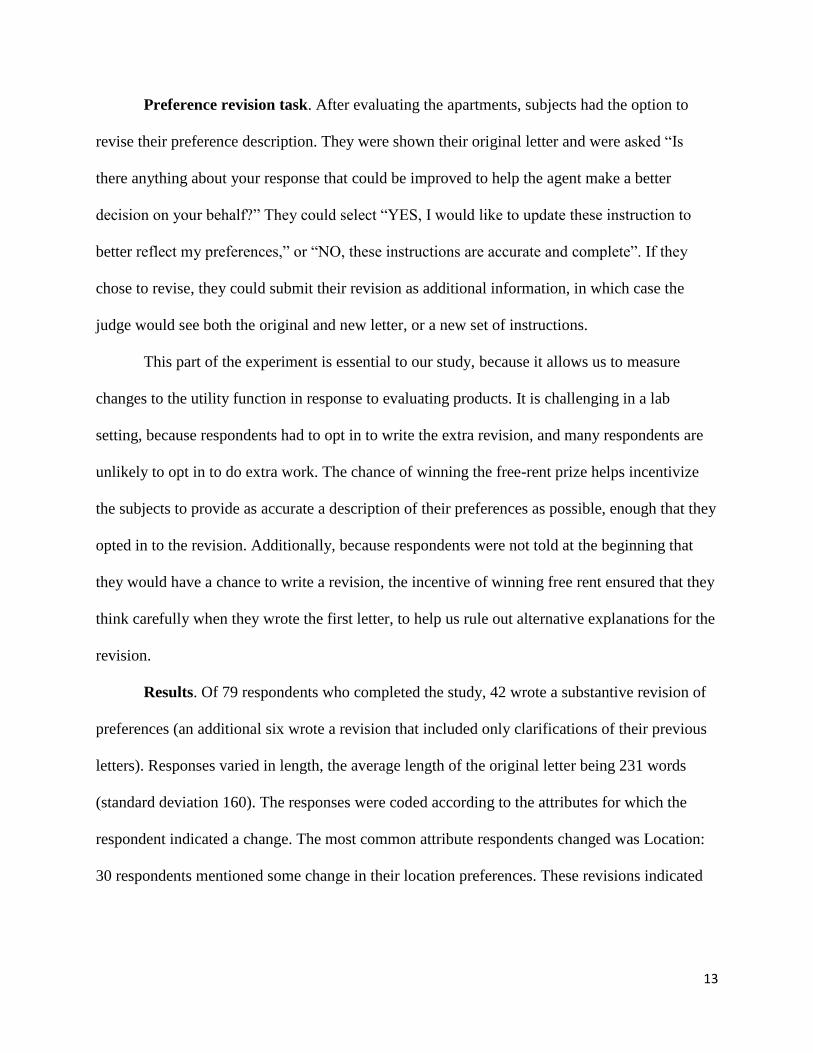
Results. Of 79 respondents who completed the study, 42 wrote a substantive revision of
preferences (an additional six wrote a revision that included only clarifications of their previous
letters). Responses varied in length, the average length of the original letter being 231 words
(standard deviation 160). The responses were coded according to the attributes for which the
respondent indicated a change. The most common attribute respondents changed was Location:
30 respondents mentioned some change in their location preferences. These revisions indicated

14
increases and decreases in the preference for certain areas. Below are some examples of
preference revisions that we coded as location:
Original Revision
“within a 15-20 minute walk to the NYU
campus”
“We would also greatly consider Brooklyn -
preferably Williamsburg - but these apartments
would have to be under $1100 each and would
need to be close to a subway line that would
take us to campus.”
“I am looking to live in the Union Square area,
but have also thought about living in Astoria. I
have decided I'd like either a small studio in
Manhattan, or a one/two bedroom in Astoria”
“I would consider living in Brooklyn, possible
in Williamsburg or close to the L train.”
“Areas that I am interested in are West and
East Village, St. Marks, 14th St., Soho,
Chinatown, or any other areas within a 15min
walking distance from NYU. I would also
consider any apartments available uptown that
are close to trains”
Areas that I am interested in are West and East
Village, St. Marks, 14th St., Soho, Chinatown,
or any other areas within a 15min walking
distance from NYU. I would also consider any
apartments available uptown that are close to
trains. Additionally, I would extend my
location preferences around the city preferably
only NYC and not NJ if there are places in
great neighborhoods with a great price and
large room. I would actually prefer Brooklyn
or Queens if there is a larger place and better
neighborhood than Manhattan.
“We prefer the Upper West Side, Chelsea, or
the West Village.”
“We prefer the Upper West Side between
Columbus Ave and Central Park West,
Chelsea, or the West Village. We will consider
other neighborhoods, but only in Manhattan.
We will not consider any apartments outside of
Manhattan.”

15
Appendix 1 contains examples of quotes for other attributes . Figure 1 presents, for each
attribute, the number of subjects that indicated a change in utility for some of the levels of that
attribute. The most common attribute to change is Location, followed by Kitchen, Laundry, and
Number of Roommates. A few subjects also included hardwood floors, windows/the amount of
natural light in the apartment, gym, loft-like setup, and so on.
[Figure 1 about here]
The results of this experiment provide evidence for the process we capture in our model:
when consumers evaluate products, they become aware of attributes, such as hardwood floors or
natural light, or attribute levels (Upper East Side) that are valuable to them but that they did not
consider previously, the corresponding utility weights are adjusted. The study helps support our
assumption that product evaluation facilitates learning about the importance of some attributes,
and not only learning about the distribution of attributes.
We should note this method of measuring the effect of product evaluation on preferences
is conservative for several reasons. First, respondents were not told they would have the option
to write a revision, and were led to believe the letter they wrote in the first part would determine
their prize, should they win. In most real-world settings, consumers implicitly know they can
change their mind later. As a result, respondents in our study made a stronger effort to write a
complete description than they would have in a real search setting. Second, writing the letter
leads to a lot of introspection: by forcing people to write their preferences down, we caused
respondents to think harder about their preferences than they might have otherwise, before
starting to search and evaluate products. Third, it is a lab study, and respondents had to opt in to

16
extra work to write a revision. Therefore, we can expect the change we see in this study is
smaller than what might happen in a real-world search setting.
Grounding the Theory Using Interviews with Realtors
We also conducted in-depth interviews with realtors in a densely populated residential
neighborhood in a large US city, in which we asked them what the challenge is behind helping
customers find an apartment, given that the realtor knows (or can easily find out) the attributes of
available apartments on the market. We chose a market to help isolate the effect of constructed
preferences from other factors that impact search, especially misaligned sales agent incentives.
Although realtor incentives are not completely aligned with the buyers, they are more aligned
than in most other direct sales settings. In many categories, such as automobiles, sales people
represent a specific manufacturer, so they are interested in convincing customers to purchase that
manufacturer’s product. Additionally, in the chosen real estate market, realty offices are located
close to each other, with at least 15 of the offices (with multiple agents) along a quarter-mile
stretch of a single street. In such a competitive environment, realtors are aware of the possibility
of losing clients to each other and of the effects of negative word of mouth (WOM). Realtors in
such an environment report they are more likely to be concerned about helping the consumer
search rather than trying to maximize short-term commissions or the magnitude of the
commission from any given consumer.
Two key insights arise from the interviews: (1) realtors are aware consumers’
preferences change during the search process, and account for it when choosing which homes to
show; and (2) realtors are aware expert consumers have more stable preferences than novice
consumers. Below are several illustrative quotes from the interviews:

17
- “Often what people start out thinking they want is not what they end up wanting.”
- “Let's say they tell you they want three things, like renovated kitchen, pet friendly,
and up to $2500. I find them something that has those 3. Then they get there and tell
me they hate the view and won't take it because of that.”
- “People may not think about what common areas look like, but once they actually go
out and see it, they realize that they will be affected by it.”
- “Let’s say someone is looking for a 1 bedroom with a good layout. I show them one,
and then I walk in the bedroom and open up a French door to a private deck. They
love that, and want me to look for more apartments with a deck.”
- “It does happen, not very often, that they see just one [apartment] and take it. Usually
with people who have been living (in this neighborhood) for a long time and know the
area and know exactly what they want.”
These exploratory data provide qualitative support for the theory and suggest changing
preferences play an important role in the consumer search process. Note that in these examples
the preference change comes as a surprise: before they were exposed to it, the consumers had not
even considered the attribute played a role in preference. Our model captures this distinction
between unawareness and uncertainty.
Model Setup
Products. We study situations in which product attributes are described by finitely many levels.
To illustrate the notation, we follow Kohli and Mahajan (1991). Let index available
products, index product attributes (e.g. rent, commute to campus, condition of
apartment), and index (discrete) attribute levels, where is the number of levels of
attribute . For example, if attribute 1 is “condition of apartment,” it has five levels if the
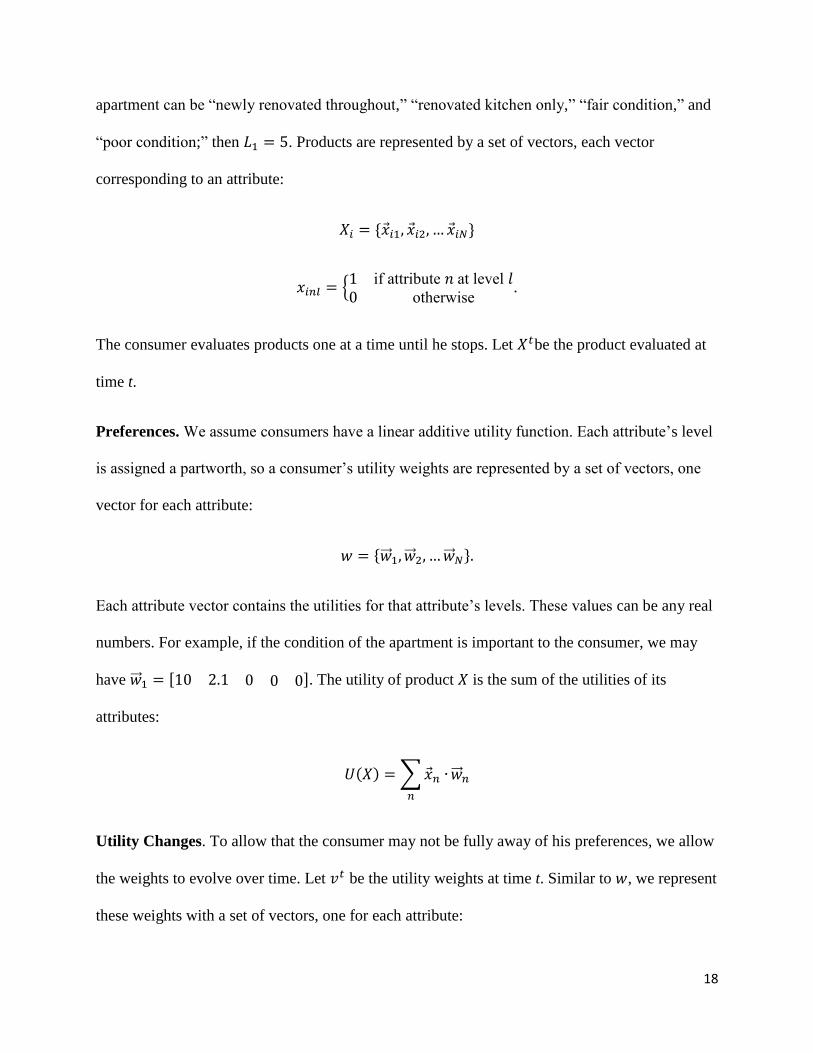
18
apartment can be “newly renovated throughout,” “renovated kitchen only,” “fair condition,” and
“poor condition;” then . Products are represented by a set of vectors, each vector
corresponding to an attribute:
{ if attribute at level otherwise
.
The consumer evaluates products one at a time until he stops. Let be the product evaluated at
time t.
Preferences. We assume consumers have a linear additive utility function. Each attribute’s level
is assigned a partworth, so a consumer’s utility weights are represented by a set of vectors, one
vector for each attribute:
Each attribute vector contains the utilities for that attribute’s levels. These values can be any real
numbers. For example, if the condition of the apartment is important to the consumer, we may
have [ ]. The utility of product is the sum of the utilities of its
attributes:
( ) ∑
Utility Changes. To allow that the consumer may not be fully away of his preferences, we allow
the weights to evolve over time. Let be the utility weights at time t. Similar to , we represent
these weights with a set of vectors, one for each attribute:

19
The consumer starts with an initial set of weights, , which may be different from . At time t,
after seeing product , the consumers learns the correct weights for that product’s features, or:
{
( )
For example, if a consumer visits an apartment that has a playground next to the building,
that attribute’s weight may go up to its true value, and stay at the value for the rest of the search
process. That is, we assume the true weights are revealed immediately, and remembered
permanently. This assumption is obviously a simplification: more generally, a consumer may
need to evaluate feature more than once in order to understand its true importance. We justify it
here by our desire to focus on the role of the change in utility weights, and we try to capture that
phenomenon with as few parameters as possible. The model can be extended to account for a
more gradual change, or a more complicated process. We do not expect the essence of the
results to change if these mechanisms were incorporated, but we leave that analysis to future
research.
The phenomenon we are capturing is that the consumer is initially unaware of the
feature’s true importance weight, because he has not yet been exposed to it. Contrasting being
unaware with being uncertain about a weight is important. For example, a consumer may be
aware of convertible cars, but uncertain whether he actually wants one. Then the consumer can
actively seek out information (e.g. test drive convertibles or read reviews) to help him determine
the weight. In our case, the consumer fails to introspect and therefore does not have the product
feature in mind; once he is forced to introspect, by evaluating a product with the feature, he
20
understands whether it is truly important. This distinction was formalized in behavioral
economics (Modica and Rustichini 1993, 1999; Geanakoplos 1989, Rubinstein and Wolinsky
1990; Samet 1990), psychology (Bargh 1989, 1994, 1996; Shiffrin and Schneider 1977; Nisbett
and Wilson 1977), and artificial intelligence (Fagin and Halpern 1988). Unawareness is an aspect
of bounded rationality that has important economic implications. In our case, it allows for some
features to be discovered serendipitously, and is key to understanding the role of product
evaluation to consumer search.
Uncertainty on product attributes. Following the literature on sequential search (see, e.g.
Moorthy, Ratchford, and Talukdar 1997), we assume the consumer has noisy information about
the values of the available products’ attributes. His knowledge of the products’ attribute values is
captured by a belief distribution.4 Because the attribute values are discrete, we model the belief
distribution as multinomial distribution with parameters for each attribute:
, where
{ }
( ), such that
∑
For example, [ ] if the consumer is 90% sure apartment 1 is
in fair condition. The accuracy with which the consumer can observe product attribute
information without evaluating the actual product determines the variance of the belief
4 Note that this is NOT a learning model in which consumers learn about the distribution of product quality.
21
distribution . If the available product information on a certain attribute were perfectly
accurate, would have a point mass corresponding to the correct attribute level and 0’s
corresponding to the other levels, or for all n.
When a product is evaluated, its attribute levels are revealed, so if the consumer has
evaluated product i, then for all n. The cost of evaluating a product is c, which
accounts for time spent, travel costs, and so on. We do not model the consumers learning about
the distribution of product quality; rather, we assume that when a consumer evaluates a product,
he learns about that product’s attribute values only. His beliefs about other products’ attributes
do not change.
Note the consumer does not update his beliefs about other products’ attributes, but only
resolves his uncertainty about the evaluated product, as in Weitzman (1979), and Moorthy,
Ratchford, and Talukdar (1997). That is, he is not learning about the distribution of available
products, as in Erdem and Keane (1996) and Adam (2001), which would require solving a bandit
problem.
Let be the set of indexes of products that have been evaluated up to time t.
Outside good. The consumer has access to an outside good, with constant utility B, that is
known to the consumer.5 The higher the value of B, the higher the probability that the buyer will
choose the outside good. Buyers who are set on purchasing something have a low B, whereas
those who are flexible have a high B.
5 In the case of real estate, the outside good may represent, for example, staying at the current
place of residence.
22
Search Process
Our model of search is similar to the classic model in Weitzman 1979, except that (1)
products have multiple attributes (rather than a single “quality” attribute), and (2) the weights of
those attributes are discovered during the search process. The consumer iterates through the
following steps:
Step 1 (Selection Rule): Identify the product to evaluate next.
Step 2 (Stopping Rule): If evaluating the product in Step 2 leads to a net expected increase in
utility that exceeds search cost, evaluate the product and go to Step 3. Otherwise, stop.
Step 3 (Update Preferences): Update preferences based on the last evaluated product. Return
to step 1.
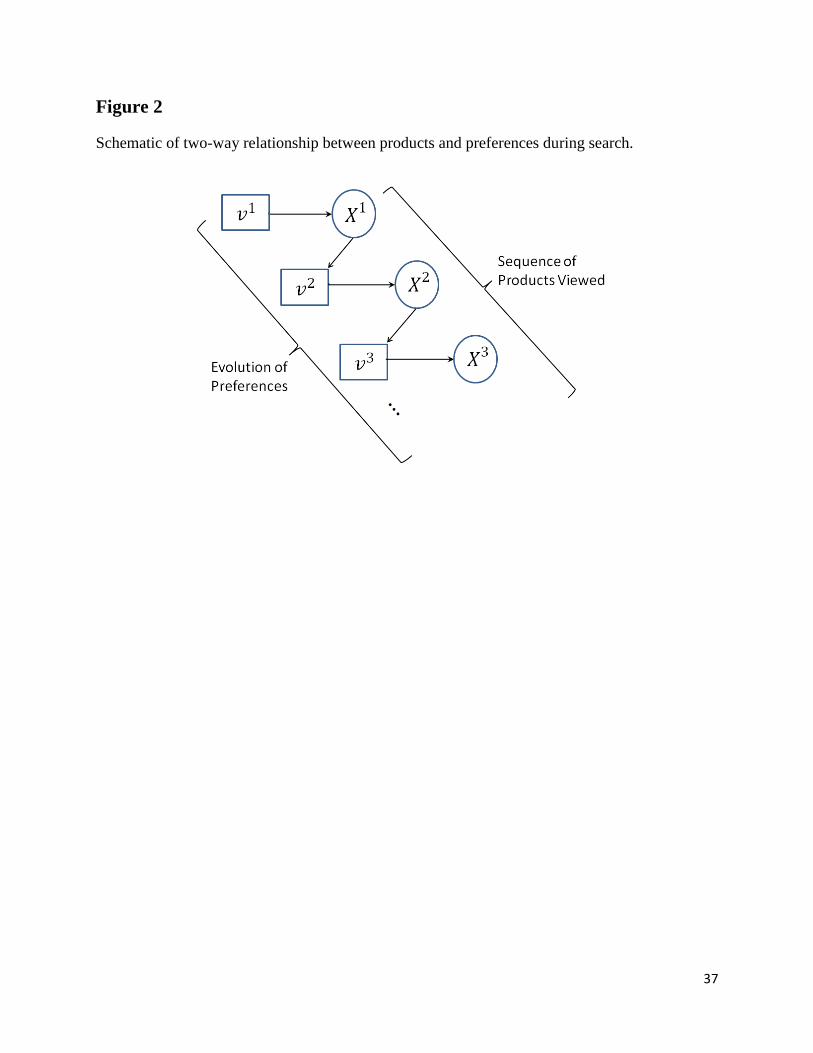
Figure 2 offers a graphical representation of the two-way relationship between preferences and
products. Current beliefs about preferences determine which product gets evaluated in each
period, and the evaluated product affects how the preferences get updated. We now address each
step in detail.
[Figure 2 about here]
Step 1: Select product to evaluate. Based on the current weights, and his beliefs about
the product attributes, the consumer decides what product to search, if any, in the next time
period. This problem is similar to the classic search problem proposed by Weitzman 1979. We
require further notation to describe the solution.
Let be the set of products the consumer has seen up to time t, and let be its
complement (set of products not yet seen up to time t). Let be the utility of the best option
seen so far, which might be the outside good:
( )

23
Note that because the consumer has learned his preferences for the products he has evaluated,
these utilities are computed using the true utility weights, w. If the consumer chooses to evaluate
another product, he will have to pay search cost c. If the product turns out to have utility lower
than , the consumer will simply not choose that product. If it turns out to have utility higher
than , the consumer will choose it and thus gain the difference in utility minus the search cost.
The resulting Bellman equation is
( ) {
{ ( ( )) ∫ ( )
∫ ( ( ) ( )
}}
The optimal policy has the form of a reservation price (see Weitzman 1979 for details). The
reservation price for product i at time t is , which satisfies:
∫ ( ) ( )
Note utility is computed according to , not the true weights w, which have yet to be
revealed. A key assumption here is that the consumer does not anticipate the weights will change
(see model and discussion of utility-changing model on Page 19). The consumer does not
optimize over future learning of preferences, because he does not know what he does not know.
The consumer selects the product with the highest reservation price, .
Step 2: (Stopping and choice rule). The condition for evaluating a new alternative is:
. If this is not met, he stops, and purchases
( ).
24
Step 3: Update preferences. If the search did not terminate in Step 3, the consumer
evaluates the selected product and learns (1) its correct attribute values, and (2) his true
importance weight of that product’s attribute levels. After viewing product at time t, the
consumer learns the true weights of ’s attribute levels. The updated utility weights at time t+1
are:
{
if ( )
otherwise
For all attributes . With the new , the consumer returns to Step 1.
Effect of Improved Product Information
In many search settings, the underlying assumption is that by providing the most detailed and
accurate product information possible, one can help consumers make better and faster decisions.
If preferences are static and known to the consumer at the start of search, this intuition is correct:
the consumer is strictly better off with more accurate product information available to him. We
show, however, this intuition not always true if the consumer is initially unaware of his
preferences. Then the consumer may be better off with noisy signals about the products. We first
demonstrate this result analytically, in a stylized model. We then present results of Monte Carlo
simulations that allow us to better understand how the search process works by using a large,
representative parameter space of consumer preferences and knowledge of the available
products.
Analytical Results
We begin by studying the model with a small parameter space to derive some analytical results.
Later, we will fully explore the parameter space using simulations.

25
Suppose only one binary attribute and two possible products exist:
[ ]
[ ]
The consumer’s initial preferences are: [
], and the correct preferences are
[ ].
Assume, WLOG, and the outside good has value 0, so that .
Suppose further that the consumer can be uncertain about the products’ attributes. Note the two
available products remain the same, but the consumer gets only a noisy signal of their attributes.
His belief about product 1 is [ ]; his belief about product 2 is [ ]. Thus he
believes
{[ ] with probability
[ ] with probability
{[ ] with probability
[ ] with probability
If and , the consumer has perfect knowledge of the products’ attributes.
Proposition 1: A consumer who knows his preferences from the start, that is, , is best off
when he also knows the correct product attributes without any uncertainty, that is, and
.
Proof: See appendix 2.
This result is fairly intuitive: if the consumer knows what he is looking for, and has access to all
product information, he may simply pick the best product. We will now show this relationship
not necessarily true if the consumer’s initial preferences are incorrect.
26
Proposition 2: If , the consumer may be better off with noisy information about product
attributes, that is, and/or , than with perfect knowledge of product attributes
without uncertainty.
Proof: See appendix 2.
If the consumer initially places incorrect weights on some product attributes, but is able to get
accurate information on the available products, he is likely to simply take what he thinks is the
best product (i.e., the product that maximizes his initial utility function), and stop there, possibly
ignoring some products he would actually like more. If he cannot observe product attributes
accurately, that uncertainty will motivate him to search more broadly; by evaluating a broader
variety of products, he will clarify his preferences and is more likely to arrive at the best product
for himself.
For the purposes of deriving analytical results, we kept the parameter space small. We can get a
much richer picture if we allow for a more complex setup with a multidimensional product space
with many attribute levels. We perform this analysis using Monte Carlo simulation
Simulation Experiments
Product attributes. We used a product space with four attributes, four levels each. First,
we generate a full factorial design of all 256 possible combinations. To account for the fact that
in most real markets, some aspects are anti-correlated (e.g., homes in a certain neighborhood are
old, cars with large engines have low fuel efficiency, Porsche does not make pickup trucks, etc.)
we create a matrix, C, that acts as an “anti-correlation” matrix. For each pair of aspects (i, j), a
product that contains both attributes does not exist (gets deleted from the full factorial matrix).
27
Thus the probability that a given product gets deleted is the product of C(i, j) for all pairs of
aspects in it. C is a symmetric matrix, with values drawn from Beta(0.1, 0.8). This distribution is
U-shaped, meaning most pairs of attributes are unlikely to lead to deletion, but some pairs lead to
deletion with high probability.
Available information of product attributes. Consumers do not accurately observe the
products’ attribute levels, but rather form a belief distribution about them. Consumers’ belief
about the level of attribute n of product i is a multinomial distribution, whose parameters drawn
from a Dirichlet:
( )
The parameters were set as follows:
{
The parameter allows us to control how accurately the consumer observes product
attributes. Setting to 1 corresponds to high noise, since the will form something close
to a uniform distribution over the attribute values. That means the consumer cannot discern that
attribute’s level. If is set to a large value, the sampled will likely assign a high (close to
1) probability to the correct attribute level, and low (close to 0) probability to the other levels of
that attribute. Figures 3a and 3b show representative belief distributions for high and low noise
conditions, respectively.
[Figure 3 around here]
Consumer Preferences. For each of 500 simulated consumers, we draw partworths of
the true attribute weights as i.i.d. standard normal random variables:
( )
28
We generate the initial utilities at time 1 in two different ways. First, to represent the consumer
simply failing to consider certain attributes, we set the initial weights of all the levels of some
attributes to 0. Second, to represent the more general case of the weights starting at any value, we
generate the initial and correct weights together, from a bivariate normal:
(
) ((
) (
))
We set the mean of both variables to 0 so that the initial weights are not biased systematically
from the correct weights. The parameter allows us to control the degree to which initial
weights differ from correct weights. Setting results in perfect correlation, and corresponds
to the consumer having exact knowledge of his preferences; setting corresponds to
completely uncorrelated weights, resulting in a big change in weights during the course of
search.
First, let us examine the case in which consumers know their preferences from the start,
namely, , and we make the information on products noisier. We control the noise using
the parameter, varying it on a logscale between 1 and 150. We run the simulations for
. Figure 4 shows that as noise increases ( decreases),
consumers search longer (Figure 4a) and the average payoff strictly decreases (Figure 4b). Table
1 shows the same data in table form. The error bars are displayed in black. This behavior is what
we expect to find: when noise is low, consumers are able to select the utility maximizing product
at time 1 and terminate search. As we increase noise, they have to search longer, and may stop
before finding the utility maximizing product, so the net payoff decreases.
[Figure 4 about here]
[Table 1 about here]

29
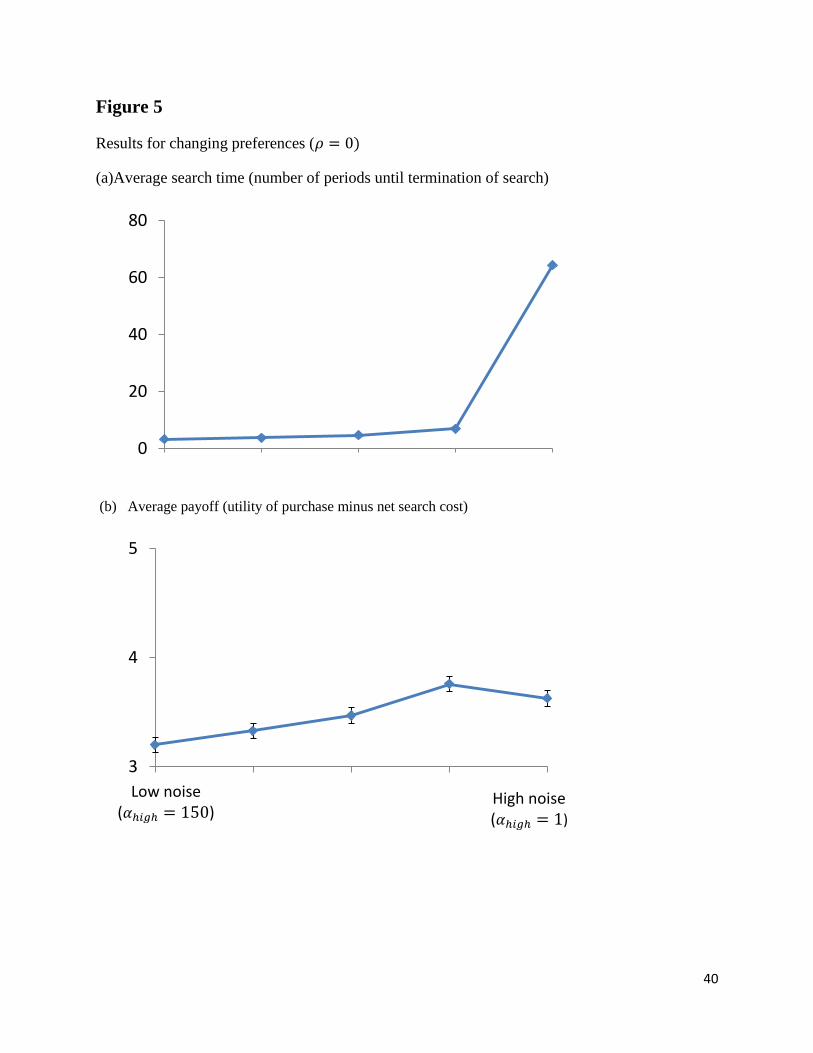
Now, let us see what happens when preferences are initially off, and get revealed during
search. Figure 5 shows similar plots as Figure 4, but for . Consumers still search longer
with higher noise (Figure 5a), but the average payoff actually increases up to a certain level of
noise ( ). This type of consumer is better off with some level of noise, than with
perfect attribute knowledge. Their search time increases, and as they evaluate more apartments,
they are able to find something better than what they found in the no-noise condition. Figure 6
plots the payoffs for three values of (0, 0.7, 1) on the same plot. Interestingly, in the very high
noise condition ( ) all three types of consumers get approximately the same payoff,
because they search for so long (>60 periods) that even the consumers who started off unaware
of their preferences (blue line) have learned their preferences by the time they have evaluated
that many products.
Product Recommendations: The Value of Information
So far, we have studied the nature of search when consumers operate on their own:
decide what products are worth evaluating, when to stop, and what to purchase. Often when
consumers search, they get product recommendations from external sources, such as their
friends, sales people, or online product recommendations or promotions. Evaluating these
products can also lead to a revision of preferences if it exposes consumers to new attributes they
had not considered previously. If a recommendation exposes the consumer to a feature they had
not considered previously but turns out to be attractive, the consumer’s search objective may
shift and affect what he chooses to search in the future. This way, a recommendation may affect
the search outcome even if the consumer does not end up choosing the recommended product. In

30
fact, even an undesirable product may prove to be a useful recommendation if it exposes the
consumer to some new important features.
We focus on consumer-centric recommendation systems, whose purpose is to help the
customer search as efficiently as possible (e.g. Netflix, XM radio, or unbiased online advisors).
Most of the literature on recommendation systems is aimed at predicting what item(s) the
consumer will like best, and recommending those (see Adomavičius and Tuzhilin 2005 for a
review).
We now introduce product recommendations into our simulations as follows. For each
consumer, we initiate the search by recommending one product at time 1, and the consumer
evaluates it and updates his utility weights accordingly. The search then proceeds as before with
the consumer selecting what to evaluate, whether to terminate search or continue, and what to
purchase. The only change is that one product is inserted into the sequence at time 1. To select
the recommended product, we cycle through all products on the market one by one. For a single
product, we compute the final outcome of the search, were the consumer to evaluate that product
at time 1. This means we are computing the net long-term impact of the recommendations,
taking into account the impact on the consumer’s own future search. We then plot the utility of
the recommended product versus the net payoff for the consumer with that product as the
recommendation. For example, the data point in Figure 7a corresponds to a recommended
product whose utility is 3.9, but the net payoff from the search (utility of final choice minus
search costs) is 7.5. Figure 7b contains the same information for all the products in the market.
Figure 8 contains similar plots for 24 random users from the simulated set.
A few interesting patterns are worth noting here. First, the data form several horizontal
clusters. The points in a single cluster correspond to the consumer ultimately purchasing one

31
product, and the outcomes vary by the amount of time the consumer took to get there. Because
search cost is minimal in these experiments relative to the variability in product utility, the
payoffs differ by small amounts. The top cluster corresponds to the consumer choosing the best
available product. As we expect to see, if the top product is recommended it ultimately gets
chosen (rightmost point on the plot belongs to the top cluster). More generally, all the points fall
on or above the y=x diagonal, meaning the consumer cannot choose something worse than the
recommended product.
However, the clusters are sometimes long in the horizontal dimension, meaning that even
low utility products (far left) may result in high net payoff. This analysis captures the
phenomenon that the impact of a recommendation goes beyond simply bringing the
recommended product to the consumer’s attention, to actually impact future search.
Recommendations can impact the long-term search outcome even if the recommended product
itself is undesirable and does not end up being purchased.
At least in a context in which the cost of search is small relative to the variability in
product quality, which is the case in many infrequent important decisions, such as real estate,
child care, or education, we expect a relationship of this nature. Then an automated
recommendation system would benefit from the ability to anticipate preference shifts. Although
specific methods for such a system are beyond the scope of this paper, perhaps measurements of
the type we conduct in our lab experiments may be promising market research tools. Most
preference measurement marketing research tools, such as conjoint analysis or other
decompositional methods, are optimized for measuring a user’s revealed preferences, or the in
our model. If recommendation systems are to infer how preferences evolve during search
measuring the initial, not well thought-out preferences, or the in our model would be helpful.

32
As we demonstrate in our lab study, certain features are more prone than others to change in
response to evaluating products.
Conclusions and Future Research
We have demonstrated (1) that as consumers evaluate products, they understand better
what they are looking for, and (2) the implications of this phenomenon for the search process
itself, and for ways to impact the search process. We have demonstrated how dynamic
preferences can result in a long and suboptimal search process even when all product attributes
are easily searched, and how attribute uncertainty can interact with preference dynamics to lead
to better search outcomes. To the best of our knowledge, this paper is the first to formally model
dynamic preferences as they relate to consumer search. Behavioral researchers have studied
extensively the nature of preference construction. Practitioners are aware of the phenomenon and
agree it is important and relevant to their strategy. This study is a step toward formalizing the
process of preference evolution during the search process and exploring its implications.
33
References
Adomavičius, Gediminas and Alexander Tuzhilin (2005), “Towards the Next Generation of
Recommender Systems: A Survey of the State-of-the-Art and Possible Extensions,” IEEE
Transactions on Knowledge and Data Engineering, vol. 17, no. 6
Alba, Joseph W. and J. Wesley Hutchinson (1987), “Dimensions of Consumer Expertise,”
Journal of Consumer Research, 13 (March), 411-454
Ansari, Asim, Skander Essagier, and Rajeev Kohli (2000), “Internet Recommendation Systems,”
Journal of Marketing Research, 37(August), pp. 363-76
Betsch, T., Haberstroh, S., Glöckner, A., Haar, T., & Fiedler, K. (2001), “The effects of routine
strength on information acquisition and adaptation in recurrent decision making,” Organizational
Behavior and Human Decision Processes, 84, 23-53
Bodapati, Anand (2008), “Recommendation Systems with Purchase Data,” Journal of Marketing
Research, XLV, 77–93.
Branco, Fernando, Monic Sun, J. Miguel Villas-Boas (forthcoming), “Optimal Search for
Product Information,” Management Science, forthcoming
Brucks, Merrie (1985), "The Effects of Product Class Knowledge on Information Search
Behavior," Journal of Consumer Research, 12 (June), pp. 1-16
Chien, Yung-Hsin and Edward I. George (1999), “A Bayesian Model for Collaborative
Filtering,” Proceedings of the 7th International Workshop on Artificial Intelligence and Statistics
Ching, Andrew, Tulin Erdem and Michael P. Keane (2011), “Learning Models: An Assessment
of Progress, Challenges and New Developments,” Available at SSRN:
http://ssrn.com/abstract=1910839
Chu, Wujin, Eitan Gerstner and James D. Hess (1995) “Costs and Benefits of a Hard-Sell,”
Journal of Marketing Research, Vol. 32, No. 1 (Feb), pp. 97-102
Coughlan, Anne T. and Subrata K. Sen (1989) "Salesforce Compensation: Theory and
Managerial Implications," Marketing Science, vol. 8, no. 4 (Fall), pp. 324-342.
Culler, Leah L. “Forget A Dream Home – Aim For What’s Practical.” MSN Real Estate. 15 Mar
2012. <http://realestate.msn.com/forget-a-dream-home-aim-for-what-is-practical>
Feldman, Jack M. and John G. Lynch Jr. (1988), “Self-Generated Validity and Other Effects of
Measurement on Belief, Attitude, Intention, and Behavior,” Journal of Applied Psychology, 73
(3), 421–35
34
Ferguson Thomas S. (1989), “Who solved the secretary problem?” Statistical Science, Volume 4,
Number 3, pp 282–296.
Finkel, Eli J., Paul W. Eastwick, Benjamin R. Karney, Harry T. Reis, Susan Sprecher (2012),
“Online Dating: A critical Analysis from the Perspective of Psychological Science,”
Psychological Science in the Public Interest, 13 (January), 3-66
Guo, Liang and Juanjuan Zhang (2012), “Consumer Deliberation and Product Line Design,”
forthcoming, Marketing Science.
Haubl, Gerard, Benedict G.C. Deallert, and Bas Donkers (, “Tunnel Vision: Local Behavioral
Influences on Consumer Decisions in Product Search,” Marketing Science, Vol. 29, No 3 (May-
June), pp 438-455.
Hauser, John R., Glen L. Urban, and Bruce Weinberg (1993), "How Consumers Allocate their
Time When Searching for Information," Journal of Marketing Research,30, 4, (November), 452-
466.
Huber, Joel, Dick R. Wittink, John A. Fiedler and Richard Miller (1993), "The Effectiveness of
Alternative Elicitation Procedures in Predicting Choice," Journal of Marketing Research, 30,
(February), 105-114
Johnson, Eric J., Wendy W. Moe, Peter S. Fader, Steven Bellman, Gerald L. Lohse (2004), “On
the Depth and Dynamics of Online Search Behavior,” Management Science Vol. 50, No. 3,
March 2004, pp. 299–308
Kim, Jun B., Paulo Albuquerque, and Bart J. Bronnenberg (2010), "Online Demand under
Limited Consumer Search,” Marketing Science, Vol. 29, No. 6, November-December, pp. 1001-
1023.
Kohli, Rajiv, and Vijay Mahajan (1991), “A Reservation-Price Model for Optimal Pricing of
Multiattribute Products in Conjoint Analysis,” Journal of Marketing Research, 28 (August), 347-
354
Moorthy, Sridhar , Ratchford, Brian T. and Talukdar, Debabrata (1995), “Consumer Information
Search Revisited: Theory and Empirical Analysis,” Journal of Consumer Research, Vol. 23, No.
4, pp. 263-277.
Morwitz, Vicki, Eric J. Johnson and David Schmittlein (1993), “Does Measuring Intent Change
Behavior?” Journal of Consumer Research, Vol. 20, pp. 46-66.
Nordgren, Loran F. and Ap Dijksterhuis (2009), “The Devil Is in the Deliberation: Thinking Too
Much Reduces Preference Consistency”, Journal of Consumer Research Vol. 36, No. 1 (June
2009), pp. 39-46.

35
Richins, Marsha L. (1983), “Negative Word-of-Mouth by Dissatisfied Consumers: A Pilot
Study,” Journal of Marketing, Vol. 47, No. 1 (Winter), pp. 68-78.
Rothchild, Michael (1974), “Searching for the Lowest Price When the Distribution of Prices Is
Unknown,” Journal of Political Economy, Vol. 82, No. 4(Jul-Aug), pp. 689-711.
Sharma, Arun (1997), “Customer Satisfaction‐Based Incentive Systems: Some Managerial and
Salesperson Considerations,” Journal of Personal Selling and Sales Management, 17, 2 (Spring),
61‐70.
Slovic, P., Griffin,D., and Tversky, A. (1990), “Compatibility Effects in Judgment and Choice.”
In Hogarth, R. (ed.) Insights in Decision Making: Theory and Applications, Chicago: University
of Chicago Press.
Star, Steven (1989), "Marketing and Its Discontents,” Harvard Business Review (November-
December), 148 -54.
Ying, Yuanping, Fred Feinberg, Michel Wedel (2006), “Improving Online Product
Recommendations by Including Nonrated Items,” Journal of Marketing Research, 43 (August),
355-365
Rogers, Alison. “After You Read the Listings, Your Agent Reads You.” The New York Times [New York] 26
March, 2013: F4. Web. 19 July 2013.

36
Figure 1
Number of users who indicated a preference change on the attribute in their revision.
0 5 10 15 20 25 30
Supermarket nearby
Soundproof walls
Pre-War buildings
Outdoor space
Maintenance company
Exposed Brick
Central AC
Theater/Gym/pool
High Ceilings
Floor
Closets
Wood floors
Price
Condition
Light/Windows
Roommates
Laundry
Kitchen
Location
37
Figure 2
Schematic of two-way relationship between products and preferences during search.

38
Figure 3
Examples of consumer beliefs about a product’s attribute level in high noise (a) and low noise
(b) conditions.
a. High Noise: =1
b. Low Noise: =50
0
0.2
0.4
0.6
0.8
1
poor
condition
fair
condition
renovated
kitchen
fully
renovated
0
0.2
0.4
0.6
0.8
1
poor
condition
fair
condition
renovated
kitchen
fully
renovated

39
Figure 4
Results for static preferences ( )
(a) Average search time (number of periods until termination of search)
(b) Average payoff (utility of purchase minus net search cost)
0
20
40
60
80
1 2 3 4 5
3
4
5
1 2 3 4 5
Low noise (𝛼 )
High noise (𝛼 )
Low noise (𝛼 𝑖𝑔 )
High noise (𝛼 𝑖𝑔 )
40
Figure 5
Results for changing preferences ( )
(a)Average search time (number of periods until termination of search)
(b) Average payoff (utility of purchase minus net search cost)
0
20
40
60
80
1 2 3 4 5
3
4
5
1 2 3 4 5Low noise (𝛼 𝑖𝑔 )
High noise (𝛼 𝑖𝑔 )

41
Figure 6
3
4
5
1 2 3 4 5
v1=w
corr(v1,w)=0.7
corr(v1,w)=0
Low noise
(𝛼 𝑖𝑔 )
High noise
(𝛼 𝑖𝑔 1)

42
Figure 7a.
Figure 7b.
0
1
2
3
4
5
6
7
8
9
-4 -2 0 2 4 6 8 10
0
1
2
3
4
5
6
7
8
9
-4 -2 0 2 4 6 8 10
Utility of Recommended Product
Net
Pay
off
N
et P
ayo
ff
Utility of Recommended Product

43
Figure 8.
Table 1
Results for
time std error
payoff std error
1.00 3.28 (0.05) 3.20 (0.069) 3.5 3.74 (0.08) 3.33 (0.069)
12.2 4.69 (0.18) 3.47 (0.071) 42.9 6.95 (0.32) 3.76 (0.072) 150 64.32 (1.77) 3.63 (0.072)
Results for
time std payoff std

44
error error
1.00 1.29 (0.04) 4.79 (0.072) 3.5 2.37 (0.11) 4.78 (0.072)
12.2 4.22 (0.24) 4.76 (0.072) 42.9 8.49 (0.52) 4.67 (0.072) 150 60.52 (1.59) 3.69 (0.074)

45
Appendix 1: Attributes Coding
1. Location
Original Revision
“within a 15-20 minute walk to the NYU
campus”
“We would also greatly consider Brooklyn -
preferably Williamsburg - but these apartments
would have to be under $1100 each and would
need to be close to a subway line that would
take us to campus.”
“I am looking to live in the Union Square area,
but have also thought about living in Astoria. I
have decided I'd like either a small studio in
Manhattan, or a one/two bedroom in Astoria”
“I would consider living in Brooklyn, possible
in Williamsburg or close to the L train.”
“Areas that I am interested in are West and
East Village, St. Marks, 14th St., Soho,
Chinatown, or any other areas within a 15min
walking distance from NYU. I would also
consider any apartments available uptown that
are close to trains”
Areas that I am interested in are West and East
Village, St. Marks, 14th St., Soho, Chinatown,
or any other areas within a 15min walking
distance from NYU. I would also consider any
apartments available uptown that are close to
trains. Additionally, I would extend my
location preferences around the city preferably
only NYC and not NJ if there are places in
great neighborhoods with a great price and
large room. I would actually prefer Brooklyn
or Queens if there is a larger place and better
neighborhood than Manhattan.
“We prefer the Upper West Side, Chelsea, or
the West Village.”
“We prefer the Upper West Side between
Columbus Ave and Central Park West,
Chelsea, or the West Village. We will consider
other neighborhoods, but only in Manhattan.
We will not consider any apartments outside of
Manhattan.”
2. Laundry Revision:
- I would also like to add on that I would like a laundry facility to be in the building or
apartment.
- Have laundry amenities in the building or nearby
3. Kitchen Revision

46
- Stainless steel appliances would be preferable but not necessary.
- I prefer to have clean and new kitchen and the room can be smaller.
4. Roommates
“For this upcoming year, I am looking for
a studio or 1-bedroom apartment in
Manhattan for under $1,700.”
“I would still be interested in seeing the 2-
bedroom offerings in comparison to the
studio and 1-bedrooms, just too make sure
that's the route I want to take, but right
now I feel pretty strongly about an
apartment for myself.”
“My preferences are for this apartment to
… be a single-room”
I would not mind sharing the common
space with roommates as long as my own
room is private. Preferably under four
roommates would be best. A single-
room/studio would be ideal though!
I am looking for a studio or a one bedroom
apartment.
I can consider rooming with another
student or two, but the rent would have to
be no more than $1,300 a month
47
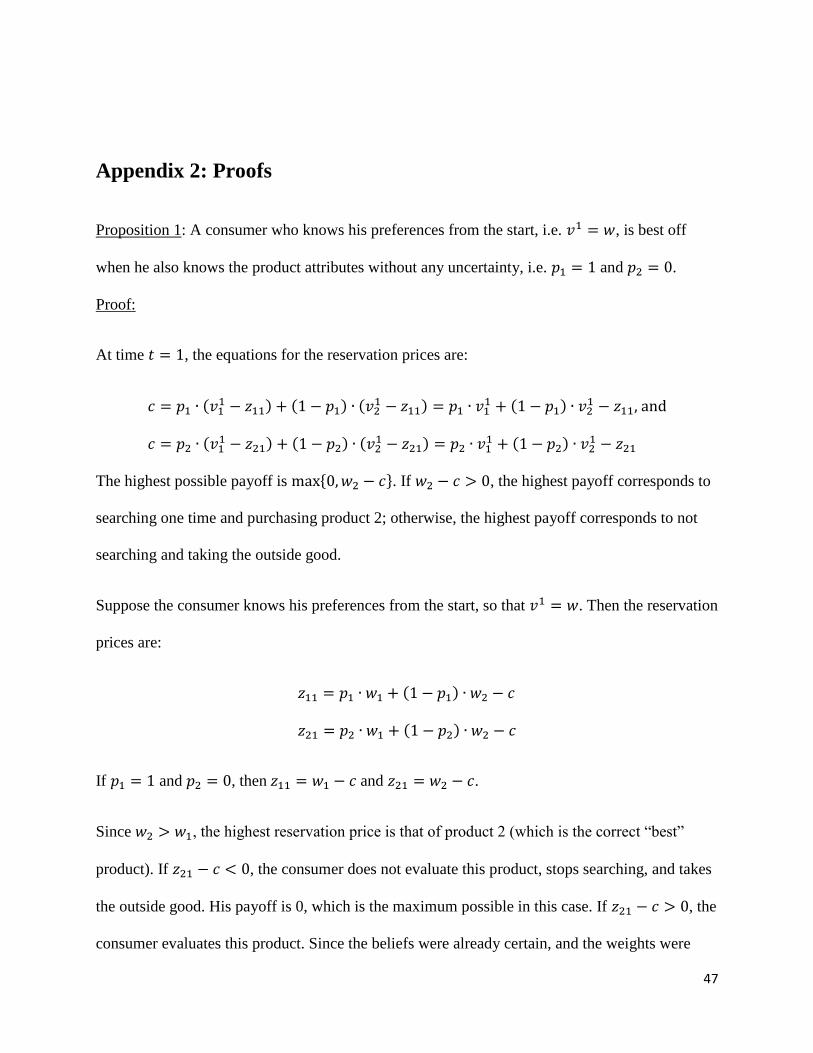
Appendix 2: Proofs
Proposition 1: A consumer who knows his preferences from the start, i.e. , is best off
when he also knows the product attributes without any uncertainty, i.e. and .
Proof:
At time , the equations for the reservation prices are:
( ) ( ) (
) ( )
( ) ( ) (
) ( )
The highest possible payoff is . If , the highest payoff corresponds to
searching one time and purchasing product 2; otherwise, the highest payoff corresponds to not
searching and taking the outside good.
Suppose the consumer knows his preferences from the start, so that . Then the reservation
prices are:
( )
( )
If and , then and .
Since , the highest reservation price is that of product 2 (which is the correct “best”
product). If , the consumer does not evaluate this product, stops searching, and takes
the outside good. His payoff is 0, which is the maximum possible in this case. If , the
consumer evaluates this product. Since the beliefs were already certain, and the weights were

48
correct, they remain unchanged. In the next time period, and the reservation price of
the remaining product is , so he does not search any longer, and purchases
product 2. His net payoff is , which is the maximum possible in this case.
Proposition 2: If , the consumer may be better off with noisy information about product
attributes, i.e. . and/or , than with perfect knowledge of product attributes without
uncertainty.
Proof: Suppose that the consumer is correct about the weight of the first attribute level, ,
but undervalues the second attribute, . Suppose further that
. The
highest possible payoff is
Case 1: and .
The reservation prices are
Since
, then , and the consumer searches the first product at time 1, and at
time 2 we have and the reservation price for product 2 is:
The consumer terminates the search, purchases product 1, and receives a payoff of .
Case 2: and/or
The reservation prices are:

49
( )
( )
If , then , and consumer searches product 2, and . At time 2 the
reservation price of product 1 is
( )
Since , the consumer terminates search and purchases product 2. His net payoff is
, which is greater than which was the payoff in Case 1.