Greenhouse Gas Emissions from Biological Nutrient Removal ...
ORIGINAL PAPER
The role of biodegradable particulate and colloidal organiccompounds in biological nutrient removal activated sludgesystems
J. Drewnowski • J. Makinia
Received: 16 May 2013 / Accepted: 21 October 2013 / Published online: 15 November 2013
� The Author(s) 2013. This article is published with open access at Springerlink.com
Abstract The efficiency of denitrification and enhanced
biological phosphorus removal in biological nutrient
removal activated sludge systems is strongly dependent on
the availability of appropriate carbon sources. Due to high
costs of commercial compounds (such as methanol, etha-
nol, acetic acid, etc.) and acclimation periods (usually)
required, the effective use of internal substrates is pre-
ferred. The aim of this study was to determine the effects of
slowly biodegradable compounds (particulate and colloi-
dal), as internal carbon sources, on denitrification, phos-
phate release/uptake and oxygen utilization for a full-scale
process mixed liquor from two large wastewater treatment
plants located in northern Poland. Since it is difficult to
distinguish the effect of slowly biodegradable substrate in a
direct way, a novel procedure was developed and imple-
mented. Four types of one- and two-phase laboratory batch
experiments were carried out in two parallel reactors with
the settled wastewater without pre-treatment (reactor 1)
and pre-treated with coagulation–flocculation (reactor 2).
The removal of colloidal and particulate fractions resulted
in the reduced process rates (except for phosphate release).
The average reductions ranged from 13 % for the oxygen
utilization rate during the second phase of a two-phase
experiment (anaerobic/aerobic), up to 35 % for the nitrate
utilization rate (NUR) during the second phase of a con-
ventional NUR measurement.
Keywords Activated sludge � Denitrification � Biological
phosphorus removal � Internal carbon source � Nitrogen
removal � pH dynamics � Slowly biodegradable substrate �Wastewater fractionation
Introduction
In modern biological nutrient removal (BNR) activated
sludge systems for combined N/P removal, sufficient
amounts of appropriate biodegradable organic compounds
(substrates) should be ensured to achieve simultaneously
high efficiency of both denitrification and enhanced bio-
logical phosphorus removal (EBPR). The reported data on
wastewater fractionation in various countries, summarized
by Makinia (2010), indicated that a content of the biode-
gradable organic fraction in total COD was highly variable
and ranged from 38 % (Zele, Belgium) to 91 % (Istambul,
Turkey).
The biodegradable organic fraction is composed of
readily (SS) and slowly (XS) biodegradable compounds, but
only the former are immediately metabolized by hetero-
trophic microorganisms. In contrast to the SS fraction, the
actual role of slowly biodegradable compounds has not
been ultimately recognized in terms of both theoretical
aspects (mechanism of utilization) and practical aspects
(influence on process performance). In the traditional
opinion, these compounds become available for utilization
by microorganisms after rapid enmeshment into sludge
flocs and follow-up hydrolysis to the readily biodegradable
substrate (Henze et al. 1987; Melcer et al. 2003; Uan et al.
2013). The latter process is accomplished by heterotrophic
microorganisms, which release extracellular enzymes that
break down and solubilize polymers, such as proteins,
lipids and polysugars. Recent experimental observations
indicate, however, that the removal of particles is not
instantaneous and better described by flocculation–
J. Drewnowski (&) � J. Makinia
Faculty of Civil and Environmental Engineering, Gdansk
University of Technology, ul. Narutowicza 11/12,
80-233 Gdansk, Poland
e-mail: [email protected]
123
Int. J. Environ. Sci. Technol. (2014) 11:1973–1988
DOI 10.1007/s13762-013-0402-1

hydrolysis rather than a one-step hydrolysis (Jimenez et al.
2005). The latest reported full-scale data on the effects of
particulate and colloidal substrate on process performance
are ambiguous and suggest that different behaviours may
result from complex interactions occurring in the activated
sludge systems (van Veldhuizen et al. 1999; Tas et al.
2009; Tuncal et al. 2009; Puig et al. 2010).
A better understanding of the effect of biodegradable
particulate and colloidal organic compounds, which are
major components of the slowly biodegradable fraction, is
important for optimal design and operation of BNR acti-
vated sludge systems. Conventional activated sludge sys-
tems have primarily been designed for removal of soluble
organic compounds, and most of them have been equipped
with quite big primary clarifiers in order to reduce the
organic (BOD) load to the biological stage. This approach
changed in the 1980s with the introduction of denitrifica-
tion and EBPR, and higher requirements of organic com-
pounds for those processes. The hydraulic retention time
(HRT) of primary clarifiers was shortened resulting in
lower efficiency of suspended solids removal (Siegrist et al.
2008). Recently, however, an opposite trend has been
observed in WWTPs due to an interest in enhancing biogas
production in anaerobic digesters. The effects of colloidal
and particulate organic compounds can thus be important
in terms of optimization of sedimentation and chemical
precipitation in primary clarifiers, i.e. balancing between
the efficiency of nutrient removal in the bioreactor and
biogas production in the digester. Gori et al. (2011) con-
cluded that an increase in the particulate COD removed in
primary clarifiers would result in reduction in the energy
demand for aeration in the bioreactor, and the associated
CO2 emissions from respiration (direct emission) and
power generation (indirect emission). The authors noted,
however, that ‘‘care must be used during process analysis
since a fraction of the COD necessary for proper nutrient
removal downstream may be incidentally removed’’.
There are no straightforward methods for measuring a
slowly biodegradable fraction in wastewater. Melcer et al.
(2003) proposed to estimate this fraction by subtracting
other fractions (readily biodegradable and inert) from total
COD:
XS ¼ COD� SS � SI � XI ð1Þ
The deficiency of that approach is that no reliable
method exists for estimating the inert particulate fraction
(XI).
Alternatively, in the Dutch STOWA guidelines for
wastewater characterization (Roeleveld and van Loosdr-
echt 2002), the biodegradable fraction of the influent COD
(SS ? XS) is determined based on a BOD analysis (mea-
suring the BOD as a function of time). Assuming that the
SS fraction is known, the XS fraction can be determined
from the following equation:
XS ¼BOD5
1�e�5kBOD
1� YBOD
� SS; ð2Þ
where BOD5—5-day biochemical oxygen demand, g BOD/
m3; kBOD—BOD decay coefficient, d-1; YBOD—yield
coefficient for BOD.
However, due to the uncertainty of the BOD analysis,
the XS fraction should be further calibrated along with the
XI fraction. Meijer et al. (2001) demonstrated a proper way
to evaluate the estimated XS/XI ratio using mass balances
over the activated sludge system. Furthermore, the authors
emphasized that a variation in the XS/XI ratio is very sen-
sitive to almost every modelled process, especially the
sludge production.
Since the concentration of the slowly biodegradable
fraction is not directly available, it is consequently difficult
to directly distinguish the effect of this fraction on major
biochemical processes in the activated sludge process. For
this purpose, Drewnowski and Makinia (2011) developed
and implemented a novel procedure based on the standard
batch experiments and pre-treatment of settled wastewater
sample. In this follow-up study, these effects were com-
prehensively evaluated with respect to denitrification,
phosphate release/uptake and oxygen utilization for a full-
scale process mixed liquor originating from two large BNR
WWTPs in northern Poland. Moreover, the pH behaviour
during those experiments was investigated in more detail.
The effect of pH on biochemical processes is normally
related the specific enzymatic activity in a bacterial cell,
energy required for the active transport of substrate across
the cell and the concentration of substrate (and inhibitor).
Materials and methods
Origin of the process biomass and wastewater
for laboratory experiments
The process mixed liquor, i.e. fresh returned activated
sludge (RAS) as recommended by Brdjanovic et al. (2000),
and settled wastewater originated from two large WWTPs
located in the cities of Gdansk and Gdynia (northern
Poland). The operating parameters and average composi-
tion of the primary and secondary effluents at both studied
plants are summarized in Table 1.
The Wschod WWTP in Gdansk is one of the largest
facilities located upon the Baltic Sea. During the time of
the study (2007–2009), the average influent flow rate to the
plant was approximately 82,000 m3/d and the pollutant
load corresponded to approximately 570,000 population
1974 Int. J. Environ. Sci. Technol. (2014) 11:1973–1988
123

equivalents (PE). The biological step consisted of six
parallel bioreactors, designed according to the Modified
University of Cape Town (MUCT) process configuration,
and twelve circular secondary clarifiers.
The average influent flow rate to the Debogorze WWTP
in Gdynia was approximately 53,500 m3/d in 2009–2010
(study period), and the pollutant load corresponded to
approximately 420,000 PE. The biological step, upgraded
in 2009 (3 months before starting the experiments), was
designed according to the Johannesburg (JHB) process
configuration with a carrousel system in the last compart-
ment for simultaneous nitrification/denitrification. The new
biological step consists of 10 bioreactors and 8 secondary
clarifiers.
For the laboratory experiments, samples of the process
mixed liquor and settled wastewater were collected from
the Wschod WWTP during three study periods (termed
winter, summer and spring) between December 2007 and
May 2009. The samples from the Debogorze WWTP were
collected during two (fall and spring) study periods
between September 2009 and May 2010. The average daily
(24-h) time-proportional samples of the settled wastewater
(after mechanical treatment) were collected at both studied
plants.
Preparation of wastewater samples
Since it is difficult to determine the effects of slowly
biodegradable substrate in a direct way, a novel labora-
tory procedure was developed based on the
measurements conducted in two parallel batch reactors
(Fig. 1). In reactor 1, the process biomass was mixed
with the settled wastewater without further pre-treatment
(containing soluble, colloidal and particulate organic
fractions), whereas the supernatant of the settled waste-
water after coagulation–flocculation was used in reactor
2. A similar concept was earlier proposed by Goel et al.
(1999) to separate hydrolysis from storage by performing
and analysing two parallel OUR measurements: one with
filtered wastewater (including only soluble COD) and the
other with non-filtered wastewater (including total COD).
The wastewater sample in reactor 2, containing only a
soluble organic fraction, was prepared according to the
rapid physical–chemical method of Mamais et al. (1993).
That method is based on precipitation with ZnSO4 at pH
10.5, which removes the colloidal particles leaving only
truly soluble organic matter in the supernatant. After
removing colloids and particulates, the pH was adjusted to
its original value by adding 6 M HCl. This kind of pre-
treatment also resulted in precipitation of phosphate so the
initial PO4–P concentrations in reactor 2 always decreased
in comparison with reactor 1.
It should be noted that Mamais et al. (1993) justified the
rationale for their coagulation–flocculation method by the
fact that readily biodegradable organic matter consists of
simple molecules such as VFAs and low molecular weight
carbohydrates that pass through the cell membrane and are
metabolized immediately. Hu et al. (2002b) indeed con-
firmed that the COD quantified with this method corre-
sponded closely with the low (\1 kDa) molecular weight
Table 1 Operating parameters and average composition of the primary and secondary effluents during three study sessions at the Wschod
WWTP and two study sessions at the Debogorze WWTP (average values ± SD)
Parameter Unit ‘‘Wschod’’ WWTP (MUCT process) ‘‘Debogorze’’ WWTP (JHB process)
Influent Effluent Bioreactor Influent Effluent Bioreactor
Q m3/d 82,000 53,500
PE – 574,000 422,000
SRT d 21 (±2.9) 28 (±6.3)
MLSS kg/m3 5.45 (±0.56) 4.95 (±0.66)
Temperature �C 11.8–20.5 15.5–17.9
COD g COD/m3 626 (±82) 48 (±4.2) 901 (±52) 25.8 (±5.3)
Soluble COD g COD/m3 194 (±38)
BOD5 g BOD/m3 298 (±35) 6.7 (±2.1) 301 (±42) 4.2 (±0.63)
Total P g P/m3 14.9 (±2.6) 0.60 (±0.10) 12.5 (±1.6) 0.50 (±0.15)
Total N g N/m3 81.2 (±5.0) 11.1 (±1.1) 90.2 (±7.0) 8.77 (±0.7)
NH4–N g N/m3 58.9 (±3.4) 1.20 (±0.75) 67.5 (±4.6) 0.98 (±0.27)
NO3–N g N/m3 7.4 (±0.64) 5.9 (±0.53)
TSS g/m3 288 (±31) 12.6 (±3.5) 260 (±28) 12.4 (±1.2)
VSS g/m3 180 (±21) 5.8 (±2.8) 198 (±16) 5.3 (±0.4)
Int. J. Environ. Sci. Technol. (2014) 11:1973–1988 1975
123

fraction, but that finding remains in contradiction to the
observations from a few other studies with municipal
wastewater (Makinia 2010).
Laboratory apparatus
The laboratory experiments were carried out in an experi-
mental apparatus consisting of two parallel, plexiglass
batch reactors (max. volume of 4.0 dm3) and automated
control system for temperature and dissolved oxygen (DO)
concentration (Drewnowski and Makinia, 2011). The
reactors were equipped with probes/electrodes (WTW
GmbH, Germany) for continuous monitoring of pH (Sen-
Tix 21), oxidation–reduction potential (ORP) (SenTix
ORP), temperature and DO concentration (CellOx 325).
The reactor content was mixed with mechanical stirrers at
the velocity of 180 rpm.
In addition, a small chamber for cyclic measurements of
oxygen utilization rates (OURs) was connected with the
main reactor. The OUR measurement was automatically
controlled and one cycle (3.5 min) consisted of the fol-
lowing phases: emptying, rinsing, filling and measuring
(3 min). The oxygen depletion in the OUR chamber was
measured using a DO probe with a stirrer (WTW Stirrox
G).
Experimental procedures
The laboratory experiments were carried out at the cur-
rent process temperatures (12–21 �C) in the full-scale
bioreactors at the studied WWTPs. The aim was to
determine the kinetics of some major biochemical pro-
cesses in BNR activated sludge systems, including nitrate
utilization rates (NURs), phosphate release/uptake rates
(PRR/PURs), OURs and ammonia utilization rates
(AURs). In each study period, batch tests were carried
out in duplicate for four different types of measurements
described below.
Conventional NUR measurement
The fresh RAS was diluted with the settled wastewater
without pre-treatment (reactor 1) and pre-treated with
coagulation–flocculation (reactor 2) to obtain 4.0 dm3 of
mixed liquor in each reactor. The dilution rate was
adjusted to obtain the mixed liquor suspended solids
(MLSS) concentration at approximately 2–3 kg/m3, but
the actual MLSS and mixed liquor volatile suspended
solids (MLVSS) concentrations in both reactors were
measured at the beginning of each test. After adding the
mixture to each reactor, the mixer, cooling system for
the water coat and on-line monitoring system were
turned on. Nitrate (KNO3) was injected to increase the
initial NO3–N concentration to approximately 20 g N/m3.
The measurement was conducted for 4 h, and samples of
the mixed liquor (V = 50 cm3) were withdrawn with the
frequency of 10–30 min, filtered under vacuum pressure
on the Whatman GF/C filter and analysed for NO3–N,
PO4–P and COD.
Anaerobic PRR and anoxic/aerobic PUR measurement
The measurement was conducted for 6.5 h and com-
prised two phases: anaerobic (2.5 h) followed by anoxic
or aerobic (4 h). Such a sequence better reflects the
actual conditions occurring in the activated sludge sys-
tems performing EBPR. The mixed liquor in the two
parallel reactors was prepared in a similar way to the
Fig. 1 Diagram illustrating the
experimental apparatus and
procedure
1976 Int. J. Environ. Sci. Technol. (2014) 11:1973–1988
123

conventional NUR measurement but, in order to maintain
anaerobic conditions, no nitrate was added. Nitrate
(KNO3) was injected at the beginning of the anoxic
phase (in the anoxic PUR test) to increase the NO3–N
concentration by approximately 20 g N/m3. In the aero-
bic PUR test, the aeration system was turned on at the
beginning of the aerobic phase and the OUR measure-
ment was initiated. The DO set point was kept at 6 g O2/
m3 to avoid the effect of oxygen limitation. In each
experiment, samples of the mixed liquor (V = 50 cm3)
were withdrawn with the frequency of 10–30 min, fil-
tered under vacuum pressure on the Whatman GF/C filter
and analysed for PO4–P and COD (anaerobic phase),
and PO4–P, COD and NO3–N/NH4–N (anoxic/aerobic
phase).
Conventional OUR measurement
This additional experiment under aerobic conditions
was carried out to verify the yield coefficient, YH, in
comparison with its theoretical value. An hour before
starting the measurement, nitrification inhibitor [allyl-
thiourea (ATU)] was added to the RAS in the amount of
10 mg/dm3. The mixed liquor in the two parallel reac-
tors was prepared in a similar way to the conventional
NUR measurement but without adding nitrate. After
placing the mixed liquor in the reactors, the automated
OUR measurement was initiated and the DO set point
was kept at 6 g O2/m3. The measurement was con-
ducted for 6 h. Samples of the mixed liquor
(V = 50 cm3) were withdrawn with the frequency of
10–60 min, filtered under vacuum pressure on the
Whatman GF/C filter and analysed for COD. Based on
the measurements of total OUR (OURtot(t)), endoge-
nous OUR (OURend(t)) and degraded COD (CODdegr.),
the YH coefficient was determined from the following
equation (Ekama et al. 1986; Kappeler and Gujer 1992;
Orhon et al. 1994):
YH ¼CODdegr: �
ROURtotðtÞ � OURendðtÞð Þdt
CODdegr:ð3Þ
Analytical methods
Total and volatile suspended solids were measured by the
gravimetric method according to the Polish Standards (PN-
72/C-04559). The total and soluble COD, PO4–P, NO3–N
and NH4–N were analysed by Hach–Lange ‘‘test-in-tube’’
using a Xion 500 spectrophotometer (Hach–Lange GmbH,
Germany). The analytical procedures, which were adapted
by Hach–Lange GmbH (Germany), followed the Standard
Methods (APHA 1992).
Results and discussion
Characteristics of the wastewater samples
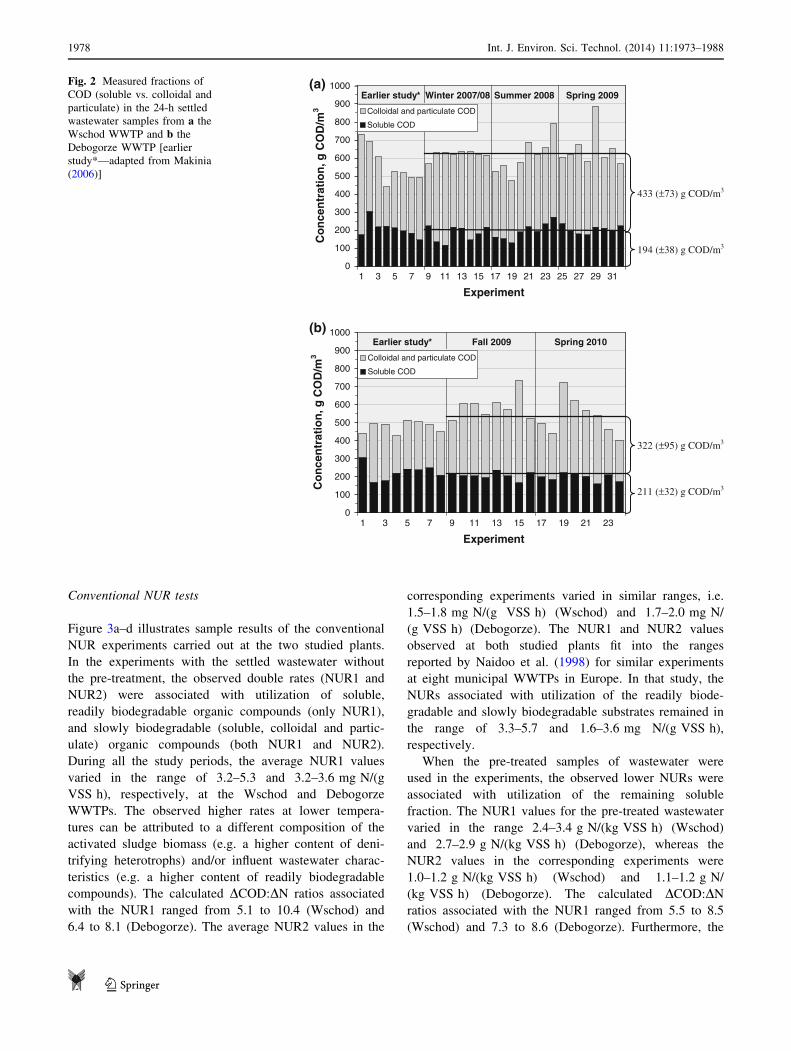
At the Wschod WWTP, the soluble fraction accounted for
19–39 % of total COD in 24 wastewater samples used in
the experiments in reactor 2 (Fig. 2a). The average value of
total COD was 627 (±81) g COD/m3 including soluble
COD = 194 (±38) g COD/m3 versus non-soluble (colloi-
dal and particulate) COD = 433 (±73) g COD/m3. For
comparison, the average values of total and soluble COD
determined using the same method of Mamais et al. (1993)
from the annual routine operating data were slightly devi-
ating from the above concentrations, i.e. 594 and 172 g
COD/m3 (2007), and 715 and 192 g COD/m3 (2008). At
the Debogorze WWTP, the soluble fraction accounted for
23–46 % of total COD in 16 samples of the settled
wastewater (Fig. 2b). The average value of total COD was
533 (±86) g COD/m3 including soluble COD = 211
(±32) g COD/m3 versus non-soluble COD = 322 (±95) g
COD/m3.
In the earlier modelling study at these two plants
(Makinia, 2006), similar measurements were carried out at
both plants and those data are also shown in Fig. 2a–b. The
estimated ratio of biodegradable to non-biodegradable
particulate (and colloidal) organic fractions varied in the
range of 1.8–2.5 (Wschod) and 1.4–1.5 (Debogorze) to fit
the waste activated sludge (WAS) production. As a conse-
quence, the ratios of [SS/(SS ? XS)] at the Wschod WWTP
(0.32–0.40) fitted well into a typical range of 0.3–0.5 (Sa-
hlstedt et al. 2003), whereas the corresponding values at the
Debogorze WWTP (0.50–0.54) slightly exceeded that
range. Furthermore, Pagilla et al. (2008) reported results of
the COD distribution in the primary effluents of both plants
based on the filtration on different pore size filters. The
dominant fraction originated from particulate organic
compounds ([1.2 lm), which constituted 67 and 75 % of
COD, respectively, at the Wschod and Debogorze WWTPs
(the latter plant was before the upgrade).
Batch test results
The ranges of all the observed specific rates, including
NURs, PRRs, anoxic/aerobic PURs and OURs, in the batch
experiments with the settled wastewater without pre-treat-
ment and after coagulation–flocculation are listed in
Table 2 (Wschod) and Table 3 (Debogorze). The obtained
kinetic results are discussed in the following sections.
Results of similar experiments with the settled wastewater,
carried out earlier by Makinia (2006) at the same plants,
were used for comparison.
Int. J. Environ. Sci. Technol. (2014) 11:1973–1988 1977
123
Conventional NUR tests
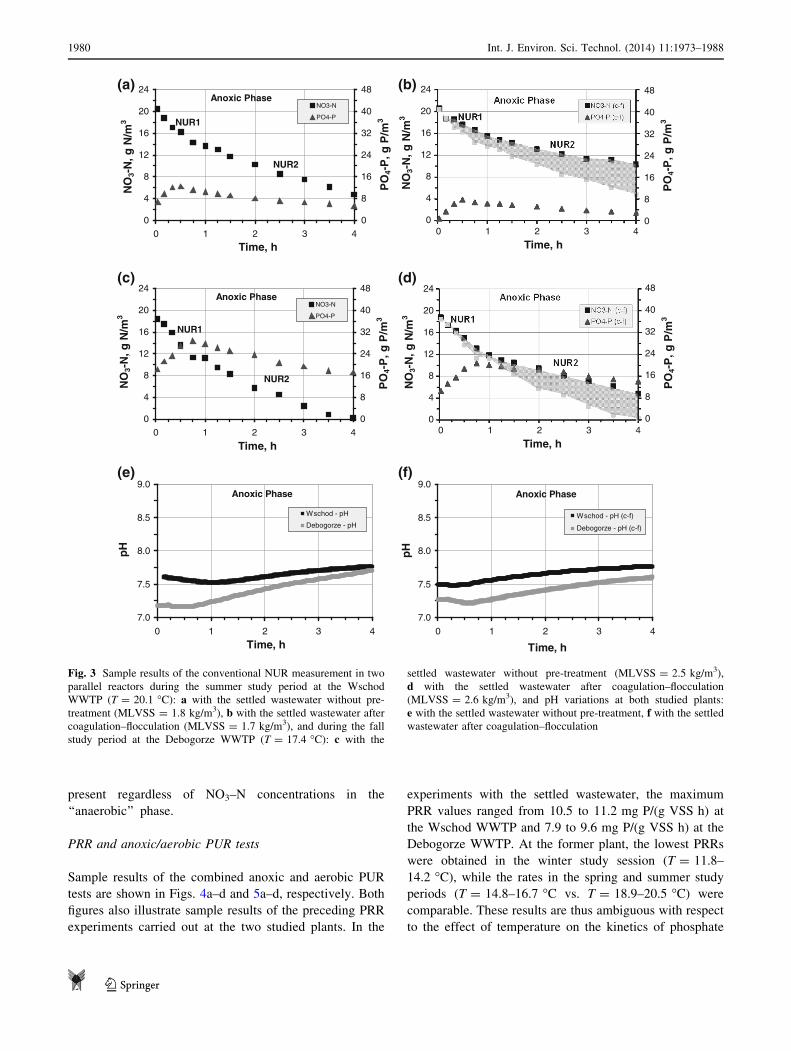
Figure 3a–d illustrates sample results of the conventional
NUR experiments carried out at the two studied plants.
In the experiments with the settled wastewater without
the pre-treatment, the observed double rates (NUR1 and
NUR2) were associated with utilization of soluble,
readily biodegradable organic compounds (only NUR1),
and slowly biodegradable (soluble, colloidal and partic-
ulate) organic compounds (both NUR1 and NUR2).
During all the study periods, the average NUR1 values
varied in the range of 3.2–5.3 and 3.2–3.6 mg N/(g
VSS h), respectively, at the Wschod and Debogorze
WWTPs. The observed higher rates at lower tempera-
tures can be attributed to a different composition of the
activated sludge biomass (e.g. a higher content of deni-
trifying heterotrophs) and/or influent wastewater charac-
teristics (e.g. a higher content of readily biodegradable
compounds). The calculated DCOD:DN ratios associated
with the NUR1 ranged from 5.1 to 10.4 (Wschod) and
6.4 to 8.1 (Debogorze). The average NUR2 values in the
corresponding experiments varied in similar ranges, i.e.
1.5–1.8 mg N/(g VSS h) (Wschod) and 1.7–2.0 mg N/
(g VSS h) (Debogorze). The NUR1 and NUR2 values
observed at both studied plants fit into the ranges
reported by Naidoo et al. (1998) for similar experiments
at eight municipal WWTPs in Europe. In that study, the
NURs associated with utilization of the readily biode-
gradable and slowly biodegradable substrates remained in
the range of 3.3–5.7 and 1.6–3.6 mg N/(g VSS h),
respectively.
When the pre-treated samples of wastewater were
used in the experiments, the observed lower NURs were
associated with utilization of the remaining soluble
fraction. The NUR1 values for the pre-treated wastewater
varied in the range 2.4–3.4 g N/(kg VSS h) (Wschod)
and 2.7–2.9 g N/(kg VSS h) (Debogorze), whereas the
NUR2 values in the corresponding experiments were
1.0–1.2 g N/(kg VSS h) (Wschod) and 1.1–1.2 g N/
(kg VSS h) (Debogorze). The calculated DCOD:DN
ratios associated with the NUR1 ranged from 5.5 to 8.5
(Wschod) and 7.3 to 8.6 (Debogorze). Furthermore, the
(a)
433 (±73) g COD/m3
0
100
200
300
400
500
600
700
800
900
1000
1 3 5 7 9 11 13 15 17 19 21 23 25 27 29 31
Experiment
Co
nce
ntr
atio
n, g
CO
D/m
3 Colloidal and particulate COD
Soluble COD
Winter 2007/08 Summer 2008 Spring 2009Earlier study*
194 (±38) g COD/m3
(b)
0
100
200
300
400
500
600
700
800
900
1000
1 3 5 7 9 11 13 15 17 19 21 23
Experiment
Co
nce
ntr
atio
n, g
CO
D/m
3 Colloidal and particulate COD
Soluble COD
Earlier study* Fall 2009 Spring 2010
322 (±95) g COD/m3
211 (±32) g COD/m3
Fig. 2 Measured fractions of
COD (soluble vs. colloidal and
particulate) in the 24-h settled
wastewater samples from a the
Wschod WWTP and b the
Debogorze WWTP [earlier
study*—adapted from Makinia
(2006)]
1978 Int. J. Environ. Sci. Technol. (2014) 11:1973–1988
123

removal of colloidal and particulate organic compounds
resulted in decreasing the overall efficiency of NO3–N
removal during the 4-h experiments by 21–37 and
24–28 %, respectively, at the Wschod and Debogorze
WWTPs.
In addition to nitrate and COD, the behaviour of
phosphate was also investigated during the experiments.
At the beginning of the experiments, phosphate was
released despite high concentrations of nitrate (in the
range of approximately 10–20 g N/m3) which, according
the traditional opinion, inhibit that process (P release).
The release continued until the readily biodegradable
substrate was present in the solution (approximately
0.5–2.5 h) depending on the study period (temperature),
biomass and initial COD concentrations in the batch
reactors. A very similar behaviour of phosphate was
observed by Brdjanovic et al. (2000) in the conventional
NUR test with a full-scale plant mixed liquor and acetate
as a carbon source. In that study, a significant amount of
phosphate was released (from approximately 2 g P/m3 to
almost 10 g P/m3) during the first hour of the test until a
complete consumption of acetate. Simultaneously, the
NO3–N concentration decreased from approximately 25 g
to 10 g N/m3. These observations are in accordance with
the conclusion of Yuan and Oleszkiwicz (2008) that
phosphate release continues as long as the substrate is
Table 2 Average values (±standard deviations) of the specific process rates observed during the batch experiments with the settled wastewater
without pre-treatment and pre-treated with coagulation–flocculation at the Wschod WWTP
Process Unit Winter
session
(11.8–14.2 �C) Spring
session
(14.8–16.7 �C) Summer
session
(18.9–20.5 �C)
Settled
wastewater
Pre-treated settled
wastewater
Settled
wastewater
Pre-treated settled
wastewater
Settled
wastewater
Pre-treated settled
wastewater
NUR1 mg N/gVSS h 4.4 (±0.92) 3.4 (±0.92) 5.3 (±0.14) 3.3 (±0.21) 3.2 (±0.35) 2.4 (±0.49)
NUR2 mg N/gVSS h 1.5 (±0.07) 1.1 (±0.07) 1.8 (±1.13) 1.2 (±0.28) 1.7 (±0.07) 1.0 (±0.01)
PRR mg P/gVSS h 10.5 (±1.07) 8.1 (±2.28) 11.2 (±0.67) 13.1 (±0.91) 11.0 (±1.56) 10.2 (±2.56)
PURAnoxic mg P/gVSS h 4.7 (±0.35) 1.2 (±0.07) 6.8 (±0.78) 6.7 (±1.20) 5.7 (±1.48) 3.4 (±1.27)
NUR mg N/gVSS h 1.8 (±0.21) 1.0 (±0.35) 3.0 (±0.71) 2.2 (±0.35) 2.3 (±0.07) 1.8 (±0.01)
PURAerobic mg P/gVSS h 8.6 (±1.41) 4.0 (±2.33) 11.4 (±0.07) 11.0 (±0.57) 6.1 (±0.42) 3.8 (±1.41)
OURMax mg O2/gVSS h 22.1 (±0.07) 18.3 (±0.07) 26.8 (±1.41) 25.9 (±0.42) 32.6 (±1.13) 29.7 (±1.89)
AUR mg N/gVSS h 2.5 (±0.57) 2.3 (±0.71) 3.5 (±0.21) 3.5 (±0.01) 3.9 (±0.35) 3.8 (±0.78)
OURMax mg O2/gVSS h 22.8 (±7.35) 16.9 (±7.99) 28.0 (±4.95) 20.8 (±6.51) 39.5 (±10.32) 27.8 (±7.99)
OUREndog mg O2/gVSS h 7.1 (±4.25) 4.95 (±2.76) 8.1 (±0.85) 5.7 (±0.14) 10.6 (±0.71) 6.6 (±1.27)
YH g COD/g COD 0.65 (±0.06) 0.66 (±0.04) 0.66 (±0.01) 0.66 (±0.05) 0.67 (±0.05) 0.62 (±0.06)
Table 3 Average values (±standard deviations) of the specific process rates observed during the batch experiments with the settled wastewater
without pre-treatment and after coagulation–flocculation at the Debogorze WWTP
Process Unit Fall session (16.0–17.8 �C) Spring session (15.4–16.2 �C)
Settled wastewater Pre-treated settled wastewater Settled wastewater Pre-treated settled wastewater
NUR1 mg N/gVSS h 3.6 (±0.64) 2.7 (±0.07) 3.2 (±0.57) 2.9 (±0.35)
NUR2 mg N/gVSS h 1.7 (±0.07) 1.1 (±0.21) 2.0 (±0.35) 1.2 (±0.07)
PRR mg P/gVSS h 9.6 (±0.44) 11.2 (±0.76) 7.9 (±0.85) 8.7 (±1.52)
PURAnoxic mg P/gVSS h 2.0 (±0.07) 1.2 (±0.49) 1.8 (±0.14) 1.7 (±0.01)
NUR mg N/gVSS h 1.8 (±0.42) 1.3 (±0.14) 2.3 (±0.49) 1.6 (±0.28)
PURAerobic mg P/gVSS h 5.9 (±1.06) 4.9 (±0.71) 5.6 (±0.35) 5.0 (±1.06)
OURMax mg O2/gVSS h 24.9 (±0.99) 21.8 (±1.34) 24.5 (±3.75) 19.1 (±1.70)
AUR mg N/gVSS h 2.9 (±0.21) 2.9 (±0.14) 2.8 (±0.07) 3.1 (±0.07)
OURMax mg O2/gVSS h 20.4 (±1.98) 16.9 (±1.30) 21.8 (±3.46) 17.1 (±0.99)
OUREndog mg O2/gVSS h 7.6 (±2.67) 5.2 (±2.73) 8.1 (±1.38) 6.1 (±1.09)
YH g COD/g COD 0.69 (±0.01) 0.71 (±0.05) 0.68 (±0.02) 0.69 (±0.07)
Int. J. Environ. Sci. Technol. (2014) 11:1973–1988 1979
123
present regardless of NO3–N concentrations in the
‘‘anaerobic’’ phase.
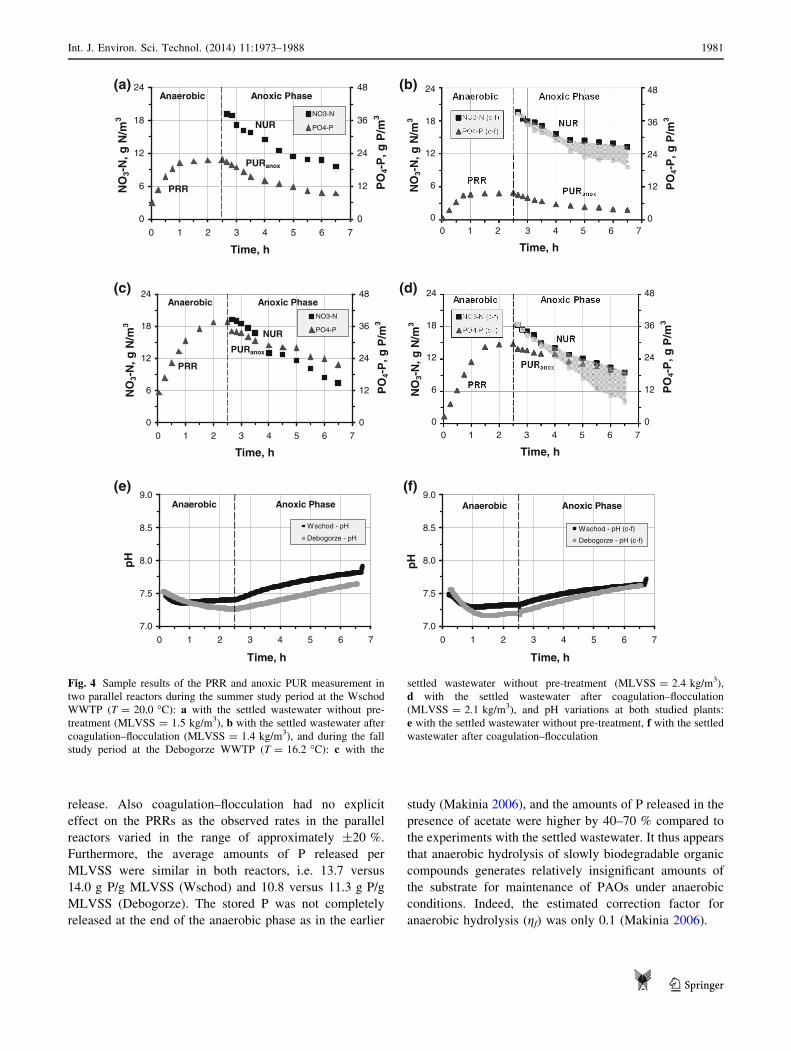
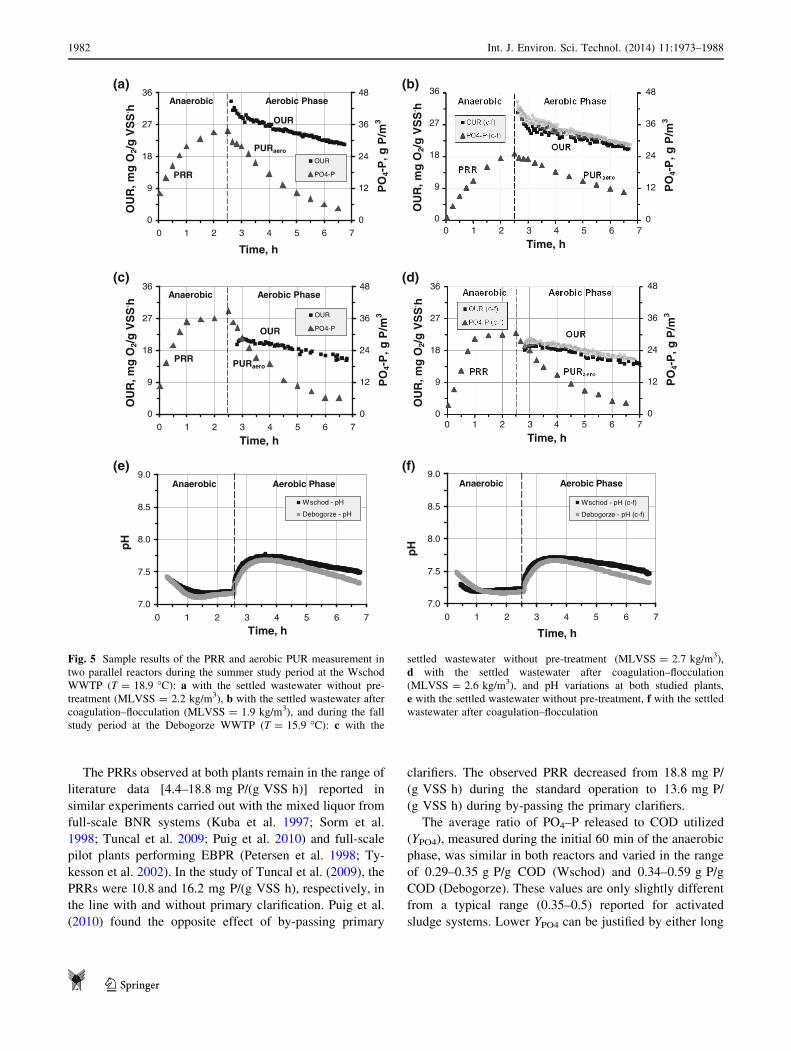
PRR and anoxic/aerobic PUR tests
Sample results of the combined anoxic and aerobic PUR
tests are shown in Figs. 4a–d and 5a–d, respectively. Both
figures also illustrate sample results of the preceding PRR
experiments carried out at the two studied plants. In the
experiments with the settled wastewater, the maximum
PRR values ranged from 10.5 to 11.2 mg P/(g VSS h) at
the Wschod WWTP and 7.9 to 9.6 mg P/(g VSS h) at the
Debogorze WWTP. At the former plant, the lowest PRRs
were obtained in the winter study session (T = 11.8–
14.2 �C), while the rates in the spring and summer study
periods (T = 14.8–16.7 �C vs. T = 18.9–20.5 �C) were
comparable. These results are thus ambiguous with respect
to the effect of temperature on the kinetics of phosphate
(a)
(c)
(b)
(d)
(e) (f)
0
4
8
12
16
20
24
0 1 2 3 4
Time, h
NO
3-N
, g N
/m3
0
8
16
24
32
40
48
PO
4-P
, g P
/m3
NO3-N
PO4-PNUR1
NUR2
Anoxic Phase
0
4
8
12
16
20
24
0 1 2 3 4
Time, h
NO
3-N
, g N
/m3
0
8
16
24
32
40
48
PO
4-P
, g P
/m3
NO3-N
PO4-P
NUR1
NUR2
Anoxic Phase
7.0
7.5
8.0
8.5
9.0
0 1 2 3 4
Time, h
pH
Wschod - pH
Debogorze - pH
Anoxic Phase
7.0
7.5
8.0
8.5
9.0
0 1 2 3 4
Time, h
pH
Wschod - pH (c-f)
Debogorze - pH (c-f)
Anoxic Phase
0
4
8
12
16
20
24
0 1 2 3 4
Time, h
NO
3-N
, g N
/m3
0
8
16
24
32
40
48
PO
4-P
, g P
/m3
0
4
8
12
16
20
24
0 1 2 3 4
Time, h
NO
3-N
, g N
/m3
0
8
16
24
32
40
48
PO
4-P
, g P
/m3
Fig. 3 Sample results of the conventional NUR measurement in two
parallel reactors during the summer study period at the Wschod
WWTP (T = 20.1 �C): a with the settled wastewater without pre-
treatment (MLVSS = 1.8 kg/m3), b with the settled wastewater after
coagulation–flocculation (MLVSS = 1.7 kg/m3), and during the fall
study period at the Debogorze WWTP (T = 17.4 �C): c with the
settled wastewater without pre-treatment (MLVSS = 2.5 kg/m3),
d with the settled wastewater after coagulation–flocculation
(MLVSS = 2.6 kg/m3), and pH variations at both studied plants:
e with the settled wastewater without pre-treatment, f with the settled
wastewater after coagulation–flocculation
1980 Int. J. Environ. Sci. Technol. (2014) 11:1973–1988
123
release. Also coagulation–flocculation had no explicit
effect on the PRRs as the observed rates in the parallel
reactors varied in the range of approximately ±20 %.
Furthermore, the average amounts of P released per
MLVSS were similar in both reactors, i.e. 13.7 versus
14.0 g P/g MLVSS (Wschod) and 10.8 versus 11.3 g P/g
MLVSS (Debogorze). The stored P was not completely
released at the end of the anaerobic phase as in the earlier
study (Makinia 2006), and the amounts of P released in the
presence of acetate were higher by 40–70 % compared to
the experiments with the settled wastewater. It thus appears
that anaerobic hydrolysis of slowly biodegradable organic
compounds generates relatively insignificant amounts of
the substrate for maintenance of PAOs under anaerobic
conditions. Indeed, the estimated correction factor for
anaerobic hydrolysis (gf) was only 0.1 (Makinia 2006).
(a) (b)
(c) (d)
(e) (f)
0
6
12
18
24
0 1 2 3 4 5 6 7
Time, h
NO
3-N
, g N
/m3
0
12
24
36
48
PO
4-P
, g P
/m3
NO3-N
PO4-PNUR
PRR
PURanox
Anaerobic Anoxic Phase
7.0
7.5
8.0
8.5
9.0
0 1 2 3 4 5 6 7
Time, h
pH
Wschod - pH
Debogorze - pH
Anoxic PhaseAnaerobic
7.0
7.5
8.0
8.5
9.0
0 1 2 3 4 5 6 7
Time, h
pH
Wschod - pH (c-f)
Debogorze - pH (c-f)
Anoxic PhaseAnaerobic
0
6
12
18
24
0 1 2 3 4 5 6 7
Time, h
NO
3-N
, g N
/m3
0
12
24
36
48
PO
4-P
, g P
/m3NO3-N
PO4-PNUR
PRR
PURanox
Anaerobic Anoxic Phase
0
6
12
18
24
0 1 2 3 4 5 6 7
Time, h
NO
3-N
, g N
/m3
0
12
24
36
48
PO
4-P
, g P
/m3
0
6
12
18
24
0 1 2 3 4 5 6 7
Time, h
NO
3-N
, g N
/m3
0
12
24
36
48
PO
4-P
, g P
/m3
Fig. 4 Sample results of the PRR and anoxic PUR measurement in
two parallel reactors during the summer study period at the Wschod
WWTP (T = 20.0 �C): a with the settled wastewater without pre-
treatment (MLVSS = 1.5 kg/m3), b with the settled wastewater after
coagulation–flocculation (MLVSS = 1.4 kg/m3), and during the fall
study period at the Debogorze WWTP (T = 16.2 �C): c with the
settled wastewater without pre-treatment (MLVSS = 2.4 kg/m3),
d with the settled wastewater after coagulation–flocculation
(MLVSS = 2.1 kg/m3), and pH variations at both studied plants:
e with the settled wastewater without pre-treatment, f with the settled
wastewater after coagulation–flocculation
Int. J. Environ. Sci. Technol. (2014) 11:1973–1988 1981
123
The PRRs observed at both plants remain in the range of
literature data [4.4–18.8 mg P/(g VSS h)] reported in
similar experiments carried out with the mixed liquor from
full-scale BNR systems (Kuba et al. 1997; Sorm et al.
1998; Tuncal et al. 2009; Puig et al. 2010) and full-scale
pilot plants performing EBPR (Petersen et al. 1998; Ty-
kesson et al. 2002). In the study of Tuncal et al. (2009), the
PRRs were 10.8 and 16.2 mg P/(g VSS h), respectively, in
the line with and without primary clarification. Puig et al.
(2010) found the opposite effect of by-passing primary
clarifiers. The observed PRR decreased from 18.8 mg P/
(g VSS h) during the standard operation to 13.6 mg P/
(g VSS h) during by-passing the primary clarifiers.
The average ratio of PO4–P released to COD utilized
(YPO4), measured during the initial 60 min of the anaerobic
phase, was similar in both reactors and varied in the range
of 0.29–0.35 g P/g COD (Wschod) and 0.34–0.59 g P/g
COD (Debogorze). These values are only slightly different
from a typical range (0.35–0.5) reported for activated
sludge systems. Lower YPO4 can be justified by either long
(a) (b)
(d)
(e) (f)
0
9
18
27
36
0 1 2 3 4 5 6 7
Time, h
OU
R, m
g O
2/g
VS
S. h
0
12
24
36
48
PO
4-P
, g P
/m3
OUR
PO4-PPRR
PURaero
OUR
Anaerobic Aerobic Phase
0
9
18
27
36
0 1 2 3 4 5 6 7
Time, h
OU
R, m
g O
2/g
VS
S. h
0
12
24
36
48
PO
4-P
, g P
/m3OUR
PO4-P
PRR PURaero
OUR
Anaerobic Aerobic Phase
7.0
7.5
8.0
8.5
9.0
0 1 2 3 4 5 6 7
Time, h
pH
Wschod - pH
Debogorze - pH
Aerobic PhaseAnaerobic
7.0
7.5
8.0
8.5
9.0
0 1 2 3 4 5 6 7
Time, h
pH
Wschod - pH (c-f)
Debogorze - pH (c-f)
Aerobic PhaseAnaerobic
(c)
0
9
18
27
36
0 1 2 3 4 5 6 7
Time, h
OU
R, m
g O
2/g
VS
S. h
0
12
24
36
48
PO
4-P
, g P
/m3
0
9
18
27
36
0 1 2 3 4 5 6 7
Time, h
OU
R, m
g O
2/g
VS
S. h
0
12
24
36
48
PO
4-P
, g P
/m3
Fig. 5 Sample results of the PRR and aerobic PUR measurement in
two parallel reactors during the summer study period at the Wschod
WWTP (T = 18.9 �C): a with the settled wastewater without pre-
treatment (MLVSS = 2.2 kg/m3), b with the settled wastewater after
coagulation–flocculation (MLVSS = 1.9 kg/m3), and during the fall
study period at the Debogorze WWTP (T = 15.9 �C): c with the
settled wastewater without pre-treatment (MLVSS = 2.7 kg/m3),
d with the settled wastewater after coagulation–flocculation
(MLVSS = 2.6 kg/m3), and pH variations at both studied plants,
e with the settled wastewater without pre-treatment, f with the settled
wastewater after coagulation–flocculation
1982 Int. J. Environ. Sci. Technol. (2014) 11:1973–1988
123

SRTs or the presence of glycogen-accumulating organisms
(GAOs) (Brdjanovic et al. 2000). Furthermore, the type of
substrate is another factor influencing YPO4. In the earlier
study (Makinia 2006), the ratios for acetate were signifi-
cantly higher (by approximately 35–40 %) in comparison
with the settled wastewater. Also, Ubukata (2005) found
that the organic compounds present in real wastewater
contribute to a different phosphate release than acetate.
The maximum PURs observed at both plants under
aerobic conditions (during the initial 60 min of the test)
varied in the ranges of 6.1–11.4 and 5.6–5.9 mg P/
(g VSS h) in the settled wastewater without pre-treatment
versus 3.8–11.0 and 4.9–5.0 mg P/(g VSS h) in the
wastewater after coagulation–flocculation, respectively, at
the Wschod WWTP (Table 2) and Debogorze WWTP
(Table 3). The anoxic PURs were significantly lower, i.e.
4.7–6.8 and 1.8–2.0 mg P/(g VSS h) in the settled waste-
water without pre-treatment versus 1.2–6.7 and
1.2–1.7 mg P/(g VSS h) in the wastewater after coagula-
tion–flocculation. The anoxic PURs correlated strongly
(r2 = 0.96–0.99) with the NURs measured during the
parallel experiments with the settled wastewater (Tables 2,
3). The calculated ratios of utilized nitrate and phosphate
varied in the range of 0.51–0.78 and 0.74–1.41 g N/g P in
the settled wastewater without pre-treatment versus
0.47–1.74 and 0.83–1.01 g N/g P in the wastewater after
coagulation–flocculation, respectively, at the Wschod
WWTP and the Debogorze WWTP. For comparison,
Tuncal et al. (2009) found lower N/P ratios which were 0.4
and 0.5 g N/g P, respectively, in the line without and with
primary clarification.
The capabilities of denitrifying PAOs cannot be signif-
icant at both studied plants in terms of contribution to the
overall utilization of nitrate. Makinia (2006) found at both
plants that the denitrification rates associated with the
anoxic storage of polyphosphate and the anoxic growth of
PAOs constituted 16–21 % of the denitrification rates
associated with the anoxic activity of ‘‘ordinary’’ hetero-
trophs. This range was very close to the earlier findings of
Hu et al. (2002a) that the specific denitrification rate of
PAOs on internally stored PHB was only about 20 % of the
rate of the ‘‘ordinary’’ heterotrophs on slowly biodegrad-
able COD.
For comparison, the anoxic and aerobic PURs reported
for full-scale BNR activated sludge systems varied in the
range of 1.9–13 and 3.6–30 mg P/(g VSS h), respectively
(Kuba et al. 1997; Sorm et al. 1998; Tuncal et al. 2009;
Puig et al. 2010). In the studies of Tuncal et al. (2009) and
Puig et al. (2010), the observed anoxic and aerobic PURs
were approximately equal; however, the effects of primary
clarification were opposite in those studies. In the former
study, a significant increase in the PURs (by 70 %) was
observed in the line without primary clarification compared
to the line with primary clarification, whereas by-passing
raw wastewater to the biological stage in the latter study
resulted in a small decrease in the PURs (by 15 %), likely
due to the shorter SRT and higher inert fraction in the
sludge.
In the two-phase experiments with the pre-treated
wastewater, the NURs decreased by approximately
22–44 % (anoxic phase), while only 3–22 % reductions
were observed with respect to the OUR measurements
(aerobic phase). The lower reductions in the aerobic phase
resulted from an equal effect of nitrification in both reac-
tors (that process was not affected by the removal of par-
ticulates and colloids) (Tables 2, 3). For comparison,
Tuncal et al. (2009) reported a similar (25 %) reduction for
the NUR measured in the line with primary clarification
compared to the line without primary clarification [1.8 vs.
2.4 mg N/(g VSS h)].
Conventional OUR measurements
In the OUR curves (Fig. 6), the first phase reflects the
primary metabolism of the added substrate (readily and
slowly biodegradable), whereas the second phase implicitly
originates from the utilization of the remaining slowly
biodegradable substrate and/or stored polymers. The
maximum OURs in the first phase varied in the range of
22.8–39.5 and 20.4–21.8 g O2/(kg VSS h), respectively, at
the Wschod and Debogorze WWTP. The differences
between the parallel reactors were reached 20–30 %
(Tables 2, 3). For comparison, Choi and Daehwan (2001)
found that particulate COD contributed to the increase in
total OUR (including nitrification) by approximately 5.5 %
when the particulate COD constituted 65 % of total COD
(50 % of the particulate fraction was estimated to be bio-
degradable). The soluble solution was made of filtered
nightsoil, while the particulate solution was made of settled
wastewater and nightsoil. In another study, Kristensen et al.
(1992) demonstrated that hydrolysis of primary sludge can
produce a broad range of readily biodegradable carbon
sources. The authors concluded this based on the obser-
vation that OURs with hydrolysate (a liquid phase of the
anaerobically hydrolysed primary sludge) as a carbon
source were typically 10–20 % higher compared to the
OURs with acetate.
The heterotrophic yield coefficients, YH, determined
from Eq. 1 based on simultaneous measurements of COD
and oxygen consumptions, are listed in Table 2
(Wschod) and Table 3 (Debogorze). The values of YH
remained in a relatively narrow range at each plant, i.e.
between 0.62–0.67 and 0.68–0.71 g cell COD/g COD,
respectively, at the Wschod and Debogorze WWTP. This
Int. J. Environ. Sci. Technol. (2014) 11:1973–1988 1983
123

may thus suggest that the composition of the settled
wastewater is slightly different at the two studied plants.
The typical values of YH for municipal wastewater,
reported by Henze et al. (1987), were within the range of
0.46–0.69 g cell COD synthetized/g COD removed with
the default value equal to 0.67 g cell COD/g COD used
in the Activated Sludge Model No. 1 (ASM1). A higher
range of YH values (0.72–0.78 g COD/g COD) was
found at the Wschod WWTP with a few external carbon
sources (acetate, ethanol, fusel oil and distilled raw
alcohol). Dircks et al. (1999) proved that the difference
in the YH coefficient could indeed result from the type of
substrate. The reported YH values for the activated sludge
from two studied Danish WWTPs were 0.71–0.72 and
0.66–0.67 g COD/g COD for acetate and ethanol,
respectively.
pH as a control parameter of biochemical processes
in BNR systems
On-line measurements of nutrient concentrations (NH4–
N, NO3–N, PO4–P) are often expensive and difficult in
(a) (b)
(c) (d)
(e) (f)
0
12
24
36
48
0 1 2 3 4 5 6
Time, h
OU
R, m
g O
2/g
VS
S. h
0
45
90
135
180
CO
D, g
O2/
m3
OUR
COD
OUR
Aerobic Phase
0
12
24
36
48
0 1 2 3 4 5 6
Time, h
OU
R, m
g O
2/g
VS
S. h
0
45
90
135
180
CO
D, g
O2/
m3OUR
COD
OUR
7.0
7.5
8.0
8.5
9.0
0 1 2 3 4 5 6
Time, h
pH
Wschod - pH
Debogorze - pH
Aerobic Phase
7.0
7.5
8.0
8.5
9.0
0 1 2 3 4 5 6
Time, h
pH
Wschod - pH (c-f)
Debogorze - pH (c-f)
Aerobic Phase
0
12
24
36
48
0 1 2 3 4 5 6
Time, hO
UR
, mg
O2/
g V
SS
. h0
45
90
135
180
CO
D, g
O2/
m3
0
12
24
36
48
0 1 2 3 4 5 6
Time, h
OU
R, m
g O
2/g
VS
S. h
0
45
90
135
180
CO
D, g
O2/
m3
Fig. 6 Sample results of the conventional OUR measurement in two
parallel reactors during the summer study period at the Wschod
WWTP (T = 20.2 �C): a with the settled wastewater without pre-
treatment (MLVSS = 1.4 kg/m3), b with the settled wastewater after
coagulation–flocculation (MLVSS = 1.2 kg/m3), and during the fall
study period at the Debogorze WWTP (T = 16.0 �C): c with the
settled wastewater without pre-treatment (MLVSS = 2.0 kg/m3),
d with the settled wastewater after coagulation–flocculation
(MLVSS = 1.8 kg/m3), and pH variations at both studied plants:
e with the settled wastewater without pre-treatment, f with the settled
wastewater after coagulation–flocculation
1984 Int. J. Environ. Sci. Technol. (2014) 11:1973–1988
123

use for different full-scale BNR activated sludge sys-
tems. However, according to the literature data (Yu et al.
1997; Lee et al. 2001, Li et al. 2008), the dynamics of
nutrient concentrations can be related with on-line
monitoring of pH. For example, the on-line profile of pH
can accurately detect the ends of PRR, PUR or NH4–N
conversions, and be used as a real-time control parameter
(Lee et al. 2001).
In this study, the pH values observed as a control
parameter at both studied plants remained in the range
7–8 during all the laboratory tests. The pH trends in the
reactors with the settled wastewater without pre-treat-
ment and after coagulation–flocculation were similar.
The pH continuously increased during the conventional
NUR experiments, however, at slower rate at the
beginning of the experiments (during 1 h) when the
PO4–P release was observed (Fig. 3). The calculated
ratios of DpH/DNO3–N varied in the range of 0.91–1.19
and 0.73–1.01 in the settled wastewater without pre-
treatment versus 0.54–1.02 and 0.53–0.76 in the waste-
water after coagulation–flocculation, respectively, at the
Wschod WWTP and the Debogorze WWTP. The pH
variations at both reactors with the settled wastewater
without pre-treatment and after coagulation–flocculation
were similar during the two-phase PRR and anoxic/aer-
obic PUR tests. Sharp decrease in pH was observed at
the beginning of anaerobic phase mainly due to the PO4–
P release. The pH continuously decreases but at slower
rate until the end of phosphate release. Second phase of
PUR tests showed different pH variations between
anoxic and aerobic phase. The calculated ratios of DpH/
DPO4–P varied in the range of 0.23–0.49 and 0.23–0.28
(anoxic), 0.25–0.43 and 0.27–0.48 (aerobic) in the settled
wastewater without pre-treatment versus 0.40–0.50 and
0.44–0.47 (anoxic), 0.33–0.62 and 0.35–0.69 (aerobic) in
the wastewater after coagulation–flocculation, respec-
tively, at the Wschod WWTP and the Debogorze
WWTP. A rapid increase in pH occurred at the begin-
ning of aerobic phase, primarily due to the stripping of
CO2 out of the system. Subsequent decrease in pH in the
aerobic phase was mainly caused by the release of H?
from nitrification. The pH profile reached a typical short
plateau, which might coincide with the end point of
NH4–N conversion to NO3–N and NO2–N (Fig. 5). In
contrast during the anoxic PUR tests, slowly increase in
pH was observed due to significant concentrations of
nitrate (15–20 g N/m3) at the beginning of anoxic phase.
After that occurred rapid increase in pH mainly caused
by anoxic PUR consumed H? in the reactor (Fig. 4). The
calculated ratios of DpH/DNO3–N varied in the range of
0.48–1.09 and 0.55–1.05 in the settled wastewater with-
out pre-treatment versus 0.49–0.88 and 0.55–0.81 in the
wastewater after coagulation–flocculation, respectively, at
the Wschod WWTP and the Debogorze WWTP. No
significant dependence on pH was observed during con-
ventional OUR tests, mainly caused by ATU addition at
the beginning of aerobic phase. The pH value continu-
ously increased but at very slowly rate mostly up to pH
8 until the end of experiment (Fig. 6).
According to the different studies (Yu et al. 1997;
Lee et al. 2001; Li et al. 2008), it has been reported
that nutrient concentrations were related to dynamic
characteristics of on-line pH sensor during different
type of experiments (e.g. SBR, batch tests) carried out
with the mixed liquor from pilot or full-scale BNR
systems. In the activated sludge system examined, the
pH in bulk wastewater should be always in narrow
range 7 and 8. However, the strong pH dependency is
typical for an enzymatic reaction with a maximum
activity around pH 8 and with little activity at pH
values below 6 and above 9 (Li et al. 2008). In this
study, based on pH dynamics, the nutrient removal
processes were estimated during different type of batch
tests carried out with the mixed liquor from full-scale
BNR systems. The pH continuously increased during
the one-phase conventional NUR experiments, however,
at slower rate at the beginning of the experiments
(during 1 h) when the PO4–P release was observed.
During the two-phase PRR and anoxic/aerobic PUR
tests, a significant drop of pH was observed due to the
lack of dissolved oxygen at the early part of anaerobic
phase. In the subsequent anoxic phase, increase in pH
was observed as anoxic phosphate uptake consumed
H?. Subsequently in aerobic phase, pH increased con-
tinuously and reached a relatively constant value when
maximum PUR was ended. The accumulated CO2 from
the respiration activity using the residual dissolved
oxygen might cause the pH decrease at the later part of
aerobic phase. Therefore, the on-line profile of pH can
accurately detect the ends of phosphate release/uptake
activity as well as nitrogen/ammonia conversion, and be
used as a real-time control parameter.
Reported full-scale results on the role of organic
particulates
Tuncal et al. (2009) investigated performances of two
parallel treatment lines operated with and without pri-
mary sedimentation at the Izmir Wastewater Treatment
Plant (WWTP) (Turkey). During the study period (more
than 1 year), the average effluent concentrations of NO3–
N and PO4–P were lower in the line without primary
sedimentation (0.82 g N/m3 and 1.7 g P/m3) compared to
the second line (1.6 g N/m3 and 3.8 g P/m3). The authors
Int. J. Environ. Sci. Technol. (2014) 11:1973–1988 1985
123
attributed these results to two mechanisms. Firstly,
increased organic loading rates, even in the particulate
form, supported survival and proliferation of denitrifying
PAOs. Secondly, sedimentation of particulate solids in
the anaerobic compartments resulted in fermentation of
the settled organic compounds and increased EBPR
performance. Significant effects of primary settling on
denitrification were also observed in the study of Tas
et al. (2009). It was estimated that the particulate COD
fraction removed by primary settling could represent
up to approximately 40 % of the total denitrification
potential of activated sludge systems. It was concluded
that the settleable COD fraction could provide an addi-
tional carbon source in systems where the denitrification
potential associated with the influent becomes rate-
limiting for the denitrification efficiency (Tas et al.
2009).
The contrary findings have been reported in Dutch
studies. Puig et al. (2010) found that by-passing raw
wastewater (27 % of the influent flow) directly to the
biological reactor did not improve effluent quality and
nutrient removal efficiency of the studied plant. The
observed increase in the influent C/N and C/P ratios was
attributed to a high non-biodegradable COD fraction and
particulate compounds with low COD/VSS ratios. van
Veldhuizen et al. (1999) also found that hydrolysis and
fermentation processes did not play a major role in the
overall treatment performance, especially for P removal.
A primary effluent in the studied plant was primarily
composed of soluble COD (46 % of total COD), including
VFAs (30 % of soluble COD). The authors emphasized,
however, that hydrolysis and fermentation processes
would be much more important in the plants fed with
wastewater from aerobic sewers in which the ratio
between soluble and particulate organic material (SS/XS) is
much lower.
Conclusion
In a present work, a novel procedure, based on the
standard batch experiments and pre-treatment of waste-
water sample with coagulation–flocculation, was pro-
posed to evaluate the effects of colloidal and particulate
organic compounds (slowly biodegradable substrate) on
denitrification and EBPR in BNR activated sludge sys-
tems. The colloidal and particulate organic fractions play
important role in enhancing denitrification and EBPR at
the studied WWTPs receiving strong municipal waste-
water. Except for one process (phosphate release), the
removal of these fractions resulted in reduced process
rates. At both studied WWTPs, the observed average
reductions were as follows: 24 and 35 %, respectively,
for the NUR1 and NUR2 during the conventional deni-
trification tests, and 30 % for the NUR during the anoxic
PUR test; 32 % and 25 %, respectively, for the anoxic
and aerobic PURs; 13 % for the average OUR during the
aerobic PUR tests, and 24 % during the conventional
OUR test (maximum measured values). Anaerobic
hydrolysis of slowly biodegradable organic compounds is
slow and generates small amounts of the substrate for
maintenance of PAOs under anaerobic conditions. In
addition to the experimental observations, the results of
such a comparative study can provide a comprehensive
database for calibration and evaluation of dynamic
models of the hydrolysis process. Based on pH dynam-
ics, the nutrient removal processes were estimated during
different types of batch tests carried out with the mixed
liquor from full-scale BNR systems. Therefore, the on-
line profile of pH can accurately detect the ends of
phosphate release/uptake activity as well as ammonia
conversion, and be used as a real-time control parameter.
The observed effects of colloidal and particulate organic
compounds are important in the overall energy balance
of WWTPs. Sedimentation and chemical precipitation in
primary clarifiers for the removal of particulate and
colloidal organic matter should be optimized in terms of
balancing between the efficiency of nutrient removal in
the bioreactor and biogas production in the digester.
Moreover the experimental observations, the results of
such a comparative study can provide a comprehensive
database for calibration and evaluation of dynamic
models of the hydrolysis process.
Acknowledgments This research has been financially supported by
Polish Ministry of Science and Higher Education under the Grant No.
N-523-422-437.
Open Access This article is distributed under the terms of the
Creative Commons Attribution License which permits any use, dis-
tribution, and reproduction in any medium, provided the original
author(s) and the source are credited.
References
APHA (1992) Standard methods for examination of water and
wastewater, 18th edn. American Public Health Association,
Washington, DC
Brdjanovic D, van Loosdrecht MCM, Versteeg P, Hooijmans CM,
Alaerts GJ, Heijnen JJ (2000) Modeling COD, N and P removal
in a full scale WWTP Haarlem Waarderpolder. Water Res
34:846–858
Choi E, Daehwan R (2001) NUR and OUR relationship in BNR
processes with sewage at different temperatures and its design
application. Water Res 35:1748–1756
1986 Int. J. Environ. Sci. Technol. (2014) 11:1973–1988
123

Dircks K, Pind PF, Mosbaek H, Henze M (1999) Yield determination
by respirometry—the possible influence of storage under aerobic
conditions in activated sludge. Water SA 25:69–74
Drewnowski J, Makinia J (2011) The role of colloidal and particulate
organic compounds in denitrification and EBPR occurring in a full-
scale activated sludge system. Water Sci Technol 63(2):318–324
Ekama GA, Dold PL, Marais GR (1986) Procedures for determining
influent COD fractions and the maximum specific growth rate of
heterotrophs in activated sludge systems. Water Sci Technol
18(6):91–114
Goel R, Mino T, Satoh H, Matsuo T (1999) Modeling hydrolysis
processes considering intracellular storage. Water Sci Technol
39(1):97–105
Gori R, Jiang LM, Sobhani R, Rosso D (2011) Effects of soluble
and particulate substrate on the carbon and energy footprint of
wastewater treatment processes. Water Res 18(15):5858–5872
Henze M, Grady CPL Jr, Gujer W, Marais GR, Matsuo T (1987)
Activated sludge model no. 1. Scientific and technical report no.
1. IAWPRC, London
Hu ZR, Wentzel MC, Ekama GA (2002a) The significance of
denitrifying polyphosphate accumulating organisms in biological
nutrient removal activated sludge systems. Water Sci Technol
46(1–2):129–138
Hu ZQ, Chandran K, Smets BF, Grasso D (2002b) Evaluation of a
rapid physical-chemical method for the determination of extant
soluble COD. Water Res 36:617–624
Jimenez JA, La Motta EJ, Parker DS (2005) Kinetics of removal of
particulate chemical oxygen demand in the activated sludge
system. Water Environ Res 77:437–446
Kappeler J, Gujer W (1992) Estimation of kinetic parameters of
heterotrophic biomass under aerobic conditions and character-
ization of wastewater for activated-sludge modeling. Water Sci
Technol 25(6):125–139
Kristensen GH, Jorgensen PE, Henze M (1992) Characterization of
functional microorganism groups and substrate in activated
sludge and wastewater by AUR, NUR and OUR. Water Sci
Technol 25(6):43–57
Kuba T, van Loosdrecht MCM, Heijnen JJ (1997) Biological
dephosphatation by activated sludge under denitrifying condi-
tions: pH influence and occurrence of denitrifying dephospha-
tation in a full-scale waste water treatment plant. Water Sci
Technol 36(12):75–82
Lee DS, Jeon ChO, Park JM (2001) Biological nitrogen removal with
enhanced phosphate uptake in a sequencing batch reactor using
single sludge system. Water Res 35:3968–3976
Li Q, Li P, Zhu P, Wu J, Liang S (2008) Effects of exogenous organic
carbon substrates on nitrous oxide emissions during the denitri-
fication process of sequence batch reactors. Environ Eng Sci
25:1221–1228
Makinia J (2006) Performance prediction of full-scale biological
nutrient removal systems using complex activated sludge
models. Veroffentlichungen des Institutes fur Siedlungswasser-
wirtschaft und Abfalltechnik der Universitat Hannover, Heft
136
Makinia J (2010) Mathematical modelling and computer simulation
of activated sludge systems. IWA Publishing, London
Mamais D, Jenkins D, Pitt P (1993) A rapid physical chemical
method for the determination of readily biodegradable soluble
COD in municipal wastewater. Water Res 27:195–197
Meijer SCF, van Loosdrecht MCM, Heijnen JJ (2001) Metabolic
modeling of full-scale biological nitrogen and phosphorus
removing WWTP’s. Water Res 35:2711–2723
Melcer H, Dold PL, Jones RM, Bye CM, Takacs I, Stensel HD,
Wilson AW, Sun P, Bury S (2003) Methods for wastewater
characterisation in activated sludge modeling. Water Environ-
ment Research Foundation (WERF), Alexandria, VA
Naidoo V, Urbain V, Buckley CA (1998) Characterisation of
wastewater and activated sludge from European municipal
wastewater treatment plants using the NUR test. Water Sci
Technol 38(1):303–310
Orhon D, Sozen S, Ubay E (1994) Assessment of nitrification-
denitrification potential of Istanbul domestic wastewaters. Water
Sci Technol 30(6):21–30
Pagilla KR, Urgun-Demirtas M, Czerwionka K, Makinia J (2008)
nitrogen speciation in the wastewater treatment plant influents
and effluents—the US and Polish case studies. Water Sci
Technol 57(10):1511–1517
Petersen B, Temmink H, Henze M, Isaacs S (1998) Phosphate uptake
kinetics in relation to PHB under aerobic conditions. Water Res
32:91–100
Puig S, van Loosdrecht MCM, Flameling AG, Colprim J, Meijer SCF
(2010) The effect of primary sedimentation on full-scale WWTP
nutrient removal performance. Water Res 44:3375–3384
Roeleveld PJ, van Loosdrecht MCM (2002) Experience with guide-
lines for wastewater characterisation in The Netherlands. Water
Sci Technol 45(6):77–87
Sahlstedt KE, Aurola AM, Fred T (2003) Practical modelling of a
large activated DN-process with ASM3. In: Proceedings of the
9th IWA specialized conference on design, operation and
economics of large wastewater treatment plants, Ruzickova I,
Wanner J (eds) 1–4 September 2003, Prague (Czech Republic),
141–148
Siegrist H, Salzgeber D, Eugster J, Joss A (2008) Anammox brings
WWTP closer to energy autarky due to increased biogas
production and reduced aeration energy for N-removal. Water
Sci Technol 57(3):383–388
Sorm R, Bortone G, Wanner J, Tilche A (1998) Behaviour of
activated sludge from a system with anoxic phosphate uptake.
Water Sci Technol 37(4–5):563–566
Tas DO, Karahan O, Insel G, Ovez S, Orhon D, Spanjers H (2009)
Biodegradability and denitrification potential of settleable chemical
oxygen demand in domestic wastewater. Water Environ Res
81:715–727
Tuncal T, Pala A, Uslu O (2009) Importance of particulate biodegradable
organic compounds in performance of full-scale biological phos-
phorus removal system. Water Environ Res 81:896–906
Tykesson E, Aspegren H, Henze M, Nielsen PH, Jansen JL (2002)
Use of phosphorus release batch tests for modelling an EBPR
pilot plant. Water Sci Technol 45(6):99–106
Uan DK, Yeom IT, Arulazhagan P, Rajesh Banu J (2013) Effects of
sludge pretreatment on sludge reduction in a lab-scale anaerobic/
anoxic/oxic system treating domestic wastewater. Int J Environ
Sci Technol 10(3):495–502
Ubukata Y (2005) Role of particulate organic matter and acetic acid for
phosphate removal in anaerobic/aerobic activated sludge process.
In: Proceedings of the IWA specialized conference ‘‘nutrient
management in wastewater treatment processes and recycle
streams’’, 19–21 September 2005, Cracow (Poland), 183–192
Int. J. Environ. Sci. Technol. (2014) 11:1973–1988 1987
123
van Veldhuizen HM, van Loosdrecht MCM, Heijnen JJ (1999)
Modelling biological phosphorus and nitrogen removal in a full
scale activated sludge process. Water Res 33:3459–3468
Yu R-F, Liaw S-L, Chang C-N, Lu H-J, Cheng WY (1997)
Monitoring and control using on-line ORP on the continuous-
flow activated sludge batch reactor system. Water Sci Technol
35(1):57–66
Yuan Q, Oleszkiwicz J (2008) Interaction between denitrification and
phosphorus removal in a nutrient removing SBR system. In:
Proceedings of the 81st annual WEF technical exhibition and
conference, 18–22 October 2008, Chicago (USA), 43–54
1988 Int. J. Environ. Sci. Technol. (2014) 11:1973–1988
123