
Big Data application to predict macroeconomic indicators - Statswork

..
4 The robustnessof macroeconomicindicatorsof capital mobility
ENRIQUE G. MENDOZA
1 Introduction
Financial capital has become highly mobile across countries as a result ofthe gradual globalisation of financial markets that followed from wide-spread deregulation and innovations in communication and transactiontechnologies in recent years. This development has renewed interest in thedebate on the implications and measurement of international capitalmobility. The controversial work of Feldstein and Horioka (1980) initi-ated the new stage of this debate by arguing that, because savings andinvestment are positively correlated, additions to savings are primarilyallocated to the domestic economy, and hence there is little evidence ofthe arbitrage in world financial markets that the neoclassical paradigmpredicts. These results raised doubts as to whether the efficiency andwelfare gains, on the basis of which international financial deregulationwas introduced, would materialise.
Further empirical work established the robustness of positive savings-investment correlations in time-series and cross-sectional studies forindustrial and developing countries (see, for example, Dooley, Frankeland Mathieson, 1987; Tesar, 1991; Bayoumi and Sterne, 1992; Montiel,1992;and Chapter IV of the May 1991 issue of World Economic Outlook(International Monetary Fund, 1991a). At the same time, however, thetheoretical literature casts doubts on whether this stylised fact could beregarded as an indicator of the degree to which capital moves acrosscountries (see Obstfeld, 1986; Zeira, 1987; Summers, 1988; Finn, 1990;Sinn, 1991). Simulations of dynamic stochastic equilibrium modelsdemonstrated that, given productivity or terms of trade shocks of themagnitude observed in the data, these models mimic the same positiverelationship between savings and investment that characterises actualeconomies (Mendoza, 1991a, 1992; Baxter and Crucini, 1993). The con-troversy surrounding savings-investment correlations motivated other
83

84 Enrique G. Mendoza The rob~tness of macroeconomicIndlcaton of capital mobility 8S
"I
Investment (closed economy) Y"C,
econometric tests used to study them. Consider the case of the savings-investment correlations. The empirical work advocating the use of thisstatistic as an indicator of capital mobility is based on the well-knownneoclassical model of savings, originally developed in the pioneeringwork of Irving Fisher (J930) and illustrated in Figure 4.1. In a closedeconomy, savings and investment are identical and they are determined atthe point where the indifference curve between consumption in twoperiods is tangent to the production possibilities frontier of output in twoperiods (point A). In contrast, when capital is mobile across countries,and households and firmsare free to borrow and lend in world markets atthe real interest rate r., savings and investment decisions are separated(points B and C). Investment and savings thus move together whencapital is not mobile across countries, and hence the rationale for arguingthat positive savings-investment correlations are evidence against capitalmobility. Nevertheless, this statement is strictly correct only in a determi-nistic, or perfect-foresight, framework, and is only a rough first approxi-mation in a stochastic economy. Under uncertainty, the marginal productof capital and the world's real interest rate are not equalised exactly eachperiod; there is, instead, an equality that holds in terms of an expectedvalue in which the return of foreign and domestic capital is weighted bythe marginal utility of consumption in each state of nature. Shifts in eitherthe indifference curve or the production possibilities frontier in Figure4.1, given the agents' desire to smooth consumption, could result inmovements of investment that coincide with movements in savings.Moreover, even in a deterministic setup, positive comovement betweensavings and investment could emerge as a result of population growth ortechnological change (Obstfeld, 1986).The best approach to determine whether positive savings-investment
correlations, as well as other macroeconomic indicators, are robust indi-cators of capital mobility under uncertainty is to impose a rigorous linkbetween theoretical and empirical work. At the same time, however,deriving the quantitative implications of the intertemporal equilibrium,stochastic framework that has dominated the analytical work in this areain recent years is not straightforward. It is only under particular con-ditions that this framework produces closed-form solutions from whichthe properties of macroeconomic indicators can be derived and testedusing available economic methods. An alternative, proposed by Obstfeld(1989), is to look for evidence that the optimality conditions, or Eulerequations, that characterise consumption behaviour in an intertemporalmodel of integrated economies hold, instead of trying to extract infor-mation from macroeconomic indicators. Another alternative is toexamine a dynamic stochastic model by using numerical methods to
.u.:.;-
Slope= -(I + r*)
I
Il;
VI
Investment (open economy)
Trade-balance deficitI
IFigure4.1 The neoclassicalmodelof Investment
researchers to focus on alternative indicators of capital mobility, such asthe degree of consumption smoothing, the differential in asset returns,and the variability of investment, but the interpretation of these indica-tors has also been a controversial subject (seeObstfeld, 1986,1989;Sachs,1982;Frankel, 1992;Razin and Rose, 1992).Moreover, direct measuresof financial capital flows and international portfolio diversification havealso added to the debate by showing that, despite heavy trading ininternational financial markets, there is a significant home bias in port-folio allocation (seeTesar and Werner, 1992).Perhaps the key element in the debate on the theory and measurement of
capital mobility is the connection between the analytical framework fromwhich indicators of capital mobility are obtained and the design of the
~.-._..

86 EnriqueG. Mendoza
determine how capital mobility affects the behaviour of macroeconomicvariables in general equilibrium. This is the approach proposed here.This chapter examines various indicators of capital mobility in a sto-
chastic intertemporal equilibrium model of a small open economy. Thechapter derives the quantitative implications of the model - i.e., theproperties of the equilibrium stochastic processes that characterise themodel - and examines which of the model's empirical regularities arebetter indicators of capital mobility. In contrast with previous work, theexercisedoes not aim to show whether the data fit a specificprediction ofthe model, but rather to create macroeconomic time series for a modeleconomy that mimic some properties of actual business cycles, and thento explore the implications of varying the degree of capital mobility on thestylised facts commonly used as measures of capital mobility.The analysis shows that, for several simulations conducted using a set of
reasonable preference and technology parameters, the macroeconomicindicators of capital mobility are not informative. In particular, savings-investment correlations do not provide information about the degree ofcapital mobility if the magnitude or the persistence of income disturb-ances changes; consumption variability is not very sensitive to the degreeof integration of financial markets; and the stylised facts of investment arerobust indicators of capital mobility only in cases in which capital con-trols are very tight. Most of the indicators are as equally sensitive todifferences in structural parameters as to differences in the degree ofmobility. Moreover, there is no evidence that preventing agents fromaccessing world capital markets limits their ability to smooth consump-tion significantly, suggesting that capital mobility may be difficult todetermine using Euler equation tests. These results are consistent with theanalytical work of Cole and Obstfeld (1991), the findings of the cross-country analysis undertaken by Razin and Rose (1992), and the simu-lation analysis of Mendoza (199Ib) and Baxter and Crucini (1992).The chapter is organised as follows. Section 2 describes the model, the
parameter specification, and the numerical solution method. Section 3compares the model's equilibrium comovements with the stylised facts ofpost-war business cycles in Canada and Mexico. Section 4 examines theperformance of the different measures of capital mobility. Section 5drawssome conclusions.
The robustnessor macroeconomicIndicators or capital mobility 87
Greenwood (1983) and other (see Frenkel and Razin, 1987 for a com-prehensive literature review), with the modification that it incorporatesstochastic disturbances affecting productivity or the terms of trade - as inthe small open economy real business-cycle models of Mendoza (199Ia)and Correia, Neve8and Rebelo (1991).
1.1 Produclion lechnology andfinancial siruciure
Firms in the economy produce tradable goods using the following tech-nology:
G(K" L"Kt+') = exp(e,)Kr L} -0 - (~)(K,+. - K,)2,
0< a < I, ~ > 0, (I)
2 The model
The model described here is the standard prototype of the intertemporalequilibrium framework for the small open economy developed by Obst-feld (1981), lIelpman and Razin (1982), Svensson and Razin (1983),
where L, is labour services, K, is the capital stock, e, is a random shockaffecting productivity or the terms of trade,' and (~/2)(Kt+' - K,)2 is thecost of adjusting the capital stock.2 The law of motion for capital is
Kt+,=(I-I5)K,+I" Osl5sl, (2)
where I, is gross investment and 15the rate of depreciation.There are three representations of financial markets in the model that
correspond to regimes with different degrees of capital mobility. In aregime of perfect mobility, households and firms exchange one-periodnoncontingent bonds, A" that pay the real interest rate r., with the rest ofthe world in a competitive international capital market.3 Net holdings offoreign assets evolve according to
A,+ I = TB, + A,(l + r.), (3)
where TB, is the balance oftrade.4 In a regimeof limited capital mobility,the accumulation of foreign assets faces binding constraints for somestates of nature. Thus, in every period:
AI s At+ I S Ah (4)
where A"(AI)is a constant lower (higher) than the stock of foreign assetsagents would optimally choose to hold under perfect capital mobility insome states of nature. When the constraints are not binding, net foreignassets evolve as in the case of perfect mobility and (4) can be replaced by(3). Finally, in a regime that forcefully obstructs capital mobility byimposing strict capital controls, the range just described collapses into aconstraint on foreign asset accumulation that is always binding:
At+1= A. (5)

88 Enrique G. Mendoza
In this case, At+I = A for alii and the balance of trade is TB,= - r.A.The resource constraint states that the sum of consumption, C" invest-
ment, and the balance of trade cannot exceed output net of adjustmentcosts:
The robustness or macroeconomic Indicators or capital molJlllty 89
C, + I, + TB, s exp(e,)KrLl-o - (*) (Kt+ I - K,)2.(6)
(199Ia) and Imrohoroglu (1989),Ponzi-type schemesin regimesof perfector limited capital mobility are ruled out by imposing an upper bound ondebt,A, ~ A for alii, where A is a negative constant. If A is small enough,the limiting probability of approaching the debt ceiling becomes infini-tesimally small. The time-recursive nature of SCU, together with thesimplifieduncertainty environment described later, implies that the equi-librium of the economy with perfect capital mobility can be characterisedby the following stochastic dynamic programming problem:
{(
£",
)(I-Y)
C--!. -IV(K"A"e;) =max ' 00
1-}'
+ CXP[ -Pln(1+C,- :)][~ ...,Y(K.. "A..,,<:+,)J}. (10)subjectto
C, = exp(e,)QKr[JI-O) - (* )(Kt+ 1- K,)2- Kt+I
+ K,(I - 15)+ (I + r.)A, - At+..
2.2 Preferences
Households are all identical and infinitely-lived.They allocate C, and L,intertemporally so as to maximise stationary cardinal utility
(SCU):S
U = EL~ {U(C,- G(L,»exp(- :~ v(C.- G(L.»)}]. (7)The instantaneous utility and time-preference functions are:
[
L"'
]
(I-Y)
C,- -!.u(C,- G(L,»= 00 - I
'-}'00>1, }'>I, (8)
v(C,- G(L,»=Pln( 1+ C,- ~), P>O. (9)
As in Greenwood, Hercowitz and Huffman (1988), (8) and (9) aredefined in terms of a composite good described by consumption minus thedisutility of labour. The marginal rate of substitution between C and Lisa function of the latter only, and hence labour is independent of thedynamics of consumption. This facilitates the quantitative analysis at thecost of neutralising the wealth effect on labour. Labour supply is deter-mined by a condition that equates the marginal product of labour with themarginal disutility of providing labour services, independently of themarginal utility of consumption. This implies that the labour supplychoice can be separated from optimal consumption plans in the dynamicprogramming problem described below.
£, = argmax(L,){exp(e,)/G'1.11-0)- ~},
A, ~ A, K, ~ 0, L, ~ 0, and C, ~ O.
Once parameter values for preferences, technology, and the shocks aredetermined, this problem is solved numerically by making use of analgorithm that iterates on the value function and the state-transitionprobability matrix using discrete grids to represent the state space.6 Thisexact-solution algorithm requires that the dimension of the model's statespace be minimised, and hence it often allows only for simple character-isations of the stochastic shocks. In this case, income disturbances areassumed to follow a two-point, symmetric Markov chain. Thus, in everyperiod the shocks take one of two values:
e,E E = {el,e2}. (II)
One-step conditional transition probabilities, denoted as n", satisfy theconditionsthat 0 S n.,S I and n.1+ n.2= I for s,r = 1,2.The symmetryconditions are nil = n22 =nand el = - e2 = e. These conditions simplifythe analysis by making the asymptotic standard deviation, u" and thefirst-order autocorrelation coefficient, p~, of the shocks equal to e and2n - I respectively.The first-order conditions describing optimal intertemporal plans under
2.3 The dynamicprogrammingproblemand Ihesolution lechnique
Optimal intertemporal plans involve selecting, at each date I, K,+.. A,+..C, and L" given the state of the economy determined by K" A, and e,.Theusual nonnegativity restrictions on C, K and L, apply and optimal plansmust also be consistent with intertemporal solvency. As in Mendoza
90 EnriqueG. Mendoza
perfect capital mobility have the usual interpretation, although with thecaveat that changes in current consumption affect the rate of time prefer-ence at which future consumption is discounted. From the perspective ofany period I, optimal savings are set so as to equate the stochasticmarginal rate of substitution between C, and CI+ I with the gross real rateof return on foreign assets I + r*. Optimal investment is set so as toequalise the expected values of the returns on capital and foreign assets,taking risk factors into account by weighting each possible occurrence ofthe marginal product of capital by the marginal utility of consumption ineach state of nature. Fisherian separation thus holds as a rough approxi-mation; investment is governed by an optimal portfolio allocation deci-sion that equates the returns on alternative assets, and savings are deter-mined by the desire to smooth consumption given its fixed inlerlemporalrelativeprice. Any need for savingsnot covered by investment in domesticcapital is covered by borrowing or lending in world capital markets.
The robustness of macroeconomic Indicators of capital mobility 91
I!,."
2.4 Parameler valuesand calihralion
Two sets of parameter values are defined so as to duplicate some of theempirical regularities that characterise business cycles in Canada andMexico.Canada is viewedas a typical small open economy because oflherelatively small set of capital controls in place and the high degree ofintegration of Canada's financial markets with those of the United States.Data for Mexico are examined to provide some evidence on the stylisedfacts of businesscycles in middle-income developing countries which actas price takers in world markets.The values of the parameters y (coefficientof relative risk aversion), w (I
plus the inverse of the intertemporal elasticity of substitution in laboursupply), a (capital's share in output), J (depreciation rate), P (the con-sumption elasticity of the rate of time preference), Q (efficiencyconstant),and r. (the world's real interest rale), are selected using long-run averagesof actual data, the restrictions imposed by the deterministic steady-stateequilibrium of the model, and also by approximating some of the esti-mates obtained in the relevant empirical literature. The values of theparameters are as follows:
Canada: a = 0.32,Q= 1.0,J = 0.1,r. = 0.04,w = 1.455,y = 1.6,P= 0.11,~ = 0.023,Pr= 0.41, and Ur= 1.285%.
The value of a is set as I minus the ratio of labour income to nationalincome at factor prices. The efficiencyparameter Q is a scale variable thatdoes nol affect equilibrium covariances in the model, but it is used forconsistency to correct for relative economy size given the Cobb-Douglastechnology and the fact that income per capita in Mexico, adjusted forpurchasing power, is one-quarter of that in Canada. d is the usual 10%depreciation rate of real business-cycle models. r. at 4% is the realinterest rate for the US economy in Prescott (1986).w for both countriesis in the range of estimates discussed in Greenwood, Hercowitz andHuffman (1988)and Mendoza (199Ia). y is set following Prescott's (1986)observation that y is not much higher than I, which is in line with some ofthe existing econometric evidence (see Ilansen and Singleton, 1983),andtaking into account that agents in developing countries seem to be morerisk averse (see Os try and Reinhart, 1992). p is determined by the steady-state equilibrium condition, considering that the post-war average of theratio of net foreign interest payments to output, r. AI Y, is 1.9% forCanada and 2.5% for Mexico. ~,Pr, and Urare calibration parameters setto mimicU/,p,.,and uy respectivelyas observed in Canada and Mexico forthe post-war period (see Table 4.1 on p. 92).
(12)
3 The modeland the stylised facts
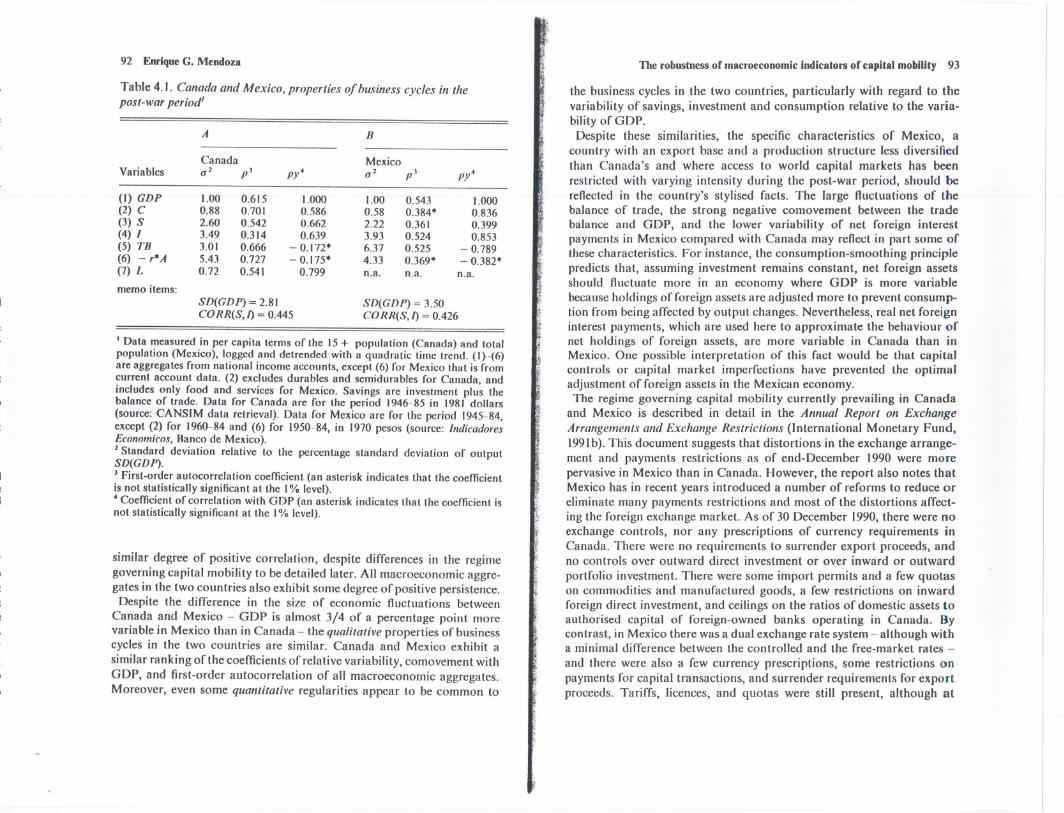
This section establishes how useful the model proposed in the previoussection is as a framework to model the implications of capital mobility, bycomparing the properties of business cycles in the model with thoseobtained from Canadian and Mexican data. The data correspond toannual observations for the periods 1946to 1985for Canada and 1945to1984for Mexico, expressed in per capita terms of the population olderthan 15years, transformed into logarithms and detrended with a quadra-tic time trend. The statistical moments for the relevant macroeconomictimes series are reported in Table 4.1.Table 4.1 shows that business-cycle facts in Canada and Mexico are
consistent with those observed in other industrial and developing coun-tries (see Backus and Kehoe, 1992;Mendoza, 1992)and do not contradictthe basic implications of a consumption-smoothing, intertemporal frame-work. In terms of standard deviations relative to the standard deviation ofGDP, consumplion is the leasl variable of all macroaggregates, whilesavings, investment, and the balance of trade are more variable thanoulput. Regarding the coefficients of correlation with GDP, consump-lion, savings and investment are procyclical, while the trade balance andreal net foreign interest payments are countercyclical or almost uncorre-lated wilh GDP. In bolh countries savings and investment exhibit a
. I.iiI
, ill,'I
:1
Mexico: a = 0.64,Q = 0.507, J = 0.1, r. = 0.04,w = 1.113, y = 2.3, P = 0.56, ~ = 0.029,Pr = 0.17, and Ur= 2.00%. (13)
92 Enrique G. Mendoza
Table 4.1. Canada and Mexico. properties of business cycles in thepost-war period'
I Data measured in per capita terms of the 15+ population (Canada) and totalpopulation (Mexico), logged and detrended with a quadratic time trend. (1}-(6)are aggregates from national income accounts, except (6) for Mexico that is fromcurrent account data. (2) excludes durables and semidurables for Canada, andincludes only food and services for Mexico. Savings are investment plus thebalance of trade. Data for Canada are for the period 1946-85 in 1981 dollars(source: CANSIM data retrieval). Data for Mexico are for the period 1945-84,except (2) for 1960-84 and (6) for 1950-84, in 1970 pesos (source: IndicadoresEconomicos, Banco de Mexico).2 Standard deviation relative to the percentage standard deviation of outputSD(GDP).J first-order autocorrelation coefficient (an asterisk indicates that the coefficientis not statistically significant at the I% level).· Coefficient of correlation with GDP (an asterisk indicates that the coefficient isnot statistically significant at the I% level).
similar degree of positive correlation, despite differences in the regimegoverningcapital mobility to be detailed later. All macroeconomic aggre-gates in the two countries also exhibit some degree of positive persistence.Despite the difference in the size of economic fluctuations between
Canada and Mexico - GDP is almost 3/4 of a percentage point morevariable in Mexico than in Canada - the qualitativeproperties of businesscycles in the two countries are similar. Canada and Mexico exhibit asimilar ranking of the coefficientsof relativevariability, comovement withGDP, and first-order autocorrelation of all macroeconomic aggregates.Moreover, even some quantitative regularities appear to be common to
The robustness or macroeconomic IndIcators or capItal mobility 93
the business cycles in the two countries, particularly with regard to thevariability of savings, investment and consumption relative to the varia-bility of GDP.Despite these similarities, the specific characteristics of Mexico, a
country with an export base and a production structure less diversifiedthan Canada's and where access to world capital markets has beenrestricted with varying intensity during the post-war period, should bereflected in the country's stylised facts. The large fluctuations of thebalance of trade, the strong negative comovement between the tradebalance and GDP, and the lower variability of net foreign interestpayments in Mexico compared with Canada may reflect in part some ofthese characteristics. For instance, the consumption-smoothing principlepredicts that, assuming investment remains constant, net foreign assetsshould fluctuate more in an economy where GDP is more variablebecause holdings of foreign assets are adjusted more to prevent consump-tion from being affected by output changes. Nevertheless, real net foreigninterest payments, which are used here to approximate the behaviour ofnet holdings of foreign assets, are more variable in Canada than inMexico. One possible interpretation of this fact would be that capitalcontrols or capital market imperfections have prevented the optimaladjustment of foreign assets in the Mexican economy.The regime governing capital mobility currently prevailing in Canada
and Mexico is described in detail in the Annual Report on ExchangeArrangementsand Exchange Restrictions (International Monetary Fund,199Ib).This document suggests that distortions in the exchange arrange-ment and payments restrictions as of end-December 1990 were morepervasivein Mexico than in Canada. However, the report also notes thatMexicohas in recent years introduced a number of reforms to reduce oreliminate many payments restrictions and most of the distortions affect-ing the foreign exchange market. As of 30 December 1990,there were noexchange controls, nor any prescriptions of currency requirements inCanada. There were no requirements to surrender export proceeds, andno controls over outward direct investment or over inward or outwardportfolio investment. There were some import permits and a few quotason commodities and manufactured goods, a few restrictions on inwardforeign direct investment, and ceilings on the ratios of domestic assets toauthorised capital of foreign-owned banks operating in Canada. Bycontrast, in Mexico there was a dual exchange rate system - although witha minimal difference between the controlled and the free-market rates -and there were also a few currency prescriptions, some restrictions onpayments for capital transactions, and surrender requirements for exportproceeds. Tariffs, licences, and quotas were still present, although at
A B-
Canada MexicoVariables q2 pJ py. q2 pJ py.
(I) GDP 1.00 0.615 1.000 1.00 0.543 1.000(2) C 0.88 0.701 0.586 0.58 0.384. 0.836(3) S 2.60 0.542 0.662 2.22 0.361 0.399(4) I 3.49 0.314 0.639 3.93 0.524 0.853(5) TB 3.01 0.666 - 0.172. 6.37 0.525 - 0.789(6) - r.A 5.43 0.727 - 0.175. 4.33 0.369. - 0.382.(7)L 0.72 0.541 0.799 n.a. n.a. n.a.memo items:
SD(GDP) = 2.81 SD(GDP) = 3.50CORR(S,I) = 0.445 CORR(S,I) = 0.426

94 Enrique G. Mendoza The robustnessof macroeconomicIndlcaton of capital mobility 95
Table 4.2. Canada and Mexico, properties of business cycles in artificialeconomies'
Figure 4.2 Limiting distribution of capital and foreign assets
in the case of Canada to capture the ergodic set of foreign assets, and then
adjusting them gradually until the ratio of the standard deviation of netfactor payments to the standard deviation of GDP in the model matchesthat observed in Mexican data (4.3%).The properties of business cycles in the simulation models representing
Canada and Mexico are listed in Table 4.2, and the joint marginal limiting
probability distribution of capital and foreign assets in the Canadianbenchmark model is depicted in Figure 4.2. Figure 4.2 illustrates clearlyhow the borrowing constraint is not binding in the stochastic steady state,so that intertemporal solvency is an equilibrium outcome. The statisticalmoments reported in Table 4.2 can be compared with the correspondingmomentsobtainedfromactualdata reported in Table4.1.In general,themodel with perfect capital mobility mimics many of the Canadianbusiness-cycle facts - including the positive correlation between savingsand investment - except the GDP correlations of consumption andsavings, and the first-order autocorrelations of investment and thebalance of trade. As shown in Mendoza (1992), the assumption that the
intertemporal relative price of aggregate consumption remains fixed atI + r* is too strong, and a more realistic structure that decomposesconsumption in tradable and nontradable goods would resolve theseanomalies.The modelcalibratedto the Mexicaneconomyis lesssuccessful,but is
still capable of mimicking some important stylised facts. Qualitatively,the modelis consistentwith the data in indicating that savings,invest-ment, and net foreign interest payments are more variable than output,while consumption is less variable. Moreover, consumption, savings, and
I Standard deviation relative to the percentage standard deviation of outputSD(GDP).2 First-order autocorrelation coefficient.3 Coefficient of correlation with GDP.
much lower levels than in the past. Important restrictions also remainedon foreign direct investment, including portfolio investment, but a majorreform in this area was introduced in May 1989.We turn nowto examinethe abilityof the modelto explainthe stylised
facts of business cycles in Canada and Mexico. The first step is todeterminewhichof the three assumptionsabout capitalmobilityismostadequate.Giventhehistoricalrecordoncapitalcontrolsand accessibilityto external financing of each country, a reasonable first approximation isto assume that Canada conforms to the view of an economy that hasenjoyed free trade in financial assets for most of the post-war period,while Mexico is best characterised as an economy where some capitalcontrols have been in place and access to foreign loans has not alwaysbeenon competitiveterms.Theseassumptionsimplythat, for Canada,equation (3) describes the evolution of foreign assets, with,d set at - 1.14as the upper bound on foreign debt. This limit on external borrowingensures intertemporal solvency, but is not binding inside the ergodic set offoreign assets in the stochastic steady state. For Mexico, equation (4) isthe law of motion of foreign assets, with bindingupper and lower boundsset at - 0.30and - 0.16respectively.Theseboundsweredeterminedbystarting from non-binding limits under perfect capital mobility, definedas
A B-
Canada MexicoVariables 0" p2 py3 0" p2 py3
(I) GDP 1.00 0.614 1.000 1.00 0.520 1.000(2) C 0.76 0.688 0.943 0.93 0.689 0.931(3) S 2.01 0.602 0.923 1.20 0.437 0.952(4) I 3.57 - 0.045 0.554 3.41 -0.166 0.433(5) TB 0.98 0.039 0.009 1.38 - 0.220 - 0.092(6) - ,.A 5.58 0.971 - 0.046 4.04 0.859 - 0.063(7) L 0.69 0.614 1.000 0.89 0.520 1.000
memo items:SD(GDP) = 2.81 SD(GDP) = 3.59CORR(S,I) = 0.585 CORR(S,I) = 0.508

96 Enrique G. Mendoza The robustness or macroeconomic Indicators or capital mobility 97
Following these arguments, the empirical literature on capital mobilityhas identified the following stylised facts as indicators of reduced capitalmobility in time-seriesor cross-sectional studies (see Montiel, 1992;Razinand Rose, 1992):(1) an increase in the savings-investment correlation,(2) an increase in the variability of output, (3) an increase in the variabi-lity of consumption relative to output, (4) a decrease in the variability ofinvestment relative to output, (5) a decrease in the variability of netforeign interest payments relative to output, and (6) an increase in thecorrelation between investm~nt and output. The problem with thesemacroeconomic indicators, as the analysis that follows shows, is that theFisherian separation argument on which they are based applies strictlyonly in a deterministic framework, or in tightly-controlled experimentsbased on stochastic models. Once stochastic elements are taken intoaccount, Fisherian separation holds only as a first approximation and thevariability and persistence of exogenous shocks affects the performanceof the indicators even if the regime of capital mobility is unchanged. Incross-sectional studies, this problem is compounded by differences inpreference and technology parameters across countries which also affectthe behaviour of the indicators.The performance of the above-mentioned indicators of the international
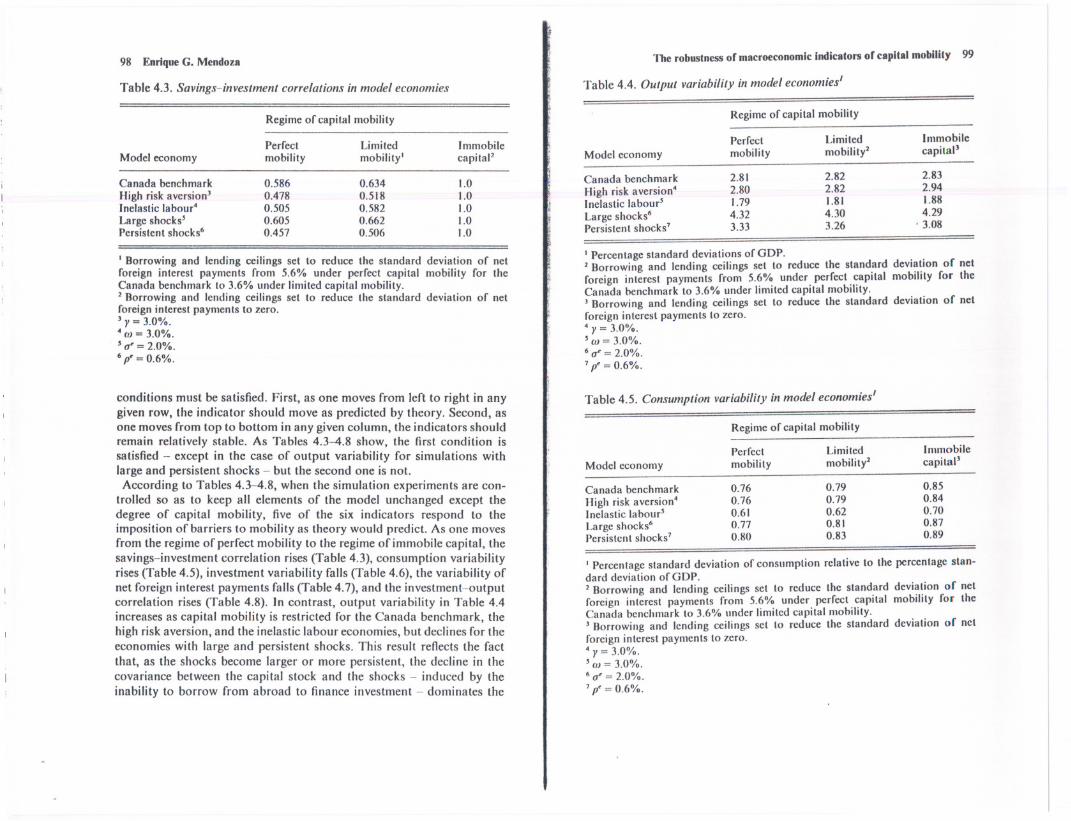
mobility of capital is examined next by undertaking a series of experi-ments in which the model is simulated under alternative regimesof capitalmobility and alternative parameter specifications. The benchmark for theanalysis is the model parameterised and calibrated to Canadian data.Table 4.3 reports simulated savings-.investmentcorrelations that corres-pond to each of the three regimesof capital mobility discussedin section 2under five different parameter scenarios; the benchmark model forCanada, an economy with higher risk aversion (y = 3),an economy wherelabour supply is relatively inelastic (co= 3),an economy where incomedisturbances are larger (0'.= 2%), and an economy where income disturb-ances are more persistent (p =0.6). Limited capital mobility is defined asa regime under which capital controls force the variability of net foreigninterest payments relative to output to decline from 5.6%, as observedunder perfect mobility, to 3.6%. Under immobile capital the relativevariability of net foreign interest payments to output is set to zero. Tables4.4-4.8 list the estimatesthat the same set of simulations produce for otherindicators of capital mobility (output variability, consumption variabi-lity, investment variability, interest payments variability, and investment-output correlations). Tables 4.3-4.8 are designed so that rows representalternative specificationsof preference parameters and exogenous incomedisturbances, while columns represent alternative regimes of capitalmobility. "'or a particular indicator of capital mobility to be robust. two
investment are procyclical, and the trade balance and foreign interestpayments are countercyclical, in the model as in the data. By contrast,some large quantitative discrepancies between moments in the model andin the data are observed. The only moments in the model that mimicclosely moments in actual data are the standard deviations of investmentand net foreign interest payments, the persistence of savings, and thecorrelation betweensavings and investment. However, there may be someproblems of measurement error with the Mexican data. Some of thecoefficientsof persistence and GDP correlation calculated with these dataare not statistically significant. as noted in Table 4.1, and consumption isdefined as personal expenditures on food and services because data onnondurables consumption are not available before 1980.To conclude, the comparison of Tables 4.1 and 4.2 suggests that the inter-
temporal equilibrium model proposed in section 2 rationalises several ofthe stylised facts of business cycles in Canada and Mexico. The modelcannot mimicall the stylisedfacts, particularly for the caseof Mexico, but ityieldssavingsplans that embody a pattern of consumption smoothing andallocations of domestic capital and foreign assets similar to that present inthe data. The model may thus be viewedas a useful benchmark for evaluat-ing the performance of indicators of capital mobility.
4 MacroeconomicIndicators of capital mobility
The extensive literature devoted to measuring capital mobility using dataon macroeconomic fJowsis based on two generalisations of the principleof Fisherian separation of savings and investment already discussed.First. because in an open economy with perfect mobility investment is setto equalise the return on domestic and foreign capital independently ofconsumption-smoothing considerations, savings and investment shouldbe uncorrelated. Second, because agents make use of the availablevehicles of savings to smooth consumption, the variability of consump-tion relative to output should decline as the degree of capital mobilityincreases, reflecting the enhanced consumption-smoothing opportunitiesprovided by world capital markets. These two arguments also imply thatinvestment should be more variable and less correlated with output whencapital is more mobile, because the resources needed to expand the capitalstock according to optimal investment plans can be obtained from worldmarkets and because the influence of consumption-smoothing on thoseinvestment plans is reduced.7 Moreover, the variability of net foreigninterest payments relative to output should decrease with the impositionof barriers to capital mobility reflecting suboptimal adjustments in thecurrent account.
98 EnriqueG. Mendoza
Table 4.3. Savings-investment correlations in model economies
The robustness or macroeconomic Indicators or capital mobility 99
Table 4.4. Output variability in model economies'
Regime of capital mobility Regime of capital mobility
Canada benchmarkHigh risk aversion]Inelastic labour'Large shocks'Persistent shocks6
0.5860.4780.5050.6050.457
0.6340.5180.5820.6620.506
1.01.01.01.01.0
Model economyPerfectmobility
Limitedmobility'
ImmobilecapitaP
I Borrowing and lending ceilings set to reduce the standard deviation of netforeign interest payments from 5.6% under perfect capital mobility for theCanada benchmark to 3.6% under limited capital mobility.2 Borrowingand Icndingceilingsset to reduce the standard deviationof netforeign interest payments to zero.) )' =3.0%.'w= 3.0%.'~=2.0%.6p' = 0.6%.
I Percentage standard deviations of GDP.2 Borrowingand lendingceilingsset to reduce the standard deviationor netforeign interest payments from 5.6% under perfect capital mobility for theCanada benchmark to 3.6% under limited capital mobility.] Borrowing and lending ceilings set to reduce the standard deviation of netforeign interest payments to zero., )'= 3.0%.'w= 3.0%.6~= 2.0%.7p' = 0.6%.
conditions must be satisfied. First, as one moves from left to right in anygiven row, the indicator should move as predicted by theory. Second, asone moves from top to bottom in any given column, the indicators shouldremain relatively stable. As Tables 4.3-4.8 show, the first condition issatisfied - except in the case of output variability for simulations withlarge and persistent shocks - but the second one is not.According to Tables 4.3-4.8, when the simulation experiments are con-
trolled so as to keep all elements of the model unchanged except thedegree of capital mobility, five of the six indicators respond to theimposition of barriers to mobility as theory would predict. As one movesfrom the regime of perfect mobility to the regime of immobile capital, thesavings-investment correlation rises (Table 4.3), consumption variabilityrises (Table 4.5), investment variability falls (Table 4.6), the variability ofnet foreign interest payments falls (Table 4.7), and the investment-outputcorrelation rises (Table 4.8). In contrast, output variability in Table 4.4increases as capital mobility is restricted for the Canada benchmark, thehigh risk aversion, and the inelastic labour economies, but declines for theeconomies with large and persistent shocks. This result reflects the factthat, as the shocks become larger or more persistent, the decline in thecovariance between the capital stock and the shocks - induced by theinability to borrow from abroad to finance investment - dominates the
Table 4.5. Consumption variability in model economies'
Regime of capital mobility
I Percentagestandarddeviationof consumptionrelativeto thepercentagestan-dard deviation of GDP.2 Borrowing and lending ceilings set to reduce the standard deviation of netforeign interest payments from 5.6% under perfect capital mobility for theCanada benchmark to 3.6% under limited capital mobility.] Borrowingand lendingceilingsset to reduce the standard deviationof netforeign interest payments to zero., )'= 3.0%.'w= 3.0%.6~ = 2.0%.7p' = 0.6%.
Perfect Limited Immobile
Model economy mobility mobility2 capital)
Canada benchmark 2.81 2.82 2.83
High risk aversion' 2.80 2.82 2.94Inelastic labour' 1.79 1.81 1.88
Large shocks6 4.32 4.30 4.29Persistent shocks7 3.33 3.26 . 3.08
Perfect Limited Immobile
Model economy mobility mobility2 capital'
Canada benchmark 0.76 0.79 0.85
High risk aversion' 0.76 0.79 0.84Inelastic labour' 0.61 0.62 0.70
Large shocks6 0.77 0.81 0.87Persistent shocks7 0.80 0.83 0.89
100 EnriqueG. Mendoza
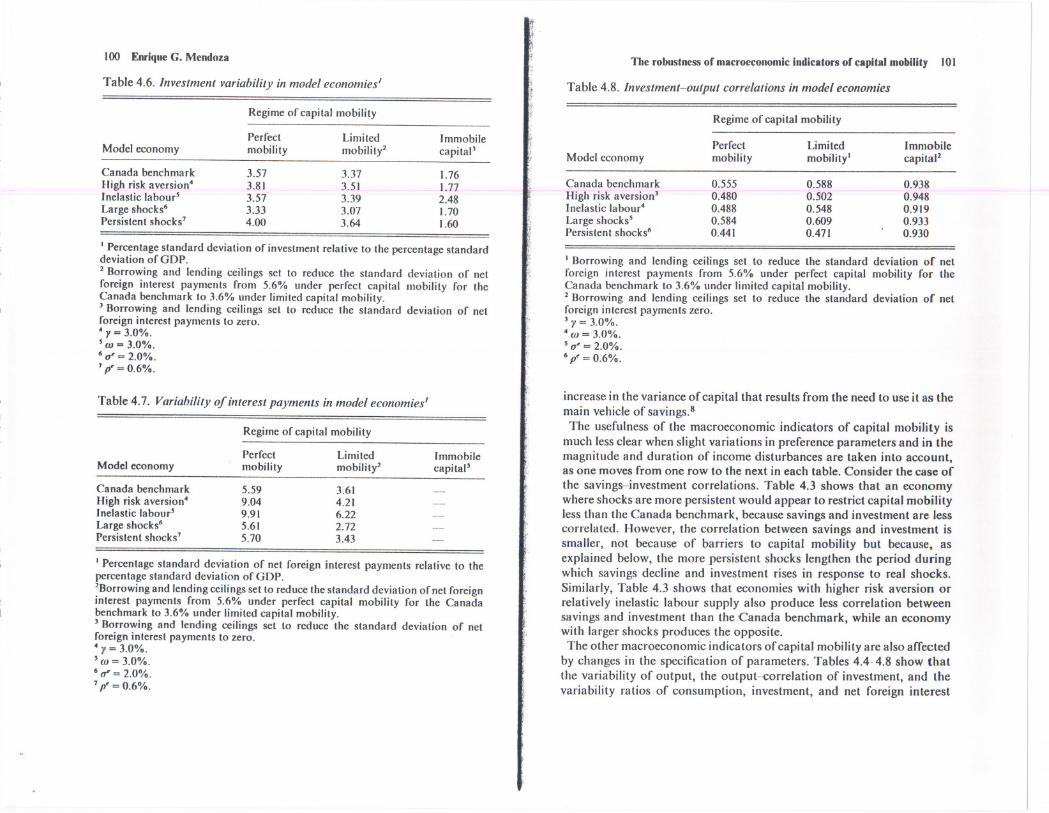
Table 4.6. Investment variability in model economies I
Regime of capital mobility
I Percentage standard deviation of investment relative to the percentage standarddeviation ofODP.2 Borrowing and lending ceilings set to reduce the standard deviation of netforeign interest payments from 5.6% under perfect capital mobility for theCanada benchmark to 3.6% under limited capital mobility.) Borrowing and lending ceilings set to reduce the standard deviation of netforeign interest payments to zero.· )' = 3.0%., OJ= 3.0%.6 t1' = 2.0%.7p' = 0.6%.
Table 4.7. Variability of interest payments in model economiesl
Regime of capital mobility
Model economyPerfectmobility
Immobilecapital'
Limitedmobility2
Canada benchmarkHigh risk aversion4Inelastic labour'Large shocks6Persistent shocks7
5.599.049.915.615.70
3.614.216.222.723.43
I Percentage standard deviation of net foreign interest payments relative to thepercentage standard deviation of ODP.
'Borrowing and lending ceilings set to reduce the standard deviation of net foreigninterest payments from 5.6% under perfect capital mobility for the Canadabenchmark to 3.6% under limited capital mobility.J Borrowing and lending ceilings set to reduce the standard deviation of netforeign interest payments to zero.4 )' =3.0%., OJ =3.0%.6 t1' = 2.0%.1p' = 0.6%.
The robustness or macroeconomic indicators or capital mobility 101
Table 4.8. Investment-output correlations in model economies
Regime of capital mobility
I Borrowing and lending ceilings set to reduce the standard deviation of netforeign interest payments from 5.6% under perfect capital mobility for theCanada benchmark to 3.6% under limited capital mobility.2 Borrowingand lendingceilingsset to reduce the standard deviationof netforeign interest payments zero.) )' = 3.0%.4 OJ = 3.0%., t1' = 2.0%.6p' = 0.6%.
increase in the variance of capital that results from the need to use it as themain vehicle of savings.8The usefulness of the macroeconomic indicators of capital mobility is
much lessclear when slight variations in preference parameters and in themagnitude and duration of income disturbances are taken into account,as one moves from one row to the next in each table. Consider the case ofthe savings-investment correlations. Table 4.3 shows that an economywhere shocks are more persistent would appear to restrict capital mobilityless than the Canada benchmark, because savings and investment are lesscorrelated. However, the correlation between savings and investment issmaller, not because of barriers to capital mobility but because, asexplained below, the more persistent shocks lengthen the period duringwhich savings decline and investment rises in response to real shocks.Similarly, Table 4.3 shows that economies with higher risk aversion orrelatively inelastic labour supply also produce less correlation betweensavings and investment than the Canada benchmark, while an economywith larger shocks produces the opposite.The other macroeconomic indicators of capital mobilityare also alTected
by changes in the specification of parameters. Tables 4.4.4.8 show thatthe variability of output, the output-correlation of investment, and thevariability ratios of consumption, investment, and net foreign interest
Perfect Limited ImmobileModel economy mobility mobility2 capital'
Canada benchmark 3.57 3.37 1.76High risk aversion. 3.81 3.51 1.77Inelastic labour' 3.57 3.39 2.48Large shocks6 3.33 3.07 1.70Persistent shocks7 4.00 3.64 1.60
Perfect Limited ImmobileModel economy mobility mobility' capital2
Canada benchmark 0.555 0.588 0.938High risk aversion) 0.480 0.502 0.948Inelastic labour4 0.488 0.548 0.919Large shocks' 0.584 0.609 0.933Persistent shocks6 0.441 0.471 0.930

102 EnriqueG. Mendoza
0.03
0.005
0.02Consumption
-0.01Trade balance
-0.021 2 3 4 5 6 7 8 9 10 II 12 13 14 15 16 17 18 19 20 21
Period
The robustness or macroeconomic Indicators or capital mobility 103
o
Investment
2 3 4 5 6 7 8 9 10 II 12 13' 14 15 16 17 18 19 20
Period
Figure 4.4 Impulse responses under the regime or Immobile capitalFigure 4.3 Impulse responses under perrect capital mobility
payments relative to output tend to be just as sensitive to changes inparameters as to the imposition of limits on capital mobility. Hence, allcountries in the sample of a cross-section study could have identicalregimesof capital mobility, and yet be judged as allowing financialcapitalto Oowmore or less freely on the basis of differences in macroeconomicindicators that could merely reflect differences in the structure of theeconomies. Tables 4.3 and 4.8 show that it is only in the extreme case inwhich capital mobility is totally obstructed that indicators based onsavings-investment correlations or investment-output correlations arerobust to parameter specifications. However, in a world where neitherperfect mobility or absolute immobility are found very frequently, thisrobustness property may not be useful.The performance of the indicators of capital mobility in the various
experiments summarised in Tables 4.3-4.8 can be examined further bystudying the differences in the pattern of adjustment of the economy inresponse to exogenous shocks due to the imposition of barriers to capitalmobility. This is illustrated in Figures 4.3 and 4.4, which depict impulseresponsesof macroeconomic aggregates to a I% productivity shock in theregimesof perfect capital mobility and immobile capital respectively.
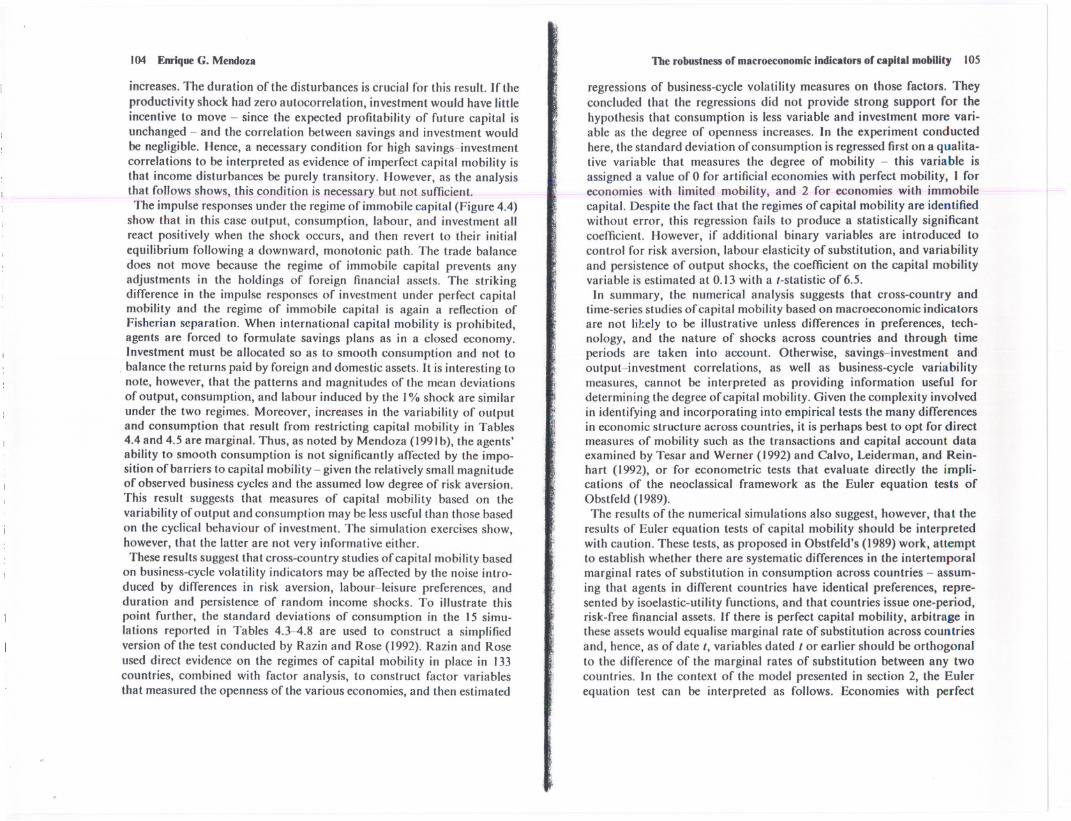
Under perfect capital mobility (Figure 4.3), the impact effect of theproductivity shock on output, consumption, labour supply, and invest-ment is positive, while that on the trade balance is negative. The increase
in labour and consumption is smaller than the surge in output, reflectingthe agents' desire to smooth consumption of the composite good C-G(L).The trade balance worsens to finance additional investment needed toequalise the expected returns on foreign assets and domestic capital. Asthe effect of the shock fades, output, consumption, and labour revert totheir long-run mean values following a downward, monotonic pattern. Incontrast, investment declines sharply and becomes negative after thesecond period, and then it returns to its long-term mean from below zerofollowing upward, monotonic trend. This reflects the extent to whichFisherian separation is still a useful approximation under uncertainty, thevolatile behaviour of investment resulting from the agent's ability toborrow and lend as necessary to equalise the expected returns of availableassets. The sharp improvement of the trade balance after the negativeimpact effect is approximately a mirror image of the changes in invest-ment, with the exception that trade surpluses also reflectthe accumulationof foreign assets to sustain savings.9Savings correspond to the differencebetween output and consumption; thus, the impulse response of savingswould also display a positive impact effect and a downward, monotonicadjustment to the initial equilibrium. Savings and investment are posi-tively correlated, despite perfect capital mobility, because the impacteffect on both variables is positive. The correlation is not perfect,however, because after the impact effect savings decline while investment
.'
0.030
0.025
H0.020
ee,g 0.015c0:
0.010
H0.01e
]c.g 0.!!
104 EnrIqueG. Mendoza
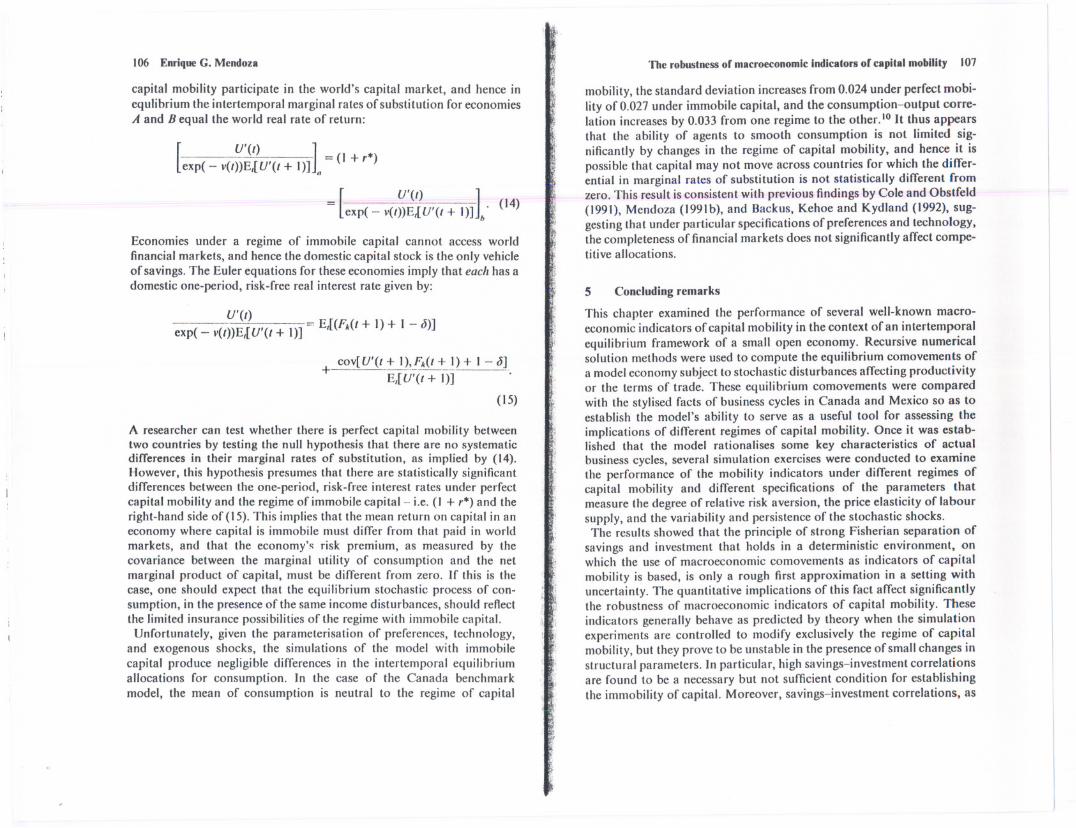
increases.The duration of the disturbances is crucial for this result. If theproductivity shock had zero autocorrelation, investment would have littleincentive to move - since the expected profitability of future capital isunchanged - and the correlation between savings and investment wouldbe negligible. Hence, a necessary condition for high savings-investmentcorrelations to be interpreted as evidence of imperfect capital mobility isthat income disturbances be purely transitory. However, as the analysisthat follows shows, this condition is necessary but not sufficient.The impulse responses under the regime of immobile capital (Figure 4.4)
show that in this case output, consumption, labour, and investment allreact positively when the shock occurs, and then revert to their initialequilibrium following a downward, monotonic path. The trade balancedoes not move because the regime of immobile capital prevents anyadjustments in the holdings of foreign financial assets. The strikingdifference in the impulse responses of investment under perfect capitalmobility and the regime of immobile capital is again a reflection ofFisherian separation. When international capital mobility is prohibited,agents are forced to formulate savings plans as in a closed economy.Investment must be allocated so as to smooth consumption and not to
. balance the returns paid by foreign and domestic assets. It is interesting tonote, however, that the patterns and magnitudes of the mean deviationsof output, consumption, and labour induced by the I% shock are similarunder the two regimes. Moreover, increases in the variability of outputand consumption that result from restricting capital mobility in Tables4.4 and 4.5 are marginal. Thus, as noted by Mendoza (199Ib), the agents'ability to smooth consumption is not significantly affected by the impo-sition of barriers to capital mobility - giventherelativelysmallmagnitudeof observed business cycles and the assumed low degree of risk aversion.This result suggests that measures of capital mobility based on thevariability of output and consumption may be less useful than those basedon the cyclical behaviour of investment. The simulation exercises show,however, that the latter are not very informative either.These results suggest that cross-country studies of capital mobility based
on business-cyclevolatility indicators may be affected by the noise intro-duced by differences in risk aversion, labour-leisure preferences, andduration and persistence of random income shocks. To illustrate thispoint further, the standard deviations of consumption in the 15 simu-lations reported in Tables 4.3-4.8 are used to construct a simplifiedversion of the test conducted by Razin and Rose (1992). Razin and Roseused direct evidence on the regimes of capital mobility in place in 133countries, combined with factor analysis, to construct factor variablesthat measured the openness of the various economies, and then estimated
The robustness of macroeconomic IndicatoR of capital mobUity 105
regressions of business-cycle volatility measures on those factors. Theyconcluded that the regressions did not provide strong support for thehypothesis that consumption is less variable and investment more vari-able as the degree of openness increases. In the experiment conductedhere, the standard deviation of consumption is regressed firston a qualita-tive variable that measures the degree of mobility - this variable isassigned a value of 0 for artificial economies with perfect mobility, I foreconomies with limited mobility, and 2 for economies with immobilecapital. Despite the fact that the regimes of capital mobility are identifiedwithout error, this regression fails to produce a statistically significantcoefficient. However, if additional binary variables are introduced tocontrol for risk aversion, labour elasticity of substitution, and variabilityand persistence of output shocks, the coefficient on the capital mobilityvariable is estimated at 0.13 with a I-statistic of 6.5.
In summary, the numerical analysis suggests that cross-country andtime-seriesstudies of capital mobility based on macroeconomic indicatorsare not lil:ely to be illustrative unless differences in preferences, tech-nology, and the nature of shocks across countries and through timeperiods are taken into account. Otherwise, savings-investment andoutput-investment correlations, as well as business-cycle variabilitymeasures, cannot be interpreted as providing information useful fordetermining the degree of capital mobility. Given the complexity involvedin identifying and incorporating into empirical tests the many differencesin economic structure across countries, it is perhaps best to opt for directmeasures of mobility such as the transactions and capital account dataexamined by Tesar and Werner (1992)and Calvo, Leiderman, and Rein-hart (1992), or for econometric tests that evaluate directly the impli-cations of the neoclassical framework as the Euler equation tests ofObstfeld (1989).The results of the numerical simulations also suggest, however, that the
results of Euler equation tests of capital mobility should be interpretedwith caution. These tests, as proposed in Obstfeld's (1989)work, attemptto establish whether there are systematic differences in the intertemporalmarginal rates of substitution in consumption across countries - assum-ing that agents in different countries have identical preferences, repre-sented by isoelastic-utility functions, and that countries issue one-period,risk-free financial assets. If there is perfect capital mobility, arbitrage inthese assets would equalise marginal rate of substitution across countriesand, hence, as of date I, variables dated I or earlier should be orthogonalto the difference of the marginal rates of substitution between any twocountries. In the context of the model presented in section 2, the Eulerequation test can be interpreted as follows. Economies with perfect
106 Enrique G. Mendoza
capital mobility participate in the world's capital market, and hence inequlibrium the intertemporal marginal rates of substitution for economiesA and B equal the world real rate of return:
[ U'(t) ]exp( - v(t»E,[U'(t+ I» = (I + ,*)n
_[
U'(t)]- exp( - v(t»E,[U'(t + I)] b' (14)
Economies under a regime of immobile capital cannot access worldfinancial markets, and hence the domestic capital stock is the only vehicleof savings.The Euler equations for these economies imply that each has adomestic one-period, risk-free real interest rate given by:
U'(t)exp( _ v(t»E,[U'(t + I)] .., E,[(Fk(t+ I) + I - J)]
+ cov[U'(t + I), Fk(t + I) + I - J]E,[U'(t+I)] .
(15)
A researcher can test whether there is perfect capital mobility betweentwo countries by testing the null hypothesis that there are no systematicdifferences in their marginal rates of substitution, as implied by (14).However, this hypothesis presumes that there are statistically significantdifferences between the one-period, risk-free interest rates under perfectcapital mobility and the regimeof immobile capital- Le. (I + ,*) and theright-hand side of(15). This implies that the mean return on capital in aneconomy where capital is immobile must differ from that paid in worldmarkets, and that the economy's risk premium, as measured by thecovariance between the marginal utility of consumption and the netmarginal product of capital, must be different from zero. If this is thecase, one should expect that the equilibrium stochastic process of con-sumption, in the presence of the same income disturbances, should renectthe limited insurance possibilitiesof the regime with immobile capital.Unfortunately, given the parameterisation of preferences, technology,
and exogenous shocks, the simulations of the model with immobilecapital produce negligible differences in the intertemporal equilibriumallocations for consumption. In the case of the Canada benchmarkmodel, the mean of consumption is neutral to the regime of capital
The robustnessor macroeconomleIndicators of eapltal mobility 107~~
mobility, the standard deviation increases from 0.024 under perfect mobi-lity of 0.027 under immobile capital, and the consumption-output corre-lation increases by 0.033 from one regime to the other. 10It thus appearsthat the ability of agents to smooth consumption is not limited sig-nificantly by changes in the regime of capital mobility, and hence it ispossible that capital may not move across countries for which the differ-ential in marginal rates of substitution is not statistically different fromzero. This result is consistent with previous findings by Cole and Obstfeld(1991), Mendoza (199Ib), and Backus, Kehoe and Kydland (1992), sug-gesting that under particular specificationsof preferences and technology,the completeness of financial markets does not significantlyaffect compe-titive allocations.
'-
5 Concludingremarks
This chapter examined the performance of several well-known macro-economic indicators of capital mobility in the context of an intertemporalequilibrium framework of a small open economy. Recursive numericalsolution methods were used to compute the equilibrium comovements ofa model economy subject to stochastic disturbances affecting productivityor the terms of trade. These equilibrium comovements were comparedwith the stylised facts of business cycles in Canada and Mexico so as toestablish the model's ability to serve as a useful tool for assessing theimplications of different regimes of capital mobility. Once it was estab-lished that the model rationalises some key characteristics of actualbusiness cycles, several simulation exercises were conducted to examinethe performance of the mobility indicators under different regimes ofcapital mobility and different specifications of the parameters thatmeasure the degree of relative risk aversion, the price elasticity of laboursupply, and the variability and persistence of the stochastic shocks.The results showed that the principle of strong Fisherian separation of
savings and investment that holds in a deterministic environment, onwhich the use of macroeconomic comovements as indicators of capitalmobility is based, is only a rough first approximation in a setting withuncertainty. The quantitative implications of this fact affect significantlythe robustness of macroeconomic indicators of capital mobility. Theseindicators generally behave as predicted by theory when the simulationexperiments are controlled to modify exclusively the regime of capitalmobility, but they prove to be unstable in the presence of small changes instructural parameters. In particular, high savings-investment correlationsare found to be a necessary but not sufficient condition for establishingthe immobility of capital. Moreover, savings-investment correlations, as
108 EnrIqueG. Mendoza
well as other indicators based on the cyclical behaviour of output, con-sumption, and investment, are equally sensitive to slight variations in theparameters that describe preferences and the stochastic process of thedisturbances as to changes in the degree of capital mobility.The findings of this analysis suggest that the evidence presented to date
on capital mobility based on macroeconomic indicators cannot be inter-preted as showing that the welfare and efficiencygains resulting from theintegration of world capital markets have not materialised. Furthermore,empirical tests aimed at establishing the mobility of capital across coun-tries using macroeconomic indicators may be affected by the noise attri-buted to differences in the structure of the economies under study. Unlessthis information can be properly incorporated into the tests, an approachbased on direct measurement of international flowsof financialcapital, orthe Euler equation tests that evaluate directly the implications of theoptimality principles that characterise the neoclassical model, may be thebest alternative. The results of the latter should be interpreted withcaution, however, because numerical simulations suggest that they canproduce favourable results even for economies where capital is in factimmobile.
The robustness of macroeconomic Indicators of capital mobility 109
NOTES
themselvescompletely against country-specific risks. However, Cole and Obst-feld (1991), Mendoza (199Ib) and Baxter and Crucini (1992) found thatmarket incompleteness may not have drastic elTects on competitive allo-cations. This financial structure also assumes that foreigners do not owndomestic capital, although it is possible for domestic agents to borrow fromworld markets to finance investment projects.
5 In this utility function, the rate of time preference, exp(v(' », increaseswith thelevel of past consumption in order to obtain a well-defined unique invariantlimiting distribution of the state variables - as demonstrated by Epstein (1983).Obstfeld (1981)used the deterministic analogue of this utility function, follow-ing Uzawa (1968), to obtain a well-defined steady state for foreign assetholdings in a small open economy. Epstein also showed that SCU is suitablefor dynamic programming, that with it consumption in every period is anormal good, and that the conditions it requires restrain the variability of therate of time preference so that major deviations from the standard time-separable setup are avoided.
6 This method is due to Bertsekas (1976)and was introduced to macroeconomicmodels by Sargent (1980).Greenwood, Hercowitz and HulTman(1988)used itto simulate a closed-economy real business-cyclemodel and Mendoza (199Ia)used it to solve a small open-economy model. The technique calculates exactlythe unique invariant joint limiting distribution of the state variables, using analgorithm that solves the functional equation problem for a discrete version ofthe state space.
7 Razin and Rose (1992)also argue that output variability increases with tradeliberalisation because of the specialisation trends that follow from perfectmobility of goods.
8 Note that, because of the Cobb-Douglas technology and the separation ofconsumption and labour in the utility function, the variance of output can beexpressed as a linear function of the variance of the shocks, the variance of thecapital stock, and the covariance between the capital stock and theshocks.
9 The present value of the trade balance must be zero to satisfy the resourceconstraint. Hence the initial worsening of the trade balance is olTset withseveral periods of improvement.
10 Even if the exercise is altered to allow for the use of capital controls to targetthe trade balance, and hence alter the mean of the capital stock, the elTectsonconsumption and welfare are negligible(see Mendoza, 1991bfor details).
Helpful comments and suggestions by Eduardo Borensztein, Mohsin Khan, AssafRazin, Andrew Rose, Lars Svensson, Linda Tesar and Peter Wickham, as well asthose provided by the discussants oflhe chapter, John Huizinga and Joseph Zeim,are gratefully acknowledged. The viewsexpressed here are the author's only anddo not represent those of the International Monetary Fund.
I The shock e, incorporates the elTectsof fluctuations in the terms of tradebecause output is a tradable commodity (see Greenwood, 1983).However, themodel ignores the existenceof nontraded goods and does not model separatelyimportable and exportable commodities. Mendoza (1992) examines a modelthat relaxes these assumptions.
2 With these adjustment costs, the cost of changing the capital stock by a fixedamount increases with the speed of the desired adjustment, giving agents anincentive to undertake investment changes gradually. This prevents the modelfrom exaggerating the variability of investment relative to what is observed inthe data (see Mendoza, 1991afor details).
3 The world's real interest rate is assumed to be fixedfor simplicity.This reducesthe model to the minimum framework in which to assess the performance ofcapital mobility indicators under uncertainty. Mendoza (199Ia) finds thatinterest rate shocks do not have significant implications for the model exam-ined here under conditions of perfect capital mobility.
4 Implicit in this financial structure is the assumption that contracts withpayment contingent on the realisations of the disturbances cannot be written.Impeding trade in these contingent claims limits the ability of agents to insure
REFERENCES
Backus, O.K. and PJ. Kehoe (1992) 'International Evidence on the HistoricalProperties of BusinessCycles', American Economic Review,82, 864-88.
Backus, David K., P.J. Kehoe and Finn E. Kydland (1992), 'International RealBusinessCycles', Joumol of Political Economy, 100(August), 745-75.
Baxter, M. and M.J. Crucini (1992) 'Business cycles and the asset structure offoreign trade', Rochester Centre for Economic Research, University ofRochester, unpublished paper.
(1993) 'Explaining savings/investment correlations', American EconomicReview, 83.

110 Enrique G. Mendoza The robustnessof macroeconomicIndicators of capita' mobility III
Montiel, Peter J. (1992) 'Capital Mobility in Developing Countries: SomeMeasurement Issues and Empirical Estimates', unpublisbed manuscript,Department of Economics, Oberlin College.
Obstfeld, Maurice (1981) 'Macroeconomic Policy, Excbange Rate Dynamics andOptimal Asset Accumulation', Journal of Political Economy, 89 (December),1142-61.
(1986) 'Capital Mobility in tbe World Economy: Tbeory and Measurement',Carnegie-RochesterConferenceSeries on Public Policy, 24 (Spring), 55-104.
(1989) 'How Integrated are World Capital Markets?: Some New Tests', in G.Calvo, R. Findlay, P. Koari and J. Braga de Macedo (eds), Debt. Stabilizationand Development:Essays in Memory of Carlos Diaz-Alejandro,Oxford: BasilBlackwell.
Ostry, Jonatban D. and Carmen M. Reinhart (1992)'Private Savingand Terms ofTrade Shocks', IMF Staff Papers,39, 495-517.
Prescott, Edward C. (1986) 'Theory Ahead of Business Cycle Measurement',Carnegie-RochesterConferenceSeries on Public Policy, 25, 11-44.
Razin, Assaf and Andrew K. Rose (1992) 'Business Cycle Volatility and Open-ness: An Exploratory Cross-Sectional Analysis, Economics Department, Tel-Aviv University and School of Business Administration, University of Cali-fornia, Berkeley, unpublished manuscript.
Sachs, Jeffrey (1982) 'Tbe Current Account and Macroeconomic Adjustment inthe 1970s', BrookingsPaperson Economic Activity, 12,201-68.
Sargent, Thomas J. (1980)'Tobin's qand the Rate oftnvestment in General Equili-brium', Carnegie-RochesterConferenceSeries on Public Policy, 12, 107-54.
Sinn, Stefan A. (1991)'Measuring International Capital Mobility: A Critical Noteon the Use of Saving and Investment Correlations', unpublished manuscript,Institut rur Weltwirtschafl, Kiel.
Summers, Lawrence (1988) 'Tax Policy and International Competitiveness', in J.Frenkel (ed.), InternationalAspects of Fiscal Policies,Chicago: University ofChicago Press.
Svensson, Lars E.O. and Assaf Razin (1983)'The Terms of Trade and tbe CurrentAccount: The Harberger-Laursen-Metzler Effect', Journal of PoliticalEconomy, 91, 97-125.
Tesar, Linda L. (1991) 'Savings, Investment and International Capital Aows',Journal of InternationalEconomics,31 (August), 55-78.
Tesar, Linda L. and Ingrid M. Werner (1992) 'Home Bias and the Globalizationof Securities Markets', NBER, Working Paper, 4218 (November).
Uzawa, Hirofumi (1968) 'Time Preference, the Consumption Function andOptimum Asset Holdings', in J.N. Wolfe (ed.), Value. Capital and Growth:Papers in Honorof Sir John Hicks, Edinburgh: Edinburgb University Press.
Zeira, Joseph (1987) 'Risk and Capital Accumulation in a SmallOpen Economy',Quarterly Journal of Economics, 102(May), 265-79.
Bayoumi, Tamim and Gabriel Sterne (1992) 'Regional Trade Blocs, MobileCapital and Excbange Rate Coordination', Researcb Department, Inter-national Monetary fund, unpublished manuscript.
Bertsekas, Dimitri P. (1976)Dynamic Programmingand Stochastic Control, NewYork: Academic Press.
Calvo, Guillermo A., Leonardo Leiderman and Carmen M. Reinhart (1992)'Capitallnnows and Real Exchange Rate Appreciation in Latin America:TbeRole of External Factors', 1MF Staff Papers,40 (March).
Cole, Harold and Maurice Obstfeld (1991) 'Commodity Trade and InternationalRisk Sharing: How Mucb Do Financial Markets Matter', Journalof MonetaryEconomics,28 (August) 3-24.
Correia, Isabel H., Joao C. Neves and Sergio Rebelo (1991) 'Business Cycles inPortugal: Theory and Evidence', Working Paper, Research Department, Bankof Portugal.
Dooley, Michael, Jeffrey A. Frankel and Donald J. Mathieson (1987) 'Inter-national Capital Mobility: What do Savings-Investment Correlations TellUs?', IMF Staff Papers,34, 503-29.
Epstein, Larry G. (1983) 'Stationary Cardinal Utility and Optimal Growth underUncertainty', Jourtlalof Economic Theory,31, 133-52.
Feldstein, Martin and Charles Horioka (1980) 'Domestic Savings and Inter-national Capital Flows', EconomicJournal, 90 (June), 314-29.
Finn, Mary G. (1990) 'On Savings and Investment Dynamics in a Small OpenEconomy', Journal of InternationalEconomics,29, 1-22.
Fisher, Irving (1930) Theory of Interest, New York: Macmillan.Frankel, Jeffrey A. (1992)'Measuring International Capital Mobility: A Review',
American EconomicReview. Papersand Proceedings,82,197-202.Frenkel, Jacob A. and Assaf Razin (1987)FiscalPoliciesand the WorldEconomy,
Cambridge, MA: MIT Press.Greenwood, Jeremy (1983) 'Expectations, The Exchange Rate and The Current
Account', Jourtlalof Monetary Economics, 12, 543-69.Greenwood, Jeremy, Zvi Hercowitz and Gregory Huffman (1988) 'Investment,
Capacity Utilization and the Real Business Cycle', American EconomicReview,78, 402-17.
Hansen, Lars P. and Kenneth J. Singleton (1983) 'Stochastic Consumption, RiskAversion, and the Temporal Behavior of Asset Returns', Journal of PoliticalEconomy, 91, 249-65.
Helpman, Elhanan and Assaf Razin (1982) 'Dynamics of a Floating ExchangeRate Regime', Jourtlalof Political Economy, 90,728-54.
Imrohoroglu, Ayse (1989) 'Cost of Business Cycles with Indivisibilities andLiquidity Constraints', Journal of Political Economy, 97, 1364--83.
International Monetary Fund (199Ia) World Economic Outlook. May 1991,Washington, DC: IMF.
(199Ib) Annual Report on Exchange Arrangementsand Exchange Restriction.~,Washington, DC: IMF.
Mendoza, Enrique G. (199Ia) 'Real BusinessCycles in a Small Open Economy',American Economic Review,81, 797-818.
(199Ib) 'Capital Controls and the Gains from Trade in a BusinessCycle Modelof a Small Open Economy', IMF Sta.ff Papers,38, 480-505.
(1992)'The Terms of Trade and Economic Fluctuations',lMF, Working PaperWP/9V98 (December).