The Roanoke Higher Education Center · PDF fileThe Roanoke Higher Education Center Roanoke...
43
The Roanoke Higher Education Center Roanoke Valley and New River Valley Industry Clustering ‘A Study to Examine Potential Development at the Roanoke Higher Education Center’ Presented to Dr. Thomas L. McKeon Executive Director Ms. Carla L. James-Collins Director of Academic and Student Services The Roanoke Higher Education Center Roanoke, VA In partial fulfillment of EDCI 5974 Virginia Polytechnic Institute and State University Dr. Steven M. Janosik, Faculty of Record John P. McNamara May 1, 2008
-
Upload
trinhkhanh -
Category
Documents
-
view
213 -
download
0
Transcript of The Roanoke Higher Education Center · PDF fileThe Roanoke Higher Education Center Roanoke...

The
Roanoke Higher Education Center
Roanoke Valley and New River Valley Industry Clustering
‘A Study to Examine Potential Development at the
Roanoke Higher Education Center’
Presented to
Dr. Thomas L. McKeon
Executive Director
Ms. Carla L. James-Collins
Director of Academic and Student Services
The
Roanoke Higher Education Center
Roanoke, VA
In partial fulfillment of EDCI 5974
Virginia Polytechnic Institute and State University
Dr. Steven M. Janosik, Faculty of Record
John P. McNamara
May 1, 2008

RV and NRV Industry Clustering John P. McNamara 2
Table of Contents
3… Study Synopsis
4… Defining Industry Clusters
o 5… Commonwealth of Virginia clusters
o 12… Roanoke Valley clusters
o 12… New River Valley clusters
12… Location Quotients
14… Roanoke Valley and New River Valley Industry Sectors with Potential
Growth
16… O*NET
17… The Skills Matrix
22… High Growth Industries
35… Roanoke Valley and New River Valley Industry Sector Database
36… Future Study Development
39… References
40… Appendix
o 40… Hot Markets and Jobs for 2008
o 43… Roanoke Valley and New River Valley Industry Sector Database

RV and NRV Industry Clustering John P. McNamara 3
Study Synopsis
Dr. Tom McKeon, Executive Director of the Roanoke Higher Education Center, was
contacted in December 2007 in order to discuss the potential of using the Roanoke Higher
Education Center (RHEC) as a site for completion of an independent study at Virginia
Polytechnic Institute and State University (Virginia Tech). The RHEC was developed from
legislation in 1997 (HB 1180) that established the Roanoke Higher Education Authority. It
presently functions to manage the facility, schedule use of space, and provide centralized
services to increase cost efficiency of the Center. As partial fulfillment of doctoral coursework
in the Department of Educational Leadership and Policy Studies, Higher Education Program, the
RHEC was chosen as a site due to the nature of its role in higher education.
Upon approval of the Graduate School, a ‗job description‘ was agreed upon, and it was
noted in an email to the RHEC staff on January 23, 2008:
John‘s primary project during this semester will be to develop information and an
infrastructure for the Center to become more involved in assessing the education and
training needs in the region (Roanoke and New River Valleys). That will include
identifying the major business clusters in the region, identifying the industries within the
clusters and sources within those industries through which we can find education and
training needs, and recommending the best methods (i.e. surveys, focus groups, advisory
committees, etc.) for us to use going forward to conduct needs assessments.
The following pages document the progress of this independent study during the Spring
semester of 2008. There is also a companion power point presentation. The RHEC staff has
been outstanding in making this study possible, and in providing the necessary tools to work
effectively. By no means is this study complete and final, as economic forces of the past few
months have indicated the potential for serious turbulence in industry for the next few years.
RV and NRV Industry Clustering John P. McNamara 4
Defining Industry Clusters
Industry clusters were coined by Michael Porter in his book The Competitive Advantage
of Nations (1990). The concept actually dates back to the 1890‘s in Alfred Marshall‘s Principles
of Economics text. Industry clusters are rooted in supply and demand economic functions.
Rosenfeld (1990) defined industry clusters as ―a geographically bounded concentration of
similar, related or complementary businesses, with active channels for business transactions,
communications and dialogue that share specialized infrastructure, labor markets and services,
and that are faced with common opportunities and threats.‖ In his paper ―Bringing Business
Clusters into the Mainstream of Economic Development,‖ Rosenfeld (1990) emphasizes the
importance of the role of social interaction and firm cooperation in determining the dynamic
nature of a cluster.
Numerous factors drive an industry cluster, including competition among rival firms,
agglomeration economies, labor force skills, technology transfer, knowledge transfer, and social
infrastructure (Doeringer and Terkla, 1995). Labor force skills and knowledge transfer are of
particular importance for this project.
Doeringer and Terkla (1995) suggest looking beyond individual industries and
recognizing that individual firms are part of a much larger industrial system. Industry clusters
should have a much broader definition to include both horizontal and vertical relationships, and
both direct and indirect linkages. Many practitioners have relied on simply defining industry
clusters as a concentration of employment in a single industry. The literature argues that this
simply represents an industry concentration, and ignores the functional relationships between
industries and the interdependent and dynamic relationships that characterize clusters (Doeringer
and Terkla 1995, Rosenfeld 1997).

RV and NRV Industry Clustering John P. McNamara 5
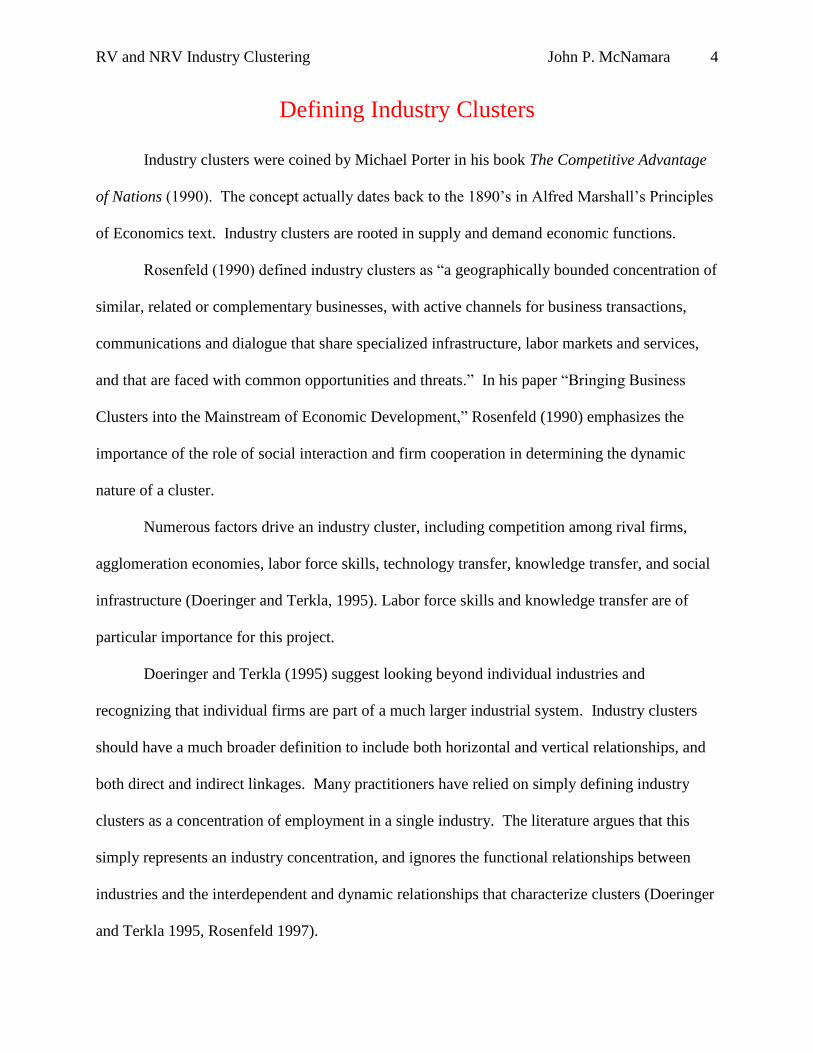
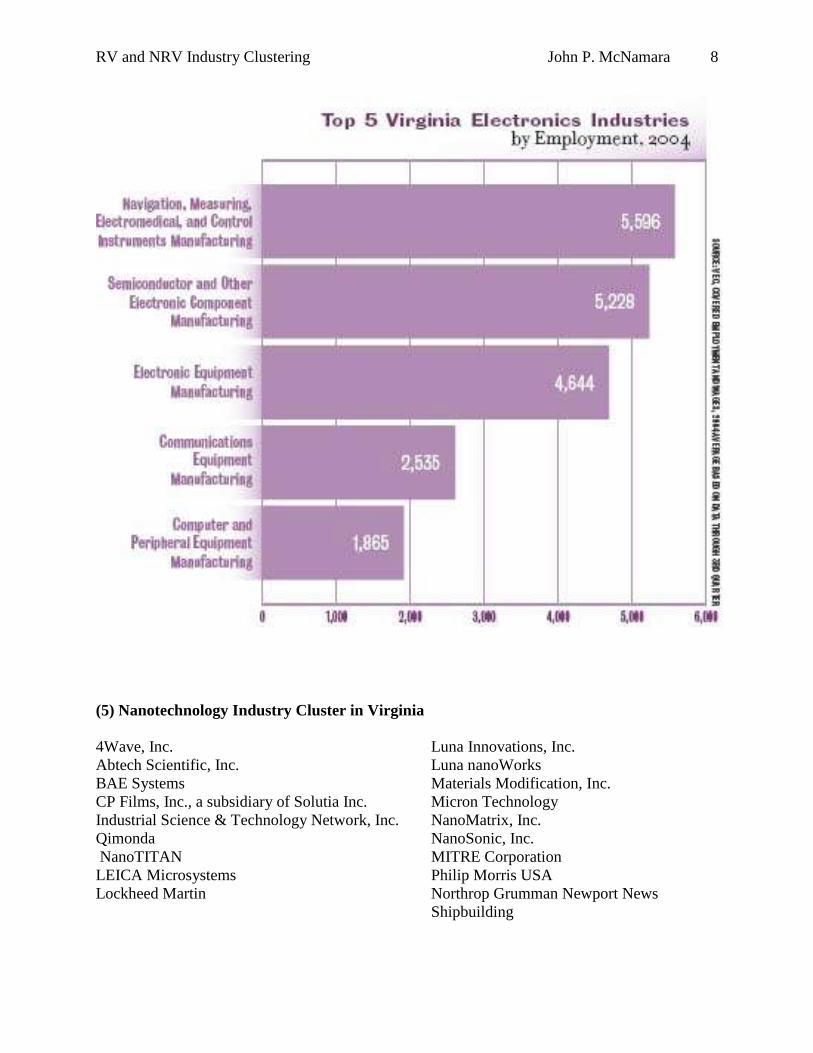
In defining industry clusters for the Roanoke Valley and New River Valley, it became
apparent that some disagreement existed as to what the industry clusters actually are due to the
fact that many methods can be used to determine the clusters. The following examines how the
Commonwealth of Virginia (Virginia Economic Development Partnership) defines industry
clusters for the state. Included are these ten (10) clusters: aerospace, automotive, biosciences,
electronics, nanotechnology, food processing, global logistics, modeling and simulation, plastics,
and wood products. Data available from the Commonwealth for each cluster varied. Some data
included specific industries, maps, tables, and bar graphs. Industry examples are as follows:
(1) Aerospace Industry Cluster in Virginia
AeroAstro General Dynamics Swales Aerospace
Agusta Westland Howmet
AIRBUS Kollmorgen
Allied Aerospace Lockheed Martin
Atlantic Research Goodyear Tire & Rubber
Aurora Flight Sciences Northrop Grumman
BAE Systems Orbital Sciences Corporation
The Boeing Company Raytheon
Dowty Aerospace Rolls-Royce North America
Electro-Tec Smiths Aerospace
Exostar Spot Image

RV and NRV Industry Clustering John P. McNamara 6
(2) Automotive Industry Cluster in Virginia
Alcoa Wheel Products Narricot Industries
Carlisle Motion Control Rehau
Continental Teves Schrader Bridgeport International
Corning Siemens VDO Automotive
DuPont Tenneco Automotive
Dynax America Timken
Eagle-Picher Toray Plastics
Federal Mogul TRW
Goodyear Tire & Rubber Co. Usui International
Intermet Volkswagen of America, Inc.
International Automotive Components Volvo Trucks North America
Koyo Steering Systems Wytheville Technologies
MeadWestvaco Yokohama Tire
(3) Bioscience Industry Cluster in Virginia
Abbott Laboratories (Ross Products Division) Incogen, Inc.
American Type Culture Collection LifeNet Health Inc.
Barr Laboratories Mediatech, Inc.
Biotage Merck & Co., Inc.
Biovail Technologies Novozymes Biologicals, Inc.
Boehringer Ingelheim PPD Development
Commonwealth Biotechnologies, Inc. PPL Therapeutics, Inc.
Covance Laboratories, Inc. PRA International
EPL, Inc. Quintiles

RV and NRV Industry Clustering John P. McNamara 7
Fisher Scientific SRI International
Genetics and IVF Institute UNOS
Howard Hughes Medical Institute Wako Chemicals USA, Inc.
Wyeth Consumer Healthcare Wyeth Pharmaceuticals
(4) Electronics Industry Cluster in Virginia
ABB Power T & D Company Kollmorgen Corporation
Aspen Motion Technologies Line Power Manufacturing Corp.
Canon Maida Development Company
Delta Star, Inc. Manufacturing Carbone Kirkwood Micron
Technology, Inc. Moog Components Group Inc.
Diebold Southeast Northrop Grumman Orbital Sciences Corporation
Electro-Tec Corporation Plastics One Inc.
GE Fanuc Pyott-Boone Electronics Inc.
General Electric Raytheon Systems
Genie Company Times Fiber Communication
Hubbell Lighting, Inc. Valcom, Inc.
Qimonda
RV and NRV Industry Clustering John P. McNamara 8
(5) Nanotechnology Industry Cluster in Virginia
4Wave, Inc. Luna Innovations, Inc.
Abtech Scientific, Inc. Luna nanoWorks
BAE Systems Materials Modification, Inc.
CP Films, Inc., a subsidiary of Solutia Inc. Micron Technology
Industrial Science & Technology Network, Inc. NanoMatrix, Inc.
Qimonda NanoSonic, Inc.
NanoTITAN MITRE Corporation
LEICA Microsystems Philip Morris USA
Lockheed Martin Northrop Grumman Newport News
Shipbuilding

RV and NRV Industry Clustering John P. McNamara 9
(6) Food Processing Industry Cluster in Virginia
Adolph Coors Company Kraft Foods
Anheuser Busch Companies Lipton Tea
Birdsong Peanuts Maple Leaf Bakery
Boar‘s Head Provisions Maruchan McKee Foods
Cargill Nestle USA
Coca-Cola Pepsi Bottling Group
Eastern Shore Seafood Products PepsiCo
Fiorucci Foods Perdue
Frito Lay Farms Sara Lee Coffee and Tea
H.P. Hood Smithfield Foods
Hershey Foods Tyson Foods
Iceland Seafood Universal Food & Beverage
Interbake Foods

RV and NRV Industry Clustering John P. McNamara 10
(7) Global Logistics Industry Cluster in Virginia
(8) Modeling & Simulation Industry Cluster in Virginia

RV and NRV Industry Clustering John P. McNamara 11
(9) Plastics Industry Cluster in Virginia
Alcoa Flexible Packaging M&H Plastics
Alloy Polymers, Inc. Melnor
BASFCP Films Inc. Plastics One, Inc.
Creative Urethanes Polymer Group, Inc.
DanChem Technologies PolyOne
Drake Extrusion, Inc. Printpack Inc.
DuPont Quadrant Engineering Plastics Products
Teijin Films Rubbermaid
Essel Propack America Sartomer Company
Gala Industries Strongwell
Glad Tessy
Goodyear Tire & Rubber Company Tredegar Corporation
Graham Packaging Honeywell Yokohama Tire
Intertape Polymer Group Yupo Corporation
Klöckner Pentaplast of America
(10) Wood Products Industry Cluster in Virginia

RV and NRV Industry Clustering John P. McNamara 12
Industry clusters have also been defined for the Roanoke Valley and New River Valley
by various constituencies. No additional data that might include specific businesses was
available. Virginia Ally Information Exchange defined industry clusters for the Roanoke Valley
as:
Automotive Manufacturing
Chemicals & Materials
Communication & Entertainment
Electronics Equipment & Instruments Manufacturing
Finance and Insurance
Health Care
Information Technology & Professional Services
Machinery & Equipment Manufacturing
Wood Products & Furniture Manufacturing
The New River Valley Planning District defined industry clusters for the New River Valley.
Again, no additional data was available.
Automotive
Contained Care
Chemicals and Plastics
High Tech
Food Processing
Health Services
Furniture and Wood Products
Textiles and Apparel
Location Quotients
In discussing industry clusters with Mr. John Hull, Roanoke Regional Economic
Resource Planner, it became apparent that some refer to industry clusters rather loosely. He is
currently gathering data from the Virginia Employment Commission and defining clusters by a
location quotient (LQ) formula (http://www.ibrc.indiana.edu/innovation/interactive.asp). An LQ
= 1 substantiates a developing cluster, and a heavily concentrated cluster is a LQ = 2 or more.
When looking at the Roanoke and New River Valleys, this methodology severely limited the

RV and NRV Industry Clustering John P. McNamara 13
information that this project was to generate. His data is as follows (Figure 19: Location
Quotient by Cluster, Roanoke Valley-Allegheny Regional Commission CEDS Region, 2006):
F ig ure 19: L ocation Quotient by C lus ter, R VAR C C E DS R eg ion, 2006
C lus ter
C lus ter
E mployment
LQ (VA
C O MP AR IS O N)
LQ (US
C O MP AR IS O N)
E lectrical equip, appliance and component manufacturing s ubc lus ter 1,432 4.161815176 2.940979894
Glas s and C eramics 760 4.710611395 2.062879342
F ores t and Wood P roducts 3,916 1.606139032 1.807191369
Motor Vehic le Manufacturing 3,175 2.546384202 1.541191893
Trans portation and Logis tics 6,559 1.367981417 1.385750124
C hemicals and C hemical-B as ed P roducts 3,663 1.785271499 1.365080233
C ons truction S ector 4,148 0.988034105 1.285840067
P rimary metal Manufacturing S ubc lus ter 622 2.68242734 1.239003181
Healthcare and S oc ial As s is tance S ector 22,823 1.42807149 1.208503461
Apparel and Textiles 1,638 1.248685785 1.163958671
B iomedical and B iotechnical L ife S c iences 17,325 1.410509546 1.152171766
R etail T rade S ector 19,932 1.066189695 1.085763989
F abricated metal product manufacturing s ubc lus ter 1,724 1.984513965 1.010124862
Advanced Materials 5,724 1.395201709 0.932623482
D efens e and S ecurity 7,260 0.488448808 0.926785353
Information Technology and Telecommunications 5,506 0.553148115 0.917259674
Trans portation equipment manufacturing s ubc lus ter 1,705 0.877435852 0.856239833
B us ines s and F inanc ial S ervices 11,341 0.610007648 0.853889986
E nergy (F os s il and R enewable) 5,621 0.702169919 0.827277281
Mining 181 1.053714593 0.796287855
P rinting and P ublis hing 2,131 0.892677383 0.77146194
Arts , E ntertainment, R ecreation and Vis itor Indus tries 3,734 0.74330111 0.654659841
Government and P ublic Adminis tration S ector 5,210 0.571557348 0.641184725
Machinery manufacturing s ubc lus ter 785 1.012510019 0.585925145
C omputer and electronic product manufacturing s ubc lus ter 820 1.186763256 0.555730522
E ducation and K nowledge C reaton 2,953 0.581832551 0.54419025
Agribus ines s , F ood P roces s ing and Technology 1,102 0.520338472 0.323989915
S ource: Virginia E mployment C ommis s ion, Q C E W, 2007.
Note that there are only four (4) industry clusters in the Virginia comparison column (ten
with potential development) and two (2) in the U.S. comparison column (eleven with potential
development) using the location quotient. This created a dilemma for the further development of
this project. In discussions with Dr. McKeon and Ms. Kathryn Tisinger, Manager of the RHEC
Career Center, a ―cluster‖ list for the Roanoke and New River Valleys was generated and noted

RV and NRV Industry Clustering John P. McNamara 14
as ―sectors‖ rather than clusters. This was necessary due to the limitations of potential industry
development as defined by various constituencies. By looking more to occupational
development rather than industrial development, sectors seemed more logical for this project
versus clusters (as defined by economic planning experts).
Roanoke Valley and New River Valley Industry Sectors
With Potential Growth
The ten (10) industry sectors that were defined for this project include the following.
Each of these has potential for growth in the Roanoke and/or the New River Valley regions.
1. Agriculture, Forestry and Fishing
Administrative
Technician
2. Biomedical
Research, product development and patents
Administrative/executive
3. Business, Finance and Insurance
CFO‘s
Lenders
Claims personnel
Real estate
Computer technology
Administrative
4. Chemical, Mining, Construction, and Machine & Equipment Manufacturing
Administrative
Operations
5. Education
Classroom instruction PK-12
Higher education
Administration
6. Government and Public Administration
Public Safety: EMS, Fire, Police, Airport
7. Healthcare
Clinical
Non-clinical
8. Information Technology
Computer
Telecommunications
Customer service

RV and NRV Industry Clustering John P. McNamara 15
9. Retail
Sales
Administration
10. Tourism
Administration
Customer service
These industries have been defined as sectors so as not to confuse them with clusters. It
is from these sectors that this project was furthered. The matrix below indicates the present
offerings in each sector at the Roanoke Higher Education Center.
Sector Potential/Institutional Development Matrix
School Sector
1 2 3 4 5 6 7 8 9 10
Averett University O O X O X O O O O O
Bluefield College O O X O O X X O O O
Hampton University O O X O O X O O O O
Hollins University O O O O X O O O O O
James Madison University O O O O X X O O O O
Jefferson College of Health Sciences O O O O O O X O O O
Mary Baldwin College O O X O X X X O O O
Nova Southeastern University O O O O X O O O O O
Old Dominion University O O O O X O O O O O
Radford University O O X O X X X X O O
Roanoke College O O O O O O O O O O
TAP/This Valley Works O O X O O O X O O O
University of Virginia O O X O X O X X O O
Virginia Tech Roanoke Center O O X X X X O X O O

RV and NRV Industry Clustering John P. McNamara 16
Sector
1 2 3 4 5 6 7 8 9 10
Virginia Western Community College O O X O O O O X O O
Western VA Workforce Development Board O O O O O O O O O O
**An ‘X’ in the sector column indicates it that applies to the member; ‘O’ indicates does not apply.
O*NET
After developing usable sectors for this project, the next step was to understand what
skills were needed for each sector. This will be useful in the future development of educational
and training needs. O*NET, funded by the U.S. Department of Labor, was used in the
development of skill matrices. A description of O*NET follows.
The O*NET program is the nation's primary source of occupational information.
Central to the project is the O*NET database, containing information on hundreds of
standardized and occupation-specific descriptors. The database is continually updated by
surveying a broad range of workers from each occupation. Information from this freely
available database forms the heart of O*NET OnLine, the interactive application for
exploring and searching occupations. The database also provides the basis for our Career
Exploration Tools, a set of valuable assessment instruments for workers and students
looking to find or change careers.
Content Model: Anatomy of an occupation
Every occupation requires a different mix of knowledge, skills, and abilities, and
is performed using a variety of activities and tasks. These distinguishing characteristics of
an occupation are described by the O*NET Content Model, which encapsulates the key
features of an occupation into a standardized, measurable set of variables called
"descriptors". The hierarchical model starts with six domains, describing the day-to-day
aspects of the job and the qualifications and interests of the typical worker. The model
expands to 277 descriptors collected by the O*NET program, with more collected by
other federal agencies such as the Bureau of Labor Statistics.
O*NET-SOC Taxonomy: A spectrum of occupations
While the Content Model defines the information structure for a single
occupation, the O*NET-SOC taxonomy defines the set of occupations across the world
of work. Based on the Standard Occupational Classification, the O*NET-SOC taxonomy

RV and NRV Industry Clustering John P. McNamara 17
currently includes 812 occupations which currently have, or are scheduled to have, data
collected from job incumbents or occupation experts. To keep up with the changing
occupational landscape, the taxonomy is periodically revised; the last revision was in
2006, with additional new and emerging occupations coming in a future update.
Data Collection: Real-world information
The O*NET-SOC taxonomy defines the occupations, and the Content Model
outlines which information is collected; the Data Collection program brings these
frameworks to life with results from the working public. The O*NET database was
initially populated by a group of occupation analysts; this information is augmented by
ongoing surveys of each occupation's worker population and occupation experts. These
statistical results are incorporated into new versions of the database on an annual
schedule, to provide up-to-date information on occupations as they evolve over time. The
latest database releases are available from the Developer's Corner.
The Skills Matrix
To this point discussion has focused on the definition of industry clusters, industry
clusters that exist in the Roanoke and New River Valleys, clusters (that were defined as sectors)
that have potential for growth, and markets and jobs in the U.S. that are hot for 2008. The source
for occupational information to address skills needed comes from O*NET as described above.
The following skills matrix was developed from the O*NET site. It can be used to help identify
skills needed for particular occupations (adapted from http://www.onetcenter.org/).
.RHEC Sector Skills Matrix Worksheet
Skill Sector
1 2 3 4 5 6 7 8 9 10
I. Basic Skills
Developed capacities that facilitate learning or the more rapid acquisition of knowledge
Active Learning:
Active Listening:
Critical Thinking:
Learning Strategies:
Mathematics:
Monitoring:
Reading Comprehension:
Science:
Speaking:
Writing:

RV and NRV Industry Clustering John P. McNamara 18
Skill Sector
1 2 3 4 5 6 7 8 9 10
II. Complex Problem Solving Skills
Developed capacities used to solve novel, ill-defined problems in complex, real-world settings
Complex Problem Solving:
III. Resource Management Skills
Developed capacities used to allocate resources efficiently Management of Financial Resources:
Management of Material Resources:
Management of Personnel Resources:
Time Management:
IV. Social Skills
Developed capacities used to work with people to achieve goals
Coordination:
Instructing:
Negotiation:
Persuasion:
Service Orientation:
Social Perceptiveness:
V. Systems Skills
Developed capacities used to understand, monitor, and improve socio-technical systems Judgment and Decision Making:
Systems Analysis:
Systems Evaluation:
VI. Technical Skills
Developed capacities used to design, set-up, operate, and correct malfunctions involving application of machines or technological systems Equipment Maintenance:
Equipment Selection:
Installation:
Operation and Control:
Operation Monitoring:
Operations Analysis:
Programming:
Quality Control Analysis:
Repairing:
Technology Design:
Troubleshooting:

RV and NRV Industry Clustering John P. McNamara 19
The Skills Matrix Descriptions (for the RHEC Sector Skills Matrix)
Skill I. Basic Skills
Developed capacities that facilitate learning or the more rapid acquisition of knowledge
Active Learning: Understanding the implications of new information for both current and future problem-solving
and decision-making.
Active Listening: Giving full attention to what other people are saying, taking time to understand the points being
made, asking questions as appropriate, and not interrupting at inappropriate times.
Critical Thinking: Using logic and reasoning to identify the strengths and weaknesses of alternative solutions,
conclusions or approaches to problems.
Learning Strategies: Selecting and using training/instructional methods and procedures appropriate for the situation
when learning or teaching new things.
Mathematics: Using mathematics to solve problems.
Monitoring: Monitoring/Assessing performance of yourself, other individuals, or organizations to make
improvements or take corrective action.
Reading Comprehension: Understanding written sentences and paragraphs in work related documents.
Science: Using scientific rules and methods to solve problems.
Speaking: Talking to others to convey information effectively.
Writing: Communicating effectively in writing as appropriate for the needs of the audience.
II. Complex Problem Solving Skills
Developed capacities used to solve novel, ill-defined problems in complex, real-world settings
Complex Problem Solving: Identifying complex problems and reviewing related information to develop and
evaluate options and implement solutions.
III. Resource Management Skills
Developed capacities used to allocate resources efficiently Management of Financial Resources: Determining how money will be spent to get the work done, and accounting
for these expenditures.
Management of Material Resources: Obtaining and seeing to the appropriate use of equipment, facilities, and
materials needed to do certain work.
Management of Personnel Resources: Motivating, developing, and directing people as they work, identifying the
best people for the job.
Time Management: Managing one's own time and the time of others.
IV. Social Skills
Developed capacities used to work with people to achieve goals
Coordination: Adjusting actions in relation to others' actions.
Instructing: Teaching others how to do something.
Negotiation: Bringing others together and trying to reconcile differences.
Persuasion: Persuading others to change their minds or behavior.
Service Orientation: Actively looking for ways to help people.
Social Perceptiveness: Being aware of others' reactions and understanding why they react as they do.
V. Systems Skills
Developed capacities used to understand, monitor, and improve socio-technical systems Judgment and Decision Making: Considering the relative costs and benefits of potential actions to choose the most
appropriate one.
Systems Analysis: Determining how a system should work and how changes in conditions, operations, and the
environment will affect outcomes.
RV and NRV Industry Clustering John P. McNamara 20
Systems Evaluation: Identifying measures or indicators of system performance and the actions needed to improve or
correct performance, relative to the goals of the system.
VI. Technical Skills
Developed capacities used to design, set-up, operate, and correct malfunctions involving application of machines or technological systems Equipment Maintenance: Performing routine maintenance on equipment and determining when and what kind of
maintenance is needed.
Equipment Selection: Determining the kind of tools and equipment needed to do a job.
Installation: Installing equipment, machines, wiring, or programs to meet specifications.
Operation and Control: Controlling operations of equipment or systems.
Operation Monitoring: Watching gauges, dials, or other indicators to make sure a machine is working properly.
Operations Analysis: Analyzing needs and product requirements to create a design.
Programming: Writing computer programs for various purposes.
Quality Control Analysis: Conducting tests and inspections of products, services, or processes to evaluate quality or
performance.
Repairing: Repairing machines or systems using the needed tools.
Technology Design: Generating or adapting equipment and technology to serve user needs.
Troubleshooting: Determining causes of operating errors and deciding what to do about it.
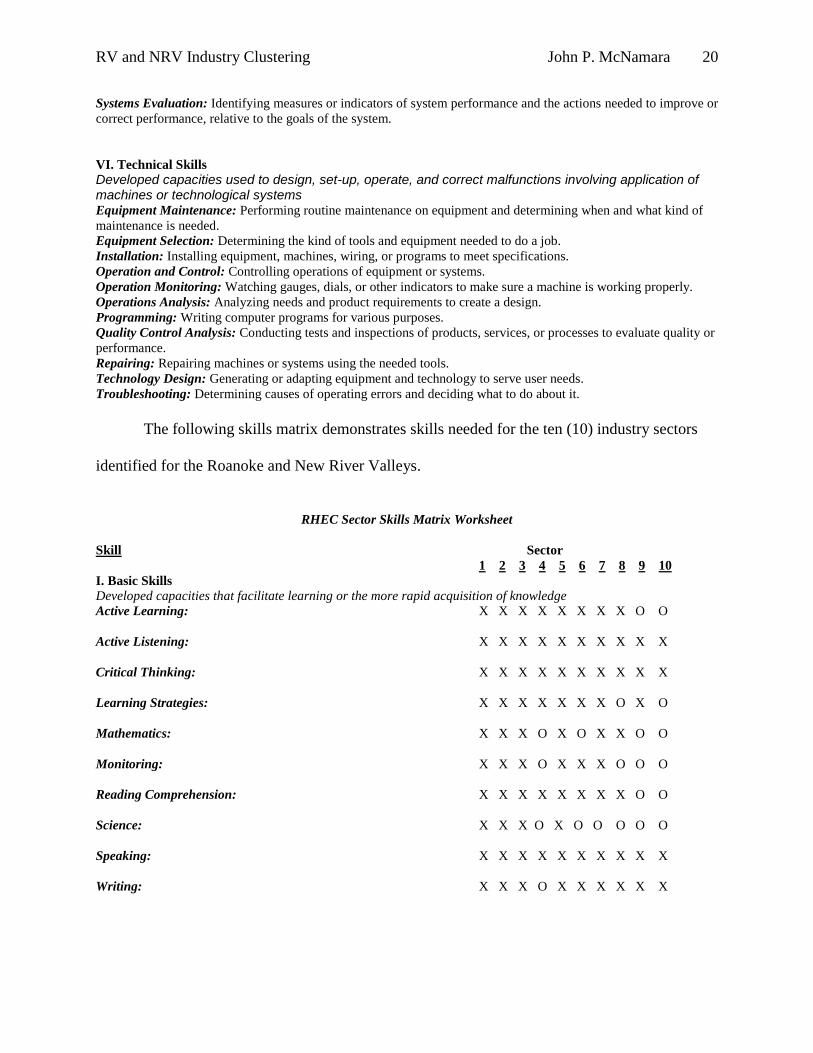
The following skills matrix demonstrates skills needed for the ten (10) industry sectors
identified for the Roanoke and New River Valleys.
RHEC Sector Skills Matrix Worksheet
Skill Sector
1 2 3 4 5 6 7 8 9 10
I. Basic Skills
Developed capacities that facilitate learning or the more rapid acquisition of knowledge
Active Learning: X X X X X X X X O O
Active Listening: X X X X X X X X X X
Critical Thinking: X X X X X X X X X X
Learning Strategies: X X X X X X X O X O
Mathematics: X X X O X O X X O O
Monitoring: X X X O X X X O O O
Reading Comprehension: X X X X X X X X O O
Science: X X X O X O O O O O
Speaking: X X X X X X X X X X
Writing: X X X O X X X X X X

RV and NRV Industry Clustering John P. McNamara 21
Sector
1 2 3 4 5 6 7 8 9 10
II. Complex Problem Solving Skills Developed capacities used to solve novel, ill-defined problems in complex, real-world settings
Complex Problem Solving: X X X O X X X X O O
III. Resource Management Skills Developed capacities used to allocate resources efficiently
Management of Financial Resources: X X X O O X O O X O
Management of Material Resources: X X X O X X O O X O
Management of Personnel Resources: X X X O O X X O X O
Time Management: X X X X X X X X X X
IV. Social Skills Developed capacities used to work with people to achieve goals
Coordination: X X X X X X X X X X
Instructing: O X X O X X X X X X
Negotiation: O X X O X X X O X O
Persuasion: O X X O X X X O X X
Service Orientation: X X X O X X X X X X
Social Perceptiveness: X X X O X X X X X X
V. Systems Skills Developed capacities used to understand, monitor, and improve socio-technical systems
Judgment and Decision Making: X X X X X X X X X O
Systems Analysis: X X X O O X O O O O
Systems Evaluation: O X X O O X O O O O
VI. Technical Skills Developed capacities used to design, set-up, operate, and correct malfunctions involving application of machines or
technological systems
Equipment Maintenance: X X X X O O O X O O
Equipment Selection: X X X X O O O X X O
Installation: X X X X O O O X X O
Operation and Control: X X X X O O X X O O
Operation Monitoring: X X X X O O O X O O

RV and NRV Industry Clustering John P. McNamara 22
Sector
1 2 3 4 5 6 7 8 9 10
Operations Analysis: O X X X O O O X O O
Programming: O X X O O O O X O O
Quality Control Analysis: O X X O O O O X O O
Repairing: X X X O O O O X O O
Technology Design: O X X O O O O X O O
Troubleshooting: X X X X X O X X X X
Adapted from U.S. Department of Labor X = skill necessary
http://www.onetcenter.org/ O = skill not necessary
High Growth Industries
With industry sectors defined and skills noted for those sectors, recognizing groups of
occupations (Job Families) based upon work performed, skills, education, training, and
credentials was constructed using O*NET (http://online.onetcenter.org/find/). National High
Growth Industries are economically critical, projected to add substantial numbers of new jobs,
and are being transformed by technology and innovation. Many occupations require education in
science, technology, engineering, and mathematics (STEM) disciplines. These High Growth
Industry Job Families are noted below for each of the ten (10) defined industry sectors for this
project.
1. Farming, Fishing, and Forestry
Code Occupation
45-2091.00 Agricultural Equipment Operators
45-2011.00 Agricultural Inspectors
45-2099.99 Agricultural Workers, All Other
45-2021.00 Animal Breeders
45-4021.00 Fallers
45-1012.00 Farm Labor Contractors
45-2092.02 Farm workers and Laborers, Crop

RV and NRV Industry Clustering John P. McNamara 23
45-2092.00 Farm workers and Laborers, Crop, Nursery, and
Greenhouse
45-2093.00 Farm workers, Farm and Ranch Animals
45-1011.07 First-Line Supervisors/Managers of Agricultural Crop and
Horticultural Workers
45-1011.08 First-Line Supervisors/Managers of Animal Husbandry and
Animal Care Workers
45-1011.06 First-Line Supervisors/Managers of Aquacultural Workers
45-1011.00 First-Line Supervisors/Managers of Farming, Fishing, and
Forestry Workers
45-1011.05 First-Line Supervisors/Managers of Logging Workers
45-3011.00 Fishers and Related Fishing Workers
45-4011.00 Forest and Conservation Workers
45-2041.00 Graders and Sorters, Agricultural Products
45-3021.00 Hunters and Trappers
45-4023.00 Log Graders and Scalers
45-4022.00 Logging Equipment Operators
45-4029.99 Logging Workers, All Other
45-2092.01 Nursery Workers
2. Biotechnology
Projected
Growth (2006-
2016)
Projected
Need (2006-
2016) Code Occupation
Much faster than
average
42000 19-2041.00 Environmental Scientists and Specialists, Including Health
Much faster than
average
6000 17-2031.00 Biomedical Engineers
Faster than
average
46000 29-2012.00 Medical and Clinical Laboratory Technicians
Faster than
average
45000 19-1042.00 Medical Scientists, Except Epidemiologists
Faster than
average
41000 19-4021.00 Biological Technicians
Faster than
average
7000 19-1021.00 Biochemists and Biophysicists
Average 142000 41-4011.00 Sales Representatives, Wholesale and Manufacturing,
Technical and Scientific Products
Average 46000 29-2011.00 Medical and Clinical Laboratory Technologists
Average 30000 19-2031.00 Chemists
Average 22000 17-3026.00 Industrial Engineering Technicians

RV and NRV Industry Clustering John P. McNamara 24
Average 10000 17-2041.00 Chemical Engineers
Average 6000 19-1023.00 Zoologists and Wildlife Biologists
Average 6000 19-4011.00 Agricultural and Food Science Technicians
19-4011.01 Agricultural Technicians
19-4011.02 Food Science Technicians
Average 5000 19-1022.00 Microbiologists
Slower than
average
24000 19-4031.00 Chemical Technicians
Decline slowly
or moderately
23000 51-9023.00 Mixing and Blending Machine Setters, Operators, and
Tenders
Decline slowly
or moderately
10000 51-9012.00 Separating, Filtering, Clarifying, Precipitating, and Still
Machine Setters, Operators, and Tenders
3. Business and Financial Operations
Code Occupation
13-2011.01 Accountants
13-2011.00 Accountants and Auditors
13-1011.00 Agents and Business Managers of Artists, Performers, and
Athletes
13-2021.00 Appraisers and Assessors of Real Estate
13-2021.02 Appraisers, Real Estate
13-2021.01 Assessors
13-2011.02 Auditors
13-2031.00 Budget Analysts
13-1199.99 Business Operations Specialists, All Other
13-1031.00 Claims Adjusters, Examiners, and Investigators
13-1031.01 Claims Examiners, Property and Casualty Insurance
13-1072.00 Compensation, Benefits, and Job Analysis Specialists
13-1041.00 Compliance Officers, Except Agriculture, Construction,
Health and Safety, and Transportation
13-1041.06 Coroners
13-1051.00 Cost Estimators
13-2041.00 Credit Analysts
13-1061.00 Emergency Management Specialists
13-1071.01 Employment Interviewers
13-1071.00 Employment, Recruitment, and Placement Specialists
13-1041.01 Environmental Compliance Inspectors
13-1041.03 Equal Opportunity Representatives and Officers
13-2051.00 Financial Analysts
13-2061.00 Financial Examiners
13-2099.99 Financial Specialists, All Other

RV and NRV Industry Clustering John P. McNamara 25
13-1041.04 Government Property Inspectors and Investigators
13-1079.99 Human Resources, Training, and Labor Relations
Specialists, All Other
13-1031.02 Insurance Adjusters, Examiners, and Investigators
13-1032.00 Insurance Appraisers, Auto Damage
13-2053.00 Insurance Underwriters
13-1041.02 Licensing Examiners and Inspectors
13-2071.00 Loan Counselors
13-2072.00 Loan Officers
13-1081.00 Logisticians
13-1111.00 Management Analysts
13-1121.00 Meeting and Convention Planners
13-2052.00 Personal Financial Advisors
13-1071.02 Personnel Recruiters
13-1021.00 Purchasing Agents and Buyers, Farm Products
13-1023.00 Purchasing Agents, Except Wholesale, Retail, and Farm
Products
13-2081.00 Tax Examiners, Collectors, and Revenue Agents
13-2082.00 Tax Preparers
13-1073.00 Training and Development Specialists
13-1022.00 Wholesale and Retail Buyers, Except Farm Products
4. Construction and Extraction
Code Occupation
47-2011.00 Boilermakers
47-2021.00 Brick masons and Block masons
47-2031.00 Carpenters
47-2041.00 Carpet Installers
47-2051.00 Cement Masons and Concrete Finishers
47-4011.00 Construction and Building Inspectors
47-4099.99 Construction and Related Workers, All Other
47-2031.01 Construction Carpenters
47-2061.00 Construction Laborers
47-5041.00 Continuous Mining Machine Operators
47-5011.00 Derrick Operators, Oil and Gas
47-2081.00 Drywall and Ceiling Tile Installers
47-5021.00 Earth Drillers, Except Oil and Gas
47-2111.00 Electricians
47-4021.00 Elevator Installers and Repairers
47-5031.00 Explosives Workers, Ordnance Handling Experts, and
Blasters

RV and NRV Industry Clustering John P. McNamara 26
47-5099.99 Extraction Workers, All Other
47-4031.00 Fence Erectors
47-1011.00 First-Line Supervisors/Managers of Construction Trades
and Extraction Workers
47-2042.00 Floor Layers, Except Carpet, Wood, and Hard Tiles
47-2043.00 Floor Sanders and Finishers
47-2121.00 Glaziers
47-4041.00 Hazardous Materials Removal Workers
47-3019.99 Helpers, Construction Trades, All Other
47-3011.00 Helpers—Brick masons, Block masons, Stonemasons, and
Tile and Marble Setters
47-3012.00 Helpers—Carpenters
47-3013.00 Helpers—Electricians
47-5081.00 Helpers--Extraction Workers
47-3014.00 Helpers--Painters, Paperhangers, Plasterers, and Stucco
Masons
47-3015.00 Helpers—Pipe layers, Plumbers, Pipefitters, and
Steamfitters
47-3016.00 Helpers—Roofers
47-4051.00 Highway Maintenance Workers
47-2131.00 Insulation Workers, Floor, Ceiling, and Wall
47-2132.00 Insulation Workers, Mechanical
47-5042.00 Mine Cutting and Channeling Machine Operators
47-5049.99 Mining Machine Operators, All Other
47-2073.00 Operating Engineers and Other Construction Equipment
Operators
47-2141.00 Painters, Construction and Maintenance
47-2142.00 Paperhangers
47-2071.00 Paving, Surfacing, and Tamping Equipment Operators
47-2072.00 Pile-Driver Operators
47-2152.01 Pipe Fitters and Steamfitters
47-2151.00 Pipe layers
47-2161.00 Plasterers and Stucco Masons
47-2152.02 Plumbers
47-2152.00 Plumbers, Pipefitters, and Steamfitters
47-4061.00 Rail-Track Laying and Maintenance Equipment Operators
47-2171.00 Reinforcing Iron and Rebar Workers
47-5051.00 Rock Splitters, Quarry
47-5061.00 Roof Bolters, Mining
47-2181.00 Roofers
47-5012.00 Rotary Drill Operators, Oil and Gas
47-2031.02 Rough Carpenters
47-5071.00 Roustabouts, Oil and Gas
RV and NRV Industry Clustering John P. McNamara 27
47-4091.00 Segmental Pavers
47-4071.00 Septic Tank Servicers and Sewer Pipe Cleaners
47-5013.00 Service Unit Operators, Oil, Gas, and Mining
47-2211.00 Sheet Metal Workers
47-2022.00 Stonemasons
47-2221.00 Structural Iron and Steel Workers
47-2082.00 Tapers
47-2053.00 Terrazzo Workers and Finishers
47-2044.00 Tile and Marble Setters
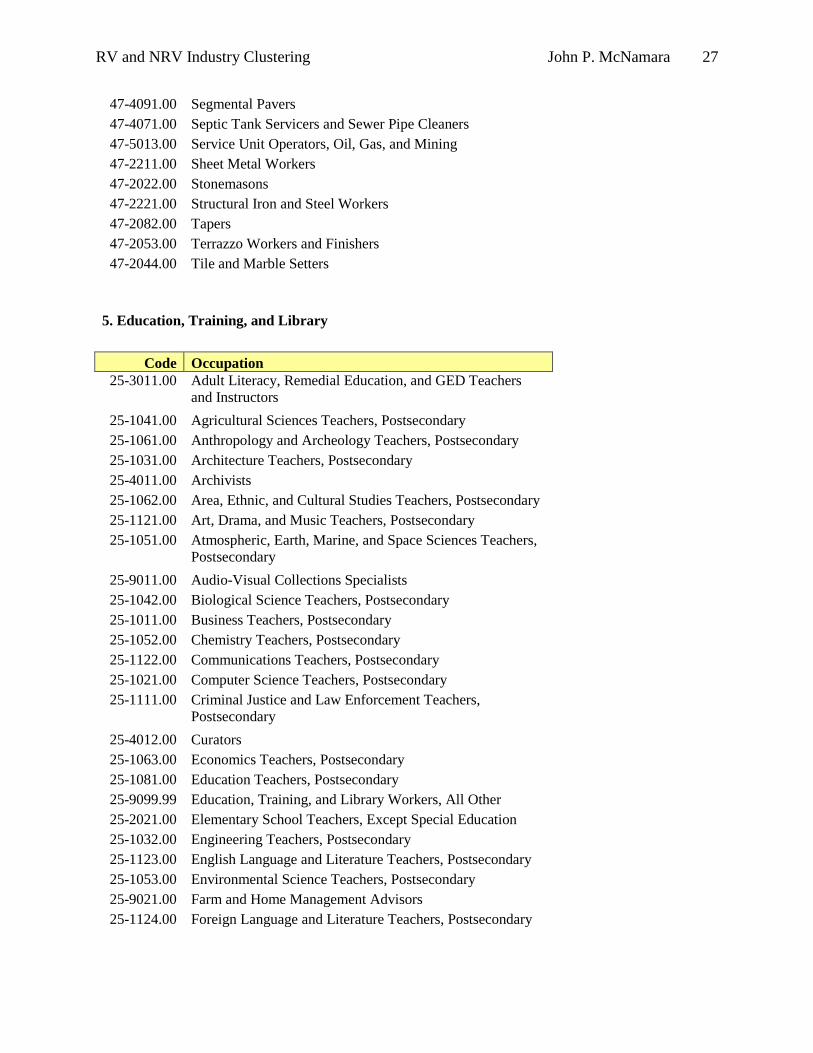
5. Education, Training, and Library
Code Occupation
25-3011.00 Adult Literacy, Remedial Education, and GED Teachers
and Instructors
25-1041.00 Agricultural Sciences Teachers, Postsecondary
25-1061.00 Anthropology and Archeology Teachers, Postsecondary
25-1031.00 Architecture Teachers, Postsecondary
25-4011.00 Archivists
25-1062.00 Area, Ethnic, and Cultural Studies Teachers, Postsecondary
25-1121.00 Art, Drama, and Music Teachers, Postsecondary
25-1051.00 Atmospheric, Earth, Marine, and Space Sciences Teachers,
Postsecondary
25-9011.00 Audio-Visual Collections Specialists
25-1042.00 Biological Science Teachers, Postsecondary
25-1011.00 Business Teachers, Postsecondary
25-1052.00 Chemistry Teachers, Postsecondary
25-1122.00 Communications Teachers, Postsecondary
25-1021.00 Computer Science Teachers, Postsecondary
25-1111.00 Criminal Justice and Law Enforcement Teachers,
Postsecondary
25-4012.00 Curators
25-1063.00 Economics Teachers, Postsecondary
25-1081.00 Education Teachers, Postsecondary
25-9099.99 Education, Training, and Library Workers, All Other
25-2021.00 Elementary School Teachers, Except Special Education
25-1032.00 Engineering Teachers, Postsecondary
25-1123.00 English Language and Literature Teachers, Postsecondary
25-1053.00 Environmental Science Teachers, Postsecondary
25-9021.00 Farm and Home Management Advisors
25-1124.00 Foreign Language and Literature Teachers, Postsecondary

RV and NRV Industry Clustering John P. McNamara 28
25-1043.00 Forestry and Conservation Science Teachers, Postsecondary
25-1064.00 Geography Teachers, Postsecondary
25-1191.00 Graduate Teaching Assistants
25-1071.00 Health Specialties Teachers, Postsecondary
25-1125.00 History Teachers, Postsecondary
25-1192.00 Home Economics Teachers, Postsecondary
25-9031.00 Instructional Coordinators
25-2012.00 Kindergarten Teachers, Except Special Education
25-1112.00 Law Teachers, Postsecondary
25-4021.00 Librarians
25-1082.00 Library Science Teachers, Postsecondary
25-4031.00 Library Technicians
25-1022.00 Mathematical Science Teachers, Postsecondary
25-2022.00 Middle School Teachers, Except Special and Vocational
Education
25-4013.00 Museum Technicians and Conservators
25-1072.00 Nursing Instructors and Teachers, Postsecondary
25-1126.00 Philosophy and Religion Teachers, Postsecondary
25-1054.00 Physics Teachers, Postsecondary
25-1065.00 Political Science Teachers, Postsecondary
25-1199.99 Postsecondary Teachers, All Other
25-2011.00 Preschool Teachers, Except Special Education
25-1066.00 Psychology Teachers, Postsecondary
25-1193.00 Recreation and Fitness Studies Teachers, Postsecondary
25-2031.00 Secondary School Teachers, Except Special and Vocational
Education
25-3021.00 Self-Enrichment Education Teachers
25-1069.99 Social Sciences Teachers, Postsecondary, All Other
25-1113.00 Social Work Teachers, Postsecondary
25-1067.00 Sociology Teachers, Postsecondary
25-2042.00 Special Education Teachers, Middle School
25-2041.00 Special Education Teachers, Preschool, Kindergarten, and
Elementary School
25-2043.00 Special Education Teachers, Secondary School
25-9041.00 Teacher Assistants
25-3099.99 Teachers and Instructors, All Other
25-2023.00 Vocational Education Teachers, Middle School
25-1194.00 Vocational Education Teachers, Postsecondary
25-2032.00 Vocational Education Teachers, Secondary School

RV and NRV Industry Clustering John P. McNamara 29
6. Management
Code Occupation
11-3011.00 Administrative Services Managers
11-2011.00 Advertising and Promotions Managers
11-9011.03 Aquacultural Managers
11-1011.00 Chief Executives
11-3041.00 Compensation and Benefits Managers
11-3021.00 Computer and Information Systems Managers
11-9021.00 Construction Managers
11-9011.02 Crop and Livestock Managers
11-9039.99 Education Administrators, All Other
11-9032.00 Education Administrators, Elementary and Secondary
School
11-9033.00 Education Administrators, Postsecondary
11-9031.00 Education Administrators, Preschool and Child Care
Center/Program
11-9041.00 Engineering Managers
11-9011.00 Farm, Ranch, and Other Agricultural Managers
11-9012.00 Farmers and Ranchers
11-3031.00 Financial Managers
11-3031.02 Financial Managers, Branch or Department
11-9051.00 Food Service Managers
11-9061.00 Funeral Directors
11-9071.00 Gaming Managers
11-1021.00 General and Operations Managers
11-3040.00 Human Resources Managers
11-3049.99 Human Resources Managers, All Other
11-3051.00 Industrial Production Managers
11-1031.00 Legislators
11-9081.00 Lodging Managers
11-9199.99 Managers, All Other
11-2021.00 Marketing Managers
11-9111.00 Medical and Health Services Managers
11-9121.00 Natural Sciences Managers
11-9011.01 Nursery and Greenhouse Managers
11-9131.00 Postmasters and Mail Superintendents
11-9141.00 Property, Real Estate, and Community Association
Managers
11-2031.00 Public Relations Managers
11-3061.00 Purchasing Managers
11-2022.00 Sales Managers
11-9151.00 Social and Community Service Managers
RV and NRV Industry Clustering John P. McNamara 30
11-3071.02 Storage and Distribution Managers
11-3042.00 Training and Development Managers
11-3071.01 Transportation Managers
11-3071.00 Transportation, Storage, and Distribution Managers
11-3031.01 Treasurers and Controllers
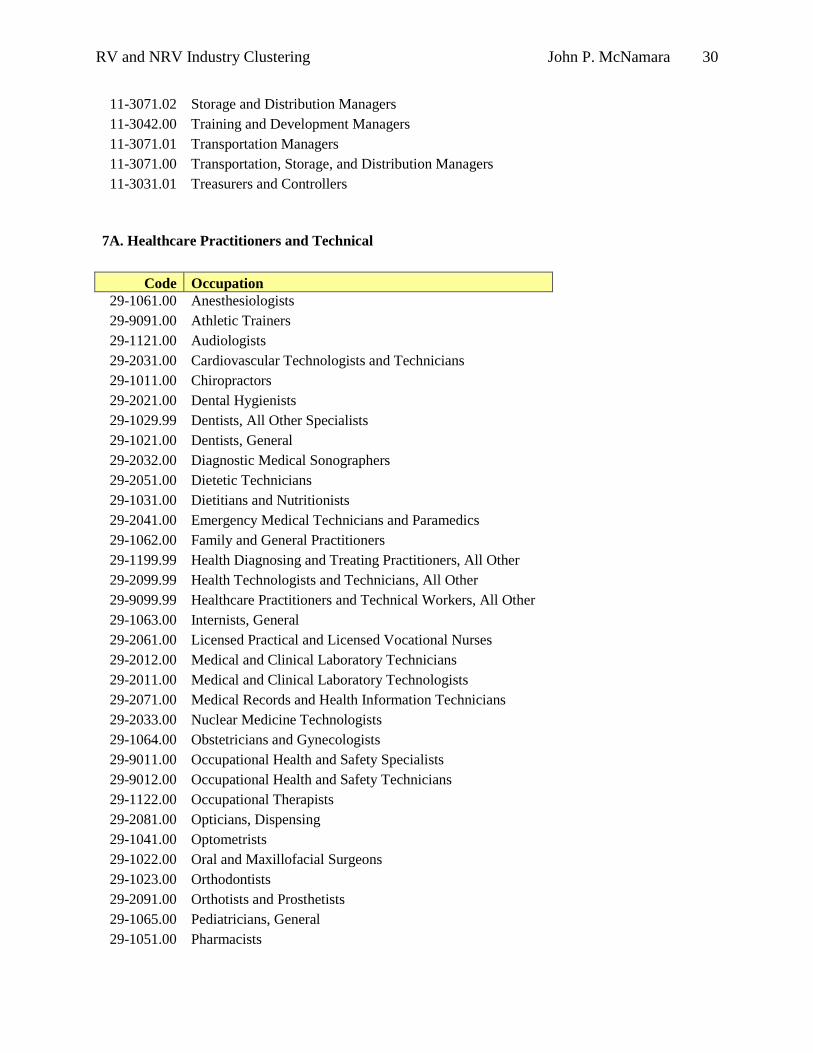
7A. Healthcare Practitioners and Technical
Code Occupation
29-1061.00 Anesthesiologists
29-9091.00 Athletic Trainers
29-1121.00 Audiologists
29-2031.00 Cardiovascular Technologists and Technicians
29-1011.00 Chiropractors
29-2021.00 Dental Hygienists
29-1029.99 Dentists, All Other Specialists
29-1021.00 Dentists, General
29-2032.00 Diagnostic Medical Sonographers
29-2051.00 Dietetic Technicians
29-1031.00 Dietitians and Nutritionists
29-2041.00 Emergency Medical Technicians and Paramedics
29-1062.00 Family and General Practitioners
29-1199.99 Health Diagnosing and Treating Practitioners, All Other
29-2099.99 Health Technologists and Technicians, All Other
29-9099.99 Healthcare Practitioners and Technical Workers, All Other
29-1063.00 Internists, General
29-2061.00 Licensed Practical and Licensed Vocational Nurses
29-2012.00 Medical and Clinical Laboratory Technicians
29-2011.00 Medical and Clinical Laboratory Technologists
29-2071.00 Medical Records and Health Information Technicians
29-2033.00 Nuclear Medicine Technologists
29-1064.00 Obstetricians and Gynecologists
29-9011.00 Occupational Health and Safety Specialists
29-9012.00 Occupational Health and Safety Technicians
29-1122.00 Occupational Therapists
29-2081.00 Opticians, Dispensing
29-1041.00 Optometrists
29-1022.00 Oral and Maxillofacial Surgeons
29-1023.00 Orthodontists
29-2091.00 Orthotists and Prosthetists
29-1065.00 Pediatricians, General
29-1051.00 Pharmacists
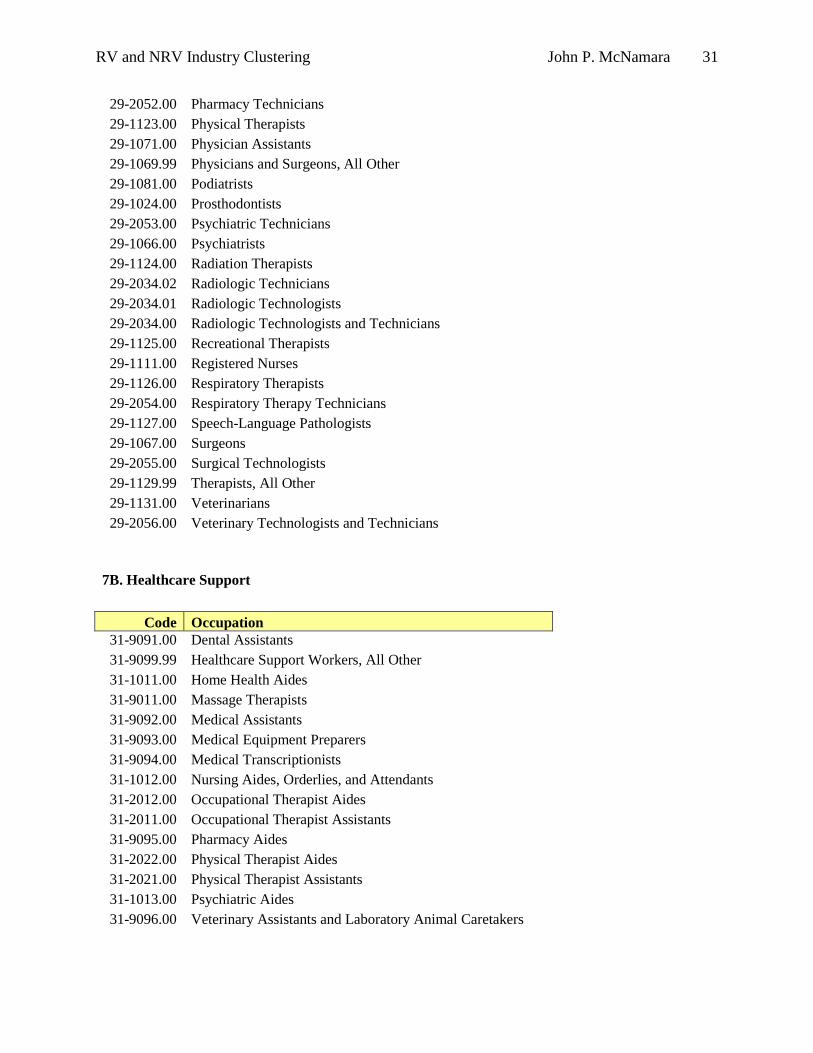
RV and NRV Industry Clustering John P. McNamara 31
29-2052.00 Pharmacy Technicians
29-1123.00 Physical Therapists
29-1071.00 Physician Assistants
29-1069.99 Physicians and Surgeons, All Other
29-1081.00 Podiatrists
29-1024.00 Prosthodontists
29-2053.00 Psychiatric Technicians
29-1066.00 Psychiatrists
29-1124.00 Radiation Therapists
29-2034.02 Radiologic Technicians
29-2034.01 Radiologic Technologists
29-2034.00 Radiologic Technologists and Technicians
29-1125.00 Recreational Therapists
29-1111.00 Registered Nurses
29-1126.00 Respiratory Therapists
29-2054.00 Respiratory Therapy Technicians
29-1127.00 Speech-Language Pathologists
29-1067.00 Surgeons
29-2055.00 Surgical Technologists
29-1129.99 Therapists, All Other
29-1131.00 Veterinarians
29-2056.00 Veterinary Technologists and Technicians
7B. Healthcare Support
Code Occupation
31-9091.00 Dental Assistants
31-9099.99 Healthcare Support Workers, All Other
31-1011.00 Home Health Aides
31-9011.00 Massage Therapists
31-9092.00 Medical Assistants
31-9093.00 Medical Equipment Preparers
31-9094.00 Medical Transcriptionists
31-1012.00 Nursing Aides, Orderlies, and Attendants
31-2012.00 Occupational Therapist Aides
31-2011.00 Occupational Therapist Assistants
31-9095.00 Pharmacy Aides
31-2022.00 Physical Therapist Aides
31-2021.00 Physical Therapist Assistants
31-1013.00 Psychiatric Aides
31-9096.00 Veterinary Assistants and Laboratory Animal Caretakers

RV and NRV Industry Clustering John P. McNamara 32
8. Information Technology
Projected
Growth (2006-
2016)
Projected
Need (2006-
2016) Code Occupation
Much faster than
average
300000 15-1031.00 Computer Software Engineers, Applications
Much faster than
average
280000 15-1051.00 Computer Systems Analysts
Much faster than
average
193000 15-1081.00 Network Systems and Data Communications Analysts
Much faster than
average
154000 15-1071.00 Network and Computer Systems Administrators
15-1071.01 Computer Security Specialists
Much faster than
average
150000 15-1032.00 Computer Software Engineers, Systems Software
Much faster than
average
47000 15-1061.00 Database Administrators
Much faster than
average
12000 15-1011.00 Computer and Information Scientists, Research
Faster than
average
86000 11-3021.00 Computer and Information Systems Managers
Average 242000 15-1041.00 Computer Support Specialists
Average 26000 41-9031.00 Sales Engineers
Slower than
average
58000 17-2141.00 Mechanical Engineers
Slower than
average
28000 17-2061.00 Computer Hardware Engineers
Decline slowly
or moderately
91000 15-1021.00 Computer Programmers
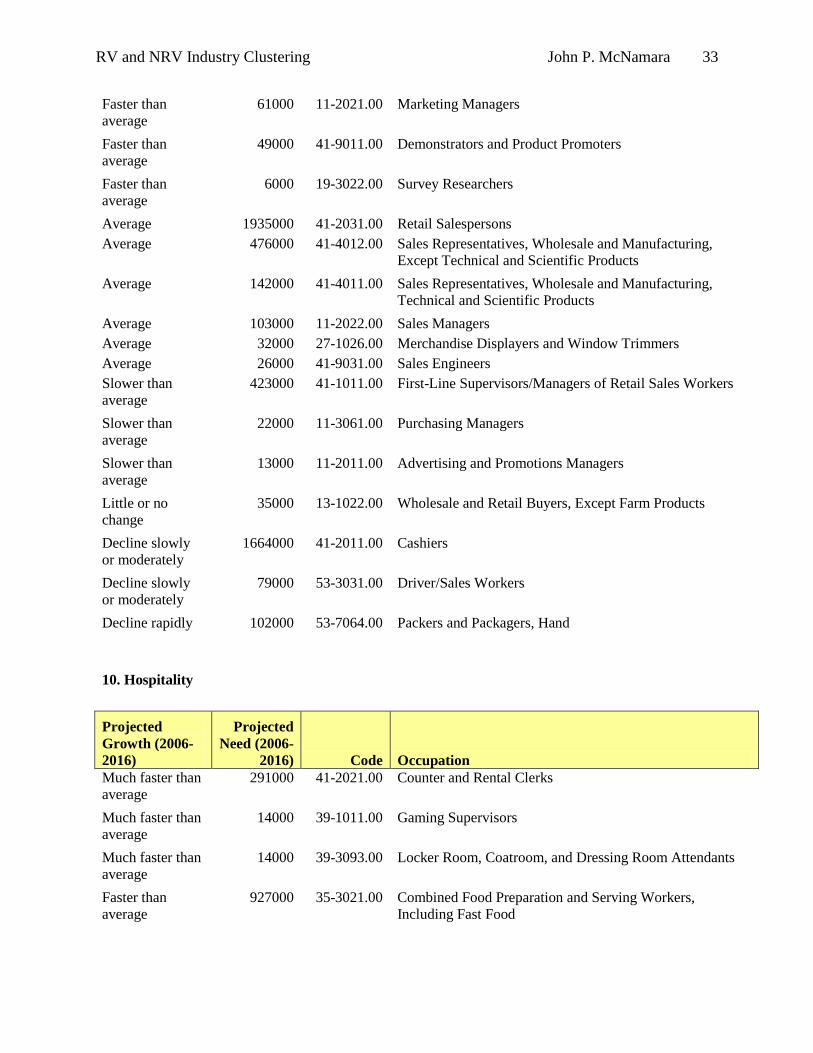
9. Retail
Projected
Growth (2006-
2016)
Projected
Need (2006-
2016) Code Occupation
Much faster than
average
1158000 43-4051.00 Customer Service Representatives
Much faster than
average
291000 41-2021.00 Counter and Rental Clerks
Faster than
average
63000 19-3021.00 Market Research Analysts
RV and NRV Industry Clustering John P. McNamara 33
Faster than
average
61000 11-2021.00 Marketing Managers
Faster than
average
49000 41-9011.00 Demonstrators and Product Promoters
Faster than
average
6000 19-3022.00 Survey Researchers
Average 1935000 41-2031.00 Retail Salespersons
Average 476000 41-4012.00 Sales Representatives, Wholesale and Manufacturing,
Except Technical and Scientific Products
Average 142000 41-4011.00 Sales Representatives, Wholesale and Manufacturing,
Technical and Scientific Products
Average 103000 11-2022.00 Sales Managers
Average 32000 27-1026.00 Merchandise Displayers and Window Trimmers
Average 26000 41-9031.00 Sales Engineers
Slower than
average
423000 41-1011.00 First-Line Supervisors/Managers of Retail Sales Workers
Slower than
average
22000 11-3061.00 Purchasing Managers
Slower than
average
13000 11-2011.00 Advertising and Promotions Managers
Little or no
change
35000 13-1022.00 Wholesale and Retail Buyers, Except Farm Products
Decline slowly
or moderately
1664000 41-2011.00 Cashiers
Decline slowly
or moderately
79000 53-3031.00 Driver/Sales Workers
Decline rapidly 102000 53-7064.00 Packers and Packagers, Hand
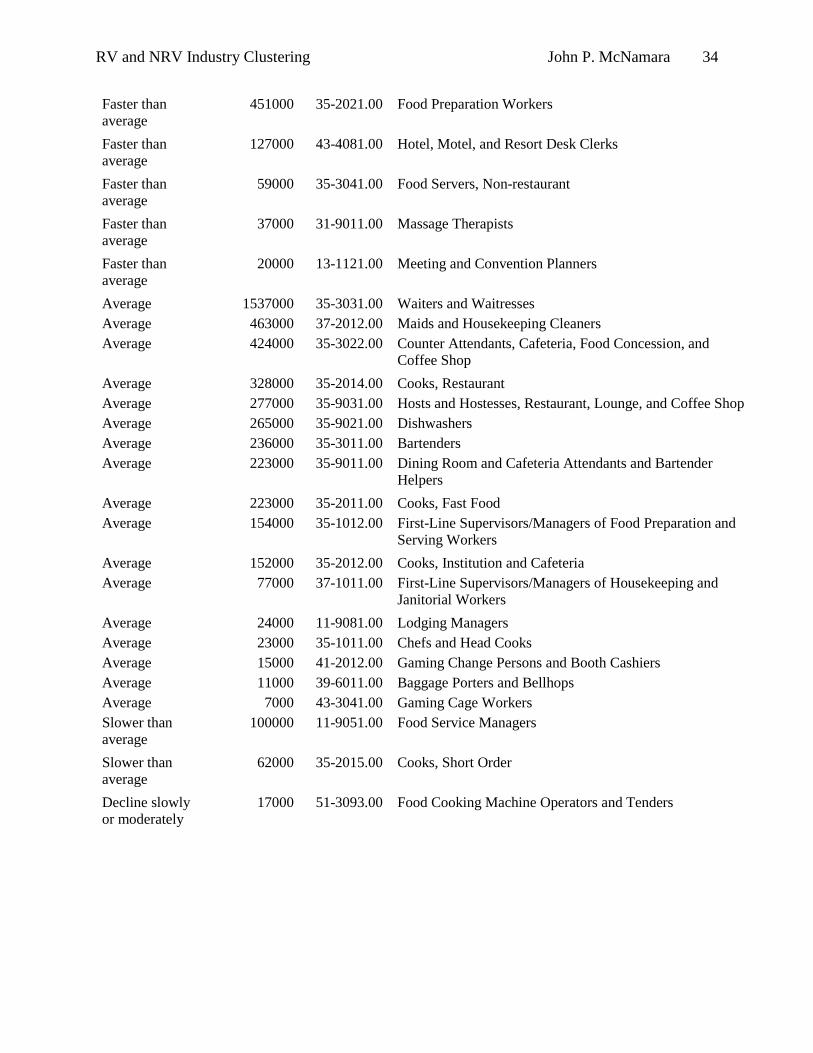
10. Hospitality
Projected
Growth (2006-
2016)
Projected
Need (2006-
2016) Code Occupation
Much faster than
average
291000 41-2021.00 Counter and Rental Clerks
Much faster than
average
14000 39-1011.00 Gaming Supervisors
Much faster than
average
14000 39-3093.00 Locker Room, Coatroom, and Dressing Room Attendants
Faster than
average
927000 35-3021.00 Combined Food Preparation and Serving Workers,
Including Fast Food
RV and NRV Industry Clustering John P. McNamara 34
Faster than
average
451000 35-2021.00 Food Preparation Workers
Faster than
average
127000 43-4081.00 Hotel, Motel, and Resort Desk Clerks
Faster than
average
59000 35-3041.00 Food Servers, Non-restaurant
Faster than
average
37000 31-9011.00 Massage Therapists
Faster than
average
20000 13-1121.00 Meeting and Convention Planners
Average 1537000 35-3031.00 Waiters and Waitresses
Average 463000 37-2012.00 Maids and Housekeeping Cleaners
Average 424000 35-3022.00 Counter Attendants, Cafeteria, Food Concession, and
Coffee Shop
Average 328000 35-2014.00 Cooks, Restaurant
Average 277000 35-9031.00 Hosts and Hostesses, Restaurant, Lounge, and Coffee Shop
Average 265000 35-9021.00 Dishwashers
Average 236000 35-3011.00 Bartenders
Average 223000 35-9011.00 Dining Room and Cafeteria Attendants and Bartender
Helpers
Average 223000 35-2011.00 Cooks, Fast Food
Average 154000 35-1012.00 First-Line Supervisors/Managers of Food Preparation and
Serving Workers
Average 152000 35-2012.00 Cooks, Institution and Cafeteria
Average 77000 37-1011.00 First-Line Supervisors/Managers of Housekeeping and
Janitorial Workers
Average 24000 11-9081.00 Lodging Managers
Average 23000 35-1011.00 Chefs and Head Cooks
Average 15000 41-2012.00 Gaming Change Persons and Booth Cashiers
Average 11000 39-6011.00 Baggage Porters and Bellhops
Average 7000 43-3041.00 Gaming Cage Workers
Slower than
average
100000 11-9051.00 Food Service Managers
Slower than
average
62000 35-2015.00 Cooks, Short Order
Decline slowly
or moderately
17000 51-3093.00 Food Cooking Machine Operators and Tenders

RV and NRV Industry Clustering John P. McNamara 35
RV and NRV Industry Sector Database
A considerable effort was put into building a database of entities in the ten (10) defined
sectors. Ms. Carla James-Collins, Director of Academic and Student Services, and her staff are
continually entering new industries/companies into the database which is located at
http://www.education.edu/ on the secured sever at the link
\\Wmata\library\RVandNRVIndustrySectorDatabase.xls. Data collected for each entry of each
sector includes the following:
Company
Street Address
City
State
Zip
RV/NRV
Contact: First Name
Contact: Last Name
Title
Phone
Website
# of Employees
Company Description
Data can be sorted and used for personal contacts, telephone solicitation, general mailings, e-
mailings, etc. The database can be easily updated and used in a variety of programs including,
for example, MS MailMerge. A current database is included in the Appendix of this paper.
Future Study Development
The final piece to this project at the Roanoke Higher Education Center is to recommend
best methods or practices to assess training and educational needs. The needs have been defined
by the ten (10) industry sectors noted earlier in this study. Future study development is divided
into the ‗3M‘ areas: media, marketing, and members. Recommendations are as follows.

RV and NRV Industry Clustering John P. McNamara 36
Media Recommendations
The media today drives many industries. Included is the industry of training and
education. We see continuous advertising for skills in the United States military, programs at
private educational institutions such as the University of Phoenix, and many college and
university flagship activities on ―game day‖ throughout the academic year. A campaign to
advertise and promote the fundamental purpose of the Roanoke Higher Education Center, noting
its‘ historic value and ―green‖ design, would heighten awareness to the public as to the extent
and possibility of future activity at the Center.
The Continuum, a magazine of current class offerings, serves as a promotion piece for the
RHEC, and coincides with other such class schedule newspaper inserts. An advancement of that
magazine would be to create a yearly magazine to be published in, for example the Roanoke
Times, highlighting RHEC achievements for the year. The present Virginia Western Community
College culinary program, Lincoln Theater addition, and James Madison University Master‘s in
Public Administration program name just a few achievements for 2007-2008.
Marketing Recommendations
The Roanoke Higher Education Center is really a gem in the City of Roanoke. It meets a
need for training and educational space under one roof (classrooms, computer laboratories,
library, café, theater/auditorium, etc.). Keeping average citizens as well as political leaders
aware of activities at the RHEC will only help to grow future business. Just who really knows
and understands what the RHEC has to offer would be an interesting preliminary survey in order
to begin a marketing campaign. To that end, several thoughts come to mind to increase
awareness:
Continue to offer ‗Open Houses‘ by building relationships with schools and
businesses, and invite them to the RHEC periodically. A program could be

RV and NRV Industry Clustering John P. McNamara 37
coordinated that demonstrates the usefulness of the RHEC facility (e.g., a group
uses the computer lab and an instructor discusses a particular computer program,
or a group gets a lesson on preparing a dinner dish at the culinary kitchen).
Create a speaker series where a ‗select‘ group of juniors and seniors,
homeschoolers, churches, business leaders, etc., are invited to the RHEC. The
featured speaker would close the program with a tour of the RHEC, including
receipt of a package of member materials for future reference. This could be an
early morning, lunchtime, or evening event.
Ten (10) sectors have been identified in this project. A sector could be featured
each month (excluding July and December) at the RHEC by coordinating a
program and/or event. Guests could be invited or be open to the public. This
could be a published program in the Continuum and in the yearly magazine.
A survey can have many purposes. Simple survey research can be done from an
office computer through on-line vendors such as Survey Monkey. Costs are
minimal from $19.95 per month to $200.00 per year for unlimited access to the
vendor. This project developed a database of industry sectors, and from that
database an email list can be generated and surveys executed. The surveys would
focus on training and educational needs that support the RHEC and its members.
Member Recommendations
The members are the key to the survival of the Roanoke Higher Education Center.
Supporting and keeping the members aware of the present and future benefits of the RHEC
ensures a continuous revenue stream. It also ensures a high quality learning experience for those
who come to the RHEC. As a RHEC partner institution faculty member at Jefferson College of
Health Sciences and author of this project, I have never heard a negative word about the RHEC.
High quality speaks for itself.
Two areas are noted for consideration. First, all members should have a direct link to the
RHEC on their website in order to make it rather easy to transition to specific programs and
courses offered at the RHEC. There should also be appropriate reverse linkages to the member
institution as well on the RHEC website. This is not presently possible in all cases. And second,
the RHEC should support the members in activities associated with campus visits at events such

RV and NRV Industry Clustering John P. McNamara 38
as college fairs. This demonstrates good, simple supportive business practice where the RHEC
benefits by helping to ensure easy access to courses and programs in downtown Roanoke.
Conclusion
And finally, to bring this project to a close is the conclusion to an article in The Heinz
School Review on April 15, 2005, titled ―Aligning Universities and Industry Clusters.‖ It is an
appropriate ending to this project and speaks to the importance of the contributions of the RHEC
to the Roanoke and New River Valleys.
Universities can play a powerful role in the development of industry clusters. There are
many examples of how new industries form from university research. Similarly, new
industry clusters have re-ordered the ranking of major economic regions. Unfortunately
the path from university research to cluster development and finally to regional economic
benefit is not simple or direct. The assets of the university must be properly aligned with
clusters that are appropriate targets for the regional economy. This report concludes that
the characteristics of the cluster are as important if not more important than the
characteristics of the university. The task for the university (and for regional
stakeholders) is to identify and support areas of university expertise that align with
clusters of opportunity for the region.
As is noted, the role of the university is to “identify and support” the emerging clusters. So it is
true for the RHEC… identify and support those who offer programs and award degrees in areas
of economic opportunity for the Roanoke and New River Valleys.

RV and NRV Industry Clustering John P. McNamara 39
References
Data/Covered Employment & Wages: Clusters.
http://www.ibrc.indiana.edu/innovation/interactive.asp?dpage=60. Retrieved from John Hull.
Doeringer, P. and Terkla, D. (1995). Business strategy and cross-industry clusters. Economic
Development Quarterly, 9: 225-37.
Hull, John M. Regional Economic Resources Planner, Roanoke Valley-Allegany Regional
Commission. Personal contact at [email protected]
New River Valley Planning District @. http://www.smartpolicy.org/urole/virginiatech
O*NET. http://www.onetcenter.org/
Paytas, J. (2005). Aligning University and Industry Clusters. The Heinz School Review, 2(1).
Retrieved from http://journal.heinz.cmu.edu/articles/aligning-universities-and-industry-clusters/
Porter, M. (1990). The Competitive Advantage of Nations. New York: Basic Books.
Roanoke Valley Economic Development Partnership @http://www.roanoke.org/
Roanoke Valley-Alleghany Regional Commission @ http://www.rvarc.org/
Rosenfeld, S. (1997). Bringing Business Clusters into the Mainstream of Economic
Development. European Planning Studies, 5(1), 3-23.
The Sun‘s Financial Diary. Hottest Jobs and Markets for 2008. Retrieved from
http://www.thesunsfinancialdiary.com/jobs/americas-hottest-jobs/
U.S. Department of Labor, Bureau of Labor Statistics @ http://www.bls.gov/home.htm
U.S. Census Bureau, North American Industry Classification System (NAICS) @
http://www.census.gov/epcd/www/naics.html
VA Economic Development Partnership
@http://www.yesvirginia.org/Virginia_Advantage/Industry_Clusters/
VA Ally Information Exchange @ http://www.virginiaallies.org/research.asp
RV and NRV Industry Clustering John P. McNamara 40
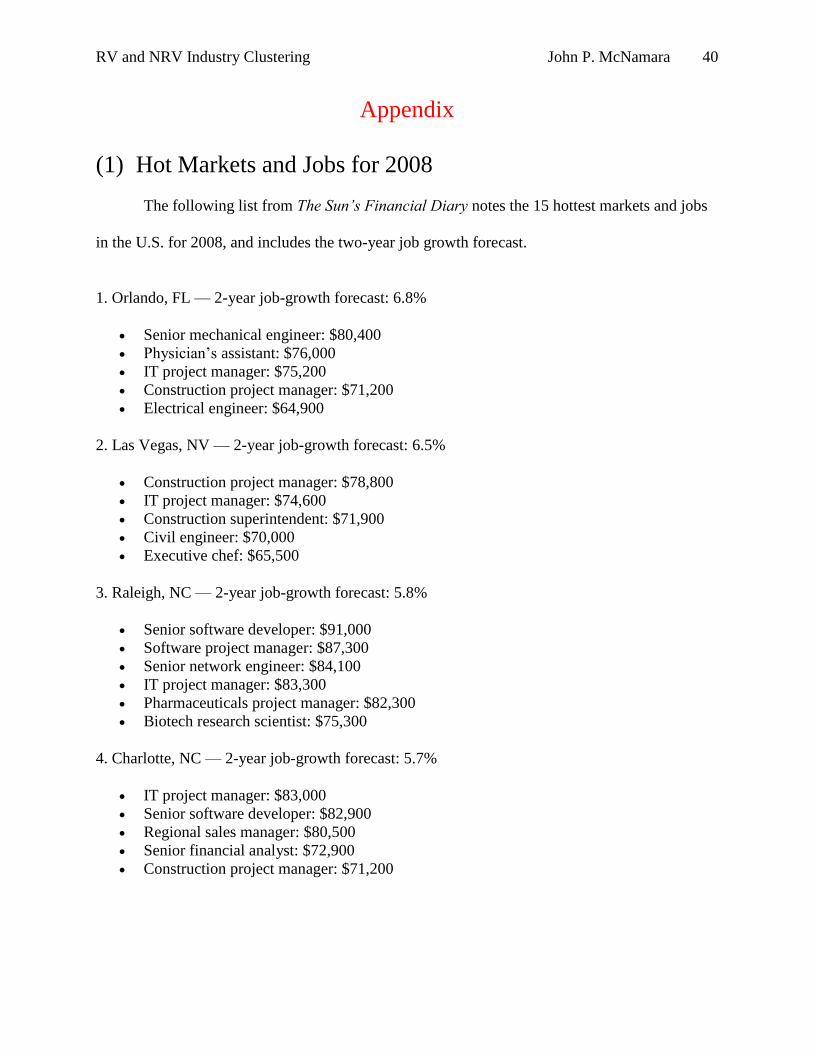
Appendix
(1) Hot Markets and Jobs for 2008
The following list from The Sun’s Financial Diary notes the 15 hottest markets and jobs
in the U.S. for 2008, and includes the two-year job growth forecast.
1. Orlando, FL — 2-year job-growth forecast: 6.8%
Senior mechanical engineer: $80,400
Physician‘s assistant: $76,000
IT project manager: $75,200
Construction project manager: $71,200
Electrical engineer: $64,900
2. Las Vegas, NV — 2-year job-growth forecast: 6.5%
Construction project manager: $78,800
IT project manager: $74,600
Construction superintendent: $71,900
Civil engineer: $70,000
Executive chef: $65,500
3. Raleigh, NC — 2-year job-growth forecast: 5.8%
Senior software developer: $91,000
Software project manager: $87,300
Senior network engineer: $84,100
IT project manager: $83,300
Pharmaceuticals project manager: $82,300
Biotech research scientist: $75,300
4. Charlotte, NC — 2-year job-growth forecast: 5.7%
IT project manager: $83,000
Senior software developer: $82,900
Regional sales manager: $80,500
Senior financial analyst: $72,900
Construction project manager: $71,200
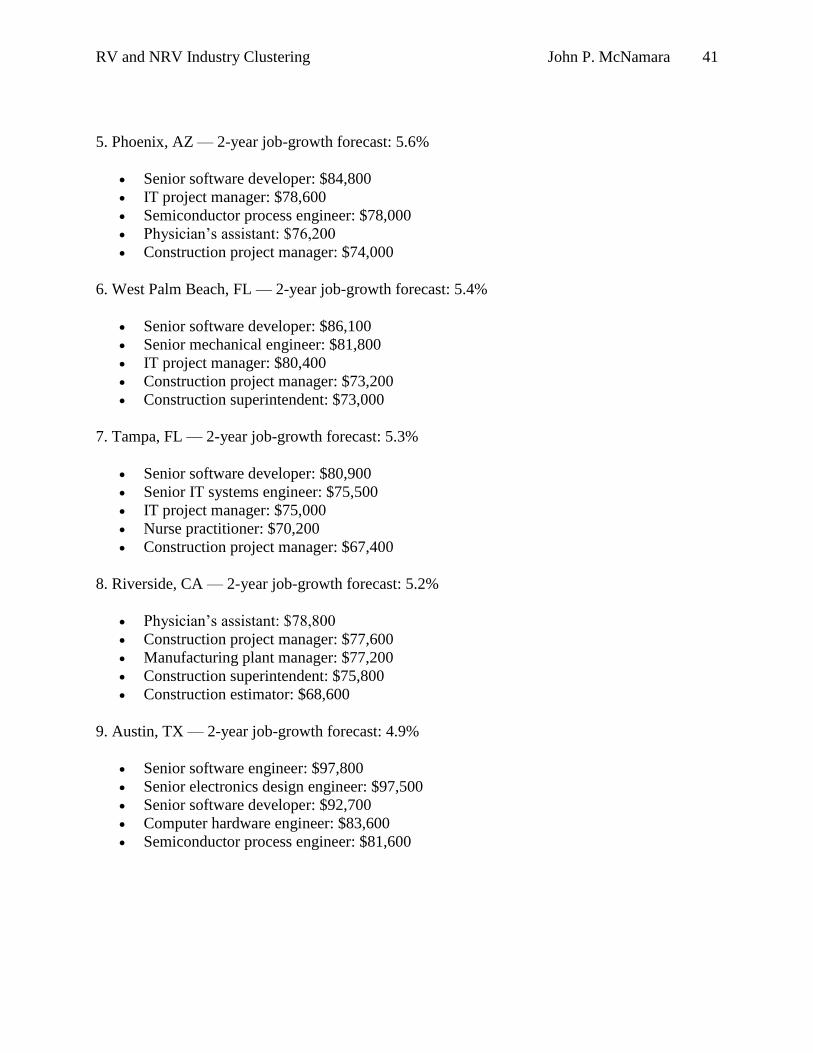
RV and NRV Industry Clustering John P. McNamara 41
5. Phoenix, AZ — 2-year job-growth forecast: 5.6%
Senior software developer: $84,800
IT project manager: $78,600
Semiconductor process engineer: $78,000
Physician‘s assistant: $76,200
Construction project manager: $74,000
6. West Palm Beach, FL — 2-year job-growth forecast: 5.4%
Senior software developer: $86,100
Senior mechanical engineer: $81,800
IT project manager: $80,400
Construction project manager: $73,200
Construction superintendent: $73,000
7. Tampa, FL — 2-year job-growth forecast: 5.3%
Senior software developer: $80,900
Senior IT systems engineer: $75,500
IT project manager: $75,000
Nurse practitioner: $70,200
Construction project manager: $67,400
8. Riverside, CA — 2-year job-growth forecast: 5.2%
Physician‘s assistant: $78,800
Construction project manager: $77,600
Manufacturing plant manager: $77,200
Construction superintendent: $75,800
Construction estimator: $68,600
9. Austin, TX — 2-year job-growth forecast: 4.9%
Senior software engineer: $97,800
Senior electronics design engineer: $97,500
Senior software developer: $92,700
Computer hardware engineer: $83,600
Semiconductor process engineer: $81,600

RV and NRV Industry Clustering John P. McNamara 42
10. Atlanta, GA — 2-year job-growth forecast: 4.6%
Regional sales manager: $86,400
Senior software developer: $84,900
IT project manager: $83,000)
Business process/management consultant: $76,500
Senior financial analyst: $72,100
Construction project manager: $70,300
11. Salt Lake City, UT — 2-year job-growth forecast: 4.4%
Senior software developer: $81,600
Electrical engineer: $73,800
IT project manager: $69,200
Financial controller: $67,200
Construction project manager: $65,800
12. Jacksonville, FL — 2-year job-growth forecast: 4.4%
IT project manager: $79,400
Senior software developer: $77,800
Financial controller: $76,800
Physician‘s assistant: $75,900
Construction project manager: $74,600
13. Dallas, TX — 2-year job-growth forecast: 4.2%
Senior software developer: $88,500
Operations director: $84,800
IT project manager: $84,500
Regional sales manager: $84,300
Financial controller: $83,200
14. San Antonio, TX –2-year job-growth forecast: 4.2%
Senior software developer: $83,900
Physician‘s assistant: $78,400
IT project manager: $76,800
Human resources director: $75,800
Construction project manager: $66,300

RV and NRV Industry Clustering John P. McNamara 43
15. Fort Lauderdale, FL — 2-year job-growth forecast: 4.1%
Senior software developer: $84,600
Financial controller: $78,600
IT project manager: $75,700
HR director: $73,500
Construction project manager: $72,700
(2) RV and NRV Industry Sector Database (dated 5/1/2008)