
THE ROAD TOWARDS ELECTRIC MOBILITY – AN ENERGY
15
Transcript of THE ROAD TOWARDS ELECTRIC MOBILITY – AN ENERGY
THE ROAD TOWARDS ELECTRIC MOBILITY – AN ENERGY ECONOMIC VIEW ON HYBRID- AND ELECTRIC VEHICLE
TECHNOLOGIES AND THE INFLUENCE OF POLICIES ON THEIR DIFFUSION
Maximilian KLOESS, Vienna University of Technology, +43 (0)1 5880137371, [email protected]
Reinhard HAAS, Vienna University of Technology, +43 (0)1 5880137352, [email protected]
Maximilian Kloess Vienna University of Technology
Gusshausstraße 25-29/373-2 Tel.: +43 1 58801 37371 Fax.: +43 158801 37397 [email protected]
1. Overview Low efficiency of vehicles, dependence on fossil fuels and high emissions are serious problems of passenger vehicles today [1]. Electrification of the powertrain is considered as one of the most promising approaches to alleviate these problems. Nowadays some car manufacturers already hold hybrid vehicles in there portfolio and several others are expected to follow within the next years. Some car makers even announce the introduction of pure electric vehicles. The core objective if this paper is to analyze the following questions for the example of Austria: How does the introduction of hybrid electric and pure electric vehicles affect the energy system? How long does it take to shift the vehicle fleet from conventional drives to partly and fully electrified drives? What are the main factors that influence this development? What role can policy play in this shift? To identify the main drivers of the diffusion of electrified vehicle propulsion technologies a model based analysis was performed considering six vehicles powertrain technologies with different degrees of electrification. They extend from conventional internal combustion engines over different hybrid electric configurations (mild hybrids, full hybrids, plug-in-hybrids, serial hybrids) to pure electric vehicles. The paper is based on a research project supported by the Austrian Ministry of Innovation, Transport and Technology, with the objective to identify potentials of vehicle powertrain systems from a technical, ecological and economic perspective1.
2. Methods The approach consists of three main steps: Firstly a detailed technical, ecological and economical analysis of the vehicle powertrain technologies was performed to determine fuel consumption, greenhouse gas emissions and investment costs [2]. In the second step the overall costs per kilometre of the vehicles were analysed considering fuel costs and political framework conditions in a dynamic context. Thirdly the market shares and the stock penetration of those vehicle propulsion technologies were estimated based on a model of the Austrian vehicle stock [3]. This paper will focus on the modelling and the scenarios developed through the model. For the modelling a bottom-up model of the Austrian vehicle stock was used. Within the model the vehicle stock was divided in three vehicle classes, (compact vehicles, middle class vehicles, upper class vehicles/SUVs) each class having specific characteristics, user groups and different sets of vehicle technologies available. In the next step scenarios were developed to display the effects in medium to long term (2010-2050).Within this context the electricity consumption driven by vehicle electrification was a matter of particular interest. 1 Support programm: A3plus - Alternative Propulsion Systems and Fuels Project Name: “Development of Sceanrios of the dissemination of vehicles with partly and fully electrified powertrain under different political framework conditions – ELEKTRA”
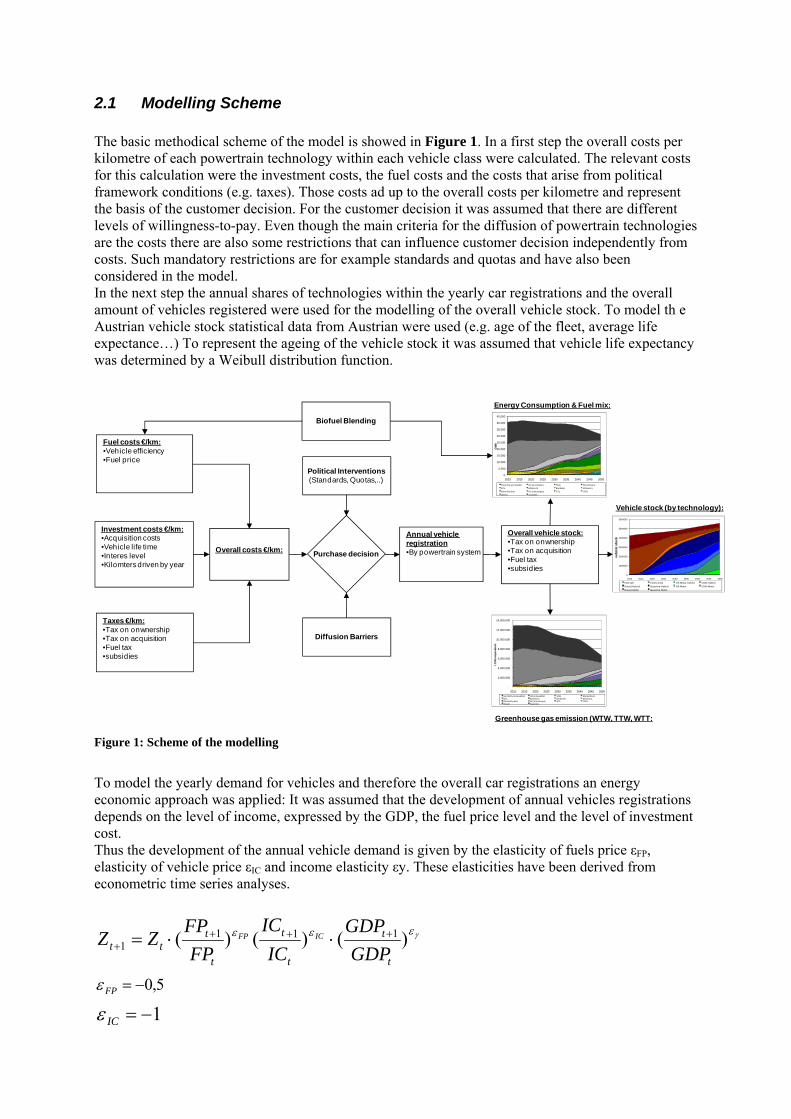
2.1 Modelling Scheme The basic methodical scheme of the model is showed in Figure 1. In a first step the overall costs per kilometre of each powertrain technology within each vehicle class were calculated. The relevant costs for this calculation were the investment costs, the fuel costs and the costs that arise from political framework conditions (e.g. taxes). Those costs ad up to the overall costs per kilometre and represent the basis of the customer decision. For the customer decision it was assumed that there are different levels of willingness-to-pay. Even though the main criteria for the diffusion of powertrain technologies are the costs there are also some restrictions that can influence customer decision independently from costs. Such mandatory restrictions are for example standards and quotas and have also been considered in the model. In the next step the annual shares of technologies within the yearly car registrations and the overall amount of vehicles registered were used for the modelling of the overall vehicle stock. To model th e Austrian vehicle stock statistical data from Austrian were used (e.g. age of the fleet, average life expectance…) To represent the ageing of the vehicle stock it was assumed that vehicle life expectancy was determined by a Weibull distribution function.
Taxes €/km:•Tax on onwnership•Tax on acquisition•Fuel tax•subsidies
Investment costs €/km:•Acquisition costs•Vehicle life time•Interes level•Kilomters driven by year
Fuel costs €/km:•Vehicle efficiency•Fuel price
Overall costs €/km: Purchase decision
Annual vehicle registration•By powertrain system
Overall vehicle stock:•Tax on onwnership•Tax on acquisition•Fuel tax•subsidies
Diffusion Barriers
Political Interventions(Standards, Quotas,..)
0
5.000
10.000
15.000
20.000
25.000
30.000
35.000
40.000
45.000
2010 2015 2020 2025 2030 2035 2040 2045 2050
GW
h
Electricity (renewable) H2 (renewable) SNG BiomethaneBTL Ethanol 2 Biodiesel Ethanol 1Electricity (mix) H2 (natural gas) GTL CNGDiesel Gasoline
0
1000000
2000000
3000000
4000000
5000000
6000000
2010 2015 2020 2025 2030 2035 2040 2045 2050
vehi
cle
stoc
k
Fuel cell Elctric drive H2-Motor-Hybrid CNG-HybridDiesel-Hybrid Gasoline-Hybrid H2-Motor CNG-MotorDiesel-Motor Gasoline-Motor
-
2.000.000
4.000.000
6.000.000
8.000.000
10.000.000
12.000.000
14.000.000
2010 2015 2020 2025 2030 2035 2040 2045 2050
t CO
2-eq
uiva
lent
Electricity (renewable) H2 (renewable) SNG BiomethaneBTL Ethanol 2 Biodiesel Ethanol 1Electricity (mix) H2 (natural gas) GTL CNGDiesel Gasoline
Energy Consumption & Fuel mix:
Greenhouse gas emission (WTW, TTW, WTT:
Vehicle stock (by technology):
Biofuel Blending
Figure 1: Scheme of the modelling
To model the yearly demand for vehicles and therefore the overall car registrations an energy economic approach was applied: It was assumed that the development of annual vehicles registrations depends on the level of income, expressed by the GDP, the fuel price level and the level of investment cost. Thus the development of the annual vehicle demand is given by the elasticity of fuels price εFP, elasticity of vehicle price εIC and income elasticity εy. These elasticities have been derived from econometric time series analyses.
γεεε )()()( 1111
t
t
t
t
t
ttt GDP
GDPIC
ICFP
FPZZ ICFP ++++ ⋅⋅=
5,0−=FPε
1−=ICε
8,0=γε
Z….vehicle registration per year IC…investment costs FP…fossil fuel price level GDP…income level represented by the grand domestic product εFP…price elasticity εIC…elasticity on investment costs εy….income elasticity
2.2 Reference Vehicles As mentioned above three classes of vehicles were distinguished:
o Compact class vehicles o Middle class vehicles o Upper class vehicles (including SUVs)
Each vehicle class was defined by vehicle mass and engine power. To determine those specifications and the allocation of each class within the vehicle stock and the yearly vehicle registrations for the particular case of Austria historic data was used. Within the vehicle classes different powertrain technologies were considered including the entire spectrum from conventional drive with internal combustion engine to pure electric drive. The following systems were analysed:
o Conventional Drive o Micro Hybrid o Mild Hybrid o Full Hybrid o Plug-In-Hybrid o Serial Hybrid (with plug-in) o Electric Vehicle o Fuel Cell Vehicle
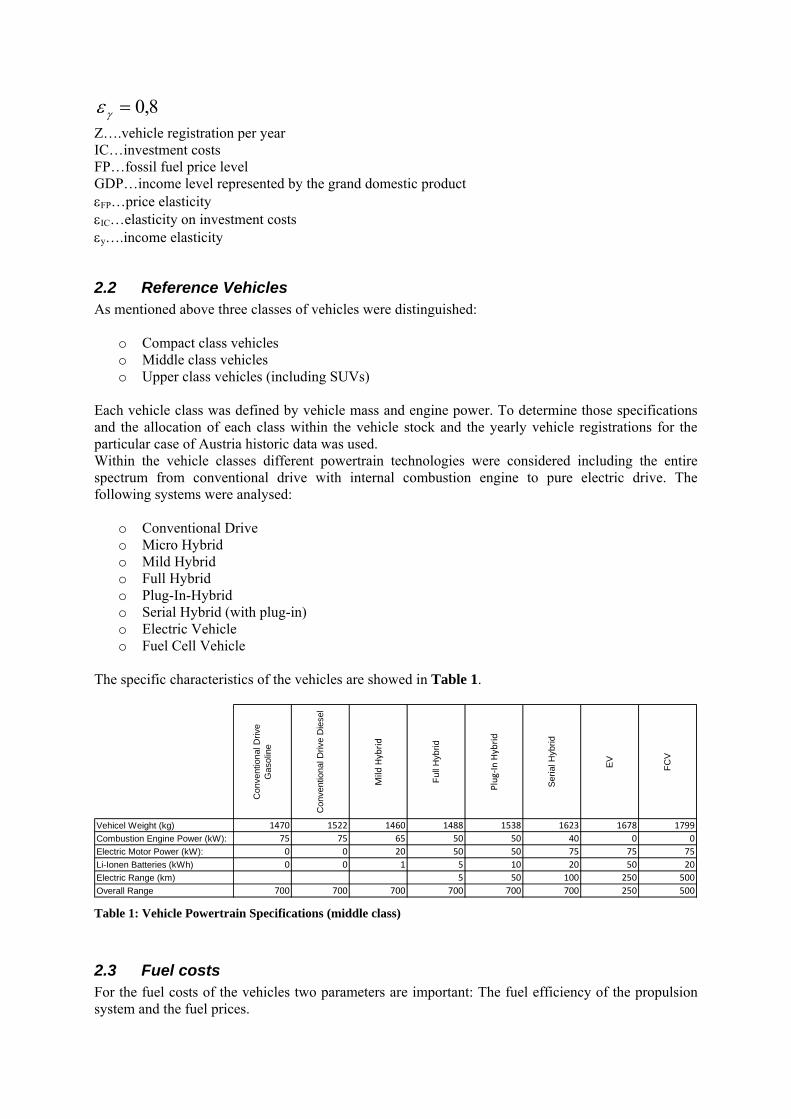
The specific characteristics of the vehicles are showed in Table 1.
Con
vent
iona
l Driv
e G
asol
ine
Con
vent
iona
l Driv
e D
iese
l
Mild
Hybrid
Full
Hyb
rid
Plug
‐In Hybrid
Seria
l Hyb
rid
EV
FCV
Vehicel Weight (kg) 1470 1522 1460 1488 1538 1623 1678 1799Combustion Engine Power (kW): 75 75 65 50 50 40 0 0Electric Motor Power (kW): 0 0 20 50 50 75 75 75Li-Ionen Batteries (kWh) 0 0 1 5 10 20 50 20Electric Range (km) 5 50 100 250 500Overall Range 700 700 700 700 700 700 250 500 Table 1: Vehicle Powertrain Specifications (middle class)
2.3 Fuel costs For the fuel costs of the vehicles two parameters are important: The fuel efficiency of the propulsion system and the fuel prices.
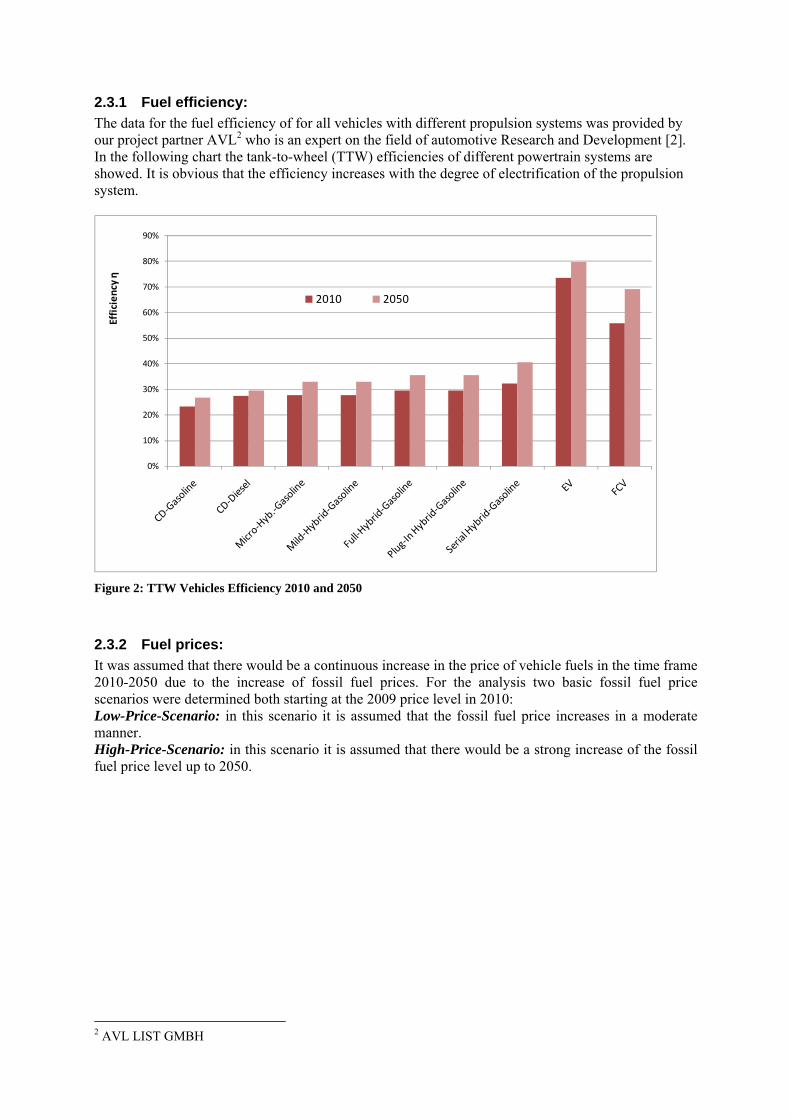
2.3.1 Fuel efficiency: The data for the fuel efficiency of for all vehicles with different propulsion systems was provided by our project partner AVL2 who is an expert on the field of automotive Research and Development [2]. In the following chart the tank-to-wheel (TTW) efficiencies of different powertrain systems are showed. It is obvious that the efficiency increases with the degree of electrification of the propulsion system.
0%
10%
20%
30%
40%
50%
60%
70%
80%
90%
Efficien
cy η
2010 2050
Figure 2: TTW Vehicles Efficiency 2010 and 2050
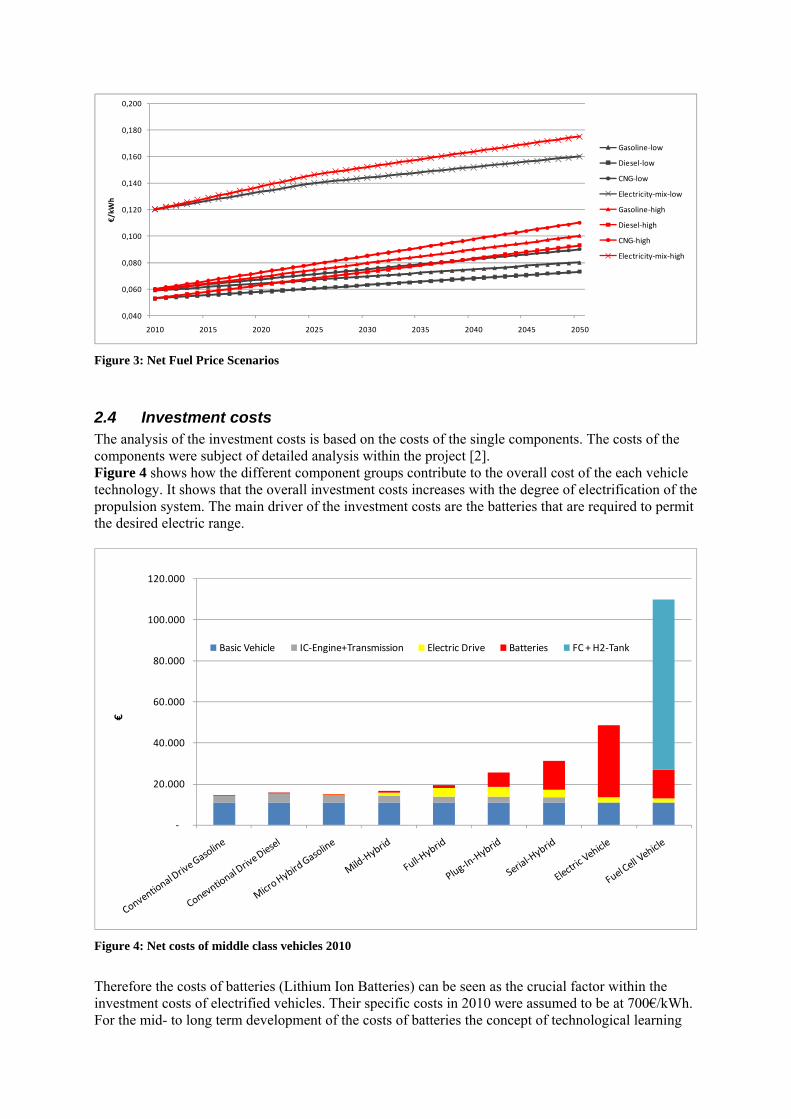
2.3.2 Fuel prices: It was assumed that there would be a continuous increase in the price of vehicle fuels in the time frame 2010-2050 due to the increase of fossil fuel prices. For the analysis two basic fossil fuel price scenarios were determined both starting at the 2009 price level in 2010: Low-Price-Scenario: in this scenario it is assumed that the fossil fuel price increases in a moderate manner. High-Price-Scenario: in this scenario it is assumed that there would be a strong increase of the fossil fuel price level up to 2050.
2 AVL LIST GMBH
0,040
0,060
0,080
0,100
0,120
0,140
0,160
0,180
0,200
2010 2015 2020 2025 2030 2035 2040 2045 2050
€/kW
h
Gasoline‐low
Diesel‐low
CNG‐low
Electricity‐mix‐low
Gasoline‐high
Diesel‐high
CNG‐high
Electricity‐mix‐high
Figure 3: Net Fuel Price Scenarios
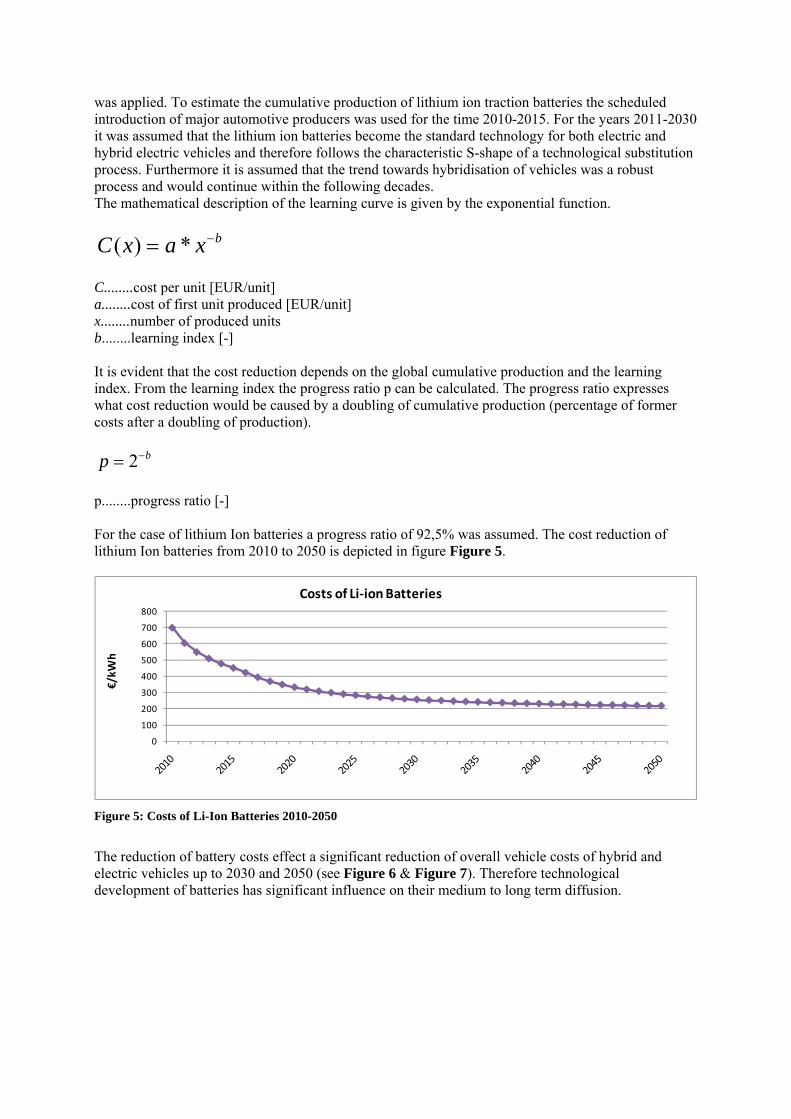
2.4 Investment costs The analysis of the investment costs is based on the costs of the single components. The costs of the components were subject of detailed analysis within the project [2]. Figure 4 shows how the different component groups contribute to the overall cost of the each vehicle technology. It shows that the overall investment costs increases with the degree of electrification of the propulsion system. The main driver of the investment costs are the batteries that are required to permit the desired electric range.
‐
20.000
40.000
60.000
80.000
100.000
120.000
€
Basic Vehicle IC‐Engine+Transmission Electric Drive Batteries FC + H2‐Tank
Figure 4: Net costs of middle class vehicles 2010
Therefore the costs of batteries (Lithium Ion Batteries) can be seen as the crucial factor within the investment costs of electrified vehicles. Their specific costs in 2010 were assumed to be at 700€/kWh. For the mid- to long term development of the costs of batteries the concept of technological learning
was applied. To estimate the cumulative production of lithium ion traction batteries the scheduled introduction of major automotive producers was used for the time 2010-2015. For the years 2011-2030 it was assumed that the lithium ion batteries become the standard technology for both electric and hybrid electric vehicles and therefore follows the characteristic S-shape of a technological substitution process. Furthermore it is assumed that the trend towards hybridisation of vehicles was a robust process and would continue within the following decades. The mathematical description of the learning curve is given by the exponential function.
bxaxC −= *)( C........cost per unit [EUR/unit] a........cost of first unit produced [EUR/unit] x........number of produced units b........learning index [-] It is evident that the cost reduction depends on the global cumulative production and the learning index. From the learning index the progress ratio p can be calculated. The progress ratio expresses what cost reduction would be caused by a doubling of cumulative production (percentage of former costs after a doubling of production).
bp −= 2 p........progress ratio [-] For the case of lithium Ion batteries a progress ratio of 92,5% was assumed. The cost reduction of lithium Ion batteries from 2010 to 2050 is depicted in figure Figure 5.
0
100
200
300
400
500
600
700
800
€/kW
h
Costs of Li‐ion Batteries
Figure 5: Costs of Li-Ion Batteries 2010-2050
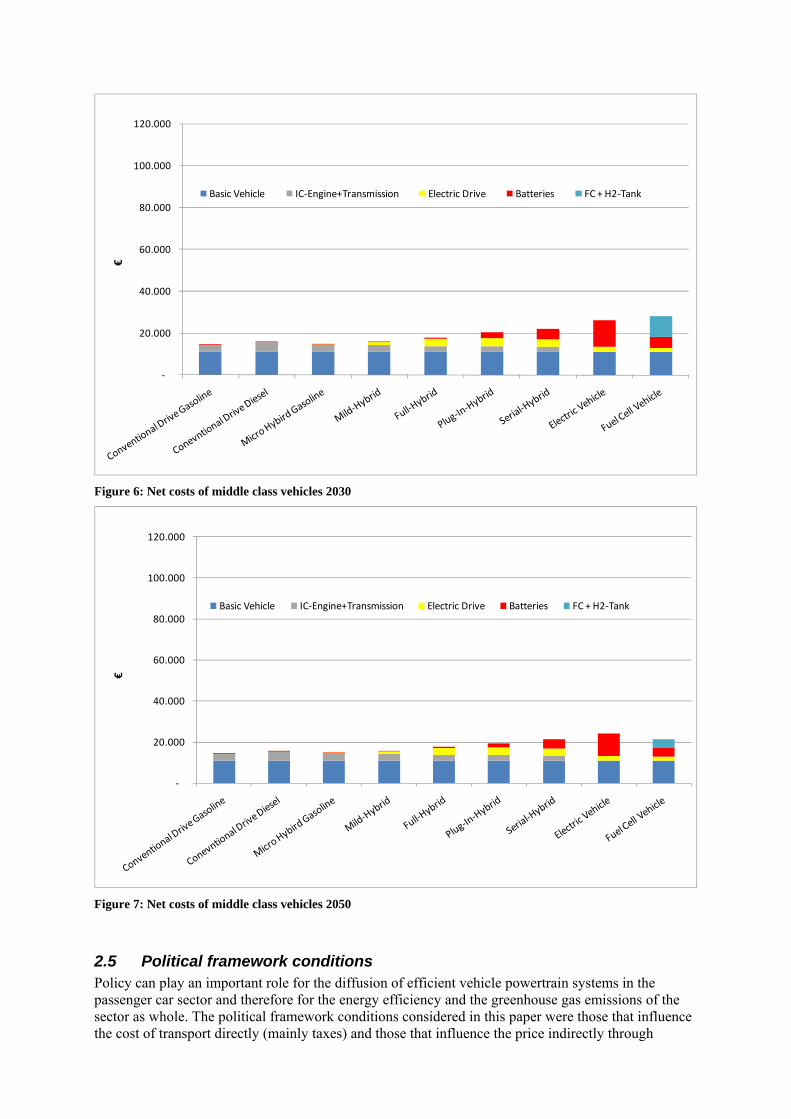
The reduction of battery costs effect a significant reduction of overall vehicle costs of hybrid and electric vehicles up to 2030 and 2050 (see Figure 6 & Figure 7). Therefore technological development of batteries has significant influence on their medium to long term diffusion.
‐
20.000
40.000
60.000
80.000
100.000
120.000 €
Basic Vehicle IC‐Engine+Transmission Electric Drive Batteries FC + H2‐Tank
Figure 6: Net costs of middle class vehicles 2030
‐
20.000
40.000
60.000
80.000
100.000
120.000
€
Basic Vehicle IC‐Engine+Transmission Electric Drive Batteries FC + H2‐Tank
Figure 7: Net costs of middle class vehicles 2050
2.5 Political framework conditions Policy can play an important role for the diffusion of efficient vehicle powertrain systems in the passenger car sector and therefore for the energy efficiency and the greenhouse gas emissions of the sector as whole. The political framework conditions considered in this paper were those that influence the cost of transport directly (mainly taxes) and those that influence the price indirectly through
compulsive restrictions (e.g. standards and quotas) For the present analysis only the first group was considered. The main taxes that are important for the passenger vehicle sector in Austria are:
Tax on Acquisition Tax on Ownership Tax on Fuels
Tax on Acquisition: this tax depends on the fuel consumption and the greenhouse gas emissions of the vehicle Tax on Ownership: the height of this tax depends on the engine power of the vehicle Tax on Fuels: in Austria fuels are taxed by unit (€/litre or €/kg) It was assumed that the political framework conditions in 2010 are the same as they are now (2009). For the time frame 2010-2050 two main policy scenarios were defined: Business as usual scenario – BAU-Scenario: In this scenario it was assumed that the political framework conditions remain on the 2010-level Policy scenario: it was assumed that taxes would be adapted with regard to an increase in energy efficiency and a reduction of greenhouse gas emissions. Therefore taxation of hydrocarbon fuels and inefficient vehicles gets raised stepwise within the period.
2.6 Overall Costs The service costs of each vehicle consists of it’s fuel costs and it’s capital costs. Those costs are added up as depicted in Figure 1. The mathematical definition is expressed by the following equations:
jSPjj CCECSC _+= [EUR/km]
SC................service costs [EUR/km] EC…..……..energy costs [EUR/km] CCSP_j…......specific capital costs of vehicle j [EUR/km]
jjj FPFCEC *= [EUR/km] FCj……….energy consumption of vehicles j [kWh/km] FP………..fuel price [EUR/kWh]
jkmjjjjSP TOSVATTAICCC +++= /))1(*)(*(_ α [EUR/km]
1)1()1(*(−+
+= DT
DT
rrrα
r………interest rate DT........depreciation time α ......…Annuity factor ICj……Investment costs of vehicles j (EUR/vehicle) TAj …..tax on acquisition TOj…...tax on ownership VATj…Value added tax Skm…….driven kilometres by year
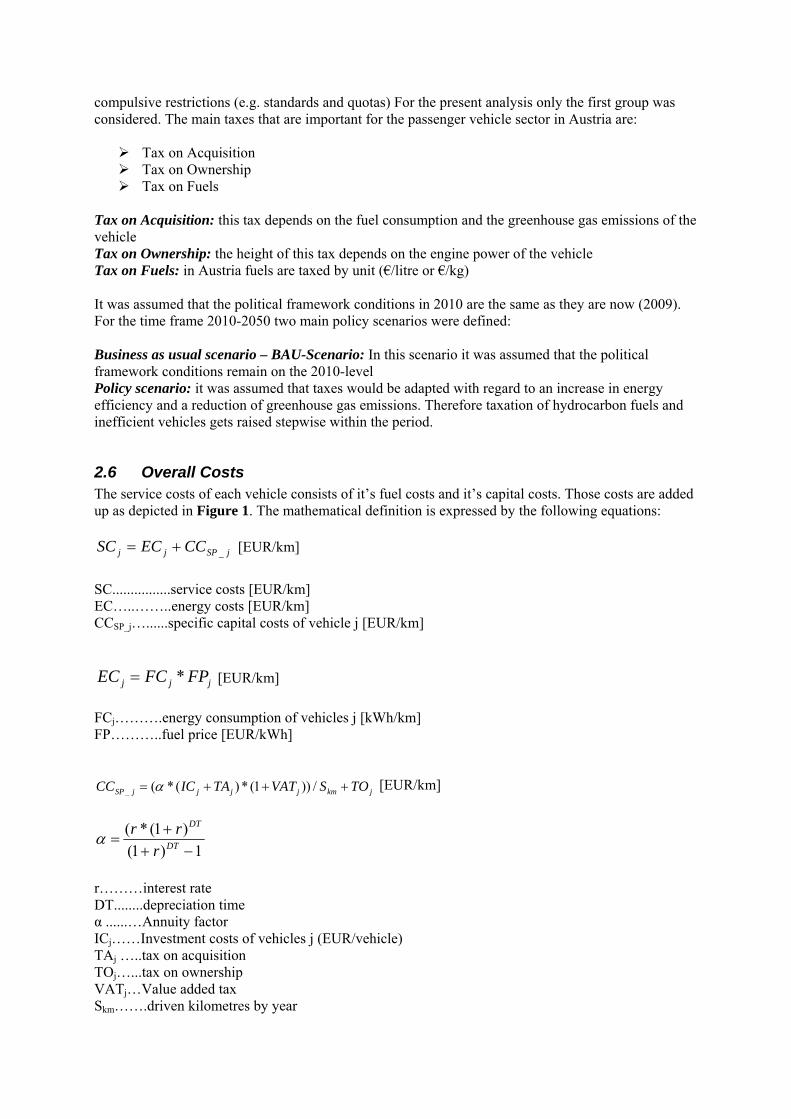
In the model the economic performance of all vehicle classes with all propulsion systems was calculated at different yearly kilometrage rates. For the further employment in the model it was the costs were calculated in € per kilometre (€/km). For the analysis an interest rate of 5% and a depreciation time of 14 years were considered. The following figures shall give an overview on the development of overall costs in the time frame 2010 to 2050.
010002000300040005000600070008000
€
Fuel Costs Investment Costs
Figure 8: Yearly overall costs of vehicles at 20 000km/a – 2010
010002000300040005000600070008000
€
Fuel Costs Investment Costs
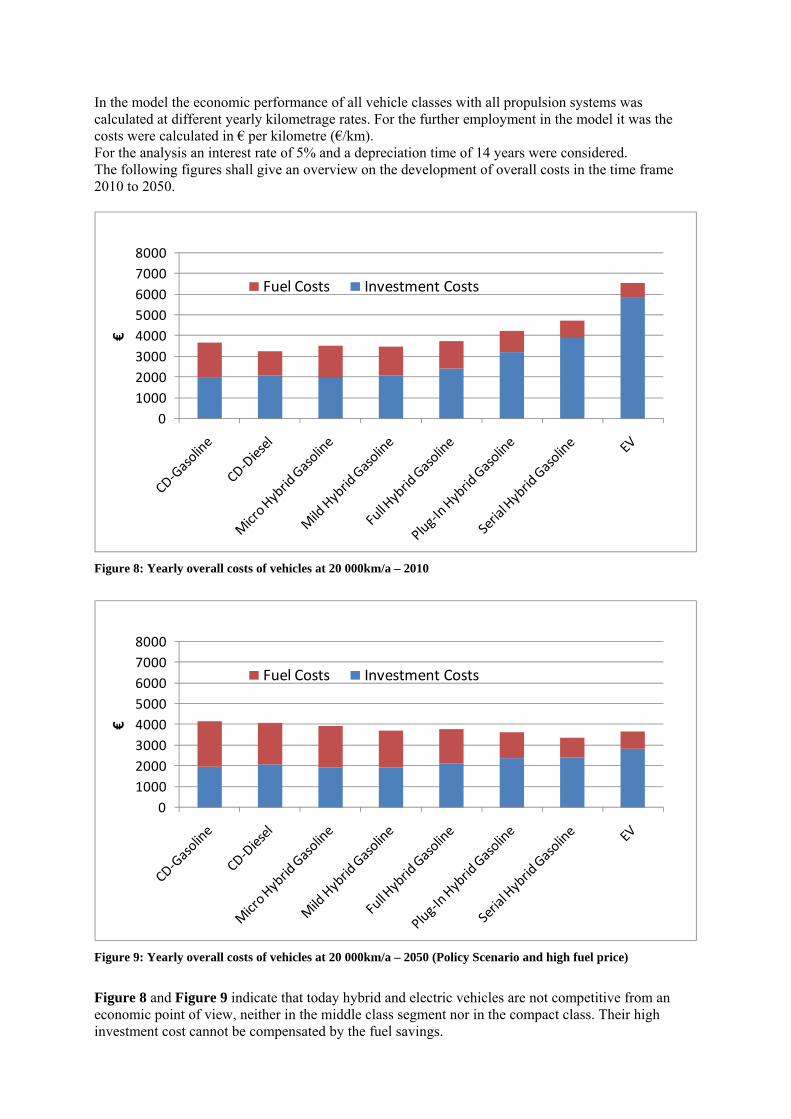
Figure 9: Yearly overall costs of vehicles at 20 000km/a – 2050 (Policy Scenario and high fuel price)
Figure 8 and Figure 9 indicate that today hybrid and electric vehicles are not competitive from an economic point of view, neither in the middle class segment nor in the compact class. Their high investment cost cannot be compensated by the fuel savings.
Until 2050, due to the reduction of the investment costs and the shift within the political and economic framework condition (Policy Scenario + high fossil fuel prices), the competitiveness of electrified vehicles improve strongly. By that time they are catching up with conventional technologies and some become even better.
2.7 Scenarios To analyse the effect of policies and different fossil fuel price levels two basic scenarios were developed. The scenarios defer from each other in the way of the policies implemented and the fossil fuel price levels (see chapter 2.3.2 and 2.5): Scenario A: BAU-Policy & Low fossil fuel level Scenario D: Active Plicy & High fossil fuel price level
3. Results Using the model it was possible to investigate the effectiveness of policies on the diffusion of efficient vehicle technologies on the one hand and the impact of further drivers, such as fuel prices and development of vehicle technologies on the other hand. The results of the model were also used to show the effects of the aforementioned drivers on the energy consumption and the greenhouse gas emissions.
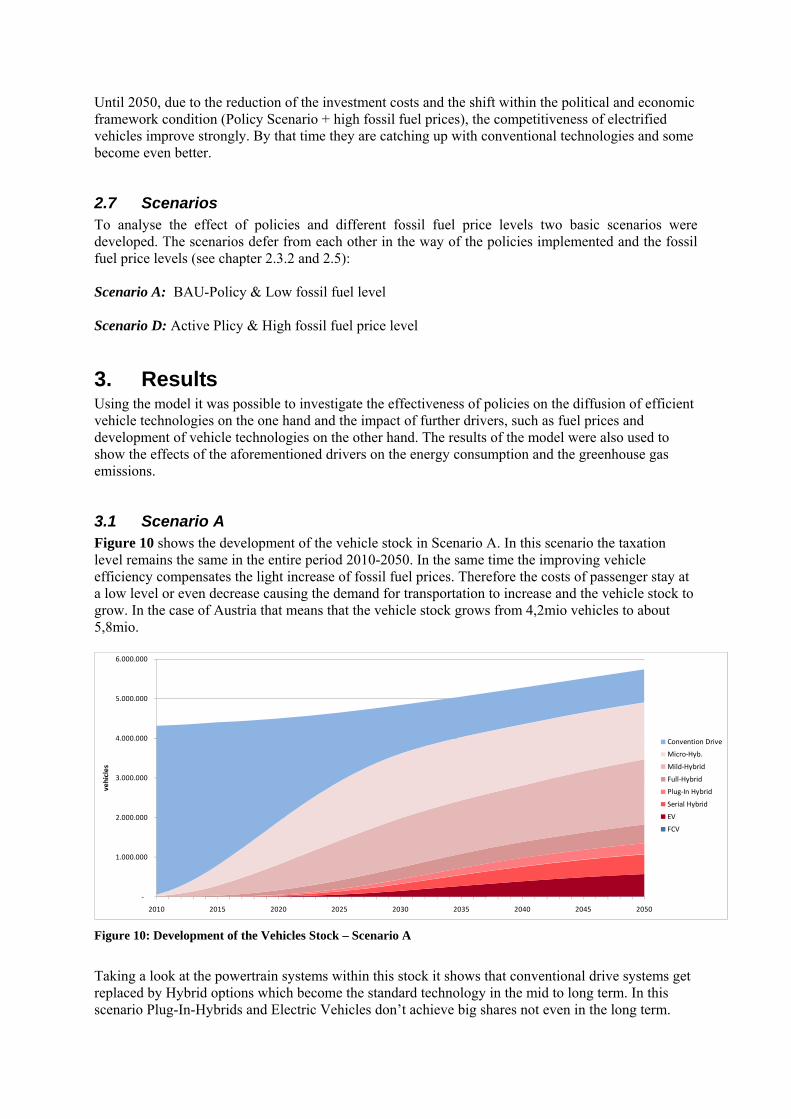
3.1 Scenario A Figure 10 shows the development of the vehicle stock in Scenario A. In this scenario the taxation level remains the same in the entire period 2010-2050. In the same time the improving vehicle efficiency compensates the light increase of fossil fuel prices. Therefore the costs of passenger stay at a low level or even decrease causing the demand for transportation to increase and the vehicle stock to grow. In the case of Austria that means that the vehicle stock grows from 4,2mio vehicles to about 5,8mio.
‐
1.000.000
2.000.000
3.000.000
4.000.000
5.000.000
6.000.000
2010 2015 2020 2025 2030 2035 2040 2045 2050
vehicles
Convention Drive
Micro‐Hyb.
Mild‐Hybrid
Full‐Hybrid
Plug‐In Hybrid
Serial Hybrid
EV
FCV
Figure 10: Development of the Vehicles Stock – Scenario A
Taking a look at the powertrain systems within this stock it shows that conventional drive systems get replaced by Hybrid options which become the standard technology in the mid to long term. In this scenario Plug-In-Hybrids and Electric Vehicles don’t achieve big shares not even in the long term.
In Scenario A the final energy consumption of the passenger sector decreases slightly (see Figure 11). Although the vehicle fleet increases the higher vehicle efficiency causes a slight reduction of overall consumption. Regarding the energy carriers one can see that liquid hydrocarbons remain the most important energy carriers even in a long term even though there is a considerable share of compressed natural gas and some electricity.
0,0
5,0
10,0
15,0
20,0
25,0
30,0
35,0
40,0
2010 2015 2020 2025 2030 2035 2040 2045 2050
TWh
Gasoline
Diesel
CNG
Electricity
Figure 11: Final Energy Consumption and Energy Carriers - Scenario A
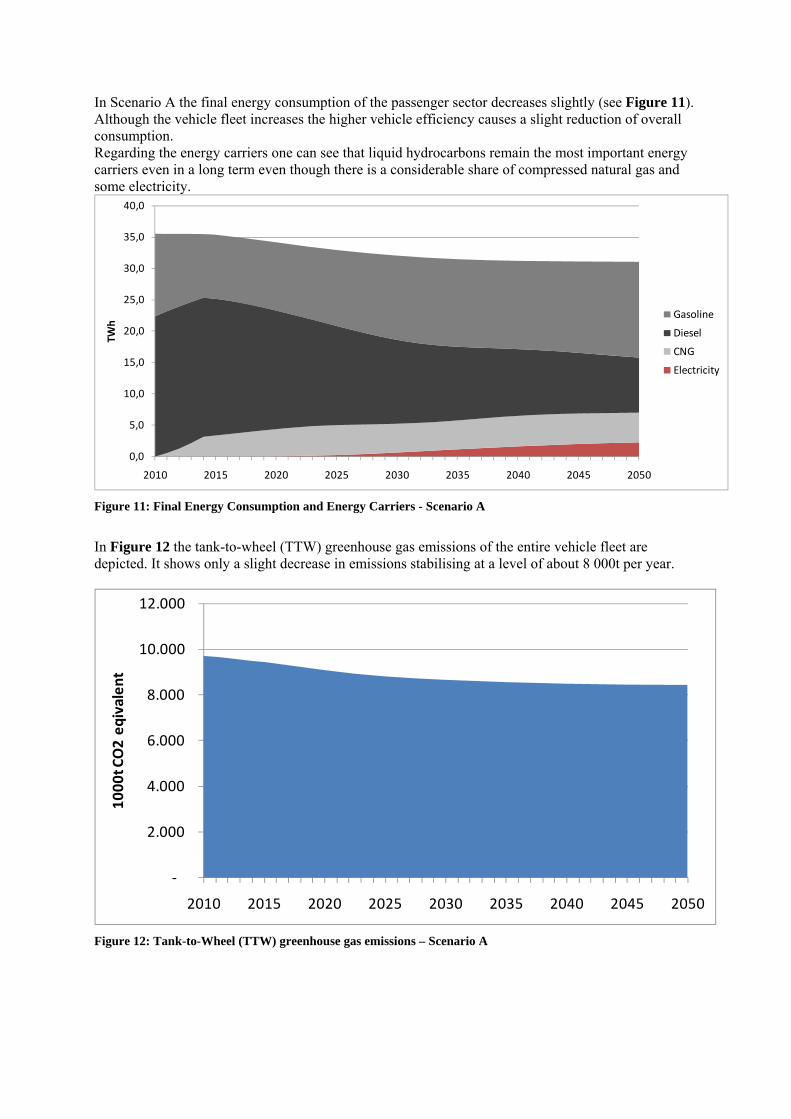
In Figure 12 the tank-to-wheel (TTW) greenhouse gas emissions of the entire vehicle fleet are depicted. It shows only a slight decrease in emissions stabilising at a level of about 8 000t per year.
‐
2.000
4.000
6.000
8.000
10.000
12.000
2010 2015 2020 2025 2030 2035 2040 2045 2050
1000
t CO2 eq
ivalen
t
Figure 12: Tank-to-Wheel (TTW) greenhouse gas emissions – Scenario A
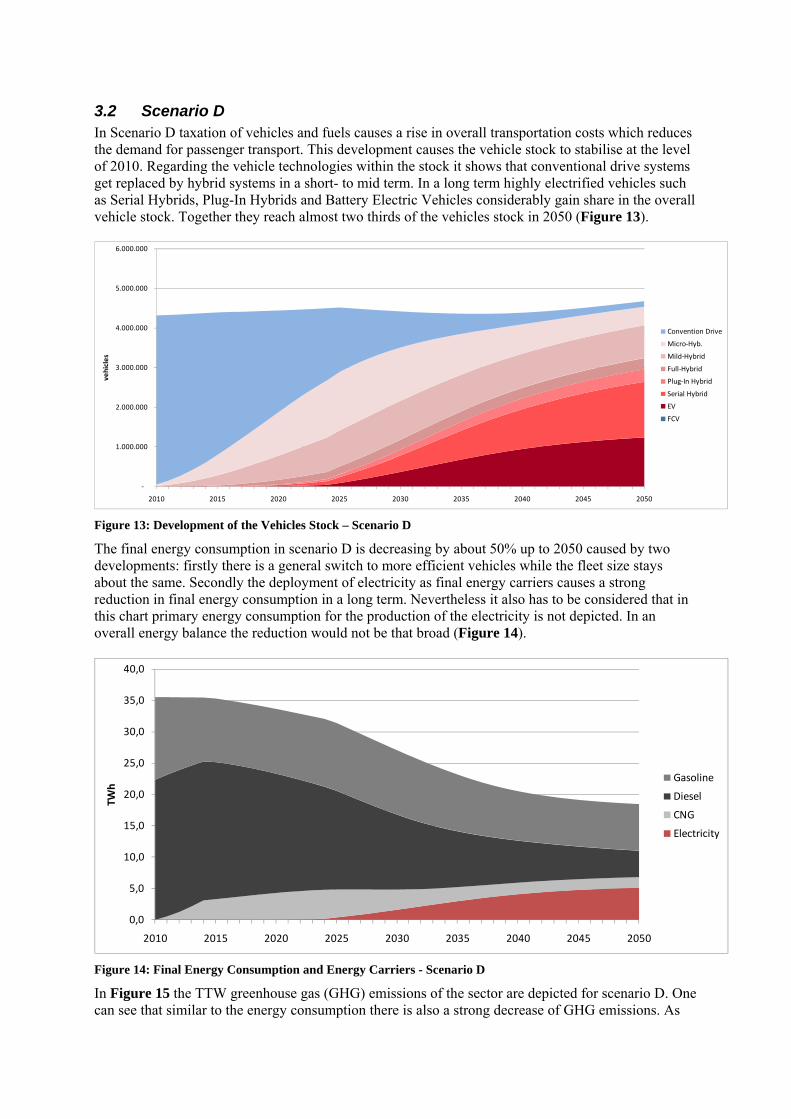
3.2 Scenario D In Scenario D taxation of vehicles and fuels causes a rise in overall transportation costs which reduces the demand for passenger transport. This development causes the vehicle stock to stabilise at the level of 2010. Regarding the vehicle technologies within the stock it shows that conventional drive systems get replaced by hybrid systems in a short- to mid term. In a long term highly electrified vehicles such as Serial Hybrids, Plug-In Hybrids and Battery Electric Vehicles considerably gain share in the overall vehicle stock. Together they reach almost two thirds of the vehicles stock in 2050 (Figure 13).
‐
1.000.000
2.000.000
3.000.000
4.000.000
5.000.000
6.000.000
2010 2015 2020 2025 2030 2035 2040 2045 2050
vehicles
Convention Drive
Micro‐Hyb.
Mild‐Hybrid
Full‐Hybrid
Plug‐In Hybrid
Serial Hybrid
EV
FCV
Figure 13: Development of the Vehicles Stock – Scenario D
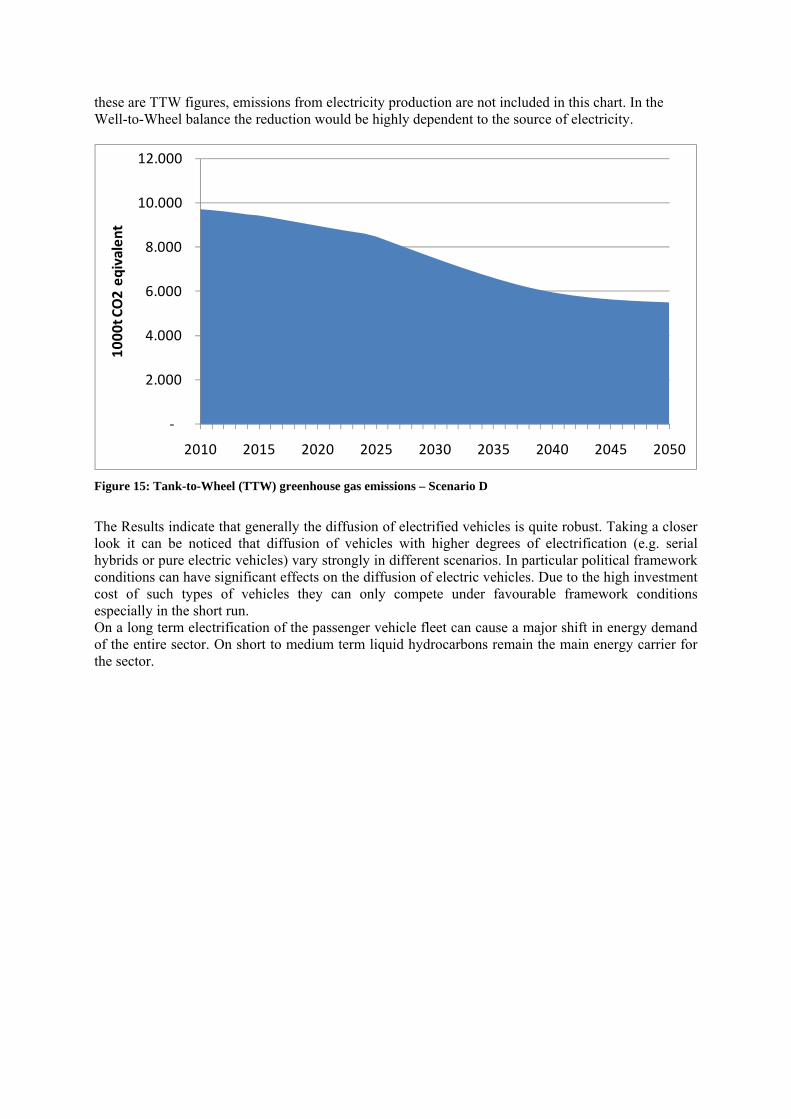
The final energy consumption in scenario D is decreasing by about 50% up to 2050 caused by two developments: firstly there is a general switch to more efficient vehicles while the fleet size stays about the same. Secondly the deployment of electricity as final energy carriers causes a strong reduction in final energy consumption in a long term. Nevertheless it also has to be considered that in this chart primary energy consumption for the production of the electricity is not depicted. In an overall energy balance the reduction would not be that broad (Figure 14).
0,0
5,0
10,0
15,0
20,0
25,0
30,0
35,0
40,0
2010 2015 2020 2025 2030 2035 2040 2045 2050
TWh
Gasoline
Diesel
CNG
Electricity
Figure 14: Final Energy Consumption and Energy Carriers - Scenario D
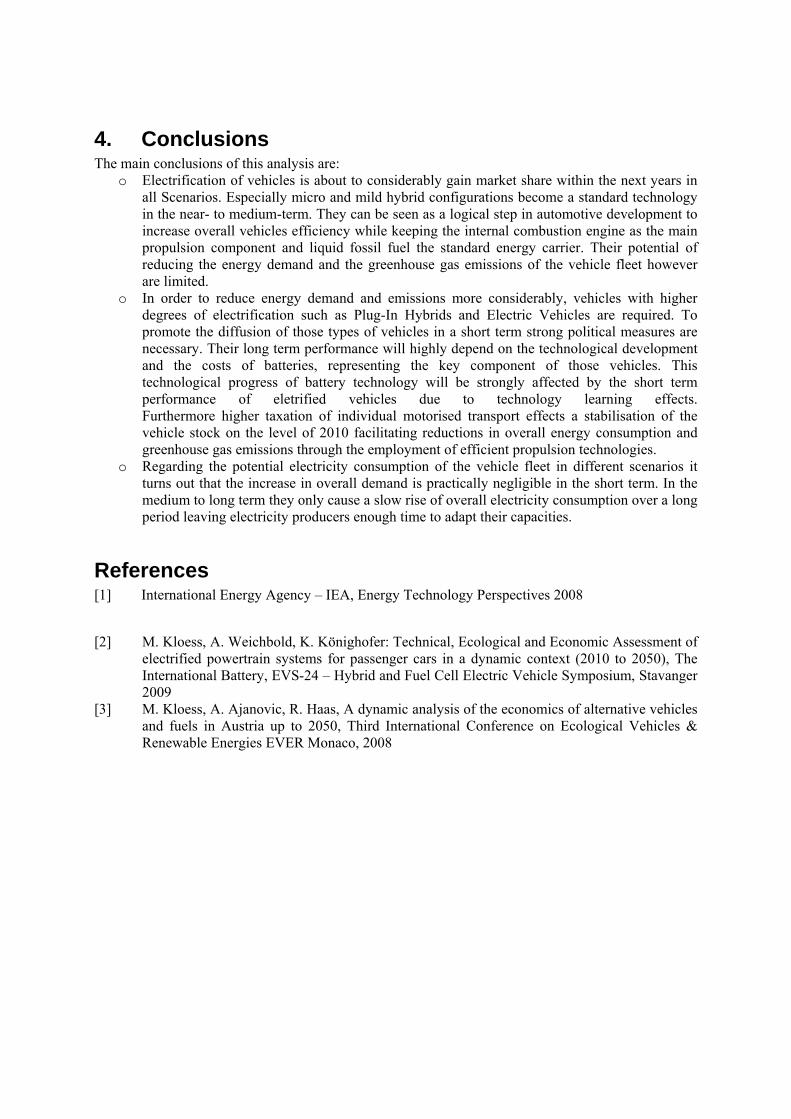
In Figure 15 the TTW greenhouse gas (GHG) emissions of the sector are depicted for scenario D. One can see that similar to the energy consumption there is also a strong decrease of GHG emissions. As
these are TTW figures, emissions from electricity production are not included in this chart. In the Well-to-Wheel balance the reduction would be highly dependent to the source of electricity.
‐
2.000
4.000
6.000
8.000
10.000
12.000
2010 2015 2020 2025 2030 2035 2040 2045 2050
1000
t CO2 eq
ivalen
t
Figure 15: Tank-to-Wheel (TTW) greenhouse gas emissions – Scenario D
The Results indicate that generally the diffusion of electrified vehicles is quite robust. Taking a closer look it can be noticed that diffusion of vehicles with higher degrees of electrification (e.g. serial hybrids or pure electric vehicles) vary strongly in different scenarios. In particular political framework conditions can have significant effects on the diffusion of electric vehicles. Due to the high investment cost of such types of vehicles they can only compete under favourable framework conditions especially in the short run. On a long term electrification of the passenger vehicle fleet can cause a major shift in energy demand of the entire sector. On short to medium term liquid hydrocarbons remain the main energy carrier for the sector.
4. Conclusions The main conclusions of this analysis are:
o Electrification of vehicles is about to considerably gain market share within the next years in all Scenarios. Especially micro and mild hybrid configurations become a standard technology in the near- to medium-term. They can be seen as a logical step in automotive development to increase overall vehicles efficiency while keeping the internal combustion engine as the main propulsion component and liquid fossil fuel the standard energy carrier. Their potential of reducing the energy demand and the greenhouse gas emissions of the vehicle fleet however are limited.
o In order to reduce energy demand and emissions more considerably, vehicles with higher degrees of electrification such as Plug-In Hybrids and Electric Vehicles are required. To promote the diffusion of those types of vehicles in a short term strong political measures are necessary. Their long term performance will highly depend on the technological development and the costs of batteries, representing the key component of those vehicles. This technological progress of battery technology will be strongly affected by the short term performance of eletrified vehicles due to technology learning effects. Furthermore higher taxation of individual motorised transport effects a stabilisation of the vehicle stock on the level of 2010 facilitating reductions in overall energy consumption and greenhouse gas emissions through the employment of efficient propulsion technologies.
o Regarding the potential electricity consumption of the vehicle fleet in different scenarios it turns out that the increase in overall demand is practically negligible in the short term. In the medium to long term they only cause a slow rise of overall electricity consumption over a long period leaving electricity producers enough time to adapt their capacities.
References [1] International Energy Agency – IEA, Energy Technology Perspectives 2008
[2] M. Kloess, A. Weichbold, K. Könighofer: Technical, Ecological and Economic Assessment of electrified powertrain systems for passenger cars in a dynamic context (2010 to 2050), The International Battery, EVS-24 – Hybrid and Fuel Cell Electric Vehicle Symposium, Stavanger 2009
[3] M. Kloess, A. Ajanovic, R. Haas, A dynamic analysis of the economics of alternative vehicles and fuels in Austria up to 2050, Third International Conference on Ecological Vehicles & Renewable Energies EVER Monaco, 2008