The Road Ahead: Economic Outlook Webinar
41
The Road Ahead: Economic Outlook Webinar
Transcript of The Road Ahead: Economic Outlook Webinar

The Road Ahead:Economic Outlook
Webinar
This material is intended for informational purposes only and does not constitute an invitation or solicitation to invest in any particular investment product. Information contained herein has been obtained from sources believed to be reliable but may change without notice. We do not guarantee its accuracy or completeness. Security National Bank accepts no liability for the results of any action taken on the basis of this information.
Financial commentary discussed in this report may not be applicable or suitable for all investors, and investors must make their own independent legal, tax, accounting, and financial evaluations of their risks and merits. Past performance is not indicative of future results. Investments offered by Security National Bank:
– Are Not a Deposit– Are Not FDIC-insured– Are Not Guaranteed by The Bank– Are Not Insured by Any Federal Government Agency– May Go Down in Value
Disclaimer

Investment Team

Damian Howard, CFAVice President, Senior Investment Officer
Brent Boyce, CFAAssistant Vice President/Trust Investment Officer
John Gibb, CFAAssistant Vice President, Investment Officer
Investment Team
Colten MoshierInvestment Services Administrative Assistant

Current State

Labor Market
15.8 million people reported they were unable to work at all or worked fewer hours due to Covid-19.
For the most part job losses are concentrated in leisure and hospitality and other lower paying sectors.

Income
Households lost an estimated $330 billion in wages during the pandemic but received almost $1 trillion in transfer payments with more to come.

Deficit Spending
The Federal government will have spent an extra $4 trillion combating the pandemic.
President-elect Biden has announced plans for an additional $1.9 trillion additional deficit spending.

Quantitative Easing
The Federal Reserve Board (FRB) has purchased a net $3 trillion of bonds.

Money Supply
Bank deposits are up $2.9 trillion and money market balances are up $1.3 trillion since January 2020.
'01 '02 '03 '04 '05 '06 '07 '08 '09 '10 '11 '12 '13 '14 '15 '16 '17 '18 '19 '204,000
6,000
8,000
10,000
12,000
14,000
16,000
18,000
20,000
5
10
15
20
2524.38
©FactSet Research Systems
US M2 Money SupplyUSD Bil. %Chg vs Year Ago
M2 Money Supply, SA - United States (Left) (% 1YR) M2 Money Supply, SA - United States (Right)

Spending
Spending is only down in the highest income group

AudienceSurvey

Way Forward

Impact Sooner than You Think
The benefits of vaccinations will be front end loaded.
Groups most at risk will be immunized first.
With hospitalizations and deaths down, economy can reopen faster than most expect.
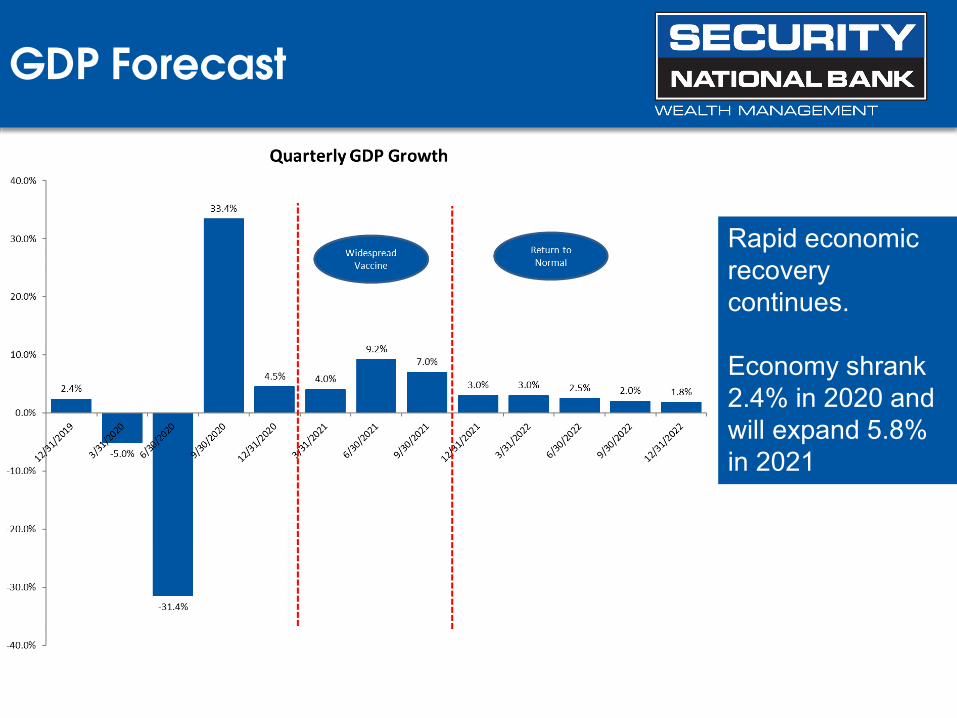
GDP Forecast
Rapid economic recovery continues.
Economy shrank 2.4% in 2020 and will expand 5.8% in 2021

Rapid Recovery
Aggressive fiscal and monetary spending results in faster recovery versus the Great Financial Crisis (GFC)
Down 9.0%
Down 3.9%
Recovery March 2021
Full Recovery June 2021

Inflation
Aggressive fiscal and monetary spending results in faster recovery versus the Great Financial Crisis (GFC)

Corporate Earnings
Earnings for the S&P 500 are set to grow 25% in 2021.
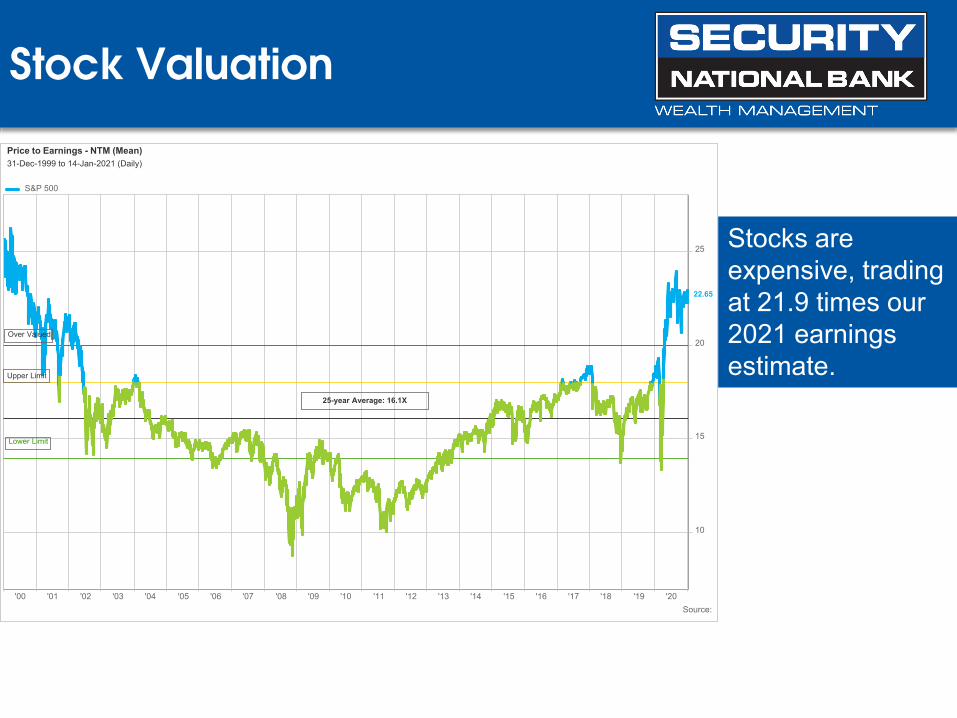
Stock Valuation
Stocks are expensive, trading at 21.9 times our 2021 earnings estimate.
'00 '01 '02 '03 '04 '05 '06 '07 '08 '09 '10 '11 '12 '13 '14 '15 '16 '17 '18 '19 '20
10
15
20
25
Upper Limit
Over Valued
Lower Limit
25-year Average: 16.1X
22.65
Source:
Price to Earnings - NTM (Mean)31-Dec-1999 to 14-Jan-2021 (Daily)
S&P 500

EconomicQuestions

What Have We done
Since September

Asset Allocation
We made some modest asset allocation moves over the last year
Equity % up to January 2021September
2020 January 2020Fixed Income Short Term 0% 0% 0%
High (Investment) Grade 35% 38% 35%High Yield 0% 2% 0%Alternative 2% 0% 0% Internaitonal 0% 0% 5%
Equities Large 45% 47% 43% Extended 8% 8% 10%International 7% 3% 5%Alternative 3% 2% 2%
Total 100% 100% 100%

How HaveWe Done

2020 Results
Our approach has proved to be successful last year.

Longer Term Results
Our approach has proved to be successful over the long term.

Stock Returns
Our returns are led by superior stock returns

Questions

This material is intended for informational purposes only, and does not constitute an invitation or solicitation to invest in any particular investment product. Information contained herein has been obtained from sources believed to be reliable but may change without notice. We do not guarantee its accuracy or completeness. Security National Bank accepts no liability for the results of any action taken on the basis of this information.
Financial commentary discussed in this report may not be applicable or suitable for all investors, and investors must make their own independent legal, tax, accounting, and financial evaluations of their risks and merits. Past performance is not indicative of future results. Investments offered by Security National Bank:
– Are Not a Deposit– Are Not FDIC-insured– Are Not Guaranteed by The Bank– Are Not Insured by Any Federal Government Agency– May Go Down in Value
Disclaimer

Damian Howard402-221-0178
Brent Boyce402-221-0162
John Gibb402-221-0188
Contact Us
Thank You!

Additional Slides

Senate Division
Democrats have the slimmest majority in Congress.
Will the center hold?

Spending
Spending is only down in the highest income group

Sell-Offs are to be Expected
Periodic sell-off are to be expected
Source: FactSet, Standard & Poor’s, J.P. Morgan Asset Management.Returns are based on price index only and do not include dividends. Intra-year drops refers to the largest market drops from a peak to a trough during the year. For illustrative purposes only. Returns shown are calendar year returns from 1980 to 2020, over which time period the average annual return was 9.0%.Guide to the Markets – U.S. Data are as of January 14, 2021.

Stocks are not the Economy
The stock market is not the economy
Source: Bureau of Economic Analysis, Bureau of Labor Statistics, Standard & Poor’s, J.P. Morgan Asset Management. Sector share of S&P 500 based on market cap weighting. Technology: information (economy, employment), technology and communication services (S&P 500). Financial services includes real estate (S&P 500). Consumer discretionary: Arts, entertainment, recreation, accommodation, and food services (economy), leisure and hospitality (employment). Consumer staples: wholesale trade and retail trade (economy, employment). Industrials and materials: construction, manufacturing, transportation and warehousing (economy, employment). Energy: mining (economy), mining and logging (employment). Government, agriculture & misc. services: government, other services, professional and business services, education and agriculture, forestry, fishing, and hunting (economy), government, other services, professional and business services, and education (employment). Guide to the Markets – U.S. Data are as of January 14, 2021.
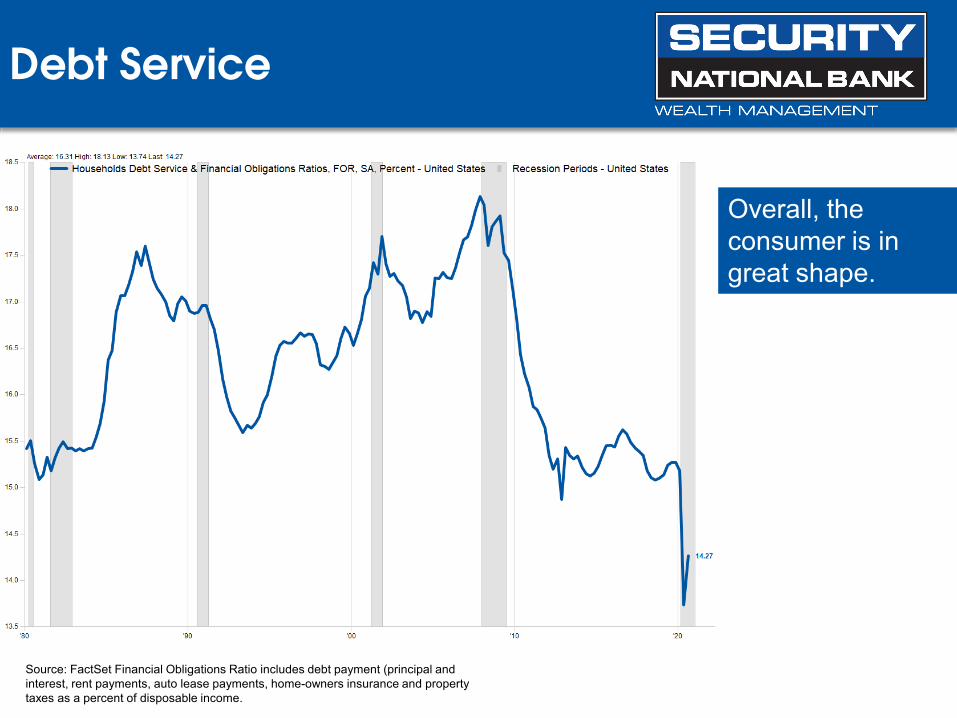
Debt Service
Overall, the consumer is in great shape.
Source: FactSet Financial Obligations Ratio includes debt payment (principal and interest, rent payments, auto lease payments, home-owners insurance and property taxes as a percent of disposable income.

Household Wealth
Net Worth is at an all-time high
Source: FactSet
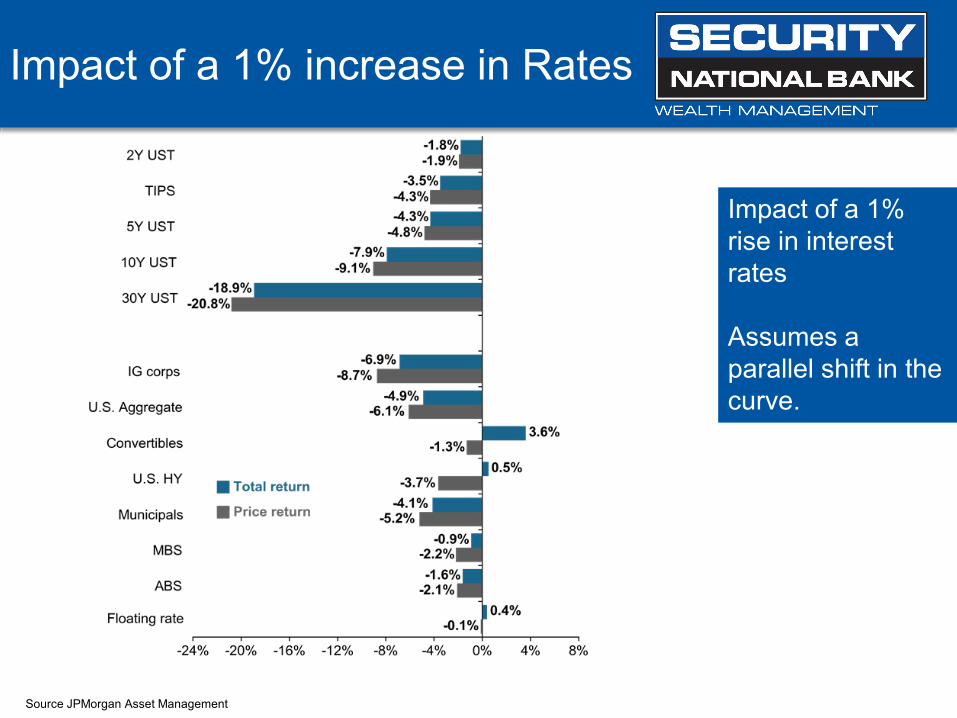
Impact of a 1% increase in Rates
Impact of a 1% rise in interest rates
Assumes a parallel shift in the curve.
Source JPMorgan Asset Management

Long Term View
Long time horizons allow for higher equity allocations.
Most investors are under allocated to equities.
Allocated to equities as cashflow and comfort allows.
Source: Barclays, Bloomberg, FactSet, Federal Reserve, Robert Shiller, Strategas/Ibbotson, J.P. Morgan Asset Management.Returns shown are based on calendar year returns from 1950 to 2020. Stocks represent the S&P 500 Shiller Composite and Bonds represent Strategas/Ibbotson for periods from 1950 to 2010 and Bloomberg Barclays Aggregate thereafter. Growth of $100,000 is based on annual average total returns from 1950 to 2020.Guide to the Markets – U.S. Data are as of January 14, 2021.

Retail Sentiment
Retail investors have for the most part missed the recovery and are now returning to the market.
Source: American Association of Individual Investors January 18, 2021.

Odd Favor Investors
Investors have an 87% chance of positive return during periods of economic growth and only 4% chance of a decline of more than 10% this year.
Source: Goldman Sachs Investment Strategy Group

Bull Market has Room to Run
Odds favor further equity gains.
Source: Goldman Sachs Investment Strategy Group