THE RISKLESS RATE OF RETURN IN RISK PREMIUM … · principal due to an increase in inflation). ......
17
'- ' THE RISKLESS RATE OF RETURN IN RISK PREMIUM STUDIES Eugene Brigham and Di1ip K. Shame May 1980
Transcript of THE RISKLESS RATE OF RETURN IN RISK PREMIUM … · principal due to an increase in inflation). ......
'- '
THE RISKLESS RATE OF RETURN
IN RISK PREMIUM STUDIES
Eugene F~ Brigham and Di1ip K. Shame
May 1980
THE RISKLESS RATE OF RETURN
IN RISK PREMIUM STUDIES
EugeneF. Brigham and Dilip K. Shome
Public Utility Research Center
University of Florida
May 1980
PURC Working Paper No. -80

-1-
One question that rises immediately in a study of risk
premiums is the best choice for the riskless rate. The
principal alternatives are (1) the rate on short-term
u.s. Treasury securities (Treasury bills) and (2) the rate
on long-term Treasury bonds. Both types o~ securities are
free of default risk, but neither is completely riskless
because both are exposed to interest rate risk (the risk of
a decline in the value of the outstanding bonds as a result
of an increase in interest rates) and to purchasing power risk
(the risk of a decline in the real value of interest and
principal due to an increase in inflation). Long-term bonds
are more exposed to both interest rate and purchasing power
risk than are Treasury bills and other short-term government
debt. Therefore, bills are closer to being truly riskless
than are bonds, and for this reason a number of people have
argued that risk premiums on common stocks should be based
on bills rather than on Treasury bonds~l
However, there is a fundamental problem with basing
common stock riskpremiums·on short-term Treasury bills,
namely, the fact that bill rates are subject to short-term
phenomena that do not affect long-term rates, or at least
affect long-term rates differently. First, consider infla-
tion. Nominal security returns are equal to a pure rate of
IThis is particular-ly true of advocates of the CAPM. See· Willard T. Carleton,"Comment on the Use of the CAPMin Public Utility Rate Cases," Financial Management,Autumn 1978, pp. 57-S9,for a more complete development of this point. Carletonnoted the points we expressed below and strongly opposed using bills in commonstock risk premium studies.

-2-
return (RR), plus a premium for expected inflation (IP), plus
a risk premium (RP), plus an error term (e) which reflects
random market factors which cause temporary disequilibrium:
Nominal expected return = RR + IP + RP + e. (1)
There is no reason to think that RR will be different for
Treasury bonds or bills, but there is a very good reason to
think that IP, RP, and e will be different for bonds versus
bills. First, IP reflec~s expected inflation over the
life of th.e security. Therefore, the yield on a 3D-day
Treasury bill reflects expected inflation during the next 30
days, while the yield on a 30-year bond reflects the average
rate of expected inflation over the next 30 years. Long and
short-term inflation rates are rarely identical. For
example, in May, 1980, the long-term expected inflation rate
(average rate over the next 5 to 10 years) is generally
regarded as being in the 8 ·to 9 percent range, but the
short-term (1 year) expected rate is about.12 percent. Thus,
long and short-term interest rates are often quite different,
as they are in theU. s. today. Also, because short-term
inflationary .expectations are more volatile than long-term
inflation, short-term interest rates are much more volatile
than long-term-interest rates.
The risk premium, RP, also differs between bills and
bonds: Because of their much greater exposure to interest
rate and purchasing power risk, bonds have a larger "liquidity
risk premium" than do bills. Finally, consider the·"error term."

-3-
Random movements in interest rates are caused by such factors
as the current level of corporate liquidity, Federal Reserve
monetary policy, u.s. Treasury surpluses or deficits, and
the activity of ,foreign and domestic currency dealers and
speculators. These random movements are probably larger
(in either a positive or a negative direction for bills than
for bonds because bills are the securities that the Treasury,
the Federal Reserve, corporate treasurers, and currency dealers
and speculators all·use .in their normal operations. The
larger error term for bills also helps explain why bill rates
are so much more volatile than bond rates.
Now consider the implications of all this for the
choice of short-term or long-term government debt instru
ments as.the basing point in a study of common stock risk
premiums. We are seeking a risk premium which can be added
to the current observed and quoted market rate on debt
securities which can then be used to obtain an estimate of
the current cost of equity capital. Bonds·and common stocks
are both long-term securities, so their returns should
reflect long-term inflation. Further, neither type of
security is used as an instrument of monetary policy, or by
currency speculators, or asa buffer for temporary changes
in corporate liquidity, or by international currency speculators.
Treasury bills are, of course, used for all these purposes.
Therefore, it is far more logical to think that the cost of
common equity is correlated with interest rates on long-term

-4-
bonds than with those on bills, and for this reason we based
our common stock risk premiums on long-term bonds rather
than on short-term bills.
The Government Bond Rate
There are a number of different issues of long-term
Treasury securities, and they sell at different premiums or
discounts depending on their coupon interest rates. Fur
ther, certain deep discount, or· "flower" bonds, sellon a
lower yield basis because they may be surrendered at par
value to pay estate taxes. (These bonds are called "flower
bonds" because they are associated with funerals.) In other
words, a $1,000 par value, 3 percent coupon, 20 year bond
would have a theoretical value of $505 if the going rate of
interest on 20 year government bonds were 8 percent, but to
a wealthy individual with terminal cancer and a one-month
expected life, the bonds would be worth approximately $1,000
because they could be used to pay $1,000 of estate taxes.
Therefore, these bonds sell at high prices, and their yields
are far below the yields on new bonds that.sel1 at close to
their par value.
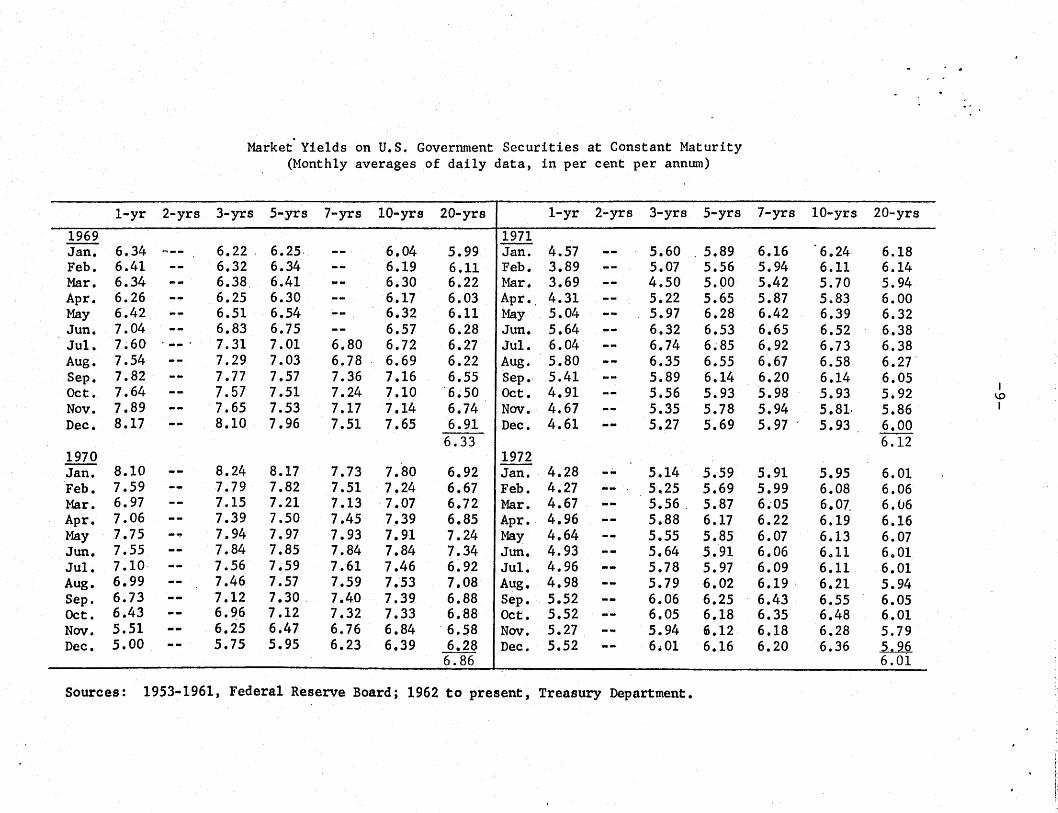
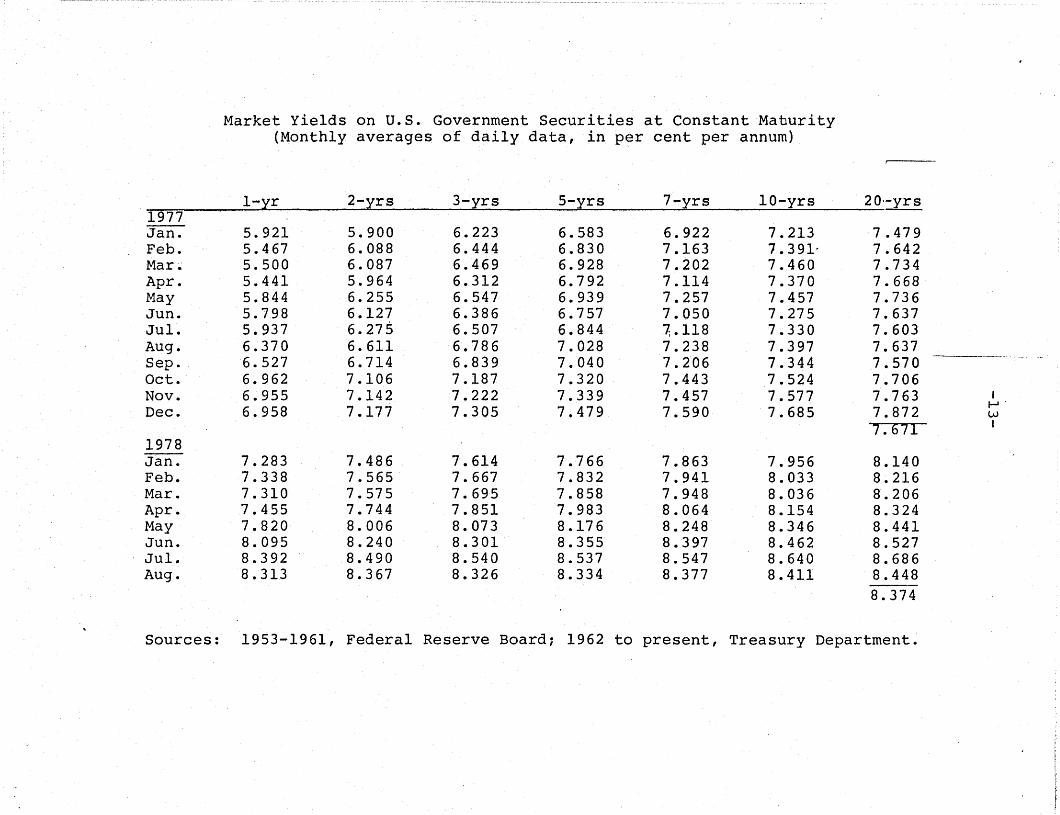
Because of the flower bond phenomenon, indices of U.S.
Treasury bond yields may be distorted, so one must exercise
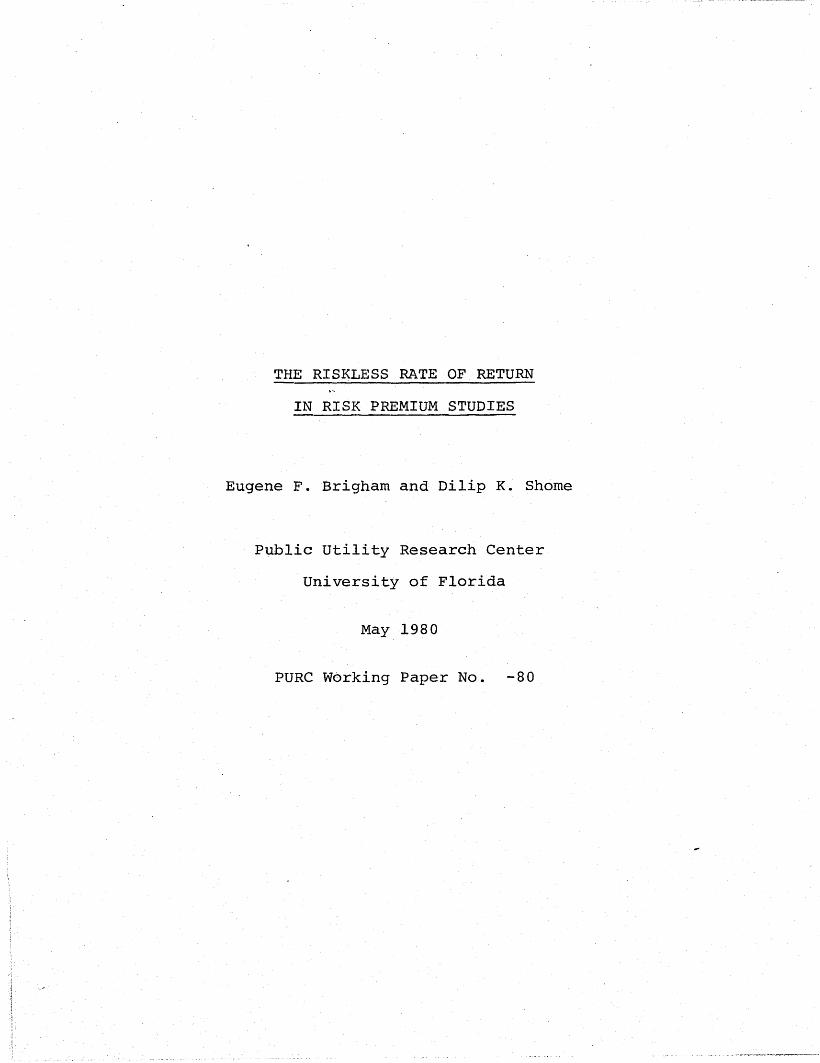
care in selecting the best index. Our choice was the U.S.
Treasury "Constant Maturity Series," which gives relatively

-5-
little weight to flower bonds. l This particular series
has been published in the Federal Reserve Bulletin since
1977; earlier editions of the FRB used a series that was
heavily weighted with flower bonds. To get some idea of
the effects of including flower bonds, consider the
following set of data for the period 1973~1975:
Long-term Treasury Bond Yields
As reportedin the FRB
during the 'yearin question Difference
1973 6.30% 7.12% '0.82%
1974 6.99 8.05 1.06
1975 6.98 8.19 1.21---Average 1.03%
Using the yield data as reported in the Federal Reserve
Bulletin would have resulted in an overstatement of the
risk premium of approximately one full percentage point.
Because the constant maturity series prior to 1977 is not
readily available, a set of tables, and a memo describing
the series prepared by the Federal Reserve Board staff, is
attached her~with as Appendix A. We also show, as Appendix B,
yield differentials on various types of bonds from 1960
through 1979.
lIf flower bonds were used in the series, the effect would be tolower the reported yield on long-term governments and,therefore, toincrease the reported risk premiums. Since we have chosen a series'which excludes these bonds, our calculated risk premiums are smallerthan would otherwise be the case.

-6-
APPENDIX AATTACHMENT TO THE H.15 AND G.13 STATISTICAL RELEASES 4/19/77
Information About the Treasury Constant Maturity Yield Series
Yields on Treasury securities at constant maturity are constructed bythe Treasury Department, based on the most active1y·traded marketable Treasurysecurities. To obtain these yields, personnel at the Treasury Department constructa yield curve each day (see below), and yield values are then read from the curve atfixed maturities. -- presently 1,2,3, 5, 7, 10,20, and 30 years. By this technique,a yield may be estimated for, say, the 5-year maturity, even if no outstandingmarketable Treasury issue currently has exactly 5 years remaining to maturity. Jj
Constant maturity yields have been constructed by the Treasury Departmentsince 1962 for maturities of 1,3,5, 10, and 20 years. The 7-year series was begunin July 1969; the 2-year series, in June 1976; and the 30-year series, in February1977. The Federal Reserve Board has recently constructed comparable data for thepe"ri od Apri 1 1953 to December 1961, so that conti nuous month ly constant maturi tyyield series (averages of daily data) now exist for five of t~e maturities for nearlya 24-year period. Copies of the back data are attached.
To construct a yield curve for any given day, the Treasury Department firstplots the closing market bid yields of outstanding Treasury securities on a graph.(These yields are based on composite quotes reported by five U.S. Governmentsecurities dealers to the Federal Reserve Bank of New York. ) The horizontal axisof the graph shows the maturity date of each security, and the vertical scale measuresthe yield. A single, continuous yield curve is then drawn, either by hand or bycomputer, through the plotted points, with the heaviest weight given to the mostrecent, actively traded Treasury issues. In particular, very little weight is nowgiven to the low-coupon, deep discount Treasury bonds commonly known as IIfloweru
bonds.
A warning should be given in the .case of the 20-year constant maturity yieldseries. During the period from roughly May 1965 to January 1973, the 20-year yieldseries fell increasingly below what may be thought of as its Ucorrectll level. Whenit was returned to its "correctll level in January 1973 -- an upward correctionof about 75 basis points was required. 2/
Jj The yield curves constructed by the Treasury Department are used as a basicinput, along with other market data, in estimating "the yield the Treasurywould have to pay if it sold a new marketable security of given maturity.
y Between June 1965 and August 1971, the Treasury sold no new marketablesecurities which had more than 7 years to maturity (because of a 4-1/4per cent Congressionally-legislated ceiling on all new Treasury bonds).Therefore, each yield curve constructed during that entire 6-year periodwas necessarily based -- at least in the long-term maturity area -- on lowyielding Treasury securities issued prior to June 1965.
Between March 1971 (When the 4-1/4 per cent ceiling was partially relaxed)"and the end of 1972, the Treasury sold five new bonds -- with maturitiesbetween 9-3/4 years and 15 years -- and·a new 20-year Treasury bond wasauctioned on January 4, 1973. Moreover, a number of new Treasury bondshave been sold since then. Based on this renewed flow of informationabout Treasury borrowing costs in the long-term area, the 20-year serieshas beenata higher, more "correct" level since January 4,1973.
Market Yields on U.S. Government Securities at Constant Maturity(Monthly averages of daily data, in per cent per annum)
1-yr 2-yrs 3-yrs '5-yrs 7-yrs 10-yrs 20-yrs 1-yr 2-yrs 3-yrs 5-yrs 7-yrs 10-yrs 20-yrs
l.ill 19551.74 2.49Jan. •• •NOT AVAILABLE ••• Jan. 1.39 1.99 2.32 2.61 2075
Feb. ... NOT AVAILABLE ..• Feb. 1.57 1.93 2.12 2.38 2.53 2.65 2.83Mar. ••• NOT AVAILABLE ••• Mar. 1.59 2.02 2.26 2.48 2.59 2.68 2.84Apr. 2.36 2.44 2.51 2.62 2.72 2.83 3.08 Apr. 1.75 2.15 2.37 2.55 2.65 2.75 2.85May 2.48 2.63 2.72 2.87 2.96 3.05 3.18 May 1.90' 2.20 2.37 2.56 2.66 2.76 2.87Jun. 2.45 2.61 2.74 2.94 3.03 ·3.11 3.21 Jun. 1.91 2.22 i 2.39 2.59 2.70 2.78 2.86Jul. 2.38 2.53 2.62 2.75 2.84 2.93 3.12 Jul. 2.02 2.33 2.51 2.72 2.83 2.90 2.94Aug. 2.28 2.44 2.58 2.80 2.88 2.95 3.10 Aug. 2.37 2.60 2.72 2.86 2.93 2.97 3.01Sep. 2.20 2.43 2.56 2.71 2.79 2.87 3.07 Sept 2.36 2.56 2.69 2.85 2.92 2.97 3.00
IOct. 1.79 2.05 2.23 2.43 2.54 2.66 2.95 Oct. 2.39 2.52 2.62 '2.76 2.83 2.88 2.93 -...J
Nov. 1.67 2.00 2.20 2.42 2.55 2.68 2.95 Nov. 2.48 2.64 2.73 2.81 2.86 2.89 2.93 I
Dec. 1.66 1.90 2.07 2.32 2.45 2.59 2.89 Dec. 2.73 2.83 2.88 2.93 2.95 2.96 2.983.06 2.90
1954 .lli.6.Jan. 1.41 1.68 1.89 2.17 2.32 2.48 2.80 Jan. 2.58 2.70 2.78 2.84 2.88 2.90 2.94Feb. 1.14 1.39 1.63 2.04 2.30 2.47 2.72 Feb. 2.49 2.60 2.67 2.74 2.79 2.84 2.91Mar. 1.13 1.36 1.59 1.93 2.19 2.37 2.61 Mar. 2.61 2.82 2.89 2.93 2.95 2.96 2.99Apr 0.96 1.29 1.54 1.87' 2.09 2.29 2.60 Apr. 2.92 3.14 3.19 3.20 3.19 3.18 3.14M.ay 0.85 1.27 1.56 1.92 2.16 2037 2.66 May 2.94 3.07 3.08 3.08 3.08 3.07 3.06Jun. 0.82 1.21 1.53 1.92 2.18 2.38 2.64 Jun. , 2.74 2.91 2.95 2.97 2.99 3.00 3.00Jul. 0.84 1.17 1047 1085 2.12 20~O 2.57 Jul. 2.76 2.98 3.06 3.12 3.12 3.11 3.08Aug. 0.88 1.21 1.49 1.90 2.17 2036 20 58' Aug. 3.10 3.33 3.39 3.41 ,3.39 3.33 3.22Sep. 1.03 1.31 1,.60 1.96 2.21 2.38 2.60 Sept 3.35 3.48 3.50 3.47 3.43 3.38 3.28Oct. 1.17 1051 1.72 2.02 2.25 2.43 2.61 Oct. 3.28 3.38 3.40 3.40 3.37 3.34 3.26Nov. 1.14 1.50 1.75 2.09 2.32 2048 2.65 Nov. 3.44 3.56 ·3.57 3.56 3.53 3.49 3.37Dec. 1.21 1.56 1.81 2.16 2.38 2.51 2067 Dec. 3.68 3.77 3.76 3.70 3.65 3.59 3.45
2.64 "J:Tli"
Sources: 1953-1961, Federal Reserve Board; 1962 to present, Treasury Department.

...
Market Yields on U.S. Government Securities at Constant Maturity(Monthly averages of daily data, in per cent per annum)
1-yr 2-yrs 3-yrs 5-yrs 7-yrs 10-yrs 20-yrs 1-yr 2-yrs 3-yrs 5-yrs 7-yrs 10-yrs 20-yrs1973 1975Jan. 5.,89 6.27 6.34 6.36 6.46 6.78 Jan. ' 6.83 7.23 7.41 7.45 7.50 7.~8
Feb. 6.19 6.58 6.60 6060 6.64 6.88 Feb. 5.98 6065 7.11 7.30 7.39 7.71Mar. 6.85 6.86 6.80 6.76 6.71 6.91 Mar. 6.11 6.81 7.30 7.58 ,7.73 7.99Apr. 6.85 6.78 6.67 6.67 6 0 67 6.86 Apr. 6.90 7.76 7.99 ,8.11 8.23 8.36May 6.89 6.83 6.80 6.83 6.85 6.99 May 6.39 7.39 . ,7.72 7.90 8.06 8022Jun. 7.31 6.83 6.69 6.81' 6090 7;'06 Jun. 6.29 7.17 7.51 7.69 7086 8.04Jul. 8.39 7.54 7.34 7.23 7.13 7.29 Jul. 7.11 7.72 7.92 7.99 8.06 8.17Aug. 8.82 7.89 . 7.63 7.52 7.40 7,.62 Aug. 7.70 8,.16 8.33 8.37 8.40 '8 050Sept 8.31 7.25 7.05 i.08 7.09 7.25 Sep. 7.75 8.29 8.37 8.39 8.43 8.57Oct. 7.40 6.81 6.77 6.78 6.79 7.18 Oct. 6.95 7.81 7.97 8.06 8.14
0
8.35 I(X)
Nov. 7.57 7.00 6.92 6.89 6.73 7.30 Nov. 6.49 7.46 7.80 7.98 8'~05 8.28 I
Dec. 7.27 6.81 6.80 6.77 6.74 7.29 Dec. 6.60 7.43 7.76 7.93 8.00 80237.12 8.19
1lli 1976Jan. 7.42 6.96 6.95 6.88 6.99 7.48 Jan. 5.81 6099 7.46 7.67 7.74 8.01Feb. 6.88 6.76 6.82 6.92 6.96 7.46 Feb. 5.91 7.06 7.45 7.72 7.79' 8.03Mar. 7.76 7.35 7.31 7.34 7.21 7.73 Mar. 6021 7.13 7.49 7.65 7.73 7.97Apr. 8.62 8.05 7.92 7.77 7.51 8.01 Apr. ' 5.92 6.84 7.25 7.44 7.56 7.86May 8.78 8.27 8.18 7.93 7.58 ' 8.14 Hay 6.40 7.27 7.59 7.77 7.90 8.13Jun. 8.67 8.15 8.10 7.90 7.54 8.10 Jun;.. 6052 7.06 7.32 7.61 7.76 7.86 8003Jul. 8.80 ' 8.41 8.38 8.19 7.81 8.26 Jul. 6.20 6.85 7012 7.49 7.70 7.83 8.00Aug. 9.36 8.66 8.63 8.41 8.04 8.60 Aug. '6.00 6.63 6.86 7.31 7.58 7.77 7.91Sep. 8.87 8.41 8.37 8'.25 8.04 8.60 Sep. 5.84 6.42 6.66 7.13 7.41 7.59 7.78Oct. 8.05 8;00 7.97 7.92 :" 7.90 8.37 Oct. 5.50 5098 6.24 6.75 7.16 7.41 7.70Nov. 7.66 7.61 7.68 7.68 7.68 7.99 Nov. 5.29 5.81 6.09 6.52 6.86 7.29 7.64Dec. 7.31 7.24 7.31 7.38 7.43 7.91 Dec. 4.89 5.38 5.68 6.10 6.37 6.87 7.30
1CIT5 -T:86
Sources: 1953-1961, Federal Reserve Board; 1962 to present, Treasury Department.
.-
Market Yields on U.S. Government Securities at Constant Maturity(Monthly averages of daily data, in per cent per annum)
1-yr 2-yrs 3-yrs 5-,yrs 7-yrs 10-yrs 20-yrs 1-yr 2-yrs 3-yrs 5-yrs 7-yrs 10-yrs 20-yrs
1969 1971Jan. 6.34 6.22 6.25· 6.04 5.99. Jan. 4.57 5.60 5.89 6.16 '6.24 6.18Feb. 6.41 6.32 6.34 6.19 6.11 Feb. 3.89 5.07 5.56 5.94 6.11 6.14Mar. 6.34 6.38. 6.41 6.30 6.22 Mar. 3.69 4.50 5.00 5.42 5.70 5.94Apr. 6.26 6.25 6.30 6.17 6.03 Apr •. 4.31 5.22 5.65 5.87 5.8~ 6.00May 6.42 6.51 6.54 -- 6.32 6.11 May 5.04 5.97 6.28 6.42 6.39 6.32Jun. 7.04 6.83 6.75 6.57 6.28 Jun. 5.64 6.32 6.53 6.65 6.52 6.38Jul. 7~60
. _. ' 7.31 7.01 6.80 6.72 6.27 Jul. 6.04 6.74 6.85 6.92 6.73 6.38Aug. 7.54 7.29 7.03 6.78 6.69 6.22 Aug. 5.80 6.35 6.55 6.67 6.58 6.27'Sep. 7.82 7.77 7.57 7.36 7.16 6.55 Sep.· 5.41 5.89 6.14 6.20 6.14 6.05
IOct. 7.64 7.57 7.51 7.24 7.10 '6~50 Oct. 4.91 5.56 5.93 5.98 5.93 5.92 ~
Nov. 7.89 7.65 7.53 7.17 7.14 6.74 Nov. 4.67 5.35 5.78 5.94 5.81. 5.86 I
Dec. 8.17 8.10 7.96 7.51 7.65 6.91 Dec. 4.61 5.27 5.69 5.97 5.93 6.006.33 6.12
1970 1972Jan. 8.10 8.24 8.17 7.73 7.80 6.92 Jan. 4.28 5.14 5.59 5.91 5.95 6.01Feb. 7.59 7.79 7.82 7.51 7.24 6.67 Feb. 4.27 5.25 5.69 5.99 6.08 6.06Mar. 6.97 7.15 7.21 7.13 '7.07 6.72 Mar. 4.67 5.56 . 5.87 6~05 6·.07. 6.06Apr. 7.06 7.39 7.50 7.45 7.• 39 6.85 Apr •. 4.96 5.88 6.17 6.22 6.19 6.16May 7.75 7.94 7.97 7.93 7.91 7.24 May 4.64 5055 5.85 6.07 6.13 6.07Jun. 7.55 7.84 7.85 7.84 7.84 7.34 Jun. 4.93 5.64 5.91 6.06 6011 6001Jul. 7.10, 7.56 7.59 7.61 7.46 6.92 Jul. 4.96 5.78 5.97 6.09 6.11 6.01Aug. 6.99 7.46 7.57 7.59 7.53 7.08 Aug. 4.98 5.79 6.02 6.19 6.21 5.94S·ep. 6.73 7.12 7.30 . 7.40 7.39 6.88 Sep. . 5.52 6.06 6.25 6.43 6.55 6.05Oct. 6.43 6.~6 7.12 7.32 7.33 6.88 Oct. 5.52 6.05 6.18 6.35 6.48 6.01Nov. 5.51 6.25 6.47 6.76 6.84 . 6.58 Nov. 5.27 5.94 6.12 6.18 6.28 5.79Dec. 5.00 5.75 5.95 6.23 6.39 6.28 Dec. 5.52 6.01 6.16 6.20 6.36 ~
6.86 6.01
Sources: 1953-1961, Federal Reserve Board; 1962 to present, Treasury Department.

t.
Market Yields on U.S. Government Securities at Constant Maturity(Monthly averages of daily data, in per cent per annum)
1965 1967Jan. 3.94 4.03 4.10 4.19 4.19 Jan. 4.75 4.75 4.70 4058 4.51Feb. 4.03 4.08 4.15 4.21 4.21 Feb. 4.71 4.73 4.74 4063 4.61Mar. 4.06 '-- 4.13 4.15 4.21 4.20 Mar. 4.35 4.43 4.54 4.54 4.56Apr. 4.04 4.12 4.15 4.20 4.20 Apr. 4.10 -- 4.38 4.51 4.59 4.64May 4.03 4.11 4.15 4.21 4.21 May 4015 4.60 4.75 4.85 4.90Jun. 3.99 4.08 4.15 4.21 4.21 Jun·;. 4 048 4~. 89 5.01 5.02 4.99Jul. 3.98 4.09 4.15 4.20 4.21 Jul. 5001 5.06 5.23 5.16 5.01Aug. 4.07 4.16 4.20 4.25 4.25 Aug. 5.13 5.23 5.31 5.28 5.12Sep. 4.20 4.24 4.25 4029 4.30 Sep. 5.24 5.41 5.40 5.30 5.16 IOct. 4.30 4.33 4.34 4.35 4.32 Oct. 5.37 5.52 . 5.57 5.48 5.36 I-'
0Nov. 4.37 4.45 4.46 4.45 4.40 Nov. 5.61 5.71 5.78 5.75 5.66 I
Dec. 4.72 4.79 4.72 4.62 4.50 Deco 5.71 5.70 5.75 5.70 5.594.27 5.01
1966 1968Jan. 4.88 4.90 4.86 4.61 4.52 Jan, 5.43 -- 5.53 5054 5.53 5.39Feb. 4.94 5.02 4.98 4 083 4.71 Feb. 5.42 5.61 5.59 5.56 5.38Mar. 4.97 4.97 4.92 4.87 4.72 Mar. 5.58 5.80 5.76 -- 5.74 5.59Apr. 4.90 4 089 4.83 4.75 4.65 Apr. 5.71 5.75 5.69 5.64 5.46May 4.93 4.95 4.88 4 078 4.69 May 6014 6011 6.04 5087 5.;>5Jun. 4.97 5.05 4.97 4.81 4073 Jun. 5098 5.82 5.85 5.72 5040Jul. 5.17 5.26 5.17 5.02 4.84 Jul. 5.65 5.54 5 060 5050 5.29Aug. 5.54 5.68 5.50 5.22 4.95 Aug. 5.43 5.42 5.50 5.42 5.23·Sep. 5.82 5.79 5.50 5.18 4094 Sep. 5.44 5.39 5.48 5.46 5.28Oct. 5.58 5.48 5.27 5001 4 083 Oct. 5.57 5.52 5055 5.58 5.44 .Nov. 5.54 5053 5.36 5.16 4.87 Nov. 5.75 5.57 5066 5.70 5056Dec. 5 .. 20 5.19 5.00 4.84 4.76 Dec. 6019 6.16 6.12 6.03 5.88
ZClr 5.45Sources: 1953-1961, Federal Reserve Board; 1962 to present, Treasury Department.

:Harket Yields on U.S. Government Securities at Constant Maturity(Honth1y averages of daily data, in per cent per annum)
1-yr 2-yrs 3-yrs 5-yrs 7-yrs 10-yrs 20-yrs 1-yr 2-yrs 3-yrs 5-yrs 7-yrs 10-yrs 20-yrs
1961 1963Jan. 2.81 3.15 3.39 3.67 3.77 3.84 3.90 Jan. 3.04 3.40 3.58 3.83 3.94Feb. 2.93 3.24 3.46 3.66 3.73 3.78 3.84 Feb. 3.01 3.39 3.66 3.92 3.97Mar. 2.88 3.15 3.35 3.60 3.68 3.74 3.81 Mar. 3.03 3.41 3.68 3.93 3.98Apr. 2.88 3.15 ·3.33 3.57 3.70 3.78 3.81 Apr. 3.11 3.50 3.74 3097 4.03May 2.87 3.·08 3.23 3.47 3.63 3.71 3.74 May 3.12 3.54 3.72 3.93 4.02Jun. 3.06 3.41 3.63 3.81 3.86 3.88 3.89 Jun. 3.20 3.• 61 3.81 3.99 4.02Jul. 2.92 3.30 3.59 3.84 3.90 3.92 3.93 Jul. 3047 3'.76 3.89 4.02 4.06Aug. 3.06 3.46 3.76 3.97 4.03 4.04 4.04 Aug. 3053 3.77 3.89 4.00 4.03Sept 3.06 3.44 3.73 3.90 3.94 3.98 4.04 Sept 3.57 3.82 3.96 4.08 4.09Oct. 3.05 3.42 3.62 3.80 3.87 3.92 4.01 Oct. 3.64 3087 3.97 4.11 4.12 I
Nov. 3.07 3.40 3.61 3.82 3.90 3.94 4.00 Nov. 3.74 3.95 4.01 4.12 4.16 I-'I-'
Dec. 3.18 3.54 3.72 3.91 4.00 4.06 4.07 Dec. 3.81 4.01 4.04 4.13 4.19 I
3.92 4.051962 1964Jan. 3.28 3.76 3.94 4.08 4.10 Jan. 3.79 4.04 4.07 4.17 4.19Feb. 3.28 3.69 3.89 4.04 4.12 Feb. 3.78 4.00 4.03 4.15 4.17Mar. 3.06 3.45 3.68 3.93 4.04 Mar. 3.91 4.12 4.14 4.22 4.22Apr. 2.99 3.38 3.60 3.84 3.93 Apr. 3.91 4.15 4.15 4.23 4.24May 3.03 3.40 3.66 3.87 3.92 May 3.84 4.04 4.05 4.20 4.20Jun. 3.03 3.39 3.64 3.91 3.96 ·Jun. 3.83 4.01 4.02 4.17 4.17Jul. 3.29 3.62 3.80 4.01 4.05 Jul. 3.72 3.93 4.03 4.19 4.16Aug. 3.20 3.46 3.71 3.98 4.01 Aug. 3.74 3.93 4.05 4.19 4.18.Sep. 3.06 3.41 3.70 3.98 4.00 Sept 3.84 4.01 4.08 4.20 4.20Oct. 2.98 3.33 3.64 3.93 3.94 Oct. 3.86 4.02 4.07 4.19 4.20 .Nov. 3.00 3.40 3.60 3.92 3.93 Nov. 3.91 4.04 4.04 4.15 4.17Dec. 3.01 3.37 3.56 3.86 3.92. Dec. 4.02 4.08 4.09 4.18 4.18
3.99 I 4.19
Sources: 1953.. 1961, Federal Reserve Board; 1962 to present, Treasury Department.

" .
Market Yields on U.S. Government Securities at Constant Maturity(Monthly averages of daily data, in per cent per annum)
1957 1959Jan. 3.37 3.43 3.46 3.47 3.47 3.46 3.41 Jan. 3.36 3.71 3.91 4.01 4.04 4.02 3.95Feb. 3.38 3.42 3.42 3.39 3.37 3.34 3.30 Feb. 3.54 3.80 3.92 3.96 3.96 3.96 3.96Mar. 3.42 3.46 3.47 3.46 3.44, 3.41 3.32 Mar. 3.61 3.87 3.97 3.,99 3.99 3.99 3.99Apr. 3.49 3.53 3.53 3.53 3051 3.48 3040 Apr. 3.72 3.93 4.03 4.12 4.13 4.12 4.06May 3.48 3.57 3.61 3.64 3.64 3.60 3.49 May 3.96 4.15 4.25 4.35 4.36 4.3"1 4.13Jun. 3.65 3.76 3.80 3.83 3.83 3.80 3.65 Jun. 4.07 4.42 4~. 52 '4.50 4.45 4.34 4.14Jul. 3.81 ' 3.91 3.96 4.00 3.98 3.93 3.72 Jul. 4.39 4.56 4.60 4.58 4.51 4.40 4.16Aug. 4.01 4.02 4.02 4.00 3.97 3.93 3.75 Aug. 4.42 4.58 4.60 4.57 4.53 4.43 4.15Sept 4.07 4~06 4.06 4.03 3.99 3.92 3.73 Sept 5.00 5.00 4.97 4.90 4.82 4.68 ' 4.29 IOct. 4.01 4.07 4.09 4.08 4.04 3.97 3.76 Oct. 4.80 4.80 4.78 ' 4.72 '4.64 4.53 4.19 ~
NNov. 3.57 3.65 3.70 3.72 3.72 3.72 3.61 Nov. 4.81 4.88 4.85 4.75 4.65 4.53 4.~0 I
Dec. 3.18 3.14 3.11 3.08 3.12 3.21 3.38 Dec. 5.14 5.15 5.12 5.01 4.88 4.69 ~3.54 4.13
1958 1960Jan. 2.65 2.72 2.78 2.88 2.97 3.09 3.27 Jan. 5.03 5.02 4.99 4.92 4.84 4.72 4.42Feb. 1.99 2.39 2.58 2.78 2.90 3.05 3.31 Feb. 4.,66 4.72 4.73 4.69 4.61 4.49 4.28Mar. 1.84 2.19 2.40 2.64 2.80 2.98 3.29 Mar. 4.02 4.22 4.29 4.31 4.30 4.25 4.14Apr. 1.45 1.83 2.15 2,,46 2.66 2.88 3.17 Apr. 4.04 4.21 4.27 4.29 4.29 4.28 4.23May 1.37 1.78 2.07 2.41 2.65 2.92 3.17 May 4.21 4.39 4046 4.49 4.44 4.35 4.20Jun. 1.23 1.70 2.08· 2.46 2.69 2.97 3.23 Jun. 3.36 3.84 4.01 4 .. 12 4.15 4.15 4.04Jul. 1.61 2.04 2.42 2.77 2.96 3.20 3.39 Jul. 3.20 3.46 3.63 3.79 3.86 3.90
13
•91
Aug. 2.50 2.84 3.06 3.29 3.42 3.54 3.65 Aug. 2.95 3.22 3.41 3.62 3.72 3.80 3.84Sept 3.05 3.33 3.52 3.69 3.73 3.76 3.80 Sept 3.07 3.28 3.43 3.61 3.72 3.80
1 1•86Oct. 3.19 3.48 3.67 3.78 3.80 3.80 3.81 Oct. 3.04 3.32 3.53 3.76 3.84 3.89 3.92Nov. 3.10 3.41 3.60 3.70 3.72 3.74 3.76 Nov. 3.08 3.40 3.60 3.81 3.88 3.93 3.96Dec. 3.29 3'.56 3.72 3.82 3.85 3.86 3.86 Dec. 2.86 3.18 3'.42 3.67 3.76 3.84 :L..2L
1":48"
Sources: 1953..1961, Federal 'Reserve Board; 1962 to present, Treasury Department.
Market Yields on u.s. Government Securities at Constant Maburity(Monthly averages of daily data, in per cent per annum)

Appendix B. YIELD DIFFERENTIALS ON VARIOUS TYPES OF BONDS1960-1979
(Average of Monthly Values)GOVERNHENT BONDS UTILITY BONDS YIELD SPREADS
:ace. ...AAA
SHORT LONG -L.T. AA A BBB A BBB BBBYEAR TERN TERN AAA AA A BBB GOVT'S -AAA -AAA -AAA -AA -AA -::.A-
1960 3.85 3.99 4.51 4.54 4.66 4.82 .52 .03 .15 .31 .12 .28 .161961 3.51 3.90 4.47 4.52 4.61 4.70 .57 .05 .14 .23 .09 .18 .091962 3.32 3.95 4.29 4.37 4.42 4.53 .34 .08 .13 .24 .05 .16 .111963 3.56 4.02 4.29 4.32 4.37 4.45 .27 .03 .08 .16 .05 .13 .081964 3.84 4.17 4.41 4.44 4.50 4.60 .24 .03 . .09 .19 .06 .16 .101965 4.07 4.23 4.52 4.55 4.63 4.77 .29 .03 .11 .25 .08 .22 .141966 4.95 4.68 5.19 5.23 5.37 5.64 .51 .04 .18 .45 .14 .41 .271967 4.69 4.90 5.61 5.67 5.80 6.07 .71 .06 .19 .46 .13 .40 .271968 5.41 5.33 6.24 6.36 6.56 6.88 .91 .12 .32 .64 .20 ·.52 .321969 6.42 6.22 7.22 7.39 7.57 7.90 1.00 .17 .35 .68 .18 .51 .331970 7.19 6.75 8.11 8.35 8.70 9.12 1.36 .24 .59 1.01 .35 .77 .42 I1971 5.32 5.94 7.54 7.71 8.2/+ 8.62 1.60 .17 .70 1.08 .53 .91 .38 .....1972 5.83 5.67 7.41 7.53 7.80 8.05 1.74 .12 .39 .64 .27 .52 .25 ~
I1973 6.88 6.12 7.72 7.83 8.03 8.17 1.60 .11 .31 .45 .20 .34 .141974 7.75 6.59 8.45 8.63 8.75 9.08 1.86 .18 .30 .63 .12 .45 .331975 7.37 8.21 8.84 9.17 9.50 10.21 .63 .33 .66 1.37 .33 1.04 .711976 6.50 7.87 8.50 8.82 9.05 9.64 .63 .32 .55 1.14 .23 .82 .591977 6.21 7.69 8.14 8.44 8.60 8.86 .45 .30 .46 .72 .16 .42 .261978 8.24 8.46 8.83 9.06 9.20 9.48 .37 .23 .37 .65 .14 .42 .281979 9.89 9.27 9..,.64 9.97 10.17 lCh69 .37 .33 .53 1.05- .. 20 --~72 .52
AVERAGE 5.74 5.90 6.69 6.85 7.03 7.32 .80 .15 .33 .62 .18 .47 .29STANDARD DEVIATION .54 .11 .20 .36 .12- .26 .17
Source: Standard & Poor, Security Price Index, 1979.

BBB-AAA%
2.00
1.50
1.00 -
0.50
Figure B-1
RISK PREMIUMS ON TRIPLE B BONDS
Spread: Baa-Aaa
I.....U1I
196q 1962 1964 1966 1968 1970 1972 1974 1976 1978 1980


![Dynamic Stall on Airfoils Exposed to Constant Pitch-Rate ... Pap… · investigating pitch rate, Reynolds number, airfoil geometry and Mach number [4, 6] all seek to identify key](https://static.fdocuments.in/doc/165x107/5f4d418c5881a577222dc2c1/dynamic-stall-on-airfoils-exposed-to-constant-pitch-rate-pap-investigating.jpg)