The rise of renewables and energy transition · between renewable investment and hydrocarbon...
25
May 2018 OIES PAPER: MEP 19 The rise of renewables and energy transition: what adaptation strategy for oil companies and oil-exporting countries? Bassam Fattouh, Director, OIES, Rahmatallah Poudineh, Lead Senior Research Fellow OIES & Rob West, Partner Oil & Energy Research, Redburn & Research Associate, OIES
Transcript of The rise of renewables and energy transition · between renewable investment and hydrocarbon...
May 2018
OIES PAPER: MEP 19
The rise of renewables and energy transition:
what adaptation strategy for oil companies and oil-exporting countries?
Bassam Fattouh, Director, OIES,
Rahmatallah Poudineh, Lead Senior Research Fellow OIES &
Rob West, Partner Oil & Energy Research, Redburn & Research Associate, OIES
i
The contents of this paper are the authors’ sole responsibility. They do not necessarily represent the
views of the Oxford Institute for Energy Studies or any of its members.
Copyright © 2018
Oxford Institute for Energy Studies
(Registered Charity, No. 286084)
This publication may be reproduced in part for educational or non-profit purposes without special
permission from the copyright holder, provided acknowledgment of the source is made. No use of this
publication may be made for resale or for any other commercial purpose whatsoever without prior
permission in writing from the Oxford Institute for Energy Studies.
ISBN 978-1-78467-109-9
DOI: https://doi.org/10.26889/ 9781784671099
OIES is grateful to the Kuwait Foundation for the Advancement of Sciences for funding support.
ii
Contents
Contents ................................................................................................................................................. ii
Figures and Tables ............................................................................................................................... ii
Abstract .................................................................................................................................................. 3
1. Introduction ....................................................................................................................................... 4
2. Energy transition ............................................................................................................................... 5 2.1 Renewables have hit a critical inflection point .............................................................................. 5 2.2 Renewable efficiency: continuation of a long-term trend .............................................................. 6 2.3 New energy sources can unlock new energy demand ................................................................. 8 2.4 The speed of energy transition: slow or fast? ............................................................................. 10 2.5 Implications of speed of transition for disrupted fuels ................................................................. 14
3. Implications for the strategy of oil companies and oil-exporting countries: the role of
renewables ........................................................................................................................................... 15 3.1 Adaptation strategy for international oil companies and the role of renewables ........................ 16 3.2 Adaptation strategy for oil-exporting countries and the role of renewables ................................ 19
4. Conclusion ....................................................................................................................................... 21
References ........................................................................................................................................... 23
Figures and Tables
Figure 1: Global energy supplied by source (per cent) ........................................................................... 6 Figure 2: Conversion of primary energy supply into consumable energy ............................................... 8 Figure 4: Global energy supplied by source ......................................................................................... 11 Figure 5: Hirfendahl–Hirschman concentration index of global energy supplies .................................. 14 Figure 6: Estimated free cash flow profile of seven Statoil renewables projects .................................. 19 Table 1: Recent costs of usable kWh of energy by source ..................................................................... 7 Table 2: Very long-run outlook and adaptation strategies for oil and gas ............................................ 17 Table 3: Countries where solar projects can liberate gas volumes ...................................................... 18 Table 4: Table of assumptions for solar investment that also liberates marketing gas ........................ 20
3
Abstract
The energy landscape is changing rapidly with far-reaching implications for global energy industries
and actors, including oil companies and oil-exporting countries. These rapid changes introduce
uncertainty in multiple dimensions, the most important of which is the speed of transition. While the
transformation of energy systems is rapid in certain regions of the world, such as Europe, the speed
of global energy transition remains uncertain. It is also difficult to define the end game (which
technology will win and what the final energy mix will be), as the outcome of transition will vary across
regions. A key issue facing oil companies and oil-exporting countries is how they should now position
themselves and how best to be part of the renewables ‘revolution’. For oil companies, moving beyond
their core business is risky, but a ‘wait-and-see' strategy could be costly, therefore oil companies need
to gradually ‘extend’ their business model and rather than a complete shift from hydrocarbons to
renewables, they should aim to build an integrated portfolio which includes both hydrocarbon and low-
carbon assets. The strategies designed to make this happen need to be flexible and able to evolve
quickly in response to anticipated changes in the market. For oil-exporting countries, with subsidized
prices and rising domestic energy consumption, there is no conflict between investing in renewables
and in hydrocarbons as these countries can liberate oil and gas for export markets, improving the
economics of renewables projects. In the long run, however, the main challenge for many oil
exporting countries is economic diversification as it is the ultimate safeguard against the energy
transition. Whether or not these countries succeed in their goal of achieving a diversified economy
has implications for global energy markets and the speed of global energy transformations. In other
words, the global energy transition will not only shape political and economic outcomes in oil-
exporting countries, but the transformations in these major oil-exporting countries will, in turn, shape
the global energy transition - adding another layer of uncertainty to the already complex phenomenon
of energy transition.
Keywords: Energy transition, renewables, oil companies, oil exporting countries, business strategy,
peak oil demand

4
1. Introduction
The energy landscape is rapidly changing with wide-reaching implications for global energy industries
and actors, including oil companies and oil-exporting countries. While there are many uncertainties
induced by the energy transition, there is almost a consensus among forecasts provided by various
organizations that the share of renewables in the energy mix will rise (International Energy Agency,
2017; BP, 2018). In fact, renewable energy’s recent cost deflation has been nothing short of
revolutionary for the global energy industry. Five years ago, US wind costs were $11 c/kWh (US cents
per kilowatt hour) and solar costs were $17 c/kWh, on a fully loaded basis, including the capital costs
of construction. Neither was commercial without subsidies. The International Renewable Energy
Agency (IRENA) (2018) estimates that global average cost for onshore wind and solar has now
declined to $5 c/kWh and $6 c/kWh respectively. A new record was set in 2016, with a $2.4 c/kWh bid
in the UAE. It was broken in October 2017 with a $1.8 c/kWh bid by Masdar and EDF for Saudi
Arabia’s 300 MW Sakaka plant. Wind power costs have also declined, and further deflation to $4
c/kWh by 2020 is within striking distance. As a result, on a plant-level basis and excluding the cost of
dealing with intermittency, wind and solar have emerged as very competitive sources of energy
globally.
As the energy transition is expected to lead to structural changes in energy markets around the globe,
oil companies and oil-exporting countries face serious challenges. The challenge for oil companies is
the disruption of their business models and how to integrate low-carbon assets into their portfolios,
whereas oil-exporting countries with proved reserves-to-production ratios of multiple decades face the
challenge of monetizing their large reserve base and the risk of losses in export revenues, which
could disrupt their socio-economic wellbeing, given the high reliance of their budget on oil revenues.
Therefore, a key question is, how should oil companies and oil-exporting countries position
themselves in the transition era in order to be part of the renewables ‘revolution’ and ensure long-term
sustainability?
A successful adaptation strategy requires understanding the nature of energy transition. This is
because decisions on business model adaptation and investment strategy require knowing how fast
the transition will happen, which technologies will eventually prevail, and how the final energy mix will
look after the transition is completed. The oil companies are faced with a strategic dilemma here. If
they postpone their adaptation strategy until there is less uncertainty, they may create a window of
opportunity for their competitors. On the other hand, early investment decisions or investment in
‘losing’ technologies would not only limit their future options but also increase the risk of asset write-
offs. Oil-exporting countries face similar strategic dilemmas as the transition entails structural
transformations in their energy sector and the overall economy, and the allocation of scarce resources
towards new sectors, including renewables, which don’t generate the sizeable rents that the oil and
gas industry does.
This paper sheds some new light on the issue of energy transition and adaptation strategy for oil
companies and oil-exporting countries. We argue that while the energy transition is happening very
fast in some regions, such as the EU, the speed of the global energy transition is highly uncertain.
Historical evidence points to a slow energy transition, which is instructive but not necessarily
predictive. Furthermore, the current transition is being managed and coordinated through government
policy aimed at decarbonization and reducing air pollution, whereas past transitions happened mostly
naturally or accidentally without strong policy support. This means that the drivers of the current
transition are fundamentally different from the past transformations and this induces uncertainty about
how events could unfold.
Given the uncertainty in the speed of transition we argue that oil companies need to adopt a strategy
that is likely to be successful under a wide set of future market conditions. We acknowledge that
moving beyond core business is risky for oil companies but at the same time a ‘wait-and-watch'
strategy can be costly. Instead, oil companies need to gradually ‘extend’ their business model rather
than completely ‘shift’ from hydrocarbons to renewables. This business model extension implies
5
building an integrated portfolio, including both hydrocarbon and low-carbon technologies assets.
Given that the endgame (in terms of winning technologies) is unclear, oil companies should focus on
a combination of competing low-carbon technologies rather than investing in a specific technology.
With regards to oil-exporting countries, the adaptation strategy is different. There is no conflict
between renewable investment and hydrocarbon business in these countries. This is because these
countries can liberate oil and gas for export through investment in alternative technologies. This will
be more pronounced when considering that oil-exporting countries are at a stage of development in
which their economic growth is tied with energy consumption and thus domestic energy consumption
is expected to rise, reducing their export capacity. We show that at current oil and gas prices,
investment in solar is a viable option in the Middle East oil-exporting countries. The economics of
renewables in oil-exporting countries will be susceptible to oil price cycles; nonetheless, when the
gains from liberated hydrocarbon are taken into account, this investment rationale is reinforced. We
argue that although renewable investment can boost the short-term export revenue of oil-exporting
countries, it is not a long-term solution against the potential disruption in global oil demand growth. In
the long run, diversification of their economies is the main strategy that can shield these countries
from the effects of energy transition. During the transition, the oil sector will play a dominant role in the
economy of these countries but is expected to start declining if the objective of diversification is
achieved. Furthermore, the success or failure of oil-exporting countries in their goal of achieving a
diversified economy will also influence the speed of global energy transition (through its impact on oil
prices), adding more layers of complexity and uncertainty.
2. Energy transition
Energy transition is a radical shift in the energy system from an existing model to a new paradigm. It
is complex and goes beyond only the replacement of one source of fuel with another. In essence,
energy transition involves changes in three interrelated dimensions (Sovacool and Geels, 2016): (i)
the tangible elements of the energy system, which include technology, infrastructure, market,
production equipment, consumption patterns and distribution chains1; (ii) actors and their conduct,
which comprise new strategies and investment patterns, as well as changing coalitions and
capabilities of actors; and (iii) socio-technical regimes that contain formal regulations and policies,
institutions as well as mindset and belief systems, discourse and views about normality and social
practices. Therefore, transition is multidimensional, complex, non-linear, non-deterministic, and highly
uncertain. Although energy transition is often assessed based on the speed of changes in the tangible
dimension, it is a multilayered process with multiple actors.
As the transition outcome is the result of an interaction of technology, institutions, society and agents,
in practice, it is difficult to predict accurately the behaviour of such a process. Relying on historical
data is one way of dealing with these issues; however, as we emphasize later in this section, such
analysis has its own limitations. In this section, we highlight the key features of energy transition using
historical evidence, economic insights, and the literature on the social dimension of energy transition.
2.1 Renewables have hit a critical inflection point
Most technologies exhibit an S-shaped performance curve over their lifetime. This curve implies that,
at the beginning, the performance of new technologies improves and penetrates the market very
slowly but it accelerates at some point thereafter, and finally diminishes when technology becomes
mature. This performance acceleration is very important during the technology maturity cycle,
because it is the critical inflection point after which the speed of penetration of technology will grow at
a much faster rate than before. There is evidence suggesting that wind and solar have already
reached the inflection point.
1 As its name suggests, the most observable element of the energy transition is the tangible aspect of energy system that
embraces the energy supply chain from upstream extractive industries and systems of national conversion and supply, to end-
user technologies (prime movers) and delivery infrastructure.
6
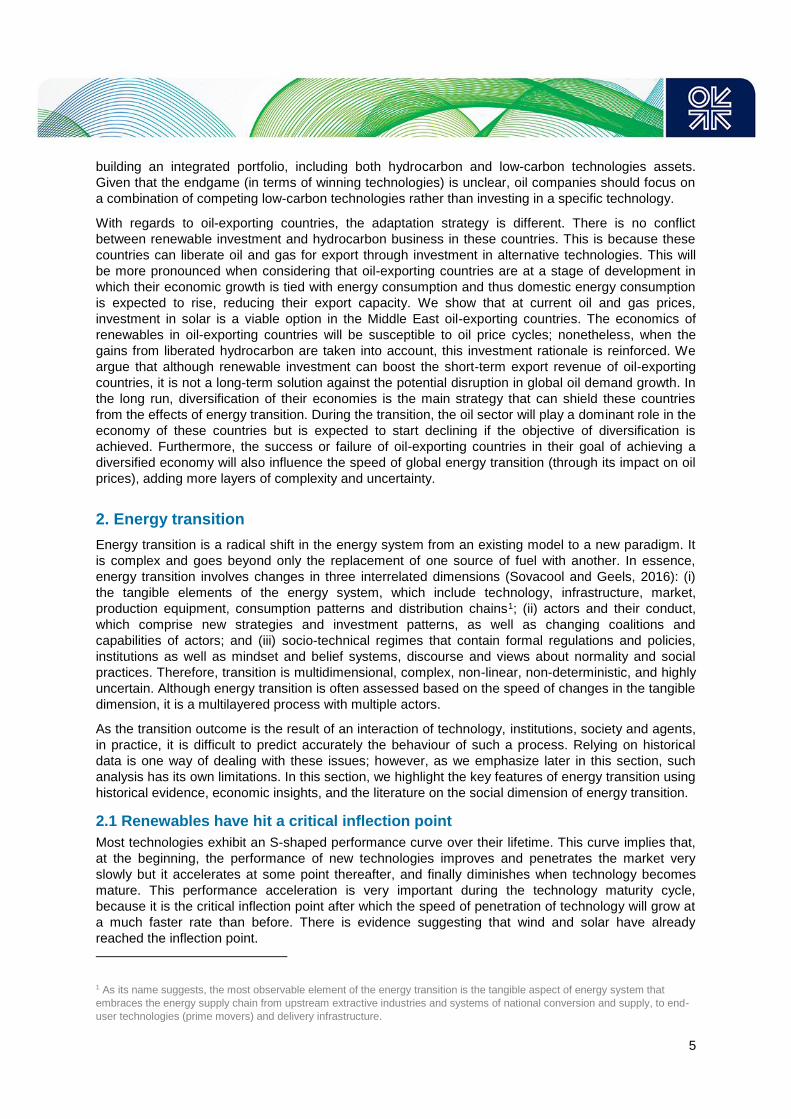
Wind powered around 2.5 per cent of total global energy needs in 2016 and solar powered 1 per cent,
on an end-demand basis (deducting the efficiency losses from combustion of fossil fuels). But our
conclusion from studying the 250-year history of the energy markets is that wind and solar are
inflecting in a way that resembles coal in the 19th century and oil in the 20th century, and are
therefore likely to be equally transformational over the 21st century. In 2011–16, we estimate that final
consumption of global energy rose by 810 TWh pa (terawatt hours per annum). Solar met 54 TWh pa
of the new demand (7 per cent) and wind met 105 TWh pa (13 per cent). This gave wind and solar a
20-per-cent share of the new growth in demand, up from zero prior to 2000. Figure 1 shows the
longer-term history of different energy sources competing to supply new demand for energy. Coal
supplied 15 per cent of new demand in 1800–30, before inflecting to 50 per cent of new demand in
1830–60 and 70 per cent of new demand in 1860–80. Oil supplied 9 per cent of new demand in
1900–20, accelerating to 17 per cent in 1920–40, and 29 per cent in 1940–80. At the same time, gas
supplied 12 per cent of new demand in 1920–40, before accelerating to 30 per cent in 1940–2000.
Figure 1: Global energy supplied by source (per cent)
Sources: BP (2017); Carbon Dioxide Information Analysis Center; Smil (2016a, 2017); authors’ estimates.
Recently, BP Energy Outlook: 2018 edition further emphasized the growing shift to renewables,
noting that ‘the pace at which renewables gain share in power generation over the Outlook is faster
than any other energy source over a similar period’. Solar power projections were increased 150 per
cent from 2015 estimates, due to panel cost deflation, which is expected to continue at 2 per cent pa
to 2040. Hence, BP sees renewables as the fastest-growing fuel source, increasing five times,
capturing around 40 per cent of new demand growth (for comparison with the data in Figure 1).
Renewables would therefore be reaching 14 per cent of primary energy supplied in 2040. The
trajectory of wind and solar could also be significantly higher than BP’s estimates, especially if an
analogy is drawn to the growth of coal in the late 19th century and oil in the 20th century. Conversely,
these renewable energies must overcome intermittency and limitations in power grids to realise their
full potential.
2.2 Renewable efficiency: continuation of a long-term trend
Penetration of renewables is not just the matter of replacement of hydrocarbons with a zero-carbon
source: it also represents a material step change in efficiency. This change in efficiency has some
fundamental effects on the dynamics of the energy industry. From an output perspective, and given
the abundance of sunshine and wind, when a solar panel or wind turbine generates a TWh of energy,
-60%
-40%
-20%
0%
20%
40%
60%
80%
100%
1750
-1800
1800
-1830
1830
-18
60
1860
-1880
1880
-1900
1900
-19
20
1920
-1940
1940
-1960
1960
-1980
1980
-20
00
2000
-2008
2008
-2011
2011
-2013
2014
-15
2016
2016
-20
Per
cent o
f annual
dem
and g
row
th (%
)
Coal Oil Gas Solar Wind Nuclear Hydro Biomass Animal

7
it is generated in the form of usable electricity, which is immediately available to consumers.
Conversely, burn coal in power generation and only around 40 per cent of the energy content in the
material can be captured as electricity. Gas is only mildly better at around 50 per cent in a combined
cycle gas turbine. And, in the internal combustion engine, less than 20 per cent of the energy in
gasoline is harnessed as mechanical energy. Therefore, when considered from the perspective of end
demand, one of the most valuable disruptive effects of renewables is that each TWh of generated
energy can displace 2.5 TWh of coal supplies or more than 5 TWh of gasoline supplies. Greater
efficiency is one of the reasons Table 1 shows renewables costs to be highly competitive.
But the long-run history helps to contextualize the step change in efficiency arising from renewables:
the primary efficiency of the global energy system has been steadily increasing since the early
industrial revolution (Figure 2). Renewables should be seen as a continuation of the same trend.
Other energy sources must continue adapting to improve their own efficiency.
Table 1: Recent costs of usable kWh of energy by source
Source: Authors’ estimates. Notes: bbl = barrel; gal = gallon; mcf = thousand cubic feet.
In the past 250 years, global energy efficiency has accelerated at 0.1 pp (percentage points) pa
(Figure 2). Particularly since the oil shock of 1980, energy efficiency has accelerated at 0.3 pp pa.
Electrification has long contributed to efficiency gains, rising from 10 per cent of global energy
consumption in 1945, to one-third in 1980 and one-half today. In 1900, electric generators achieved
just 5–10 per cent thermal efficiency. This rose to around 5 pp per decade until 1960. The best
combined cycle gas turbines today are around 60 per cent efficient. Even greater efficiency gains are
visible when concentrating on specific industries. In heating, pre-industrial open fires captured around
5–10 per cent of energy at best, while the best gas furnaces achieve 97 per cent thermal efficiency
today. In materials, the most common metal produced on earth is steel, made from iron, whose
manufacture consumes 7 per cent of the world’s primary energy. Energy needed to smelt a ton of iron
fell from 76 MWh (Megawatt hours) in 1750 to 15 MWh in 1900, 8 MWh in 1950 and around 4 MWh by
2010. Large blast furnaces today require 90 per cent less energy per ton of finished metal than the pig
iron furnaces of pre-industrial times (Lüngen, 2013).
Vehicle efficiency has arguably lagged these other examples. Sources quote the fuel economy of the
Ford Model T and other pre-war vehicles at 14–21 mpg. New passenger cars’ fuel economy flatlined
at 23 mpg in the 1980s, 1990s, and early 2000s, according to the US Environmental Protection
Agency (EPA). In the past decades, improvements accelerated again, to 2.5 per cent pa; around 5
per cent annual improvements are decreed by Obama-era CAFE (Corporate Average Fuel Economy)
standards (EPA, 2018).
4 | FEBRUARY 2018
• Wind power has also def ated, to c5c/kWh on average today, we estimate. Further
def ation to 4c/kWh by 2020 is within striking distance.
As a result, wind and solar have emerged among the most competitive new sources
of energy globally. T eir average construction costs are c65% below the retail power
price in the US and c80% below the UK (Fig 1).
For comparison, we calculate that simply fuelling existing gas plants in Europe and
Asia costs 4.6c/kWh, which rises to 10c/kWh when new capital costs are added to
construct gas import facilities and gas-f red power plants.
Another disruption is that the oil markets have been transformed by the
emergence of shale oil. Last year, we estimate that US tight oil had a full-cycle
marginal cost of c$50/bbl. T is is still only good enough to yield 6.5c/kWh if burned
at 45% ef ciency in power generation; while gasoline cars are much less ef cient,
yielding a total cost of 44c per usable kWh in the US.
T e low relative costs of renewables are now staggering. Critical questions are
raised for investors: can incumbents in the fossil fuel industry maintain their pricing
power and market shares? For oil and gas companies, the temptation is also growing
to invest in the renewable energy revolution.
But this is not the f rst energy revolution in history. T e past 250 years of data can
help to navigate a course. Af er reviewing over 1,000 pages of energy history1 , we
reach f ve conclusions.
(1) Prior energy disruptions unfold over decades not years
Fig 2 (overleaf) illustrates the total energy supplied globally back to 1750.
Competition in the energy industry is nothing new. But it takes place over very
long timeframes.
Source: Redburn estimates
Energy Source Cost Average price ($)
Energy
(kwh/unit) Efficiency
Effective
energy cost
(c/kWh)
UK on-highway gasoline Variable 6.5 /gal 33 18% 107
US on-highway gasoline Variable 2.6 /gal 33 18% 44
UK retail electricity Variable 23
US wholesale gasoline Variable 1.8 /gal 33 45% 12
US retail electricity Variable 10
Oil Variable 50.0 /bbl 1,700 45% 6.5
Wind Full 5.0
Asian gas Variable 7.0 /mcf 301 50% 4.6
European gas Variable 7.0 /mcf 301 50% 4.6
Solar Full 3.6
Coal Variable 80.0 /ton 5,815 40% 3.4
US gas Variable 3.0 /mcf 301 50% 2.0
World's cheapest solar tariff Full 1.8
Fig 1
Recent costs
of usable
kWh of
energy by
source
Th
is c
op
y h
as b
een
gen
erat
ed f
or
Bas
sam
Fat
touh
of
Oxfo
rd I
nst
itu
te f
or
Ener
gy S
tudie
s.
This copy has been generated for Bassam Fattouh of Oxford Institute for Energy Studies.

8
Efficiency gains have a deflationary effect on cost of energy services. In 2000, a lumen of light in
Britain cost 0.01 per cent of what it did in 1500. The cost of heating, industrial power, and
transportation over land all fell 90–98 per cent since 1500 (Fouquet, 2008). Real electricity prices also
declined 97–98 per cent across the developed world in the 20th century (Kander, Malanima, and
Warde, 2013). This is the other main reason energy producers must consistently focus on efficiency
and cost control.
Figure 2: Conversion of primary energy supply into consumable energy
Source: Authors’ estimates.
Returning to the theme of demand, more efficient, cost-deflated energy will unlock new consumption
patterns. This effect is termed the ‘Jevons Paradox’, after the English economist who noted great
increases in coal consumption when steam engines became more efficient. ‘It is wholly a confusion of
ideas to suppose that the economical use of fuels is equivalent to a diminished consumption. The
very contrary is the truth. As a rule, new modes of economy will lead to an increase of consumption’,
Stanley Jevons wrote in 1865. Although the rebound effect can kick in with the rise in energy
efficiency, there is also the possibility of an asymmetric response, meaning that consumers reduce
their consumption when the cost of energy is high but do not necessarily increase their usage when
the costs of energy services decline. There is some empirical evidence on such asymmetric response
(Gately and Huntington, 2002).
2.3 New energy sources can unlock new energy demand
One of the key features of past energy transition has been its effect on demand. The historical data
show that revolutions on the supply side of market in previous energy transitions have had an impact
on the demand side. In other words, new energy sources unlocked new sources of energy demand,
meaning that when new energy sources enter the global mix, energy demand growth has tended to
accelerate.
British coal was initially used as a heating fuel, then in mines: first for pumping, then winding, and
then ventilation. Coal’s abundance, however, opened new forms of transportation. The first use was
steam ships, most famously, Robert Fulton’s Clermont on the Hudson River in 1807. When the
Stockton and Darlington Railway opened in 1825, freight was first carried by horses. It was only four
years later that Stephenson’s Rocket won the Rainhill Trials, held to determine the best design for
steam-powering the new Liverpool and Manchester Railway. For a full half-century after, global
energy demand accelerated 1 pp pa faster than global populations. Later, coal was the primary fuel
used for electricity generation, starting in 1882 when the Edison Illuminating Company began
supplying power to Pearl Street Station in Lower Manhattan. This prolonged coal’s 4 per cent pa
demand CAGR (compound annual growth rate) into the early 1900s.
In the 1860s, rock oil was originally used to displace whale oil in lighting. Abundant oil supplies,
however, allowed engineers to refine the gasoline and diesel engine in the 1880s and 1890s. Mass
production of the Ford Model T from 1908 increased the pace of global energy demand growth to a
0%
10%
20%
30%
40%
1751
1762
1773
1784
1795
1806
1817
1828
1839
1850
1861
1872
1883
1894
1905
1916
1927
1938
1949
1960
1971
1982
1993
2004
2015
Glo
bal
ene
rgy
effi
cien
cy
(ene
rgy
con
sum
ed
/ ene
rgy
supp
lied
)
9
new record of 3 per cent pa prior to the First World War; and 4 per cent pa in the post-war boom from
1945 to the first oil shock in 1973.
Therefore, given the possibility of induced effects of supply side revolutions on demand side, an
important question is whether the renewable energy revolution will compete for market share in a
fixed global energy market? If historical trends are repeated, it is possible that new sources of energy
will unlock new demand that is not currently easy to envisage (currently demand is almost stagnant in
most of developed world). As one example, Bitcoin mining is estimated to consume around 42 TWh of
energy this year (2018), about the same as the entirety of New Zealand (BP, 2017).
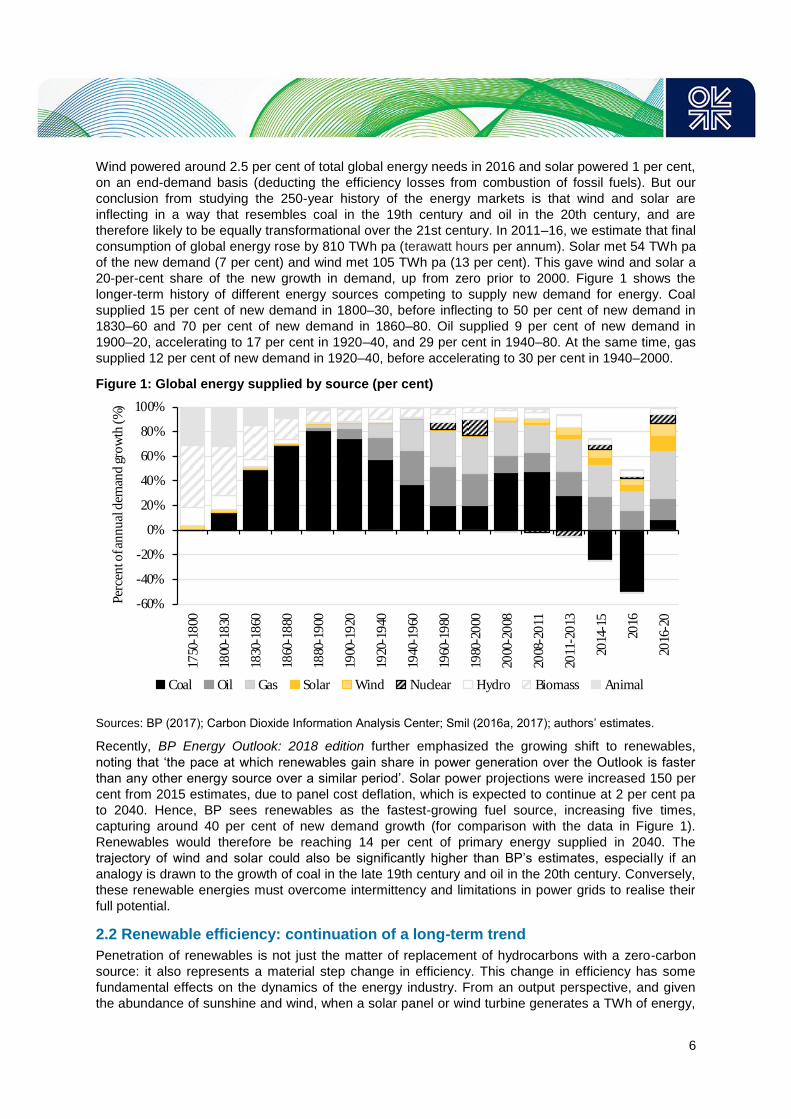
Speeding up travel by ten times, while saving time, requires a thousand times more power to
overcome air resistance. Indeed, history shows the world has unlocked exponentially more powerful
machinery over the past 300 years as energy supplies have become more abundant (Figure 3).
Following the thread of commonly available transportation options, a horse-pulled wagon in 1890
achieved 1 kW (kilowatts) of output; the 1910s Ford Model T achieved 15 kW at full speed; a 1985
Honda Civic outputs 65 kW; and, the most popular vehicle sold in the US last year, the Ford F-150,
can output 200 kW. Likewise, in industry, a donkey treading a Roman hourglass mill could output 300
W (watts) in 100BCE; an eight-man Dutch treadwheel output 800 W in around 1500; Newcomen’s
steam engine output 3.75 kW in 1712; Edison’s Pearl Street station reached 92 kW in 1882; industrial
compressors achieved 10 MW (megawatts) in 1970; and, today, the world’s largest nuclear plant can
output 8.2 GW (gigawatts). Lastly, in the sphere of mass transportation, a 170-man Greek Trireme
could output 20 kW in 500BCE, scaling up to 30 MW at a Japanese container ship in 1960, and 60
MW for a Boeing 747 in 1970 (Smil, 2017).
New energy sources also unlocked social and industrial changes. A wealth of recent research
suggests 50-year pulsations in human waves of innovation, triggered by new primary energies
(Bernard et al, 2013). An age of decentralized renewable power growth might be expected to lessen
the importance of large cities, and promote more dispersed settlements, linked into the economic
system by greater digital connectivity and more rapid travel. If so, this trend would have very long-
term implications for almost all sectors and industries, from retail footfall to land value.
An important caveat for extrapolating from the past here, however, is that the constraint of the current
energy transition is greenhouse gas emissions and not energy consumption. In other words, even if
new sources of energy unlock new demand, there is no guarantee that it will benefit hydrocarbon
resources if such new demand for fossil fuel resources is energy based and the problem of emissions
remains unresolved. Future energy demand growth will be constrained by carbon emissions; thus, it is
unlikely that the new demand would lead to the same inter-fuel competition as seen in the historical
transitions.
Figure 3: Power consumption rating of typical industrial, wind, and transportation exemplars
Source: Smil (2017).
1.E-02
1.E-01
1.E+00
1.E+01
1.E+02
1.E+03
1.E+04
1.E+05
1.E+06
1.E+07
1700 1750 1800 1850 1900 1950 2000
Pow
er C
on
sum
pti
on
(kW
, lo
g a
xis
)
Year (AD)
Industry & Power Wind Transport "Mass Transport"

10
2.4 The speed of energy transition: slow or fast?
It is not an overstatement to say that the speed of energy transition is the most critical parameter of
transition, which has serious implications for the business strategy of actors in the energy sector.
Nonetheless, predicting the speed of transition with certainty, based on available information, is
almost impossible mainly because of the complexity of transformation and presence of multiple layers
and actors in this process. In this section we review the arguments and empirical evidence on the
speed of transition and evaluate their robustness and predictive power.
The view of slow transition
The mainstream view is that energy transition is a slow process (Sovacool, 2016). This camp provides
various arguments to back up this position. We summarize the main reasons in favour of slow
transition as follows (Smil, 2016a,b, 2017; Fouquet, 2016; Sovacool, 2016; Sovacool and Geels,
2016):
Historical data and evidence indicate that past energy transitions have been slow.
The scale and complexity of energy transformation is such that it tends to create lock in and path dependency.
The transition of the energy sector relies heavily on the availability of infrastructure, which often takes time and is very costly to build.
New energy sources gradually improve their performance and competiveness (through learning curves and economies of scale). This will result in the slow replacement of incumbents in energy markets.
Innovation diffusion is a lengthy process. It takes time for an innovation or new system to move from a niche to a mass market.
There is a huge sunk cost involved in existing infrastructures of the current energy system, which creates inertia and provides an economic incentive to utilize them until they are written off. For example, for large power plants, capital costs, which are so large, play a key role in the decommissioning of plants. Generators’ owners tend to keep existing assets running for as long as it is economically and technically feasible.
As transition causes disruption, incumbents and declining industries will fight back and this delays the transformation process.
Fast transitions rarely happen and, when they do, they are anomalies that are related to small countries or specific contexts with little scope for replicability elsewhere.
The key empirical evidence for a slow transition is past inter-fuel competition, which led to the
substitution of coal for pre-industrial biomass and muscle power, and oil for coal (see Figure 4). In the
18th century, energy was supplied primarily by biomass and muscle power. Coal’s market share rose
from 5 per cent to 60 per cent between 1830 and 1914, peaking in the year that the First World War
broke out. Oil rose from 1 per cent to 40 per cent between 1900 and 1973, peaking in the year of the
first OPEC oil shock. Gas rose from 4 per cent in 1945 to 24 per cent today, while nuclear rose from
zero per cent in 1954 to 2 per cent in 2000.

11
Figure 4: Global energy supplied by source
Sources: BP (2017); Carbon Dioxide Information Analysis Center; Smil (2016a, 2017); authors’ estimates.
The first known use of coal for heating was in China in 100BCE. Coal mining expanded in the UK in
the 1640s. The Newcomen steam engine was developed in 1712, transforming the ability to harvest
coal’s mechanical energy. James Watt’s improved design was developed in the 1760s. But even by
1800, with industrialization in full swing, there were only 2,000 steam engines working in Britain. For
comparison, there were 6,000 water mills registered in Britain’s 1086 Domesday Book survey. In the
past transition, coal power changed the world, but over centuries.
Oil’s share of global energy supply was only 13 per cent in 1945 at the end of the Second World War,
doubling to 27 per cent by 1960 and 37 per cent by 1970. The acceleration coincided with the wave of
US highway construction starting in 1956 – almost a century after Edwin Drake struck oil in
Pennsylvania in 1859, let alone 16th-century descriptions of 35-metre oil wells being dug on the
Absheron Peninsula, near modern-day Baku, Azerbaijan. Ford started mass-producing Model Ts in
1908. Rudolf Diesel invented his eponymous engine in 1892 (but had sold only 300 units by 1901).
Karl Benz built the first practical car in 1885. So, oil also emerged over decades.
The same is true in aviation. Louis Blériot made the first English Channel flight crossing in 1909. It
was not until 1957 that airlines carried more people across the Atlantic than ships. Going back even
further, Roman water mills were used in the 1st century BCE, but did not become widespread for
another 500 years. The first large alternating-current hydro station was build at Niagara in 1895 (37
MW). Despite the steady completion of ever-larger mega-projects – most notably China’s 22.5 GW
Three Gorges Project, in 2012 – water turbines peaked at around 16 per cent of the world’s electricity
and around 2 per cent of total primary energy supply. Hydro did not continue expanding indefinitely to
the point of dominating global energy markets. This was mainly because of water resource and
environmental constraints and competing use of water for agriculture. This is probably less of an issue
for wind and solar except that wind and solar farms may face public opposition when they are in the
vicinity of local residences.
The past diffusion of technologies was slow even for smaller appliances, for which widespread
adoption can take generations. The first home refrigerators were marketed in 1914, but became
common in the US only in the 1940s, and in Europe only in the 1960s (comprising 10 per cent of
domestic electricity use today). Similarly, air conditioning units were patented in 1902, but only scaled
down for household use in the 1950s; while in the French census of 1954, only 10 per cent of
households had a bathroom and central heating, rising to just 60 per cent by the mid-1970s (Prost,
1991).
0
20,000
40,000
60,000
80,000
100,000
120,000
140,000
160,000
0%
10%
20%
30%
40%
50%
60%
70%
80%
90%
100%
1751
1761
1771
1781
1791
1801
1811
1821
1831
1841
1851
1861
1871
1881
1891
1901
1911
1921
1931
1941
1951
1961
1971
1981
1991
2001
2011
Glo
bal
Ener
gy S
upp
lied
(T
WH
)
Per
cen
t of G
lob
al E
ner
gy S
up
pli
ed (
%)
Biomass Animal Hydro Wind Coal
Oil Gas Nuclear Solar Global Energy

12
The above examples demonstrate two key features of the previous energy transitions: (a) past
transitions were mainly driven by market forces, technological advances and innovation; and (b) the
adoption of major energy sources occurred slowly over decades, not years.
The view of fast transition
On the other side of this debate are proponents of fast transition. The main arguments in favour of a
fast transition can be summarized as follows (Fouquet, 2016; Sovacool, 2016; Sovacool and Geels,
2016):
Comparison with the past is a biased view because the drivers of the current transition differ fundamentally from the drivers of past transitions.
A key feature of historical transitions is that they were more opportunity-driven, whereas low-carbon transitions are more problem-driven, which involves a collective public good (climate change). Therefore, policy plays an important role in the current transition.
Historical transitions were more about variation (in energy mix) whereas the current transition is also about adjusting to the selection environment.
A key feature of the current energy transition is that it is managed or incentivized (or planned and coordinated) whereas past transitions were more naturally occurring (or even accidental or circumstantial) as a result of changes in technology, price, demand, or consumer preferences.
In a managed transition, political will and a sense of urgency in society to mitigate the adverse impacts of climate change, may lead to policies that change markets and selection environments in a rapid manner or even phase out technologies before they are written off.
Historical evidence does not unanimously point to slow transitions. There are also examples in history of fast national-scale transitions as well as fast transitions in end-use technologies.
In essence, the energy transition is a multilayer and multi-actor phenomenon. In such a situation, changes that are seemingly slow within one isolated layer (for example, national energy conversion and supply) can multiply when one takes a more holistic and systematic perspective.
The current transition is not just influenced by changes in the energy sector. It draws on synergistic advances in multiple domains at once, such as 3D printing, blockchain, computing, nanotechnology, materials science, and biological and genetic engineering. Therefore, it can be accelerated in ways that have not been possible in past transitions.
As human knowledge is a cumulative process, we can benefit from what we have learned from past transformations in order to expedite future transitions. In addition, the rates of learning and innovation in various sectors can produce technologies that previous energy systems could not, with technological characteristics that predispose them to accumulated breakthroughs that were hitherto unseen.
There is also some historical evidence that supports the argument in favour of fast transition. In terms
of end-use technologies, Sovacool (2016) refers to lighting in Sweden, cook stoves in China, liquefied
petroleum gas (LPG) stoves in Indonesia, and ethanol vehicles in Brazil as examples of where end-
use technologies diffused at a remarkable rate.
Sweden completed the shift to efficient lighting in almost nine years (between 1991 and 2000). The
National Improved Stove Program in China facilitated the penetration of improved stoves from less
than one 1 per cent of the Chinese market in 1982 to more than 80 per cent by 1998, reaching half a
billion people. Indonesia completed the programme of conversion from kerosene stoves to LPG
stoves to improve air quality in just three years (from 2007 to 2009). Within this period, the number of
LPG stoves across the nation increased from 3 million to 43.3 million, which served almost two-thirds
of Indonesia’s 65 million households (or about 216 million people). Brazil created its Proálcool
programme in November 1975 to increase ethanol production and substitute petroleum with ethanol
in conventional vehicles; and, in 1981, only six years later, 90 per cent of all new vehicles sold in
Brazil could run on ethanol.
13
There are also examples of fast diffusion at a global scale. Indeed, cell phones are a technology that
did achieve rapid penetration at world level. In 1982, the world population was around 4.6 billion but
there was not a single mobile phone subscriber. In 2017, there were 7.6 billion people in the world
with more than five billion mobile phone subscriptions. The smartphone, which is a more recent
phenomenon, has already reached 2.4 billion users, as of 2017. Although a phone weighs ten-
thousand times less than a compact car, and so may not be a good basis for generalizations about
other industries such as transportation, it is an indicator of the combined effects of cost reduction and
consumer preference.
It is fair to say that the speed of penetration of end-use technologies such as the phone is different
from supply-side resources (such as the coal and gas supply chains), because end-use technologies’
penetration does not require a change in the entire energy system. Opponents of fast transition often
argue that large infrastructures cannot be substituted easily, specifically at the national level. There
are also examples, however, of national-scale fast transitions in energy supply that have resulted in
significant changes in the infrastructure within a relatively short period of time. These are, for
example, natural gas in the Netherlands, nuclear electricity in France, combined heat and power in
Denmark, and coal retirements in Ontario, Canada (Sovacool, 2016).
The Netherland’s discovery of the Groningen natural gas field in 1959 is an example of rapid
transformation of an energy economy. In that year coal was supplying around 55 per cent of Dutch
primary energy supply followed by crude oil at 43 per cent and natural gas at less than 2 per cent. In
December 1965, one year after gas deliveries began from Groningen, natural gas supplied 5 per cent
of the Netherland’s primary energy, which rose very fast to 50 per cent by 1971 (Sovacool, 2016).
The other example is the French nuclear generation fleet. Subsequent to the oil crisis in 1973, the
French government planned for a large nuclear power programme, with the aim to reduce its heavy
reliance on imported oil. France built 56 reactors from 1974 to1989. As a result, nuclear power rose
rapidly from 4 per cent of national electricity supply in 1970 to 10 per cent in 1978, and almost 40 per
cent by 1982 (Sovacool, 2016).
The Danish energy transformation is another interesting case, which involves two sets of changes:
from oil to coal as a fuel for electricity, and from individual to district heating in the heat sector. Prior to
1974, almost all heating in Denmark was provided by fuel oil, which made country very susceptible to
oil supply disruption. The government managed to achieve a remarkable transformation within five
years. Indeed, from 1976 to 1981 the Danish electricity system transformed from 90 per cent oil
based to 95 per cent coal based. Moreover, combined heat and power (CHP) production increased
from a negligible share in 1970 to supply 61 per cent of national electricity and 77 per cent of the
country’s district heating in 2010 (Sovacool, 2016).
The case of Ontario presents a complete shift from a particular resource. In 2003, the government of
Ontario decided to retire all coal-fired electricity generation by 2007, a goal that was accomplished
with a few years delay. As a result, coal generation in Ontario declined from 25 per cent of state
supply in 2003 to 15 per cent in 2008, 3 per cent in 2011, and 0 per cent in 2014 (Sovacool, 2016).
More recently, Britain is on track to become the first major economy to transition away from coal after
centuries of production and consumption. In the electricity sector, the consumption of coal fell to 12
million tonnes in 2016, levels not seen since 1935 (Wilson and Staffell, 2018). This change was
unprecedented; it took 14 years for power sector coal demand to increase from 12 to 28 million
tonnes pa (1936 to 1950), but only one year to make the reverse transition (2015 to 2016). Also, in
2016, the total consumption of coal in the UK (in all sectors) was around 18 million tonnes, a level not
seen over the past 150 years. The British case is good example of complexity of energy transition and
the role of policy in expediting the process.

14
Some key insights on the speed of transition
The review of evidence and arguments for the speed of transition reveals some interesting insights:
First, historical evidence regarding the speed of transition is inconclusive, with both cases of slow and fast transitions populating the history.
Second, historical data about slow transition are instructive but not necessarily predictive about future transition.
Third, the speed of transition differs across sectors and regions and has multiple layers that make it difficult to draw a concrete conclusion at the global scale.
Fourth, policy plays a key role in the current transition at least in the short to medium term before market fully takes over.
Fifth, today the challenge of gaining market share is amplified because the energy market is larger than ever before: 12 times on 1900 levels and 35 times on 1800.
Therefore, we argue that although transition can be fast in a specific sector or a specific country or
even a specific layer of industry, the speed of grand transition (at the global level) is uncertain (it can
be slow or fast). Furthermore, there is some degree of subjectivity when we talk about the time
dimension of transition because it is not clear what counts as fast and what counts as slow (for
example, is 30 years fast or slow?). The speed of energy transition is also susceptible to
governments’ change of priorities, election cycles, and political competitions.
2.5 Implications of speed of transition for disrupted fuels
Given the uncertainty in the speed of global energy transition we can envision two scenarios. The first
scenario is one in which the grand transition happens in a slow manner (given that past radical
changes in the global energy mix have tended to emerge over decades) and other energy sources
have time to adapt. Historically, there are very few examples of major energy sources disappearing
from the global energy mix, as seen in Figure 1. Indeed, we might think of the 19th century as the
‘great age of coal’ and the 20th century as the ‘great age of oil’. But the world consumed twice as
much wood than coal in the 19th century, and 15 per cent more coal than oil in the 20th century. In
other words, coal’s ascent did not mark the end of biomass, and oil’s ascent did not mark the end of
coal.
The ability of incumbent energy sources to adapt and to preserve market share is further illustrated by
the Hirfendahl–Hirschman Index (HHI) in Figure 5. In the past half-century, what is most remarkable is
how little has changed. The HHI is flat at 2,500. The largest change in the energy mix is natural gas
gaining 10 pp of share, at the expense of animal and biomass. But since the rise of oil and gas, no
individual energy source has been able to win a dominant market share – and no major energy
source has been fully eliminated. Energy sources constantly adapted to compete with one another.
Figure 5: Hirfendahl–Hirschman concentration index of global energy supplies
Source: BP (2017); Carbon Dioxide Information Analysis Center; Smil (2016a, 2017); authors’ estimates.
2,000
2,500
3,000
3,500
4,000
4,500
1751
1759
1767
1775
1783
1791
1799
1807
1815
1823
1831
1839
1847
1855
1863
1871
1879
1887
1895
1903
1911
1919
1927
1935
1943
1951
1959
1967
1975
1983
1991
1999
2007
2015
Her
fin
dah
l Hir
sch
man
In
dex
15
One must go back much further to find energy sources being displaced. Even in these instances, the
disruption took decades or centuries, and the displaced energy source retained a pricing premium
while being disrupted, rather than trading down to cost parity with its competitor. For instance, wood is
inferior to coal as a fuel. The latter is around 11 times more energy dense and thus easier to
transport. It also burns three times hotter, at 1,927 degrees Celsius, whereas wood burns at 600
degrees Celsius. Wood prices continued to trade at a premium for 500 years, before sufficient coal
could be produced and transported to meet latent demand. Even over the course of the 20th century,
the use of fuel wood and other biomass doubled to around 12,500 TWh, meeting around 12 per cent
of global energy supplies in 2015 (Smil, 2010).
The second scenario is one in which the grand energy transition happens faster than expected, and
perhaps in a revolutionary way, and therefore disrupts the business model of incumbents before they
can adapt. Such a revolutionary disruption is not without precedence. In the book Clean Disruption of
Energy and Transportation, technology advocate Tony Seba contrasts two views of New York’s 5th
Avenue, in 1900 and 1913. In the former, there is ‘one car’ in a sea of horses, and in the latter ‘one
horse’ in a sea of cars. New York’s transition from horse to car took just a dozen years. Seba argues
that technology’s S-curves are chronically underestimated by experts who should know better.
Furthermore, from an evolutionary perspective, historical transitions were more about developing
variations (technologies) in the age of scarcity, whereas low-carbon transitions are more about
adjusting the selection environments (Sovacool and Geels, 2016) in the age of abundance (via
policies, regulations, and incentives that shape markets) and this affects the balance of demand and
supply. Under energy scarcity in a world of increasing demand, it is possible to have a partial and
slow substitution of incumbents, where incumbents even retain a pricing premium and satisfy the
marginal demand in presence of a new source of energy, which is cheaper and has more calorific
content (the case of wood versus coal, for example). However, things can be completely different
when there is supply abundance and demand is not growing. It is possible that a new source of
energy completely displaces the incumbent. In such a world, the incumbents cannot retain a pricing
premium if it is going to have a market share.
3. Implications for the strategy of oil companies and oil-exporting countries: the role of renewables
Oil companies and oil-exporting countries cannot afford to ignore the transition of the energy sector,
which can disrupt their business model and erode their revenue base. For this, they need to
understand what aspects of energy transition affect their business activities. Among the multiple
dimensions of the energy transition, its speed is of paramount importance for the business strategy of
oil-sector actors because of its effect on the long-term demand for oil. Despite the speedy
transformation of the energy sector in some regions such the EU, the speed of transition at global
scale is uncertain and this further induces uncertainty in the long-term demand for petroleum
resources (for example, it is not clear when peak oil demand will occur; the various demand
projections are highly sensitive to underlying assumptions such as population growth, economic
growth, efficiency gains, and carbon tax, among other factors). On top of that, it is difficult to define
what the endgame is, which technology wins, and how the final mix of energy will look. It is quite likely
that the outcome of the transition will be different across regions. Faced with these high uncertainties,
the key question is: how can oil-exporting countries and oil companies adapt their business models to
the transition period?
Traditionally, investment in the oil and gas sectors (and perhaps investment in the entire energy
sector) has had three key features: (a) investment in hydrocarbon assets is mostly sunk and thus
irreversible; (b) there is some degree of uncertainty over the reward from investment and therefore
the best a decision maker could do is to assess probabilities of different outcomes that can lead to

16
higher or a lower profit from the investment; and (c) possibility of delay meaning that the decision
maker could wait until he or she obtains more information about the future. During the transition,
however, the situation is even more complex as wrong assumptions about uncertainties can lead to
misallocation of capital and write-offs. Worse, underinvestment in conventional energy could yield
shortages, underpinning shortages of light, heat, power, and mobility – the mainstays of modern
civilization. Conversely, a wait-and-watch strategy by postponing investment decisions can create a
window of opportunity for competitors. The other side of the coin is that too early investment also
limits future options and can lock the company into a suboptimized investment decision. Given the
range of uncertainties surrounding the transformation of the energy sector, oil companies and
exporting countries should consider multiple variables at once and form strategies that are resilient in
most possible outcomes.
3.1 Adaptation strategy for international oil companies and the role of renewables
Until this decade, the business strategy of oil and gas companies was straightforward: replace or
grow reserves, refine and sell products in an increasing market. As oil demand prospects have
become more uncertain and traditional energy sources face disruption, oil companies need a different
approach. The alternative approach, however, is not straightforward. First, there is no one-size-fits-all
solution. Oil companies have had a different path and risk attitude, different endowments, have
operated in different geographies, and have different types of expertise (some, for example, are more
experienced in offshore operation than others).
Second, the successful response of oil companies to energy transition is beyond the question of
integrating or not integrating renewables in their business model. The natural hedge of industry
against the decline in oil demand growth might be to increase the share of gas in their portfolios,
which still has room for growth, at the least in the medium term (in fact, of seven new projects being
brought onstream by BP in recent years, six involve gas rather than oil; others, such as Shell and
Total, are making a similar shift)2. The support for a functioning carbon tax by some oil companies can
also be seen in this light, because it benefits natural gas at the expense of coal. In the long run,
however, gas use in power generation will struggle to maintain market share – although gas might
retain a competitive role in high-value heating. In effect, oil companies need to evaluate which part of
their business model is at risk with energy transition and in what time frame. Successful adaptation
strategies in the past have included unlocking new sources of demand, improving efficiency, and
deflating costs. Some of these lessons are applied in Table 2.
2 Therefore, we do not pretend to offer a comprehensive strategy for oil companies in response to energy transition; instead, a
way of thinking about the issue.

17
Table 2: Very long-run outlook and adaptation strategies for oil and gas
Source: Compiled by the authors.
A relevant question is whether oil companies’ core business skills can be translated into the
renewables business. It is not so difficult to see why oil companies are reluctant to undertake such a
move. First, oil companies are used to invest in high-return upstream projects whereas return to
investment in renewables is modest. Oil companies compete on efficiency and economics whereas
renewables are a regulated industry. The higher return of upstream and familiarity with industry often
wins over the risk and modest return of renewable investment. Second, the success of the
renewables industry depends on the availability of subsidies, and oil companies are often reluctant to
develop a complete business strategy around subsidies for various reasons (for example,
dependability on policy support and unpopularity of subsidies for oil companies). What complicates
the issue is that oil companies’ past moves into the renewables industry have not been always
successful. BP invested $8.3 billion in wind and renewable assets in 2005–13. It failed to find a buyer
for its 1.6 GW of US wind capacity in 2013. The replacement cost at today’s wind prices is estimated
at around $2.3 billion.
Shell’s CEO, Ben van Beurden, has resisted being ‘rushed’ into renewables. During a press interview
in October 2017, he said, ‘We were among the first of the big international oil companies to get into
solar and we found out we could not make any money out of it’. In January 2018, BP’s CEO, Bob
Dudley, acknowledged the need for a different model from its prior renewables projects. He
mentioned:
On the solar point, you’ll recall back in the 2000s, the company made big bets [on
renewables] . . . In fact, around 2000, BP had the third largest solar company in the world
behind Sharp and Hitachi. Gosh, has the world changed. So, we manufactured it. We
started in the US. We moved to Spain, we moved to India, we moved to China. Solar cells
became commoditised. And panels. That’s not what we’re doing today. We learned that
lesson really well.
14 | FEBRUARY 2018
adaptation strategies in the past have included unlocking new sources of demand,
improving ef ciency and def ating costs.
We apply these lessons in Fig 10. We are optimistic on the ability to create new
demand for oil in materials and high-velocity transportation. Gas can also retain a
competitive role in high-value heating. However, oil and gas use in power generation
will struggle to maintain market share at current pricing.
T e conclusion for oil and gas pricing: volatile, with the f oor set by power parity
Over the coming decades, both oil and gas prices will be volatile around their
marginal costs, which we currently estimate at c$45/bbl for oil and c$6/mcf for LNG.
A f oor of $4-5/mcf gas prices and c$25-30/bbl oil prices is suggested during times of
oversupply: these are the pricing points at which oil and gas compete for demand in
the power sector.
How should Oil Majors invest in renewables?
Some Majors are beginning to talk vocally about the upcoming energy transition.
But investor perceptions vary widely. Some green energy advocates question why
Source: Redburn estimates
Outlook Rationale Preferred adaptation strategy
LNG for
power
Most negative Maintaining $7/mcf LNG equates to
4.6c/kWh at existing import facilities;
10c/kWh to grow market share
Deflation. $4-5/mcf long-run LNG is
required to compete effectively with
renewables
Oil for
power
Negative $50 oil equates to 6.5c/kWh when
burned in power generation (c10%
higher if burning diesel)
Lose market share. Defending
current c5Mbpd demand requires
c$30-40/bbl oil
Oil for
transportation
Mixed Low efficiency of internal
combustion engine makes oil
uncompetitive. But rate of
displacement is limited by pace of
electric vehicles (seen at 150-500m
by 2040, out of a vehicle parc
approaching 2 billion)
Create new demand in long-
distance, high-velocity, high-bulk
travel that is mechanically better
suited to oil's 10x higher energy
density than batteries (e.g., super-
sonic jets, flying cars)
Gas for
heating
Positive At $7/mcf gas, efficient gas boilers
can achieve 3-4c/kWh (at retail gas
prices), which is 3x better than
electrical heating
Vertical integration. Majors may
wish to go downstream in gas value
chains
Oil for
materials
Most positive Materials are not prone to
substitution by new energy, and are
themselves the disruptors (e.g.,
thermoplastic composite carbon
fibre is 10x lighter than similar-
strength steel)
Create new demand, in high-value
modern materials
Fig 10
Very long-run
outlook and
adaptation
strategies for
oil and gas
Thi
s co
py h
as b
een
gene
rate
d fo
r Bas
sam
Fat
touh
of O
xfor
d In
stitu
te fo
r Ene
rgy
Stud
ies.
This copy has been generated for Bassam Fattouh of Oxford Institute for Energy Studies.
18
Despite these drawbacks, oil companies should not see their options as a choice between either
renewable or hydrocarbon investment, but rather a choice between static efficiency (focusing on
maximizing the return from their current hydrocarbon assets) and dynamic efficiency (positioning in
the transition for long-term survival). We argue that neither a wait-and-watch strategy nor a hasty
move to renewables is a good way of positioning for energy transition, because both approaches are
risky from a business perspective. Instead we suggest gradual ‘business model extension’ as part of a
comprehensive adaptation strategy. The business model extension involves changes in the
investment, operation, research and development, and coalition decisions of oil companies with a
special view to future technologies. For a successful move, oil companies need to reassess their
existing portfolio across the entire value chain and consider opportunities in most competitive and
valuable assets, both from hydrocarbon and low-carbon resources. The operating model of these
companies also needs to become more compatible and agile given the continuing change in the
energy sector. The business model extension differs from the shifting strategy in that it balances the
short-term revenue maximization with long-term business disruption risk. For example, if, for any
reason, it turns out that the oil company has made incorrect assumptions about the speed of
transition, winning technologies, and future energy mix, it will only affect part of their business model.
Therefore, an oil company with an extended business model is unlikely to face a total business
disruption even under a worst-case scenario.
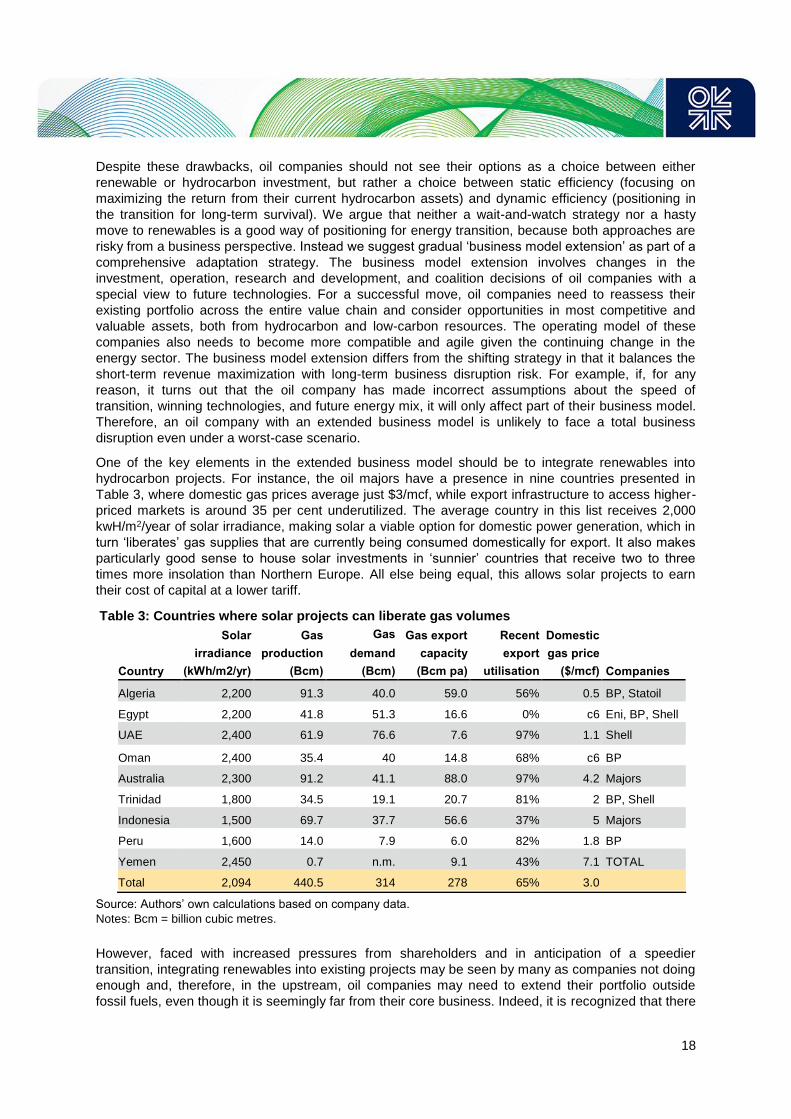
One of the key elements in the extended business model should be to integrate renewables into
hydrocarbon projects. For instance, the oil majors have a presence in nine countries presented in
Table 3, where domestic gas prices average just $3/mcf, while export infrastructure to access higher-
priced markets is around 35 per cent underutilized. The average country in this list receives 2,000
kwH/m2/year of solar irradiance, making solar a viable option for domestic power generation, which in
turn ‘liberates’ gas supplies that are currently being consumed domestically for export. It also makes
particularly good sense to house solar investments in ‘sunnier’ countries that receive two to three
times more insolation than Northern Europe. All else being equal, this allows solar projects to earn
their cost of capital at a lower tariff.
Table 3: Countries where solar projects can liberate gas volumes
Source: Authors’ own calculations based on company data.
Notes: Bcm = billion cubic metres.
However, faced with increased pressures from shareholders and in anticipation of a speedier
transition, integrating renewables into existing projects may be seen by many as companies not doing
enough and, therefore, in the upstream, oil companies may need to extend their portfolio outside
fossil fuels, even though it is seemingly far from their core business. Indeed, it is recognized that there
16 | FEBRUARY 2018
for Majors to fund renewable projects that genuinely do create value, integrate with
their conventional operations and benef t from their pre-existing skill sets.
We think renewables make most sense for Oil Majors in markets where additional
hydrocarbons can be ‘liberated’ for export. For instance, the Majors have a presence
in the ten countries in Fig 11, where domestic gas prices average just $3/mcf, while
export infrastructure to access higher priced markets is c35% under-utilised.
T e average country in this list receives 2,000 kwH/m2/year of solar irradiance,
making solar a viable option for domestic power generation, which in turn ‘liberates’
gas supplies that are currently being consumed domestically for export.
It also makes particularly good sense to house solar investments in ‘sunnier’
countries that receive 2-3x more insolation than Northern Europe (Fig 12).
Fig 11
Countries
where solar
projects can
liberate gas
volumes
Source: Redburn, companies
Country
Solar
irradiance
(kWh/m2/yr)
Gas
production
(Bcm)
Gas
demand
(Bcm)
Gas export
capacity
(Bcm pa)
Recent
export
utilisation
Domestic
gas price
($/mcf) Companies
Algeria 2,200 91.3 40.0 59.0 56% 0.5 BP, Statoil
Egypt 2,200 41.8 51.3 16.6 0% c6 Eni, BP, Shell
UAE 2,400 61.9 76.6 7.6 97% 1.1 Shell
Oman 2,400 35.4 40 14.8 68% c6 BP
Australia 2,300 91.2 41.1 88.0 97% 4.2 Majors
Trinidad 1,800 34.5 19.1 20.7 81% 2 BP, Shell
Indonesia 1,500 69.7 37.7 56.6 37% 5 Majors
Peru 1,600 14.0 7.9 6.0 82% 1.8 BP
Yemen 2,450 0.7 n.m. 9.1 43% 7.1 TOTAL
Total 2,094 440.5 314 278 65% 3.0
Source: SolarGIS
0
500
1000
1500
2000
2500
3000
UK
Germ
any
Fra
nce
Italy
Spain
India
Alg
eria
Aust
ralia
UA
E
Om
an
Chile
(peak)
Annual Insola
tion
(kW
h/m
2/y
ear)
Fig 12
Average annual
insolation in
select countries
(kWh/m2/year)
Th
is c
op
y h
as b
een
gen
erat
ed f
or
Bas
sam
Fat
tou
h o
f O
xfo
rd I
nst
itute
for
Ener
gy S
tudie
s.
This copy has been generated for Bassam Fattouh of Oxford Institute for Energy Studies.

19
is a risk involved in moving beyond the core business; however, it is often argued that this risk needs
to be weighed against the risk of eventual disruption of the business model.
In practice, the oil majors’ most recent solution has been to gain a foothold in renewables through
bolt-on acquisitions. For instance, in April, Total agreed to purchase Direct Energie for €1.9 billion in
cash, to gain access to a pre-existing pipeline of 550 MW of renewable capacity, plus a larger pipeline
of 2 GW. This follows BP’s $200 million acquisition of a 43-per-cent stake in LightSource in 2017,
alongside plans to quadruple its solar capacity to 8 GW. In December 2017, Shell agreed to acquire
the UK’s First Utility, also moving its business further downstream into the power sector – although
this bolt-on (likely to be around £200 million) was shy of a potential bid for Equis Energy, Asia’s
largest renewables firm, at 11 GW, which ultimately sold for $3.7 billion to GIP.
While underlying project economics appear sound, the risk of rapid renewables growth – organic or
via multiple bolt-on acquisitions – is that patience is required by shareholders. For instance, on
modelling Statoil’s seven largest renewables projects, we conclude that while the overall IRR (internal
rate of return) will exceed a passable 8 per cent hurdle rate, the overall portfolio will not turn free cash
positive until the late 2020s; while it will be in the early 2030s that return on capital employed hits 10
per cent in the continually growing renewables portfolio (see Figure 6).
Figure 6: Estimated free cash flow profile of seven Statoil renewables projects
Source: Authors’ own calculations based on company data.
3.2 Adaptation strategy for oil-exporting countries and the role of renewables
The countries that are dependent on oil and gas production for government revenue are also highly
vulnerable to changes in the energy landscape. There are two important differences between major
oil companies and oil-exporting countries in relation to energy transition. While the key issue for oil
companies is disruption of existing business models, the main challenge for oil-exporting countries, in
addition to loss of revenues, which is essential for the functioning of their economies, is the ability to
monetize their large reserve base. This is mainly because the proved reserved to production ratio of
international oil companies is typically around eight to ten years, whereas this number is several
decades, beyond all peak oil demand forecasts, for some of the resource rich countries (for example,
it is more than 63 years for Saudi Arabia with around 90 per cent dependence of government budget
on oil revenues). This makes the inability to monetize the reserve base a serious risk in these
countries.
The second important difference is that, for oil-exporting countries, there is no conflict between static
and dynamic efficiency when it comes to positioning for the energy transition. Indeed, investment in
renewables could help further boost their short-term revenues as it frees up their hydrocarbon
resources for export (as long as international prices are above the break-even price). Oil-exporting
countries have unique characteristics that make the rationale of investment in renewables for them
-600
-400
-200
0
200
400
600
2012 2014 2016 2018 2020 2022 2024 2026 2028 2030 2032 2034 2036 2038 2040 2042 2044 2046 2048 2050
Sta
toil R
en
ew
ab
les
Fre
e C
ash
Flo
w ($M
)
Sherringham Shoal Dudgeon Arkona Dogger Bank Empire Wind
Hywind Apodi SG&A Group FCF
20
quite compelling. These countries have rising energy demand and are at a stage of development
where economic growth is tied up with energy consumption. The rise in energy demand is expected to
strain the export capability of these countries. Indeed some of them, such as Kuwait and the UAE, are
already net importers of natural gas.
The economics of renewables in exporting countries depends on the opportunity cost of domestic oil
and gas consumption, which is reflected in international price of hydrocarbon resources. According to
the Energy Information Administration (EIA) (2016), generating 1 MWh of electricity requires 1.73
barrels of oil or 10.11 mcf of natural gas. The record low auction prices for solar photovoltaics (PV) in
Dubai, Mexico, Peru, Chile, Abu Dhabi, and Saudi Arabia have shown that, under the right
circumstances, an LCOE (levelized cost of electricity) of $0.03/kWh for solar is achievable (IRENA,
2018). IRENA (2018) also estimates the global average cost of solar PV to be around $0.06/kWh. If
the lower band is considered (which is closer to costs of solar at the region), the break-even prices of
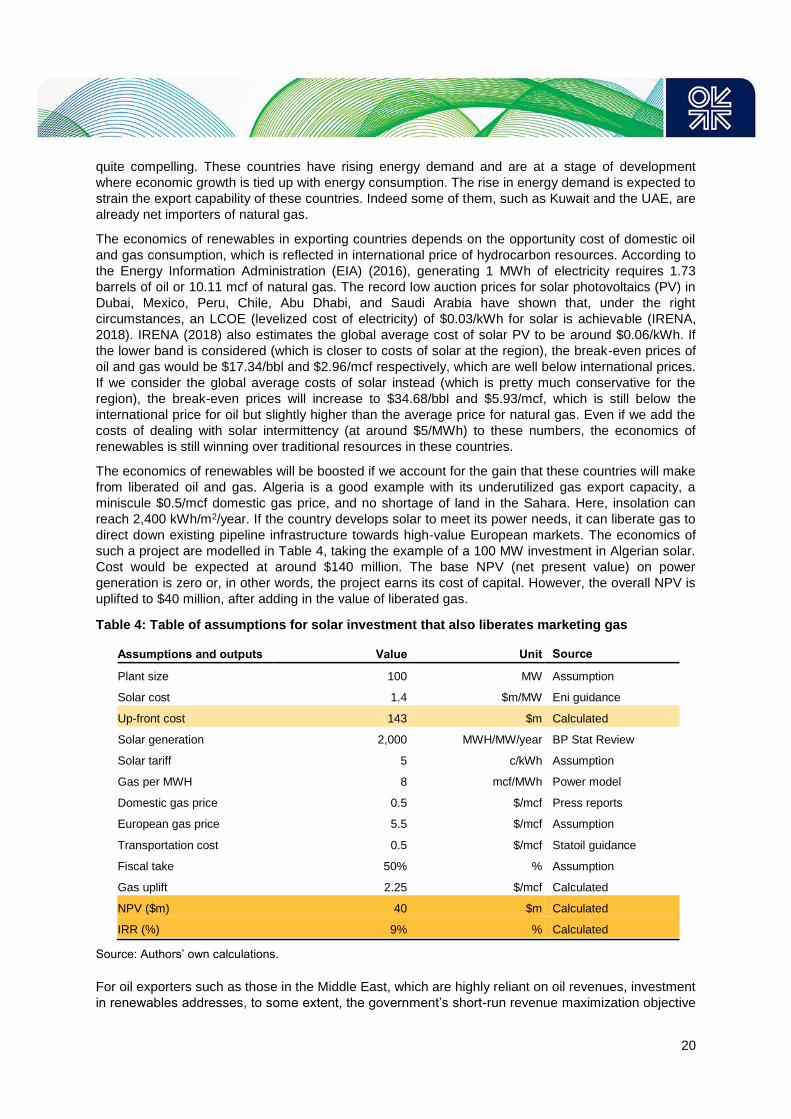
oil and gas would be $17.34/bbl and $2.96/mcf respectively, which are well below international prices.
If we consider the global average costs of solar instead (which is pretty much conservative for the
region), the break-even prices will increase to $34.68/bbl and $5.93/mcf, which is still below the
international price for oil but slightly higher than the average price for natural gas. Even if we add the
costs of dealing with solar intermittency (at around $5/MWh) to these numbers, the economics of
renewables is still winning over traditional resources in these countries.
The economics of renewables will be boosted if we account for the gain that these countries will make
from liberated oil and gas. Algeria is a good example with its underutilized gas export capacity, a
miniscule $0.5/mcf domestic gas price, and no shortage of land in the Sahara. Here, insolation can
reach 2,400 kWh/m2/year. If the country develops solar to meet its power needs, it can liberate gas to
direct down existing pipeline infrastructure towards high-value European markets. The economics of
such a project are modelled in Table 4, taking the example of a 100 MW investment in Algerian solar.
Cost would be expected at around $140 million. The base NPV (net present value) on power
generation is zero or, in other words, the project earns its cost of capital. However, the overall NPV is
uplifted to $40 million, after adding in the value of liberated gas.
Table 4: Table of assumptions for solar investment that also liberates marketing gas
Source: Authors’ own calculations.
For oil exporters such as those in the Middle East, which are highly reliant on oil revenues, investment
in renewables addresses, to some extent, the government’s short-run revenue maximization objective
18 | FEBRUARY 2018
Each Major’s adaptation to the very long-run energy transition is summarised in
Fig 17 (overleaf). We argue that Eni and BP’s renewables strategies are closest to
the model we favour: focusing on solar investments in sunny countries where gas
molecules can be liberated for export.
TOTAL, Shell and BP are also investing to create demand. But US Super-Majors
have been slower than their European peers to communicate any change of long-
term strategy arising from the global energy transition.
As further detail to substantiate Fig 17, we review each Major’s strategy to face the
energy transition in more detail below. Share prices move on short-term changes in
perceptions. T is contrasts with the very long-term timeframe of energy transitions.
Fig 14
Table of
assumptions
for solar
investment
that also
liberates
marketing gas
Source: Redburn
Assumptions and outputs Value Unit Source
Plant size 100 MW Assumption
Solar cost 1.4 $m/MW Eni guidance
Up-front cost 143 $m Calculated
Solar generation 2,000 MWH/MW/year BP Stat Review
Solar tariff 5 c/kWh Assumption
Gas per MWH 8 mcf/MWh Power model
Domestic gas price 0.5 $/mcf Press reports
European gas price 5.5 $/mcf Assumption
Transportation cost 0.5 $/mcf Statoil guidance
Fiscal take 50% % Assumption
Gas uplift 2.25 $/mcf Calculated
NPV ($m) 40 $m Calculated
IRR (%) 9% % Calculated
Source: Redburn, companies
0.0
0.1
0.2
0.3
0.4
0.5
0.6
0.7
0.8
Eni BP TOTAL Statoil Shell
2018 r
enew
able
s capex (
$bn)
0%
1%
2%
3%
4%
5%
6%
7%
Eni Shell BP TOTAL Statoil
2018 r
enew
able
s capex
(% o
f ota
l)
Fig 15
Renewables
spend by
Major
Fig 16
Renewables
share by
Major
Th
is c
opy
has
bee
n g
ener
ated
for
Bas
sam
Fat
tou
h o
f O
xfo
rd I
nst
itute
for
En
ergy
Stu
die
s.
This copy has been generated for Bassam Fattouh of Oxford Institute for Energy Studies.
21
by freeing exports of hydrocarbons, but does not guarantee their long-term sustainability. In the long
run, diversification of their economies remains the main adaptation strategy that these countries need
to pursue. Renewables may replace hydrocarbon resources in the domestic energy mix, but not in the
government budget, because investment in renewables does not generate the high returns that the oil
and gas industry does. Furthermore, while the renewable energy industry is part of the diversification
strategy, it alone cannot deliver the real needs of these economies, such as job creation and welfare
improvements. Thus, during the transition, the oil and gas sector will continue to play a key role in
these economies, generating the rents needed to expand parts of the productive economy, including
manufacturing industries, agriculture, and the service sector (with a specific view to those sectors in
which they have comparative advantage), in order to increase the non-oil portion of gross domestic
product and, consequently, diversify the sources of governments’ income. In fact, the oil and gas
sector may play its part in the diversification drive through building new industries and fostering
backward and forward linkages. This is a flexible strategy that maximizes the benefit from rent-
generating capital (that is, oil and gas reserves) and, at the same time, positions the country for an
era that could see oil demand flatline or decline. During the transition period, export rents will initially
constitute the bulk of the governments’ revenues but will decline if diversification progresses as
planned.
However, achieving economic diversification is easier said than done, because this entails extensive
changes in the economy with implications for citizens’ welfare and distribution of national income. For
example, oil countries need to carry out painful fiscal reforms that will lead to the reduction or removal
of subsidies (including underpriced energy careers) and the introduction of taxes, such as income and
value added tax. These issues are inherently complex given the rigidity of existing political structures,
institutions, and the implicit social contract through which lack of political participation is compensated
for by distribution of hydrocarbon rents. This is why gradual and small-scale reforms combined with
mitigation measures can be implemented, but one should not expect speedy transformations of oil-
exporting economies.
Also, there is a probability (which is not trivial) that these countries could fail in their goal of achieving
a diversified economy. This, in turn, will impact the speed of the global energy transition. In other
words, the global energy transition will not only shape the political and economic outcomes in oil-
exporting countries, but the transition in the major oil exporters will also shape the global energy
transition. It is a two-way street. The feedback effect from exporting countries is relevant even if these
countries succeed in expanding their productive economy, or the global oil market shifts from the
current scarcity-oriented model to a marginal-cost-based market in which hydrocarbons cannot retain
a premium pricing. For instance, if these countries succeed in their diversification objectives, they may
engage in a more aggressive reserve monetization strategy, which will result in lower oil prices and
large changes in relative prices of fuels, affecting the speed of transition unless these changes in
relative prices are adjusted through carbon taxes, which open new sets of issues related to
international coordination and distribution. On the other hand, if the transition does not go smoothly
and does result in many output disruptions and more volatile oil prices, this would in turn affect the
energy transition process. Such feedbacks add other layers of uncertainty to the already complex
issue of the current energy transition.
4. Conclusion
The global energy industry verges on its next energy transition. The 21st century will be characterized
by a rising share of cost-competitive renewable technologies, and a move away from carbon-intensive
fuels. The critical uncertainty is the pace of the transition.
The historical precedents exacerbate the uncertainty. Both ‘fast transitions’ and ‘slow transitions’ have
occurred previously. In addition, new and unimaginable demand-side technologies have tended to
emerge alongside prior energy transitions. The uncertainty cannot be resolved, only acknowledged.

22
Yet, the consequences of miscalculating the pace of transition, in either direction, are dire. Scaling
away from fossil fuels too quickly into alternative energy, in the presence of these uncertainties, can
lead to asset write-off and loss for investors. Transition too slowly, however, and incumbents may be
left with stranded assets and excluded from the benefits of the energy revolution. This is a delicate
trade-off that the oil companies and oil-exporting countries need to balance.
In the face of uncertainty, we have advocated that oil- and gas-producing companies and countries
should seek resilient strategies. For the oil majors, this includes gradual investment in a portfolio of
proven renewable energy technologies that complement their pre-existing value chains. Transition of
these businesses will require patience from investors. For oil-producing economies, policy should
promote renewables investment, particularly where it liberates domestic oil and gas consumption for
international export.

23
References
BP (2017). BP Statistical Review of World Energy,
www.bp.com/content/dam/bp/en/corporate/pdf/energy-economics/statistical-review-2017/bp-
statistical-review-of-world-energy-2017-full-report.pdf
BP (2018). BP Energy Outlook: 2018 edition, www.bp.com/content/dam/bp/en/corporate/pdf/energy-
economics/energy-outlook/bp-energy-outlook-2018.pdf
Bernard, L. et al. (2013). ‘Time scales and mechanisms of economic cycles: a review of theories of
long waves’, Political Economy Research Institute Working Paper No. 337, 1–21, University of
Massachusetts, Amherst, MA.
Carbon Dioxide Information Analysis Center (2017), http://cdiac.ess-dive.lbl.gov
Energy Information Administration (EIA) (2016). ‘How much coal, natural gas, or petroleum is used to
generate a kilowatthour of electricity?’, www.eia.gov/tools/faqs/faq.cfm?id=667&t=6 [last retrieved
09/06/2016].
Environmental Protection Agency (EPA) (2018). Highlights of CO2 and Fuel Economy Trends,
www.epa.gov/fuel-economy-trends/highlights-co2-and-fuel-economy-trends
Fouquet, R. (2008). Heat, Power and Light: Revolutions in Energy Services, London: Edward Elgar
Publishing.
Fouquet, R. (2016). ‘Historical energy transitions: Speed, prices and system transformation’, Energy
Research & Social Science, 13 (2016), 202–15.
Gately, D. and Huntington, H.G. (2002). ‘The Asymmetric Effects of Changes in Price and Income on
Energy and Oil Demand’, Energy Journal 23 (1), 19–55.
International Energy Agency (IEA) (2017). World Energy Outlook, https://webstore.iea.org/world-
energy-outlook-2017
International Renewable Energy Agency (IRENA) (2018). Renewable Power Generation Costs in
2017, IRENA, Abu Dhabi, www.irena.org/publications/2018/Jan/Renewable-power-generation-costs-
in-2017
Jevons, S.W (1866). The Coal Question; An Inquiry concerning the Progress of the Nation, and the
Probable Exhaustion of our Coal-mines, London: Macmillan and Co. 2nd edition.
Kander, A., Malanima, P., and Warde, P. (2013). Power to the People: Energy in Europe over the
Last Five Centuries, Princeton, NJ: Princeton University Press.
Lüngen, H.B. (2013). ‘Trends for reducing agents in blast furnace operation’, Stahlinstitut VDEh,
www.dkg.de/akk-vortraege/2013-_-2rd_polnisch_deutsches_symposium/abstract-luengen_reducing-
agents.pdf
Prost, A. (1991). ‘Public and private spheres in France’, in Prost, A. and Vincent, G. (eds.), A History
of Private Life, Volume V: Riddles of Identity in Modern Times, Cambridge, MA: Belknap Press of
Harvard University Press.
Seba, T. (2014). Clean Disruption of Energy and Transportation, San Francisco, CA: Tony Seba.
Smil, V. (2010). Energy Transitions: History, Requirements, Prospects, Santa Barbara, CA: Praeger.
Smil, V. (2016a). Energy Transitions: Global and National Perspectives, Santa Barbara, CA: Praeger.

24
Smil, V. (2016b) ‘Examining energy transitions: a dozen insights based on performance’, Energy
Research & Social Science, 22 (2016), 194–7.
Smil, V. (2017). Energy and Civilization: A History, Cambridge, MA: The MIT Press.
Sovacool, B.K. (2016). ‘How long will it take? Conceptualizing the temporal dynamics of energy
transitions’, Energy Research & Social Science, 13 (2016), 202–15.
Sovacool, B.K. and Geels, F.W. (2016). ‘Further reflections on the temporality of energy transitions: A
response to critics’, Energy Research & Social Science, 22, 232–7.
Wilson, G. and Staffell, I. (2018). ‘Rapid fuel switching from coal to natural gas through effective
carbon pricing’, Nature Energy, 3, 365–72