The Rise of Factor-Based Investing - HPM Partners€¦ · The Rise of Factor-Based Investing ......
14
The Rise of Factor-Based Investing In recent years we have seen a proliferation of systematic or rules-based investment strategies brought to market under the smart beta umbrella. Smart beta incorporates elements of both active and passive investing, focusing on risk factors that have been identified as the underlying drivers of investment returns across different asset classes, time periods and market conditions. Many of these strategies are quite complex, but some are based on well-known phenomena such as the small cap and value effects. As with other innovations in finance, the emergence of smart beta ETFs is making these developments readily accessible to investors. In this report, we review some smart beta strategies that offer attractive portfolio benefits to investors. By Karim HK Ahamed, CFA, HPMP Partner & Investment Strategist, July 2016
-
Upload
vuongnguyet -
Category
Documents
-
view
215 -
download
0
Transcript of The Rise of Factor-Based Investing - HPM Partners€¦ · The Rise of Factor-Based Investing ......
The Rise of Factor-Based Investing
In recent years we have seen a proliferation of systematic or rules-based investment strategies brought to market under the smart beta umbrella. Smart beta incorporates elements of both active and passive investing, focusing on risk factors that have been identified as the underlying drivers of investment returns across different asset classes, time periods and market conditions. Many of these strategies are quite complex, but some are based on well-known phenomena such as the small cap and value effects. As with other innovations in finance, the emergence of smart beta ETFs is making these developments readily accessible to investors. In this report, we review some smart beta strategies that offer attractive portfolio benefits to investors.
By Karim HK Ahamed, CFA, HPMP Partner & Investment Strategist, July 2016
www.hpmpartners.com
2
Executive Summary
Historically, investment managers have fallen into two distinct camps – active or passive. Active managers presume that manager skill, or alpha, is abig driver of investment returns. However, true manager alpha is scarce, and many active managers struggle to keep pace with the broader marketindices. Conversely, passive managers assume it is difficult, if not impossible, to beat the market and investors are better served by passive strategiesthat simply seek to match the returns of a desired benchmark.
In recent years, there has been a plethora of investment strategies brought to market under the smart beta umbrella. The term smart beta incorporateselements of both active and passive investing to create systematic or rules-based strategies that aim to enhance portfolio returns, or reduce portfoliorisk. In this report, we will review whether smart beta strategies are an innovative new tool for investors as advertised, or just another catchy marketingslogan.
Advances in financial theory have enabled investment researchers to isolate common risk factors that drive portfolio returns. These factors representthe building blocks for smart beta strategies. Many of the newer smart beta strategies are quite complex, but some are based on familiar phenomenasuch as the small cap and value effects. Researchers have verified that these factors are predictable and replicable across different asset classes,time periods and market conditions.
Our review of factor-based strategies leads us to conclude that smart beta strategies provide another tool for managers to improve the investmentprocess. The factors we have highlighted in this report are well known, persistent and readily accessed by investors. Our research shows that combiningtwo or more factor strategies offers better diversification and lower portfolio volatility than the stand-alone factors individually.
A growing number of large institutions are now adopting a factor-based approach to portfolio allocation. As with other innovations in finance, theemergence of smart beta ETFs is making these developments accessible to smaller investors.
The proliferation of funds coming to market suggests there will be a shake out and consolidation of the smart beta market at some point. By workingwith some of the top players, and focusing on factors which have been proven in the marketplace, we can capture the benefits of this new tool for ourclients.
HPM PARTNERS
The Rise of Factor-Based Investing
3
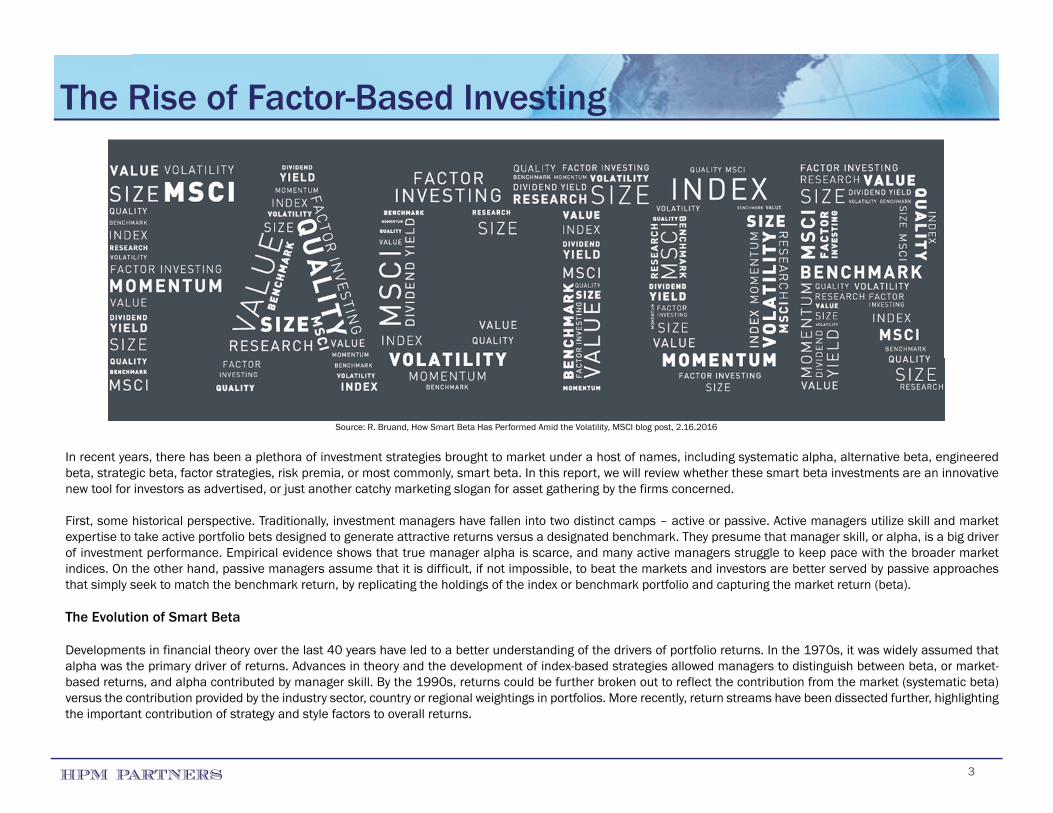
In recent years, there has been a plethora of investment strategies brought to market under a host of names, including systematic alpha, alternative beta, engineeredbeta, strategic beta, factor strategies, risk premia, or most commonly, smart beta. In this report, we will review whether these smart beta investments are an innovativenew tool for investors as advertised, or just another catchy marketing slogan for asset gathering by the firms concerned.
First, some historical perspective. Traditionally, investment managers have fallen into two distinct camps – active or passive. Active managers utilize skill and marketexpertise to take active portfolio bets designed to generate attractive returns versus a designated benchmark. They presume that manager skill, or alpha, is a big driverof investment performance. Empirical evidence shows that true manager alpha is scarce, and many active managers struggle to keep pace with the broader marketindices. On the other hand, passive managers assume that it is difficult, if not impossible, to beat the markets and investors are better served by passive approachesthat simply seek to match the benchmark return, by replicating the holdings of the index or benchmark portfolio and capturing the market return (beta).
The Evolution of Smart Beta
Developments in financial theory over the last 40 years have led to a better understanding of the drivers of portfolio returns. In the 1970s, it was widely assumed thatalpha was the primary driver of returns. Advances in theory and the development of index-based strategies allowed managers to distinguish between beta, or market-based returns, and alpha contributed by manager skill. By the 1990s, returns could be further broken out to reflect the contribution from the market (systematic beta)versus the contribution provided by the industry sector, country or regional weightings in portfolios. More recently, return streams have been dissected further, highlightingthe important contribution of strategy and style factors to overall returns.
HPM PARTNERS
The Rise of Factor-Based Investing
Source: R. Bruand, How Smart Beta Has Performed Amid the Volatility, MSCI blog post, 2.16.2016
4
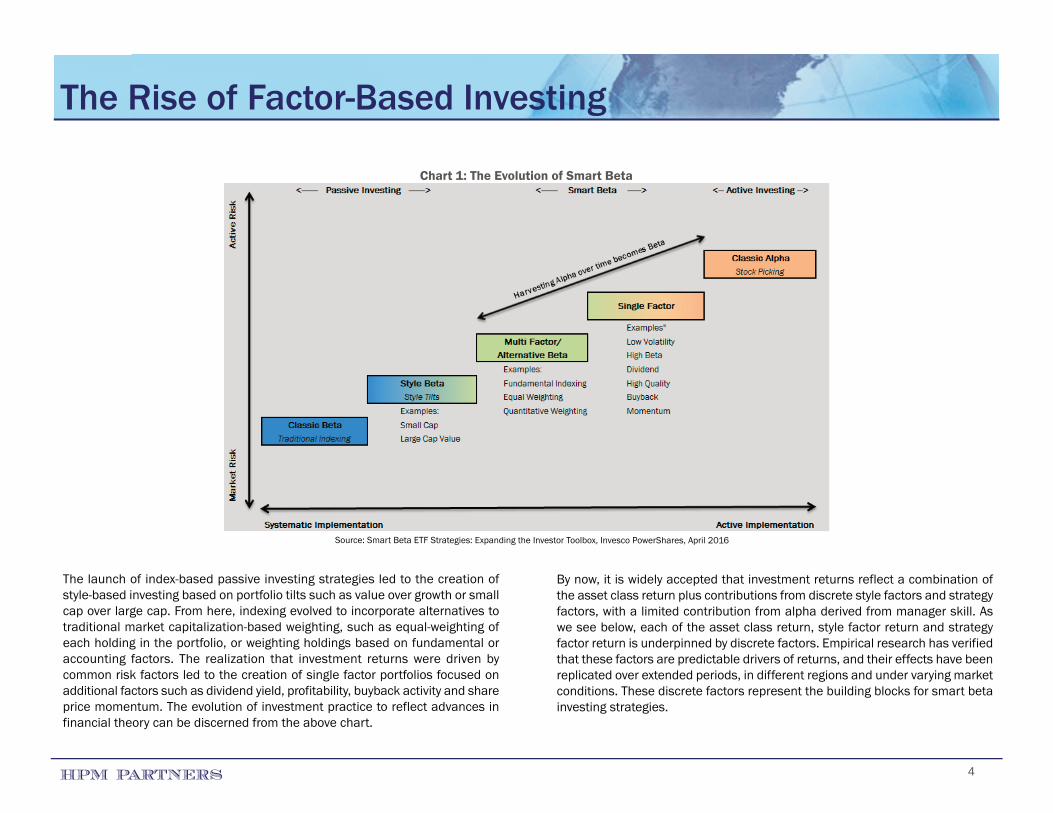
The launch of index-based passive investing strategies led to the creation ofstyle-based investing based on portfolio tilts such as value over growth or smallcap over large cap. From here, indexing evolved to incorporate alternatives totraditional market capitalization-based weighting, such as equal-weighting ofeach holding in the portfolio, or weighting holdings based on fundamental oraccounting factors. The realization that investment returns were driven bycommon risk factors led to the creation of single factor portfolios focused onadditional factors such as dividend yield, profitability, buyback activity and shareprice momentum. The evolution of investment practice to reflect advances infinancial theory can be discerned from the above chart.
By now, it is widely accepted that investment returns reflect a combination ofthe asset class return plus contributions from discrete style factors and strategyfactors, with a limited contribution from alpha derived from manager skill. Aswe see below, each of the asset class return, style factor return and strategyfactor return is underpinned by discrete factors. Empirical research has verifiedthat these factors are predictable drivers of returns, and their effects have beenreplicated over extended periods, in different regions and under varying marketconditions. These discrete factors represent the building blocks for smart betainvesting strategies.
HPM PARTNERS
The Rise of Factor-Based Investing
Source: Smart Beta ETF Strategies: Expanding the Investor Toolbox, Invesco PowerShares, April 2016
Chart 1: The Evolution of Smart Beta
5
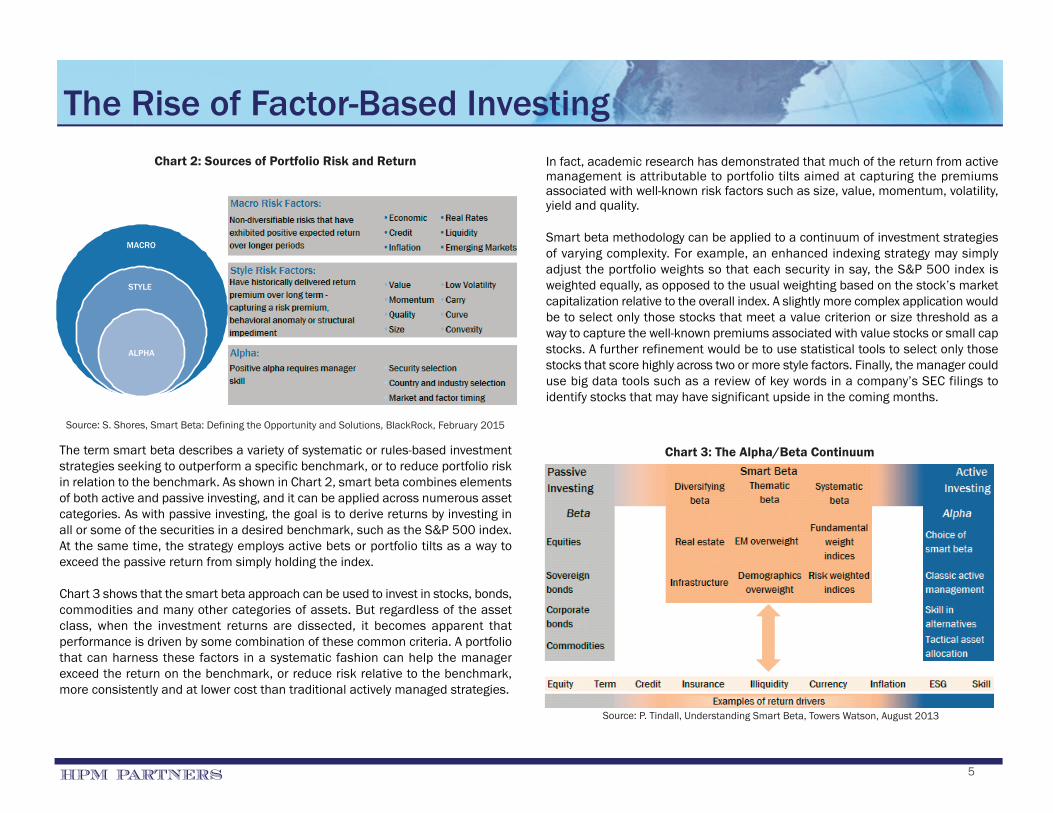
The term smart beta describes a variety of systematic or rules-based investmentstrategies seeking to outperform a specific benchmark, or to reduce portfolio riskin relation to the benchmark. As shown in Chart 2, smart beta combines elementsof both active and passive investing, and it can be applied across numerous assetcategories. As with passive investing, the goal is to derive returns by investing inall or some of the securities in a desired benchmark, such as the S&P 500 index.At the same time, the strategy employs active bets or portfolio tilts as a way toexceed the passive return from simply holding the index.
Chart 3 shows that the smart beta approach can be used to invest in stocks, bonds,commodities and many other categories of assets. But regardless of the assetclass, when the investment returns are dissected, it becomes apparent thatperformance is driven by some combination of these common criteria. A portfoliothat can harness these factors in a systematic fashion can help the managerexceed the return on the benchmark, or reduce risk relative to the benchmark,more consistently and at lower cost than traditional actively managed strategies.
In fact, academic research has demonstrated that much of the return from activemanagement is attributable to portfolio tilts aimed at capturing the premiumsassociated with well-known risk factors such as size, value, momentum, volatility,yield and quality.
Smart beta methodology can be applied to a continuum of investment strategiesof varying complexity. For example, an enhanced indexing strategy may simplyadjust the portfolio weights so that each security in say, the S&P 500 index isweighted equally, as opposed to the usual weighting based on the stock’s marketcapitalization relative to the overall index. A slightly more complex application wouldbe to select only those stocks that meet a value criterion or size threshold as away to capture the well-known premiums associated with value stocks or small capstocks. A further refinement would be to use statistical tools to select only thosestocks that score highly across two or more style factors. Finally, the manager coulduse big data tools such as a review of key words in a company’s SEC filings toidentify stocks that may have significant upside in the coming months.
HPM PARTNERS
The Rise of Factor-Based Investing
Source: S. Shores, Smart Beta: Defining the Opportunity and Solutions, BlackRock, February 2015
Chart 2: Sources of Portfolio Risk and Return
MACRO
STYLE
ALPHA
Source: P. Tindall, Understanding Smart Beta, Towers Watson, August 2013
Chart 3: The Alpha/Beta Continuum

6
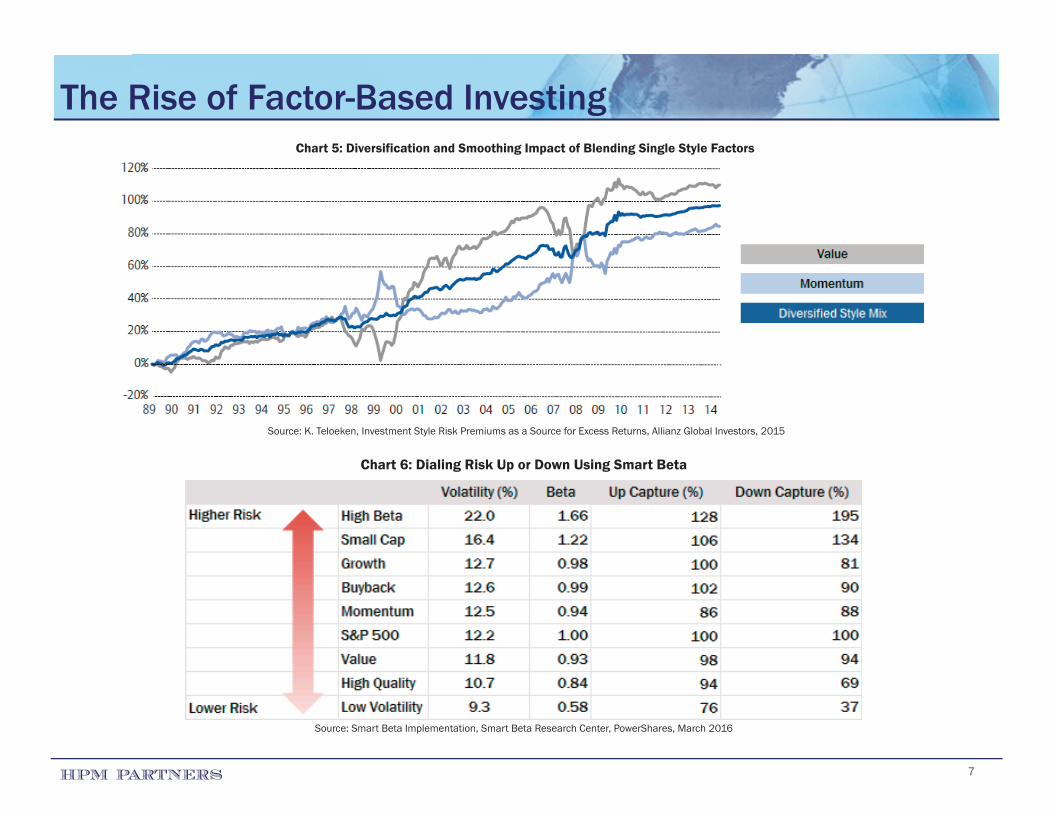
When it comes to implementation, combining factors has been shown to bemore effective than using single factor strategies. As illustrated in Chart 5 onthe following page, combining two or more factors helps to smooth out thevariability in returns experienced with single factors. For example, valueinvesting is a proven driver of attractive long term returns, but investors in thestrategy need to be prepared for sustained periods of underperformance whenthe investing style is out of favor.
There are two basic methods for combining strategies. The first is to create ablend of individual factor strategies, such as an equally-weighted combinationof four independent single factor strategies. Advantages to this approach aresimplicity and the flexibility to weight each factor individually to obtain a desiredportfolio tilt. Drawbacks to this approach are more volatile returns, a tendencyfor uncorrelated factors to cancel each other out, and the potential for highertransaction costs if one factor model is selling a given security while anotherfactor model in that portfolio is buying the same security at the same time.
The other method is to screen across all factors in the same portfolio andnetting out buys and sells of the same security within the portfolio. Although itis more complicated to implement, this integrated approach helps to reduceredundant transaction costs and provide better smoothing of portfolio variability,as it tends to select securities that score well in the aggregate across multipledimensions, whereas the single factor technique picks securities that scorehighest on a single factor, even if they score badly on the other factors.
To illustrate how investors can use factor-based strategies as a tool to customizeportfolios, Chart 6 on the next page shows how risk exposure can be dialed upor down with the aid of smart beta factors. An investor looking to reduce riskcan focus on high quality or low volatility strategies, whereas someone lookingto add risk for upside can focus on small cap or high beta strategies.
HPM PARTNERS
The Rise of Factor-Based Investing
Approach Complexity Alpha Generation Methodology Active/Passive
Enhanced Indexing LowTargeted exposure by adjusting existing benchmarks/indices based on desired factors such as volatility, value and quality
Create a non-market capitalization weighted benchmark
Passive
Rules-Based Strategies MediumSelect and weigh investments based on a set of fixed rules focused on specified risk factors such as value and market capitalization size
Active security selection using a structured rules-based approach
Active
Fundamental or Factor Based Strategies
Medium
Identify securities that are attractively priced relative to future prospects based on fundamental factors such as valuation, earnings, quality and momentum
Use covariance matrices and/or multiple regression to determine the weight of factor exposures
Active
Metadata Strategies High
Invest opportunistically using a highly quantitative or big-data driven approach that incorporates a combination of fundamental, technical and event-driven models
Employ a combination of statistical techniques and models to collect and analyze vast amounts of data
Active
Chart 4: Examples of Smart Beta Strategies
Source: Man, Machine & the Market, Goldman Sachs Asset Management, June 2015
7
The Rise of Factor-Based Investing
HPM PARTNERS
Chart 6: Dialing Risk Up or Down Using Smart Beta
Source: Smart Beta Implementation, Smart Beta Research Center, PowerShares, March 2016
Chart 5: Diversification and Smoothing Impact of Blending Single Style Factors
Source: K. Teloeken, Investment Style Risk Premiums as a Source for Excess Returns, Allianz Global Investors, 2015
8
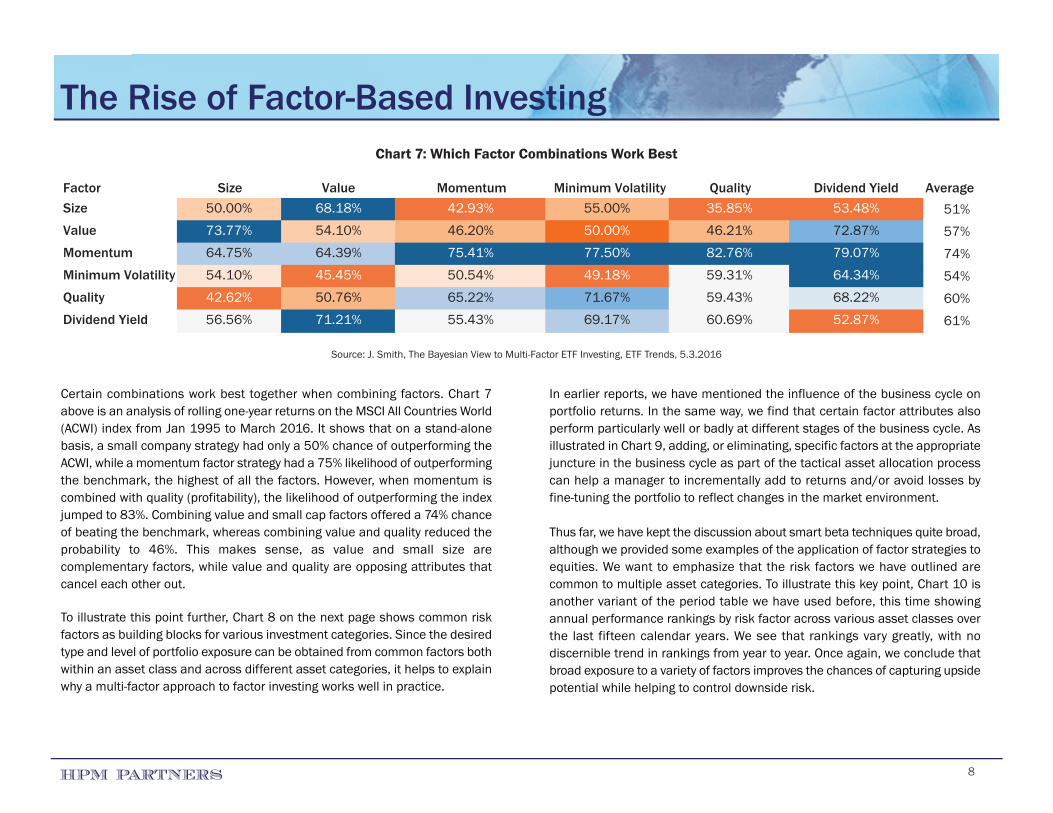
Certain combinations work best together when combining factors. Chart 7above is an analysis of rolling one-year returns on the MSCI All Countries World(ACWI) index from Jan 1995 to March 2016. It shows that on a stand-alonebasis, a small company strategy had only a 50% chance of outperforming theACWI, while a momentum factor strategy had a 75% likelihood of outperformingthe benchmark, the highest of all the factors. However, when momentum iscombined with quality (profitability), the likelihood of outperforming the indexjumped to 83%. Combining value and small cap factors offered a 74% chanceof beating the benchmark, whereas combining value and quality reduced theprobability to 46%. This makes sense, as value and small size arecomplementary factors, while value and quality are opposing attributes thatcancel each other out.
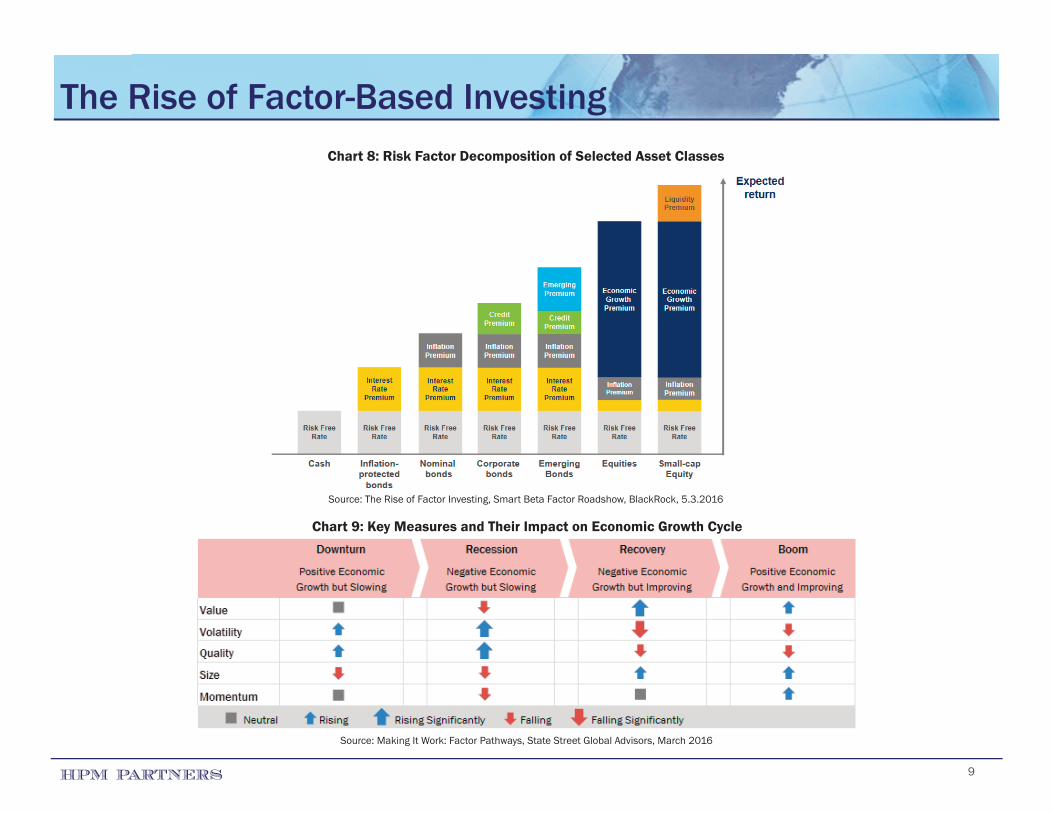
To illustrate this point further, Chart 8 on the next page shows common riskfactors as building blocks for various investment categories. Since the desiredtype and level of portfolio exposure can be obtained from common factors bothwithin an asset class and across different asset categories, it helps to explainwhy a multi-factor approach to factor investing works well in practice.
In earlier reports, we have mentioned the influence of the business cycle onportfolio returns. In the same way, we find that certain factor attributes alsoperform particularly well or badly at different stages of the business cycle. Asillustrated in Chart 9, adding, or eliminating, specific factors at the appropriatejuncture in the business cycle as part of the tactical asset allocation processcan help a manager to incrementally add to returns and/or avoid losses byfine-tuning the portfolio to reflect changes in the market environment.
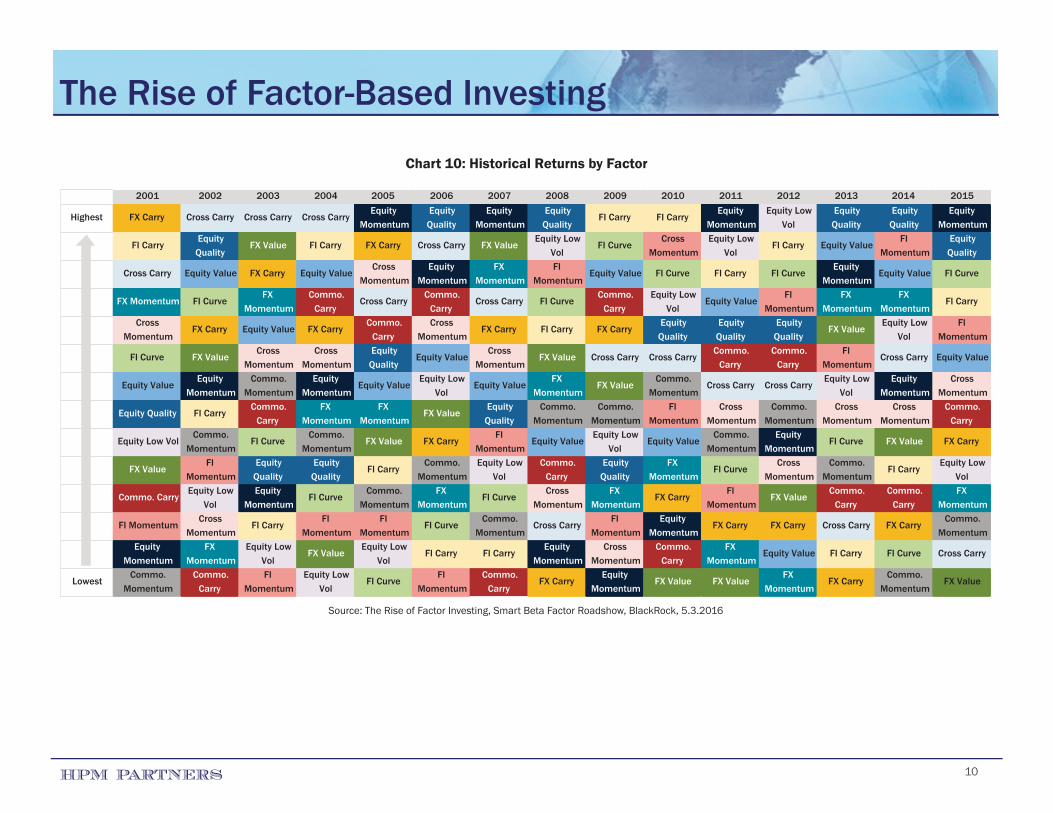
Thus far, we have kept the discussion about smart beta techniques quite broad,although we provided some examples of the application of factor strategies toequities. We want to emphasize that the risk factors we have outlined arecommon to multiple asset categories. To illustrate this key point, Chart 10 isanother variant of the period table we have used before, this time showingannual performance rankings by risk factor across various asset classes overthe last fifteen calendar years. We see that rankings vary greatly, with nodiscernible trend in rankings from year to year. Once again, we conclude thatbroad exposure to a variety of factors improves the chances of capturing upsidepotential while helping to control downside risk.
HPM PARTNERS
The Rise of Factor-Based Investing
Factor Size Value Momentum Minimum Volatility Quality Dividend Yield AverageSize 50.00% 68.18% 42.93% 55.00% 35.85% 53.48% 51%Value 73.77% 54.10% 46.20% 50.00% 46.21% 72.87% 57%Momentum 64.75% 64.39% 75.41% 77.50% 82.76% 79.07% 74%Minimum Volatility 54.10% 45.45% 50.54% 49.18% 59.31% 64.34% 54%Quality 42.62% 50.76% 65.22% 71.67% 59.43% 68.22% 60%Dividend Yield 56.56% 71.21% 55.43% 69.17% 60.69% 52.87% 61%
Chart 7: Which Factor Combinations Work Best
Source: J. Smith, The Bayesian View to Multi-Factor ETF Investing, ETF Trends, 5.3.2016
9HPM PARTNERS
The Rise of Factor-Based InvestingChart 8: Risk Factor Decomposition of Selected Asset Classes
Source: The Rise of Factor Investing, Smart Beta Factor Roadshow, BlackRock, 5.3.2016
Chart 9: Key Measures and Their Impact on Economic Growth Cycle
Source: Making It Work: Factor Pathways, State Street Global Advisors, March 2016
10HPM PARTNERS
The Rise of Factor-Based Investing
2001 2002 2003 2004 2005 2006 2007 2008 2009 2010 2011 2012 2013 2014 2015
Highest FX Carry Cross Carry Cross Carry Cross CarryEquity
MomentumEquity Quality
Equity Momentum
Equity Quality
FI Carry FI CarryEquity
MomentumEquity Low
VolEquity Quality
Equity Quality
Equity Momentum
FI CarryEquity
QualityFX Value FI Carry FX Carry Cross Carry FX Value
Equity Low Vol
FI CurveCross
MomentumEquity Low
VolFI Carry Equity Value
FI Momentum
Equity Quality
Cross Carry Equity Value FX Carry Equity ValueCross
MomentumEquity
MomentumFX
MomentumFI
MomentumEquity Value FI Curve FI Carry FI Curve
Equity Momentum
Equity Value FI Curve
FX Momentum FI CurveFX
MomentumCommo.
CarryCross Carry
Commo. Carry
Cross Carry FI CurveCommo.
CarryEquity Low
VolEquity Value
FI Momentum
FX Momentum
FX Momentum
FI Carry
Cross Momentum
FX Carry Equity Value FX CarryCommo.
CarryCross
MomentumFX Carry FI Carry FX Carry
Equity Quality
Equity Quality
Equity Quality
FX ValueEquity Low
VolFI
Momentum
FI Curve FX ValueCross
MomentumCross
MomentumEquity Quality
Equity ValueCross
MomentumFX Value Cross Carry Cross Carry
Commo. Carry
Commo. Carry
FI Momentum
Cross Carry Equity Value
Equity ValueEquity
MomentumCommo.
MomentumEquity
MomentumEquity Value
Equity Low Vol
Equity ValueFX
MomentumFX Value
Commo. Momentum
Cross Carry Cross CarryEquity Low
VolEquity
MomentumCross
Momentum
Equity Quality FI CarryCommo.
CarryFX
MomentumFX
MomentumFX Value
Equity Quality
Commo. Momentum
Commo. Momentum
FI Momentum
Cross Momentum
Commo. Momentum
Cross Momentum
Cross Momentum
Commo. Carry
Equity Low VolCommo.
MomentumFI Curve
Commo. Momentum
FX Value FX CarryFI
MomentumEquity Value
Equity Low Vol
Equity ValueCommo.
MomentumEquity
MomentumFI Curve FX Value FX Carry
FX ValueFI
MomentumEquity
QualityEquity
QualityFI Carry
Commo. Momentum
Equity Low Vol
Commo. Carry
Equity Quality
FX Momentum
FI CurveCross
MomentumCommo.
MomentumFI Carry
Equity Low Vol
Commo. CarryEquity Low
VolEquity
MomentumFI Curve
Commo. Momentum
FX Momentum
FI CurveCross
MomentumFX
MomentumFX Carry
FI Momentum
FX ValueCommo.
CarryCommo.
CarryFX
Momentum
FI MomentumCross
MomentumFI Carry
FI Momentum
FI Momentum
FI CurveCommo.
MomentumCross Carry
FI Momentum
Equity Momentum
FX Carry FX Carry Cross Carry FX CarryCommo.
MomentumEquity
MomentumFX
MomentumEquity Low
VolFX Value
Equity Low Vol
FI Carry FI CarryEquity
MomentumCross
MomentumCommo.
CarryFX
MomentumEquity Value FI Carry FI Curve Cross Carry
LowestCommo.
MomentumCommo.
CarryFI
MomentumEquity Low
VolFI Curve
FI Momentum
Commo. Carry
FX CarryEquity
MomentumFX Value FX Value
FX Momentum
FX CarryCommo.
MomentumFX Value
Chart 10: Historical Returns by Factor
Source: The Rise of Factor Investing, Smart Beta Factor Roadshow, BlackRock, 5.3.2016
11
Implementation
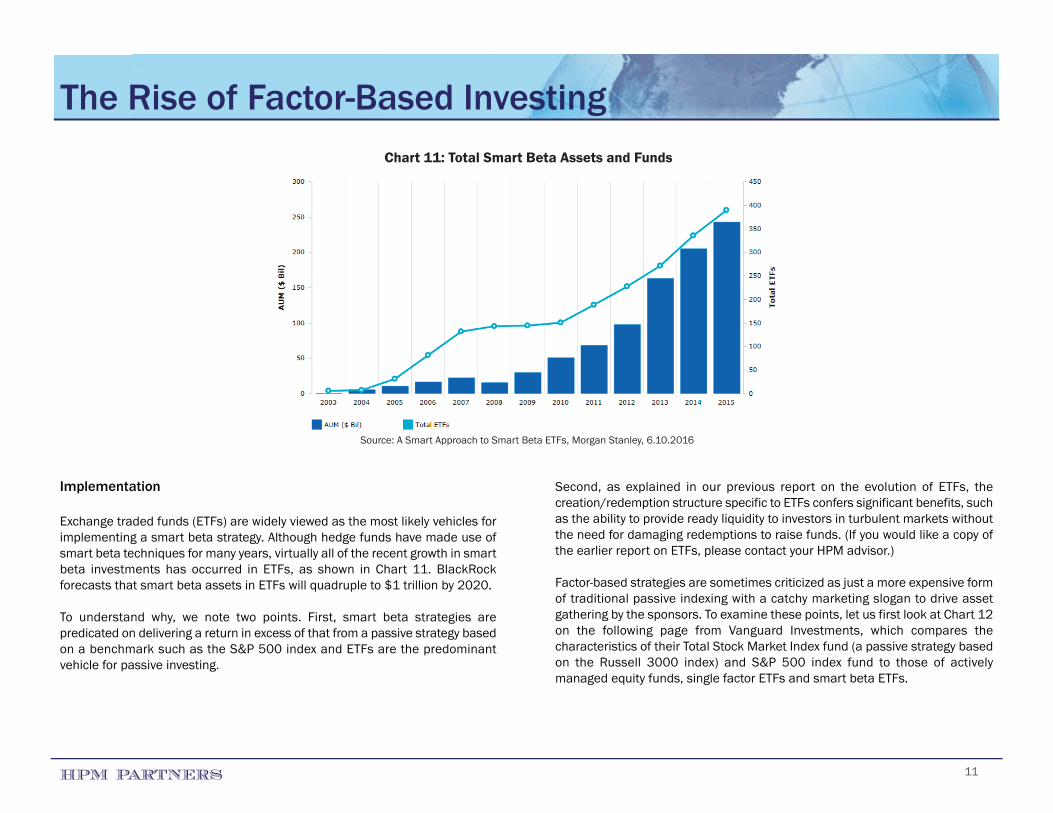
Exchange traded funds (ETFs) are widely viewed as the most likely vehicles forimplementing a smart beta strategy. Although hedge funds have made use ofsmart beta techniques for many years, virtually all of the recent growth in smartbeta investments has occurred in ETFs, as shown in Chart 11. BlackRockforecasts that smart beta assets in ETFs will quadruple to $1 trillion by 2020.
To understand why, we note two points. First, smart beta strategies arepredicated on delivering a return in excess of that from a passive strategy basedon a benchmark such as the S&P 500 index and ETFs are the predominantvehicle for passive investing.
Second, as explained in our previous report on the evolution of ETFs, thecreation/redemption structure specific to ETFs confers significant benefits, suchas the ability to provide ready liquidity to investors in turbulent markets withoutthe need for damaging redemptions to raise funds. (If you would like a copy ofthe earlier report on ETFs, please contact your HPM advisor.)
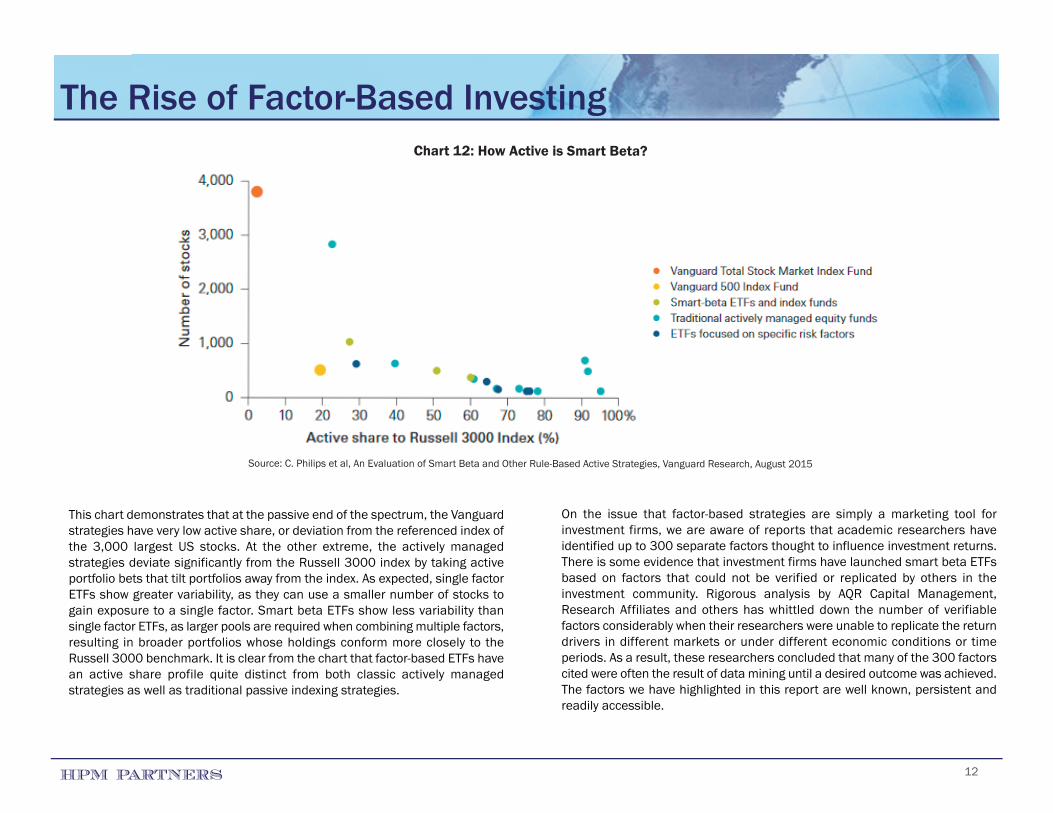
Factor-based strategies are sometimes criticized as just a more expensive formof traditional passive indexing with a catchy marketing slogan to drive assetgathering by the sponsors. To examine these points, let us first look at Chart 12on the following page from Vanguard Investments, which compares thecharacteristics of their Total Stock Market Index fund (a passive strategy basedon the Russell 3000 index) and S&P 500 index fund to those of activelymanaged equity funds, single factor ETFs and smart beta ETFs.
HPM PARTNERS
The Rise of Factor-Based InvestingChart 11: Total Smart Beta Assets and Funds
Source: A Smart Approach to Smart Beta ETFs, Morgan Stanley, 6.10.2016
12
The Rise of Factor-Based Investing
HPM PARTNERS
This chart demonstrates that at the passive end of the spectrum, the Vanguardstrategies have very low active share, or deviation from the referenced index ofthe 3,000 largest US stocks. At the other extreme, the actively managedstrategies deviate significantly from the Russell 3000 index by taking activeportfolio bets that tilt portfolios away from the index. As expected, single factorETFs show greater variability, as they can use a smaller number of stocks togain exposure to a single factor. Smart beta ETFs show less variability thansingle factor ETFs, as larger pools are required when combining multiple factors,resulting in broader portfolios whose holdings conform more closely to theRussell 3000 benchmark. It is clear from the chart that factor-based ETFs havean active share profile quite distinct from both classic actively managedstrategies as well as traditional passive indexing strategies.
On the issue that factor-based strategies are simply a marketing tool forinvestment firms, we are aware of reports that academic researchers haveidentified up to 300 separate factors thought to influence investment returns.There is some evidence that investment firms have launched smart beta ETFsbased on factors that could not be verified or replicated by others in theinvestment community. Rigorous analysis by AQR Capital Management,Research Affiliates and others has whittled down the number of verifiablefactors considerably when their researchers were unable to replicate the returndrivers in different markets or under different economic conditions or timeperiods. As a result, these researchers concluded that many of the 300 factorscited were often the result of data mining until a desired outcome was achieved.The factors we have highlighted in this report are well known, persistent andreadily accessible.
Chart 12: How Active is Smart Beta?
Source: C. Philips et al, An Evaluation of Smart Beta and Other Rule-Based Active Strategies, Vanguard Research, August 2015
13
The Rise of Factor-Based Investing
HPM PARTNERS
Another objection that has been raised about smart beta strategies is that theyare expensive in comparison to traditional ETFs that offer very cheap and liquidexposure to myriad investment strategies. Expense ratios on ETFs employingfactor-based strategies were much higher initially, perhaps because of thesmaller asset base and higher upfront development costs. As more money hasflowed into the category, expenses can be amortized over a larger asset baseand fund expense ratios have come down. Firms such as BlackRock andGoldman Sachs have made a concerted effort to price their factor-based ETFsat a level comparable to their traditional ETFs, taking away much of thisargument.
Conclusion
Smart beta is another stage in the evolution of portfolio theory. Some well-established factor strategies have been tested over many years, principally byhedge funds seeking an investment edge. A growing number of pension plans,endowments and foundations are adopting a factor-based approach to portfolioallocation, in place of the traditional asset class-based approach. As we haveseen with other innovations in finance, the emergence of smart beta ETFs helpsto make factor-based investing accessible for smaller investors.
Many of the newer smart beta strategies are quite complex, but some are basedon familiar phenomena such as the small cap and value effects. Despite beingwidely known and used by so many investors, these effects have persisted overlong periods without losing their effectiveness, either because the factors areso strong they cannot be arbitraged away, or because investor behavior gets inthe way. For example, an investor employing a momentum strategy or a valuestrategy has to be prepared for extended periods of underperformance whenthe strategy is out of favor and investors often lack the patience or discipline tohold on to a severely underperforming strategy long enough for it to turn around.
The proliferation of funds coming to market, many of which have been createdunder less rigorous criteria, suggests that there will be a shake out andconsolidation of the smart beta market at some point. By working with some ofthe top providers and focusing on factors which have been proven to providepersistent and replicable results outside of the academic research, we believewe can capture the benefits from this new tool to help improve returns and/orreduce risks for our clients.
Source: Aaron Bacall, cartoonstock.com. Reprinted with permission.
(Our special thanks to AQR Capital Management, BlackRock and Goldman Sachs for their help with our research for this report.)
18HPM PARTNERS
Important DisclosuresThis document contains general information that is not applicable to everyone. The information contained herein should not be construed as personalized investmentadvice. Past performance is no guarantee of future results. There is no guarantee that the views and opinions expressed in this document will come to pass. Informationcontained herein has been obtained from sources believed to be reliable but is not guaranteed accurate. All information is as of July 20, 2016, political and economicchanges after that date may impact the accuracy of the information herein and HPM Partners LLC (“HPM”) is not obligated to update this document. Investing in thefinancial markets involves risk, including the risk of loss of the principal amount invested, and may not be appropriate for everyone. The information presented is subjectto change without notice and should not be considered as a solicitation to buy or sell any security. HPM is an SEC-registered investment adviser with offices in New York,Illinois, Ohio, Michigan and California. For information pertaining to the registration status of HPM, please contact us or refer to the Investment Adviser Public Disclosurewebsite (www.adviserinfo.sec.gov). For additional information about HPM, including fees and services, send for our disclosure statement as set forth on the Form ADVusing the contact information herein. Please read the disclosure statement carefully before you invest or send money.