The Rise of Domestic Capital Markets for Corporate...
61
Policy Research Working Paper 8844 e Rise of Domestic Capital Markets for Corporate Financing Facundo Abraham Juan J. Cortina Sergio L. Schmukler Development Economics Development Research Group May 2019 Public Disclosure Authorized Public Disclosure Authorized Public Disclosure Authorized Public Disclosure Authorized
Transcript of The Rise of Domestic Capital Markets for Corporate...

Policy Research Working Paper 8844
The Rise of Domestic Capital Markets for Corporate Financing
Facundo AbrahamJuan J. Cortina
Sergio L. Schmukler
Development Economics Development Research GroupMay 2019
Pub
lic D
iscl
osur
e A
utho
rized
Pub
lic D
iscl
osur
e A
utho
rized
Pub
lic D
iscl
osur
e A
utho
rized
Pub
lic D
iscl
osur
e A
utho
rized

Produced by the Research Support Team
Abstract
The Policy Research Working Paper Series disseminates the findings of work in progress to encourage the exchange of ideas about development issues. An objective of the series is to get the findings out quickly, even if the presentations are less than fully polished. The papers carry the names of the authors and should be cited accordingly. The findings, interpretations, and conclusions expressed in this paper are entirely those of the authors. They do not necessarily represent the views of the International Bank for Reconstruction and Development/World Bank and its affiliated organizations, or those of the Executive Directors of the World Bank or the governments they represent.
Policy Research Working Paper 8844
During the past decades, firms from emerging econo-mies have significantly increased the amount of financing obtained in capital markets. Whereas the literature argues that international markets have been an important con-tributor to this process, the role of domestic markets is mostly unknown. By examining the case of East Asia, this paper shows that domestic markets have been a key driver of the observed trends in capital market financing since the early 2000s. As domestic markets developed, more and
smaller firms gained access to equity and corporate bond financing. Domestic markets also helped some corporations to diversify funding sources and obtain domestic currency financing. Policy reforms following the Asian Financial Crisis accompanied the growth of domestic markets. Part of the reforms were aimed at developing domestic capital markets for small and medium-size enterprises. Although these markets have developed significantly, they still serve relatively few corporations, albeit from new sectors.
This paper is a product of the Development Research Group, Development Economics. It is part of a larger effort by the World Bank to provide open access to its research and make a contribution to development policy discussions around the world. Policy Research Working Papers are also posted on the Web at http://www.worldbank.org/prwp. The authors may be contacted at [email protected], [email protected], and [email protected].

The Rise of Domestic Capital Markets for Corporate Financing
Facundo Abraham Juan J. Cortina Sergio L. Schmukler *
JEL Classification Codes: F33; G00; G01; G15; G21; G23; G31
Keywords: Asian Financial Crisis; corporate bond markets; corporate financing; Global Financial Crisis; SME capital markets; stock markets; syndicated loan markets
* This paper is a joint product of the World Bank Development Research Group, the East Asia and Pacific Region, andthe Finance, Competitiveness, and Innovation Global Practice at the Malaysia Knowledge and Research Hub. For helpfulcomments and data provided, we are grateful to Ashraf Bin Arshad, Irina Astrakhan, Ana Maria Aviles, Anderson Caputo,Jian Chen, Jose de Luna Martinez, Tatiana Didier, Catiana Garcia-Kilroy, Aart Kraay, Norman Loayza, Andrew Mason,Sudhir Shetty, various financial sector experts at the World Bank, and participants at presentations held at the MalaysiaSecurities Commission and the World Bank (Kuala Lumpur and Washington, DC). We received additional financialsupport from the World Bank Knowledge for Change Program and Strategic Research Program.Email addresses: [email protected]; [email protected]; [email protected].

1
1. Introduction
Firms from emerging economies have significantly increased the amount of financing raised in capital
markets since the early 1990s. An important driver of this rise has been the participation of firms in
international markets. As governments liberalized financial markets in the 1990s and globalization
deepened, emerging economy firms have significantly increased their equity and bond issuances
abroad (Henderson et al., 2006; Gozzi et al., 2010; Doidge et al., 2013). Moreover, after the 2008-09
Global Financial Crisis, low interest rates in advanced economies have led to a boom in international
bond issuances by emerging economy firms (Shin, 2013; Chui et al., 2014; Turner, 2014; Acharya et
al., 2015; McCauley et al., 2015; Caballero et al., 2016; Bruno and Shin, 2017; Chang et al., 2017).
Whereas the literature has systematically documented the importance of international capital
markets for emerging economy firms, the role of domestic markets has been largely overlooked. In
this paper, we study (i) whether domestic activity can also explain the boom in capital market financing
in emerging economies, and (ii) whether domestic and international markets act as complements or
substitutes for firms in emerging economies. These issues are relevant because, although financial
markets have become increasingly globalized, some degree of market segmentation might persist over
time, and domestic and international markets could serve different types of firms.
We address these questions by analyzing the equity and bond issuance activity of East Asian
firms since the early 1990s. We focus on this region because its corporate issuances account for most
of the capital market activity in emerging regions. The amount of equity and bonds raised by East
Asian firms during the 1990-2016 period accounted for about 70 percent of the total amount raised
by firms from emerging regions in domestic and international markets. Furthermore, following the
1997-98 Asian Financial Crisis, policy makers in the region have made a conscious effort to develop
domestic markets, among other initiatives, to decrease the reliance on financing from abroad and

2
foreign currency instruments. Although our focus is on East Asia, we systematically compare the
patterns in this region with those in other emerging and advanced economies.
To conduct the analysis, we use transaction-level data on equity and corporate bonds issued
in domestic and international (cross-border) markets over the period 1990-2016. The data include
124,390 security issuances conducted by 22,945 firms from East Asian economies. The analysis
focuses on the largest 10 economies in the region in terms of gross domestic product (GDP). The
data comprise firms listed in stock exchanges and unlisted firms. Including both types of firms is
important because most of the existing research on firms’ issuance activity focuses only on listed firms,
limiting the scope of the analysis. Whereas all equity issuers in our sample are listed firms, the latter
account for only 40 percent of bond issuers. By excluding unlisted firms, other papers are not only
disregarding most of the corporate bond issuers, but also are likely omitting relatively smaller firms.
Our analysis yields the following interrelated findings. First, driven by domestic rather than
international issuances, the amount of financing raised in capital markets by East Asian firms has
greatly increased since the 1990s. The total amount of equity and bond financing raised per year
(relative to GDP) in the median East Asian economy doubled between the periods 1990-98 and 2008-
16. As a result, the relative size of capital market financing in East Asia has become similar to that in
advanced economies. The share of equity raised domestically per year in the median East Asian
economy increased from 85 to 97 percent between 1990-99 and 2008-16; that of domestic bonds rose
from 36 to 80 percent between the same periods. Because of the high correlation between issuance
market and currency denomination, the share of domestic currency bond financing also increased
significantly. The larger reliance on domestic markets occurred both at the economy-industry level
and within firms. The patterns in East Asia are similar to those in other emerging regions, where
domestic equity and bond activity has grown relatively faster than international activity. However, the

3
growth of domestic markets was more subdued in other regions, which still conducted most of their
bond issuances abroad during 2008-16.
Second, along with the growth in the amount raised, the extensive margin increased as more
and smaller firms in East Asia gained access to equity and bond markets. Driven by a higher
participation of firms in domestic markets, the average number of issuing firms per year in the median
East Asian economy more than tripled, from 60 issuers in 1990-98 to 185 issuers in 2008-16. Because
domestic markets cater to smaller firms than international ones, the size of the typical capital market
issuer in East Asia declined 38 percent between 1990-98 and 2008-16. These patterns stand in contrast
to those in other regions. In advanced and other emerging economies, the number of issuers has
remained fairly constant and the size of the typical issuer has increased over time.
Third, the relatively larger firms with access to international markets have also benefited from
the development of domestic markets in East Asia. Whereas the relatively smaller issuing firms rely
almost exclusively on domestic capital markets, the largest firms raise funds in multiple markets:
domestic capital markets, international capital markets, and syndicated loan markets. Access to
different markets allows firms to mitigate negative shocks in one market by raising more funds in
other markets. When international debt markets collapsed during the Global Financial Crisis, firms in
East Asia moved from international to domestic bond markets. This “spare tire” function was not
present during the Asian Financial Crisis, when domestic capital markets were less developed.
Fourth, the growth in domestic financing occurred while policy makers implemented a set of
reforms to develop domestic capital markets after the Asian Financial Crisis. Aware that relatively
large corporations are typically the main users of traditional capital markets, policy makers
complemented these reforms with policies aimed at developing domestic capital markets for small and
medium-sized enterprises (SMEs). Compared to those in other regions, including advanced ones, SME
markets have become large in East Asia. By 2016, SME markets in the region were the largest in the

4
world in terms of market capitalization. However, the experience of China (mainland); Hong Kong
SAR, China; and Taiwan, China suggests that SME markets tend to serve few firms that, in some
cases, are not SMEs, but rather larger corporations. On the positive side, these markets seem to be
providing financing to new sectors that are not adequately served by traditional markets.
Our paper contributes to different strands of the literature. First, consistent with the literature
on corporate financing mentioned in the first paragraph, our paper shows that bond issuance activity
by emerging economy firms accelerated after the Global Financial Crisis. This literature associates the
increasing corporate debt levels in emerging economies post-Global Financial Crisis with a surge in
international bond issuances and, potentially, foreign currency risk. Our paper complements that
literature by showing that domestic issuance activity by East Asian firms (the most active users of
capital markets among emerging economies) outpaced that in international markets. As a result, most
bond issuances during 2008-16, across and within firms, took place in domestic markets. These trends
hold for different criteria used in the literature to define international issuances: residence of issuing
firms, nationality of issuing firms, and currency denomination. Thus, these findings also show a greater
reliance of East Asian firms on domestic currency financing.
Second, our paper relates to research that tries to understand whether domestic and
international financial markets are substitutes or complements. The literature has argued that financial
frictions can lead to market segmentation, preventing some firms and investors to participate in
international financial markets. For instance, information asymmetries, tax treatment, fixed transaction
costs, and regulations can inhibit some firms from using certain markets and/or result in certain
investors and financial intermediaries (with specific preferences, time horizons, or abilities to diversify
risk) dominating specific markets (La Porta et al., 1997; Karolyi and Stulz, 2003; Pirinsky and Wang,
2006; Japelli and Pagano, 2008; Bekaert et al., 2011). Thus, even in an increasingly globalized world in
which financial transactions can take place anywhere, domestic intermediaries could play a meaningful

5
role for emerging economy firms. For example, a large literature finds that domestic and foreign banks
complement each other by specializing in different financial products and clients (Claessens, 2016).
But not much is known about whether domestic and international capital markets behave in a
complementary manner. Earlier studies argue that, as internationalization advances, trading activity
for large firms can shift away from domestic markets and into international markets (Claessens et al.,
2002; Levine and Schmukler, 2006), whereas others find that internationalization has no effect on
domestic markets (Karolyi, 2004). Other papers argue that internationalization might indeed
strengthen domestic capital markets, for example, by incentivizing them to become more efficient or
by enhancing transparency (Smith and Sofianos, 1997; Hargis and Ramanlal, 1998; Hargis, 2000; Moel,
2001). Research also shows that domestic and international markets complement each other by
providing different types of bonds (Gozzi et al., 2015). As firms switch across markets, the aggregate
and firm-level amount of financing, debt maturity, and currency denomination change, as witnessed
during the Global Financial Crisis and during domestic banking crises (Cortina et al., 2019). Our paper
contributes to this literature by offering evidence that relatively developed domestic capital markets
can complement international ones, expanding access to financing for smaller firms and completing
markets for relatively larger corporations.
Third, our paper adds to the literature that examines how financial development affects firms
of different sizes. Research shows that relatively smaller firms benefit more from financial
development than larger ones (Guiso et al., 2004; Beck and Dermirguc-Kunt, 2006; Cetorelli and
Strahan, 2006; Beck et al., 2008; Ayyagari et al., 2016). The rationale behind this finding is that financial
development is typically associated with a reduction in financial frictions (such as high transaction
costs, lack of information sharing, or weak enforcement institutions), which are particularly important
for small firms. In line with these arguments, our findings are consistent with the fact that more

6
developed domestic capital markets improve access to finance for smaller firms relatively more than
for larger corporations.
Fourth, our paper complements a strand of literature that analyzes aggregate trends in East
Asian financial markets. These studies find that financial markets have expanded significantly after the
Asian Financial Crisis and have become more diversified, as capital markets have grown faster than
the banking sector (Gosh, 2006; Estrada et al., 2010; Park, 2011; Mizen et al., 2012; Cline, 2015; Dekle
and Pundit, 2015; Kang et al., 2015). Nevertheless, none of these studies has distinguished the use of
domestic vis-à-vis international markets nor the number and types of issuers behind the expanding
markets.
The remainder of the paper is organized as follows. Section 2 describes the data and
methodology. Section 3 documents the growth of domestic and international equity and bond
financing by East Asian firms. Section 4 analyzes three aspects of firm financing associated with the
growth in capital markets: the extensive margin, issuer size, and financial market diversification.
Section 5 discusses the possible role of the capital market reforms implemented after the Asian
Financial Crisis and the role of SME capital markets. Section 6 concludes.
2. Data and Methodology
2.1. Data Sources and Sample
To analyze the issuance activity in East Asia, we use comprehensive, transaction-level data on equity
and corporate bonds issued in domestic and international markets over the period 1990-2016. The
data come from Thomson Reuters’ Security Data Corporation (SDC) Platinum, which provides
transaction-level information on new issuances of common and preferred equity, as well as publicly
7
and privately placed bonds.1 Because the analysis focuses on corporate financing, we exclude all public-
sector issuances, comprising issuances by national, local, and regional governments, government
agencies, regional agencies, and multilateral organizations. We also exclude mortgage-backed securities
and other asset-backed securities.
In this paper, we cover the 10 largest economies in East Asia (in terms of GDP): China, Hong
Kong SAR, Indonesia, Malaysia, the Philippines, the Republic of Korea, Singapore, Taiwan, Thailand,
and Vietnam. The data set contains 22,945 unique firms issuing in capital markets and 124,390 security
issuances, consisting of 43,196 equity issuances and 81,194 bond issuances over the sample period.
To benchmark against other regions of the world, we also analyze data from other emerging
economies (in Eastern Europe and other Asia, Latin America, and the Middle East and Africa) and
advanced economies (in North America, Western Europe, and Japan). Appendix Table 1 provides the
list of economies included in each group. We focus the analysis on three periods, 1990-98, 1999-2007,
and 2008-16, so we can compare trends before and after the Asian Financial Crisis and the Global
Financial Crisis. All values are reported in millions of constant 2011 U.S. dollars.
To account for the fact that our sample of countries is heterogenous, we focus the analysis on
the median economy. For the regressions we collapse data at the economy-industry-year level and
include economy-industry fixed effects.2 In this way, we make sure that we are not simply capturing
the trends in the largest economy (China) or in the most financially developed economies in the sample
(Hong Kong SAR, Korea, and Singapore). Instead, our results show average trends across equally-
weighted East Asian economies. For robustness, we repeated the whole analysis in the paper excluding
1 Thomson Reuters’ Security Data Corporation is one of the most widely used databases on transaction-level research. Some prominent studies such as Henderson et al. (2006), Kim and Weisbach (2008), and Bruno and Shin (2017) use the same database. An alternative transaction-level database is Dealogic, which yields similar estimates of issuance activity. 2 This level of aggregation creates an unbalanced panel over 1990-2016. Only economy-industry-year observations with reported issuance activity (of any type) are included in the analysis. We divide industries across nine main categories by using the first digit of the Standard Industrial Classification (SIC) codes: agriculture, forestry, and finishing; mining; construction; manufacturing; transportation and utilities; wholesale trade; retail trade; finance, insurance, and real state; and other services.

8
China, Hong Kong SAR, Korea, and Singapore.3 The results are qualitatively similar to the ones
reported in the paper.
We classify equity and corporate bond issuances as domestic or international using the
residence-based approach followed by the Bank of International Settlements (BIS). We compare the
location of the issuance with the residence of the issuing firm (Gruić and Wooldridge, 2012). Domestic
securities are, thus, those issued by residents in their local markets. International issuances are those
issued by residents abroad. Using this methodology, the data set includes 38,386 (71,489) equity (bond)
issuances in domestic markets and 4,810 (9,703) equity (bond) issuances in international markets.
Besides the residence-based approach, the literature uses two alternative criteria to classify
international and domestic corporate bond issuances: the nationality-based and currency-based
approaches (Gruić and Wooldridge, 2012; Shin, 2013; Avdjiev et al., 2014; McCauley et al., 2015). The
nationality-based approach considers the nationality of a firm instead of its residence. Therefore,
issuances by a subsidiary of a foreign-owned firm in the domestic market are considered international,
as the parent company resides outside the domestic market. Under the currency-based approach, debt
issuances denominated in foreign currency are considered international, and those in local currency as
domestic. Because our paper focuses on the role of domestic markets for firms located in East Asia,
we use the classification of issuances by the residence approach as our main results. But for robustness,
we also use the nationality-based and currency-based approaches to estimate the growth of domestic
vis-à-vis international bond issuances. The results are robust to using these two alternative measures.
Following the literature, we also repeated the analysis for (i) non-financial sector issuers
(residence and currency basis) and (ii) firms whose ultimate parent is a non-financial sector firm
(nationality basis). The results for non-financial firms are very similar to the ones reported in the paper.
3 Data for Korea seem to have poor coverage before 1994 because the reported data on bond issuances increases 57-fold during 1993-94. Therefore, we also repeated the whole analysis of the paper after excluding all issuance activity from Korea during 1990-93. The results are almost identical.

9
Furthermore, the main results of this paper are robust to excluding firms with some degree of
government ownership, which include stated-owned enterprises (SOEs). These firms accounted for
18 percent of the total issuance activity by East Asian firms during the sample period. The results also
hold for firms with some degree of government ownership, excluding the rest.
To compare the evolution of capital markets with bank financing, some of the analysis uses
syndicated loan data, which also come from SDC. Unlike typical bank loans, transaction-level
syndicated loans are available for all economies. Moreover, syndicated loan markets capture a sizable
share of bank financing and are the most relevant comparison to capital markets in terms of
transaction size (amount raised per issuance) and terms of financing such as debt maturity (Ivashina
and Scharfstein, 2010; Cerutti et al., 2015). The syndicated loan data include 9,606 issuing firms and
25,493 issuances. To distinguish between domestic and international (cross-border) syndicated loans,
we compare the nationality of the lead bank that arranges the deal with the residence of issuing firms.
Domestic loans are those in which only domestic banks lead the syndication, whereas international
syndicated loans entail the participation of at least one foreign bank acting as a lead arranger.
2.2. Measure of Firm Size
To study the types of firms issuing in domestic and international markets over time, we focus on size.
We follow the literature that typically uses firm size or collateral to measure financial access across
firms or over time (Beck and Dermirguc-Kunt, 2006; Beck et al., 2008; Campello and Larrain, 2016;
de la Torre et al., 2017). In addition, we are interested in size because there is evidence that, due to
large fixed costs, only large firms have access to international markets (Pagano et al., 2002; Claessens
and Schmukler, 2007).

10
The literature on firms’ issuance activity tends to study the size of issuers through balance
sheet data, using for example firm assets.4 The downside of this approach is that balance sheet data
are usually available for firms listed in stock exchanges, but not for unlisted firms that conduct
issuances. This issue is not trivial because most corporate debt issuers are unlisted (Table 1).5 We thus
use an alternative measure of size that is comparable across firms and covers the whole universe of
issuers. We proxy firm size by the average amount raised per issuance, measured over all issuances per
firm during the entire 1990-2016 period.
To make sure that the average amount raised is a good proxy for issuer size, we plot the
average amount raised and the average assets (also from SDC) for listed firms. The scatter plot shows
a high correlation between the two size variables (Appendix Figure 1, Panel A). Regressions of the log
of average assets on the log of the average amount raised per issuance yield a point estimate of 0.99,
not statistically different from one but statistically different from zero. To the extent that a similar
correlation exists for unlisted firms, the average amount raised should be a good proxy for the analysis
of issuer size.
A comparison of the firm size distribution (FSD) of listed and unlisted bond issuers illustrates
the importance of using a comprehensive and complete measure of firm size. The FSD of unlisted
bond issuers lies to the left of that of listed issuers across the bottom quantiles, indicating that the
smallest firms tapping bond markets are unlisted (Appendix Figure 1, Panel B). This confirms that if
we were to use assets to measure firm size and only cover listed firms, we would be disregarding the
smallest users of bond markets.
To check that our results on firm size are not specific to the proxy we use, we also explored
two alternative measures of firm size from Worldscope data for listed firms. In particular, we used
4 See, for example, Pagano et al. (2002), Kim and Segal (2009), Adrian et al. (2013), Didier et al. (2015), Becker and Ivashina (2014), and Bruno and Shin (2017). 5 This statement holds when considering as “listed firms” subsidiaries owned by listed parent companies.

11
total assets and net sales, taking the values reported by firms in their end-of-year balance sheets. Both
sets of results with the alternative measures are qualitatively and quantitatively similar to the ones
reported in the paper. That is, the size of listed firms issuing in capital markets, in terms of assets and
sales, follows the same trend as the size of firms based on issuance volume.
3. Capital Market Financing
3.1. The Rise of Equity and Bond Financing
Since the early 1990s, firms in East Asia have significantly increased the amount of funds raised in
capital markets. In the median East Asian economy, the average amount of capital raised per year
through equity and bonds increased by factors of 2 and 5, respectively, between the periods 1990-98
and 2008-16.
Although East Asian economies grew fast over the sample period, capital market financing
increased even faster, especially in bond markets. The amount raised in equity per year increased from
1.3 percent to 1.6 percent of GDP between the periods 1990-98 and 2008-16 (Figure 1, Panel A). The
annual amount raised in equity to GDP in East Asia was the highest among advanced and emerging
regions for every period in our sample. The amount raised through bond issuances has grown
significantly faster. The total amount raised in bonds per year increased from 1.6 percent to 4.5 percent
of GDP between 1990-98 and 2008-16. In other words, bond financing was about three times equity
financing in 2008-16, whereas in 1990-98 both values were roughly the same. The ratio of the amount
raised in bonds to GDP is also significantly larger than in other emerging economies. However, the
value still lags that in advanced economies. The patterns in capital market financing in East Asia

12
contrast with those in syndicated loan financing, where the annual amount raised as a ratio to GDP
has fallen over time.6
The expansion of capital market activity by East Asian firms is also evident when analyzing
the more widely used indicator of market capitalization (Figure 1, Panel B). Stock and corporate bond
market capitalization (as a ratio of GDP) have significantly expanded in the region since the 1990s
and, as a result, amounts outstanding have become similar to those in advanced economies. In
addition, East Asian corporate capital markets have grown relatively faster than corporate bank credit,
suggesting a trend toward more diversified financing sources. Note, however, that market
capitalization can be driven not only by growth in issuances but also by revaluation of asset prices.
3.2. Domestic vs. International Markets
To formally assess the growth in equity and bond issuance activity in East Asia and examine to what
extent domestic and international issuances have driven this growth, we estimate panel ordinary least
squares (OLS) regressions of the log (1+the annual amount raised) by each industry in each East Asian
economy during 1990-2016 on dummy variables for the periods 1999-2007 and 2008-16.7 We use the
period 1990-98 as the base, so we omit the dummy for these years. The regressions include economy-
industry fixed effects to control for differences across economies and industries that are constant over
time. We cluster standard errors at the economy-industry level, as we do for other regressions in the
paper. We estimate separate models for total, domestic, and international issuances.
The estimated coefficients imply that the total amount raised in equity and bonds by East
Asian firms at the economy-industry level has increased over time (Table 2, Panel A). In the period
2008-16, the annual amount raised per economy-industry in equity and bonds was about 180 percent
6 Although there is considerable heterogeneity in the levels of issuance activity across economies in East Asia, the reported trends tend to hold across them (Appendix Figure 2). 7 The dummies take value one for each year in the corresponding period and zero otherwise.

13
and 277 percent higher than in 1990-98, respectively. The expansion of domestic issuance activity has
been the main driver of this growth. Between the periods 1990-98 and 2008-16, the annual amount
raised domestically per economy-industry increased 187 percent in equity and 381 percent in bonds.
International issuances have also grown during the last sample period, which is consistent with the
literature, but this growth was much slower than the growth of domestic issuances. The annual amount
raised per economy-industry in international equity and bond markets increased 73 percent and 58
percent, respectively, between 1990-98 and 2008-16.
For corporate bonds, we repeat the analysis using the two alternative definitions of
international bond issuances described in the data section: by nationality of issuers and by currency
denomination (Table 2, Panel B). The estimates are fairly robust. The alternative estimates show that
domestic issuances have been the main driver of the growth in corporate bond raising activity. Our
results also indicate that the reliance on domestic currency bond financing by East Asian firms at the
economy-industry level has increased significantly over time.
As the amount issued in domestic markets grew faster than the amount issued internationally,
the share of capital market financing obtained domestically increased (Figure 2). In particular, the
share of equity raised domestically per year by the median East Asian economy increased from 85
percent of the total during 1990-98 to 97 percent during 2008-16. In bond markets, international
issuances dominated during the pre-crisis period. However, this trend reversed in the 2000s and bond
raising activity by East Asian firms now takes place predominantly in domestic markets. The share of
bond financing raised in domestic markets was 36 percent in 1990-98, 65 percent in 1999-07, and 80
percent in 2008-16.8
8 The trend of a growing share of equity and bonds raised in domestic markets tends to hold for every East Asian economy (Appendix Figure 3).
14
The patterns of equity financing in East Asia are similar to those in other regions, where equity
is also predominantly raised in domestic markets and the share of domestic equity financing has
increased over time. The evidence also suggests that domestic bond activity has grown relatively faster
than the international activity in other emerging economies. However, in contrast to East Asia, other
regions still conducted most of their bond issuances in international markets during 2008-16.
To formally show the shift in the composition from international to domestic markets in East
Asia at the economy-industry level, we estimate panel OLS regressions of the share of the total amount
raised in domestic markets per economy, industry, and year during 1990-2016 on dummy variables for
the periods 1999-2007 and 2008-2016 (Table 3, Panel A). We analyze separately equity and bonds,
including economy-industry fixed effects. In the period 1990-98, the average share of equity and bonds
raised per year in domestic markets across economy-industries was 72 percent and 21 percent,
respectively. The estimates for equity issuances imply that this share experienced no growth in 1999-
2007; but it increased to 91 percent in 2008-16. For bond issuances, the share of domestic issuances
increased to 49 percent in 1999-2007 and to 69 percent in 2008-16.
We then examine whether the switch toward domestic capital markets not only occurred
within industries but also within firms (Table 3, Panel B). Namely, we estimate panel regressions of
the share of the total raised in domestic markets per firm and year during 1990-2016 on dummy
variables for the periods 1999-2007 and 2008-2016. We estimate separate models for equity and bonds,
including firm fixed effects. In this way, we focus on within firm changes over time, disregarding the
compositional changes in the set of firms raising new capital, that is, different firms issuing in different
markets at different points in time.
A relevant issue when running regressions at the firm level is that the number of issuers varies
significantly across economies. For example, China and Korea accounted for 75 percent of the total
number of East Asian issuers during 2008-16. Thus, the estimation results could be driven by the

15
trends in those economies with relatively more issuers. We address this issue by estimating weighted
least squares (WLS) regressions. In particular, we assign each firm-year observation a weight equal to
1𝑁𝑖𝑡⁄ , with 𝑁𝑖𝑡 being the total number of issuers per economy-industry i and period t (1990-98, 1999-
2007, and 2008-16). The sum of the weights of all observations per economy, industry, and period
equals one, which means that every economy-industry has the same weight in the regressions. Using
this method, economies with relatively more issuers do not have relatively more weight and, instead,
our results show average trends across equally-weighted East Asian economies.
The regression results imply that part of the overall switch toward domestic markets occurred
within firms (Table 3, Panel B). The average share of equity issued domestically (rather than
internationally) per firm slightly increased over time, although it was already high in 1990-98. In that
period, this share was 89 percent and increased to 92 percent in 2008-16. In contrast, the average
fraction of bonds issued domestically per firm greatly increased over time. This share increased by 28
percentage points, from 39 percent in 1990-98 to 67 percent in 2008-16. For robustness, we also run
non-weighted OLS regressions. Although these regressions yield similar results to the ones reported,
the coefficient estimates are slightly smaller (Appendix Table 2). This means that the within-firm
switch from international to domestic markets was less prominent in relatively larger economies, such
as China and Korea.
4. Firms Using Capital Markets
Next, we examine three aspects through which the expansion of domestic capital markets might have
impacted firm financing: the extensive margin, issuer size, and financial market diversification.

16
4.1. Extensive Margin
The growth in the amount raised in East Asian capital markets has been accompanied by an expansion
in the extensive margin. In other words, an increasing number of firms have been using capital markets
to obtain financing over the years. In the median East Asian economy, the average number of yearly
issuers per period has more than tripled from 60 to 185 issuers between 1990-98 and 2008-16 (Figure
3, Panel A). This overall pattern holds for equity and bond markets, and contrasts with that in other
emerging and advanced economies, where the level of yearly issuers and its growth over time were
significantly lower.
A broader use of domestic rather than international markets seems to be behind the overall
increase in the number of issuing firms in East Asia. Whereas the number of international issuers did
not increase much over time, the number of domestic issuers has substantially expanded (Figure 3,
Panel B). The number of issuers per year in domestic equity and bond markets increased almost three-
fold and six-fold, respectively, between 1990-98 and 2008-16. The number of international issuers per
year increased for equity (though the level is still relatively small) and declined for bonds.
Regressions at the economy-industry level provide robust evidence of the reported growth in
the extensive margin. We estimate panel OLS regressions of the log (1+the number of issuers) per
economy, industry, and year during 1990-2016 on dummy variables for the periods 1999-2007 and
2008-16, in addition to economy-industry fixed effects. The estimates imply that, on average, the
number of yearly issuers expanded considerably within industries. In particular, the number of equity
and corporate bond issuers per year more than doubled between 1990-98 and 2008-16 (Table 4). For
equity, the number of domestic and international issuers increased over time, with the former growing

17
significantly faster. Regarding bonds, only domestic markets show a statistically significant growth in
the number of yearly issuers, fully driving the aggregate patterns within this instrument.9
4.2. Issuer Size
As the extensive margin expanded over time, smaller firms have accessed capital markets to raise funds
(Figure 4). The size of the median issuer in the median East Asian economy has consistently declined
over time within equity and corporate bond markets. Specifically, the size of the typical equity and
bond issuer declined by 60 percent and 30 percent, respectively, between 1990-98 and 2008-16. This
pattern contrasts with other emerging and advanced economies, where the median issuer size has
tended to increase over time.
Because domestic markets attract relatively smaller firms than international markets, the fall in
the size of issuers could be a consequence of the broader use of domestic markets. In particular, firms
issuing domestic equity and bonds are about 30 percent the size of those issuing international securities
(Figure 5).10 Thus, the FSD of domestic issuers is more left skewed than that of international issuers.
To formally assess the changes in issuer size over time, we estimate panel OLS regressions of
the size of equity and corporate bond issuers in East Asia during 1990-2016 on dummy variables for
the periods 1999-2007 and 2008-16. These regressions also include economy-industry fixed effects.
The dependent variable is the log of size of the median issuer per economy, industry, and year.
Therefore, we make sure that each economy-industry-year observation has the same weight in the
regression and that industries in countries with more issuing firms do not drive the results.
9 Although not reported, the intensive margin (changes in the amount raised within firms) yields a more nuanced picture. For equity, we do not find a change in the amount raised per firm, either domestically or internationally. For bonds, the amount raised per firm increased over time in both domestic and international markets. 10 We define domestic issuers as firms that issue equity or debt in domestic markets only. International issuers are firms that issue capital in international markets at least once over the sample period.

18
The estimates show that the median size of issuing firms declined in equity and bond markets
relative to the 1990-98 period (Table 5). Mirroring the overall statistics presented above, the size of
the typical issuer per economy-industry declined by around 59 percent in equity markets and by 33
percent in bond markets between 1990-98 and 2008-16. For bonds, the use of domestic markets is
clearly driving this pattern: the size of domestic issuers has fallen over time whereas the size of
international issuers, if anything, has increased. In the case of equity, the issuer size declined for both
domestic and international issuers. However, it is important to consider that international equity
issuers account for a very small fraction of the total number of equity issuers. In the last period of our
sample (2008-16), firms issuing international equity accounted for about 9 percent of the total equity
issuers in the median East Asian economy. Thus, changes in the size of domestic issuers are most
likely driving the trends in equity markets. For robustness, we run regressions using total assets of
listed firms (instead of our proxy based on issuance size), which show an even larger decline in the
size of equity and bond issuers between 1990-98 and 2008-16 (Appendix Table 3).
4.3. Financial Market Diversification
So far, the analysis has shown how an increasing number of relatively smaller firms seem to have
benefited from the development of domestic capital markets in East Asia. But we are also interested
in determining whether the larger corporations already using capital markets have benefited from this
development as well. On the one hand, these firms have access to international markets and might
not rely much on domestic capital markets. On the other hand, even if these firms use international
markets, they might still use domestic capital markets to diversify their sources of financing and
mitigate shocks in other markets.
To better understand the role of domestic capital markets in East Asia, we study how these
markets are used vis-à-vis other markets across two different dimensions: (i) the cross-sectional size

19
distribution of issuers and (ii) during normal vs. crisis periods. To do this, we compare the funding in
capital markets with that in syndicated loans markets. These types of loans pool funds from several
banks to lend large amounts of credit and are the main alternative to corporate bond financing in
terms of issuance size and debt maturity. With syndicated loans included into the sample, we have six
different markets that can be simultaneously analyzed: domestic equity, international equity, domestic
bonds, international bonds, domestic syndicated loans, and international syndicated loans.
Market access varies significantly across firm size. Whereas the relatively smaller issuers
depend almost entirely on domestic equity and bond markets, larger firms tend to use a wider set of
instruments, issued in different locations. We classify issuers into ten deciles by firm size and examine
the share of firms, per decile, issuing in different markets (Figure 6). In the first decile (the smallest
issuers), 97 percent of the firms are domestic equity and/or domestic bond issuers, whereas only 7
percent of those firms issue in other markets. Relatively larger firms also use domestic capital markets,
but they seem to raise capital across markets in a more balanced manner. For instance, 46 percent of
firms in the tenth decile (the largest firms) use domestic capital markets, 21 percent use domestic
syndicated loans, 7 percent use international equity, 17 percent use international bonds, and 34 percent
use international syndicated loans. The fact that the sum of different types issuers is close to 100
percent in the first decile means that most of the smallest issuing firms stick to only one (domestic)
market.11 Because smaller firms are typically younger, this pattern of financing across firm size is
consistent with a pecking order that suggests that firms use domestic markets first and, then, access
international and syndicated loan markets at a later stage, when they are larger.12
11 The sum of these percentages does not need to be 100 percent because some firms in each decile can issue in more than one market at the same time and thus belong to more than one group of issuers. 12 There is a very high correlation between firm size (in terms of assets) and age. Using the Worldscope data on listed East Asian firms, a 1 percent increase in age is associated with a 0.5 percent increase in size.

20
Access to various markets can be beneficial because, when the supply of funds from specific
markets declines, firms can compensate by raising more funds in less affected markets. Adrian et al.
(2013) and Becker and Ivashina (2014) provide evidence that firms in the United States switch from
syndicated loan to bond markets to withstand credit supply shocks on the banking sector. Taking a
more global perspective, Cortina et al. (2019) show how firms also switch between international and
domestic debt markets during periods of financial crises. This behavior is consistent with the view
that capital markets can act as a spare tire, providing financing when the banking sector is in crisis
(Greenspan, 1999; Levine et al., 2016).
Following this research, we study changes in debt issuance composition across markets for
East Asian firms around the 1997-98 Asian Financial Crisis and the 2008-09 Global Financial Crisis.
The spare tire function of alternative debt markets was not observed during the Asian Financial Crisis,
perhaps because domestic capital markets were not as developed then (Figure 7, Panel A). However,
a broader access to domestic markets over time seems to have allowed firms to move across different
markets during the Global Financial Crisis. As the crisis hit syndicated loan and international bond
markets, East Asian firms turned to domestic bond markets (Figure 7, Panel B). While the number of
total syndicated loan and international bond issuances declined by 20 percent and 30 percent,
respectively, during 2008-09, domestic corporate bond issuances expanded by 110 percent. Because
of this movement toward domestic bond markets, the total number of debt issuances (bonds plus
syndicated loans) did not decline. The movement toward domestic bond markets is even larger when
focusing only on those firms issuing debt in international markets before the crisis (Figure 7, Panel
C).13 These firms increased their domestic bond issuances by 150 percent, while declining issuances in
all the other markets. That is, international debt issuers, which are the relatively larger corporations,
shifted toward domestic bond markets during the Global Financial Crisis.
13 To compute this panel, we only keep firms that issued international debt at least once before 2008.

21
5. The Role of Policies
5.1. Capital Market Reforms
The observed expansion of domestic equity and bond markets in East Asia occurred while economies
in the region implemented several policies to develop their capital markets in the aftermath of the
Asian Financial Crisis. The goal of these policies was to diversify financial markets and reduce their
dependence on bank lending, which was an important factor leading to the crisis.14
To get a sense of the numerous and different types of capital market reforms implemented in
East Asia, we gather information on the policies issued by authorities in Indonesia, Korea, Malaysia,
the Philippines, and Vietnam.15 Overall, we compile 68 capital market reforms which we classify into
three categories based on their goal: (i) expansion of the investors base (e.g., allowing the entry of
foreign investors or creating new types of investors, such as pension or mutual funds), (ii)
improvement of market infrastructure (e.g., introducing new instruments or launching new
exchanges), and (iii) enhancement of investors protection (e.g., enacting new regulations or improving
corporate governance practices).
The implementation of these reforms over time does not show a clear pattern. These reforms
were not concentrated in a specific period, but instead were implemented throughout the entire period
following the Asian Financial Crisis. In addition, the different categories of reforms were not
implemented in a sequential manner. In other words, economies did not follow a path in which they
put in place reforms of a certain type first and then moved on to other types of reforms.
As a result, credibly estimating the effect of reforms on domestic capital market growth
constitutes a challenge. Because policy reforms are dispersed throughout the entire 1997-2016 period,
14 Kawai (1998), Corsetti et al. (1999), Radelet and Sachs (2000), Geithner (2007), and Park et al. (2017), among others, discuss the role of banks during the Asian Financial Crisis. 15 Appendix Tables 4 to 8 include the list of reforms in each economy for which we were able to obtain information. To compile these reforms, we received help from the World Bank Office of the Chief Economist for East Asia and Pacific and financial sector experts in the region.
22
it is not possible to establish pre- and post- reform periods and compare the trends of issuance activity
between the two. For the same reason, evaluating the impact of individual policies is difficult, because
an increase in issuance activity after a policy was implemented could be explained by other policies
implemented around the same years. Reverse causality is another potential problem. We do not know
whether issuance activity increased as a result of exogenous policies being implemented, or policy
makers reacted by introducing reforms in anticipation to an expansion in issuance activity by firms.
Although we cannot formally identify the causal impact of policy reforms in East Asia due to
the nature of the data, there seems to be a link between the implementation period of these reforms
and the rise of domestic capital markets. The security market reforms index constructed by Abiad et
al. (2010) shows improvements in capital markets after the Asian Financial Crisis, but not before. In
general, there is a strong and positive correlation between the implementation of reforms and domestic
capital market development (La Porta et al., 2000; Henry and Lorentzen, 2003; Burger and Warnock,
2012). Reforms such as the ones implemented in East Asia are usually needed for capital markets to
flourish and for firms to raise funds in those markets. It is likely that they have made capital markets
in the region more attractive to firms as well as investors and, as a result, have promoted their use.
5.2. SME Capital Markets
Our analysis so far has covered developments in the traditional capital markets in East Asia, which
only large corporates tend to use even though the size of firms has declined over time. Thus, policy
makers in the region have complemented the above-mentioned reforms with efforts to expand access
by developing alternative capital markets targeted at SMEs. These SME markets try to attract smaller
firms by, for example, reducing fees, offering less stringent listing and disclosure requirements, and
appointing advisors that help firms navigate the listing process, among other measures.

23
In most East Asian economies, SME markets were established after the Asian Financial Crisis.
For example, China established its first SME market in 2004, Hong Kong SAR in 1999, the Philippines
in 2013, Singapore in 2007, Thailand in 1999, and Vietnam in 2009. Even in those economies where
SME markets were already in place before the crisis (Korea, Malaysia, and Taiwan), policy makers
introduced new reforms in the post-crisis period. The efforts to promote SME markets were in line
with similar initiatives in other regions. For example, Argentina, Brazil, Canada, India, Nigeria, Poland,
South Africa, Turkey, and the United Kingdom, among many others, have established SME capital
markets since the 1990s. The European Union also established its own SME regional market in 2005
(WFE, 2015).
Capital markets for SMEs in East Asia are relatively large when compared to SME markets in
other regions (Figure 8, Panel A). The median SME market in East Asia has a market capitalization
equivalent to 4.2 percent of GDP, compared to 1.4 percent in advanced economies and less than 1
percent in other emerging regions. However, there is wide heterogeneity in size across East Asian
economies. The size of SME markets as a ratio of GDP ranges from 15.9 percent in Taiwan to only
0.1 percent in the Philippines (Figure 8, Panel B).
To analyze financing patterns in East Asian SME capital markets, we gather data on SME
markets in China (SME Board, ChiNext, and NEEQ), Hong Kong SAR (GEM), and Taiwan (TPEx).
We focus on these markets because they have become large relative to other SME markets in the
region and around the world. Furthermore, because we have data at the firm level, we can examine
the characteristics of issuers and compare issuers in traditional and SME markets. The SME Board
(established in 2004) and ChiNext (established in 2009) in China function as part of the Shenzhen
Stock Exchange, which along with Shanghai is one of the largest exchanges in the economy. The SME
Board is targeted at mature SMEs, whereas ChiNext is aimed at emerging start-ups, particularly high-
tech firms. Like ChiNext, NEEQ is oriented toward small, high-tech firms. This exchange, which

24
started as a pilot project in 2006 and became nationwide in 2013, operates as an independent over-
the-counter market. GEM was established in 1999 as part of the Hong Kong Stock Exchange and is
directed toward firms with high growth potential that do not satisfy the profitability or track record
requirements to be listed in the main market. In Taiwan, TPEx was created in 1994 as an independent
over-the-counter market dedicated to promoting SMEs and microenterprises as well as emerging and
high-tech industries.
The final data set contains annual data on the volume of equity issuances and the number of
equity issuers over 2004-16. We choose 2004 as the first year in our sample to adequately compare
trends in China’s SME markets with those in Hong Kong SAR and Taiwan. We omit from the analysis
the few bond issuances that occur in SME markets because they take place sparsely and only in specific
markets. In addition, we use balance sheet data for 5,914 issuing firms: 810 firms in the SME Board,
570 firms in ChiNext, 3,971 firms in NEEQ, 188 firms in GEM, and 375 firms in TPEx. Data come
from Wind Data Feed Service (Wind) and the official website of each exchange.
These data show that few firms are participating in SME markets (Table 6). The number of
issuing firms per year in the SME Board, ChiNext, and GEM is around 100, about one-third of the
number of issuers in traditional markets. The number of issuers is relatively larger in NEEQ (1,217
issuers) and TPEx (395). However, even for these two markets, the number of issuers is very small
when compared to the total universe of SMEs in China (11.7 million in 2013) and Taiwan (1.4 million
in 2016).
Whereas in some cases these markets are effectively serving SMEs, in others they are serving
rather large corporations (Table 6). The median issuer in GEM, NEEQ, and TPEx has $13 million,
$25 million, and $40 million in assets, respectively. Moreover, the median firm issuing in GEM and
NEEQ has around 100 employees, which according to standard definitions, can be classified as an

25
SME.16 On the other hand, although firms issuing in ChiNext have less assets than those in China’s
traditional markets, they are still very large corporations. With a median firm size of $124 million and
673 employees, firms accessing ChiNext are significantly above the usual thresholds to define SMEs.
With a median size of $234 million and 1,502 employees, firms accessing the SME Board tend to be
even larger than those accessing traditional markets.
Capital markets for SMEs in China, Hong Kong SAR, and Taiwan are financing different
sectors than traditional markets do (Figure 9). In traditional markets, the manufacturing sector and
the finance, insurance, and real estate sector dominate. These two sectors combined account for 71
percent, 73 percent, and 89 percent of the amount raised in the traditional markets of China, Hong
Kong SAR, and Taiwan, respectively. In SME markets, the manufacturing sector is also relevant, but
the finance, insurance, and real estate sector is significantly smaller. In turn, SME markets are
characterized by a large presence of issuers dedicated to “other services,” which together with
manufacturing are the largest sectors in terms of amounts issued. The other services sector accounts
for 48 percent of the amount raised in GEM, 33 percent in ChiNext, 32 percent in NEEQ, 16 percent
in the SME Board, and 14 percent in TPEx. This sector is mostly composed of information technology
(IT) firms, which is probably related to the fact that SME markets are particularly targeted toward
high-tech firms. In contrast to SME markets, issuance activity by firms dedicated to other services is
relatively low in traditional markets, accounting for 6 percent or less of the total amount raised.
6. Conclusions
Since the 1990s, East Asian firms have increased their issuance activity in capital markets, most
notably, in domestic markets during the 2000s. As the amount raised has grown faster domestically
16 For example, the World Bank defines SMEs as firms with fewer than 300 employees. For the Organisation for Economic
Co-operation and Development (OECD), SMEs are firms with fewer than 250 employees. In general, the threshold for a firm to be defined as an SME ranges between 100 and 500 employees across economies (Ayyagari et al., 2007).

26
than internationally, domestic markets have become the predominant place where equity and bonds
are issued and local currencies the predominant denomination of bond contracts. In addition, the
number of East Asian firms issuing in domestic markets has significantly increased over time, whereas
the number of international issuers has remained stagnant.
These findings bring new insights to the literature on corporate financing in emerging
economies. Whereas international capital markets have indeed been an important contributor to the
corporate finance boom that started in the 1990s, domestic markets have played an even more
important role in the new millennium. Although the evidence used in this paper focuses extensively
on East Asia, the region accounts for the bulk of the capital raising activity in emerging economies.
Moreover, the data indicate that domestic issuance activity has also grown relatively faster than
international activity in other emerging economies. However, the relative importance of domestic
issuances is much lower in emerging economies outside East Asia.
The significant expansion and large size of domestic capital markets in East Asia seem to
provide several benefits. We find that domestic capital markets attract more and smaller firms than
international markets. Thus, as domestic markets grew, the size of issuing firms declined and the
extensive margin expanded. In addition, domestic capital markets diversify the financing sources for
larger corporations and can act as a spare tire, helping to mitigate shocks in international markets.
Furthermore, because of the high correlation between the currency denomination of bonds and the
market of issuance, these findings imply a shift toward domestic currency financing in emerging
economies. This shift could mitigate, at least in relative terms, the existing concerns that currency risk
in the corporate sector of emerging economies has expanded in recent years (Chui et al., 2014; IMF,
2015). On the other hand, the boom in corporate bond financing over the last decade is driving the
increasing level of debt, which is growing faster than GDP. This credit growth is raising concerns
related to declines in lending standards and increasing risk taking (IMF, 2018; McKinsey, 2018).

27
Our analysis raises some relevant questions about domestic capital markets that could be
explored in future research. First, an interesting question is why domestic capital markets in East Asia
have developed so much. Domestic capital market growth in East Asia occurred while policy makers
implemented a series of capital market reforms. But identifying whether specific policy reforms helped
to jump start this process is not an easy task. East Asian economies implemented reforms of diverse
kinds over an extended period. It might be the case that no single reform was more relevant than
others. Instead, the whole reform process might have acted as a signal to the market that policy makers
were committed to developing domestic capital markets. This commitment, in turn, could have
encouraged more firms and investors to use these markets. A related question is what types of
investors are behind this development. It might be the case that as savings increased in the region and
domestic institutional investors were established, more domestic funds became available in domestic
markets. Another possibility is that, following the reforms aimed at liberalizing markets and lowering
the restrictions to foreign investors, the foreign participation in East Asian stock and bond markets
increased. In sum, further analysis on the impact of capital market reforms in East Asia is needed.
Second, the evidence presented in this paper shows that, although the expansion of domestic
capital markets seems to bring new financing to more firms over time, the direct benefits appear to
be directly accrued by relatively few firms. Most SMEs do not use capital market financing even when
SME markets are in place. Thus, it would be worth examining the reasons why SME markets seem to
fail to attract many small firms and whether these reasons lie on the supply or the demand side of
funds. Answers to these questions might provide insights on how these markets could be improved.
Alternative instruments, such as securitization or mini-bonds, might be more effective at promoting
capital market financing for SMEs.
Third, even if only relatively few firms use domestic capital markets, their actions can produce
positive spillovers for non-issuing firms. For example, as more firms turn to capital markets for funds,

28
the demand for bank financing from these firms might drop, freeing funds that can be channeled
toward other (arguably smaller) corporations. Moreover, there is evidence that firms issuing in capital
markets can act as financial intermediaries, raising funds at low interest rates in these markets and then
on-lending the proceeds at higher rates, perhaps “crowding in” smaller firms (Caballero et al., 2016;
Bruno and Shin, 2017). It would be useful to examine to what extent these spillovers to non-issuers
and smaller firms are present.

29
References
Abiad A., E. Detragiache, and T. Tressel. 2010. “A New Dataset on Financial Reforms.” IMF Staff
Papers, 57 (2): 281-302.
Acharya, V., S. G. Cecchetti, J. De Gregorio, S. Kalemli-Özcan, P. R. Lane, and U. Panizza. 2015.
Corporate Debt in Emerging Economies: A Threat to Financial Stability? Brookings Institution.
Adrian, T., P. Colla, and H. S. Shin. 2013. “Which Financial Frictions? Parsing Evidence from the
Financial Crisis of 2007-09.” NBER Macroeconomics Annual, 27 (1): 159-214.
Avdjiev, S., M. Chui, and H. S. Shin. 2014. “Non-financial Corporations from Emerging Market
Economies and Capital Flows.” BIS Quarterly Review, December, Bank for International
Settlements.
Ayyagari, M., T. Beck, and A. Demirguc-Kunt. 2007. “Small and Medium Enterprises Across the
Globe.” Small Business Economics, 29 (4): 415-34.
Ayyagari, M., P. F. Juarros, M. S. Martinez Peria, and S. Singh. 2016. “Access to Finance and Job
Growth: Firm-level Evidence across Developing Countries.” Policy Research Working Paper
7604, World Bank.
Bekaert, G., C. R. Harvey, C. T. Lundblad, and S. Siegel. 2011. “What Segments Equity Markets?”
Review of Financial Studies, 24 (12): 3842-90.
Beck T., and A. Demirguc-Kunt. 2006. “Small and Medium-size Enterprises: Access to Finance as a
Growth Constraint.” Journal of Banking and Finance, 30 (11): 2931-43.
Beck T., A. Demirguc-Kunt, L. Laeven, and R. Levine. 2008. “Finance, Firm Size, and Growth.”
Journal of Money, Credit and Banking, 40 (7): 1379-1405.
Becker, B., and V. Ivashina. 2014. “Cyclicality of Credit Supply: Firm-level Evidence.” Journal of
Monetary Economics, 62 (C): 76-93.
Bruno, V., and H. S. Shin. 2017. “Global Dollar Credit and Carry Trades: A Firm-level Analysis.”
Review of Financial Studies, 30 (3): 703-49.
Burger, J., F. Warnock, and V. Warnock. 2012. “Emerging Local Currency Bond Markets.” Financial
Analysts Journal, 68 (4): 73-93.
Caballero, J., U. Panizza, and A. Powell. 2016. “The Second Wave of Global Liquidity: Why Are Firms
Acting Like Financial Intermediaries?” IDB Working Paper 641, Inter-American
Development Bank.
Campello M., and M. Larrain. 2016. “Enlarging the Contracting Space: Collateral Menus, Access to
Credit, and Economic Activity.” Review of Financial Studies, 29 (2): 349-83.
Cerutti, E., G. Hale, and C. Minoiu. 2015. “Financial Crises and the Composition of Cross-Border
Lending.” Journal of International Money and Finance, 52 (C): 60-81.
Cetorelli, N., and P. E. Strahan. 2006. “Finance as a Barrier to Entry: Bank Competition and Industry
Structure in Local U.S. Markets.” Journal of Finance, 61 (1): 437-61.
Chang, R., A. Fernandez, and A. Gulan. 2017. “Bond Finance, Bank Credit, and Aggregate
Fluctuations in an Open Economy.” Journal of Monetary Economics, 85 (C): 90-109.

30
Chui, M., I. Fender, and V. Sushko. 2014. “Risks Related to EME Corporate Balance Sheets: The Role
of Leverage and Currency Mismatch.” BIS Quarterly Review, September, Bank for International
Settlements.
Claessens, S. 2016. “Global Banking: Recent Developments and Insights from Research.” Review of
Finance, 21 (4): 1513-55.
Claessens, S., D. Klingebiel, and S. L. Schmukler. 2002. “The Future of Stock Exchanges in Emerging
Economies: Evolution and Prospects.” In R. E. Litan and R. Herring (eds.), Brookings-
Wharton Papers on Financial Services, 167-202, Brookings Institution.
Claessens, S., and S. L. Schmukler. 2007. “International Financial Integration through Equity Markets:
Which Firms from Which Countries Go Global?” Journal of International Money and Finance, 26
(5): 788-813.
Cline, W. R. 2015. “The Financial Sector and Growth in Emerging Asian Economies.” Working Paper
Series WP15-5, Peterson Institute for International Economics.
Corsetti, G., P. Pesenti, and N. Roubini. 1999. “What Caused the Asian Currency and Financial
Crisis?” Japan and the World Economy, 11 (3): 305-73.
Cortina, J. J., T. Didier, and S. L. Schmukler. 2019. “Global Corporate Borrowing during Crises: The
Effects of Switching across Markets.” Mimeo. Previous version available as CEPR Discussion
Paper DP13008.
Dekle, R., and M. Pundit. 2015. “The Recent Convergence of Financial Development in Asia.” ADB
Economics Working Paper Series 440, Asian Development Bank.
de la Torre, A., Gozzi, J. C., and S. L. Schmukler. 2017. Innovative Experiences in Access to Finance: Market
Friendly Roles for the Visible Hand? Latin American Development Forum, World Bank.
Didier, T., R. Levine, and S. L. Schmukler. 2015. “Capital Market Financing, Firm Growth, and Firm
Size Distribution.” Policy Research Working Paper 7353, World Bank.
Doidge, C., G. A. Karolyi, and R. M. Stulz. 2013. “The U.S. Left Behind? Financial Globalization and
the Rise of IPOs Outside the U.S.” Journal of Financial Economics, 110 (30): 546-73.
Estrada, G., D. Park, and A. Ramayandi. 2010. “Financial Development and Economic Growth in
Developing Asia.” ADB Economics Working Paper Series 233, Asian Development Bank.
Geithner, T. 2007. “Reflections on the Asian Financial Crisis.” Speech at the Trends in Asian Financial
Sectors Conference, June, Federal Reserve Bank of San Francisco.
Gosh, S. R. 2006. East Asian Finance: The Road to Robust Markets. World Bank.
Gozzi, J. C., R. Levine, and S. L. Schmukler. 2010. “Patterns of International Capital Raisings.” Journal
of International Economics, 8 (1): 45-57.
Gozzi, J. C., R. Levine, M. S. Martinez Peria, and S. L. Schmukler. 2015. “How Firms Use Corporate
Bond Markets under Financial Globalization.” Journal of Banking and Finance, 58 (C): 532-55.
Greenspan, A. 1999. “Do Efficient Financial Markets Mitigate Financial Crises?” Financial Markets
Conference of the Federal Reserve Bank of Atlanta, October.
Gruić, B., and P. Wooldridge. 2012. “Enhancements to the BIS Debt Securities Statistics.” BIS
Quarterly Review, December, Bank of International Settlements.

31
Guiso, L., P. Sapienza, and L. Zingales. 2004. “Does Local Financial Development Matter?” Quarterly
Journal of Economics, 119 (3): 929-69.
Hargis, K. 2000. “International Cross-Listing and Stock Market Development in Emerging
Economies.” International Review of Economics and Finance, 9 (2): 101-22.
Hargis, K., and P. Ramanlal. 1998. “When Does Internationalization Enhance the Development of
Domestic Stock Markets?” Journal of Financial Intermediation, 7 (3): 263-92.
Henderson, B. J., N. Jegadeesh, and M. S. Weisbach. 2006. “World Markets for Raising New Capital.” Journal of Financial Economics, 82 (1): 63-101.
Henry, P. B., and P. L. Lorentzen. 2003. “Domestic Capital Market Reform and Access to Global
Finance: Making Markets Work.” In R. E. Litan, M. Pomerleano, and V. Sundararajan (eds.),
The Future of Domestic Capital Markets in Developing Countries, 179-214, Brookings
Institution.
IMF. 2015. “Corporate Leverage in Emerging Markets - A Concern?” In IMF Global Financial
Stability Report October 2015 - Vulnerabilities, Legacies, and Policy Challenges: Risks
Rotating to Emerging Markets, 83-114, International Monetary Fund.
IMF. 2018. “The Riskiness of Credit Allocation: A Source of Financial Vulnerability?” In IMF Global
Financial Stability Report April 2018 - A Bumpy Road Ahead? 57-92, International Monetary
Fund.
Ivashina, V., and D. Scharfstein. 2010. “Bank Lending during the Financial Crisis of 2008.” Journal of
Financial Economics, 97 (1): 319-38.
Japelli, T., and M. Pagano. 2008. “Financial Market Integration under EMU.” European Economy
Economic Papers 312, European Commission.
Kang, H., P. Jeasakul, and C. H. Lim. 2015. “A Bird’s-Eye View of Finance in Asia.” In R. Sahay, J.
Schiff, C. H. Lim, C. Sumi, and J. Walsh (eds.), The Future of Asian Finance, 9-37,
International Monetary Fund.
Karolyi, G. A. 2004. “The Role of American Depositary Receipts in the Development of Emerging
Equity Markets.” Review of Economics and Statistics, 86 (3): 670-90.
Karolyi, G. A., and R. M. Stulz. 2003. “Are Financial Assets Priced Locally or Globally?” In G. M.
Constantinides, M. Harris, and R. M. Stulz (eds.), Handbook of the Economics of Finance,
975-1020, Elsevier.
Kawai, M. 1998. “The East Asian Currency: Causes and Lessons.” Contemporary Economic Policy, 16 (2):
157-72.
Kim, W., and M. Weisbach. 2008. “Motivations for Public Equity Offers: An International
Perspective.” Journal of Financial Economics, 87 (2): 281-307.
King, M., and D. Segal. 2009. “The Long-Term Effects of Cross-Listing, Investor Recognition, and
Ownership Structure on Valuation.” Review of Financial Studies, 22 (6): 2393-421.
La Porta, R., F. Lopez-De-Silanes, A. Shleifer, A., and R. W. Vishny. 1997. “Legal Determinants of
External Finance.” Journal of Finance, 52(3): 1131-50.
La Porta, R., F. Lopez-De-Silanes, A. Shleifer, A., and R. W. Vishny. 2000. “Investor Protection and
Corporate Governance.” Journal of Financial Economics, 58 (1-2): 3-27.

32
Levine, R., C. Lin, and W. Xie. 2016. “Spare Tire? Stock Markets, Banking Crises, and Economic
Recoveries.” Journal of Financial Economics, 120 (1): 81-101.
Levine, R., and S. L. Schmukler. 2006. “Internationalization and Stock Market Liquidity.” Review of
Finance, 10 (1): 153-87.
McCauley, R., P. McGuire, and V. Sushko. 2015. “Global Dollar Credit: Links to US Monetary Policy
and Leverage.” Economic Policy, 30 (82): 187-229.
McKinsey. 2018. “Rising Corporate Debt. Peril or Promise?” Discussion Paper. McKinsey Global
Institute.
Mizen, P., F. Packer, E. Remolona, and S. Tsoukas. 2012. “Why Do Firms Issue Abroad? Lessons
from Onshore and Offshore Corporate Bond Finance in Asian Emerging Markets.” Working
Paper 401, Bank for International Settlements.
Moel. 2001. “The Role of American Depositary Receipts in the Development of Emerging Markets.”
Economia, 2 (1): 209-74.
Pagano, M., A. A. Röell, and J. Zechner. 2002. “The Geography of Equity Listing: Why Do Companies
List Abroad?” Journal of Finance, 57 (6): 2651-94.
Park, C. Y. 2011. “Asian Financial System: Development and Challenges.” ADB Economics Working
Paper Series 285, Asian Development Bank.
Park, C. Y., J. Lee, J. Villafuerte, and P. Rosenkranz. 2017. “20 Years After the Asian Financial Crisis:
Lessons Learned and Future Challenges.” ADB Briefs 85, Asian Development Bank.
Pirinsky, C., and Q. Wang. 2006. “Does Corporate Headquarters Location Matter for Stock Returns?”
Journal of Finance, 61 (4): 1991-2015.
Radelet, S., and J. Sachs. 2000. “The Onset of the East Asian Financial Crisis.” In P. Krugman (ed.),
Currency Crises, 105-153, University of Chicago Press.
Shin, H. S. 2013. “The Second Phase of Global Liquidity and its Impact on Emerging Economies.”
Proceedings, issue November, 1-10, Federal Reserve Bank of San Francisco.
Smith, K. and G. Sofianos. 1997. “The Impact of an NYSE Listing on the Global Trading of Non-
US Stocks.” NYSE Working Paper, New York Stock Exchange.
Turner, P. 2014. “The Global Long-Term Interest Rate, Financial Risks and Policy Choices in EMEs.”
BIS Working Papers 441, Bank for International Settlements.
WFE. 2015. WFE Report on SME Exchanges. World Federation of Exchanges.

This figure shows the evolution of capital markets and banks over 1990-2016. Panel A shows, for the median
economy in each region and period, the amount of equity, corporate bonds, and syndicated loans raised per year as a
percentage of GDP. Panel B shows, for the median economy in each region and period, the average size of financial
markets as a percentage of GDP. In Panel B, “equity” refers to stock market capitalization, “corporate bonds” to the
amount outstanding of domestic private bonds, and “banks” to the amount oustanding of private credit granted by
domestic banks. The market capitalization data come from the World Bank Financial Development and Structure
Dataset (version June 2017).
Figure 1. Growth in Equity and Corporate Bond Financing
A. Total Amount Raised
B. Market Capitalization
0%
20%
40%
60%
80%
100%
120%
1990-1
998
1999-2
007
2008-2
016
1990-1
998
1999-2
007
2008-2
016
1990-1
998
1999-2
007
2008-2
016
1990-1
998
1999-2
007
2008-2
016
1990-1
998
1999-2
007
2008-2
016
East Asia Eastern Europe andother Asia
Latin America the Middle East andAfrica
Advanced economies
Sh
are
of
GD
P
0%
2%
4%
6%
8%
10%
1990-1
998
1999-2
007
2008-2
016
1990-1
998
1999-2
007
2008-2
016
1990-1
998
1999-2
007
2008-2
016
1990-1
998
1999-2
007
2008-2
016
1990-1
998
1999-2
007
2008-2
016
East Asia Eastern Europe andother Asia
Latin America the Middle East andAfrica
Advanced economies
Sh
are
of
GD
P
Equity Corporate bonds Banks
Equity Corporate bonds Syndicated loans

Figure 2. Share of Domestic and International Issuances
A. East Asia
B. Emerging Economies
C. Advanced Economies
This figure shows, for the median economy in each region and period, the share of the total amount raised per year in domestic
and international markets. Domestic issuances are those conducted by firms in their home economy. International issuances are
those conducted by firms outside their home economy.
85% 87%97%
36%
65%80%
16% 10% 3%
61%
31%19%
0%
10%
20%
30%
40%
50%
60%
70%
80%
90%
100%
1990-1
998
1999-2
007
2008-2
016
1990-1
998
1999-2
007
2008-2
016
Equity Corporate bonds
Sh
are
of
the
tota
l ra
ised
69%80%
94%
4%17%
31%20%
6%
100% 96%83%
0%
10%
20%
30%
40%
50%
60%
70%
80%
90%
100%
1990-1
998
1999-2
007
2008-2
016
1990-1
998
1999-2
007
2008-2
016
Equity Corporate bonds
Sh
are
of
the
tota
l ra
ised
81%88%
95%
46%
10%
32%
19%12%
5%
54%
90%
68%
0%
10%
20%
30%
40%
50%
60%
70%
80%
90%
100%
1990-1
998
1999-2
007
2008-2
016
1990-1
998
1999-2
007
2008-2
016
Equity Corporate bonds
Sh
are
of
the
tota
l ra
ised
Domestic markets International markets

Figure 3. Number of Issuing Firms
A. Number of Issuing Firms
B. Number of Issuing Firms in East Asia: Domestic and International Markets
This figure shows the growth in the number of issuing firms over 1990-2016. Panel A shows, for the median economy in each region and
period, the average number of firms issuing equity and/or corporate bonds per year. Panel B shows, for the median East Asian economy in
each period, the average number of firms issuing equity and corporate bonds per year in domestic and international markets.
60
137
185
3 8 13 58 63 71
0
20
40
60
80
100
120
140
160
180
200
1990-1
998
1999-2
007
2008-2
016
1990-1
998
1999-2
007
2008-2
016
1990-1
998
1999-2
007
2008-2
016
East Asia Emerging economies Advanced economies
Num
ber
of
firm
s
35
95 104
13
34
69
1
3 10
14
9
12
0
20
40
60
80
100
120
1990-1
998
1999-2
007
2008-2
016
1990-1
998
1999-2
007
2008-2
016
Equity Corporate bonds
Num
ber
of
firm
s
Domestic markets International markets

Figure 4. Size of Issuing Firms
This figure shows, for the median economy in each region and period, the size of the median firm issuing equity and
corporate bonds. Firm size is measured as the average amount raised per issuance over the whole sample period, 1990-
2016. Values are reported in millions of constant 2011 U.S. dollars (USD).
0
50
100
150
200
250
1990-1
998
1999-2
007
2008-2
016
1990-1
998
1999-2
007
2008-2
016
1990-1
998
1999-2
007
2008-2
016
East Asia Emerging economies Advanced economies
Mill
ion
USD
Equity Corporate bonds

Domestic International Domestic International
$16 $59 $32 $95
Figure 5. Firm Size Distribution: Domestic and International Issuers
A. Equity Issuers
B. Corporate Bond Issuers
Corporate bond marketEquity market
C. Median Firm Size per Market (Million USD)
This figure compares the size of East Asian firms issuing in domestic and international markets. Panels A and B
show the firm size distribution of domestic and international equity and corporate bond issuers. Densities are
estimated using the Epanechnikov kernel function. Panel C shows, for the median East Asian economy, the size
of the median firm issuing in domestic and international markets. Firm size is measured as the average amount
raised per issuance over the whole sample period, 1990-2016. Firm size values are reported in millions of
constant 2011 U.S. dollars (USD).

Figure 6. Use of Different Markets by Firm Size
This figure shows the share of East Asian firms issuing in different markets: domestic equity, domestic bonds, domestic syndicated loans,
international equity, international bonds, and international syndicated loans. Issuing firms are classified into ten deciles according to their size. The
first decile contains the smallest issuers and the tenth decile the largest issuers. Firm size is measured as the average amount raised per issuance over
the whole sample period, 1990-2016.
0%
10%
20%
30%
40%
50%
60%
70%
1st 2nd 3rd 4th 5th 6th 7th 8th 9th 10th
Sh
are
of
tota
l is
suin
g fi
rms
per
dec
ile
Domestic equity Domestic bonds Domestic syndicated loans International equity International bonds International syndicated loans
Firm decile

Figure 7. Issuance Activity during Crises
A. Asian Financial Crisis B. Global Financial Crisis C. Global Financial Crisis, International Issuers
This figure shows the percent change in the number of corporate bond and syndicated loan issuances by East Asian firms in domestic and international markets around
the Asian Financial Crisis (1997-98) and the Global Financial Crisis (2008-09). Issuance data are aggregated in two-year periods around the Asian Financial Crisis (1995-
96, 1997-98, 1999-2000) and the Global Financial Crisis (2006-2007, 2008-09, 2010-11). Panel A and Panel B use data on all issuers around crises. Panel C only keeps
firms that issued international debt at least once before 2008.
-90%
-60%
-30%
0%
30%
60%
90%
120%
150%
1995-1996 1997-1998 1999-2000
Per
cen
t ch
ange
issu
ance
s
-90%
-60%
-30%
0%
30%
60%
90%
120%
150%
2006-2007 2008-2009 2010-2011Per
cen
t ch
ange
iss
uan
ces
Domestic bonds International bonds Domestic syndicated loans International syndicated loans Total debt
-90%
-60%
-30%
0%
30%
60%
90%
120%
150%
2006-2007 2008-2009 2010-2011Per
cen
t ch
ange
issu
ance
s

Figure 8. Size of SME Capital Markets
A. Market Capitalization in Selected Regions
B. Market Capitalization in East Asian Economies
This figure shows the size of SME markets in different regions. Panel A shows the market capitalization as a
ratio of GDP for the median SME market in each region. Eastern Europe and other Asia includes BSE
SME (India), SME Emerge (India), Innovations and Investment Market (Russian Fed.), and Second
National Market (Turkey). Latin America includes Pyme Board (Argentina) and Bovespa Mais (Brazil).
Middle East and Africa includes NILEX (Egypt), Development Market and Growth Market (Morocco),
Nigerian Stock Exchange (Nigeria), Alternative Exchange (South Africa), Development Capital Market
(South Africa), and Venture Capital Market (South Africa). Advanced economies include TSX Venture
(Canada), Emerging Companies Market (Cyprus), Entry Standard (Germany), ATHEX Alternative Market
(Greece), Enterprise Securities Market (Ireland), Euro MTF (Luxembourg), JASDAQ (Japan), Mothers
(Japan), First North (Norway), Oslo Axess (Norway), MAB Expansion (Spain), AIM (United Kingdom), and
NYSE MKT (United States). East Asia includes the SME markets listed in Panel B, which in turn shows
each market capitalization as a ratio of GDP. Data are at year-end 2016 or latest available. The market
capitalization data come from the own exchanges and the World Federation of Exchanges (WFE).
4.2%
0.08% 0.02% 0.02%
1.4%
0%
1%
2%
3%
4%
5%
East Asia Eastern Europe andother Asia
Latin America the Middle East andAfrica
Advanced economies
Sh
are
of
GD
P
0.1% 0.2% 0.7%1.4% 1.6%
2.9%
5.5%
7.1%
11.8%12.5%
13.3%
15.9%
0%
3%
6%
9%
12%
15%
18%
Sh
are
of
GD
P

Figure 9. Amount Raised by Sector: Traditional vs. SME Capital Markets
A. Traditional Markets
B. SME Markets
This figure shows, for each market, the share of the total equity raised by each sector during 2004-16. Only data on IPO issuances are
included for TPEx. Other services include: business services, hotels, health services, legal services, and repair services, among other
professional services. Other sectors include: agriculture, forestry, and fishing; construction; mining; and wholesale and retail.
44%
22%
61%
27%
51%
28%10% 9%
6%
5% 6%
3%14% 13%
3%
0%
10%
20%
30%
40%
50%
60%
70%
80%
90%
100%
China Hong Kong SAR Taiwan
Sh
are
of
the
tota
l eq
uit
y ra
ised
54% 56%
29%
13%
80%
6%
2%
24%
18%
1%
3%1%
4%
4%
1%
16%33%
32%
48%
14%21%
8%12%
17%
4%
0%
10%
20%
30%
40%
50%
60%
70%
80%
90%
100%
SME Board ChiNext NEEQ GEM TPEx
China Hong Kong SAR Taiwan
Sh
are
of
the
tota
l eq
uit
y ra
ised
Manufacturing Finance, insurance, and real estate Transportation and utilities Other services Other sectors

Type of issuer Total % Listed Total % Listed Total % Listed
Domestic equity 12,000 100% 38,386 100% $2,465 100%
International equity 1,860 100% 4,810 100% $770 100%
Total equity 13,860 100% 43,196 100% $3,236 100%
Type of issuer Total % Listed Total % Listed Total % Listed
Domestic corporate bonds 10,861 35% 71,489 46% $6,595 43%
International corporate bonds 2,223 55% 9,703 42% $1,451 49%
Total corporate bonds 13,084 38% 81,194 45% $8,046 44%
Type of issuer Total % Listed Total % Listed Total % Listed
Domestic syndicated loans 3,933 14% 10,112 32% $1,355 26%
International syndicated loans 5,653 26% 15,316 38% $2,705 36%
Total syndicated loans 9,606 21% 25,493 36% $4,075 33%
Number of issuances
Table 1. Summary Statistics
Amount raised
B. Corporate Bonds
This table shows the total number of firms, number of issuances, and amount raised per market in East Asia during 1990-2016, as well as
the percentages that correspond to listed firms. The latter are those that appear listed in public stock exchanges at least once during the
sample period. Unlisted firms are the rest of the firms. Amount raised values are reported in billions of constant 2011 U.S. dollars (USD).
Number of firms Number of issuances
A. Equity
Amount raised
C. Syndicated Loans
Amount raised
(billion USD)
(billion USD)
(billion USD)
Number of firms Number of issuances
Number of firms

Type of instrument:
Base period: 1990-98
Period 1999-07 0.58 *** 0.48 *** 0.64 *** 1.18 *** 2.03 *** -0.08
[0.16] [0.17] [0.18] [0.19] [0.22] [0.18]
Period 2008-16 1.80 *** 1.87 *** 0.73 *** 2.77 *** 3.81 *** 0.58 **
[0.16] [0.15] [0.25] [0.28] [0.31] [0.25]
Economy-industry FE Yes Yes Yes Yes Yes Yes
No. of observations 2,079 2,079 2,079 2,079 2,079 2,079
No. of clusters 90 90 90 90 90 90
R-squared 0.58 0.55 0.50 0.60 0.61 0.54
Alternative definition:
Base period: 1990-98
Period 1999-07 0.23 1.68 *** -0.79 *** 1.18 *** 2.05 *** -0.10
[0.14] [0.24] [0.26] [0.19] [0.21] [0.19]
Period 2008-16 1.25 *** 3.13 *** -0.24 2.77 *** 3.73 *** 0.78 ***
[0.18] [0.29] [0.29] [0.28] [0.30] [0.25]
Economy-industry FE Yes Yes Yes Yes Yes Yes
No. of observations 1,429 1,429 1,429 2,079 2,079 2,079
No. of clusters 85 85 85 90 90 90
R-squared 0.69 0.59 0.52 0.60 0.60 0.54
International
A. Equity and Corporate Bonds
Total Domestic International
Dependent variable: log (1+amount raised) per economy, industry, and year
B. Corporate Bonds: Alternative Definitions of International Issuances
This table shows OLS (ordinary least squares) regressions of the log of (1+amount raised) through equity and bonds per East
Asian economy, industry, and year during 1990-2016 on two period dummies (1998-2007 and 2008-16). The regressions estimate
total, domestic, and international issuances separately. Panel A classifies domestic and international equity and bond issuances by
the residence of the issuing firm. Panel B classifies domestic and international bond issuances by (i) the nationality of the issuing
firm (parent company) and (ii) the currency denomination of the issuance. The regressions include economy-industry fixed effects
(FE). Standard errors are reported in brackets and are clustered at the economy-industry level. *, **, and *** indicate statistical
significance at the 10%, 5%, and 1% levels, respectively.
Table 2. Issuance Activity
Equity Corporate bonds
Dependent variable: log (1+amount raised) per economy, industry, and year
Total Domestic International Total Domestic International
Nationality of issuer Currency denomination
Total Domestic
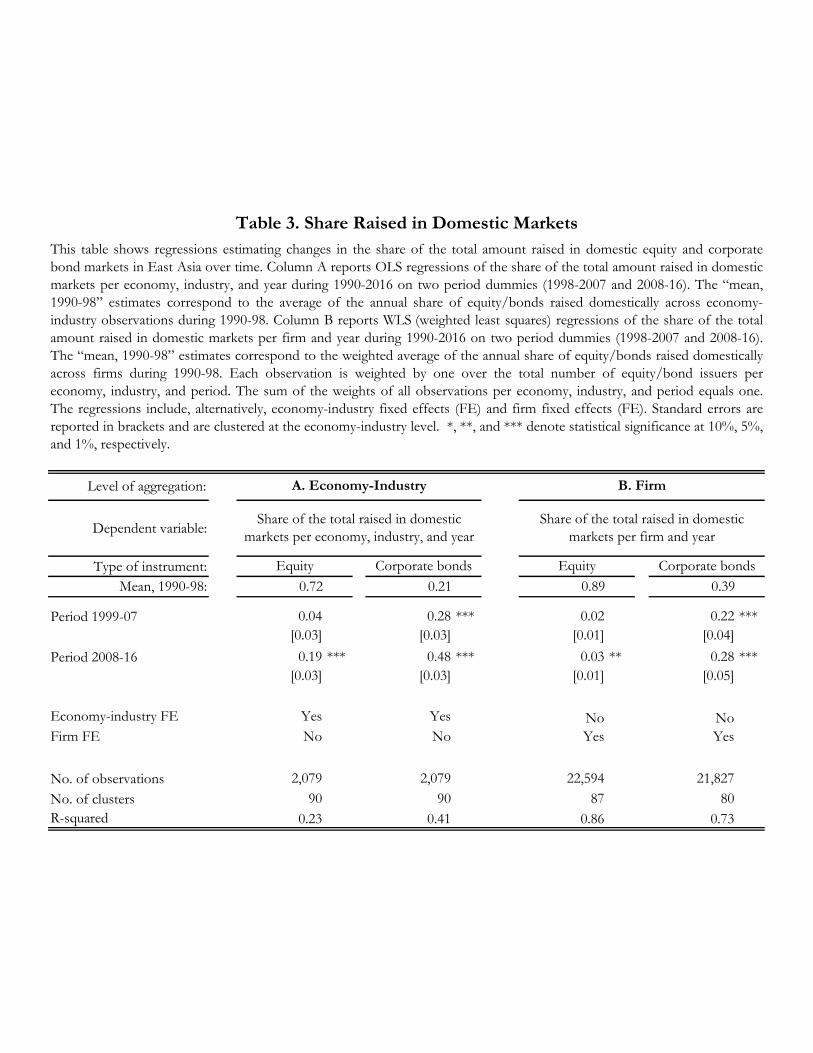
Level of aggregation:
Dependent variable:
Type of instrument:
Mean, 1990-98: 0.72 0.21 0.89 0.39
Period 1999-07 0.04 0.28 *** 0.02 0.22 ***
[0.03] [0.03] [0.01] [0.04]
Period 2008-16 0.19 *** 0.48 *** 0.03 ** 0.28 ***
[0.03] [0.03] [0.01] [0.05]
Economy-industry FE Yes Yes No No
Firm FE No No Yes Yes
No. of observations 2,079 2,079 22,594 21,827
No. of clusters 90 90 87 80
R-squared 0.23 0.41 0.86 0.73
Table 3. Share Raised in Domestic Markets
A. Economy-Industry B. Firm
Share of the total raised in domestic
markets per economy, industry, and year
Share of the total raised in domestic
markets per firm and year
Equity Corporate bonds Equity Corporate bonds
This table shows regressions estimating changes in the share of the total amount raised in domestic equity and corporate
bond markets in East Asia over time. Column A reports OLS regressions of the share of the total amount raised in domestic
markets per economy, industry, and year during 1990-2016 on two period dummies (1998-2007 and 2008-16). The “mean,
1990-98” estimates correspond to the average of the annual share of equity/bonds raised domestically across economy-
industry observations during 1990-98. Column B reports WLS (weighted least squares) regressions of the share of the total
amount raised in domestic markets per firm and year during 1990-2016 on two period dummies (1998-2007 and 2008-16).
The “mean, 1990-98” estimates correspond to the weighted average of the annual share of equity/bonds raised domestically
across firms during 1990-98. Each observation is weighted by one over the total number of equity/bond issuers per
economy, industry, and period. The sum of the weights of all observations per economy, industry, and period equals one.
The regressions include, alternatively, economy-industry fixed effects (FE) and firm fixed effects (FE). Standard errors are
reported in brackets and are clustered at the economy-industry level. *, **, and *** denote statistical significance at 10%, 5%,
and 1%, respectively.

Type of instrument:
Base period: 1990-98
Period 1999-07 0.51 *** 0.47 *** 0.19 *** 0.34 *** 0.53 *** -0.06
[0.08] [0.09] [0.05] [0.06] [0.07] [0.05]
Period 2008-16 1.06 *** 1.02 *** 0.35 *** 1.03 *** 1.25 *** 0.11 *
[0.09] [0.09] [0.09] [0.11] [0.13] [0.06]
Economy-industry FE Yes Yes Yes Yes Yes Yes
No. of observations 2,079 2,079 2,079 2,079 2,079 2,079
No. of clusters 90 90 90 90 90 90
R-squared 0.71 0.69 0.59 0.68 0.64 0.65
Table 4. Extensive Margin: Number of Firms Issuing
International
Dependent variable: log (1+number of issuers) per economy, industry, and year
Equity Corporate bonds
Total Domestic International Total Domestic
This table shows OLS regressions of the log of (1+the number of issuers) in equity and corporate bond markets per East Asian
economy, industry, and year during 1990-2016 on two period dummies (1998-2007 and 2008-16). The regressions estimate total,
domestic, and international issuers separately. The regressions include economy-industry fixed effects (FE). Standard errors are
reported in brackets and are clustered at the economy-industry level. *, **, and *** indicate statistical significance at the 10%, 5%,
and 1% levels, respectively.

Type of instrument:
Base period: 1990-98
Period 1999-07 -0.43 *** -0.44 *** -0.18 0.06 0.03 0.23 *
[0.09] [0.09] [0.23] [0.10] [0.11] [0.12]
Period 2008-16 -0.59 *** -0.56 *** -0.70 *** -0.33 *** -0.30 *** 0.14
[0.11] [0.11] [0.25] [0.12] [0.11] [0.15]
Economy-industry FE Yes Yes Yes Yes Yes Yes
No. of observations 253 252 175 246 234 217
No. of clusters 88 88 70 88 87 80
R-squared 0.86 0.84 0.71 0.80 0.79 0.69
Table 5. Size of Equity and Corporate Bond Issuers
Dependent variable: size (in logs) of the median issuing firm per economy, industry, and period
Equity Corporate bonds
Total Domestic International Total Domestic International
This table shows OLS regressions of the size of East Asian equity and corporate bond issuers during 1990-2016 on two period
dummies (1999-07 and 2008-16). The dependent variable is the median issuer size (in logs) per economy, industry, and period.
Firm size is measured as the average amount raised per issuance over the whole sample period, 1990-2016. The regressions include
economy-industry fixed effects (FE). Standard errors are reported in brackets and are clustered at the economy-industry level. *, **,
and *** denote statistical significance at 10%, 5%, and 1%, respectively.

Traditional markets
China 317 72,095 214 1,359
Hong Kong SAR 362 61,763 116 643
Taiwan 158 5,945 68 448
SME markets
SME Board (China) 124 18,355 238 1,502
ChiNext (China) 116 12,070 124 673
NEEQ (China) 1,217 10,169 13 135
GEM (Hong Kong SAR) 101 1,094 25 104
TPEx (Taiwan) 395 655 40 n/a
Table 6. Traditional vs. SME Capital Markets
Market
Number of
firms issuing
per year
Amount raised
per year
(million USD)
Assets of
issuing firms
(million USD)
Number of
employees of
issuing firms
This table shows indicators on equity issuers in traditional and SME capital markets in China, Hong Kong
SAR, and Taiwan. Assets and the number of employees of issuing firms correspond to the median equity
issuer. Firm-level data are averages across all years per firm. Values for the traditional markets, SME Board,
GEM, and TPEx are for the period 2004-16. Values for ChiNext are for the period 2009-16 and values for
NEEQ are for the period 2013-16. Only data on IPO issuances are included for TPEx. Amount raised and
asset values are reported in millions of constant 2011 U.S. dollars (USD).
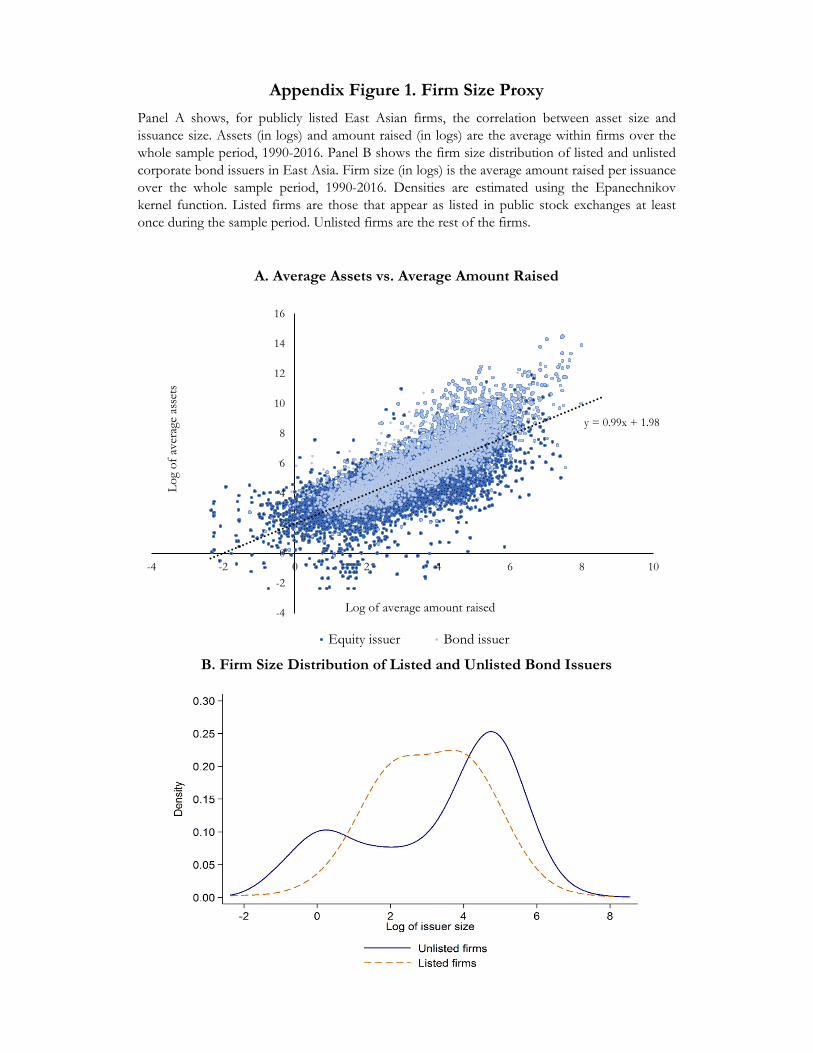
Appendix Figure 1. Firm Size Proxy
Panel A shows, for publicly listed East Asian firms, the correlation between asset size and
issuance size. Assets (in logs) and amount raised (in logs) are the average within firms over the
whole sample period, 1990-2016. Panel B shows the firm size distribution of listed and unlisted
corporate bond issuers in East Asia. Firm size (in logs) is the average amount raised per issuance
over the whole sample period, 1990-2016. Densities are estimated using the Epanechnikov
kernel function. Listed firms are those that appear as listed in public stock exchanges at least
once during the sample period. Unlisted firms are the rest of the firms.
A. Average Assets vs. Average Amount Raised
B. Firm Size Distribution of Listed and Unlisted Bond Issuers
y = 0.99x + 1.98
-4
-2
0
2
4
6
8
10
12
14
16
-4 -2 0 2 4 6 8 10
Lo
g o
f av
erag
e as
sets
Log of average amount raised
Equity issuer Bond issuer

This figure shows the evolution of capital markets and banks over 1990-2016. Panel A shows, for each East Asian economy and
period, the amount of equity, corporate bonds, and syndicated loans raised per year as a percentage of GDP. Panel B shows, for
each East Asian economy and period, the average size of financial markets as a percentage of GDP. In Panel B, “equity” refers
to stock market capitalization, “corporate bonds” to the amount outstanding of domestic private bonds, and “banks” to the
oustanding amount of private credit granted by domestic banks. The market capitalization data come from the World Bank
Financial Development and Structure Dataset (version June 2017).
Appendix Figure 2. Growth in Equity and Bond Financing: East Asian Economies
A. Total Amount Raised
B. Market Capitalization
0%
50%
100%
150%
200%
250%
300%
1990-1
998
1999-2
007
2008-2
016
1990-1
998
1999-2
007
2008-2
016
1990-1
998
1999-2
007
2008-2
016
1990-1
998
1999-2
007
2008-2
016
1990-1
998
1999-2
007
2008-2
016
1990-1
998
1999-2
007
2008-2
016
1990-1
998
1999-2
007
2008-2
016
1990-1
998
1999-2
007
2008-2
016
China Hong KongSAR
Indonesia Korea Malaysia Philippines Singapore Thailand
Sh
are
of
GD
P
502% 1014%
0%
2%
4%
6%
8%
10%
12%
14%
16%
18%
20%
1990-1
998
1999-2
007
2008-2
016
1990-1
998
1999-2
007
2008-2
016
1990-1
998
1999-2
007
2008-2
016
1990-1
998
1999-2
007
2008-2
016
1990-1
998
1999-2
007
2008-2
016
1990-1
998
1999-2
007
2008-2
016
1990-1
998
1999-2
007
2008-2
016
1990-1
998
1999-2
007
2008-2
016
1990-1
998
1999-2
007
2008-2
016
1990-1
998
1999-2
007
2008-2
016
China Hong KongSAR
Indonesia Korea Malaysia Philippines Singapore Taiwan Thailand Vietnam
Sh
are
of
GD
P
31%
050100150200250300Equity Corporate bonds Banks
0%20%Equity Corporate bonds Syndicated loans

Appendix Figure 3. Share of Domestic and International Issuances: East Asian Economies
A. Equity
B. Corporate Bonds
This figure shows, for each East Asian economy and period, the share of the total amount raised per year in domestic and international markets. Domestic issuances are those
conducted by firms in their home economy. International issuances are those conducted by firms outside their home economy.
0%
10%
20%
30%
40%
50%
60%
70%
80%
90%
100%
1990-1
998
1999-2
007
2008-2
016
1990-1
998
1999-2
007
2008-2
016
1990-1
998
1999-2
007
2008-2
016
1990-1
998
1999-2
007
2008-2
016
1990-1
998
1999-2
007
2008-2
016
1990-1
998
1999-2
007
2008-2
016
1990-1
998
1999-2
007
2008-2
016
1990-1
998
1999-2
007
2008-2
016
1990-1
998
1999-2
007
2008-2
016
1990-1
998
1999-2
007
2008-2
016
China Hong KongSAR
Indonesia Korea Malaysia Philippines Singapore Taiwan Thailand Vietnam
Sh
are
of
the
tota
l ra
ised
Domestic markets International markets
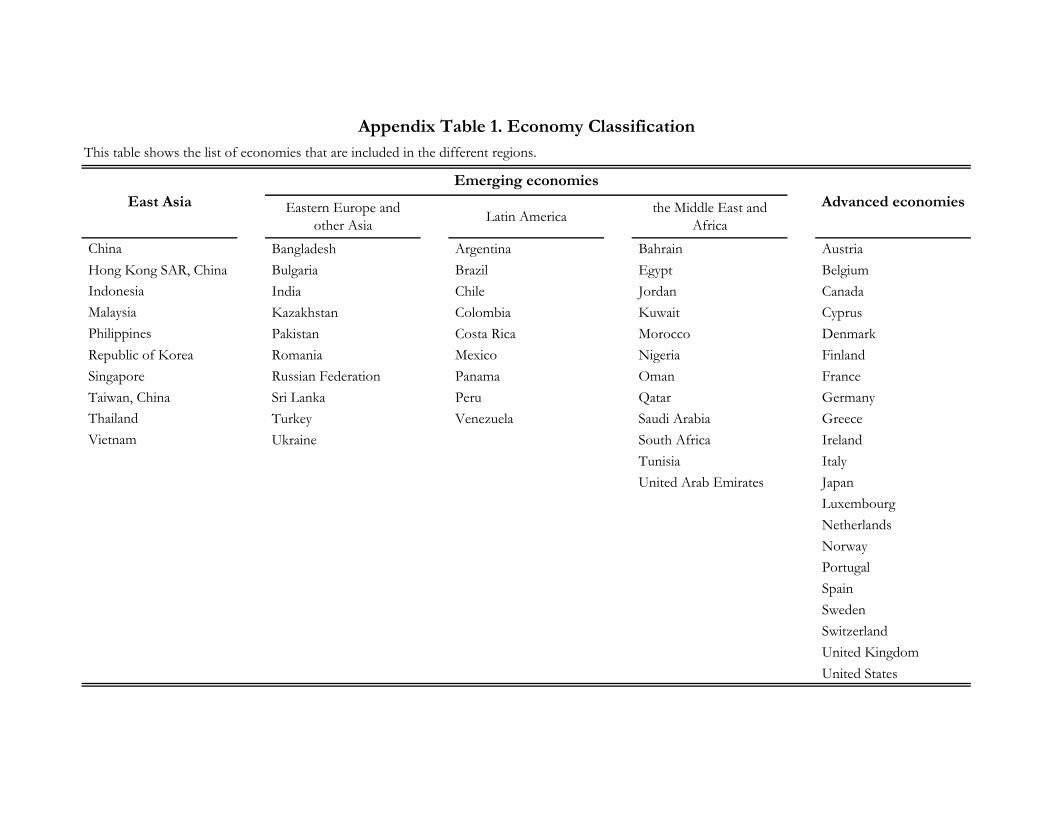
Eastern Europe and
other AsiaLatin America
the Middle East and
Africa
China Bangladesh Argentina Bahrain Austria
Hong Kong SAR, China Bulgaria Brazil Egypt Belgium
Indonesia India Chile Jordan Canada
Malaysia Kazakhstan Colombia Kuwait Cyprus
Philippines Pakistan Costa Rica Morocco Denmark
Republic of Korea Romania Mexico Nigeria Finland
Singapore Russian Federation Panama Oman France
Taiwan, China Sri Lanka Peru Qatar Germany
Thailand Turkey Venezuela Saudi Arabia Greece
Vietnam Ukraine South Africa Ireland
Tunisia Italy
United Arab Emirates Japan
Luxembourg
Netherlands
Norway
Portugal
Spain
Sweden
Switzerland
United Kingdom
United States
Appendix Table 1. Economy Classification
This table shows the list of economies that are included in the different regions.
Emerging economies
Advanced economiesEast Asia

Dependent variable:
Type of instrument:
Period 1999-07 0.02 ** 0.11 **[0.01] [0.05]
Period 2008-16 0.02 ** 0.17 ***[0.01] [0.06]
Firm FE Yes Yes
No. of observations 22,594 21,827No. of clusters 87 80R-squared 0.87 0.69
Appendix Table 2. Share Raised in Domestic Markets
Share of the total raised in
domestic markets per firm and year
Equity Corporate bonds
This table shows OLS regressions of the share of the total amount raised in
domestic markets per East Asian firm and year during 1990-2016 on two
period dummies (1998-2007 and 2008-16). The regressions include firm
fixed effects (FE). Standard errors are reported in brackets and are
clustered at the economy-industry level. *, **, and *** denote statistical
significance at 10%, 5%, and 1%, respectively.
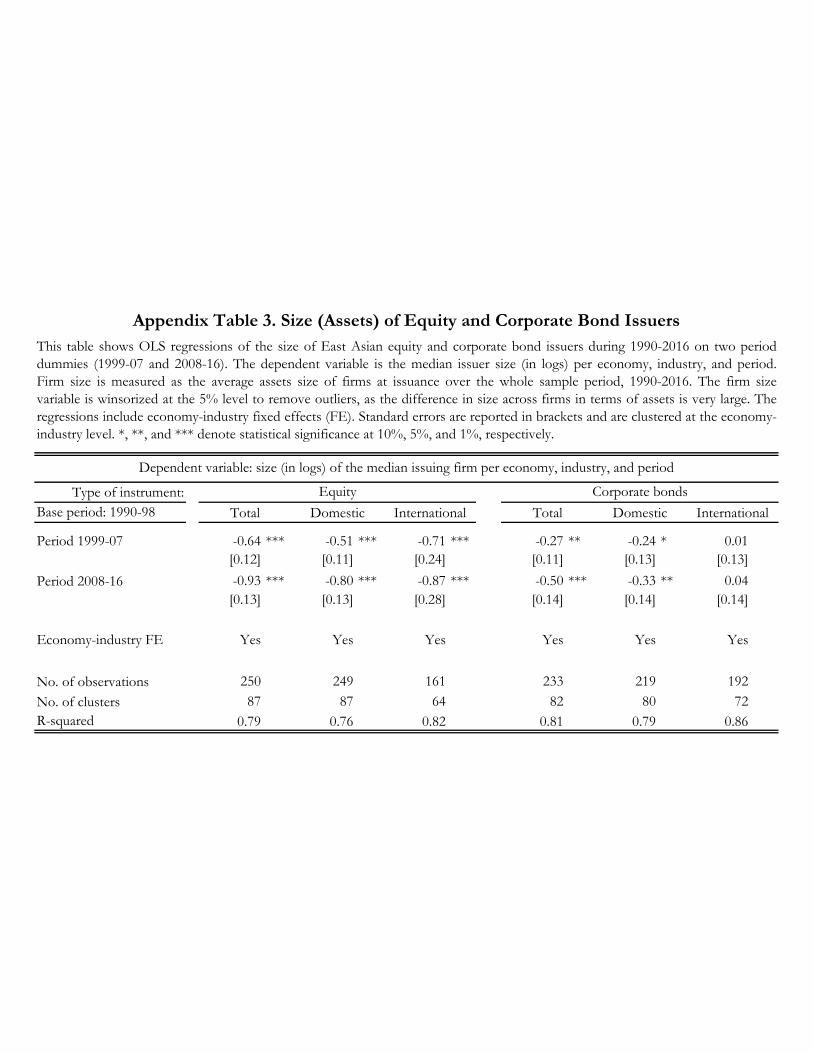
Type of instrument:
Base period: 1990-98
Period 1999-07 -0.64 *** -0.51 *** -0.71 *** -0.27 ** -0.24 * 0.01
[0.12] [0.11] [0.24] [0.11] [0.13] [0.13]
Period 2008-16 -0.93 *** -0.80 *** -0.87 *** -0.50 *** -0.33 ** 0.04
[0.13] [0.13] [0.28] [0.14] [0.14] [0.14]
Economy-industry FE Yes Yes Yes Yes Yes Yes
No. of observations 250 249 161 233 219 192
No. of clusters 87 87 64 82 80 72
R-squared 0.79 0.76 0.82 0.81 0.79 0.86
International
Appendix Table 3. Size (Assets) of Equity and Corporate Bond Issuers
This table shows OLS regressions of the size of East Asian equity and corporate bond issuers during 1990-2016 on two period
dummies (1999-07 and 2008-16). The dependent variable is the median issuer size (in logs) per economy, industry, and period.
Firm size is measured as the average assets size of firms at issuance over the whole sample period, 1990-2016. The firm size
variable is winsorized at the 5% level to remove outliers, as the difference in size across firms in terms of assets is very large. The
regressions include economy-industry fixed effects (FE). Standard errors are reported in brackets and are clustered at the economy-
industry level. *, **, and *** denote statistical significance at 10%, 5%, and 1%, respectively.
Dependent variable: size (in logs) of the median issuing firm per economy, industry, and period
Equity Corporate bonds
Total Domestic International Total Domestic

Expansion of
investor base
Improvement of
market
infrastructure
Enhancement of
investor
protection
1997 ✓ Revocation of stock purchase limit by foreign investors
1997 ✓ Regulation of assets-backed securities
2006 ✓ Regulation of existing sharia capital market
2007 ✓ Merge of Jakarta Stock Exchange and Surabaya Stock Exchange
2008 ✓ Establishment of Indonesia Bond Pricing Agency
2011 ✓ Enactment of law on Financial Services Authority (OJK)
2012 ✓ Establishment of OJK
2013 ✓ Development of capital market data warehouse system
2013 ✓ Enactment of regulation to facilitate share buybacks under fluctuating market conditions
2013 ✓ Facilitatation of settlement of transactions using custodian banks
2013 ✓ Launch of investor protection fund
2013 ✓ Establishment of single investor identity
2014 ✓ Implementation of new lot sizes and price fractions
2014 ✓ Enactment of OJK regulation on sustainable public offering
2014 ✓ Launch of roadmap to good corporate governance for issuers and public companies
2015 ✓ Regulation of exchange-traded funds
2015 ✓ New regulation of the sharia capital market
2015 ✓ Launch of issuers reporting system through extensible business reporting language
2016 ✓ Launch of electronic licensing and registration system
2016 ✓ Launch of integrated investment management system
2016 ✓ Establishment of Indonesia securities financing
2016 ✓ Launch of investor alert portal
Appendix Table 4. Capital Market Reforms - Indonesia
Year
Type of policy
Policy description
This table shows the capital market reforms in Indonesia since the 1997-98 Asian Financial Crisis. To compile these reforms we received help from the World Bank Office of the Chief
Economist for East Asia and Pacific and financial sector experts in the region.

Expansion of
investor base
Improvement of
market
infrastructure
Enhancement of
investor
protection
1998 ✓ Elimination of restrictions on investments by foreign investors
1998 ✓ Introduction of mutual funds
1998 ✓ Introduction of asset-backed securities
1998 ✓ Enhancement of corporate governance practices
1999 ✓ Introduction of mark-to-market system
2000 ✓ Approval of inter-dealer brokers to act as intermediares
2004 ✓ Enactment of Indirect Investment Asset Management Business Act
2005 ✓ Introduction of retirement pension system
2005 ✓ Launch of Korea Exchange (KRX)
2007 ✓ Enactment of Financial Investment Services and Capital Markets Act
2012 ✓ Launch of Korean hedge funds
2012 ✓ Removal of limit on corporate bond issuances amounts
2015 ✓Adoption of individual savings account (ISA), allowing individuals to invest in
various financial products through a single account
Appendix Table 5. Capital Market Reforms - Korea
Year
Type of policy
Policy description
This table shows the capital market reforms in Korea since the 1997-98 Asian Financial Crisis. To compile these reforms we received help from the World Bank Office of
the Chief Economist for East Asia and Pacific and financial sector experts in the region.

Expansion of
investor base
Improvement of
market
infrastructure
Enhancement of
investor
protection
2000 ✓ Release of Malaysian code on corporate governance
2003 ✓ Streamline of IPO approval process
2003 ✓ Standarization of lot sizes
2003 ✓ Demutualistion of Kuala Lumpur Stock Exchange (KLSE)
2004 ✓ Enactment of revised guidelines on the offering of private debt securities
2004 ✓ Immediate approval of bond issues for selected issuers
2004 ✓ Enhancement of corporate disclosure
2006 ✓ Facilitatation of foreign-owned firms listings on domestic markets
2007 ✓ Enhancement of corporate governance provisions
2007 ✓ Enactment of Capital Markets and Services Act 2007
2008 ✓ Introduction of greenshoe mechanism
2009 ✓ Reduction of cost of regulatory compliance
2009 ✓ Establishment of credit guarantees for lower-rated firms issuing bonds
2009 ✓ Comprehensive revamp of Malaysia exchange structure
2012 ✓ Introduction of retail investors to corporate bond market
Appendix Table 6. Capital Market Reforms - Malaysia
Year
Type of policy
Policy description
This table shows the capital market reforms in Malaysia since the 1997-98 Asian Financial Crisis. To compile these reforms we received help from the World Bank Office of the
Chief Economist for East Asia and Pacific and financial sector experts in the region.

Expansion of
investor base
Improvement of
market
infrastructure
Enhancement of
investor
protection
1998 ✓ Provision of self-regulatory organization status to the Philippine Stock Exchange (PSE)
2000 ✓ Enactment of securities regulation code
2002 ✓ Issuance of circulars promulgating the code of corporate governance
2004 ✓ Obligation of compliance with international financial reporting standards (IFRS)
2006 ✓ Introduction of bond exchange/swaps
2007 ✓ Introduction of corporate securities in Philippine Dealing and Exchange (PDeX) trading board
2008 ✓ Enactment of Personal Equity and Retirement Account (PERA) Law
2008 ✓ Authorization of corporate bond trading for public through accredited brokers on PDeX
2008 ✓ Removal of documentary stamp taxes on securities trading
2010 ✓ Enactment of regulation requiring listed companies to maintain a ten percent public float
2013 ✓ Enactment of rules and regulations on exchange-traded funds
2015 ✓ Implementation of rules and regulations of the securities regulation code
2016 ✓ Approval of public-private partnership (PPP) listing rules
2016 ✓ Launch of corporate governance code for publicly listed companies
Appendix Table 7. Capital Market Reforms - Philippines
Year
Type of policy
Policy description
This table shows the capital market reforms in the Philippines since the 1997-98 Asian Financial Crisis. To compile these reforms we received help from the World Bank Office of the Chief Economist
for East Asia and Pacific and financial sector experts in the region.

Expansion of
investor base
Improvement of
market
infrastructure
Enhancement of
investor
protection
2000 ✓ Launch of Ho Chi Minh City Stock Exchange (HOSE)
2005 ✓ Launch of Hanoi Stock Exchange (HNX)
2006 ✓ Authorization of domestic bond issuances for companies
2007 ✓ Enactment of Securities Law
Appendix Table 8. Capital Market Reforms - Vietnam
Year
Type of policy
Policy description
This table shows the capital market reforms in Vietnam since the 1997-98 Asian Financial Crisis. To compile these reforms we received help from the World Bank Office
of the Chief Economist for East Asia and Pacific and financial sector experts in the region.