The Rise and Fall of Big - Energy...
10
BY STEVE HUNTOON The alternatives may make more sense The Rise and Fall of Transmission Big 32 PUBLIC UTILITIES FORTNIGHTLY SEPTEMBER 2015 www.fortnightly.com
-
Upload
duongkhanh -
Category
Documents
-
view
215 -
download
0
Transcript of The Rise and Fall of Big - Energy...
By Steve Huntoon
The alternatives may make more sense
The Rise and Fall
of
TransmissionBig
32 Public utilities Fortnightly September 2015 www.fortnightly.com

September 2015 Public utilities Fortnightly 33www.fortnightly.com
Steve Huntoon is the principal of Energy Counsel, LLP, www.energy-counsel.com. Mr. Huntoon is a former President of the Energy Bar Association, and for over 30 years of practice in energy regulatory law he has advised and represented such companies and institutions as Dynegy, PECO Energy (now part of Exelon), Florida Power & Light (NextEra Energy), ISO New England, Entergy, PacifiCorp, Williston Basin (MDU Resources), and Conectiv (PHI).
t was heady stuff back then: Big lines and arrows sweeping across the country, depicting massive new transmission projects. But after 10 years of dramatic announcements and proposals, the reality today is that Big Transmission1 has fallen and it won’t be getting up – not even for the Clean Power Plan.
And a second reality is this: The fall of Big Transmission is not a public policy failure. Rather, as I’ll show below, Big Transmission never did make sense.
Instead, the experience so far points to a continuation of what we’re doing now – to more of the incremental trans-mission expansions that have characterized the last ten years – and not to count on Big Transmission as a solution to any future industry challenge.
memorandum of understand-ing “… to expedite and simplify building of transmission lines on Federal lands.” And two years after that the Obama Administra-tion, with the same nine agencies
formed the “Rapid Response Team for Transmission,” which selected seven high-priority projects to move fast.3
The initial driver for all this was the Northeast Blackout and the ensuing calls for up to $100 billion in new transmis-sion investment.4 Back then the need was for delivery of new coal-fired generation (e.g., Project Mountaineer5). Then it was delivery of wind generation (e.g., Clean Line). And most recently, today, it is the anticipated impact of EPA’s Clean Power Plan. Yet none of these drivers can hope to push Big Transmission forward, as we’ll see.
The FallToday, ten years after PJM unveiled Project Mountaineer and others followed with proposals just as ambitious, no Big Transmis-sion project has been built, or has begun construction, or has won approval to be built in the future. PJM has approved $25.6 billion in new transmission – but not a dollar for Big Transmission.6
The RisePJM kicked things off ten years ago, wowing a conference at the Federal Energy Regulatory Commission (FERC) with the announcement of “Project Mountaineer”: four enormous transmission lines running from western West Virginia to northern New Jersey (see Figure 1). Three years later, in 2008, FERC presented to Congress its idea for a massive new 765-kV transmission system (Figure 2).
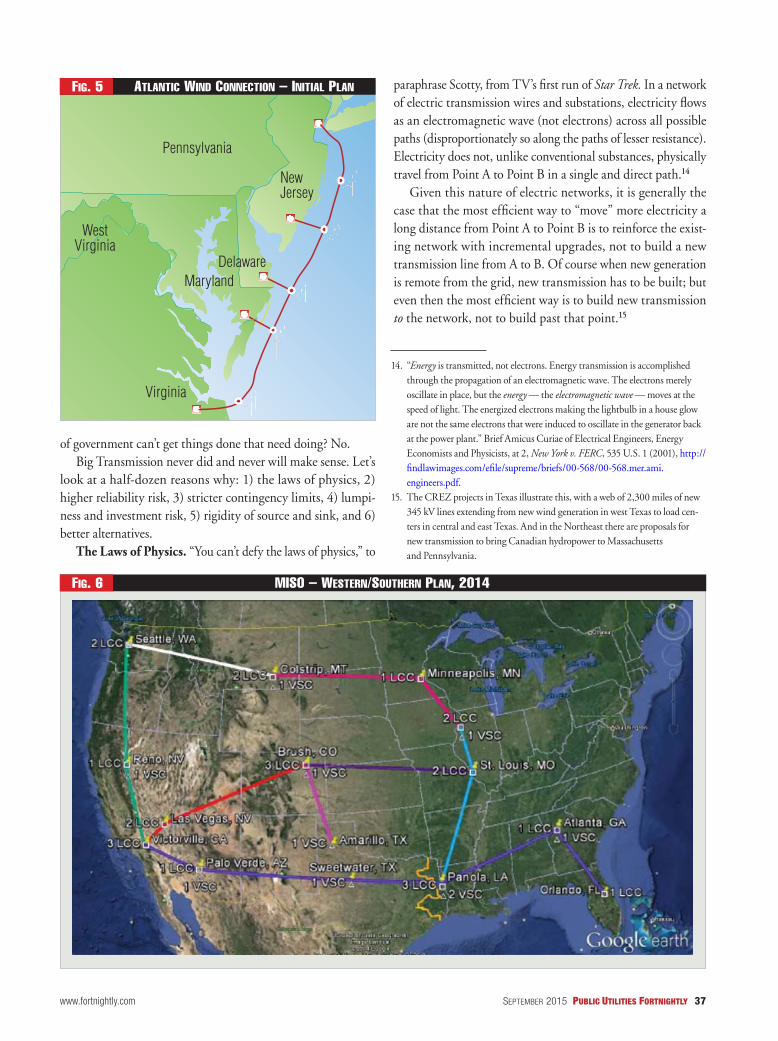
The Midcontinent Independent System Operator (“MISO”) then followed with its own proposal for massive transmission lines to the East (Figure 3). Independent transmission developers soon joined in, with the most well-known, Clean Line Energy, propos-ing huge projects crisscrossing the country (Figure 4). Atlantic Wind Connection proposed a 350-mile off-shore project running from southern Virginia to northern New Jersey (Figure 5).
Not wanting to miss the boat, virtually every major utility created its own transmission company or partnered with another utility to form a joint venture.2
In October 2009 some nine federal agencies agreed to a
IThe biggest projects are going nowhere.
1. Big Transmission means high-voltage long transmission lines, which for purposes of this article is defined as at least 500 kV and at least 250 miles. This definition is admittedly arbitrary. 500 kV is one threshold for “regional”transmission facilities, such as in PJM where “Regional Facilities” are defined as those 500 kV and above (and double-circuit 345 kV facilities which have roughly the same capability as single-circuit 500 kV facilities). 250 miles would cover a significant portion of an average region. If the definition of Big Transmission were relaxed to say 200 miles then the One Nevada Transmission Line of 500 kV and 231 miles would qualify as Big Transmission (and be the one Big Transmission project actually built).
2. As examples of the latter, American Electric Power and Great Plains Energyformed Transource Energy, and Duke Energy and American Transmission Co. formed Duke American Transmission Co.
3. White House, “Obama Administration Announces Job-Creating Grid Modernization Pilot Projects,” October 5, 2011, https://www.whitehouse.gov/administration/eop/ceq/Press_Releases/October_5_2011.
4. The conventional wisdom asserting such a need was refuted in a November 2003 Fortnightly article “Myth of the Transmission Deficit,” co-authored bythis writer and A. Metzner.
5. The three queued projects shown on the Project Mountaineer map [Figure 1]comprised 3,600 MW of proposed coal-fired generation. The last of these projects was withdrawn from the PJM queue on December 1, 2011.
6. PJM 2014 Regional Transmission Expansion Plan, Executive Summary, page3 (“Since 1999, the PJM Board has approved transmission system enhance-ments totaling nearly $25.6 billion to ensure compliance with NERC and regional planning criteria.”), http://pjm.com/~/media/documents/reports/2014-rtep/2014-rtep-book-1.ashx. The largest new transmission lines in PJM have been the Trans-Allegheny Interstate Line (“TrAIL”) and the Susquehanna-Roseland project, neither of which would qualify as Big Trans-mission. The TrAIL project was 180 miles of 500 kV line almost exclusively in/along existing right-of-way. The Susquehanna-Roseland project was 157 miles of 500 kV line exclusively in/along existing right-of-way.
© Can Stock Photo Inc. / akulam
atiau

34 Public utilities Fortnightly September 2015 www.fortnightly.com
approvals to proceed, and the basic business model remains theoretical. Atlantic Wind Connection downsized to an off-shore line from southern to northern New Jersey, first with wind (Figure 7), and then without wind as off-shore wind lost favor in New Jersey (Figure 8).9
As for the high-priority projects of the Administration’s Rapid Response Team for Transmission, the four Big Transmission projects are, as a general matter, going nowhere fast.10
In summary, the last ten years have seen various drivers for Big Transmission, and its fall nonetheless. Can EPA’s Clean Power Plan, the latest must-have need, somehow resurrect Big Transmission? No.
9. The rebranding of AWC is covered here, http://www.eenews.net/climatewire/stories/1059998047. As it recounts, the Fishermen’s Energy off-shore wind project was rejected for mandatory utility purchase by the New Jersey Board of Public Utilities (“NJ BPU”). A recent court decision by the Appellate Divi-sion of New Jersey’s Superior Court upheld that NJ BPU decision, http://www.eenews.net/climatewire/2015/06/01/stories/1060019373.
10. See, for example, the status of the projects posted on the “ETrans Federal Per-mitting Transmission Tracking System,” http://trackingsystem.nisc-llc.com/etrans/utility/Search.seam.
MISO has approved $20.2 billion in new transmission – but not a dollar for Big Transmission.7 The Southwest Power Pool has approved $8.8 billion in new transmission – but not one dollar for Big Transmission.8
PJM’s Project Mountaineer is long dead. MISO’s concept for Big Transmission reversed course – now pointing West and South (Figure 6), instead of going from West to East, as first proposed – but with no sign of traction in any direction.
No Clean Line project has obtained the necessary regulatory
7. MISO Transmission Expansion Plan 2014, Executive Summary, page 4 (“…there are currently $20.2 billion of approved and pending projects in various stages of design, construction, or already in-service”), https://www.misoen-ergy.org/Library/Repository/Study/MTEP/MTEP14/MTEP14%20Execu-tive%20Summary.pdf. The largest built or approved new transmission lines in MISO are the potential Great Northern Transmission Line of 220 miles and 500 kV from Manitoba into Minnesota (which is far from certain to be built) and various 345 kV projects.
8. SPP 101, slide 17 (“More than $8.8 billion in transmission grid upgrades wereplanned and approved in the 2000-14 planning cycles,” http://www.spp.org/publications/Intro_to_SPP_APR%202015.pdf. The largest transmission projects in SPP have been four double circuit 345 kV projects in southern Kansas and northern Oklahoma.
PJM – ProJect Mountaineer, 2005Fig. 1
Major transmission corridors
– Queued project– N41– N42– N43
Proposed corridors
345 kV
500 kV
765 kV

September 2015 Public utilities Fortnightly 35www.fortnightly.com
Ferc (WellinghoFF) – caPitol hill BrieFing, 2008Fig. 2
MiSo – eaStern Plan, 2009Fig. 3
Composite wind resource map
Transmission linesVoltage (kV)
Source: POWERmap, powermap.plants.com. ©2007 Platts, a division of the McGraw-Hill Companies.
345-499500-699700-7991000 (DC)
The remaining states use data from the 1987 “Wind Energy Atlas of the United States.”
Existing 765 kVNew 765 kVAC-DC-AC link
Scenario 1 Transmission lines (kV)
230 (1)345 (47)400 (13)500 (22)765 (61)800 (32)

36 Public utilities Fortnightly September 2015 www.fortnightly.com
the wrong question. The lesson of the last ten years is that incremental expansion, not Big Transmission, is the right way to build out the grid.
The InquestSo if Big Transmission has fallen should that suggest a failure of public policy? Has Big Transmission fallen because our system
posed%20Clean%20Power%20Plan%20-%20Phase%20I.pdf (page 40). NERC also says “… a reconductoring of a rural 100 mile, 230 kV transmis-sion line average[es] 81 months, or just under seven years.” Id. But the recon-ductoring and rebuild of the Mount Storm-Doubs 100 mile, 500 kV line in PJM was completed in less than four years (October 2010 to May 2014). http://pjm.com/planning/rtep-upgrades-status/backbone-status/mount-storm-doubs.aspx. NERC’s study also carries an implicit assumption that changes in power flows will require additional transmission, citing for exam-ple that PJM East is projected under CPP to change from being a net importer to being a net exporter of 5,167 MW (“CPP State” scenario). Id. at 26-27. Why that would require more transmission capability is unexplained. The same transmission system that supports capacity deliverability of 7,883 MW from PJM West to PJM East today (the “Capacity Emergency Transfer Limit” in PJM’s Reliability Pricing Model) would be available to support power flow in the other direction if such a need arose.
A recent study from ICF International pegs the cost of incremental transmission needed for the Clean Power Plan at a relatively small $1.5-2.5 billion nationwide.11 The Brattle Group similarly concluded that planned transmission and transmission planning are adequate.12 And though a recent study from the North American Electric Reliability Corporation (“NERC”) paints a somewhat different picture, saying that “[i]t can take up to 15 years to build a new 500-kV line from planning to energization,”13 the NERC study is answering
11. ICF International, “Clean Power Plan Transmission Investments: It’s Not How Much, It’s How Soon,” April 2015, http://www.icfi.com/insights/white-papers/2015/clean-power-plan-transmission-investments.
12. Brattle Group, “EPA’s Clean Power Plan and Reliability,” February 2015 (“Transmission planning processes are adequate due to the significant build out expected regardless of CPP standards,” page vi). http://www.brattle.com/system/publications/pdfs/000/005/121/original/EPAs_Clean_Power_Plan_and_Reliability_-_Assessing_NERC’s_Initial_Reliability_Review.pdf?1427375637.
13. North American Electric Reliability Corporation, “Potential Reliability Impacts of EPA’s Proposed Clean Power Plan – Phase I,” April 2015, http://www.nerc.com/pa/RAPA/ra/Reliability%20Assessments%20DL/Poten-tial%20Reliability%20Impacts%20of%20EPA%E2%80%99s%20Pro-
clean line PlanFig. 4
Wind speed (m/S)> 10.5
10.09.59.08.58.07.57.06.56.05.55.04.54.0
< 4.0
Source: Wind resource estimates developed by AWS Truepower, LLC for windNavigator. Web: http://www.windnavigator.com | http://www.awstruepower.com. Spacial resolution of wind resource data: 2.5 km. Projection: Albers Equal Area WGS84. 01-APR-2011 2.1.1
Existing AC transmission (kV)
Existing DC transmission (kV)
345-499500-699700-799800-1000
345-499500-699700-7991000 (DC)
Clean Lineprojects
Rock Island
Grain Belt Express
Western Spirit
Centennial WestPlains & Eastern
September 2015 Public utilities Fortnightly 37www.fortnightly.com
paraphrase Scotty, from TV’s first run of Star Trek. In a network of electric transmission wires and substations, electricity flows as an electromagnetic wave (not electrons) across all possible paths (disproportionately so along the paths of lesser resistance). Electricity does not, unlike conventional substances, physically travel from Point A to Point B in a single and direct path.14
Given this nature of electric networks, it is generally the case that the most efficient way to “move” more electricity a long distance from Point A to Point B is to reinforce the exist-ing network with incremental upgrades, not to build a new transmission line from A to B. Of course when new generation is remote from the grid, new transmission has to be built; but even then the most efficient way is to build new transmission to the network, not to build past that point.15
14. “Energy is transmitted, not electrons. Energy transmission is accomplishedthrough the propagation of an electromagnetic wave. The electrons merely oscillate in place, but the energy — the electromagnetic wave — moves at thespeed of light. The energized electrons making the lightbulb in a house glow are not the same electrons that were induced to oscillate in the generator back at the power plant.” Brief Amicus Curiae of Electrical Engineers, Energy Economists and Physicists, at 2, New York v. FERC, 535 U.S. 1 (2001), http://findlawimages.com/efile/supreme/briefs/00-568/00-568.mer.ami.engineers.pdf.
15. The CREZ projects in Texas illustrate this, with a web of 2,300 miles of new345 kV lines extending from new wind generation in west Texas to load cen-ters in central and east Texas. And in the Northeast there are proposals for new transmission to bring Canadian hydropower to Massachusetts and Pennsylvania.
of government can’t get things done that need doing? No.Big Transmission never did and never will make sense. Let’s
look at a half-dozen reasons why: 1) the laws of physics, 2) higher reliability risk, 3) stricter contingency limits, 4) lumpi-ness and investment risk, 5) rigidity of source and sink, and 6) better alternatives.
The Laws of Physics. “You can’t defy the laws of physics,” to
Pennsylvania
NewJersey
DelawareMaryland
Virginia
WestVirginia
MiSo – WeStern/Southern Plan, 2014
atlantic Wind connection – initial Plan
Fig. 6
Fig. 5

38 Public utilities Fortnightly September 2015 www.fortnightly.com
will be relying on an inherently more vulnerable transmission line.19
Stricter Contingency Limits. The principle of security-constrained unit commitment means that at any point in time the grid must be able to survive the loss of any single physical element without overloading other elements. That’s called single-contingency (N-1) operation. Big Transmission, by virtue of its size relative to other transmission lines that it is interconnected with, poses a large overload potential for those lines. That means that SCUC dispatch must limit what flows on Big Transmission to the amount that, if Big Transmission went down, would not overload any of the other, smaller transmission lines. This limiting factor will vary from time to time, but the key point is that the actual use of Big Transmission may end
up being much less than its nominal capability.20
Lumpiness and Investment Risk. Big Transmission is by nature big. That means big capital cost. Big Transmission also is lumpy, which means that such projects tend to go from construction to 100 per cent in-service overnight. Generally speaking Big Transmission is not scalable or “phaseable.” And
because transmission planning must satisfy reliability criteria 100 per cent of the time, the “before” system that existed on the day before Big Transmis-sion went into service also had to meet reliability criteria. So
the day that Big Transmission does go into service the grid is immediately overbuilt. The new Big Transmission project and will take years to “grow into.” This lack of ability to scale and/or phase makes Big Transmission problematic relative to smaller alternatives.
And this all-or-nothing drawback prevails regardless of
other causes correlated with circuit size (e.g., foreign interference, vegetation) would increase the percentage of all outage event causes correlated with size to 74%.
19. A discussion of this phenomenon appears in the Direct Testimony of GeorgeLoehr, a transmission engineer, in the certificate proceeding involving the Potomac-Appalachian Transmission Highline (“PATH”) certificate applica-tion in Virginia. Case No. PUE-2009-00043, October 23, 2009, http://www.scc.virginia.gov/docketsearch/DOCS/208y01!.PDF (pages 29-31).
20. Unless, of course, additional costs are incurred to upgrade transmission lineswith which Big Transmission interconnects.
This point helps explain why PJM, MISO, and SPP have built and planned tens of billions of dollars of new transmission without any Big Transmission. The envisioned Big Transmission projects didn’t survive review relative to the alternative of incremental network upgrades.16
Higher Reliability Risk. The reliability problem is this: When a new transmission line of any size goes into service it becomes the responsibility of the system operator to utilize that line in dispatching generation resources to the greatest extent possible per the principle of “security-constrained unit commitment” (SCUC).17 In the case of Big Transmission there are likely to be price differences between source A and sink B (which of course could reverse from time to time) for many hours of the year. But the reliability problem is that Big Transmission is by definition long. Big Transmission is thus a Big Target for adverse weather, and adverse weather is by far the biggest single cause of transmission outages.18 The upshot is that the grid
16. To be sure there has been some impact from reduced growth in projected demand, but if that influence were dominant it would render inexplicable thetens of billions of dollars in incremental transmission expansion that has occurred and is being planned (as shown in the previous section). And if the incremental network reinforcements were not supplanting Big Transmission, then the effect of reduced growth in projected demand would only delay Big Transmission rather than kill it.
17. This term basically means the lowest cost overall use of resources that is physi-cally possible, in any given hour.
18. Weather (including lightning) caused 44% of transmission outage events in the period 2012-2014 as reported by NERC http://www.nerc.com/pa/RAPA/PA/Performance%20Analysis%20DL/2015%20State%20of%20Reliability.pdf (Table A.3, excluding events for which cause was not known). Including
NewJersey
NewJersey
atlantic Wind - redux atlantic Wind - 3rd tryFig. 7 Fig. 8
Atlantic Wind Connection – Downsized w/o Wind
Atlantic Wind Connection – Downsized w/ Wind
Don’t blame government. This is no failure of public policy.
September 2015 Public utilities Fortnightly 39www.fortnightly.com
addition to the ones at each end).22 Better Alternatives. The pressure of the stakeholder process
and the potential competition among transmission provid-ers gives rise to transmission solutions that otherwise may not have emerged in a mono-lithic utility environment. But that tends to undercut Big Transmission. It is somewhat ironic that the regulatory reforms spurred in part by a perceived need for
Big Transmission have, in practice, tended to undermine Big Transmission by facilitating development of these alternatives. Let’s consider two examples of this.
First, in 2007, PJM proposed the 765/500-kV Potomac-Appa-lachian Transmission Highline (“PATH”) project which, at an
22. Each converter station for a 4,000 MW DC line runs about $300 million. Black & Veatch, “HVDC Conceptual Study,” November 17, 2009, https://www.pjm.com/~/media/committees-groups/committees/teac/20091118/20091118-pjm-path-dc-conceptual-study.ashx (page 2).
whether Big Transmission exists in a market or in a regulated environment. But certainly when Big Transmission is dependent upon market conditions the lumpiness and risk factors are all the more daunting. Big Transmission somehow needs to bring together generation resources and market demand – to the exclusion of alternatives – to forge a level of commitment that will last for many years. That’s a prerequisite for financing. So the entities at each end need to perceive such a compelling business proposition that they will forego other alternatives21 and cast their fate with Big Transmission. That’s a tough sell.
Rigidity of Source and Sink. Big Transmission is inherently rigid in source and sink. Reinforcements may be required at both of these points, at significant additional cost. This problem is particularly acute with DC transmission because each AC-DC converter station can cost hundreds of millions of dollars, making it prohibitively expensive to locate substations along the route (in
21. FERC requires that utilities interconnect all new generation. So a new genera-tor is assured of being able to interconnect its project to the utility serving the territory it is located in; the issue is solely how much money and time it will take for the interconnection. Given this legally assured ability to access the grid through the resident utility, market-based Big Transmission is effectively competing with that utility and thus must offer substantial value added.
Wind speed (m/S)> 10.5
10.09.59.08.58.07.57.06.56.05.55.04.54.0
< 4.0
Source: Wind resource estimates developed by AWS Truepower, LLC for windNavigator. Web: http://www.windnavigator.com | http://www.awstruepower.com. Spacial resolution of wind resource data: 2.5 km. Projection: Albers Equal Area WGS84. 01-APR-2011 2.1.1
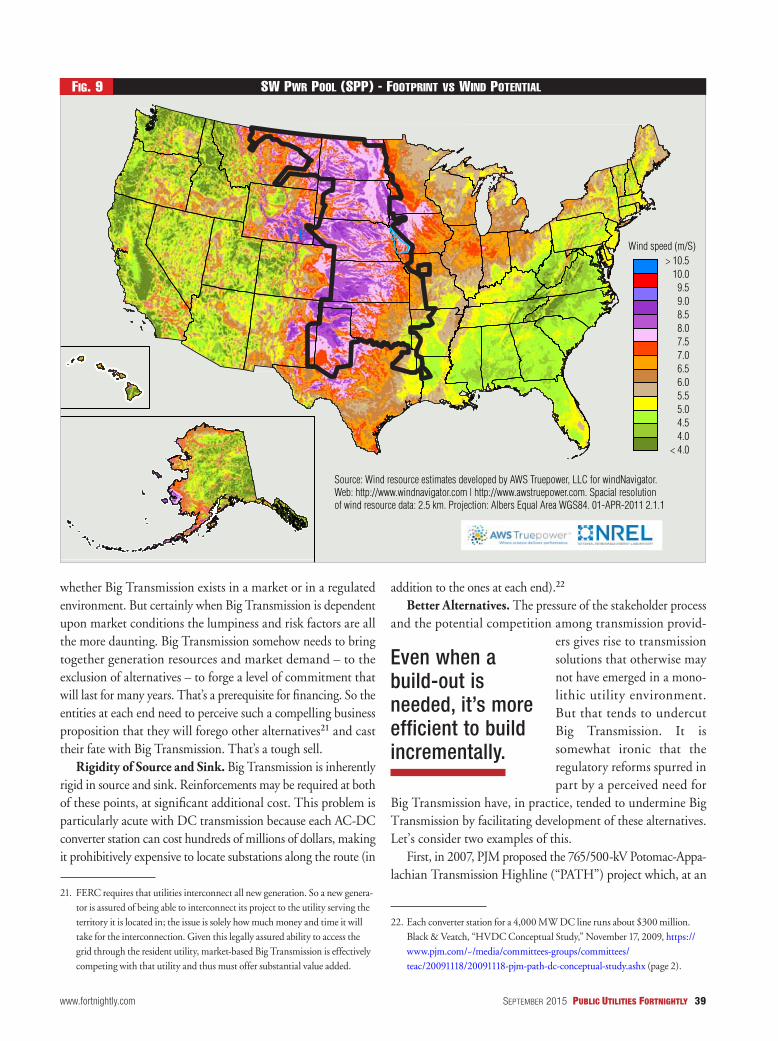
SW PWr Pool (SPP) - FootPrint vS Wind PotentialFig. 9
Even when a build-out is needed, it’s more efficient to build incrementally.
40 Public utilities Fortnightly September 2015 www.fortnightly.com
the 5-year transmission planning period.24 PJM staff conducted further reviews, but in November 2010 continued to recommend the PATH project.25
Meanwhile the Virginia State Corporation Commission set the PATH certificate application for hearing and, finding that Virginia Power’s proposal “may be relevant for purposes of this proceeding,” the commission required its hearing examiner “to ensure that the record is developed on such project.”26 Four months later, under PJM’s newly updated analysis, including the Mt. Storm-Doubs rebuild, the need for PATH basically
24. PJM Presentation to Transmission Expansion Advisory Committee (“TEAC”), July 14, 2010, http://www.pjm.com/~/media/committees-groups/committees/teac/20100714/20100714-dominion-alternative-pro-posal.ashx. The rebuild would increase the “thermal capability” of the line by65% (slide 4).
25. PJM Presentation to TEAC, November 10, 2010, http://www.pjm.com/~/media/committees-groups/committees/teac/20101110/20101110-reliability-and-market-efficiency-update.ashx (slide 25).
26. Order, Case No. PUE-2010-00115, October 20, 2010, http://www.scc. virginia.gov/docketsearch/DOCS/29s401!.PDF (page 5). Inadequate consideration of alternatives was one of many objections to the PATH projectin a prior certificate proceeding at the Virginia Commission, e.g., Direct Testimony of Hyde Merrill, Case No. PUE-2009-00043, October 23, 2009, http://www.scc.virginia.gov/docketsearch/DOCS/208k01!.PDF.
estimated cost of $2.1 billion, would extend 290 miles from the Amos substation in West Virginia to a new substation in Maryland to be called Kemptown. PATH essentially was the western half of the #2 project in the overall Project Mountaineer plan (Figure 1).23
And a large portion of the PATH project would be greenfield (more than 150 miles). PATH thus became very controversial – much more controversial than the earlier Trans-AlleghenyInterstate Line (“TrAIL”) project, which was smaller and ranalmost exclusively in and along existing transmission right-of-way). The initial 2012 in-service date for PATH was pushedback three successive times (always five years away), largelydue to reduced load growth, higher demand response, andnew generation.
Then, in July 2010, Dominion Resources (not a PATH project participant) presented to a PJM stakeholder group its analysis that a proposal by its operating subsidiary, Virginia Power, to rebuild one of its transmission lines, the Mt. Storm-Doubs line, along with some reactive reinforcements, at a total estimated cost of $620 million, would meet the reliability requirements of
23. The PATH entity was a joint venture of subsidiaries of American Electric Power and Allegheny Energy (the latter now a subsidiary of FirstEnergy).
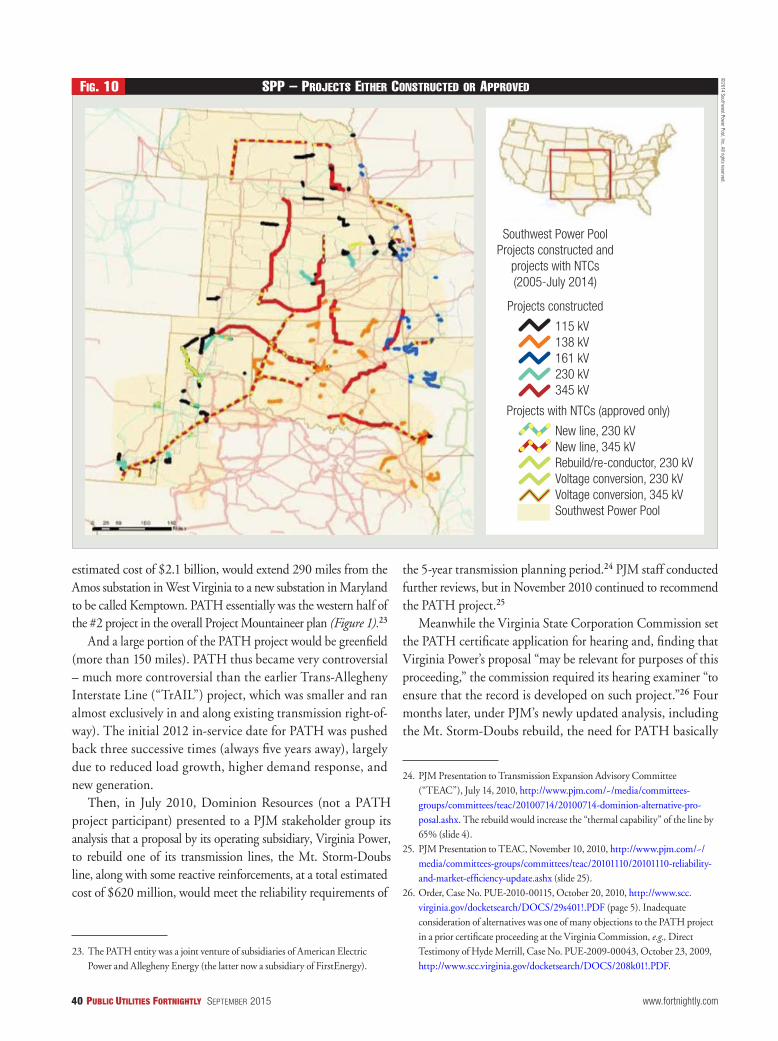
SPP – ProJectS either conStructed or aPProvedFig. 10
Southwest Power PoolProjects constructed and
projects with NTCs(2005-July 2014)
Projects constructed
115 kV138 kV161 kV230 kV345 kV
Projects with NTCs (approved only)
New line, 230 kVNew line, 345 kVRebuild/re-conductor, 230 kVVoltage conversion, 230 kVVoltage conversion, 345 kVSouthwest Power Pool
©2014 Southw
est Power Pool, Inc. All rights reserved.

September 2015 Public utilities Fortnightly 41www.fortnightly.com
To accommodate new wind resources SPP has been steadily expanding its system, with $8.8 billion in approved transmission upgrades, but none for Big Transmission, as noted already. The larger projects are shown in Figure 10 (“NTC” means approved projects yet to be constructed).
By all accounts the interconnection of new wind generation through these smaller and incremental projects is working in the Southwest Power Pool. Wind developer comments in the last SPP interconnection reform proceeding at FERC (Docket No. ER14-781-000) were relatively muted. Lack of loud complaints from wind developers (not a shy group) is telling, akin to the dog not barking.32 And stakeholder concerns on the most recent SPP transmission plan were whether too much was being spent to
support new wind generation.33 Simply put, Big Trans-
mission has fallen because it doesn’t make sense. It is inconsistent with the nature of electricity. It imposes higher
reliability risks and limits, makes for a lumpy investment with high risk, and is inflexible. Better alternatives emerge, such as the Mt. Storm-Doubs rebuild alternative to PATH and the SPP incremental expansion projects, relative to single massive transmission lines.
The Takeaway It’s worth knowing the history of Big Transmission, and the reason for its fall, so we don’t repeat calls for Big Transmission as the solution to each challenge du jour (be it avoiding blackouts, interconnecting new coal, interconnecting new renewables, relieving congestion, overcoming retirements, etc.).
Let’s build more of the right stuff.
32. Sir Arthur Conan Doyle, Silver Blaze (1892).33. “Falling Oil Prices, Wind Exports Raise Concerns about SPP Transmission
Expansion” RTO Insider, January 29, 2015.
disappeared.27 PATH was suspended in February 2011 and permanently terminated in August 2012.28
The PATH saga teaches many lessons, but one stands out – that smaller transmission projects can obviate a perceived need for Big Transmission. Still another lesson highlights the value of an open process to elicit such proposals by sophisti-cated stakeholders.29
Here’s a second example of better alternatives. This one involved the addition of new wind resources in the Southwest Power Pool (“SPP”). The need to interconnect new wind resources has been invoked as a driver for Big Transmission for years – the idea being that Big Transmission was necessary to bring remote wind generation to load.30 Indeed, SPP has enormous wind resources as shown by its footprint (including the Dakota and Montana areas to be integrated into SPP in October 2015) superimposed on a wind resource map (Figure 9).
But this need is being met through incremental transmission projects, not Big Transmission. SPP has interconnected 8,583 MW of wind generation and has another 17,000 MW in its interconnection queue.31
27. PJM Presentation to TEAC, March 10, 2011, http://www.pjm.com/~/media/committees-groups/committees/teac/20110310/20110310-reliability-analysis-update.ashx (esp. slide 16).
28. PJM Presentation to TEAC, August 9, 2012, http://pjm.com/~/media/ committees-groups/committees/teac/20120809/20120809-reliability- analysis-update.ashx (esp. slides 6, 8 and 13).
29. It is difficult to apportion the demise of PATH among reduced load growth, the Mt. Storm-Doubs alternative, new generation, and sophisticated state-level opposition. However, it is fair to observe that reduced load growth had only postponed PATH in the past (three times). What was different in 2010was the emergence of the Mt. Storm-Doubs alternative, and the focus of a state regulator on that alternative.
30. Proposed Big Transmission projects to tap SPP wind resources include HighPlains Express and Centennial West to go west, and Grain Belt Express and Plains & Eastern to go east. Figure 4 shows the last three.
31. SPP, SPP 101, May 2015, http://www.spp.org/publications/Intro_to_SPP_APR%202015.pdf (slide 78).
Big Transmission never made sense. Never will.
Subscribe today:fortnightly.com/subscribe
or sign up for a no obligation trial at fortnightly.com/free-trial
or call 1-800-368-5001.
PUBLIC UTILITIES
FORTNIGHTLY FORTNIGHTLYENERGY, MONEY, POWER
March 2013
EnergyTurning
InsideOut
Negawatts, microgrids, and Amory Lovins
Your best source for unbiased and
insightful coverage of the critical issues
facing the energy industry.
PUBLIC UTILITIES
FORTNIGHTLY FORTNIGHTLYENERGY, MONEY, POWER