
CHEMICAL FORMULA D. Crowley, 2007. Chemical Formula To understand chemical formula.

The Dow Chemical Company2010 Annual Report
The Right Formula for Growth

+pipeline
+
portfolio+
Mastering Transformation... At Every Level
All we see, all we touch – our entire complex world – comes down to 118 elements. Just 118. It is only when we introduce the element of humanity – the 119th element – that creativity combines with chemistry, and innovation changes lives.
In our view, the greatest challenges the world will face in the coming decades are ones that can be solved – and will be solved – at the intersection of chemistry, biology and physics… sciences that the people of Dow have mastered.
Our ability to design the right formula has the power to transform what nature began and to create solutions the world has never known. By rethinking what is possible at the molecular level, Dow is changing the world around us – pioneering new products and addressing the megatrends facing humankind.
This strategy has fueled the transformation of our Company. Creating new markets for our products. New solutions for our customers. And increasing value for our stockholders.
We invite you to take a closer look.

Table of Contents
2 Meet the World’s Best Problem Solvers – the Men and Women of Dow
3 Financial Highlights 4 Chairman’s Letter to Stockholders 6 2010 Achievements 8 Executive Leadership Committee and Corporate Officers 9 Corporate Governance and Board of Directors 10 The Right Formula for Growth 12 The Right Portfolio 16 The Right Pipeline 20 The Right Geographic Presence 24 The Right Investments in People and the Planet 28 Vision, Mission and Strategy Form 10-K for the Year Ended December 31, 2010
(with selected exhibits) Stockholder Reference Information – Inside Back Cover
people
places
the right formula for growth
+

Meet the World’s Best Problem Solvers – the Men and Women of Dow
Dow employs nearly 50,000 people across the globe, people of incredibly diverse talents. Yet, together, our people are inspired by a common purpose and passion: to put the power of chemistry to work to solve human problems.
By searching for solutions and never giving up. By engaging their imagination and ingenuity. By listening, anticipating, collaborating and creating, they reach beyond the expected to offer the truly innovative. At the same time, they perform with integrity, discipline and a respect for people and the planet.
Here are some of the remarkable men and women of Dow – people who are making a difference and making it now – for our customers and for the world. Together, they are working on developing new technologies for cleaner energy and water, safer and more efficient operations, and solutions for customers.
Carrie Cui-Ping
TS&D Engineer
Alternative Energy, Epoxy Systems
Shanghai, China
Jarod D. Davis
External Engagement Leader
Sustainability
Midland, Michigan
Paul-Michael Pellny
Global Market Manager, Industrial Processes
Dow Water & Process Solutions
Schwalbach, Germany
Kala Smile Ross
Resource Leader, Process Automation
Engineering Solutions
Chennai, India
Karen L. Eddlemon
Counsel, U.S. Operations
Legal
Plaquemine, Louisiana
Niels Smits
Production Leader LHC-7 Freeport
Manufacturing and Engineering
Freeport, Texas
Mónica Aravena Selman
Administrative Specialist
Polyethylene
Talcahuano, Chile
Sandeep S. Dhingra
Global R&D Director, Analytical Sciences
Core R&D
Midland, Michigan2 The Dow Chemical Company

2010 Annual Report 3
1 A reconciliation to the most directly comparable U.S. GAAP measure is provided on the Internet at www.dow.com/financial.2 Net debt equals total debt (“Notes payable” plus “Long-term debt due within one year” plus “Long-term debt”) minus “Cash and cash equivalents.”
The forward-looking statements contained in this document involve risks and uncertainties that may affect the Company s operations, markets, products, services, prices and other factors as discussed more fully elsewhere and in filings with the U.S. Securities and Exchange Commission. These risks and uncertainties include, but are not limited to, economic, competitive, legal, governmental and technological factors. Accordingly, there is no assurance that the Company s expectations will be realized. The Company assumes no obligation to provide revisions to any forward-looking statements should circumstances change, except as otherwise required by securities and other applicable laws. References to “Dow“ or the “Company“ mean The Dow Chemical Company and its consolidated subsidiaries, unless otherwise expressly noted.
Net Sales(dollars in millions)
06 07
49,0
09
08
53,3
75
09
57,3
61
10
44,8
75 53,6
74
06 07
3,79
6
08
2,96
2
09
626
10
566
2,32
1
Total Sales$53,674
Plastics$11,551
Chemicals and Energy$3,485
Hydrocarbons$5,442
Electronic and Specialty Materials$5,040
Coatings and Infrastructure$5,365
Health and Agricultural Sciences$4,869
Performance Systems$6,676
Performance Products$10,903Corporate: $343
Per Share Data(dollars)
Net Income from Continuing Operations
(dollars in millions)
Earnings – Excluding Certain Itemsand Discontinued Operations1
Earnings – Diluted
Dividends Declared
1.50
0.60
1.68
06
3.82
07
4.23
2.99
08
3.74
1.63
5
0.62
09
1.79
0.32
10
0.63
0.60
1.72 1.
97
Financial Highlights
2010 2009
Net Sales (dollars in millions) $53,674 $44,875
Net Income from Continuing Operations (dollars in millions) $2,321 $566
Earnings per Share from Continuing Operations – Diluted, Excluding Certain Items1 $1.97 $0.63
Dividends Declared per Share $0.60 $0.60
Net Debt to Capital Ratio2 43% 48%
2010 Sales by Operating Segment (dollars in millions)

Dear Stockholders,
For a global enterprise like The Dow Chemical Company, changing course demands resiliency and perseverance. It requires singular focus and unwavering purpose. And it calls for a relentless spirit of exploration and implementation.
These qualities have long set generations of Dow people apart – men and women who have made difficult, bold, courageous decisions. More recently, these qualities have enabled the Company to successfully pursue its strategy of transformational growth and its mission: to passionately innovate what is essential to human progress by providing sustainable solutions to our customers.
This strategy began to take shape in earnest several years ago when your Board of Directors and executive leadership team took a hard look at the Company’s future. We considered the transformational impact of the global megatrends that are revolutionizing our world. And we considered the changes that Dow needed to make in order to seize the new opportunities defined by these trends.
Since then, Dow employees have worked hard to implement these profound changes.
This Company has never been about staying in one place. We are always
advancing. We are always growing. We are always innovating. Progress
is a Dow tradition. It is an element of our DNA.
The Dow Chemical Company4
Today, we are proud to report that this transformational strategy is firmly in place and it is delivering clear results. In 2010, we achieved, and in many cases exceeded, our goals:
• We grew revenue 26 percent excluding the impact of divestitures, more than double our 2010 goal of 10 percent, and delivered gains in every quarter.
• Our growth in emerging regions hit a new milestone, surpassing $16 billion in revenues for the first time in our Company’s history. Sales in Asia Pacific topped $9 billion in the year, also representing an all-time record. And this is only the beginning: we made investments in Thailand, China, Vietnam, Korea and elsewhere in this exciting growth region. And we continued to make significant progress on several mega projects designed to accelerate our growth in Asia Pacific and the Middle East.
• We expanded EBITDA margins1 more than 200 basis points at a Company level and achieved year-over-year EBITDA margin expansion for seven consecutive quarters, excluding certain items.2

2010 Annual Report 5
1 EBITDA is defined as earnings before interest, income taxes, depreciation and amortization. EBITDA margin is defined as EBITDA as a percentage of sales. EBITDA and EBITDA margin are presented excluding certain items.
2 See Supplemental Information at www.dow.com/financial for a description of these items.
Andrew N. Liveris
President, Chief Executive Officer and Chairman of the Board February 25, 2011
Strategically, we are committed to continue expanding our portfolio of specialty chemicals, agrosciences and advanced materials, and accelerate the transformation of our Plastics franchise.
We are focused on maintaining the momentum of our growth portfolio and will continue to invest in and monetize our innovation pipeline. We will also continue accelerating toward our 2012 goal of $2 billion in growth synergies.
We will further strengthen our presence in emerging geographic areas – with a goal of reaching 35 percent of revenue from these regions in 2012. Our progress will accelerate as we continue implementing projects in Thailand, Saudi Arabia, Brazil and China that will bolster our downstream businesses and increase our asset footprint in the emerging world.
From an operational perspective, we will maintain our vigilant approach to reliable operations, productivity and cost reductions, while prudently investing in growth.
Financially, we remain committed to driving our net debt to total capital ratio down to less than 40 percent by the end of 2012.
And finally, we will continue advocating globally for policies that help manufacturing thrive in a 21st-century economy.
We will pursue all of this while upholding our unwavering focus on safe operations in the communities where we live and work. In fact, Dow’s commitment to sustainability and our focus on addressing great global challenges will increase as Dow steps into its role as the official “Chemistry Company” of the Olympic Movement – a premier partnership we initiated in 2010.
These are, without question, remarkable times for The Dow Chemical Company. As we fix our eyes on a new frontier, we are building upon a rich legacy of innovation that is woven into the fabric of our Company. After all, it was the potential of chemistry that brought Herbert H. Dow to Midland, Michigan, 114 years ago. He believed deeply in the power of chemistry to create, to build and to improve.
More than a century later, the men and women of The Dow Chemical Company continue to be driven by that set of beliefs – by Herbert H. Dow’s spirit of exploration and his ethic of hard work. We are disciplined. We are passionate. We are purposeful, and we stand behind our mission.
Thank you for believing in our mission. Thank you for supporting our work. And thank you for investing in the future of our Company.
• Our strong investment in growth remained steadfast. Our 2010 R&D spending increased to $1.7 billion, and we drew on our $30 billion net present value innovation pipeline to launch new products that will set us apart for years to come. In fact, more than one-third of our revenue this year was generated by products launched within the last five years.
• We delivered more than $1 billion in revenue from growth synergies on a run-rate basis from our transformational acquisition of Rohm and Haas, and we surpassed $2 billion in cost synergies, well ahead of schedule.
• We put our disciplined portfolio management approach into action – divesting $5 billion in non-strategic assets in less than two years.
• We pursued strategic joint ventures that bolster our integration strength, while simultaneously liberating capital for investment in our businesses that are technology- and customer-driven.
• We reduced our net debt to capital ratio to 42.6 percent, and delivered more than $4 billion in cash from operating activities.
We are now entering a period of increasing financial flexibility after successfully integrating the largest acquisition in our history in the midst of what has become known as the world’s worst financial crisis since the Great Depression.
And in terms of earnings growth, we delivered results more than triple that of the year-ago period.
We accomplished all of this while maintaining our high standards for environment, health and safety performance. Our efforts were recognized by the National Safety Council, which named Dow the recipient of the prestigious Robert W. Campbell Award. Dow is the first chemical company to be so honored.
Our commitment to helping people around the world remained equally strong. Thousands of employees volunteered this year, as they always do, working in local communities where we operate and beyond. In particular, Dow provided support in Pakistan, Haiti and Chile in the wake of disasters that struck these regions in 2010.
As we stand steadfast behind our values of integrity, respect for people and protection of our planet, we also recognize that this Company has never been about staying in one place. We are always advancing. We are always growing. We are always innovating. Progress is a Dow tradition. It is an element of our DNA.
That is why, even as we celebrate a tremendous year, we are looking to the future. We welcome the fact that the global economy is showing positive trends. However, we won’t depend on external factors to fuel our growth. Our portfolio is well-balanced to mitigate uncertainty, and our drive to deliver sustained earnings growth remains resolute.

6 The Dow Chemical Company
u First Quarter
Dow signs a definitive agreement to divest Styron to Bain Capital Partners for $1.6 billion. The Company also finalizes the sales of its acrylic acid and esters business in Clear Lake, Texas, and its UCAR Emulsion Systems specialty latex business in North America to Arkema.
The Company surpasses its full-year growth synergy target related to the acquisition of Rohm and Haas, delivering $530 million in sales on an annual run-rate basis.
Dow successfully completes a two-year, multimillion-dollar project to transform its STYROFOAM™ Brand Insulation to a more sustainable manufacturing technology in North America, cutting in half the greenhouse gas emissions from production at all of its converted facilities in the region.
DOW™ POWERHOUSE™ Solar Shingle receives a GLOBE Foundation award for “Environmental Excellence in Emerging Technology.”
Dow AgroSciences announces the first commercial sale of SmartStax™ corn hybrid. A revolutionary new seed trait combination, SmartStax™ also receives the AgProfessional Readers’ Choice 2009 New Product of the Year award.
Paul Polman, CEO of Unilever PLC and Unilever N.V., is elected to Dow’s Board of Directors, and William H. Weideman is appointed Executive Vice President and Chief Financial Officer.
Dow supports efforts to assist disaster recovery in Haiti and Chile, following devastating earthquakes in both countries.
u Second Quarter
Dow Advanced Materials1 hosts its first-ever Sector Day for media and investors, during which it projects sales will grow to $12 billion by 2012 and EBITDA will nearly double to roughly $3 billion by 2012. Growth will be driven by leadership positions in fast-growing end-markets, a strong geographic position and a robust innovation pipeline.
Dow exceeds its commitments to deliver cost synergies related to the acquisition of Rohm and Haas and to reduce structural costs, achieving a run-rate of more than $2 billion.
Dow completes the sale of Styron and exceeds its goal of divesting $5 billion in non-strategic assets in less than two years.
Joint venture Dow Kokam breaks ground on a world-scale lithium ion battery manufacturing facility in Midland, Michigan. In conjunction with the groundbreaking, Dow hosts U.S. Vice President Joe Biden at its headquarters and showcases several of the Company’s major green technology initiatives.
Dow and Cobblestone Homes introduce Michigan’s first affordable net-zero energy home, constructed with energy-efficient technologies from Dow.
Dow Electronic Materials announces a multi-phase plan to expand its trimethylgallium (TMG) production capacity to serve the fast-growing LED industry. Plans include adding significant TMG capacity at existing U.S. facilities and building a new manufacturing plant in Cheonan, Korea.
Dow AgroSciences and Bayer CropScience enter into cross-licensing agreements for cotton technologies. Through the combination of leading technologies such as WideStrike® Insect Protection and GlyTol™, cotton growers worldwide will have more choices for improving productivity.
Dow and BASF receive a 2010 Presidential Green Chemistry Challenge Award for jointly developed hydrogen peroxide to propylene oxide (HPPO) technology. The technology vastly improves the production process of a key chemical intermediate, propylene oxide.
Dow wins four 2010 American Chemistry Council Responsible Care® Energy Efficiency Awards for programs that improved energy efficiency at three of the Company’s U.S. facilities.
Dow is added to the NASDAQ OMX CRD Global Sustainability 50 Index for the first time. The index is comprised of companies that have taken a leadership role in sustainability performance reporting.
Dow continues its commitment to chemical safety with a five-year, $5 million research grant to The Hamner Institute.
2010 Achievements
In 2010, Dow was focused on the execution of our strategy and delivering on the promise of our new portfolio.
1 Dow Advanced Materials includes the Electronic and Specialty Materials, and Coatings and Infrastructure operating segments.

2010 Annual Report 7
u Third Quarter
Dow is the first-ever chemical company to receive the National Safety Council’s international Robert W. Campbell Award. The prestigious award honors a company that upholds Environment, Health and Safety as key business values.
Sales in emerging geographies surpass $4 billion in the quarter for the first time in the Company’s history. Continuing its focus on growth in emerging geographies, Dow, along with Saudi Aramco, confirms that Jubail Industrial City is the planned site location for a proposed joint venture petrochemical project.
Dow and Mitsui & Co. Ltd. sign a definitive agreement to form a 50:50 manufacturing joint venture to construct, own and operate a new membrane chlor-alkali facility at Dow’s manufacturing complex in Freeport, Texas.
Dow announces the first 100 full-time jobs to support the development of the DOW™ POWERHOUSE™ Solar Shingle in Midland, Michigan.
Dow Electronic Materials inaugurates its new organic light emitting diode (OLED) materials facility in Cheonan, Korea.
Dow becomes an official Worldwide Olympic Partner. This top sponsorship extends through 2020 and will allow Dow to showcase its people, products, scientific excellence and commitment to sustainable solutions on a global stage.
Dow and India-based Tata Consultancy Services celebrate the construction of a new Business Process Service Center in Midland, Michigan. The partnership supports a business services model that is expected to deliver world-class capabilities at an estimated 30 percent savings, while creating new jobs in the Great Lakes Bay Region.
Dow announces a technology breakthrough project that will increase polyolefin elastomers manufacturing capacity at its production facilities in Freeport, Texas; Tarragona, Spain; and Plaquemine, Louisiana.
Dow AgroSciences showcases a new refuge-in-the-bag concept. Pending registration by the U.S. Environmental Protection Agency, the concept will be commercialized as SmartStax™ Refuge Advanced™ and will provide a single-bag solution for refuge reduction in the U.S. Corn Belt as early as 2012.
Dow introduces ENLIGHT™ Polyolefin Encapsulant Films that can enhance efficiencies in photovoltaic module production and lower conversion costs. Commercial-scale manufacturing of the films begins in Findlay, Ohio, in the following quarter.
Dow is named to the “Carbon Disclosure Leadership Index” by the Carbon Disclosure Project for the sixth year.
Dow Chairman and Chief Executive Officer Andrew Liveris is appointed by President Barack Obama to the President’s Export Council. Liveris joins labor leaders, congressional representatives and CEOs from other top U.S. companies in advising the Administration on how to achieve its goal of doubling exports in the next five years.
u Fourth Quarter
Dow announces the successful startup of a new Solution Linear Low Density Polyethylene II train (SPE II) in Thailand. SPE II is owned by Siam Polyethylene Company Limited, a joint venture of Dow and Siam Cement Group.
Dow and the Shenhua Group submit a Project Application Report to the Chinese government for approval to build and operate a world-scale integrated complex in Yulin City, Shaanxi Province.
Dow AgroSciences is granted a U.S. patent for crop plants that contain one of Dow AgroSciences’ new class of herbicide tolerant traits.
DOW™ POWERHOUSE™ Solar Shingle receives Underwriters Laboratories (UL) safety certification. The certification is a milestone toward its planned 2011 commercialization.
Dow Electronic Materials announces it will construct a new manufacturing facility in Eastern China to meet the growing material demand within the printed circuit board, electronic and industrial finishing, and photovoltaic industries in Asia Pacific.
Dow Coating Materials announces a breakthrough series of products designed to significantly reduce paint manufacturers’ dependence on a key raw material, titanium dioxide.
Dow Water & Process Solutions announces that its reverse osmosis technology will be used in the world’s largest 16-inch desalination plant, the Soreq Plant, located near Tel Aviv, Israel.
Dow breaks ground on a new manufacturing facility in southern Vietnam for the production of polymers used in paint, coatings, construction, packaging, home and personal care industries.
Dow announces plans to build a propylene glycol plant in Thailand. The new facility will use propylene oxide derived from the new, sustainable HPPO technology, developed jointly by Dow and BASF.
Dow continues to make solid progress in deleveraging its balance sheet, reaching a net debt to total capitalization ratio of 42.6 percent by year-end.
Dow announces that its largest manufacturing facility in Brazil, the Aratu Complex, will add biomass to its portfolio of clean energy sources by the end of 2012.
Dow partners with the International Union of Pure and Applied Chemistry as the first global partner for the International Year of Chemistry in 2011.

The Dow Chemical Company8
Andrew N. LiverisPresident, Chief Executive Officerand Chairman of the Board
William H. WeidemanExecutive Vice President and Chief Financial Officer
William F. BanholzerExecutive Vice President,Ventures, New BusinessDevelopment & Licensingand Chief Technology Officer
William L. CurryChief Tax Officer andAssistant Secretary
Ronald C. EdmondsVice President and Controller
Corporate Officers(at February 25, 2011)
James R. FitterlingExecutive Vice President of The Dow Chemical Company and President, Plastics and Hydrocarbons
Gregory M. FreiwaldExecutive Vice President, Human Resources, Corporate Affairs, & Aviation
Michael R. GambrellExecutive Vice President,Manufacturing andEngineering Operations
Heinz HallerExecutive Vice President and Chief Commercial Officer
Charles J. KalilExecutive Vice President,Law and GovernmentAffairs, General Counseland Corporate Secretary
David E. KeplerExecutive Vice President,Business Services, ChiefSustainability Officer andChief Information Officer
Juan R. LucianoExecutive Vice President of The Dow Chemical Company and President, Performance Division
James D. McIlvennyGroup Senior Vice President, Mega Projects
Geoffery E. MerszeiExecutive Vice President ofThe Dow Chemical Company;President of Dow Europe,Middle East and Africa; andChairman of Dow Europe
Jerome A. PeribereExecutive Vice President of The Dow Chemical Company and President and Chief Executive Officer, Dow Advanced Materials
Fernando RuizCorporate Vice Presidentand Treasurer
Carol A. WilliamsGroup Senior Vice President of The Dow Chemical Company and President, Chemicals and Energy Division
Gregory T. GrocholskiCorporate Auditor
W. Michael McGuireAssistant Secretary
Amy E. WilsonAssistant Secretary
Seated left to right: Michael R. Gambrell, Charles J. Kalil, Andrew N. Liveris, William H. Weideman, David E. Kepler
Standing left to right: Jerome A. Peribere, Heinz Haller, William F. Banholzer, Juan R. Luciano, James R. Fitterling, Gregory M. Freiwald, Geoffery E. Merszei, James D. McIlvenny, Carol A. Williams
Executive Leadership Committee (at February 25, 2011)

2010 Annual Report 9
Corporate GovernanceAt Dow, we believe our success depends on maintaining the highest ethical and moral standards everywhere we operate. That focus on integrity starts at the top. Effective corporate governance begins with the performance of the Board of Directors.
Dow exemplifies good governance with a presiding director; directors with solid, diverse experience and credentials; corporate governance guidelines; and codes of business conduct and financial ethics. Independent directors comprise a substantial majority of Dow’s Board.
Dow’s corporate governance guidelines address important aspects of Dow’s corporate governance structure, such as criteria for director qualifications, election, continuing education and tenure; ongoing improvement of Board effectiveness; and a framework for the evaluation of management and succession planning.
During 2010, Dow again achieved the highest rating possible for its standards of corporate governance from GovernanceMetrics International, an independent research and ratings agency.
More information on Dow’s corporate governance, including Dow’s corporate governance guidelines, Board Committee charters and Code of Business Conduct, is available online at www.dow.com.
Andrew N. Liveris, president, chief executive officer and chairman, and William H. Weideman, executive vice president and chief financial officer, executed the certifications required by Sections 302 and 906 of the Sarbanes-Oxley Act of 2002 on February 18, 2011, and filed Management’s Report on Internal Control Over Financial Reporting, as required by Section 404. The certifications were filed as exhibits to the Company’s Annual Report on Form 10-K for the year ended December 31, 2010, and copies are included herein.
In addition, Mr. Liveris certified to the New York Stock Exchange (NYSE) on May 27, 2010, that he was unaware of any violations by the Company of the NYSE corporate governance listing standards in effect as of that date. The certification was made in accordance with the rules of the NYSE.
Andrew N. LiverisPresident, Chief Executive Officerand Chairman of the Board
Arnold A. AllemangDirector since 1996
Jacqueline K. BartonArthur and Marian HanischMemorial Professor of Chemistry,California Institute of TechnologyDirector since 1993
James A. BellExecutive Vice President,Corporate President andChief Financial Officer,The Boeing CompanyDirector since 2005
Jeff M. FettigChairman and Chief ExecutiveOfficer, Whirlpool CorporationDirector since 2003
Barbara H. FranklinPresident and Chief ExecutiveOfficer, Barbara FranklinEnterprises and Former U.S.Secretary of CommerceDirector 1980 –1992 and1993 to date
John B. HessChairman and Chief ExecutiveOfficer, Hess CorporationDirector since 2006
Paul PolmanChief Executive Officer, Unilever PLC and Unilever N.V.Director since 2010
Dennis H. ReilleyFormer Non-Executive Chairman, Covidien, Ltd.Director since 2007
James M. RinglerChairman, Teradata CorporationDirector since 2001
Ruth G. ShawFormer Executive Advisor,Duke Energy CorporationDirector since 2005
Paul G. SternDow Presiding Director,Chairman, Claris CapitalDirector since 1992
Board of Directors (at February 25, 2011)
Committees of the Board of Directors(at February 25, 2011)
Audit CommitteeB.H. Franklin, ChairJ.A. BellJ.M. FettigJ.M. RinglerP.G. Stern
Compensation and Leadership Development CommitteeD.H. Reilley, ChairJ.K. BartonJ.B. HessP. PolmanR.G. Shaw
Environment, Health and Safety CommitteeJ.K. Barton, ChairA.A. AllemangA.N. LiverisP. PolmanD.H. ReilleyJ.M. RinglerR.G. Shaw
Governance CommitteeP.G. Stern, ChairJ.A. BellJ.M. FettigB.H. Franklin
Dennis H. Reilley Paul G. SternJames M. Ringler
Jeff M. Fettig Barbara H. Franklin John B. HessArnold A. Allemang
Andrew N. Liveris
Jacqueline K. Barton James A. Bell
Ruth G. ShawPaul Polman

The Right Formula for GrowthOur goal in 2010 was to execute for today and build for tomorrow. Even in an environment of economic uncertainty, Dow’s earnings growth was clearly evident as we continued to reduce our cost structure, deliver on our synergy targets, strengthen our balance sheet and make significant progress in transforming our portfolio.
Underpinning our transformation are four pillars:
u With the right business portfolio, we are creating value for our customers through our higher-growth, higher-margin, market-focused businesses, many of which are leaders in their industries.
u With the right geographic presence, we are creating opportunities in new places with new customers by expanding our reach in emerging markets.
u Through the right growth pipeline, we are creating new products for new markets by aligning our substantial research and development investments to address critical global issues.
u With the right people, we are creating passionate leaders at every level and in every part of our business – leaders who execute by understanding and anticipating economic realities, making smart choices, leading change and inspiring teamwork by example.
Using the same financial discipline, creative vision and sense of purpose that have always set Dow apart, our people – the 119th element – are transforming Dow into a more innovative, market-driven and technology-rich company, while also helping to transform our world.
10 The Dow Chemical Company

Focus on Megatrends
We have taken an outside- in approach – based on the global demographics and tectonic shifts that are shaping the future. These megatrends serve as the lens that sharpens our focus and directs our investments.
Robust Portfolio
As one of the world’s largest performance products, performance systems, agroscience and advanced materials providers, we have leadership positions in high-growth, high-margin sectors such as electronics, water, agriculture, coatings and alternative energy. And our restructured global Plastics franchise is now comprised in large part of technology-based polymers that are at the epicenter of growth in high-performance packaging, elastomers and wire and cable applications.
Integration Strength
We deliver unparalleled integration advantage to our downstream market-driven advanced materials, agrosciences and performance businesses through world-class building blocks powered by technology and manufacturing economies of scale, coupled with strategic partnerships that bolster our feedstock advantage.
Sustainability Leadership
Our innovation engine is focused on delivering carbon mitigation, alternative energy, water purification, crop productivity, building efficiency and many more solutions that improve lives while protecting the planet. Our leadership is validated by third-party recognition. Our Sustainability Goals are integral to our corporate vision, mission and values – which continue to drive change that is good for the environment, good for people and good for business.
Technology Leadership
Our innovation agenda is focused on megatrends and is backed by a rigorous process that enables us to deliver commercial success and bottom-line results. Our rich $30 billion pipeline on a non-risk-adjusted net present value (NPV) basis is filled with solutions that customers want and, in turn, will enable us to expand margins and reduce earnings volatility over time.
Global Reach
Dow’s growing geographic presence means we are now in a better position than ever to capitalize on emerging market opportunities, with 32 percent of our sales in 2010 coming from these fast-growing regions. And this is only the beginning as we continue to make progress with key mega projects that will even further expand our ability to serve high-growth regions.
Financial Discipline
We continue to drive financial discipline and, as a result, have reduced our cost structure, lowered debt and strengthened our balance sheet. In 2010, we delivered $2.4 billion in cost savings related to our restructuring programs and acquisition-related synergies. We exceeded our goal to divest $5 billion in non-strategic assets over the last several years. And we reduced our net debt to capital ratio to 42.6 percent. Moving forward, we will maintain our vigilant approach to cost productivity, while prudently investing in growth.
Customer Focus
We have shifted our portfolio to a more market-driven, customer-centric model, aligning our businesses and innovations to address customer needs. We recognize that our customers will be our organizing principle for growth. That is why we are building relationships with customers who are on the forefront of innovation and technology differentiation – identifying and anticipating future needs throughout the value chain.
112010 Annual Report

The Dow Chemical Company12
Reshaped: More Technology-Rich Businesses
Dow’s new portfolio is preferentially tilted toward specialty chemical, advanced material and agroscience businesses. These technology-rich platforms are already delivering higher margins and earnings growth. Since 2009, Dow’s gross margin has improved from 13 percent to approximately 15 percent. In addition, the Company more than doubled its annual EBITDA run-rate performance since the first quarter of 2009 to nearly $2 billion in the fourth quarter of 2010.
Advanced Materials and Health and Agricultural Sciences, which serve customers in electronics, health care, agriculture, infrastructure and other fast-growing end-markets, are leading Dow’s growth. Growth in the Performance division is driven by our systems-and-solutions approach to customers, an improving economy and strong sales in fast-growing end-markets such as wind energy applications. Together, these segments accounted for sales of $33 billion in 2010.
Meanwhile, our Chemicals and Energy segment continues to bolster its integration strength, fueling downstream growth in our market-driven and performance businesses. And our Plastics segment – prized for strong back-integration into feedstocks, economies of scale, as well as technology and brand leadership – represents the strongest franchise in the industry.
Reinvigorated: Delivering on Our Commitments
We have actively reshaped Dow through aggressive portfolio management. In less than two years, we have divested more than $5 billion in non-strategic businesses – exceeding our 2009 –2010 targets. In 2010, we:
• Surpassed our goal of divesting $2 billion in non-strategic assets, fueled in large part by our sale of Styron to Bain Capital for $1.6 billion. These actions allowed us to reduce debt while freeing capital for investment in our higher-growth, higher-margin businesses.
• Maintained an aggressive focus to deliver against restructuring and acquisition-related synergy targets, delivering $2.4 billion in cost savings… ahead of schedule.
• Continued to manage our balance sheet, evidenced by the fact that our net debt to total capital ratio reached 42.6 percent by year-end. This was driven in part by more than $4 billion of cash from operating activities.
THE RIGHT PORTFOLIODow has reshaped and repositioned its portfolio to take on the complex realities of today and tomorrow. We have reorganized our businesses around customers and global market needs. We have preferentially invested in higher-growth and technology-rich businesses, while preserving our unique integration advantage. And we have exited businesses that no longer meet our strategic vision. As a result, we have a diverse portfolio of leading businesses that are capable of creating growth for our customers and long-term value for our stockholders.
Through cross-selling opportunities, new business and new solutions, we have captured significant growth
synergies since our 2009 acquisition of Rohm and Haas. Already, we have realized more than $1 billion revenue in growth synergies on an annual run-rate basis, exceeding our 2010 target by more than $500 million – and we are rapidly accelerating toward our 2012 target of $2 billion.
+

2010 Annual Report 13
STRATEGy-IN-ACTION
Plastics: A Portfolio with Focus
We have executed changes to our Plastics segment that have resulted in a tighter market focus and superior financial returns.
We have streamlined our portfolio, moving away from high-cost commodities toward higher-margin specialties. Our focus is on high-value-added polymers, such as linear low density polyethylene (LLDPE), which serve market segments such as
flexible food and specialty packaging, and health and hygiene. These specialty market segments demand and reward new technology innovation. And we are bringing our solutions to regions that are growing rapidly – as evidenced by a joint venture’s start-up of its Solution Linear Low Density Polyethylene II train in Thailand.
Strengthening Our Feedstock Advantage
At the same time, we plan to boost our ethane cracking capability in the United States by up to 30 percent over the next three years, capitalizing on the region’s affordable and stable natural gas prices. In addition, we are reviewing joint venture options for building a natural gas liquids fractionator. Both actions will further strengthen the competitive advantage of our higher-margin specialty plastics, Performance and Advanced Materials segments.
We continue to bolster our integration strength in cost-effective ways. In December, Dow finalized a joint
venture agreement with Mitsui to construct and operate a new chlor-alkali facility at Dow’s Freeport, Texas, site. The 50:50 joint venture will result in a world-scale chlor-alkali plant that will supply critical building blocks to Dow’s downstream businesses – at lower cost and with less capital.
Relationships: Partnering for Growth
Overall, our joint ventures delivered $1.1 billion in EBITDA to Dow in 2010, representing a 54 percent increase from 2009,
excluding certain items.1 An integral part of our business model, our joint venture activities have risen markedly in recent years. For example:
• Dow Corning’s equity earnings have grown by nearly 20 percent a year since 2004. This growth is expected to continue as new silicone capacity comes online in China and as Dow Corning increases its ability to support key industries such as electronics and solar through its Hemlock Semiconductor joint venture.
• EQUATE Petrochemical Company, which produces polyethylene and ethylene glycol for customers throughout Europe, Middle East and Asia, is benefiting from recent expansions that nearly doubled production capacity.
• Dow Kokam broke ground on its Midland Battery Park facility in June 2010. The plant, which will manufacture 600,000 watt-hours of advanced lithium ion batteries for the growing plug-in hybrid and electrical vehicle business, is on target for start-up in first quarter 2012. Already revenue positive, the joint venture also began commercial production at a new facility in France, to produce battery systems to power 15,000 fully electric vehicles annually.
2010 Dow Proportionate Share of All Principal JV Sales* by Geography
North America 24%
Europe, Middle East and Africa 28%
Asia Pacific41%
Latin America7%
Equity Earnings from Nonconsolidated Affiliates($ in millions)
05
$964
06
$959
07
$1,122
08
$787
09
$630
10
$1,112
0
200
400
600
800
1000
1200
2010 Dow Proportionate Share of All Principal JV Sales* by Geography
North America 24%
Europe, Middle East and Africa 28%
Asia Pacific41%
Latin America7%
Equity Earnings from Nonconsolidated Affiliates($ in millions)
05
$964
06
$959
07
$1,122
08
$787
09
$630
10
$1,112
0
200
400
600
800
1000
1200+
1 See supplemental information on www.dow.com/financial for a description of these items.
* Adjusted Net Sales is equal to Net Sales for these joint ventures less sales to Dow and/or to other Dow joint ventures.

14 The Dow Chemical Company
Electronic and Specialty Materials
Customer-centric businesses developing customized advanced materials for applications from semiconductors and flat panel displays to water processing and cellulosics for pharmaceuticals and food
STRENGTHS & STRATEGy
• #1 or #2 positions in chemical mechanical planarization (CMP) pads/slurries, semiconductor photolithography materials and metallization for circuit boards
• #1 in reverse osmosis membranes, ion exchange resins
• Strong positions in high-growth industries: pharmaceuticals, personal care, food, water and electronics
• Well-positioned, growing manufacturing and R&D base in Asia Pacific
• Addressing growing consumer demand for sustainable products
2010 HIGHLIGHTS
• Opened world-class OLED manufacturing plant in Korea; also broke ground for new Dow Seoul Technology Center and LED precursor manufacturing plant in Korea and a new East China manufacturing center to serve electronics and photovoltaic industries
• Announced the world’s largest desalination plant will be enabled by Dow Water Process & Solutions technology
Health and Agricultural Sciences
A global leader with high-value products in plant biotechnology, agricultural chemicals, urban pest management and healthy oils
STRENGTHS & STRATEGy
• Agricultural chemistry pipeline filled with high-value solutions and proprietary formulations; new products anticipated to yield $800 million in sales by 2013
• Significant technology-driven growth, led by SmartStax™ technology today, coming with Dow Herbicide Tolerant Trait (DHT) Technology System in future
• Leading-edge insecticide, herbicide, fungicide and fumigant solutions for growers
• Bolt-on seed acquisitions continue to strengthen channel access
2010 HIGHLIGHTS
• Launched SmartStax™ and introduced SmartStax™ Refuge Advanced™ concept
• Granted patents for DHT platform in the United States, Mexico, New Zealand, South Africa and China
• Entered into cross-licensing agreements with Bayer CropScience regarding cotton technologies
• Expanded seed marketing capabilities through bolt-on acquisitions, including Grand Valley Hybrids
Coatings and Infrastructure
Industry-leading businesses focused on building solutions, construction chemicals, coating materials, and adhesives and functional polymers
STRENGTHS & STRATEGy
• World’s largest and broadest supplier of raw materials and largest R&D commitment in the coatings industry
• Focused coatings growth on low-volatile organic compound (VOC)/low-odor coatings, advanced hiding platforms, and a broad coating additives platform
• #1 position in extruded polystyrene foam insulation and cellulosic-based construction chemical additives; breakthrough development in solar shingles
• Positioned for emerging market trends, including more stringent energy standards for buildings, coating solutions for low-VOC/low-odor and solventless adhesives for sustainable packaging
2010 HIGHLIGHTS
• Introduced new coatings technology that enables superior hiding performance and reduced use of titanium dioxide; invested in new emulsion plants in East China and Vietnam
• Received UL certification for the DOW™ POWERHOUSE™ Solar Shingle
• Launched next-generation STYROFOAM™ Brand Insulation with an unprecedented 50-year warranty
152010 Annual Report
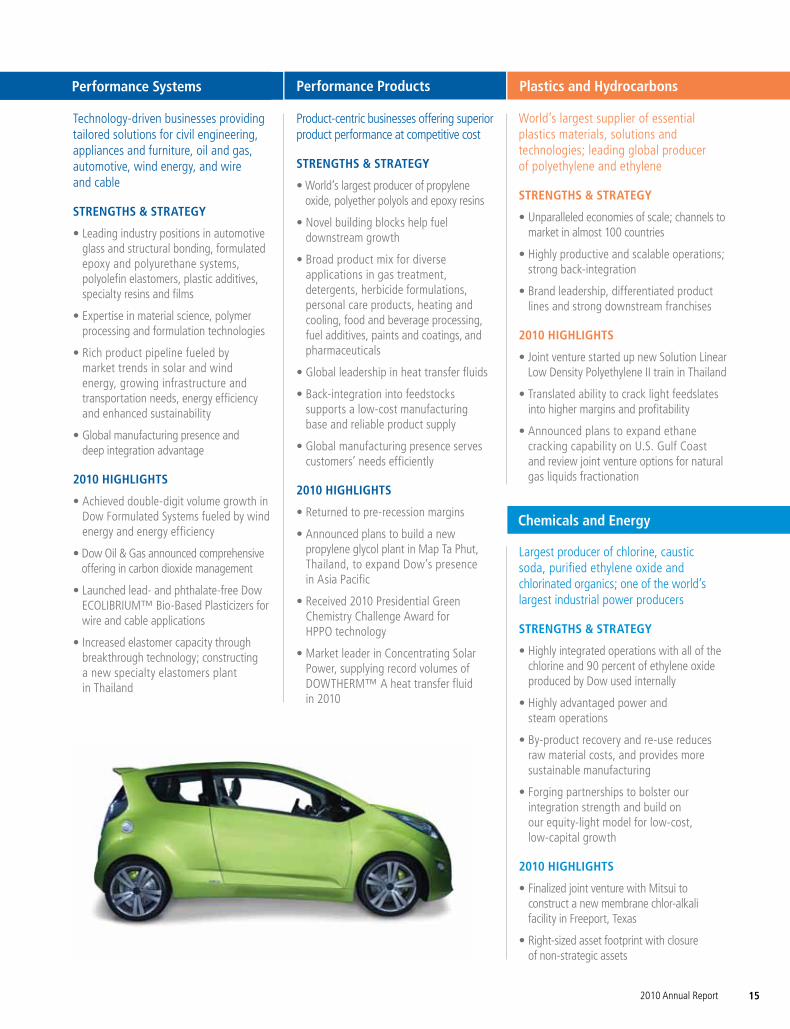
Technology-driven businesses providing tailored solutions for civil engineering, appliances and furniture, oil and gas, automotive, wind energy, and wire and cable
STRENGTHS & STRATEGy
• Leading industry positions in automotive glass and structural bonding, formulated epoxy and polyurethane systems, polyolefin elastomers, plastic additives, specialty resins and films
• Expertise in material science, polymer processing and formulation technologies
• Rich product pipeline fueled by market trends in solar and wind energy, growing infrastructure and transportation needs, energy efficiency and enhanced sustainability
• Global manufacturing presence and deep integration advantage
2010 HIGHLIGHTS
• Achieved double-digit volume growth in Dow Formulated Systems fueled by wind energy and energy efficiency
• Dow Oil & Gas announced comprehensive offering in carbon dioxide management
• Launched lead- and phthalate-free Dow ECOLIBRIUM™ Bio-Based Plasticizers for wire and cable applications
• Increased elastomer capacity through breakthrough technology; constructing a new specialty elastomers plant in Thailand
Plastics and Hydrocarbons
World’s largest supplier of essential plastics materials, solutions and technologies; leading global producer of polyethylene and ethylene
STRENGTHS & STRATEGy
• Unparalleled economies of scale; channels to market in almost 100 countries
• Highly productive and scalable operations; strong back-integration
• Brand leadership, differentiated product lines and strong downstream franchises
2010 HIGHLIGHTS
• Joint venture started up new Solution Linear Low Density Polyethylene II train in Thailand
• Translated ability to crack light feedslates into higher margins and profitability
• Announced plans to expand ethane cracking capability on U.S. Gulf Coast and review joint venture options for natural gas liquids fractionation
Performance Systems Performance Products
Product-centric businesses offering superior product performance at competitive cost
STRENGTHS & STRATEGy
• World’s largest producer of propylene oxide, polyether polyols and epoxy resins
• Novel building blocks help fuel downstream growth
• Broad product mix for diverse applications in gas treatment, detergents, herbicide formulations, personal care products, heating and cooling, food and beverage processing, fuel additives, paints and coatings, and pharmaceuticals
• Global leadership in heat transfer fluids
• Back-integration into feedstocks supports a low-cost manufacturing base and reliable product supply
• Global manufacturing presence serves customers’ needs efficiently
2010 HIGHLIGHTS
• Returned to pre-recession margins
• Announced plans to build a new propylene glycol plant in Map Ta Phut, Thailand, to expand Dow’s presence in Asia Pacific
• Received 2010 Presidential Green Chemistry Challenge Award for HPPO technology
• Market leader in Concentrating Solar Power, supplying record volumes of DOWTHERM™ A heat transfer fluid in 2010
Chemicals and Energy
Largest producer of chlorine, caustic soda, purified ethylene oxide and chlorinated organics; one of the world’s largest industrial power producers
STRENGTHS & STRATEGy
• Highly integrated operations with all of the chlorine and 90 percent of ethylene oxide produced by Dow used internally
• Highly advantaged power and steam operations
• By-product recovery and re-use reduces raw material costs, and provides more sustainable manufacturing
• Forging partnerships to bolster our integration strength and build on our equity-light model for low-cost, low-capital growth
2010 HIGHLIGHTS
• Finalized joint venture with Mitsui to construct a new membrane chlor-alkali facility in Freeport, Texas
• Right-sized asset footprint with closure of non-strategic assets

The Dow Chemical Company16
THE RIGHT PIPELINEPowered by science and connected to customer and societal needs, our innovation pipeline has a net present value of $30 billion today – triple the value in 2007. We are strategically aligning our R&D investments with key global megatrends that represent $350 billion in addressable market opportunities. From SmartStax™ seeds to revolutionary DOW™ POWERHOUSE™ solar shingles, from coating formulations that improve indoor air quality to purification solutions that deliver clean drinking water, our R&D engine is delivering breakthrough technologies and driving Dow’s growth – while also helping to shape the future.
Managing for Results
Our commitment to innovation has never wavered. In 2010, despite a sluggish economy, we continued our strong investment in R&D, increasing spending to $1.7 billion. Plus, our stringent R&D pipeline management system helps ensure we optimize our investments in these important ways:
• A heightened customer and market focus. We systematically identify market opportunities, then meet them with targeted solutions that help our customers win in the marketplace. Voice-of-the-customer research and strong cross-collaboration between functions and businesses help pinpoint unmet needs.
• Disciplined, cross-company portfolio management. Our Innovation Growth Playbook is used to optimize the distribution of long- and short-term projects in our pipeline. Based on a 10-year horizon, these R&D projects are prioritized, first within individual business units, and then ultimately across the Company as a whole. This allows us to allocate our resources to the projects with the highest potential return.
• An R&D organization that targets both short-term business objectives and long-term strategic research. In 2010, approximately 75 percent of our Core R&D funds were allocated directly to the businesses. This allows us to strengthen our market leadership in existing technologies, while capturing growth opportunities through new markets or disruptive, technological change.
• A world-class team of more than 6,000 researchers. Increasingly, we are taking a global approach to innovation, and in 2010, we hired more than 100 new PhDs from the world’s top universities. We operate more than 40 R&D facilities globally, and are planning a new R&D center at the King Abdullah University of Science and Technology in Saudi Arabia. This global approach to finding the best intellectual power helps us remain competitive in local markets and enables us to attract top talent.
Accelerating Innovation through Collaboration
Dow multiplies the power of our R&D investments and our innovation reach through our ever-growing global network of innovation partners.
Most recently, we teamed with Oak Ridge National Laboratory to create a Center of Energy Excellence to research the development of low-cost carbon fiber for wind turbines. We also work with top R&D talent at premier educational institutions. For example, with the California Institute of Technology, we are developing next- generation, low-cost, high-efficiency photovoltaic materials. With Shanghai Jiao Tong University in China, we are making advances in polymer science. And at Northwestern University, we are partnering to extend our expertise in catalysis.
Dow’s R&D investments are strategically aligned to megatrends that represent $350 billion in addressable market opportunities with growth rates of between 1.3 and 3 times GDP.

17
Innovating for Growth
Dow’s R&D pipeline is deep and diverse. We have more than 500 projects in our pipeline that together represent a non-risk- adjusted net present value (NPV) of $30 billion, or $12 billion on a risk-adjusted basis.
The health of this pipeline is evident with more than $16 billion in non-risk-adjusted NPV in early-stage exploration and $6 billion in projects approaching commercialization. Our rigorous prioritization continues to ensure that we support opportunities to investigate a wide variety of disruptive innovative technologies, while continuing to deliver near-term, bottom-line results.
STRATEGy-IN-ACTION
Technology Integration: A Powerful Path to Innovation
By using our scope and scale to connect our materials science expertise to customer needs, we are using a single epoxy molecule to create formulations for a product as small as a 35 nm chip and as large as a 60-meter wind blade. This new epoxy formulation combines excellent thermal characteristics and strong bonding capabilities with flow properties that make it an ideal underfill for “flip chips” – a chip packaging technique that is favored in smart phones and other lightweight electronic devices.
But that is not all. This epoxy has properties that give it a fast infusion rate and make it perfect for the efficient manufacture of wind turbine blades. Two demanding industries. Two critical market needs. One promising material used to create high-margin, revolutionary customer solutions. This is the power of technology integration. This is the power of one Dow.
Among our achievements in 2010:
• Our breakthrough DOW™ POWERHOUSE™ Solar Shingle passed more than 50 third-party tests to achieve UL certification, a critical milestone for 2011 commercialization.
• SmartStax™ trait technology, developed under an R&D and cross-licensing agreement between Dow AgroSciences and Monsanto, was commercially launched in North America.
• Dow AgroSciences was granted patents in key countries for Dow Herbicide Tolerant Trait Technology in corn. When launched, the new technology system will enable exceptional weed control by partnering with and improving current cropping systems to offer growers unsurpassed flexibility, convenience and value.
• Our 16-inch membrane reverse osmosis water filters were chosen to be used in the world’s largest desalination plant in Israel. These new filters are twice the size of previous units, helping to make the production of clean drinking water from seawater more affordable and energy efficient.
R&D Pipeline ValuationNPV ($ in billions)
5
10
17
28 30
1997 2007 2008 2009 2010
Preservative
Advanced Materials Division
Performance Division
Dow AgroSciences
Corporate and New Businesses
Basics
2010 Annual Report
• Our portfolio of low-VOC/low-odor binders continues to gain wide acceptance by paint manufacturers worldwide. Led by the suite of acrylic-based AVANSE™ binders, the portfolio provides tough, durable coatings that meet the most stringent VOC and environmental standards.
• Dow Electronic Materials introduced new products in a variety of areas – including polishing pads, slurries, photoresists, metallization and films – helping to further our leadership positions in the industry. In fact, more than 95 percent of all smart phones are manufactured using products from Dow Electronic Materials.
• Dow Coating Materials introduced a new technology platform that takes hiding capability to a new level by significantly reducing customers’ dependence on titanium dioxide.
• Dow Oil & Gas launched ELEVATE™ CO2 Enhanced Oil Recovery Conformance Solution, an innovative, new technique designed to increase oil production at existing wells while simultaneously reducing operating expenditures.
2010 Pipeline Valuation by Stage ($ in billions)
Exploration
16.3
2.5
Development
6.4
3.7
Implementation
6.95.8
NPV
Risk-Adjusted NPV
0.000000
4.075000
8.150000
12.224999
16.299999

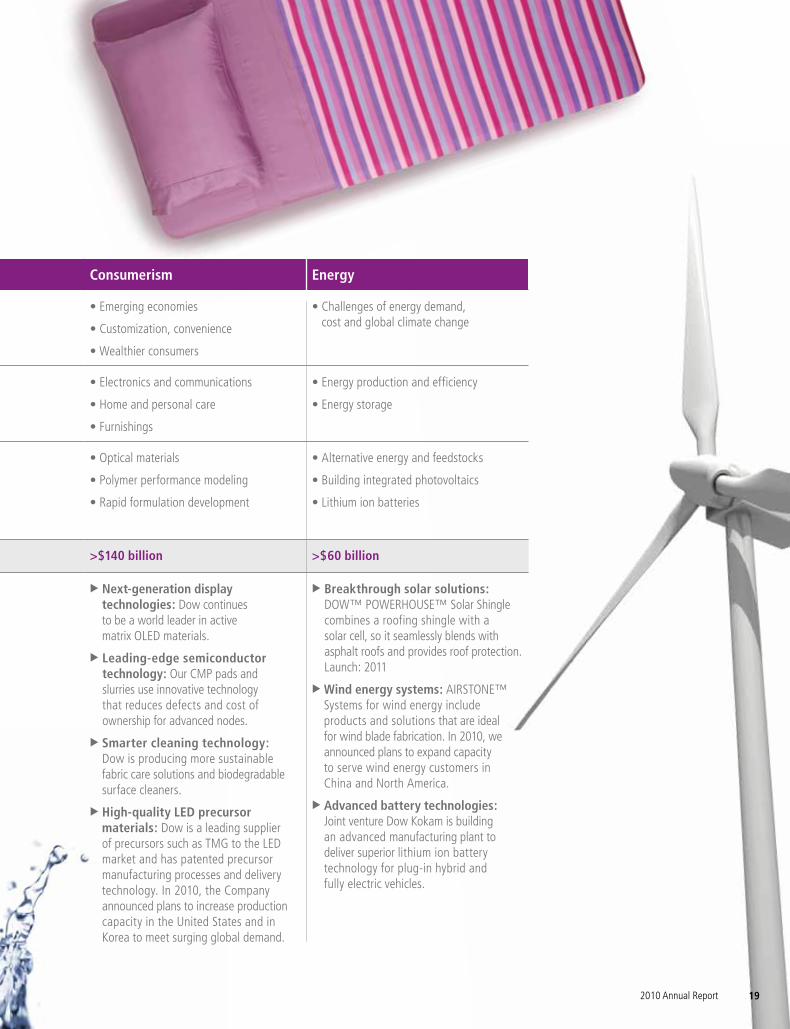
Tomorrow’s Growth Drivers – Four Key MegatrendsOur R&D investments are strategically aligned with four key megatrends: Health and Nutrition, Transportation and Infrastructure, Consumerism, and Energy. These megatrends represent $350 billion in addressable market opportunities with above-average growth rates of up to three times global GDP. By aligning our R&D investments to these very real growth drivers, we are delivering practical solutions for clean water, affordable energy and increased food resources, while creating new earnings streams for Dow.
Health and Nutrition Transportation and Infrastructure Consumerism Energy
Market Drivers • Emerging economies
• Higher living standards
• Aging populations
• Urbanization
• Aging infrastructure
• Global integration
• Emerging economies
• Customization, convenience
• Wealthier consumers
• Challenges of energy demand, cost and global climate change
Opportunity Areas • Agriculture
• Functional foods
• Health care
• Construction and transportation
• Coatings
• Water
• Electronics and communications
• Home and personal care
• Furnishings
• Energy production and efficiency
• Energy storage
Key Dow Capabilities • Biotechnology
• Chemistry
• Material sciences
• Building materials
• Advanced materials science
• Filter membrane elements
• High throughput formulations capability
• Optical materials
• Polymer performance modeling
• Rapid formulation development
• Alternative energy and feedstocks
• Building integrated photovoltaics
• Lithium ion batteries
Dow Addressable Market >$70 billion >$75 billion >$140 billion >$60 billion
Recent Innovations u Leading seed traits in development: Proprietary Dow Herbicide Tolerant Trait Technology and SmartStax™ Refuge Advanced™, a blended product of 95 percent SmartStax™ and 5 percent non-insect-traited seed, deliver growth opportunities in key row crops.
u Healthier oils: In 2010, zero trans fat Omega-9 oils were introduced in microwave popcorn, resulting in 60 percent less saturated fat and nearly 40 percent fewer calories than other microwave popcorns.
u Pharma solutions: METHOCEL™ Direct Compression (DC) Premium Grade Hypromellose Polymers deliver cost effective, performance-enhancing drug processing and delivery solutions.
u Solutions for cleaner air: AERIFY™ diesel particulate filters will deliver lower emissions and reduce impact on fuel economy. Launch: 2012
u Solutions for improved coatings: Our next-generation hiding coatings technology significantly reduces manufacturers’ dependence on titanium dioxide while also addressing performance, reducing VOCs and providing better economics.
u Solutions for cleaner water: Dow’s membrane technologies are positioned to reduce the cost of desalination and reuse 35 percent by 2015.
u Next-generation display technologies: Dow continues to be a world leader in active matrix OLED materials.
u Leading-edge semiconductor technology: Our CMP pads and slurries use innovative technology that reduces defects and cost of ownership for advanced nodes.
u Smarter cleaning technology: Dow is producing more sustainable fabric care solutions and biodegradable surface cleaners.
u High-quality LED precursor materials: Dow is a leading supplier of precursors such as TMG to the LED market and has patented precursor manufacturing processes and delivery technology. In 2010, the Company announced plans to increase production capacity in the United States and in Korea to meet surging global demand.
u Breakthrough solar solutions: DOW™ POWERHOUSE™ Solar Shingle combines a roofing shingle with a solar cell, so it seamlessly blends with asphalt roofs and provides roof protection. Launch: 2011
u Wind energy systems: AIRSTONE™ Systems for wind energy include products and solutions that are ideal for wind blade fabrication. In 2010, we announced plans to expand capacity to serve wind energy customers in China and North America.
u Advanced battery technologies: Joint venture Dow Kokam is building an advanced manufacturing plant to deliver superior lithium ion battery technology for plug-in hybrid and fully electric vehicles.
The Dow Chemical Company18
19
Health and Nutrition Transportation and Infrastructure Consumerism Energy
Market Drivers • Emerging economies
• Higher living standards
• Aging populations
• Urbanization
• Aging infrastructure
• Global integration
• Emerging economies
• Customization, convenience
• Wealthier consumers
• Challenges of energy demand, cost and global climate change
Opportunity Areas • Agriculture
• Functional foods
• Health care
• Construction and transportation
• Coatings
• Water
• Electronics and communications
• Home and personal care
• Furnishings
• Energy production and efficiency
• Energy storage
Key Dow Capabilities • Biotechnology
• Chemistry
• Material sciences
• Building materials
• Advanced materials science
• Filter membrane elements
• High throughput formulations capability
• Optical materials
• Polymer performance modeling
• Rapid formulation development
• Alternative energy and feedstocks
• Building integrated photovoltaics
• Lithium ion batteries
Dow Addressable Market >$70 billion >$75 billion >$140 billion >$60 billion
Recent Innovations u Leading seed traits in development: Proprietary Dow Herbicide Tolerant Trait Technology and SmartStax™ Refuge Advanced™, a blended product of 95 percent SmartStax™ and 5 percent non-insect-traited seed, deliver growth opportunities in key row crops.
u Healthier oils: In 2010, zero trans fat Omega-9 oils were introduced in microwave popcorn, resulting in 60 percent less saturated fat and nearly 40 percent fewer calories than other microwave popcorns.
u Pharma solutions: METHOCEL™ Direct Compression (DC) Premium Grade Hypromellose Polymers deliver cost effective, performance-enhancing drug processing and delivery solutions.
u Solutions for cleaner air: AERIFY™ diesel particulate filters will deliver lower emissions and reduce impact on fuel economy. Launch: 2012
u Solutions for improved coatings: Our next-generation hiding coatings technology significantly reduces manufacturers’ dependence on titanium dioxide while also addressing performance, reducing VOCs and providing better economics.
u Solutions for cleaner water: Dow’s membrane technologies are positioned to reduce the cost of desalination and reuse 35 percent by 2015.
u Next-generation display technologies: Dow continues to be a world leader in active matrix OLED materials.
u Leading-edge semiconductor technology: Our CMP pads and slurries use innovative technology that reduces defects and cost of ownership for advanced nodes.
u Smarter cleaning technology: Dow is producing more sustainable fabric care solutions and biodegradable surface cleaners.
u High-quality LED precursor materials: Dow is a leading supplier of precursors such as TMG to the LED market and has patented precursor manufacturing processes and delivery technology. In 2010, the Company announced plans to increase production capacity in the United States and in Korea to meet surging global demand.
u Breakthrough solar solutions: DOW™ POWERHOUSE™ Solar Shingle combines a roofing shingle with a solar cell, so it seamlessly blends with asphalt roofs and provides roof protection. Launch: 2011
u Wind energy systems: AIRSTONE™ Systems for wind energy include products and solutions that are ideal for wind blade fabrication. In 2010, we announced plans to expand capacity to serve wind energy customers in China and North America.
u Advanced battery technologies: Joint venture Dow Kokam is building an advanced manufacturing plant to deliver superior lithium ion battery technology for plug-in hybrid and fully electric vehicles.
2010 Annual Report

The Dow Chemical Company20
Driving Growth in Emerging Geographies
Because of Dow’s transformed portfolio of value-added technology businesses and our broad geographic reach, our sales from emerging geographies again increased in 2010. For the year, emerging geographies generated 34 percent of total sales. In fact, sales in these areas surpassed $16 billion in 2010, setting an all-time record for the Company.
To accelerate our ongoing transformation, Dow is building its presence in high-growth, high-potential geographies such as Greater China, Southeast Asia, Latin America, Eastern Europe, the Middle East and Africa. We are increasing investment in our advanced innovation capability, world-class local talent and differentiated product portfolios to support our customers’ businesses – and the demands of new middle-class consumers.
Our investments in 2010 included:
• The start-up of a specialty polyethylene plant in Thailand, capturing our share of growth in the region.
• Construction of a Dow Electronic Materials plant in eastern China to meet material demands of the Chinese photovoltaic and electronics industry.
• Construction of a new manufacturing facility in southern Vietnam for the production of polymers used in the paint, coatings, construction, packaging, home and personal care industries.
• The addition of a new Dow Seoul Technology Center in Korea focused on technological advancements in flat panel display technologies, semiconductor devices and related applications.
• The inauguration of a new OLED Electronic Materials facility in Korea. During the last 10 years, Dow has invested more than $300 million in the Korean electronic materials industry to support new business development, manufacturing, and research and development.
THE RIGHT GEOGRAPHIC PRESENCEToday, Dow is poised to succeed as one of the most global corporations in the world. Our geographic reach, in developed and developing markets alike, allows us to capture new opportunities and strengthen our ability to achieve sustainable growth. Today we are accelerating our growth by bringing our innovations to emerging economies – regions where fast population growth and a growing middle class are resulting in new demand for our products and double-digit growth for the Company in 2010.
28%
2008 Pro Forma Sales2010 Sales
32%
Projected 2012
35%
2010 Sales by Geography
North America
Europe, Middle East and Africa
Asia Pacific
Latin America
36%
34%
18%
12%
Emerging Geographies
Developed Geographies

GEOGRAPHIC PRESENCE – CHINA Elevating Competitiveness through Mega Projects
Our investments in mega projects are a cornerstone of our geographic growth strategy. These projects provide capacity for the building blocks needed to support the continued growth of our Performance and market-driven businesses – and our customers’ growth.
Our mega projects follow an equity-light model, in which we share the assets and costs with a regional partner. This allows us to maintain our integration and our size, while freeing up capital for investments in our Performance and Advanced Materials businesses. In 2010, we continued to make significant progress with several mega projects:
• We entered into the final stages of the front-end engineering and design study of a proposed joint venture project with Saudi Aramco. Dow and Saudi Aramco are working to build a world-scale integrated chemicals complex in Jubail, Saudi Arabia. The complex will provide access to advantaged feedstock and increase capacity for our Performance businesses.
• In Thailand, we invested in expanding and growing our Performance businesses in Asia Pacific through our joint ventures with The Siam Cement Group. The site is fully integrated with feedstock supply from a nearby cracker, and in 2010, we launched our Solution Linear Low Density Polyethylene II train. World-scale Specialty Elastomers and HPPO plants are also under construction, and we have announced plans to build a propylene glycol facility as well.
• In China, Dow and the Shenhua Group are completing a feasibility study to build and operate a world-scale integrated complex in Yulin City. This project recently reached a key milestone when the partnership submitted the formal Project Application Report to the Chinese government.
Winning Locally
Ultimately, we will grow our geographic presence through strong local relationships, strong local knowledge and strong local talent. To reach our growth objectives, Dow has implemented a new geographic operating model that places senior executives in critical strategic leadership roles at the local level. We have also introduced the Geographic Leadership Council, which plays an active role in driving business development, fortifying government relationships, enhancing customer interaction, and participating in employee management and development.
Dow in China: Innovating for Growth
At the Shanghai Dow Center, Dow researchers and customers are working side-by-side to turn market opportunities into profitable solutions. The R&D facility’s unique Customer Innovation Center converts concepts into prototypes – giving customers a first-hand opportunity to experience how their lotions will feel on their customers’ skin or how their paints will be nearly odorless.
By investing in people, infrastructure and research, Dow is able to quickly find solutions to unique local needs and tap new opportunities in new markets. For example, with the acquisition of Rohm and Haas in 2009, Dow has significantly expanded its electronic materials footprint and coatings capacity in mainland China and Taiwan.
As a result, nearly 90 percent of Dow’s revenue in Greater China was derived from our combined Performance segments in 2010.
Three decades after Dow first began doing business in China, the Shanghai Dow
Center demonstrates how Dow is using its innovation pipeline to support the growth of its customers in China. The center houses more than 1,500 employees, including some 500 scientists and researchers working across 80 integrated labs.
+
212010 Annual Report
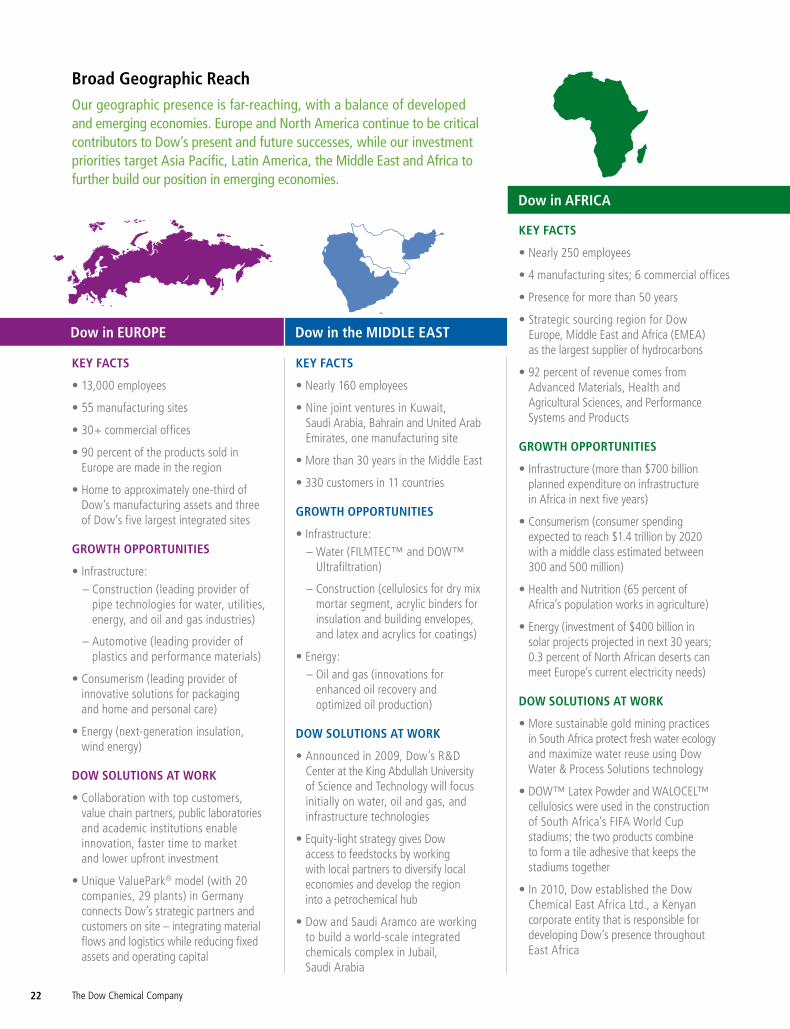
The Dow Chemical Company22
Dow in AFRICA
KEy FACTS
• Nearly 250 employees
• 4 manufacturing sites; 6 commercial offices
• Presence for more than 50 years
• Strategic sourcing region for Dow Europe, Middle East and Africa (EMEA) as the largest supplier of hydrocarbons
• 92 percent of revenue comes from Advanced Materials, Health and Agricultural Sciences, and Performance Systems and Products
GROWTH OPPORTUNITIES
• Infrastructure (more than $700 billion planned expenditure on infrastructure in Africa in next five years)
• Consumerism (consumer spending expected to reach $1.4 trillion by 2020 with a middle class estimated between 300 and 500 million)
• Health and Nutrition (65 percent of Africa’s population works in agriculture)
• Energy (investment of $400 billion in solar projects projected in next 30 years; 0.3 percent of North African deserts can meet Europe’s current electricity needs)
DOW SOLUTIONS AT WORK
• More sustainable gold mining practices in South Africa protect fresh water ecology and maximize water reuse using Dow Water & Process Solutions technology
• DOW™ Latex Powder and WALOCEL™ cellulosics were used in the construction of South Africa’s FIFA World Cup stadiums; the two products combine to form a tile adhesive that keeps the stadiums together
• In 2010, Dow established the Dow Chemical East Africa Ltd., a Kenyan corporate entity that is responsible for developing Dow’s presence throughout East Africa
Dow in the MIDDLE EAST
KEy FACTS
• Nearly 160 employees
• Nine joint ventures in Kuwait, Saudi Arabia, Bahrain and United Arab Emirates, one manufacturing site
• More than 30 years in the Middle East
• 330 customers in 11 countries
GROWTH OPPORTUNITIES
• Infrastructure:– Water (FILMTEC™ and DOW™
Ultrafiltration)
– Construction (cellulosics for dry mix mortar segment, acrylic binders for insulation and building envelopes, and latex and acrylics for coatings)
• Energy:– Oil and gas (innovations for
enhanced oil recovery and optimized oil production)
DOW SOLUTIONS AT WORK
• Announced in 2009, Dow’s R&D Center at the King Abdullah University of Science and Technology will focus initially on water, oil and gas, and infrastructure technologies
• Equity-light strategy gives Dow access to feedstocks by working with local partners to diversify local economies and develop the region into a petrochemical hub
• Dow and Saudi Aramco are working to build a world-scale integrated chemicals complex in Jubail, Saudi Arabia
KEy FACTS
• 13,000 employees
• 55 manufacturing sites
• 30+ commercial offices
• 90 percent of the products sold in Europe are made in the region
• Home to approximately one-third of Dow’s manufacturing assets and three of Dow’s five largest integrated sites
GROWTH OPPORTUNITIES
• Infrastructure:– Construction (leading provider of
pipe technologies for water, utilities, energy, and oil and gas industries)
– Automotive (leading provider of plastics and performance materials)
• Consumerism (leading provider of innovative solutions for packaging and home and personal care)
• Energy (next-generation insulation, wind energy)
DOW SOLUTIONS AT WORK
• Collaboration with top customers, value chain partners, public laboratories and academic institutions enable innovation, faster time to market and lower upfront investment
• Unique ValuePark® model (with 20 companies, 29 plants) in Germany connects Dow’s strategic partners and customers on site – integrating material flows and logistics while reducing fixed assets and operating capital
Dow in EUROPE
Broad Geographic ReachOur geographic presence is far-reaching, with a balance of developed and emerging economies. Europe and North America continue to be critical contributors to Dow’s present and future successes, while our investment priorities target Asia Pacific, Latin America, the Middle East and Africa to further build our position in emerging economies.

2010 Annual Report 23
Dow in NORTH AMERICA
KEy FACTS
• 25,000 employees
• 59 manufacturing sites
• Investments in higher-margin, higher-growth businesses
• Leader in responsible operations and innovations that address energy challenges
• Strong network of manufacturing, sales and R&D facilities
• Large, integrated sites that provide a competitive cost advantage
GROWTH OPPORTUNITIES
• Energy (innovations in solar and next-generation energy storage technology)
• Health and Nutrition (investments in branded seeds and new trait innovations are accelerating our growth in U.S. corn and cotton)
DOW SOLUTIONS AT WORK
• Joint venture between Dow and Mitsui to construct a new membrane chlor-alkali facility in Freeport, Texas
• Multiple investments in advanced manufacturing at Dow’s Michigan Operations in Midland are resulting in new green-technology jobs: – About 100 new jobs were created
to support development of the DOW™ POWERHOUSE™ Solar Shingle
– Joint venture Dow Kokam world-scale lithium ion battery manufacturing facility is expected to employ more than 800 people when fully operational
– Dow and Tata Consultancy Services began construction of a new Business Process Services Center in Midland, supporting a business service model that is expected to optimize services while creating new jobs for the region
Dow in ASIA PACIFIC
KEy FACTS
• 7,000 employees
• 43 manufacturing sites
• 18 percent of global sales
• Double-digit growth fueled by market-driven Advanced Materials businesses
• Investments expanding in region, with $400 million in capital investments in Advanced Materials in the next three years, $800 million in Thailand joint venture investment in the next two years, new emulsion plant in Vietnam, and mega project in China
• Key strategic alignments with top customers in the region
GROWTH OPPORTUNITIES
• Infrastructure (well-positioned with industry-leading water filtration technology and leading coatings franchise)
• Energy (supplies resin formulation for wind blades for all major global turbine producers)
• Health and Nutrition (Dow AgroSciences rice oil opportunities)
• Consumerism (leading supplier of electronic materials)
DOW SOLUTIONS AT WORK
• New Dow Technology Center in Korea is strategically located to engage key semiconductor and display customers in Asia Pacific and will house 200–300 scientists
• Dow and the Shenhua Group are working together to build and operate a world-scale integrated complex of coal, power and chemicals in Yulin City, Shaanxi Province
Dow in LATIN AMERICA
KEy FACTS
• 4,000 employees
• 27 manufacturing sites
• 12 percent of Dow’s global sales
• Sustainability drives innovation (Brazil leads in sugarcane-based ethanol production)
• Recognized as a top employer in Brazil, Colombia, Argentina, Mexico and Chile
GROWTH OPPORTUNITIES
• Health and Nutrition (growth-driving region for Dow AgroSciences, doubled agrochemicals capacity in Argentina)
• Energy (plastic innovations, including renewable energy alternatives, lightweighting of vehicles)
• Consumerism (sustainable packaging for beverages, household and personal care driven by growing consumer base)
• Transportation and Infrastructure (government investments in infrastructure and growth of middle class is boosting sales in coatings, insulation products and adhesives; robust automotive production)
DOW SOLUTIONS AT WORK
• Developing plans for world-scale integrated industrial park to make polyethylene from sugarcane in Brazil
• Collaboration through Dow’s we.nnovate program and the Latin America Customer Academy fosters innovation across sites and identifies future market opportunities and joint projects

The Dow Chemical Company24
THE RIGHT INvESTMENTS IN PEOPLE AND THE PLANETSustainability means making every decision with the future in mind. At Dow, we are committed to minimizing our impact and to delivering solutions that help our customers and the rest of society do the same. We believe that if you want to make sustainability about more than just words, you have to set the bar high and measure your progress rigorously.
2010 marks the mid-point of our 2015 Sustainability Goals. These 10-year commitments go beyond our own footprint and include goals that connect our businesses with helping to solve the world’s biggest challenges – energy, climate change, water, food, housing and health. Science for a sustainable world – this is our contribution to protecting the planet.
Innovations for Tomorrow
• Dow is addressing the global water crisis on multiple fronts, including lower-cost desalination technologies, more effective ultrafiltration systems and support of initiatives such as Dow Live Earth Run for Water, a series of 6 km run/walks held in cities across the world to raise awareness and funds for clean drinking water.
• We are investing in next-generation solar technologies across the entire value chain – from expanding polycrystalline silicon production through Dow Corning’s Hemlock Semiconductor joint venture to manufacturing our breakthrough DOW™ POWERHOUSE™ Solar Shingle for homeowners.
• We continue to innovate technologies for more efficient wind energy. In 2010, we partnered with Astraeus Wind Energy, Inc. and MAG Industrial Automation Systems to improve the manufacture of wind turbine blades.
• As a recognized leader in building insulation applications, Dow Building & Construction was selected by the U.S. Department of Energy to lead a multi-year project that will combine research and residential in-home testing to develop enhanced home energy-efficiency retrofit solutions.
Responsible Operations
• In 2010, Dow received the National Safety Council’s prestigious Robert W. Campbell Award. This international award recognizes a company that upholds Environment, Health and Safety (EH&S) as a key business
value and clearly links measurable achievement in EH&S performance to productivity and profitability.
• Since 1994, Dow has prevented more than 90 million metric tons of carbon dioxide (CO2) from entering the atmosphere and saved more than $9 billion in energy costs. And we continue to improve our processes. For example, our patented flare technology, which uses hydrogen instead of methane at selected sites, will save more than $10 million during the next 10 years and eliminate 27,000 metric tons of emissions each year – the equivalent of taking about 4,600 cars off the road.
• Our industrial energy-efficiency efforts have saved 1,800 trillion Btu – equivalent to the electrical usage of all the residential homes in California for more than 20 months.
• Our products reduce greenhouse gases by multiples of our own emissions on an annual basis. A third-party-validated life cycle assessment found the use of insulation products such as STYROFOAM™ Brand Insulation avoids emissions that are six times greater than our Company’s annual emissions.

25
Smart Solutions for Today
• Dow’s clean and sustainable innovations – such as the world’s first halogen-free solution for flexible cords and functional paint technologies that reduce formaldehyde levels in the air – are expected to create $20 billion in market opportunities.
• Michigan’s first affordable net-zero energy home uses readily available energy-efficiency technologies from Dow. The house is expected to save $3,500 in energy costs and avert 45,000 pounds of CO2 annually.
• We successfully completed a two-year, multimillion-dollar project to transform our energy-saving STYROFOAM™ Brand Insulation to a more sustainable manufacturing technology in North America, eliminating the use of ozone-depleting substances, and cutting in half the greenhouse gas emissions from its production at converted facilities.
Partners for Change
• We partnered with leading organizations such as Change the Equation and the International Year of Chemistry to advance science, technology, engineering and math education.
• We were named a lead industrial partner to the U.S./China Cleaner Energy Resource Center for Building Energy Efficiency, which will conduct research to save energy and cut costs in buildings.
• Our capital investments in WaterHealth International impact the lives of two million people in India. Plus, in response to the Haiti earthquake, we donated Dow Water & Process Solutions equipment and raw materials to several non-governmental organizations.
• Dow AgroSciences is collaborating with Donald Danforth Plant Science Center to study how our EXZACT™ Precision Technology can help improve the nutritional value and virus resistance of the root crop cassava for millions of people living in developing nations, particularly in Africa.
• Through the Dow Sustainability Corps, we put the talents of our employees to work, addressing sustainable development challenges across the world. Our employees conducted seven projects across the globe, teaming with Central America Medical Outreach, Pure Water for the World and The Nature Conservancy, among others.
• In partnership with Habitat for Humanity International, Dow sponsored 19 builds, including projects in India and Egypt, to provide safe, affordable and energy-efficient housing to families across the world. We also participated in the 19th Jimmy Carter Work Project, which built 80 homes in four U.S. cities.
2010 Recognitions
• Awarded an unprecedented seventh U.S. Presidential Green Chemistry Challenge Award for our hydrogen peroxide to propylene oxide (HPPO) technology, jointly developed with BASF
• Named a 2010 Leader of Change by the Foundation for Social Change (FSC) and the United Nations Office for Partnerships
• Awarded first-ever “Employee Volunteers in Action Award” from Keep America Beautiful® for Dow’s engagement at 49 sites with more than 600 employees
• Named a finalist for the U.S. Chamber of Commerce’s 2010 Corporate Citizenship Award for International Community Service. Recognized for our commitment to provide safe, affordable, energy-efficient housing to families worldwide through our partnership with Habitat for Humanity
• Achieved A+ rating for Global Reporting Initiative report for the third consecutive year
• Named for the 10th time to the Dow Jones Sustainability World Index
• Added to NASDAQ OMX CRD Global Sustainability 50 Index
STRATEGy-IN-ACTION
First-of-Kind Collaboration to Demonstrate Business Opportunities in Protecting Nature
Dow and The Nature Conservancy are embarking on a groundbreaking collaboration to help companies integrate the value of nature into top-line strategies and goals.
Announced in January 2011, the collaboration will use scientific models, maps and analyses to measure the benefits that nature provides for people – such as clean air, water and food – and then apply them to help guide Dow’s business decisions. Dow will use the information, for example, to make informed decisions regarding land and water management, site selection and development, and natural resource management on Dow lands and waterways. Dow and its philanthropic arm, The Dow Chemical Foundation, have committed $10 million to the five-year project.
A major objective of the project is to share all tools and results publicly and through peer review, so that other companies, scientists and interested parties can test and apply the learnings.
2010 Annual Report

0.000
0.514
1.028
1.542
2.056
0.000
0.514
1.028
1.542
2.056
Injury and Illness Rate(recordable incidents per
200,000 work hours)
Loss of Primary Containment Incidents(number of incidents)
0.000000
17.800001
35.600002
53.400003
71.200005
0
2
4
6
8
10
0.000000
17.800001
35.600002
53.400003
71.200005
0.000000
1233.600118
2467.200235
3700.800353
4934.400471
0.0
0.2
0.4
0.6
0.8
Process Safety(number of incidents)
Energy Intensity(BTUs per pound of production)
Percent of Company Sales with Sustainability
Advantage
090807 13 1410 11 12 150
2
4
6
8
10
0.000000
11.111111
22.222222
33.333333
44.444444
55.555556
66.666667
77.777778
88.888889
100.000000
0.000000
11.111111
22.222222
33.333333
44.444444
55.555556
66.666667
77.777778
88.888889
100.000000
-261.000000
-216.714302
-172.428604
-128.142906
-83.857208
-39.571510
4.714188
48.999886
GHG Emissions (millon metric tons of CO2-equivalent)
(Kyoto and non-Kyoto)
1109 100807 1512 13 14
Percent of Sales with Sustainable Chemistry Advantages
1.71
Greenhouse Gas Emissions (millon metric tons of CO2-equivalent, Kyoto and non-Kyoto)
51 52 48 45 43 43*
070605 08 09 10Direct and Indirect Absolute GHG Emissions from Operations
Avoided Emissions Attributable to Dow Insulation in Service
060594 07 08 09 10 11 12 13 14 15
Injury and Illness(recordable incidents per 200,000 work hours)
2.57
060594 07 08 09 10 11 12 13 14 15
Energy Intensity(Btu per pound of production)
060594 07 08 09 10 11 12 13 14 15
060594 07 08 09 10 11 12 13 14 15
Percent of Sales Covered by Assessments
Sales Covered by Assessments
0
070605 08 09 10 11 12 13 14 15
7
0.000000
523.200012
1046.400024
1569.600037
2092.800049
060594 07 08 09 10 11 12 13 14 150.000000
523.200012
1046.400024
1569.600037
2092.800049
0605 07 08 09 10 11 12 13 14 15
Loss of Primary Containment Incidents(number of incidents)
94
2,61
6
0605 07 08 09 10 11 12 13 14 15
Process Safety(number of incidents)
59
90
69
74
0605 07 08 09 10 11 12 13 14 15
33
48
69
23
1.69
3.42
6,16
8
7,87
5
6,03
8
5,83
2
5,84
9
5,98
6
6,02
8
0.52
0.48
0.38
0.40
0.29 0.32
1,32
0
461
355
1,10
5
920
768
44 45
*Estimate
0.000
0.514
1.028
1.542
2.056
0.000
0.514
1.028
1.542
2.056
Injury and Illness Rate(recordable incidents per
200,000 work hours)
Loss of Primary Containment Incidents(number of incidents)
0.000000
17.800001
35.600002
53.400003
71.200005
0
2
4
6
8
10
0.000000
17.800001
35.600002
53.400003
71.200005
0.000000
1233.600118
2467.200235
3700.800353
4934.400471
0.0
0.2
0.4
0.6
0.8
Process Safety(number of incidents)
Energy Intensity(BTUs per pound of production)
Percent of Company Sales with Sustainability
Advantage
090807 13 1410 11 12 150
2
4
6
8
10
0.000000
11.111111
22.222222
33.333333
44.444444
55.555556
66.666667
77.777778
88.888889
100.000000
0.000000
11.111111
22.222222
33.333333
44.444444
55.555556
66.666667
77.777778
88.888889
100.000000
-261.000000
-216.714302
-172.428604
-128.142906
-83.857208
-39.571510
4.714188
48.999886
GHG Emissions (millon metric tons of CO2-equivalent)
(Kyoto and non-Kyoto)
1109 100807 1512 13 14
Percent of Sales with Sustainable Chemistry Advantages
1.71
Greenhouse Gas Emissions (millon metric tons of CO2-equivalent, Kyoto and non-Kyoto)
51 52 48 45 43 43*
070605 08 09 10Direct and Indirect Absolute GHG Emissions from Operations
Avoided Emissions Attributable to Dow Insulation in Service
060594 07 08 09 10 11 12 13 14 15
Injury and Illness(recordable incidents per 200,000 work hours)
2.57
060594 07 08 09 10 11 12 13 14 15
Energy Intensity(Btu per pound of production)
060594 07 08 09 10 11 12 13 14 15
060594 07 08 09 10 11 12 13 14 15
Percent of Sales Covered by Assessments
Sales Covered by Assessments
0
070605 08 09 10 11 12 13 14 15
7
0.000000
523.200012
1046.400024
1569.600037
2092.800049
060594 07 08 09 10 11 12 13 14 150.000000
523.200012
1046.400024
1569.600037
2092.800049
0605 07 08 09 10 11 12 13 14 15
Loss of Primary Containment Incidents(number of incidents)
94
2,61
6
0605 07 08 09 10 11 12 13 14 15
Process Safety(number of incidents)
59
90
69
74
0605 07 08 09 10 11 12 13 14 15
33
48
69
23
1.69
3.42
6,16
8
7,87
5
6,03
8
5,83
2
5,84
9
5,98
6
6,02
8
0.52
0.48
0.38
0.40
0.29 0.32
1,32
0
461
355
1,10
5
920
768
44 45
*Estimate
2015 Sustainability Goal UpdatesDow’s 2015 Sustainability Goals address a broad spectrum of commitments to our stakeholders – our customers, employees, global communities, stockholders and the environment. We take our commitments seriously and report quarterly on our progress. A summary of our 2010 progress is below. More detailed goal descriptions and complete reports can be viewed at www.dow.com/commitments.
Local Protection of Human Health and the Environment
GOAL: Achieve, on average, a 75 percent improvement in key indicators for Environment, Health & Safety operating excellence from the 2005 baseline
Product Safety Leadership
GOAL: Publish Product Safety Assessments for all products
Dow is committed to making Product Safety Assessments (PSAs) publicly accessible for all of our products. At the end of 2010, Dow had posted 330 PSAs to the Product Safety page on www.dow.com.
In 2010, the Injury and Illness rate was .32 per 200,000 hours of work. Although this performance does not meet our expectations when compared with our 2009 performance, it represents a more than 35 percent improvement over 2005 performance levels.
Sustainable Chemistry
GOAL: Double the percentage of sales to 10 percent for products that are highly advantaged by sustainable chemistry
The percentage of sales from products with highly advantaged sustainable chemistry performance increased from 1.7 percent in 2008 to 3.4 percent in 2009.
26 The Dow Chemical Company
At the end of 2010, 355 Loss of Primary Containment (LOPC) incidents occurred, translating into an annual rate that is an improvement from 2009. This is more than a 70 percent improvement over our 2005 baseline performance levels.
At the end of 2010, we recorded 45 Process Safety Incidents. This is more than a 40 percent improvement over 2005.
PSAs now cover products that represent 69% of Company sales.

2010 Annual Report 27
0.000
0.514
1.028
1.542
2.056
0.000
0.514
1.028
1.542
2.056
Injury and Illness Rate(recordable incidents per
200,000 work hours)
Loss of Primary Containment Incidents(number of incidents)
0.000000
17.800001
35.600002
53.400003
71.200005
0
2
4
6
8
10
0.000000
17.800001
35.600002
53.400003
71.200005
0.000000
1233.600118
2467.200235
3700.800353
4934.400471
0.0
0.2
0.4
0.6
0.8
Process Safety(number of incidents)
Energy Intensity(BTUs per pound of production)
Percent of Company Sales with Sustainability
Advantage
090807 13 1410 11 12 150
2
4
6
8
10
0.000000
11.111111
22.222222
33.333333
44.444444
55.555556
66.666667
77.777778
88.888889
100.000000
0.000000
11.111111
22.222222
33.333333
44.444444
55.555556
66.666667
77.777778
88.888889
100.000000
-261.000000
-216.714302
-172.428604
-128.142906
-83.857208
-39.571510
4.714188
48.999886
GHG Emissions (millon metric tons of CO2-equivalent)
(Kyoto and non-Kyoto)
1109 100807 1512 13 14
Percent of Sales with Sustainable Chemistry Advantages
1.71
Greenhouse Gas Emissions (millon metric tons of CO2-equivalent, Kyoto and non-Kyoto)
51 52 48 45 43 43*
070605 08 09 10Direct and Indirect Absolute GHG Emissions from Operations
Avoided Emissions Attributable to Dow Insulation in Service
060594 07 08 09 10 11 12 13 14 15
Injury and Illness(recordable incidents per 200,000 work hours)
2.57
060594 07 08 09 10 11 12 13 14 15
Energy Intensity(Btu per pound of production)
060594 07 08 09 10 11 12 13 14 15
060594 07 08 09 10 11 12 13 14 15
Percent of Sales Covered by Assessments
Sales Covered by Assessments
0
070605 08 09 10 11 12 13 14 15
7
0.000000
523.200012
1046.400024
1569.600037
2092.800049
060594 07 08 09 10 11 12 13 14 150.000000
523.200012
1046.400024
1569.600037
2092.800049
0605 07 08 09 10 11 12 13 14 15
Loss of Primary Containment Incidents(number of incidents)
94
2,61
6
0605 07 08 09 10 11 12 13 14 15
Process Safety(number of incidents)
59
90
69
74
0605 07 08 09 10 11 12 13 14 15
33
48
69
23
1.69
3.42
6,16
8
7,87
5
6,03
8
5,83
2
5,84
9
5,98
6
6,02
8
0.52
0.48
0.38
0.40
0.29 0.32
1,32
0
461
355
1,10
5
920
768
44 45
*Estimate Energy Efficiency and Conservation
GOAL: Reduce our energy intensity 25 percent
Through 2010, savings due to improved energy intensity performance exceeded $9 billion on a less than $2 billion investment.
00 01 0402 03
Energy Efficiency Cumulative Savings
9695 9997 98 05 06 09 1007 08
$9.4 billion saved since 1994
$ billions
123456789
10
0123456789
10
Our 2010 Energy Intensity goal was 5,397 Btu/lb, or 87.5 percent of the value in 2005. Our actual performance was 6,028 Btu/lb, which is 98 percent of the 2005 baseline.
0.000
0.514
1.028
1.542
2.056
0.000
0.514
1.028
1.542
2.056
Injury and Illness Rate(recordable incidents per
200,000 work hours)
Loss of Primary Containment Incidents(number of incidents)
0.000000
17.800001
35.600002
53.400003
71.200005
0
2
4
6
8
10
0.000000
17.800001
35.600002
53.400003
71.200005
0.000000
1233.600118
2467.200235
3700.800353
4934.400471
0.0
0.2
0.4
0.6
0.8
Process Safety(number of incidents)
Energy Intensity(BTUs per pound of production)
Percent of Company Sales with Sustainability
Advantage
090807 13 1410 11 12 150
2
4
6
8
10
0.000000
11.111111
22.222222
33.333333
44.444444
55.555556
66.666667
77.777778
88.888889
100.000000
0.000000
11.111111
22.222222
33.333333
44.444444
55.555556
66.666667
77.777778
88.888889
100.000000
-261.000000
-216.714302
-172.428604
-128.142906
-83.857208
-39.571510
4.714188
48.999886
GHG Emissions (millon metric tons of CO2-equivalent)
(Kyoto and non-Kyoto)
1109 100807 1512 13 14
Percent of Sales with Sustainable Chemistry Advantages
1.71
Greenhouse Gas Emissions (millon metric tons of CO2-equivalent, Kyoto and non-Kyoto)
51 52 48 45 43 43*
070605 08 09 10Direct and Indirect Absolute GHG Emissions from Operations
Avoided Emissions Attributable to Dow Insulation in Service
060594 07 08 09 10 11 12 13 14 15
Injury and Illness(recordable incidents per 200,000 work hours)
2.57
060594 07 08 09 10 11 12 13 14 15
Energy Intensity(Btu per pound of production)
060594 07 08 09 10 11 12 13 14 15
060594 07 08 09 10 11 12 13 14 15
Percent of Sales Covered by Assessments
Sales Covered by Assessments
0
070605 08 09 10 11 12 13 14 15
7
0.000000
523.200012
1046.400024
1569.600037
2092.800049
060594 07 08 09 10 11 12 13 14 150.000000
523.200012
1046.400024
1569.600037
2092.800049
0605 07 08 09 10 11 12 13 14 15
Loss of Primary Containment Incidents(number of incidents)
94
2,61
6
0605 07 08 09 10 11 12 13 14 15
Process Safety(number of incidents)
59
90
69
74
0605 07 08 09 10 11 12 13 14 15
33
48
69
23
1.69
3.42
6,16
8
7,87
5
6,03
8
5,83
2
5,84
9
5,98
6
6,02
8
0.52
0.48
0.38
0.40
0.29 0.32
1,32
0
461
355
1,10
5
920
768
44 45
*Estimate
Addressing Climate Change
GOAL: Reduce our greenhouse gas intensity 2.5 percent per year
We estimate our absolute greenhouse gas (GHG) emissions in 2010 were 43.0 million metric tons, essentially flat with 2009 performance. Our intent is to continue to grow the Company while maintaining or reducing GHGs relative to recent history.
Energy Intensity improved 22% in the first 10-year goal.
Contributing to Community Success
GOAL: Achieve community acceptance ratings of 100 percent at Dow sites where we have a major presence
Dow is committed to improving the quality of life in the communities in which it operates throughout the world. Through financial contributions and the volunteer efforts of our employees, Dow supports programs that address education, the environment and economic success – all important aspects of community sustainability. In 2010, Dow and The Dow Chemical Foundation contributed $35.7 million to hundreds of programs globally.
Breakthrough to World Challenges
GOAL: Achieve at least three breakthroughs that will significantly help solve world challenges
In 2010, Dow continued to make significant progress in addressing global challenges. For example, Dow is providing seeds that increase crop productivity and natural insecticides that control crop-damaging insects. Through our building science solutions, we are helping improve energy efficiency in commercial and residential buildings. On the renewable energy front, Dow technology is making solar power practical for average homeowners and enabling wind blades that are stronger, lighter and easier to manufacture.
Charitable Contributions
Europe, Middle East and Africa: $3.0 million
Latin America: $1.4 million
Asia Pacific: $1.9 million
North America: $7.2 million
Total Site and Local Initiatives:$13.5 million
Global Business and Functionally Aligned Projects: $10.6 million
Disaster Relief: $1.0 million
Global Corporate Projects: $10.6 million
Total Corporate Initiatives:
$22.2 million
NOTE: Charts have real data

28 The Dow Chemical Company
MISSION
To passionately innovate what is essential to human progress by providing sustainable solutions to our customers
vISION
To be the most profitable and respected science-driven chemical company in the world
STRATEGyPreferentially invest in a portfolio of technology-integrated, market-driven performance businesses that create value for
our shareholders and growth for our customers
Manage a portfolio of asset-integrated, building-block businesses to generate value for our downstream portfolio
vALUES Integrity
Respect for People
Protecting Our Planet
STRATEGIC THEMES Financial Discipline
Sustainability
People
Innovation and Growth

555045
40
3530
25
20
1510
5
0 00 01 02 03 04 05 06 07 08 09 10
60
STOCKHOLDER REFERENCE INFORMATION
General Information
Website: www.dow.comTelephone: (800) 258 2436 (Customer Information Group) or (989) 832 1556 (800) 232 2436 (Customer Service Center) (989) 636 1000 (Dow Operator/Switchboard)
For calls originating outside the United States and Canada, the international dialing code is +1.
Transfer Agent and Stockholder Services
BNY Mellon Shareowner Services
Telephone: (800) 369 5606 (201) 680 6685 (Outside the U.S. and Canada) (800) 231 5469 (Hearing Impaired–TTY Phone)Email: [email protected]: www.bnymellon.com/shareowner/equityaccess
Address Stockholder Inquiries to:BNY Mellon Shareowner ServicesP.O. Box 358016Pittsburgh, PA 15252 U.S.A.
Send Certificates for Transfer and Address Changes to:BNY Mellon Shareowner ServicesP.O. Box 358010Pittsburgh, PA 15252 U.S.A.
Investor Relations
The Dow Chemical Company2030 Dow CenterMidland, MI 48674 U.S.A.Telephone: (800) 422 8193 (United States and Canada) (989) 636 1463Fax: (989) 636 1830
Office of the Corporate Secretary
The Dow Chemical Company2030 Dow CenterMidland, MI 48674 U.S.A.Telephone: (989) 636 1792Fax: (989) 638 1740
Annual Meeting
The 2011 Annual Meeting of Stockholders will be held at 10:00 a.m. on Thursday, May 12, 2011, at the Midland Center for the Arts, 1801 West St. Andrews, Midland, Michigan, U.S.A.
Dow Dividend Reinvestment Plan
All registered stockholders may reinvest cash dividends in additional Dow shares. For more information on the Plan, please contact Dow’s transfer agent, BNY Mellon Shareowner Services (see Transfer Agent and Stockholder Services).
Stock Exchange Listings and Trading Privileges
Symbol: DOWAmsterdam, Bavarian, Brussels, Chicago, Düsseldorf, Frankfurt, Hamburg, Hannover, London, New York, Paris, Switzerland and Tokyo
Eleven-year Review of Market Price per Share of Common Stock(1)
$47.17 $39.67 $37.00 $42.00 $51.34 $56.75 $45.15 $47.96 $43.43 $29.50 $34.50 High
36.63 33.78 29.70 41.57 49.51 43.82 39.90 39.42 15.09 27.63 34.14 Close on December 31
23.00 25.06 23.66 24.83 36.35 40.18 33.00 38.89 14.93 5.89 22.42 Low
(1) Adjusted for 3-for-1 stock split in 2000.
(in d
olla
rs)

Table of Contents
UNITED STATESSECURITIES AND EXCHANGE COMMISSION
Washington, D.C. 20549
FORM 10-KANNUAL REPORT PURSUANT TO SECTION 13 OR 15(d) OF THE
SECURITIES EXCHANGE ACT OF 1934
For the fiscal year ended DECEMBER 31, 2010Commission file number: 1-3433
THE DOW CHEMICAL COMPANY(Exact name of registrant as specified in its charter)
Delaware 38-1285128
State or other jurisdiction ofincorporation or organization
(I.R.S. Employer Identification No.)
2030 DOW CENTER, MIDLAND, MICHIGAN 48674(Address of principal executive offices) (Zip Code)
Registrant’s telephone number, including area code: 989-636-1000
Securities registered pursuant to Section 12(b) of the Act:
Title of each class Name of each exchange on which registeredCommon Stock, par value $2.50 per share New York and Chicago Stock Exchanges
Debentures, 6.85%, final maturity 2013 New York Stock Exchange
Indicate by check mark if the registrant is a well-known seasoned issuer, as defined in Rule 405 of the Securities Act. Yes No
Indicate by check mark if the registrant is not required to file reports pursuant to Section 13 or Section 15(d) of the Act.¨ Yes No
Indicate by check mark whether the registrant (1) has filed all reports required to be filed by Section 13 or 15(d) of the Securities Exchange Act of 1934 duringthe preceding 12 months (or for such shorter period that the registrant was required to file such reports), and (2) has been subject to such filing requirementsfor the past 90 days. Yes No
Indicate by check mark whether the registrant has submitted electronically and posted on its corporate Web site, if any, every Interactive Data File required tobe submitted and posted pursuant to Rule 405 of Regulation S-T during the preceding 12 months (or for such shorter period that the registrant was required tosubmit and post such files). Yes No
Indicate by check mark if disclosure of delinquent filers pursuant to Item 405 of Regulation S-K is not contained herein, and will not be contained, to the bestof the registrant’s knowledge, in definitive proxy or information statements incorporated by reference in Part III of this Form 10-K or any amendment to thisForm 10-K.
Indicate by check mark whether the registrant is a large accelerated filer, an accelerated filer, a non-accelerated filer, or a smaller reporting company. See thedefinitions of “large accelerated filer,” “accelerated filer” and “smaller reporting company” in Rule 12b-2 of the Exchange Act.
Large accelerated filer Accelerated filer ¨
Non-accelerated filer ¨ Smaller reporting company ¨
Indicate by check mark whether the registrant is a shell company (as defined in Rule 12b-2 of the Act).¨ Yes No
The aggregate market value of voting common stock held by non-affiliates as of June 30, 2010 (based upon the closing price of $23.72 per common share asquoted on the New York Stock Exchange), was approximately $27.4 billion. For purposes of this computation, it is assumed that the shares of voting stockheld by Directors, Officers and the Dow Employees’ Pension Plan Trust would be deemed to be stock held by affiliates. Non-affiliated common stockoutstanding at June 30, 2010 was 1,156,112,393 shares.
Total common stock outstanding at January 31, 2011 was 1,167,921,633 shares.
DOCUMENTS INCORPORATED BY REFERENCE
Part III: Proxy Statement for the Annual Meeting of Stockholders to be held on May 12, 2011.

Table of Contents
The Dow Chemical CompanyANNUAL REPORT ON FORM 10-K
For the fiscal year ended December 31, 2010
TABLE OF CONTENTS PAGE
PART I
Item 1. Business. 3
Item 1A. Risk Factors. 18
Item 1B. Unresolved Staff Comments. 21
Item 2. Properties. 22
Item 3. Legal Proceedings. 23
Item 4. Reserved. 24
PART II
Item 5. Market for Registrant’s Common Equity, Related Stockholder Matters and Issuer Purchases of Equity Securities. 25
Item 6. Selected Financial Data. 26
Item 7. Management’s Discussion and Analysis of Financial Condition and Results of Operations. 28
Item 7A. Quantitative and Qualitative Disclosures About Market Risk. 76
Item 8. Financial Statements and Supplementary Data. 77
Item 9. Changes in and Disagreements With Accountants on Accounting and Financial Disclosure. 159
Item 9A. Controls and Procedures. 160
Item 9B. Other Information. 162
PART III
Item 10. Directors, Executive Officers and Corporate Governance. 163
Item 11. Executive Compensation. 163
Item 12. Security Ownership of Certain Beneficial Owners and Management and Related Stockholder Matters. 163
Item 13. Certain Relationships and Related Transactions, and Director Independence. 163
Item 14. Principal Accounting Fees and Services. 163
PART IV
Item 15. Exhibits, Financial Statement Schedules. 164
SIGNATURES 166
2
Table of Contents
The Dow Chemical Company and SubsidiariesPART I, Item 1. Business.
THE COMPANY
The Dow Chemical Company was incorporated in 1947 under Delaware law and is the successor to a Michigan corporation, of the same name, organized in1897. Except as otherwise indicated by the context, the terms “Company” or “Dow” as used herein mean The Dow Chemical Company and its consolidatedsubsidiaries. On April 1, 2009, the merger of Rohm and Haas Company (“Rohm and Haas”) with a subsidiary of the Company was completed, and Rohmand Haas became a wholly owned subsidiary of Dow.
Dow is a diversified, worldwide manufacturer and supplier of products used primarily as raw materials in the manufacture of customer products andservices. The Company serves the following industries: appliance; automotive; agricultural; building and construction; chemical processing; electronics;furniture; housewares; oil and gas; packaging; paints, coatings and adhesives; personal care; pharmaceutical; processed foods; pulp and paper; textile andcarpet; utilities; and water treatment.
The Company’s principal executive offices are located at 2030 Dow Center, Midland, Michigan 48674, telephone 989-636-1000. Its Internet websiteaddress is www.dow.com. All of the Company’s filings with the U.S. Securities and Exchange Commission are available free of charge through the InvestorRelations page on this website, immediately upon filing.
BUSINESS AND PRODUCTS
Corporate ProfileDow combines the power of science and technology with the “Human Element” to passionately innovate what is essential to human progress. The Companyconnects chemistry and innovation with the principles of sustainability to help address many of the world’s most challenging problems such as the need forclean water, renewable energy generation and conservation, and increasing agricultural productivity. Dow’s diversified industry-leading portfolio of specialtychemical, advanced materials, agrosciences and plastics businesses deliver a broad range of technology-based products and solutions to customers inapproximately 160 countries and in high growth sectors such as electronics, water, energy, coatings and agriculture. In 2010, Dow had annual sales of$53.7 billion and employed approximately 50,000 people worldwide. The Company’s more than 5,000 products are manufactured at 188 sites in 35 countriesacross the globe. The following descriptions of the Company’s eight operating segments include a representative listing of products for each business.
ELECTRONIC AND SPECIALTY MATERIALSApplications: chemical mechanical planarization (CMP) pads and slurries • chemical processing aids and intermediates • electronic displays • foodand pharmaceutical processing and ingredients • home and personal care ingredients • hygiene and infection control • photolithography materials •printed circuit board materials • process and materials preservation • semiconductor packaging, connectors and industrial finishing • water purification
Dow Electronic Materials is a leading global supplier of materials for chemical mechanical planarization; materials used in the production ofelectronic displays, including brightness films, diffusers, metalorganic light emitting diode (LED) precursors and organic light emitting diode(OLED) materials; products and technologies that drive leading edge semiconductor design; materials used in the fabrication of printed circuitboards; and integrated metallization processes critical for interconnection, corrosion resistance, metal finishing and decorative applications. Theseenabling materials are found in applications such as consumer electronics, flat panel displays and telecommunications.
• Products: ACuPLANE™ CMP slurries; AR™ antireflective coatings; AUROLECTROLESS™ immersion gold process; COPPERGLEAM™ acid copper plating products; CYCLOTENE™ advanced electronics resins; DURAPOSIT™ electroless nickel process;ENLIGHT™ products for photovoltaic manufacturers; EPIC™ immersion photoresists; INTERVIA™ photodielectrics for advancedpackaging; LITHOJET™ digital imaging processes; OPTOGRADE™ metalorganic precursors; VISIONPAD™ CMP pads
3

Table of Contents
Specialty Materials is a portfolio of businesses characterized by a vast global footprint, a broad array of unique chemistries, multi-functionalingredients and technology capabilities, combined with key positions in the pharmaceuticals, food, home and personal care, water and energyproduction, and industrial specialty industries. These technology capabilities and market platforms enable the businesses to develop innovativesolutions that address modern societal needs for sufficient and clean water, air and energy, material preservation and improved health care,disease prevention, nutrition and wellness. The businesses’ global footprint and geographic reach provide multiple opportunities for value growth.Specialty Materials consists of five global businesses: Dow Water and Process Solutions, Dow Home and Personal Care, Dow Microbial Control,Dow Wolff Cellulosics and Performance Materials.
• Products and Services: Acrolein derivatives; ACUDYNE™ hair fixative resins; ACULYN™ rheology modifiers; ACUMER™ scaleinhibitors and dispersants; ACUSOL™ detergent polymers, dispersants, opacifiers and rheology modifiers; AMBERCHROM™chromatography resins; AMBERJET™, AMBERLITE™, AMBERLYST™ and DOWEX™ ion exchange resins; ANGUS™nitroalkanes and derivatives; AQUCAR™ water treatment microbiocides; ASC METATIN™ dimethyltin catalyst; AUTOMATE™liquid dyes; BIOBAN™ biocide for material preservation; CELLOSIZE™ hydroxyethyl cellulose; CLEAR+STABLE™ carboxymethylcellulose; Divinylbenzene; DOW™ electrodeionization; DOW™ ultrafiltration; DUOLITE™ pharmaceutical grade resins;DURAGREEN™ and DURAPLUS™ floor care polymers; ECOSMOOTH™ silk conditioning polymers; ECOSURF™ biodegradablesurfactants; ETHOCEL™ ethylcellulose polymers; FILMTEC™ reverse osmosis membrane elements; GLUTEX™ sanitizers andcleaners; KATHON™ preservatives; KLARIX™ algicides; METHOCEL™ cellulose ethers; NEOLONE™ preservatives for personalcare; OPULYN™ opacifiers; POLYOX™ water-soluble resins; PRIMENE™ amines; Quaternaries; SATISFIT™ Weight CareTechnology; SILVADUR™ antimicrobial; Sodium borohydride products; SOFTCAT™ polymers; SOLTERRA™ Boost inorganic SPFbooster; SOLTEX™ waterproofing polymer; SUNSPHERES™ SPF boosters; UCARE™ polymers; UCARHIDE™ opacifier;UCON™ fluids; VENPURE™ reducing agents; VERSENE™ chelating agents; Vinylbenzyl chloride; VINYZENE™ antimicrobialsfor plastics; WALOCEL™ cellulose polymers; WALSRODER™ nitrocellulose; ZinClear™ IM zinc oxide dispersions
The Electronic and Specialty Materials segment also includes the Company’s share of the results of Dow Corning Corporation, a joint venture ofthe Company.
COATINGS AND INFRASTRUCTUREApplications: building and construction, insulation and weatherization, roofing membrane systems, adhesives and sealants • cellulosic-basedconstruction additives • construction materials (vinyl siding, vinyl windows, vinyl fencing) • flexible and rigid packaging • general mortars andconcrete, cement modifiers and plasters, tile adhesives and grouts • house and traffic paints • leather, textile, graphic arts and paper • metal coatings •pipeline coatings • processing aids for plastic production • tapes and labels • transportation and corrosion protection
Dow Adhesives and Functional Polymers is a portfolio of businesses that primarily manufacture sticking and bonding solutions for a widerange of applications, including adhesive tapes and paper labels, flexible packaging and leather, textile and imaging. These products aresupported with market recognized best-in-class technical support and end-use application knowledge. Many of the businesses’ water-bornetechnologies are well-positioned to support more environmentally preferred applications.
• Products: ADCOTE™ and AQUA-LAM™ laminating adhesives; MOR-FREE™ solventless adhesives; ROBOND™ acrylic
adhesives; SERFENE™ barrier coatings; Solvent-based polyurethanes and polyesters; TYMOR™ tie resins
4

Table of Contents
Dow Building and Construction is comprised of three global businesses – Dow Building Solutions, Dow Construction Chemicals and DowSolar Solutions – which offer extensive lines of industry-leading insulation, housewrap, sealant and adhesive products and systems, as well asconstruction chemical solutions and building-integrated photovoltaics. Through its strong sales support, customer service and technical expertise,Dow Building Solutions provides meaningful solutions for improving the energy efficiency in homes and buildings today, while also addressingthe industry’s emerging needs and demands. Dow Construction Chemicals provides solutions for increased durability, greater water resistanceand lower systems costs. As a leader in insulation solutions, the businesses’ products help curb escalating utility bills, reduce a building’scarbon footprint and provide a more comfortable indoor environment. Dow Solar Solutions is focused on developing the next generation of solarenergy products to solve global energy challenges.
• Products: AQUASET™ acrylic thermosetting resins; CELLOSIZE™ hydroxyethyl cellulose; DOW™ latex powders; FROTH-PAK™polyurethane spray foam; GREAT STUFF™ polyurethane foam sealant; INSTA-STIK™ roof insulation adhesive; METHOCEL™cellulose ethers; POWERHOUSE™ solar shingle; RHOPLEX™ aqueous acrylic polymer emulsions; STYROFOAM™ brand insulationproducts (including extruded polystyrene and polyisocyanurate rigid foam sheathing products); THERMAX™ insulation; TILEBOND™ roof tile adhesive; WEATHERMATE™ weather barrier solutions (housewraps, sill pans, flashings and tapes)
Dow Coating Materials is the largest coatings supplier in the world and a premier supplier of raw materials for architectural paints andindustrial coatings. The business manufactures and delivers solutions that leverage high quality, technologically advanced product offerings forpaint and coatings. The business also offers technologies used in industrial coatings, including packaging, pipelines, wood, automotive, marine,maintenance and protective industries. The business is also the leader in the conversion of solvent to water-based technologies, which enablecustomers to offer more environmentally friendly products, including low volatile organic compound (VOC) paints and other sustainablecoatings.
• Products: ACRYSOL™ rheology modifiers; AVANSE™, ELASTENE™, PRIMAL™ and RHOPLEX™ acrylics; CELLOSIZE™hydroxyethyl cellulose; CELLOSOLVE™ and the CARBITOL™ and DOWANOL™ series of oxygenated solvents; D.E.H.™ curingagent and intermediates; D.E.R.™ and D.E.N.™ liquid and epoxy resins; FORTEGRA™ Epoxy Tougheners; OROTAN™ andTAMOL™ dispersants; ROPAQUE™ opaque polymers; TRITON™, TERGITOL™, DOWFAX™ and ECOSURF™ SA surfactants
HEALTH AND AGRICULTURAL SCIENCESApplications: agricultural seeds, traits (genes) and oils • control of weeds, insects and plant diseases for agriculture and pest management
Dow AgroSciences is a global leader in providing agricultural and plant biotechnology products, pest management solutions and healthy oils.The business invents, develops, manufactures and markets products for use in agriculture, industrial and commercial pest management, andfood service.
• Products: AGROMEN™ seeds; BRODBECK™ seed; CLINCHER™ herbicide; DAIRYLAND™ seed; DELEGATE™ insecticide;DITHANE™ fungicide; Dow AgroSciences™ SmartStax™; FORTRESS™ fungicide; GARLON™ herbicide; GLYPHOMAX™herbicide; GRANITE™ herbicide; HERCULEX™ I, HERCULEX™ RW and HERCULEX™ XTRA insect protection;KEYSTONE™ herbicides; LAREDO™ fungicide; LONTREL™ herbicide; LORSBAN™ insecticides; MILESTONE™ herbicide;MUSTANG™ herbicide; MYCOGEN™ seeds; NEXERA™ canola and sunflower seeds; PHYTOGEN™ cottonseeds; PROFUME™gas fumigant; RENZE™ seed; SENTRICON™ termite colony elimination system; SIMPLICITY™ herbicide; STARANE™ herbicide;TELONE™ soil fumigant; TORDON™ herbicide; TRACER™ NATURALYTE™ insect control; TRIUMPH™ seed; VIKANE™structural fumigant; WIDESTRIKE™ insect protection
The Health and Agricultural Sciences segment also includes the results of the AgroFresh business, providing a portfolio of products used formaintaining the freshness of fruits, vegetables and flowers.
5

Table of Contents
PERFORMANCE SYSTEMSApplications: automotive interiors, exteriors, under-the-hood and body engineered systems • bedding • caps and closures • food and specialtypackaging • footwear • furniture • gaskets and sealing components • manufactured housing and modular construction • medical equipment • mining •pipe treatment • pressure sensitive adhesives • transportation • vinyl exteriors • waterproofing membranes • wire and cable insulation and jacketingmaterials for power utility and telecommunications
Dow Automotive Systems is a leading global provider of technology-driven solutions that meet consumer demand for vehicles that are safer,stronger, quieter, lighter, more comfortable and stylish. The business provides plastics, adhesives, glass bonding systems, emissions controltechnology, films, fluids, structural enhancement and acoustical management solutions to original equipment manufacturers, tier, aftermarketand commercial transportation customers. With offices and application development centers around the world, Dow Automotive Systemsprovides materials science expertise and comprehensive technical capabilities to its customers worldwide.
• Products: AERIFY™ diesel particulate filters; BETAFOAM™ NVH acoustical foams; BETAMATE™ structural adhesives;BETASEAL™ glass bonding systems; DOW™ polyethylene resins; IMPAXX™ energy management foam; INSPIRE™ performancepolymers; INTEGRAL™ adhesive films; ISONATE™ pure and modified methylene diphenyl diisocyanate (MDI) products;PELLETHANE™ thermoplastic polyurethane elastomers; Premium brake fluids and lubricants; SPECFLEX™ semi-flexiblepolyurethane foam systems
Dow Elastomers offers a unique set of elastomers, specialty films and plastic additive products for customers worldwide. The business isfocused on delivering innovative solutions that allow for differentiated participation in multiple industries and applications. The business offers abroad range of performance elastomers and plastomers, specialty copolymers, synthetic rubber, specialty resins, and films and plastic additives.Key applications include adhesives, transportation, building and construction, packaging and consumer durables.
• Products: ADVASTAB™ thermal stabilizer; AFFINITY™ polyolefin plastomers (POPs); AMPLIFY™ functional polymers; DOW™Adhesive Film; DOW™ Backing Layer Film; DOW™ Medical Device Film; DOW™ Medical Packaging Film; DOW™ very lowdensity polyethylene; ENGAGE™ polyolefin elastomers; ENLIGHT™ polyolefin encapsulant films; INFUSE™ olefin blockcopolymers; INTEGRAL™ adhesive films; NORDEL™ hydrocarbon rubber; NYLOPAK™ nylon barrier films; OPTICITE™ films;PARALOID™ EXL impact modifier; PRIMACOR™ copolymers; PROCITE™ window envelope films; SARAN™ barrier resins;SARANEX™ barrier films; TRENCHCOAT™ protective films; TRYCITE™ polystyrene film; TYBRITE™ clear packaging film;TYRIN™ chlorinated polyethylene; VERSIFY™ plastomers and elastomers
Dow Formulated Systems manufactures and markets custom formulated, rigid and semi-rigid, flexible, integral skin and microcellularpolyurethane foams and systems and tailor-made epoxy solutions and systems. These products are used in a broad range of applicationsincluding appliances, athletic equipment, automotive, bedding, construction, decorative molding, furniture, shoe soles and wind turbines.
• Products: AIRSTONE™ epoxy systems; Encapsulants and chemical compositions; ENFORCER™ Technology and ENHANCER™Technology for polyurethane carpet and turf backing; HYPERKOTE™, TRAFFIDECK™ and VERDISEAL™ waterproofing systems;HYPOL™ hydrophilic polyurethane prepolymers; RENUVA™ Renewable Resource Technology; SPECFIL™ urethane components;SPECFLEX™ copolymer polyols; SPECTRIM™ reaction moldable products; VORACOR™ and VORALAST™ polyurethane systemsand VORALAST™ R renewable content system; VORAMER™ industrial adhesives and binders; VORASTAR™ polymers;XITRACK™ polyurethane rail ballast stabilization systems
6

Table of Contents
Dow Wire and Cable is the world’s leading provider of polymers, additives and specialty oil technology-based solutions for electrical andtelecommunication applications. Through its suite of polyolefin ENDURANCE™ products, the business sets industry standards for assuranceof longevity, efficiency, ease of installation and protection in the transmission, distribution and consumption of power, voice and data. In additionto world-class power, telecommunications and flame retardant/specialty cable applications, the business supports its product offerings with solidresearch, product development, engineering and market validation expertise.
• Products: ENGAGE™ polyolefin elastomers; NORDEL™ hydrocarbon rubber; SI-LINK™ and REDI-LINK™ moisture crosslinkable
polyethylene-based wire and cable insulation compounds; TYRIN™ chlorinated polyethylene; UNIGARD™ flame retardant compoundfor specialty wire and cable applications
The Performance Systems segment also includes the results of Dow Fiber Solutions, providing differentiated fibers and process improvements tothe textile industry, and Dow Oil and Gas, providing products for use in exploration and production, refining and gas processing, transportation,and fuel and lubricant performance.
On March 2, 2010, Dow announced the entry into a definitive agreement to sell Styron to an affiliate of Bain Capital Partners; the transactionclosed on June 17, 2010. Businesses and products sold included Synthetic Rubber and certain products from Dow Automotive Systems, whichwere reported in the Performance Systems segment through the date of the divestiture.
PERFORMANCE PRODUCTSApplications: adhesives • aircraft and runway deicing fluids • appliances • carpeting • chelating agents • chemical intermediates • civil engineering •cleaning products • coated paper and paperboard • composites • construction • corrosion inhibitors • detergents, cleaners and fabric softeners • electricalcastings, potting and encapsulation and tooling • electrical laminates • electronics • flavors and fragrances • flooring • footwear • gas treatment • heattransfer fluids • home and office furnishings • industrial coatings • mattresses • metalworking fluids • packaging • sealants • surfactants
The Amines business is the world’s largest producer of ethanolamines, ethyleneamines and isopropanolamines used in a wide variety ofapplications, including gas treatment, heavy-duty liquid detergents, herbicide formulations for the agricultural industry and personal careproducts.
• Products: Alkyl alkanolamines; Ethanolamines; Ethyleneamines; Isopropanolamines; Piperazine; VERSENE™ chelating agents
The Emulsion Polymers business provided a broad line of styrene-butadiene products supporting customers in paper and paperboardapplications, as well as carpet and artificial turf backings.
On March 2, 2010, Dow announced the entry into a definitive agreement to sell Styron to an affiliate of Bain Capital Partners; thetransaction closed on June 17, 2010. Businesses sold included Emulsion Polymers (styrene-butadiene latex), which was reported in thePerformance Products segment through the date of the divestiture.
The Epoxy business is the world’s largest producer of epoxy resins and intermediates. The business is the most feedstock-integrated supplier inthe world. Epoxies provide good adhesion and coating protection over a range of environmental conditions, making them ideal for applicationssuch as transportation, marine and civil engineering.
• Products: D.E.H.™ epoxy curing agents or hardeners; D.E.N.™ epoxy novolac resins; D.E.R.™ epoxy resins (liquids, solids and
solutions); Epoxy intermediates (acetone, allyl chloride, epichlorohydrin and phenol); Epoxy resin waterborne emulsions and dispersions;FORTEGRA™ epoxy tougheners; Glycidyl methacrylate (GMA)
7

Table of Contents
The Oxygenated Solvents business offers a full range of acetone derivatives, alcohols, esters, and ethylene- and propylene-based glycol etherproducts. The business is the industry leader in solvent products used in cleaning products, inks, electronics, mining, paints and coatings,personal care and other applications.
• Products: Acetic esters; Acetone derivatives; Alcohols; Aldehydes; Butyl CARBITOL™ and Butyl CELLOSOLVE™ solvents;
Carboxylic acids; DOWANOL™ glycol ethers; ECOSOFT™ IK solvent; PROGLYDE™ DMM solvent; UCAR™ propionates
The Performance Monomers business produces specialty monomer products that are sold externally as well as consumed internally as buildingblocks used in downstream polymer businesses. The business’ products are used in several applications, including cleaning materials, personalcare products, paints, coatings and inks.
• Products: Acrylic acid/acrylic esters; ACUMER™, ACUSOL™, DURAMAX™, OPTIDOSE™, ROMAX™ and TAMOL™
dispersants; Methyl methacrylate
The Polyglycols, Surfactants and Fluids business is one of the world’s leading suppliers of polyglycols and surfactants, with a broad range ofproducts and technology and a proven record of performance and economy. The business also produces a broad line of lubricants, hydraulicfluids, aircraft deicing fluids and thermal fluids, with some of the most recognized brand names in the industry. Product applications includechemical processing, cleaning, heating, cooling, food and beverage processing, fuel additives, paints and coatings, pharmaceuticals and siliconesurfactants.
• Products: AMBITROL™ and NORKOOL™ coolants; CARBOWAX™ and CARBOWAX SENTRY™ polyethylene glycols andmethoxypolyethylene glycols; DOW™ polypropylene glycols; DOW™ SYMBIO base fluid; DOWFAX™, TERGITOL™ andTRITON™ surfactants; DOWFROST™ and DOWTHERM™ heat transfer fluids; ECOSURF™ biodegradable surfactants;SYNALOX™ lubricants; UCAR™ deicing fluids; UCON™ fluids
The Polyurethanes business is a leading global producer of polyurethane raw materials. Dow’s polyurethane products are used in a broad rangeof applications including appliance, athletic equipment, automotive, bedding, construction, decorative molding, furniture and shoe soles.
• Products: ECHELON™ polyurethane prepolymer; ISONATE™ methylene diphenyl diisocyanate (MDI); MONOTHANE™ single
component polyurethane elastomers; PAPI™ polymeric MDI; Propylene glycol; Propylene oxide; RENUVA™ Renewable ResourceTechnology; VORANATE™ isocyanate; VORANOL™ VORACTIV™ polyether and copolymer polyols
The Performance Products segment also includes the results of Dow Haltermann, a provider of world-class contract manufacturing services tocompanies in the fine and specialty chemicals and polymers industries, and SAFECHEM, a wholly owned subsidiary that manufactures closed-loop systems to manage the risks associated with chlorinated solvents. The segment also includes a portion of the results of the OPTIMAL Groupof Companies (through the September 30, 2009 divestiture of this group of joint ventures) and the SCG-Dow Group, joint ventures of theCompany.
PLASTICSApplications: adhesives • appliances and appliance housings • agricultural films • automotive parts and trim • beverage bottles • bins, crates, pails andpallets • building and construction • coatings • consumer and durable goods • consumer electronics • disposable diaper liners • fibers and nonwovens •films, bags and packaging for food and consumer products • hoses and tubing • household and industrial bottles • housewares • hygiene and medicalfilms • industrial and consumer films and foams • information technology • oil tanks and road equipment • plastic pipe • textiles • toys, playgroundequipment and recreational products • wire and cable compounds
8

Table of Contents
The Polyethylene business is the world’s leading supplier of polyethylene-based solutions through sustainable product differentiation. Withmultiple catalyst and process technologies, the business offers customers one of the industry’s broadest ranges of polyethylene resins.
• Products: ASPUN™ fiber grade resins; ATTANE™ ultra low density polyethylene (ULDPE) resins; CONTINUUM™ bimodalpolyethylene resins; DOW™ high density polyethylene (HDPE) resins; DOW™ low density polyethylene (LDPE) resins; DOWLEX™polyethylene resins; ELITE™ enhanced polyethylene (EPE) resins; TUFLIN™ linear low density polyethylene (LLDPE) resins;UNIVAL™ HDPE resins
The Polypropylene business, a major global polypropylene supplier, provides a broad range of products and solutions tailored to customer needsby leveraging Dow’s leading manufacturing and application technology, research and product development expertise, extensive market knowledgeand strong customer relationships.
• Products: DOW™ homopolymer polypropylene resins; DOW™ impact copolymer polypropylene resins; DOW™ random copolymer
polypropylene resins; INSPIRE™ performance polymers; UNIPOL™ PP process technology; SHAC™ and SHAC™ ADT catalystsystems
The Styrenics business, the global leader in the production of polystyrene resins, is uniquely positioned with geographic breadth andparticipation in a diversified portfolio of applications.
• Products: Licensing and supply of related catalysts, process control software and services for the Mass ABS process technology;
STYRON A-TECH™ and C-TECH™ advanced technology polystyrene resins and a full line of STYRON™ general purposepolystyrene resins; STYRON™ high-impact polystyrene resins
On March 2, 2010, Dow announced the entry into a definitive agreement to sell Styron to an affiliate of Bain Capital Partners; thetransaction closed on June 17, 2010. Businesses sold included Styrenics (polystyrene, acrylonitrile butadiene styrene, styreneacrylonitrile and expandable polystyrene), Polycarbonate and Compounds and Blends, as well as the Company’s 50-percent ownershipinterest in Americas Styrenics LLC, a nonconsolidated affiliate; all of which were reported in the Plastics segment through the date of thedivestiture.
The Plastics segment also includes the results of the Plastics Licensing and Catalyst business and the Polycarbonate and Compounds and Blendsbusiness (through the June 17, 2010 divestiture of Styron). It also includes the results of Equipolymers, Americas Styrenics LLC (through theJune 17, 2010 divestiture of Styron) and Univation Technologies, LLC (which licenses the UNIPOL™ polyethylene process and sells relatedcatalysts, including metallocene catalysts), as well as a portion of the results of EQUATE Petrochemical Company K.S.C., The Kuwait OlefinsCompany K.S.C. and the SCG-Dow Group, all joint ventures of the Company.
CHEMICALS AND ENERGYApplications: agricultural products • alumina • automotive antifreeze and coolant systems • carpet and textiles • chemical processing • dry cleaning •household cleaners and plastic products • inks • metal cleaning • packaging, food and beverage containers • paints, coatings and adhesives • personalcare products • petroleum refining • pharmaceuticals • plastic pipe • power • protective packaging • pulp and paper manufacturing • soaps anddetergents • water treatment
The Chlor-Alkali/Chlor-Vinyl business focuses on the production of chlorine for consumption by downstream Dow derivatives, as well asproduction, marketing and supply of ethylene dichloride, vinyl chloride monomer and caustic soda. These products are used for applicationssuch as alumina production, pulp and paper manufacturing, soaps and detergents and building and construction. Dow is the world’s largestproducer of both chlorine and caustic soda.
• Products: Caustic soda; Chlorine; Ethylene dichloride (EDC); Hydrochloric acid; Vinyl chloride monomer (VCM)
9

Table of Contents
The Energy business supplies power, steam and other utilities, principally for use in Dow’s global operations.
• Products: Power, steam and other utilities
The Ethylene Oxide/Ethylene Glycol business is the world’s largest producer of purified ethylene oxide, principally used in Dow’s downstreamperformance derivatives. Dow is also a key supplier of ethylene glycol to MEGlobal, a 50:50 joint venture and a world leader in the manufactureand marketing of merchant monoethylene glycol and diethylene glycol. Ethylene glycol is used in polyester fiber, polyethylene terephthalate (PET)for food and beverage container applications, polyester film, and aircraft and runway deicers.
• Products: Ethylene oxide (EO); Ethylene glycol (EG); METEOR™ EO/EG process technology and catalysts
The Chemicals and Energy segment also includes the results of the Chlorinated Organics business. Also included in the Chemicals and Energysegment are the results of MEGlobal and a portion of the results of EQUATE Petrochemical Company K.S.C., The Kuwait Olefins CompanyK.S.C. and the OPTIMAL Group of Companies (through the September 30, 2009 divestiture of this group of joint ventures), all joint ventures ofthe Company.
HYDROCARBONSApplications: polymer and chemical production
The Hydrocarbons business encompasses the procurement of natural gas liquids and crude oil-based raw materials, as well as the supply ofmonomers, principally for use in Dow’s global operations. The business regularly sells its by-products and buys and sells products in order tobalance regional production capabilities and derivative requirements. The business also sells products to certain Dow joint ventures. Dow is theworld leader in the production of olefins and aromatics.
• Products: Benzene; Butadiene; Butylene; Cumene; Ethylene; Propylene; Styrene
The Hydrocarbons segment also includes the results of Compañía Mega S.A. and a portion of the results of The Kuwait Olefins CompanyK.S.C. and the SCG-Dow Group, joint ventures of the Company.
On March 2, 2010, Dow announced the entry into a definitive agreement to sell Styron to an affiliate of Bain Capital Partners; the transactionclosed on June 17, 2010. Businesses and products sold included certain styrene monomer assets, which were reported in the Hydrocarbonssegment through the date of the divestiture.
Corporate includes the results of Ventures (which includes new business incubation platforms focused on identifying and pursuing new commercialopportunities); Venture Capital; non-business aligned technology licensing and catalyst activities; the Company’s insurance operations andenvironmental operations; and certain corporate overhead costs and cost recovery variances not allocated to the operating segments. In 2009, Corporatealso included the results of the Salt business, which the Company acquired with the April 1, 2009 acquisition of Rohm and Haas and sold to K+SAktiengesellschaft on October 1, 2009.
Industry Segments and Geographic Area ResultsSee Note Z to the Consolidated Financial Statements for information by operating segment and geographic area.
10

Table of Contents
CompetitionHistorically, the chemical industry has operated in a competitive environment, and that environment is expected to continue. The Company experiencessubstantial competition in each of its operating segments and in each of the geographic areas in which it operates. In addition to other chemical companies, thechemical divisions of major national and international oil companies, advanced material suppliers, and producers of crop protection chemicals andagricultural biotechnology provide substantial competition in the United States and abroad. Dow competes worldwide on the basis of quality, technology, priceand customer service, and for 2010, continued to be the largest U.S. producer of chemicals and plastics, in terms of sales.
Raw MaterialsThe Company operates in an integrated manufacturing environment. Basic raw materials are processed through many stages to produce a number of productsthat are sold as finished goods at various points in those processes.
The two major raw material streams that feed the integrated production of the Company’s finished goods are chlorine-based and hydrocarbon-based rawmaterials.
Salt, limestone and natural brine are the base raw materials used in the production of chlor-alkali products and derivatives. The Company owns saltdeposits in Louisiana and Texas; Alberta, Canada; Brazil; and Germany.
The Company purchases hydrocarbon raw materials including liquefied petroleum gases, crude oil, naphtha, natural gas and condensate. These rawmaterials are used in the production of both saleable products and energy. The Company also purchases electric power, benzene, ethylene and propylene tosupplement internal production. Expenditures for hydrocarbon feedstocks and energy accounted for 41 percent of the Company’s production costs andoperating expenses for the year ended December 31, 2010. The Company purchases these raw materials on both short- and long-term contracts.
Other significant raw materials include acetone, aniline, phenol, styrene, methanol, carbon black, ammonia, formaldehyde and acetic acid. TheCompany purchases these raw materials on both short- and long-term contracts.
The Company had adequate supplies of raw materials during 2010, and expects to continue to have adequate supplies of raw materials in 2011.
Method of DistributionAll products and services are marketed primarily through the Company’s sales force, although in some instances more emphasis is placed on sales throughdistributors.
Twenty-nine percent of the sales of the Chemicals and Energy segment in 2010 were to one customer, with which the Company has an ongoing supplycontract. In addition, excess ethylene glycol produced in Dow’s plants in the United States and Europe is sold to MEGlobal, a 50:50 joint venture withPetrochemical Industries Company (K.S.C.) of Kuwait. Sales to MEGlobal represented approximately 10 percent of the sales in the Chemicals and Energysegment in 2010. Twenty-five percent of the sales of the Hydrocarbons segment in 2010 were to two other customers with which the Company has ongoingsupply contracts. Other than the sales to these customers, no significant portion of the business of any operating segment is dependent upon a single customer.
No single product accounted for more than 5 percent of the Company’s consolidated net sales in 2010.
Research and DevelopmentThe Company is engaged in a continuous program of basic and applied research to develop new products and processes, to improve and refine existingproducts and processes, and to develop new applications for existing products. Research and development expenses were $1,660 million in 2010,$1,492 million in 2009 and $1,310 million in 2008. At December 31, 2010, the Company employed approximately 6,300 people in various research anddevelopment activities.
11

Table of Contents
Patents, Licenses and TrademarksThe Company continually applies for and obtains U.S. and foreign patents. At December 31, 2010, the Company owned 3,609 active U.S. patents and14,028 active foreign patents as follows: Patents Owned at December 31, 2010 U.S. Foreign Electronic and Specialty Materials 988 3,063 Coatings and Infrastructure 513 2,625 Health and Agricultural Sciences 573 1,882 Performance Systems 744 3,311 Performance Products 330 1,465 Plastics 215 931 Chemicals and Energy 26 106 Hydrocarbons 14 102 Corporate 206 543 Total 3,609 14,028
Dow’s primary purpose in obtaining patents is to protect the results of its research for use in operations and licensing. Dow is also party to a substantialnumber of patent licenses and other technology agreements. The Company had revenue related to patent and technology royalties totaling $191 million in2010, $269 million in 2009 and $307 million in 2008. The Company incurred royalties to others of $111 million in 2010, $102 million in 2009 and$60 million in 2008. Dow also has a substantial number of trademarks and trademark registrations in the United States and in other countries, including the“Dow in Diamond” trademark. Although the Company considers that its patents, licenses and trademarks in the aggregate constitute a valuable asset, it doesnot regard its business as being materially dependent upon any single patent, license or trademark.
Principal Partly Owned CompaniesDow’s principal nonconsolidated affiliates at December 31, 2010, including direct or indirect ownership interest for each, are listed below:
• Compañía Mega S.A. – 28 percent – an Argentine company that owns a natural gas separation and fractionation plant, which provides feedstocks
to the Company’s petrochemical plant located in Bahia Blanca, Argentina.
• Dow Corning Corporation – 50 percent – a U.S. company that manufactures silicone and silicone products. See Note N to the Consolidated
Financial Statements.
• EQUATE Petrochemical Company K.S.C. – 42.5 percent – a Kuwait-based company that manufactures ethylene, polyethylene and ethylene
glycol.
• Equipolymers – 50 percent – a company, headquartered in Horgen, Switzerland, that manufactures purified terephthalic acid, and manufactures
and markets polyethylene terephthalate resins. • The Kuwait Olefins Company K.S.C. – 42.5 percent – a Kuwait-based company that manufactures ethylene and ethylene glycol.
• MEGlobal – 50 percent – a company, headquartered in Dubai, United Arab Emirates, that manufactures and markets monoethylene glycol and
diethylene glycol.
• The SCG-Dow Group [consisting of Siam Polyethylene Company Limited – 49 percent; Siam Polystyrene Company Limited – 50 percent; Siam
Styrene Monomer Co., Ltd. – 50 percent; Siam Synthetic Latex Company Limited – 50 percent] – Thailand-based companies that manufacturepolyethylene, polystyrene, styrene and latex.
• Univation Technologies, LLC – 50 percent – a U.S. limited liability company that develops, markets and licenses polyethylene process
technology and related catalysts.
See Note H to the Consolidated Financial Statements for additional information.
12

Table of Contents
Financial Information About Foreign and Domestic Operations and Export SalesIn 2010, the Company derived 67 percent of its sales and had 52 percent of its property investment outside the United States. While the Company’sinternational operations may be subject to a number of additional risks, such as changes in currency exchange rates, the Company does not regard its foreignoperations, on the whole, as carrying any greater risk than its operations in the United States. Information on sales and long-lived assets by geographic area foreach of the last three years appears in Note Z to the Consolidated Financial Statements, and discussions of the Company’s risk management program forforeign exchange and interest rate risk management appear in Part I, Item 1A. Risk Factors; Part II, Item 7A. Quantitative and Qualitative Disclosures AboutMarket Risk; and Note J to the Consolidated Financial Statements.
Protection of the EnvironmentMatters pertaining to the environment are discussed in Part I, Item 7. Management’s Discussion and Analysis of Financial Condition and Results ofOperations; and Notes A and N to the Consolidated Financial Statements.
EmployeesPersonnel count was 49,505 at December 31, 2010, 52,195 at December 31, 2009 and 46,102 at December 31, 2008. Headcount decreased from year-end2009 primarily due to divestitures, including Styron, the Powder Coatings business and a portion of the Company’s acrylic monomer and specialty latexbusinesses, as well as actions taken related to the integration of Rohm and Haas and previously announced restructuring plans. Personnel count atDecember 31, 2009 was up from 46,102 at December 31, 2008, primarily due to the acquisition of Rohm and Haas, offset by declines related to restructuringactivities, business divestitures and personnel transfers to a joint venture.
Other ActivitiesDow engages in the property and casualty insurance and reinsurance business primarily through its Liana Limited subsidiaries.
13

Table of Contents
EXECUTIVE OFFICERS OF THE REGISTRANTSet forth below is information related to the Company’s executive officers as of February 11, 2011.
WILLIAM F. BANHOLZER, 54. EXECUTIVE VICE PRESIDENT, VENTURES, NEW BUSINESS DEVELOPMENT & LICENSING AND CHIEFTECHNOLOGY OFFICER. Employee of Dow since 2005. General Electric Company, Chemical Engineer 1983-1989. Laboratory Manager and Leader R&DCenter 1989-1992. Engineering Manager of Superabrasives Business 1992-1997. Vice President of Global Engineering, GE Lighting 1997-1999. VicePresident of Global Technology, GE Advanced Materials 1999-2005. Dow Corporate Vice President and Chief Technology Officer 2005-2009. Executive VicePresident and Chief Technology Officer 2009 to date. Ventures, New Business Development & Licensing May 2009 to date. Director of Dow CorningCorporation,* Dow Kokam LLC* and Mycogen Corporation.* Member of the Dow AgroSciences LLC* Members Committee and the Dow CorningCorporation Corporate Responsibility Committee. Elected to the U.S. National Academy of Engineering (“NAE”) 2002. Elected NAE Councilor 2005. Memberof American Chemical Society and American Institute of Chemical Engineers. Advisory Board member for chemistry and chemical engineering atMassachusetts Institute of Technology and University of California, Berkeley.
RONALD C. EDMONDS, 53. VICE PRESIDENT AND CONTROLLER. Employee of Dow since 1992. Arthur Anderson & Co. 1979-1982. The UpjohnCompany 1982-1991. Chiquita Brands International 1991-1992. Dow Latin America Audit Manager 1992-1994. Latin America Payables Controller 1994-1997. Global Payables Controller 1997-1998. Global Procurement Service Center Leader 1998-2001. Global Accounting Director 2001-2007. BusinessFinance Vice President for Performance Plastics and Chemicals and Market Facing Businesses 2007 to June 2009. Vice President and Assistant Controller July2009 to November 2009. Vice President and Controller November 2009 to date. Director of Dorinco Reinsurance Company,* DSL Holdings Inc.* and LianaLimited.* Director of the Midland Center for the Arts. Member of Financial Executives International Committee on Corporate Reporting, the American Instituteof Certified Public Accountants and the Michigan Association of Certified Public Accountants.
JAMES R. FITTERLING, 49. EXECUTIVE VICE PRESIDENT AND PRESIDENT, PLASTICS AND HYDROCARBONS. Employee of Dow since1984. Commercial Director Liquid Separation Dow Pacific 1994-1998. Global Business Director Liquid Separations and President and CEO of FilmTecCorporation* 1998-2000. Chief Executive Officer of The OPTIMAL Group 2002-2005 with added responsibility for the Southeast Asia and Australia regionin 2004. Business Vice President Polyethylene 2005-2007. President Basic Plastics 2007-2009. Vice President Corporate Development 2009 to August 2010.Dow Executive Vice President and President, Plastics and Hydrocarbons August 2010 to date. Chairman and Director of Univation Technologies, LLC.*Board member of Chemical Financial Corporation and the Midland Country Club.
GREGORY M. FREIWALD, 57. EXECUTIVE VICE PRESIDENT, HUMAN RESOURCES AND CORPORATE AFFAIRS, AND AVIATION. Employeeof Dow since 1979. Human Resources Manager, Chemical & Performance Business-U.S. Region 1992-1993. Human Resources Director for Executive,Finance, Law and Corporate 1993-1994. Latin America Human Resources and Quality Performance Director 1994-1996. Latin America Human ResourcesLeader and PBBPolisur S.A.* Human Resources Integration Leader 1996-1997. Global Human Resources, Resources Center Director 1997-2001. SeniorHuman Resources Director for Global Human Resources, Resource Center and Human Resources Director for Geographic Council 2001-2004. HumanResources Vice President, Operations 2004-2005. Human Resources Vice President 2005-2006. Vice President, Corporate Affairs and Executive Compensation2006-2007. Senior Vice President, Human Resources and Corporate Affairs 2008-2009. Executive Vice President, Human Resources, Corporate Affairs andAviation 2009 to date.
14
Table of Contents
MICHAEL R. GAMBRELL, 56. EXECUTIVE VICE PRESIDENT, MANUFACTURING AND ENGINEERING OPERATIONS. Employee of Dow since1976. Business Director for the North America Chlor-Alkali Assets Business 1989-1992. General Manager for the Plastic Lined Pipe Business 1992-1994.Vice President of Operations for Latin America 1994-1996. Corporate Director, Technology Centers and Global Process Engineering 1996-1998. GlobalBusiness Director, Chlor-Alkali Assets Business 1998-2000. Business Vice President, EDC/VCM & ECU Management 2000-2003. Business Vice President,Chlor-Vinyl Business 2003. Senior Vice President, Chemicals and Intermediates 2003-2005. Executive Vice President, Basic Plastics and Chemicals Portfolio2005-2007. Executive Vice President, Basic Plastics and Chemicals, and Manufacturing and Engineering 2007-2009. Executive Vice President, Manufacturingand Engineering Operations 2009 to date. Ex-officio member of the Dow Board of Directors’ Environment, Health and Safety Committee. Board member ofOman Petrochemical Industries Company LLC.* Director of TRW Automotive Holdings Corporation. Director of the National Association of Manufacturers.Director Emeritus of the U.S.-India Business Council. Member of the U.S. Department of Commerce’s Manufacturing Council. Member of the University ofMichigan Advisory Engineering Council. Recipient of the President’s Distinguished Career Award from Rose-Hulman Institute of Technology, 1996.
HEINZ HALLER, 55. EXECUTIVE VICE PRESIDENT AND CHIEF COMMERCIAL OFFICER. Employee of Dow 1980-1994 and since 2006.Marketing manager, Chlorinated Solvents 1984-1985. Frankfurt Sales office manager and Regional manager, Emulsion Polymers and Specialty Chemicals1986-1989. Dow business operations manager, Emulsion Polymers, New Ventures and Plastic Lined Pipe 1989-1992. Global business director, EmulsionPolymers 1993-1994. Managing Director and member of the board, OMYA-Plüss-Staufer AG 1994-1999. Chief Executive Officer, Red Bull Sauber AG andSauber Petronas Engineering AG 2000-2002. Managing Director, Allianz Capital Partners GmbH 2002-2006. Dow Corporate Vice President, StrategicDevelopment and New Ventures 2006-2007. Executive Vice President, Performance Plastics and Chemicals 2007-2009. Executive Vice President, Health,Agriculture and Infrastructure Group February 2009 to May 2009. Executive Vice President, Performance Systems May 2009 to August 2010. ChiefCommercial Officer August 2010 to date. Director of Mycogen Corporation,* Dow Kokam LLC* and Dow Corning Corporation.* Chairman of the DowAgroSciences LLC* Members Committee. Director of the Michigan Molecular Institute.
CHARLES J. KALIL, 59. EXECUTIVE VICE PRESIDENT, LAW AND GOVERNMENT AFFAIRS, GENERAL COUNSEL AND CORPORATESECRETARY. Employee of Dow since 1980. U.S. Department of Justice – Assistant U.S. Attorney, Eastern District of Michigan 1977-1980. GeneralCounsel of Petrokemya (a former 50:50 joint venture of the Company) 1982-1983. Regional Counsel to Middle East/Africa 1983-1986. SeniorEnvironmental Attorney 1986-1987. Litigation Staff Counsel and Group Leader 1987-1990. Senior Financial Law Counsel, Mergers and Acquisitions1990-1992. General Counsel and Area Director of Government and Public Affairs for Dow Latin America 1992-1997. Special Counsel and Manager ofINSITE™ legal issues 1997-2000. Assistant General Counsel for Corporate and Financial Law 2000-2003. Associate General Counsel for Corporate LegalAffairs 2003-2004. Dow Corporate Vice President and General Counsel 2004-2007. Senior Vice President and General Counsel 2007-2008. Executive VicePresident and General Counsel 2008 to date. Corporate Secretary 2005 to date. Board member of Dow Corning Corporation,* Dorinco ReinsuranceCompany,* Liana Limited* and Oman Petrochemical Industries Company LLC.* Member of the Conference Board’s Council of Chief Legal Officers.Member of the American Bar Association, District of Columbia Bar and the State Bar of Michigan. Board member of Institute for Legal Reform, U.S.Chamber of Commerce. Recipient of 2010 Bridge Builder of the Year Award, American Arab Chamber of Commerce.
15

Table of Contents
DAVID E. KEPLER, 58. EXECUTIVE VICE PRESIDENT, BUSINESS SERVICES, CHIEF SUSTAINABILITY OFFICER AND CHIEFINFORMATION OFFICER. Employee of Dow since 1975. Computer Services Manager of Dow U.S.A. Eastern Division 1984-1988. Commercial Directorof Dow Canada Performance Products 1989-1991. Director of Pacific Area Information Systems 1991-1993. Manager of Information Technology forChemicals and Plastics 1993-1994. Director of Global Information Systems Services 1994-1995. Director of Global Information Application 1995-1998.Vice President 1998-2000. Chief Information Officer 1998 to date. Corporate Vice President with responsibility for eBusiness 2000 to date. Responsibility forAdvanced Electronic Materials 2002-2003. Responsibility for Business Services – Customer Service, Information Systems, Purchasing, Six Sigma, SupplyChain 2004 to date. Senior Vice President with added responsibility for EH&S 2006 to date. Chief Sustainability Officer 2007 to date. Executive Vice President2008 to date. Director of Dorinco Reinsurance Company* and Liana Limited.* Director of Teradata Corporation. Chairman of the MidMichigan InnovationCenter Board of Directors. Member of U.S. Chamber of Commerce Board of Directors and American Chemistry Council Board of Directors. Member of theU.S. National Infrastructure Advisory Council, the American Chemical Society, the American Institute of Chemical Engineers, and the University ofCalifornia Board of Trustees.
ANDREW N. LIVERIS, 56. PRESIDENT, CHIEF EXECUTIVE OFFICER AND CHAIRMAN. DIRECTOR SINCE 2004. Employee of Dow since 1976.General manager of Dow’s Thailand operations 1989-1992. Group business director for Emulsion Polymers and New Ventures 1992-1993. Generalmanager of Dow’s start-up businesses in Environmental Services 1993-1994. Vice President of Dow’s start-up businesses in Environmental Services 1994-1995. President of Dow Chemical Pacific Limited* 1995-1998. Vice President of Specialty Chemicals 1998-2000. Business Group President forPerformance Chemicals 2000-2003. President and Chief Operating Officer 2003-2004. President and Chief Executive Officer 2004 to date and Chairman 2006to date. Director of Citigroup, Inc. and International Business Machines Corporation. Chairman of the International Council of Chemical Associations. ViceChairman of the U.S. Business Council. Past Chairman of the U.S.-China Business Council and American Chemistry Council. Member of the President’sExport Council, the American Australian Association, the Business Roundtable, the U.S.-India CEO Forum, and the Peterson Institute for InternationalEconomics. Member of the Board of Trustees of Tufts University.
JUAN R. LUCIANO, 49. EXECUTIVE VICE PRESIDENT AND PRESIDENT, PERFORMANCE DIVISION. Employee of Dow since 1985. Sales &Marketing Manager Specialty Chemicals 1994-1996. Senior Marketing Manager for the Americas, Polyglycols within Specialty Chemicals Portfolio 1996-1999. Business Director Chelants, Specialty Chemicals 1999-2000. Global Business Director LDPE/PRIMACOR™/SARAN™/Slurry PE 2000-2001.Global Business Director Polypropylene 2001-2004. Business Vice President Engineering Polymers 2004-2006. Global Business Vice President Olefins andAromatics 2006-2007. Business Group President Hydrocarbons and Energy 2007-2008. Senior Vice President Hydrocarbons and Energy, Basic Plastics, andJoint Ventures 2008 to August 2010. Dow Executive Vice President and President, Performance Division August 2010 to date. Members Committee of DowHydrocarbons and Resources LLC.*
JAMES D. MCILVENNY, 52. GROUP SENIOR VICE PRESIDENT, MEGA PROJECTS. Employee of Dow since 1982. Business Manager SeparationSystems 1989-1994. Director of Marketing, Sales and Service Liquid Separations 1994-1995. Global Business Director Liquid Separations 1995-1998.President and Chief Executive Officer FilmTec Corporation* 1995-1998. President and Chief Executive Officer Hampshire Chemical Corp.* 1998-2001.Business Vice President Specialty Polymers 2001-2004. President Greater China 2004-2006. President Dow Asia Pacific and Greater China 2006-2008. SeniorVice President Performance Products 2009 to August 2010. Dow Group Senior Vice President, Mega Projects August 2010 to date.
GEOFFERY E. MERSZEI, 59. EXECUTIVE VICE PRESIDENT; PRESIDENT OF DOW EUROPE, MIDDLE EAST AND AFRICA; AND CHAIRMANOF DOW EUROPE. Employee of Dow 1977-2001 and since 2005. Dow Middle East/Africa Credit Manager 1977-1980. Dow Asia Pacific Credit Manager1980-1982. Dow Asia Pacific Finance and Credit Manager 1982-1983. Dow Germany and Eastern Europe Treasurer 1983-1986. Dow Foreign ExchangeManager 1986-1988. Director of Finance for Dow Asia Pacific 1988-1991. Director of Finance/Treasurer for Dow Europe 1991-1996. Dow Vice Presidentand Treasurer 1996-2001. Alcan, Inc., Executive Vice President and Chief Financial Officer 2001-2005. Dow Executive Vice President and Chief FinancialOfficer 2005-2009. Board member of The Dow Chemical Company 2005-2009. President of Dow Europe, Middle East and Africa, and Chairman of DowEurope 2009 to date. Member of the European Chemical Industry Council Board and Executive Committee.
16

Table of Contents
JEROME A. PERIBERE, 56. EXECUTIVE VICE PRESIDENT AND PRESIDENT AND CHIEF EXECUTIVE OFFICER, DOW ADVANCEDMATERIALS. Employee of Dow since 1977. Regional Marketing Manager of Eastern Europe 1982-1985. Regional Manager for the Middle East and Africa1985-1988. European Agricultural Business Director 1988-1989. European Agricultural Commercial Director 1989-1993. Agricultural Global CommercialDirector 1993-1997. Corporate Strategy Leader for Dow AgroSciences 1997-1998. Vice President of Weed Management Global Business Unit and EuropeanTrade Area 1998-2002. Vice President Agricultural Chemicals 2002-2004. President and Chief Executive Officer of Dow AgroSciences 2004-2009. DowExecutive Vice President and President and Chief Executive Officer, Dow Advanced Materials 2009 to date. Board member of Harris Financial Corporationand the United Way of Southeastern Pennsylvania. Member of the Greater Philadelphia Chamber of Commerce.
FERNANDO RUIZ, 55. CORPORATE VICE PRESIDENT AND TREASURER. Employee of Dow since 1980. Treasurer, Ecuador Region 1982-1984.Treasurer, Mexico Region 1984-1988. Financial Operations Manager, Corporate Treasury 1988-1991. Assistant Treasurer, USA Area 1991-1992. SeniorFinance Manager, Corporate Treasury 1992-1996. Assistant Treasurer 1996-2001. Corporate Director of Insurance and Risk Management 2001. CorporateVice President and Treasurer 2001 to date. President and Chief Executive Officer, Liana Limited* and Dorinco Reinsurance Company* 2001 to date. Presidentof Dow Credit Corporation* 2001 to date. Director of Dow Financial Services Inc.* Member of Financial Executives International and Michigan StateUniversity (Eli Broad College of Business) Advisory Board. Member of DeVry, Inc. Board of Directors.
WILLIAM H. WEIDEMAN, 56. EXECUTIVE VICE PRESIDENT AND CHIEF FINANCIAL OFFICER. Employee of Dow since 1976. Controller ofTexas Operations 1994-1996. Global Business Controller for Specialty Chemicals 1996-1998. Global Finance Director for Specialty Chemicals 1998-2000.Global Finance Director for Performance Chemicals 2000-2004. Finance Vice President, Chemicals and Intermediates and Dow Ventures 2004-2006. GroupFinance Vice President for Basic Chemicals and Plastics Portfolio 2006. Vice President and Controller 2006 to November 2009. Vice President and InterimChief Financial Officer November 2009 to March 2010. Dow Executive Vice President and Chief Financial Officer March 2010 to date. Director of DowCorning Corporation,* Diamond Capital Management Inc.,* Dorinco Reinsurance Company* and Liana Limited.* Member of the Dow AgroSciences LLC*Members Committee. Director of the Dow Chemical Employees’ Credit Union and Family and Children’s Services of Midland. Board and finance committeemember of Mid Michigan Health. Member of Central Michigan University Accounting Advisory Committee and Central Michigan University DevelopmentBoard.
CAROL A. WILLIAMS, 52. GROUP SENIOR VICE PRESIDENT AND PRESIDENT, CHEMICALS AND ENERGY DIVISION. Employee of Dow since1980. Director of Analytical Science Lab 1993-1995. Global R&D Director Epoxy Products and Intermediates Business 1995-1999. North America Chlor-Alkali Assets Business Operations Leader, Site Leader 1999-2000. Business Vice President Chlor-Alkali Assets 2000-2003. Vice President Global Purchasing2003-2004. R&D Vice President Hydrocarbons & Energy, Chemicals & Intermediates and Corporate R&D 2004-2005. Vice President Business DevelopmentMarket Facing Businesses 2005-2006. Vice President R&D, Performance Plastics & Chemicals Portfolio 2006-2007. Corporate Vice President Market Facing,Business Development and Licensing 2007-2008. Senior Vice President Basic Chemicals Division 2008 to August 2010. Dow Group Senior Vice President andPresident, Chemicals and Energy Division August 2010 to date. Advisory Board member Engineering Department at Carnegie Mellon University. Member ofSociety of Women Engineers. Member of American Institute of Chemical Engineers. Chairperson of the World Chlorine Council. * A number of Company entities are referenced in the biographies and are defined as follows. Some of these entities have had various names over the years.
The names and relationships to the Company, unless otherwise indicated, are stated in this footnote as they existed as of February 11, 2011. Dow KokamLLC – ultimately 45 percent owned by Dow. Dow Corning Corporation, Oman Petrochemical Industries Company LLC and Univation Technologies, LLC– companies ultimately 50 percent owned by Dow. Diamond Capital Management Inc.; Dorinco Reinsurance Company; Dow AgroSciences LLC; DowChemical Pacific Limited; Dow Credit Corporation; Dow Financial Services Inc.; Dow Hydrocarbons and Resources LLC; DSL Holdings Inc.; FilmTecCorporation; Hampshire Chemical Corp.; Liana Limited; Mycogen Corporation; and PBBPolisur S.A. – all ultimately wholly owned subsidiaries of Dow.Ownership by Dow described above may be either direct or indirect.
17

Table of Contents
The Dow Chemical Company and SubsidiariesPART I, Item 1A. Risk Factors.
The factors described below represent the Company’s principal risks.
Global Economic Conditions: The Company operates in a global, competitive environment, which gives rise to operating and market riskexposure.The Company sells its broad range of products and services in a competitive, global environment, and competes worldwide for sales on the basis of productquality, price, technology and customer service. Increased levels of competition could result in lower prices or lower sales volume, which could have a negativeimpact on the Company’s results of operations.
Economic conditions around the world and in certain industries in which the Company does business also impact sales prices and volume. As a result,an economic downturn in the geographic areas or industries in which Dow sells its products could reduce demand for these products and result in decreasedsales volume, which could have a negative impact on Dow’s results of operations.
In addition, volatility and disruption of financial markets could limit customers’ ability to obtain adequate financing to maintain operations, whichcould result in a decrease in sales volume and have a negative impact on Dow’s results of operations. The Company’s global business operations also give riseto market risk exposure related to changes in foreign exchange rates, interest rates, commodity prices and other market factors such as equity prices. Tomanage such risks, Dow enters into hedging transactions pursuant to established guidelines and policies. If Dow fails to effectively manage such risks, itcould have a negative impact on the Company’s results of operations.
The economic environment impacts the fair value of pension and insurance assets, which could trigger increased future funding requirements of thepension trusts and could result in other- than- temporary impairment losses for certain insurance assets.
Financial Obligations and Credit Markets: Market conditions could reduce the Company’s flexibility to respond to changing business conditions orfund capital needs.Interest and dividend payments could increase the Company’s vulnerability to adverse economic conditions and reduce the Company’s flexibility to respond tochanging business and economic conditions or to fund capital expenditures or working capital needs. In addition, the economic environment could result in acontraction in the availability of credit in the marketplace and reduce sources of liquidity for the Company. This could result in higher borrowing costs.
Raw Materials: Availability of purchased feedstocks and energy and the volatility of these costs impact Dow’s operating costs and addvariability to earnings.The Company purchases hydrocarbon raw materials including liquefied petroleum gases, crude oil, naphtha, natural gas and condensate. The Company alsopurchases electric power, benzene, ethylene and propylene to supplement internal production, as well as other raw materials. If the Company’s key suppliersare unable to provide the raw materials required for production, it could have a negative impact on Dow’s results of operations.
Purchased feedstock and energy costs account for a substantial portion of the Company’s total production costs and operating expenses. While theCompany uses its feedstock flexibility and financial and physical hedging programs to lower overall feedstock costs, when these costs increase the Companyis not always able to immediately raise selling prices; and, ultimately, the ability to pass on underlying cost increases is greatly dependent on marketconditions. Conversely, when these costs decline, selling prices decline as well. As a result, volatility in these costs could negatively impact the Company’sresults of operations.
Supply/Demand Balance: Earnings generated by the Company’s basic chemical and plastic products vary based in part on the balance ofsupply relative to demand within the industry.The balance of supply relative to demand within the industry may be significantly impacted by the addition of new capacity, especially for basic commoditieswhere capacity is generally added in large increments as world-scale facilities are built. This may disrupt industry balances and result in downward pressureon prices due to the increase in supply, which could negatively impact the Company’s results of operations.
18

Table of Contents
Litigation: The Company is party to a number of claims and lawsuits arising out of the normal course of business with respect to commercialmatters including product liability, governmental regulation and other actions.Certain of the claims and lawsuits facing the Company purport to be class actions and seek damages in very large amounts. All such claims are contested.With the exception of the possible effect of the asbestos-related liability of Union Carbide Corporation (“Union Carbide”), described below, it is the opinion ofthe Company’s management that the possibility is remote that the aggregate of all such claims and lawsuits will have a material adverse impact on theCompany’s consolidated financial statements.
Union Carbide is and has been involved in a large number of asbestos-related suits filed primarily in state courts during the past three decades. AtDecember 31, 2010, Union Carbide’s asbestos-related liability for pending and future claims was $728 million ($839 million at December 31, 2009) and itsreceivable for insurance recoveries related to the asbestos liability was $50 million ($84 million at December 31, 2009). At December 31, 2010, Union Carbidealso had receivables of $248 million ($448 million at December 31, 2009) for insurance recoveries for defense and resolution costs. It is the opinion of theCompany’s management that it is reasonably possible that the cost of Union Carbide disposing of its asbestos-related claims, including future defense costs,could have a material adverse impact on the Company’s results of operations and cash flows for a particular period and on the consolidated financial positionof the Company.
Environmental Compliance: Actual or alleged violations of environmental laws or permit requirements could result in restrictions or prohibitionson plant operations, substantial civil or criminal sanctions, as well as the assessment of strict liability and/or joint and several liability.The Company is subject to extensive federal, state, local and foreign laws, regulations, rules and ordinances relating to pollution, protection of theenvironment, and the generation, storage, handling, transportation, treatment, disposal and remediation of hazardous substances and waste materials. AtDecember 31, 2010, the Company had accrued obligations of $607 million ($619 million at December 31, 2009) for probable environmental remediation andrestoration costs, including $59 million ($80 million at December 31, 2009) for the remediation of Superfund sites. This is management’s best estimate of thecosts for remediation and restoration with respect to environmental matters for which the Company has accrued liabilities, although the ultimate cost withrespect to these particular matters could range up to approximately twice that amount. Costs and capital expenditures relating to environmental, health or safetymatters are subject to evolving regulatory requirements and depend on the timing of the promulgation and enforcement of specific standards which impose therequirements. Moreover, changes in environmental regulations could inhibit or interrupt the Company’s operations, or require modifications to its facilities.Accordingly, environmental, health or safety regulatory matters could result in significant unanticipated costs or liabilities.
Chemical Safety: Increased concerns regarding the safe use of chemicals in commerce and their potential impact on the environment have resultedin more restrictive regulations from local, state and federal governments and could lead to new regulations.Concerns regarding the safe use of chemicals in commerce and their potential impact on health and the environment reflect a growing trend in societal demandsfor increasing levels of product safety and environmental protection. These concerns could manifest themselves in stockholder proposals, preferredpurchasing and continued pressure for more stringent regulatory intervention. These concerns could also influence public perceptions, the viability of theCompany’s products, the Company’s reputation and the cost to comply with regulations. In addition, terrorist attacks and natural disasters have increasedconcerns about the security and safety of chemical production and distribution. These concerns could have a negative impact on the Company’s results ofoperations.
Local, state and federal governments continue to propose new regulations related to the security of chemical plant locations and the transportation ofhazardous chemicals, which could result in higher operating costs and interruptions in normal business operations.
19

Table of Contents
Operational Event: A significant operational event could negatively impact the Company’s results of operations.As a diversified chemical manufacturing company, the Company’s operations, the transportation of products or severe weather could result in an unplannedevent that could be significant in scale and could negatively impact operations, neighbors or the public at large, which could have a negative impact on theCompany’s results of operations.
In the past, major hurricanes have caused significant disruption in Dow’s operations on the U.S. Gulf Coast, logistics across the region, and the supplyof certain raw materials, which had an adverse impact on volume and cost for some of Dow’s products. Due to the Company’s substantial presence on theU.S. Gulf Coast, similar severe weather in the future could negatively affect Dow’s results of operations.
Company Strategy: Implementing certain elements of the Company’s strategy could negatively impact the Company’s financial results.The Company is evaluating the formation of new joint ventures in emerging geographies to build and operate integrated, world-scale facilities. Large projectslike these are accompanied by uncertainty and risks including: learning to navigate different government regulatory environments; developing relationshipswith new, local partners; and determining raw material supply and other details regarding product movement. If the implementation of these proposed jointventures is not successful, it could adversely affect the Company’s financial condition and results of operations.
Goodwill: An impairment of goodwill would negatively impact the Company’s financial results.The April 1, 2009 acquisition of Rohm and Haas Company increased the Company’s goodwill by $9.7 billion. At least annually, the Company performs animpairment test for goodwill. When tested, if the carrying value of a reporting unit exceeds its estimated fair value, impairment is deemed to have occurred andthe carrying value of goodwill is written down to fair value with a charge against earnings. Since the Company utilizes a discounted cash flow methodology tocalculate the fair value of its reporting units, continued weak demand for a specific product line or business could result in an impairment. Accordingly, anydetermination requiring the write-off of a significant portion of goodwill could negatively impact the Company’s results of operations.
Implementation of ERP system: The Company’s implementation of a new enterprise resource planning (“ERP”) system may adversely affectthe Company’s business and results of operations or the effectiveness of internal control over financial reporting.Beginning in the first quarter of 2011, the Company is implementing a new ERP system that will deliver a new generation of work processes and informationsystems. ERP implementations are complex and time-consuming projects that involve substantial expenditures on system software and implementationactivities that take several years. ERP implementations also require transformation of business and financial processes in order to reap the benefits of the ERPsystem. If the Company does not effectively implement the ERP system as planned or if the system does not operate as intended, it could adversely affectfinancial reporting systems, the Company’s ability to produce financial reports, and/or the effectiveness of internal control over financial reporting.
20

Table of Contents
The Dow Chemical Company and SubsidiariesPART I, Item 1B. Unresolved Staff Comments
UNRESOLVED STAFF COMMENTS
None.
21

Table of Contents
The Dow Chemical Company and SubsidiariesPART I, Item 2. Properties.
PROPERTIES
The Company operates 188 manufacturing sites in 35 countries. Properties of Dow include facilities which, in the opinion of management, are suitable andadequate for the manufacture and distribution of Dow’s products. During 2010, the Company’s production facilities and plants operated at 83 percent ofcapacity. The Company’s major production sites are as follows:
United States:
Plaquemine and Hahnville, Louisiana; Midland, Michigan; Freeport, Seadrift, TexasCity and Deer Park, Texas; Marlborough, Massachusetts.
Canada: Fort Saskatchewan, Alberta.Germany: Boehlen; Leuna; Rheinmuenster; Schkopau; Stade.France: Drusenheim.The Netherlands: Terneuzen.Spain: Tarragona.Argentina: Bahia Blanca.Brazil: Aratu.
Including the major production sites, the Company has plants and holdings in the following geographic areas:
United States: 55 manufacturing locations in 20 states.Canada: 4 manufacturing locations in 3 provinces.Europe, Middle East and Africa: 59 manufacturing locations in 18 countries.Latin America: 27 manufacturing locations in 5 countries.Asia Pacific: 43 manufacturing locations in 10 countries.
All of Dow’s plants are owned or leased, subject to certain easements of other persons which, in the opinion of management, do not substantiallyinterfere with the continued use of such properties or materially affect their value.
A summary of properties, classified by type, is provided in Note G to the Consolidated Financial Statements. Additional information regarding leasedproperties can be found in Note R to the Consolidated Financial Statements.
22

Table of Contents
The Dow Chemical Company and SubsidiariesPART I, Item 3. Legal Proceedings.
LEGAL PROCEEDINGSAsbestos-Related Matters of Union Carbide CorporationUnion Carbide Corporation (“Union Carbide”), a wholly owned subsidiary of the Company, is and has been involved in a large number of asbestos-relatedsuits filed primarily in state courts during the past three decades. These suits principally allege personal injury resulting from exposure to asbestos-containingproducts and frequently seek both actual and punitive damages. The alleged claims primarily relate to products that Union Carbide sold in the past, allegedexposure to asbestos-containing products located on Union Carbide’s premises, and Union Carbide’s responsibility for asbestos suits filed against a formerUnion Carbide subsidiary, Amchem Products, Inc.
It is the opinion of Dow’s management that it is reasonably possible that the cost of Union Carbide disposing of its asbestos-related claims, includingfuture defense costs, could have a material adverse impact on the Company’s results of operations and cash flows for a particular period and on theconsolidated financial position of the Company.
For additional information, see Asbestos-Related Matters of Union Carbide Corporation in Management’s Discussion and Analysis of FinancialCondition and Results of Operations, and Note N to the Consolidated Financial Statements.
Environmental MattersIn a meeting on April 28, 2010, the Company received verbal and written communications from the U.S. Environmental Protection Agency (“EPA”) notifyingthe Company of the EPA’s intent to seek injunctive relief and assess a civil penalty against the Company for alleged violations of various environmental rulesand regulations at the Company’s Midland, Michigan site. The Company is negotiating with the EPA and the U.S. Department of Justice and expects thatresolution of this matter will likely result in a civil penalty in excess of $100,000.
The Company received a written communication dated September 17, 2010 from the EPA, notifying the Company of the EPA’s intent to assess a civilpenalty against the Company for alleged violations of various environmental rules and regulations at the Company’s Plaquemine, Louisiana site. TheCompany is negotiating with the EPA and expects that resolution of this matter will likely result in a civil penalty in excess of $100,000.
Rohm and Haas Pension Plan MattersIn December 2005, a federal judge in the U.S. District Court for the Southern District of Indiana (the “District Court”) issued a decision granting a class ofparticipants in the Rohm and Haas Pension Plan (the “Rohm and Haas Plan”) who had retired from Rohm and Haas Company (“Rohm and Haas”), now awholly owned subsidiary of the Company, and who elected to receive a lump sum benefit from the Rohm and Haas Plan, the right to a cost-of-livingadjustment (“COLA”) as part of their retirement benefit. In August 2007, the Seventh Circuit Court of Appeals affirmed the District Court’s decision, and inMarch 2008, the U.S. Supreme Court denied the Rohm and Haas Plan’s petition to review the Seventh Circuit’s decision. The case was returned to the DistrictCourt for further proceedings. In October 2008 and February 2009, the District Court issued rulings that have the effect of including in the class all Rohm andHaas retirees who received a lump sum distribution without a COLA from the Rohm and Haas Plan since January 1976. These rulings are subject to appeal,and the District Court has not yet determined the amount of the COLA benefits that may be due to the class participants. The Rohm and Haas Plan and theplaintiffs entered into a settlement agreement that, in addition to settling the litigation with respect to the Rohm and Haas retirees, provides for the amendment ofthe complaint and amendment of the Rohm and Haas Plan to include active employees in the settlement benefits. The District Court preliminarily approved thesettlement on November 24, 2009 and, following a hearing on March 12, 2010, issued a final order approving the settlement on April 12, 2010. A group ofobjectors to the settlement filed an appeal from the final order. In November 2010, the District Court issued an order approving class counsel’s fee awardpetition in an amount consistent with the terms of the settlement. The same objectors also appealed this order. Both appeals are pending.
A pension liability associated with this matter of $185 million was recognized as part of the acquisition of Rohm and Haas on April 1, 2009. Theliability, which was determined in accordance with the accounting guidance for contingencies, recognized the estimated impact of the above described judicialdecisions on the long-term Rohm and Haas Plan obligations owed to the applicable Rohm and Haas retirees and active employees. At December 31, 2010, theCompany had a liability of $186 million ($183 million at December 31, 2009) associated with this matter.
23

Table of Contents
The Dow Chemical Company and SubsidiariesPART I, Item 4. Reserved .
RESERVED
24

Table of Contents
The Dow Chemical Company and SubsidiariesPART II, Item 5. Market for Registrant’s Common Equity,
Related Stockholder Matters and Issuer Purchases of Equity Securities.
MARKET FOR REGISTRANT’S COMMON EQUITY, RELATED STOCKHOLDER MATTERS AND ISSUER PURCHASES OF EQUITYSECURITIESThe principal market for the Company’s common stock is the New York Stock Exchange, traded under the symbol “DOW.”
Quarterly market and dividend information can be found in Quarterly Statistics at the end of Part II, Item 8. Financial Statements and SupplementaryData.
At December 31, 2010, there were 84,119 registered common stockholders. The Company estimates that there were an additional 554,000 stockholderswhose shares were held in nominee names at December 31, 2010. At January 31, 2011, there were 83,711 registered common stockholders.
On December 8, 2010, the Board of Directors declared a quarterly dividend of $0.15 per share, payable January 28, 2011, to stockholders of record onDecember 31, 2010. On February 9, 2011, the Board of Directors declared a quarterly dividend of $0.15 per share, payable April 29, 2011, to stockholdersof record on March 31, 2011. Since 1912, the Company has paid a cash dividend every quarter and, in each instance prior to February 12, 2009, hadmaintained or increased the amount of the dividend, adjusted for stock splits. During this 97-year period, Dow has increased the amount of the quarterlydividend 47 times (approximately 12 percent of the time), and maintained the amount of the quarterly dividend approximately 88 percent of the time. Thedividend was reduced in February 2009, for the first time in the 97-year period, due to uncertainty in the credit markets, unprecedented lower demand forchemical products, the ongoing global recession and pending business issues. The Company declared dividends of $0.60 per share in 2010, $0.60 per sharein 2009 and $1.68 per share in 2008.
See Part III, Item 11. Executive Compensation for information relating to the Company’s equity compensation plans.
The following table provides information regarding purchases of the Company’s common stock by the Company during the three months endedDecember 31, 2010: Issuer Purchases of Equity Securities
Total number of sharespurchased as part of the
Company’s publicly
Approximate dollar valueof shares that may yet be
purchased under theCompany’s publicly
Period
Total numberof shares
purchased (1)
Averageprice paidper share
announced sharerepurchase program (2)
announced sharerepurchase program
October 2010 2,048 $29.85 - - November 2010 4,974 $32.25 - - December 2010 1,268 $34.24 - - Fourth quarter 2010 8,290 $31.96 - - (1) Represents shares received from employees and non-employee directors to pay taxes owed to the Company as a result of the exercise of stock options or
the delivery of deferred stock. For information regarding the Company’s stock option plans, see Note T to the Consolidated Financial Statements.(2) The Company does not currently have an authorized share repurchase program.
25

Table of Contents
The Dow Chemical Company and SubsidiariesPART II, Item 6. Selected Financial Data.
In millions, except as noted (Unaudited) 2010 2009 2008 2007 2006 Summary of Operations (1)
Net sales (2) $ 53,674 $ 44,875 $ 57,361 $ 53,375 $ 49,009 Cost of sales (2) 45,780 39,148 51,913 46,302 41,448 Research and development expenses 1,660 1,492 1,310 1,305 1,164 Selling, general and administrative expenses 2,609 2,487 1,966 1,861 1,660 Amortization of intangibles 509 399 92 72 50 Special charges: restructuring, merger-related, asbestos-related, IPR&D,
impairment losses 115 869 1,117 635 414 Equity in earnings of nonconsolidated affiliates 1,112 630 787 1,122 9 5 9 Sundry income - net 125 891 89 324 137 Interest expense - net 1,436 1,532 562 454 431 Income (Loss) from continuing operations before income taxes 2,802 469 1,277 4,192 4,938 Provision (Credit) for income taxes 481 (97) 651 1,230 1,142 Net income (loss) from continuing operations 2,321 5 6 6 626 2,962 3,796 Income from discontinued operations, net of income taxes - 110 28 23 21 Net income attributable to noncontrolling interests 11 28 75 98 93 Preferred stock dividends 340 312 - - - Income (Loss) before cumulative effect of changes in accounting principles 1,970 336 579 2,887 3,724 Cumulative effect of changes in accounting principles - - - - -
Net income (loss) available for The Dow Chemical Company common stockholders $ 1,970 $ 336 $ 579 $ 2,887 $ 3,724 Per share of common stock (in dollars): (3)
Net income (loss) from continuing operations per common share - basic $ 1.75 $ 0.22 $ 0.59 $ 3.00 $ 3.85 Discontinued operations per common share - basic - 0.10 0.03 0.03 0.02 Earnings (Loss) per common share - basic 1.75 0.32 0.62 3.03 3.87 Net income (loss) from continuing operations per common share - diluted $ 1.72 $ 0.22 $ 0.59 $ 2.97 $ 3.80 Discontinued operations per common share - diluted - 0.10 0.03 0.02 0.02 Earnings (Loss) per common share - diluted 1.72 0.32 0.62 2.99 3.82 Cash dividends declared per share of common stock $ 0.60 $ 0.60 $ 1.68 $ 1.64 $ 1.50 Cash dividends paid per share of common stock 0.60 0.87 1.68 1.59 1.46 Book value per share of common stock 19.23 18.42 14.62 20.62 17.81
Weighted-average common shares outstanding - basic (3) 1,125.9 1,043.2 930.4 953.1 962.3 Weighted-average common shares outstanding - diluted (3) 1,143.8 1,053.9 939.0 965.6 974.4 Convertible preferred shares outstanding (thousands) 4,000 4,000 - - -
Year-end Financial Position Total assets $ 69,588 $ 66,018 $ 45,474 $ 48,801 $45,581 Working capital 9,885 6,437 2,952 6,209 6,608 Property - gross 51,648 53,567 48,391 47,708 44,381 Property - net 17,668 18,141 14,294 14,388 13,722 Long-term debt 20,605 19,152 8,042 7,581 8,036 Total debt 23,827 22,373 11,856 9,715 9,546 The Dow Chemical Company’s stockholders’ equity 21,839 20,555 13,511 19,389 17,065
Financial Ratios Research and development expenses as percent of net sales (2) 3.1% 3.3% 2.3% 2.4% 2.4% Income (Loss) from continuing operations before income taxes as percent of net
sales (2) 5.2% 1.0% 2.2% 7.9% 10.1% Return on stockholders’ equity 11.0% 2.0% 4.3% 14.9% 21.8% Debt as a percent of total capitalization 51.3% 51.4% 45.7% 31.8% 34.1%
General Capital expenditures $ 2,130 $ 1,683 $ 2,276 $ 2,075 $ 1,775 Depreciation 2,289 2,291 2,016 1,959 1,904 Salaries and wages paid 5,711 5,152 4,681 4,404 3,935 Cost of employee benefits 1,653 1,389 981 1,130 1,125 Number of employees at year-end (thousands) 49.5 52.2 46.1 45.9 42.6 Number of Dow stockholders of record at year-end (thousands) (4) 84.1 89.9 94.6 98.7 103.1
(1) Adjusted to report sale of the Calcium Chloride business in 2009 as discontinued operations.(2) Adjusted for reclassification of insurance operations in 2002.(3) Adjusted for 3-for-1 stock split in 2000.(4) Stockholders of record as reported by the transfer agent. The Company estimates that there were an additional 554,000 stockholders whose shares were
held in nominee names at December 31, 2010.

26

Table of Contents
The Dow Chemical Company and SubsidiariesPART II, Item 6. Selected Financial Data.
In millions, except as noted (Unaudited) 2005 2004 2003 2002 2001 2000 Summary of Operations (1)
Net sales (2) $46,186 $ 40,063 $32,536 $ 27,545 $ 27,988 $ 29,727 Cost of sales (2) 38,194 34,175 28,110 23,737 23,838 24,256 Research and development expenses 1,073 1,022 981 1,066 1,072 1,119 Selling, general and administrative expenses 1,542 1,434 1,390 1,595 1,762 1,822 Amortization of intangibles 5 5 81 63 6 5 178 139 Special charges: restructuring, merger-related, asbestos-related,
IPR&D, impairment losses 114 543 - 1,108 1,556 6 Equity in earnings of nonconsolidated affiliates 964 923 322 40 29 354 Sundry income - net 755 6 9 9 146 54 394 352 Interest expense - net 564 661 736 708 648 519 Income (Loss) from continuing operations before income taxes 6,363 3,769 1,724 (640) (643) 2,572 Provision (Credit) for income taxes 1,769 867 (92) (287) (239) 834 Net income (loss) from continuing operations 4,594 2,902 1,816 (353) (404) 1,738 Income from discontinued operations, net of income taxes 23 17 17 11 19 9 Net income attributable to noncontrolling interests 82 122 94 63 32 72 Preferred stock dividends - - - - - - Income (Loss) before cumulative effect of changes in accounting
principles 4,535 2,797 1,739 (405) (417) 1,675 Cumulative effect of changes in accounting principles (20) - (9) 67 32 - Net income (loss) available for The Dow Chemical Company
common stockholders $ 4,515 $ 2,797 $ 1,730 $ (338) $ (385) $ 1,675 Per share of common stock (in dollars): (3)
Net income (loss) from continuing operations per common share -basic $ 4.66 $ 2.96 $ 1.86 $ (0.38) $ (0.45) $ 1.87
Discontinued operations per common share - basic 0.03 0.02 0.02 0.01 0.02 0.01 Earnings (Loss) per common share - basic 4.69 2.98 1.88 (0.37) (0.43) 1.88 Net income (loss) from continuing operations per common share -
diluted $ 4.60 $ 2.91 $ 1.85 $ (0.38) $ (0.45) $ 1.84 Discontinued operations per common share - diluted 0.02 0.02 0.02 0.01 0.02 0.01 Earnings (Loss) per common share - diluted 4.62 2.93 1.87 (0.37) (0.43) 1.85 Cash dividends declared per share of common stock $ 1.34 $ 1.34 $ 1.34 $ 1.34 $ 1.30 $ 1.16 Cash dividends paid per share of common stock 1.34 1.34 1.34 1.34 1.25 1.16 Book value per share of common stock 15.84 12.88 9.89 8.36 11.04 13.22
Weighted-average common shares outstanding - basic (3) 963.2 940.1 918.8 910.5 901.8 893.2 Weighted-average common shares outstanding - diluted (3) 976.8 953.8 926.1 910.5 901.8 904.5 Convertible preferred shares outstanding (thousands) - - - - - -
Year-end Financial Position Total assets $ 45,934 $ 45,885 $41,891 $ 39,562 $35,515 $35,991 Working capital 6,741 5,384 3,578 2,519 2,183 1,150 Property - gross 41,934 41,898 40,812 37,934 35,890 34,852 Property - net 13,537 13,828 14,217 13,797 13,579 13,711 Long-term debt 9,186 11,629 11,763 11,659 9,266 6,613 Total debt 10,706 12,594 13,109 13,036 10,883 9,450 The Dow Chemical Company’s stockholders’ equity 15,324 12,270 9,175 7,626 9,993 11,840
Financial Ratios Research and development expenses as percent of net sales (2) 2.3% 2.6% 3.0% 3.9% 3.8% 3.8% Income (Loss) from continuing operations before income taxes as
percent of net sales (2) 13.8% 9.4% 5.3% (2.3)% (2.3)% 8.7% Return on stockholders’ equity 29.5% 22.8% 18.9% (4.4)% (3.9)% 14.1% Debt as a percent of total capitalization 39.1% 47.9% 55.4% 59.2% 48.9% 42.5%
General Capital expenditures $ 1,597 $ 1,333 $ 1,100 $ 1,623 $ 1,587 $ 1,808 Depreciation 1,904 1,904 1,753 1,680 1,595 1,554 Salaries and wages paid 4,309 3,993 3,608 3,202 3,215 3,395 Cost of employee benefits 988 885 783 611 540 486 Number of employees at year-end (thousands) 42.4 43.2 46.4 50.0 52.7 53.3 Number of Dow stockholders of record at year-end (thousands) (4) 105.6 108.3 113.1 122.5 125.1 87.9
(1) Adjusted to report sale of the Calcium Chloride business in 2009 as discontinued operations.

(2) Adjusted for reclassification of insurance operations in 2002.(3) Adjusted for 3-for-1 stock split in 2000.(4) Stockholders of record as reported by the transfer agent. The Company estimates that there were an additional 554,000 stockholders whose shares were
held in nominee names at December 31, 2010.
27

Table of Contents
The Dow Chemical Company and SubsidiariesPART II, Item 7. Management’s Discussion and Analysis of Financial
Condition and Results of Operations. Management’s Discussion and Analysis of Financial Condition and Results of Operations Page
2010 Overview 29 Acquisition of Rohm and Haas Company 31 Results of Operations 32 Segment Results 39 Electronic and Specialty Materials 40 Coatings and Infrastructure 42 Health and Agricultural Sciences 43 Performance Systems 45 Performance Products 46 Plastics 48 Chemicals and Energy 50 Hydrocarbons 52 Sales Price and Volume Charts 5 5 Liquidity and Capital Resources 5 6 Cash Flow 5 6 Working Capital 57 Debt 57 Financing Activities 58 Financing Activities Related to the Acquisition of Rohm and Haas 5 9 Capital Expenditures 60 Contractual Obligations 61 Off-Balance Sheet Arrangements 61 Fair Value Measurements 62 Dividends 62 Outlook for 2011 63 Critical Accounting Policies 63 Environmental Matters 68 Asbestos-Related Matters of Union Carbide Corporation 72 Matters Involving the Formation of K-Dow Petrochemicals 75
FORWARD-LOOKING INFORMATIONThe Private Securities Litigation Reform Act of 1995 provides a “safe harbor” for forward-looking statements made by or on behalf of The Dow ChemicalCompany and its subsidiaries (“Dow” or the “Company”). This section covers the current performance and outlook of the Company and each of its operatingsegments. The forward-looking statements contained in this section and in other parts of this document involve risks and uncertainties that may affect theCompany’s operations, markets, products, services, prices and other factors as more fully discussed elsewhere and in filings with the U.S. Securities andExchange Commission (“SEC”). These risks and uncertainties include, but are not limited to, economic, competitive, legal, governmental and technologicalfactors. Accordingly, there is no assurance that the Company’s expectations will be realized. The Company assumes no obligation to provide revisions to anyforward-looking statements should circumstances change, except as otherwise required by securities and other applicable laws.
ABOUT DOWDow combines the power of science and technology with the “Human Element” to passionately innovate what is essential to human progress. The Companyconnects chemistry and innovation with the principles of sustainability to help address many of the world’s most challenging problems such as the need forclean water, renewable energy generation and conservation, and increasing agricultural productivity. Dow’s diversified industry-leading portfolio of specialtychemical, advanced materials, agrosciences and plastics businesses deliver a broad range of technology-based products and solutions to customers inapproximately 160 countries and in high growth sectors such as electronics, water, energy, coatings and agriculture. In 2010, Dow had annual sales of$53.7 billion. The Company conducts its worldwide operations through global businesses, which are reported in eight operating segments: Electronic andSpecialty Materials, Coatings and Infrastructure, Health and Agricultural Sciences, Performance Systems, Performance Products, Plastics, Chemicals andEnergy, and Hydrocarbons.
28

Table of Contents
In 2010, 36 percent of the Company’s sales were to customers in North America; 34 percent were in Europe, Middle East and Africa (“EMEA”); whilethe remaining 30 percent were to customers in Asia Pacific and Latin America. The Company employs approximately 50,000 people and has a broad, globalreach with 188 manufacturing sites in 35 countries.
2010 OVERVIEWIn 2010, Dow and the chemical industry as a whole experienced another year of improving economic conditions. Economies across much of the developedworld showed signs of ongoing recovery in most end-markets as the year progressed. Meanwhile, the emerging geographies continued to lead in economicgrowth and, as a result, were a critical area of focus for new business opportunities and investments. As the year came to a close, however, some challengesremained, such as high unemployment in developed geographies and weakness in construction end-markets, particularly in the United States and Europe. Inthe face of these challenges, Dow delivered a reshaped and transformed business portfolio in 2010 – one that is increasingly targeted to growing geographicareas and end-markets, and well-balanced to mitigate uncertainties.
Dow’s reported sales increased 20 percent from 2009 to $53.7 billion, an increase of 15 percent from pro forma 2009 sales. Excluding the impact ofdivestitures, sales rose 26 percent versus pro forma 2009 sales. The Company reported quarterly sequential sales gains throughout the year, excludingdivestitures. Sales improvements were broad-based, with notable gains in emerging geographies around the world. Dow’s reported sales in the emerginggeographies surpassed $16 billion. As the global economic recovery continued, feedstock and energy costs rose throughout the year and remained volatile. TheCompany’s purchased feedstock and energy costs were $5.0 billion higher than 2009, an increase of 31 percent.
The Company reported volume growth of 2 percent over 2009 pro forma sales. Excluding the impact of divestitures, Dow reported a 12 percentimprovement in volume, with gains in all operating segments and geographic areas. Volume growth was notable in the Performance segments (Electronic andSpecialty Materials; Coatings and Infrastructure; Health and Agricultural Sciences; Performance Systems; and Performance Products), all of which reporteddouble-digit volume growth except Coatings and Infrastructure, which was impacted by continued weakness in the construction industry. Compared with2009 pro forma sales, price rose 13 percent on a reported basis and 14 percent excluding divestitures. Price gains were most significant in the Basics segments(Plastics; Chemicals and Energy; and Hydrocarbons), which together reported a 25 percent improvement compared with 2009. Dow’s results from jointventures returned to the level of earnings reported before the global economic recession, totaling $1.1 billion for the year, an increase of more than 75 percentfrom 2009. Earnings available for common stockholders increased from $0.32 per share in 2009 to $1.72 per share in 2010.
The Company continued to invest for growth in the year, reinforcing its strategic focus on science-based innovation and technology integration. Researchand development (“R&D”) expenses rose to nearly $1.7 billion, an increase of 6 percent versus pro forma spending in the prior year, as the Companyinvested in growth projects in its innovation pipeline. Selling, General and Administrative (“SG&A”) expenses fell 5 percent versus 2009 pro forma spending,despite increased spending in Health and Agricultural Sciences to support new product launches and commercial activities related to recent seed acquisitions.
Finally, the Company delivered $4.1 billion of cash from operating activities, nearly double that of 2009, and surpassed its goal to divest $2 billion innon-strategic assets in 2010. Dow ended the year with $7.0 billion of cash and cash equivalents. Throughout the year the Company had sufficient liquidityand financial flexibility to meet all of its financial obligations.
(1) The unaudited pro forma historical information is based on the historical consolidated financial statements and accompanying notes of both Dow and
Rohm and Haas and has been prepared to illustrate the effects of the Company’s acquisition of Rohm and Haas, assuming the acquisition of Rohm andHaas had been consummated on January 1, 2008, and the treatment of Dow’s Calcium Chloride business as discontinued operations due to the sale ofthe business on June 30, 2009.
(2) Excludes sales of the Salt business of Rohm and Haas Company divested on October 1, 2009, sales related to TRN divested on September 1, 2009,sales of the acrylic monomer business and a portion of the specialty latex business divested on January 25, 2010, sales of the Powder Coatings businessdivested on June 1, 2010 and sales of Styron divested on June 17, 2010.
29
(1)
(2)
Table of Contents
Dow focused on the execution of its strategy and delivering on the promise of its new portfolio, as well as investing for growth in businesses tied to fast-growing geographic areas and end-markets. Actions taken during 2010 included:
• Dow completed the sale of Styron to an affiliate of Bain Capital Partners for $1.6 billion. The Company also finalized the sale of its acrylic acidand esters business in Clear Lake, Texas, and its UCAR Emulsion Systems specialty latex business in North America to Arkema. With thecompletion of the sale of Styron, Dow exceeded its goal of divesting $5 billion in non-strategic assets in less than two years. See Note E to theConsolidated Financial Statements for additional information on divestitures.
• Dow successfully completed a two-year, multimillion-dollar project to transform its STYROFOAM™ brand insulation to a more sustainable
manufacturing technology in North America, reducing the greenhouse gas emissions from production at all of its converted facilities in the regionby one half.
• Dow AgroSciences announced the first planting of a SmartStax™ corn hybrid for commercial production. A revolutionary new seed trait
combination, SmartStax™ received the AgProfessional Readers’ Choice 2009 New Product of the Year award.
• Dow Kokam LLC, a joint venture of Dow and Kokam America, broke ground on a world-scale lithium ion battery manufacturing facility in
Michigan. The plant is expected to employ more than 800 people and have the capacity to manufacture 1.2 billion watt-hours of large formataffordable lithium ion batteries.
• Dow Electronic Materials announced a multi-phase plan to expand its trimethylgallium (“TMG”) production capacity to serve the fast-growing
light emitting diode (“LED”) industry. Plans include adding significant TMG capacity at existing U.S. facilities and building a newmanufacturing plant in Cheonan, Korea.
• Dow and BASF received a 2010 Presidential Green Chemistry Challenge Award for jointly developed hydrogen peroxide to propylene oxide
technology. The technology improves the production process of a key chemical intermediate, propylene oxide.
• Dow and Mitsui formed a 50:50 manufacturing joint venture to construct, own and operate a new membrane chlor-alkali facility at Dow’s
manufacturing complex in Freeport, Texas.
• Dow became an official Worldwide Olympic Partner. This top sponsorship extends through 2020 and will allow Dow to showcase its people,
products, scientific excellence and commitment to sustainable solutions on a global stage.
• Dow announced a technology breakthrough project that will increase polyolefin elastomers manufacturing capacity at its production facilities in
Freeport, Texas, and Tarragona, Spain.
• Dow AgroSciences showcased a new refuge-in-the-bag concept. Pending registration by the U.S. Environmental Protection Agency, the concept will
be commercialized as SmartStax™ Refuge Advanced™ and will provide a single-bag solution for refuge reduction in the U.S. Corn Belt as earlyas 2012.
• Dow introduced ENLIGHT™ Polyolefin Encapsulant Films that can enhance efficiencies in photovoltaic module production and lead to lower
conversion costs. Commercial-scale manufacturing of the films began in Findlay, Ohio, in the fourth quarter of the year.
• Dow announced the successful startup of the Solution Linear Low Density Polyethylene II train (“SPE II”) in Thailand. SPE II is owned by Siam
Polyethylene Company Limited, a joint venture of Dow and Siam Cement Group.
• Dow AgroSciences was granted a U.S. patent for crop plants that contain one of Dow AgroSciences’ new class of herbicide tolerant traits.
• DOW™ POWERHOUSE™ solar shingle received Underwriters Laboratories safety certification. The certification is a milestone toward its
planned 2011 commercialization.
30

Table of Contents
• Dow Electronic Materials announced it will construct a new manufacturing facility in Eastern China to meet the growing material demand to serve
printed circuit board, electronic and industrial finishing, and photovoltaic industries in Asia Pacific.
• Dow broke ground on a new manufacturing facility in southern Vietnam for the production of polymers used in the paint, coatings, construction,
packaging, home and personal care industries.
Looking to 2011, Dow expects growth in the emerging geographies to continue, driven by a broad range of leading end-markets. The Company projectsthat these geographic areas will continue their high rate of growth, although year-over-year comparisons will be subdued relative to recent years. Signs ofimprovement in industrial end-markets in North America and Europe, coupled with ongoing strength in higher-growth sectors, such as electronics, agricultureand packaging, give Dow greater optimism that growth will continue in the developed geographies. Despite these more favorable business conditions, theCompany expects lingering challenges to remain, particularly slow employment growth in developed geographies. Consequently, the Company’s plans do notassume an accelerated rebound in business conditions. Dow’s success will continue to be driven by its transformed business portfolio, balanced geographicpresence and investments in innovations aimed at the intersection of greatest societal need and business opportunity.
Dow’s results of operations and financial condition for the year ended December 31, 2010 are described in further detail in the following discussion andanalysis.
ACQUISITION OF ROHM AND HAAS COMPANYOn April 1, 2009, the Company completed the acquisition of Rohm and Haas. Pursuant to the July 10, 2008 Agreement and Plan of Merger (the “MergerAgreement”), Ramses Acquisition Corp., a direct wholly owned subsidiary of the Company, merged with and into Rohm and Haas (the “Merger”), with Rohmand Haas continuing as the surviving corporation becoming a direct wholly owned subsidiary of the Company.
The Company pursued the acquisition of Rohm and Haas to make the Company a leading specialty chemicals and advanced materials company,combining the two organizations’ best-in-class technologies, broad geographic reach and strong industry channels to create a business portfolio withsignificant growth opportunities.
Pursuant to the terms and conditions of the Merger Agreement, each outstanding share of Rohm and Haas common stock was converted into the right toreceive cash of $78 per share, plus additional cash consideration of $0.97 per share. The additional cash consideration represented 8 percent per annum onthe $78 per share consideration from January 10, 2009 to the closing of the Merger, less dividends declared by Rohm and Haas with a dividend record datebetween January 10, 2009 and the closing of the Merger. All options to purchase shares of common stock of Rohm and Haas granted under the Rohm andHaas stock option plans and all other Rohm and Haas equity-based compensation awards, whether vested or unvested as of April 1, 2009, became fullyvested and converted into the right to receive cash of $78.97 per share, less any applicable exercise price. Total cash consideration paid to Rohm and Haasshareholders was $15.7 billion.
The Company achieved its synergy targets related to the acquisition a full quarter ahead of schedule, with realized savings of $1.4 billion includingincreased purchasing power for raw materials; manufacturing and supply chain work process improvements; and the elimination of redundant corporateoverhead for shared services and governance. The integration of Rohm and Haas was substantially complete at December 31, 2010.
On July 31, 2009, the Company entered into a definitive agreement for the sale of certain acrylic monomer and specialty latex assets, as required by theUnited States Federal Trade Commission (“FTC”), for approval of the April 1, 2009 acquisition of Rohm and Haas (see Note E to the Consolidated FinancialStatements). The transaction closed on January 25, 2010.
31

Table of Contents
RESULTS OF OPERATIONSResults of Rohm and Haas are included in the Company’s consolidated results from the April 1, 2009 acquisition forward. In order to provide the mostmeaningful comparison of results of operations, some of the comparisons made in this section are presented on a pro forma basis, reflecting the combinationof Dow and Rohm and Haas assuming the transaction had been consummated on January 1, 2008.
Net sales for 2010 were $53.7 billion, up 20 percent from reported net sales of $44.9 billion in 2009 and up 15 percent from pro forma net sales of$46.6 billion in 2009. Sales increased in 2010 across all segments and geographic areas, with higher prices contributing 13 percent of the improvement andincreased volume adding 2 percent over 2009 pro forma results. The increase in price was largely driven by higher feedstock and energy costs, and was mostpronounced in the combined Basics segments, with Hydrocarbons up 35 percent, Plastics up 24 percent, and Chemicals and Energy up 18 percent. Double-digit price increases were reported in all geographic areas. Volume was mixed across the segments, with significant gains in Electronic and Specialty Materials(up 19 percent) and Health and Agricultural Sciences (up 11 percent) tempered by the impact of recent divestitures, which resulted in declines in Coatings andInfrastructure (down 3 percent) and Plastics (down 8 percent). The Company’s recent divestitures included the Styron business unit (“Styron”) divested onJune 17, 2010; the Powder Coatings business divested on June 1, 2010; a portion of the acrylic monomer business and a portion of the specialty latexbusiness divested on January 25, 2010; the Salt business of Rohm and Haas Company divested on October 1, 2009; and the Company’s ownership interestin Total Raffinaderij Nederland N.V. (“TRN”) divested on September 1, 2009. See Note E to the Consolidated Financial Statements for additional informationconcerning the Company’s divestitures. Excluding these divestitures, volume increased 12 percent compared with 2009 on a pro forma basis, with volumeimprovement in all segments and geographic areas.
On a pro forma basis, net sales for 2009 were down 30 percent from $66.9 billion in 2008. Compared with 2008, prices fell 17 percent, with decreasesin all segments and double-digit declines in all geographic areas. Price declines were most pronounced in the Basics segments, with Hydrocarbons down28 percent, and Plastics and Chemicals and Energy each down 27 percent, driven by significantly lower feedstock and energy costs. Volume decreased13 percent as a result of the continued weakness in the global economy, with declines in all operating segments except Health and Agricultural Sciences, whichreported growth of 4 percent. From a geographic perspective, the volume decrease was most pronounced in North America, down 18 percent from 2008 levels,which were already reduced due to Hurricanes Gustav and Ike which hit the U.S. Gulf Coast, resulting in temporary plant outages.
Sales in the United States accounted for 33 percent of total sales in 2010 and 32 percent of total sales in 2009 and 2008. See the Sales Price and Volumetables at the end of the section titled “Segment Results” for details regarding the change in sales by operating segment and geographic area. In addition, salesand other information by operating segment and geographic area are provided in Note Z to the Consolidated Financial Statements.
Gross margin for 2010 was $7.9 billion, compared with $5.7 billion in 2009 and $5.4 billion in 2008. The improvement in gross margin comparedwith 2009 reflected higher prices, which more than offset a $5.0 billion increase in purchased feedstock and energy costs; increased volume in Electronic andSpecialty Materials, Health and Agricultural Sciences, and other higher margin product lines; and significantly higher operating rates. In 2010, gross marginwas reduced by a $50 million labor-related litigation matter that was included in “Cost of Sales” and reflected in Corporate, and $91 million in assetimpairments and related costs in the Polyurethanes business, the Epoxy business and Dow Automotive Systems. The impairment charges and related costswere included in “Cost of Sales” and reflected in Performance Systems ($9 million) and Performance Products ($82 million).
In 2009, despite a significant drop in sales compared with 2008, gross margin increased as a result of the acquisition of Rohm and Haas, a$10.2 billion decrease in feedstock and energy costs, lower other raw material and freight costs, and the favorable impact of currency on costs. In 2009, Grossmargin was reduced by a one-time increase in cost of sales of $209 million related to the fair value step-up of inventories acquired from Rohm and Haas onApril 1, 2009, and sold in the second quarter of 2009. The increase was included in “Cost of sales” and reflected in the operating segments as follows:$75 million in Electronic and Specialty Materials, $82 million in Coatings and Infrastructure, $30 million in Performance Systems and $22 million inPerformance Products. Gross margin in 2009 was also reduced by hedging losses of $56 million related to the sale of the Company’s 45 percent ownershipinterest in TRN (see Note E to the Consolidated Financial Statements), reflected in the Hydrocarbons segment.
32

Table of Contents
Gross margin in 2008 was negatively impacted by Hurricanes Gustav and Ike, which hit the U.S. Gulf Coast, causing temporary outages for several ofthe Company’s Gulf Coast production facilities and resulting in $181 million in additional manufacturing expenses, including the repair of property damage,clean-up costs, unabsorbed fixed costs and inventory write-offs. The expenses were included in “Cost of sales” and reflected in the operating segments asfollows: $2 million in Electronic and Specialty Materials, $2 million in Health and Agricultural Sciences, $6 million in Performance Systems, $59 millionin Performance Products, $16 million in Plastics, $44 million in Chemicals and Energy, and $43 million in Hydrocarbons, with the remaining $9 million inCorporate. In addition, gross margin in 2008 was reduced by legal expenses and other costs of $69 million related to the K-Dow transaction; these costs wereexpensed (to “Cost of sales”) upon Petrochemical Industries Company (K.S.C.) of Kuwait’s refusal to close the K-Dow transaction (reflected in Corporate).
Dow’s global plant operating rate was 83 percent of capacity in 2010, compared with 74 percent in 2009 and 77 percent in 2008. Operating ratesimproved in 2010, with both increased demand and actions taken by management to rationalize capacity through shutdowns and divestitures contributing tothe improvement. In 2009, operating rates were down from 2008, reflecting the downturn in the global economy. In 2008, operating rates were impacted bylower demand resulting from the slowing global economy, especially in the second half of the year, as well as by Hurricanes Gustav and Ike which hit theU.S. Gulf Coast in the third quarter of 2008. Depreciation expense was $2,289 million in 2010, $2,291 million in 2009 and $2,016 million in 2008.
Personnel count was 49,505 at December 31, 2010, down from 52,195 at December 31, 2009. Headcount decreased from year-end 2009 primarily dueto divestitures, including Styron, the Powder Coatings business and a portion of the Company’s acrylic monomer and specialty latex businesses, as well asrestructuring activities associated with the integration of Rohm and Haas and previously announced restructuring plans. Personnel count at December 31,2009 was up from 46,102 at December 31, 2008, primarily due to the acquisition of Rohm and Haas, offset by declines related to restructuring activities,business divestitures and personnel transfers to a joint venture.
Research and development (“R&D”) expenses were $1,660 million in 2010, compared with $1,492 million in 2009 and $1,310 million in 2008. Theincrease in R&D expenses in 2010 reflected the Company’s planned spending on strategic corporate growth initiatives and continued investments in the Healthand Agricultural Sciences segment, partially offset by the elimination of R&D expenses related to the divestiture of Styron. In 2009, R&D expenses increasedcompared with 2008, due to the acquisition of Rohm and Haas and planned growth initiatives in the Health and Agricultural Sciences segment, partially offsetby cost savings in other segments.
Selling, general and administrative (“SG&A”) expenses were $2,609 million in 2010, compared with $2,487 million in 2009 and $1,966 million in2008. SG&A expenses increased 5 percent from 2009, as selling expenses for all segments increased commensurate with higher sales and the full-year impactof the Rohm and Haas acquisition in 2010. In 2009, SG&A expenses increased compared with 2008, primarily due to the acquisition of Rohm and Haas,partially offset by cost savings initiatives.
33

Table of Contents
The following table illustrates the relative size of the primary components of total production costs and operating expenses of Dow. More informationabout each of these components can be found in other sections of Management’s Discussion and Analysis of Financial Condition and Results of Operations,Notes to the Consolidated Financial Statements, and Part II, Item 6. Selected Financial Data. Production Costs and Operating Expenses Cost components as a percent of total 2010 2009 2008 Hydrocarbon feedstocks and energy 41% 35% 48% Salaries, wages and employee benefits 14 15 10 Maintenance 4 3 3 Depreciation 5 5 4 Restructuring charges - 2 1 Supplies, services and other raw materials 36 40 34 Total 100% 100% 100%
Amortization of intangibles was $509 million in 2010, $399 million in 2009 and $92 million in 2008. The increase in amortization of intangibles in2010 reflected the full-year impact of the amortization of intangible assets acquired from Rohm and Haas. Amortization of intangibles in 2009 increased from2008 due to amortization of the fair value of intangible assets acquired from Rohm and Haas from the April 1, 2009 acquisition date forward. See Notes D andI to the Consolidated Financial Statements for additional information regarding the acquisition of Rohm and Haas and goodwill and other intangible assets.
The Company performs annual goodwill impairment tests during the fourth quarter of the year. During the fourth quarter of 2010, no impairmentindicators related to the carrying value of goodwill were identified. During the fourth quarter of 2009, it was determined that goodwill associated with the DowHaltermann business unit was impaired. The impairment was based on a review performed by management in which discounted cash flows did not supportthe carrying value of the goodwill. As a result, the Company recorded a goodwill impairment loss of $7 million, impacting the Performance Products segment.During the fourth quarter of 2008, it was determined that goodwill associated with the Dow Automotive Systems and Polypropylene reporting units wasimpaired. The impairment was based on a review performed by management in which discounted cash flows did not support the carrying value of thegoodwill. The Company recorded charges totaling $239 million for goodwill impairment losses, including $209 million for the Dow Automotive Systemsreporting unit (impacting the Performance Systems segment) and $30 million for the Polypropylene reporting unit (impacting the Plastics segment). See Note Ito the Consolidated Financial Statements for additional information regarding goodwill.
During 2010, the Company recorded adjustments of $29 million to the 2009 restructuring charge for additional asset impairments, exit and disposalactivities, and severance; and adjustments of $3 million to the 2008 restructuring charge to reduce the severance reserve. The adjustments were reflected inElectronic and Specialty Materials ($8 million charge), Coatings and Infrastructure ($5 million charge), Performance Products ($15 million charge) andCorporate ($2 million credit).
34

Table of Contents
In June 2009, Dow’s Board of Directors approved a restructuring plan that incorporated actions related to the Company’s acquisition of Rohm and Haasas well as additional actions to advance the Company’s strategy and to respond to continued weakness in the global economy. The restructuring plan includedthe shutdown of a number of facilities and a global workforce reduction. As a result, the Company recorded restructuring charges totaling $677 million in thesecond quarter of 2009, which included asset write-downs and write-offs of $454 million, severance costs of $155 million and costs associated with exit ordisposal activities of $68 million. The impact of the charges was shown as “Restructuring charges” in the consolidated statements of income and was reflectedin the Company’s segment results as follows: $68 million in Electronic and Specialty Materials, $171 million in Coatings and Infrastructure, $73 million inPerformance Products, $1 million in Plastics, $75 million in Chemicals and Energy and $65 million in Hydrocarbons, with the remaining $224 million inCorporate.
During 2009, the Company recorded the following adjustments to its restructuring plans: in the first quarter of 2009, the Company recorded additionalseverance of $19 million related to 2008 restructuring activities, reflected in Corporate; in the second quarter of 2009, the Company recorded a $15 millionreduction in the 2007 restructuring reserve, reflected in the Health and Agricultural Sciences segment; and in the fourth quarter of 2009, the Company recordeda $5 million reduction to the 2007 restructuring reserve and $13 million in additional charges related to the 2009 restructuring activities, both reflected inCorporate.
On December 5, 2008, the Company’s Board of Directors approved a restructuring plan as part of a series of actions to advance the Company’sstrategy and respond to the severe economic downturn that began in the latter part of 2008. The restructuring plan included the shutdown of a number offacilities and a global workforce reduction, which were substantially complete by the end of 2010. As a result of the shutdowns and global workforcereduction, the Company recorded restructuring charges of $785 million in the fourth quarter of 2008. The charges consisted of asset write-downs and write-offs of $336 million, costs associated with exit or disposal activities of $128 million and severance costs of $321 million. The impact of the charges is shownas “Restructuring charges” in the consolidated statements of income and was reflected in the Company’s segment results as follows: $10 million in Electronicand Specialty Materials, $16 million in Coatings and Infrastructure, $68 million in Performance Systems, $39 million in Performance Products,$98 million in Plastics, $106 million in Chemicals and Energy and $18 million in Hydrocarbons, with the remaining $430 million in Corporate. In additionto the charges related to the 2008 restructuring plan, in the fourth quarter of 2008, the Company recorded additional adjustments of $54 million related to the2007 and 2006 restructuring plans, primarily impacting the Plastics segment.
See Note C to the Consolidated Financial Statements for details on the restructuring charges.
During 2009, a charge of $7 million was recorded for purchased in-process research and development (“IPR&D”) related to the purchase of lithium ionbattery technology by the Ventures business, impacting Corporate. During 2008, charges totaling $44 million were recorded for purchased IPR&D related toacquisitions within the Health and Agricultural Sciences segment. See Note D to the Consolidated Financial Statements for information regarding these charges.
Charges totaling $143 million in 2010, $166 million in 2009 and $49 million in 2008 were recorded for integration costs, legal expenses and othertransaction costs related to the acquisition of Rohm and Haas; these charges were reflected in Corporate. In 2009, the Company also recorded $60 million inacquisition-related retention costs. These costs were recorded in “Cost of sales,” “Research and development expenses,” and “Selling, general andadministrative expenses” in the consolidated statements of income and reflected in Corporate. The integration of Rohm and Haas was substantially complete atDecember 31, 2010.
Following the completion of a study to review Union Carbide’s asbestos claim and resolution activity in December of 2010, Union Carbide decreased itsasbestos-related liability for pending and future claims (excluding future defense and processing costs) by $54 million in the fourth quarter of 2010. Similarly,following completion of a study to review Union Carbide’s asbestos claim and resolution activity in December of 2008, Union Carbide decreased its asbestos-related liability for pending and future claims (excluding future defense and processing costs) by $54 million in the fourth quarter of 2008. The reductionswere shown as “Asbestos-related credits” in the consolidated statements of income and were reflected in Corporate. See “Asbestos-Related Matters of UnionCarbide Corporation” in Other Matters for additional information.
35

Table of Contents
Dow’s share of the earnings of nonconsolidated affiliates in 2010 was $1,112 million, compared with $630 million in 2009 and $787 million in 2008.In 2010, increased earnings at Dow Corning Corporation (“Dow Corning”), EQUATE Petrochemical Company K.S.C. (“EQUATE”), MEGlobal, TheKuwait Olefins Company K.S.C. and The Kuwait Styrene Company K.S.C. more than offset a decline in earnings resulting from the September 2009divestitures of the Company’s ownership interests in TRN and the OPTIMAL Group of Companies (“OPTIMAL”), and the June 2010 divestiture of theCompany’s ownership interest in Americas Styrenics LLC. See Note E to the Consolidated Financial Statements for additional information concerning theCompany’s recent divestitures. In 2009, equity earnings declined compared with 2008, reflecting the overall decrease in global demand and poor economicconditions, with EQUATE, Dow Corning and OPTIMAL reporting the largest declines. Improved results were reported by The Kuwait Olefins CompanyK.S.C. in 2009 following the successful startup of additional production capacity for ethylene oxide/ethylene glycol and increased production of ethylene insupport of additional polyethylene capacity. Equity earnings for 2009 were negatively impacted by a $65 million impairment charge related to Equipolymersand the Company’s $29 million share of a restructuring charge related to Dow Corning. See Note H to the Consolidated Financial Statements for additionalinformation on nonconsolidated affiliates.
Sundry income - net includes a variety of income and expense items such as the gain or loss on foreign currency exchange, dividends from investments,and gains and losses on sales of investments and assets. Sundry income - net for 2010 was $125 million, compared with $891 million in 2009 and$89 million in 2008. In 2010, sundry income - net included a net $27 million gain on the Styron divestiture, reflected in the following operating segments:Performance Systems ($7 million), Performance Products ($13 million) and Plastics ($7 million). In addition to the net gain on the Styron divestiture, Sundryincome - net for 2010 included net gains on several other divestitures, partially offset by a loss of $46 million related to the early extinguishment of debt and acharge of $47 million for an obligation related to a past divestiture (both reflected in Corporate). Sundry income - net in 2009 included a gain of $513 millionon the sale of the Company’s ownership interest in TRN and related inventory on September 1, 2009 and a gain of $339 million on the sale of the Company’sownership interest in OPTIMAL on September 30, 2009. Sundry income - net in 2009 was reduced by a loss of $56 million related to the Company’s earlyextinguishment of debt in the third quarter of 2009. In 2008, sundry income - net reflected net gains on several small divestitures and asset sales, partiallyoffset by unfavorable foreign exchange hedging results. See Note E to the Consolidated Financial Statements for additional information concerning theCompany’s recent divestitures. See “Liquidity and Capital Resources” for additional information on the Company’s early extinguishment of debt.
Net interest expense (interest expense less capitalized interest and interest income) was $1,436 million in 2010, down from $1,532 million in 2009,reflecting lower debt financing costs during the year. In 2009, net interest expense increased compared with net interest expense of $562 million in 2008, due todebt financing activity for the April 1, 2009 acquisition of Rohm and Haas. Interest expense (net of capitalized interest) and amortization of debt discounttotaled $1,473 million in 2010, $1,571 million in 2009 and $648 million in 2008. See “Liquidity and Capital Resources” for additional informationregarding debt financing activity. Interest income was $37 million in 2010, down from $39 million in 2009 and $86 million in 2008. Interest rates oninvestments in 2010 were consistent with those of 2009, following a decline from 2008 rates, resulting in lower interest income in 2010 and 2009 comparedwith 2008.
36

Table of Contents
The provision for income taxes was $481 million, compared with a credit of $97 million in 2009 and a provision of $651 million in 2008. TheCompany’s effective tax rate fluctuates based on, among other factors, where income is earned and the level of income relative to tax credits available. Forexample, as the percentage of foreign sourced income increases, the Company’s effective tax rate declines. The Company’s tax rate is also influenced by thelevel of equity earnings, since most of the earnings from the Company’s equity company investments are taxed at the joint venture level.
The tax rate for 2010 was positively impacted by a high level of equity earnings as a percentage of total earnings, the release of a tax valuation allowance,a tax law change, and improved financial results in jurisdictions with tax rates that are lower than the U.S. statutory rate. These factors resulted in an effectivetax rate of 17.2 percent for 2010.
In 2009, the effective tax rate was negative 20.7 percent, and was reduced by several factors: a significantly higher level of equity earnings as a percentof total earnings, favorable accrual-to-return adjustments in various geographies, the recognition of domestic losses and an improvement in financial results injurisdictions with tax rates that are lower than the U.S. statutory rate. In 2008, the effective tax rate was 51.0 percent, reflecting the negative impact of goodwillimpairment losses that were not deductible for tax purposes.
On June 30, 2009, the Company sold the Calcium Chloride business and recognized a $162 million pretax gain. The results of operations related to theCalcium Chloride business have been reclassified and reported as income from discontinued operations for all periods presented. Income from discontinuedoperations (net of income taxes) was $110 million ($0.10 per share) in 2009, compared with $28 million ($0.03 per share) in 2008.
Net income attributable to noncontrolling interests was $11 million in 2010, $28 million in 2009 and $75 million in 2008. Net income attributable tononcontrolling interests declined in 2010 compared with 2009 as a result of the July 2009 redemption of the Tornado Finance V.O.F. preferred partnershipunits. Net income attributable to noncontrolling interests declined in 2009 compared with 2008 as a result of the third quarter of 2008 redemption by theoutside partner of its ownership interest in Hobbes Capital S.A. See Note U to the Consolidated Financial Statements for additional information concerningthese noncontrolling interests.
Preferred stock dividends of $340 million were recognized in 2010, compared with preferred stock dividends of $312 million in 2009. Dividends relatedto the Company’s Cumulative Convertible Perpetual Preferred Stock, Series A were $340 million in 2010 and $255 million in 2009. The remaining$57 million of dividends in 2009 related to the Cumulative Perpetual Preferred Stock, Series B and Cumulative Convertible Perpetual Preferred Stock,Series C, both of which were retired in the second quarter of 2009. See Notes W and X to the Consolidated Financial Statements for additional information.
Net income available for common stockholders was $1,970 million ($1.72 per share) in 2010, compared with $336 million ($0.32 per share) in 2009and $579 million ($0.62 per share) in 2008.
37

Table of Contents
The following table summarizes the impact of certain items recorded in 2010, 2009 and 2008: Certain Items Impacting Results
PretaxImpact (1)
Impact onNet Income (2)
Impact onEPS (3)
In millions, except per share amounts 2010 2009 2008 2010 2009 2008 2010 2009 2008 Cost of sales:
One-time increase in cost of sales related to fair valuation ofRohm and Haas inventories - $ (209) - - $ (132) - - $ (0.13) -
Impact of Hurricanes Gustav and Ike - - $ (181) - - $ (115) - - $ (0.12) K-Dow related expenses - - (69) - - (44) - - (0.05) Labor-related litigation matter $ (50) - - $ (33) - - $ (0.03) - - Asset impairments and related costs (91) - - (72) - - (0.06) - -
Goodwill impairment losses - (7) (239) - (7) (230) - (0.01) (0.25) Restructuring charges (26) (689) (839) (14) (466) (628) (0.02) (0.45) (0.68) Purchased in-process research and development charges - (7) (44) - (5) (44) - (0.01) (0.05) Transaction, integration and other acquisition costs (143) (226) (49) (93) (170) (43) (0.08) (0.16) (0.05) Asbestos-related credits 54 - 54 34 - 34 0.03 - 0.04 Equity in earnings of nonconsolidated affiliates:
Dow Corning restructuring - (29) - - (27) - - (0.03) - Equipolymers impairment - (65) - - (65) - - (0.06) -
Sundry income - net: Net gain on sale of TRN (4) - 457 - - 321 - - 0.29 - Gain on sale of OPTIMAL - 339 - - 198 - - 0.18 - Gain (Loss) on divestiture of Styron 27 - - (56) - - (0.04) - - Obligation related to past divestiture (47) - - (30) - - (0.03) - - Loss on early extinguishment of debt (46) (56) - (29) (36) - (0.02) (0.03) -
Total $(322) $ (492) $(1,367) $(293) $ (389) $(1,070) $(0.25) $ (0.41) $(1.16)
(1) Impact on “Income from Continuing Operations Before Income Taxes.”(2) Impact on “Net Income from Continuing Operations.”(3) Impact on “Net income from continuing operations available for common stockholders - Earnings per common share – diluted.”(4) Consists of a $513 million gain in “Sundry income – net” and hedging losses of $56 million in “Cost of sales.”
38

Table of Contents
SEGMENT RESULTSIn the fourth quarter of 2010, the Company made the following changes to its operating segments to reflect changes in the Company’s organization.
• Segment name changed from Basic Plastics to Plastics • Segment name changed from Basic Chemicals to Chemicals and Energy • Segment name changed from Hydrocarbons and Energy to Hydrocarbons • Energy moved from Hydrocarbons to Chemicals and Energy • Construction-related cellulosics moved from Electronic and Specialty Materials to Coatings and Infrastructure • Transportation adhesives moved from Coatings and Infrastructure to Performance Systems • Certain new business development initiatives moved from Performance Products to Coatings and Infrastructure
The reporting changes are reflected in this section for all periods presented.
The reported results by operating segment can be found in Note Z to the Consolidated Financial Statements. The Company uses EBITDA (which Dowdefines as earnings before interest, income taxes, depreciation and amortization) as its measure of profit/loss for segment reporting purposes. EBITDA byoperating segment includes all operating items relating to the businesses, except depreciation and amortization; items that principally apply to the Company asa whole are assigned to Corporate. Note Z also includes a reconciliation of EBITDA to “Income from Continuing Operations Before Income Taxes.”
In order to provide the most meaningful comparison of results by operating segment, the following discussion and analysis compares actual results for2010 to actual results for the last nine months of 2009 plus pro forma historical results for the first quarter of 2009 and pro forma historical results for 2008.The unaudited pro forma historical segment information is based on the historical consolidated financial statements and accompanying notes of both Dow andRohm and Haas and was prepared to illustrate the effects of the Company’s acquisition of Rohm and Haas, assuming the acquisition of Rohm and Haas hadbeen consummated on January 1, 2008. In addition, the unaudited pro forma historical segment information reflects the impact of increased depreciation andamortization expense resulting from the fair valuation of assets acquired from Rohm and Haas assuming that the transaction had been consummated onJanuary 1, 2008.
The unaudited pro forma historical segment information, prepared following the April 1, 2009 acquisition of Rohm and Haas, is not necessarilyindicative of the results of operations that would have actually occurred had the acquisition been completed as of the date indicated, nor is it indicative of thefuture operating results of the combined company. The unaudited pro forma historical segment information does not reflect future events that may occur afterthe acquisition of Rohm and Haas, including the potential realization of operating cost savings (synergies) or restructuring activities or other costs related to theplanned integration of Rohm and Haas, and does not consider potential impacts of current market conditions on revenues, expense efficiencies or assetdispositions (with the exception of the sale of Dow’s Calcium Chloride business).
The following table, which summarizes the pretax impact of certain items recorded by Rohm and Haas prior to the acquisition, is provided for proforma comparison purposes. Certain Items Impacting Rohm and Haas Results In millions
Three monthsended
March 31, 2009
Year endedDec. 31, 2008
Impact of Hurricanes Gustav and Ike $ (2) $ (29) Restructuring charges (2) (199) Transaction and other acquisition costs (80) (54) Gain on sale of 40 percent equity investment in UP Chemical
Company - 87 Total Rohm and Haas Certain Items $(84) $(195)
In addition, due to the completion of several divestitures (see Note E to the Consolidated Financial Statements), the change in sales volume from 2009excluding divestitures is also provided by operating segment, where applicable.
39
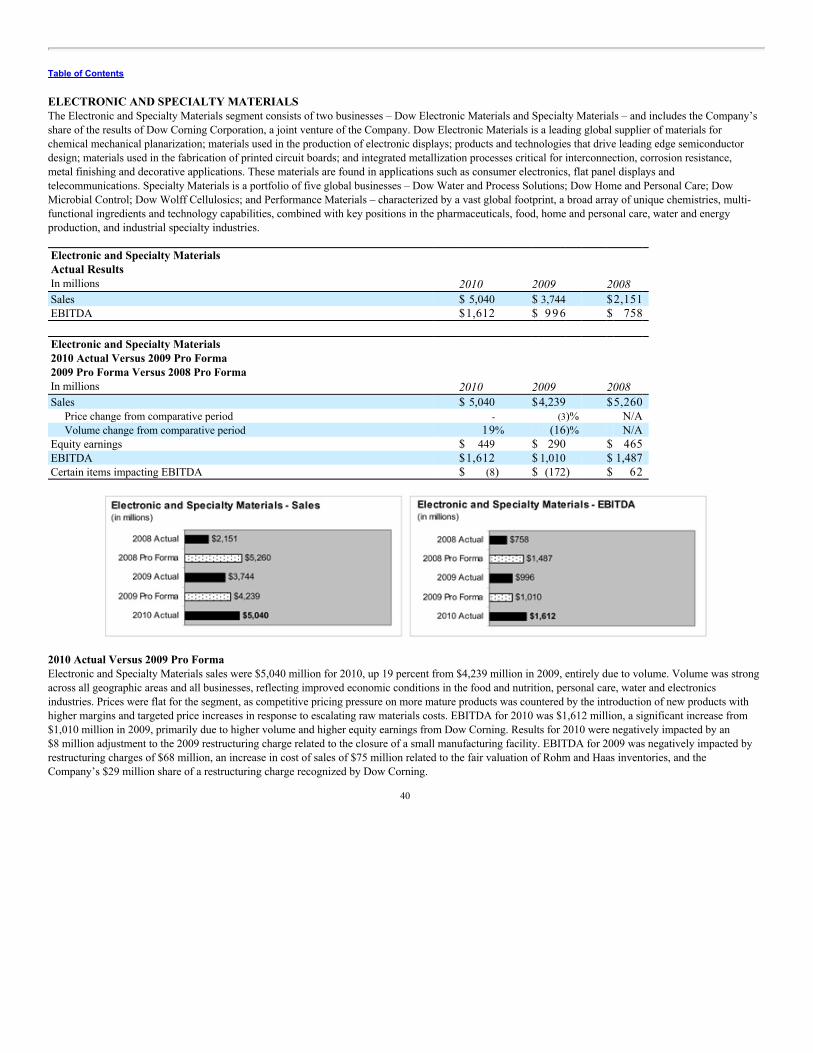
Table of Contents
ELECTRONIC AND SPECIALTY MATERIALSThe Electronic and Specialty Materials segment consists of two businesses – Dow Electronic Materials and Specialty Materials – and includes the Company’sshare of the results of Dow Corning Corporation, a joint venture of the Company. Dow Electronic Materials is a leading global supplier of materials forchemical mechanical planarization; materials used in the production of electronic displays; products and technologies that drive leading edge semiconductordesign; materials used in the fabrication of printed circuit boards; and integrated metallization processes critical for interconnection, corrosion resistance,metal finishing and decorative applications. These materials are found in applications such as consumer electronics, flat panel displays andtelecommunications. Specialty Materials is a portfolio of five global businesses – Dow Water and Process Solutions; Dow Home and Personal Care; DowMicrobial Control; Dow Wolff Cellulosics; and Performance Materials – characterized by a vast global footprint, a broad array of unique chemistries, multi-functional ingredients and technology capabilities, combined with key positions in the pharmaceuticals, food, home and personal care, water and energyproduction, and industrial specialty industries. Electronic and Specialty Materials Actual Results In millions 2010 2009 2008 Sales $ 5,040 $ 3,744 $2,151 EBITDA $1,612 $ 9 9 6 $ 758
Electronic and Specialty Materials 2010 Actual Versus 2009 Pro Forma 2009 Pro Forma Versus 2008 Pro Forma In millions 2010 2009 2008 Sales $ 5,040 $4,239 $5,260
Price change from comparative period - (3)% N/A Volume change from comparative period 19% (16)% N/A
Equity earnings $ 449 $ 290 $ 465 EBITDA $1,612 $ 1,010 $ 1,487 Certain items impacting EBITDA $ (8) $ (172) $ 62
2010 Actual Versus 2009 Pro FormaElectronic and Specialty Materials sales were $5,040 million for 2010, up 19 percent from $4,239 million in 2009, entirely due to volume. Volume was strongacross all geographic areas and all businesses, reflecting improved economic conditions in the food and nutrition, personal care, water and electronicsindustries. Prices were flat for the segment, as competitive pricing pressure on more mature products was countered by the introduction of new products withhigher margins and targeted price increases in response to escalating raw materials costs. EBITDA for 2010 was $1,612 million, a significant increase from$1,010 million in 2009, primarily due to higher volume and higher equity earnings from Dow Corning. Results for 2010 were negatively impacted by an$8 million adjustment to the 2009 restructuring charge related to the closure of a small manufacturing facility. EBITDA for 2009 was negatively impacted byrestructuring charges of $68 million, an increase in cost of sales of $75 million related to the fair valuation of Rohm and Haas inventories, and theCompany’s $29 million share of a restructuring charge recognized by Dow Corning.
40

Table of Contents
Dow Electronic Materials sales in 2010 were up 29 percent from 2009, driven by higher volume, especially in Asia Pacific, primarily due to strongunderlying demand in the electronics industry and new product introductions. Semiconductor foundry utilization rates across the industry improvedsignificantly compared with 2009 and were running in excess of 90 percent throughout most of 2010, supporting higher demand for chemical mechanicalplanarization pads and materials used in printed circuit boards. Demand for liquid crystal display (“LCD”) chemicals and film materials that replace glassused in plasma display panels also increased. New product launches and strategic customer wins helped drive a 39 percent volume growth for Dow ElectronicMaterials in Asia Pacific.
Specialty Materials sales in 2010 were up 13 percent from 2009, as volume improved 14 percent and prices decreased 1 percent due to currency. Volumeincreased in all geographic areas, with particular strength in Asia Pacific, and in all businesses. Dow Water and Process Solutions sales were higher driven bysolid demand for ion exchange resins and reverse osmosis membranes. Demand for specialty biocides and cellulosics used in food and nutrition also improvedsignificantly compared with 2009.
2009 Versus 2008 (Pro Forma Comparison)Electronic and Specialty Materials sales were $4,239 million for 2009, down 19 percent from $5,260 million in 2008, as volume dropped 16 percent andprices declined 3 percent. The decrease in volume was broad-based with declines in all geographic areas and in all businesses due to the global downturn in theelectronics and construction industries. EBITDA for 2009 was $1,010 million, compared with $1,487 million for 2008. Despite the impact of lower SG&Aexpenses and lower raw material costs during 2009, EBITDA declined as a result of lower volume, a decrease in equity earnings from Dow Corning, whichincluded the Company’s $29 million share of a restructuring charge, restructuring charges of $68 million (see Note C to the Consolidated FinancialStatements), and an increase in cost of sales of $75 million related to the fair valuation of Rohm and Haas inventories. EBITDA for 2008 included a gain onthe sale of Rohm and Haas’ investment in UP Chemical Company of $87 million, restructuring charges of $22 million and hurricane-related costs of$3 million.
Electronic Materials sales for 2009 were down 23 percent versus 2008, driven by a 22 percent decrease in volume and a 1 percent decline in prices.Volume declined in all geographic areas reflecting the global economic downturn. Asia Pacific, however, reported signs of recovery in the second half of 2009due to a rebound in electronics demand and re-stocking within the value chain.
Specialty Materials sales for 2009 were down 17 percent versus 2008 with volume down 12 percent and prices down 5 percent. Volume declined acrossall major businesses and geographic areas. Volume declines in ion exchange resins and reverse osmosis membranes, particularly for large industrial waterprojects, were principally due to lower infrastructure spending and cautious capital spending by customers. Volume declines in cellulosics were driven byweaker construction industry conditions. Prices declined in all geographic areas, especially in North America and EMEA.
Electronic and Specialty Materials Outlook for 2011Electronic and Specialty Materials sales are expected to increase in 2011, driven by continued demand in the electronics, water and health care industries,especially in emerging geographies.
Electronic Materials sales volume is expected to increase, driven by higher demand across electronics end-markets especially in mobile phones, LCDtelevisions and tablet devices. Industry semiconductor foundry utilization rates are expected to remain near current levels in 2011. In the fourth quarter of2010, Dow Electronic Materials broke ground on two new manufacturing facilities in Asia Pacific. The construction of the new metalorganic precursormanufacturing plant in Cheonan, Korea is part of a multi-phase plan announced in June 2010 to expand trimethylgallium production capacity to meet thesurging demand for the material in LED and related electronics applications. The facility is expected to be operational in early 2011. A new Eastern Chinamanufacturing facility at the Company’s Zhangjiagang site will meet growing demand for materials for printed circuit boards, electronic and industrialfinishing and photovoltaics in Asia. Start-up is planned for late 2011.
Specialty Materials sales are also expected to increase, especially in emerging geographies, due to higher demand for specialty biocides used in personalcare and cosmetics applications. Higher demand for cellulosics used in food and nutrition is also expected. Dow Water and Process Solutions sales are expectedto increase, driven by higher demand for ion exchange resins and reverse osmosis membranes used in large industrial water desalination projects. Severalinnovation projects across the business are anticipated to drive higher sales.
41

Table of Contents
COATINGS AND INFRASTRUCTUREThe Coatings and Infrastructure segment consists of the following businesses: Dow Adhesives and Functional Polymers; Dow Building and Construction;and Dow Coating Materials. These businesses produce a wide variety of products with a broad range of applications – sticking and bonding solutions,construction materials (insulation and vinyl applications) and raw materials for architectural paints and industrial coatings. Coatings and Infrastructure Actual Results In millions 2010 2009 2008 Sales $5,365 $4,551 $3,234 EBITDA $743 $414 $212 Coatings and Infrastructure 2010 Actual Versus 2009 Pro Forma 2009 Pro Forma Versus 2008 Pro Forma In millions 2010 2009 2008 Sales $5,365 $5,173 $6,723
Price change from comparative period 7% (7)% N/A Volume change from comparative period (3)% (16)% N/A Volume change, excluding divestitures 4% N/A N/A
Equity earnings $2 $3 $2 EBITDA $743 $518 $731 Certain items impacting EBITDA $(5) $(254) $(39)
2010 Actual Versus 2009 Pro FormaCoatings and Infrastructure sales were $5,365 million for 2010, up 4 percent from $5,173 million in 2009. Compared with 2009, price was up 7 percent,while volume declined 3 percent. Price improved across all geographic areas and most businesses, driven by higher raw material costs. The price improvementwas most pronounced in Dow Coating Materials, where raw material supply constraints led to a favorable pricing environment during 2010. Volume declinedas a result of recent divestitures within the segment. Excluding the impact of the FTC required divestiture of certain specialty latex assets and the divestiture ofthe Powder Coatings business, volume increased 4 percent compared with 2009. The increase in volume was primarily driven by higher demand forinsulation products and adhesives used in packaging and leather applications.
EBITDA for 2010 was $743 million, compared with $518 million for 2009. Results for 2010 were negatively impacted by $5 million in restructuringcharges related to the divestiture of the specialty latex assets. EBITDA for 2009 was reduced by $172 million of restructuring charges primarily related to theCompany’s actions to optimize facilities following the acquisition of Rohm and Haas and an increase in cost of sales of $82 million related to the fairvaluation of Rohm and Haas inventories. Compared with 2009, the benefit of higher prices, improved operating rates and lower SG&A expenses was offset bysignificantly higher raw material costs. See Notes C and D to the Consolidated Financial Statements for additional information on restructuring charges andthe acquisition of Rohm and Haas.
42

Table of Contents
2009 Versus 2008 (Pro Forma Comparison)Coatings and Infrastructure sales were $5,173 million for 2009, down 23 percent from $6,723 million in 2008, as volume dropped 16 percent and prices fell7 percent. The decrease in price and volume was due to weak demand for architectural and industrial coatings and other materials used in residential andcommercial construction, and lower demand for packaging, adhesive tapes and paper labels. Demand for coatings and construction materials was downsignificantly due to the downturn in the housing industry, particularly in North America and EMEA.
EBITDA for 2009 was $518 million compared with $731 million for 2008. EBITDA for 2009 was reduced by $172 million of restructuring chargesand by an $82 million increase in cost of sales related to the fair valuation of Rohm and Haas inventories. As a result of these charges and the decrease insales, EBITDA declined in 2009 despite lower raw material and freight costs and lower SG&A expenses. EBITDA for 2008 included $39 million ofrestructuring charges.
Coatings and Infrastructure Outlook for 2011Coatings and Infrastructure sales are expected to increase in 2011, driven by the gradual recovery of new residential construction in the United States andcontinued growth in insulation products due to more stringent energy codes. Innovation projects, like POWERHOUSE solar shingles, are expected tocommercially launch in the second half of 2011. Dow Coating Materials sales are also expected to increase, especially in emerging geographies, driven byhigher demand for architectural coatings. Demand for industrial coatings is expected to remain flat. Price increases are expected across most businesses inresponse to projected higher raw material costs in 2011.
HEALTH AND AGRICULTURAL SCIENCESDow AgroSciences is a global leader in providing agricultural and plant biotechnology products, pest management solutions and healthy oils. The businessinvents, develops, manufactures and markets products for use in agriculture, industrial and commercial pest management, and food service. Health and Agricultural Sciences Actual Results In millions 2010 2009 2008 Sales $4,869 $4,522 $4,535 EBITDA $640 $573 $872
Health and Agricultural Sciences 2010 Actual Versus 2009 Pro Forma 2009 Pro Forma Versus 2008 Pro Forma In millions 2010 2009 2008 Sales $4,869 $4,537 $4,609
Price change from comparative period (4)% (6)% N/A Volume change from comparative period 11% 4% N/A
Equity earnings $2 $2 $4 EBITDA $640 $577 $892 Certain items impacting EBITDA - $15 $(49)
43
TM
Table of Contents
2010 Actual Versus 2009 Pro FormaHealth and Agricultural sales were a record $4,869 million in 2010, up from $4,537 million in 2009. Sales increased 7 percent, with volume up 11 percentand price down 4 percent. With the launch of SmartStax technology, growth in the corn, soybean and cotton portfolios, and new seed acquisitions, theSeeds, Traits and Oils business reported a 25 percent increase in volume. New agricultural chemicals products also posted strong volume growth, increasing34 percent as pyroxsulam cereal herbicide sales doubled, and penoxsulam rice herbicide, aminopyralid range and pasture herbicide and spinetoram insecticiderecorded double-digit growth. The price decline when compared with the same period last year was the result of continued generic competition on commodityagricultural chemicals. AgroFresh reported modest volume growth in all geographic areas in 2010.
EBITDA for 2010 was $640 million, compared with $577 million in 2009. EBITDA increased as sales volume gains in the Seeds, Traits and Oilsbusiness, new product growth, and continued portfolio management more than offset lower pricing on commodity agricultural chemicals and increasedinvestment in R&D and SG&A to support growth initiatives. Results for 2009 were favorably impacted by a $15 million reduction in the 2007 restructuringreserve, originally related to pre-acquisition contract termination fees between the Company and Rohm and Haas. See Note C to the Consolidated FinancialStatements for information on restructuring charges.
2009 Versus 2008 (Pro Forma Comparison)Health and Agricultural sales were $4,537 million in 2009, down from $4,609 million in 2008. Sales decreased 2 percent as prices declined 6 percent (halfdue to currency), while volume increased 4 percent. Reduced farm income and tighter credit markets in many regions created significant downward pricingpressure during 2009. Prices declined as farm income was negatively impacted by falling crop commodity prices combined with the relatively higher costs ofpurchases made earlier in the year. The commodity product glyphosate accounted for the vast majority of the overall decline in prices compared with 2008.Volume increased as new seed acquisitions and growth in the corn, soybean and sunflower portfolios resulted in 33 percent sales growth in the Seeds, Traitsand Oils business. Volume for new agricultural chemicals products also increased as pyroxsulam sales more than tripled and penoxsulam and spinetoram hadcontinued strong growth. AgroFresh posted record sales volume growth compared with 2008 as SMARTFRESH technology for maintaining the just-harvested quality and freshness of fruits and vegetables continued to receive excellent channel support in all geographic areas.
EBITDA for 2009 was $577 million, compared with $892 million in 2008. EBITDA was negatively impacted by higher costs associated with thevaluation of inventory based on reduced raw material prices, unfavorable currency exchange rates, glyphosate price declines, and increased R&D and SG&Aexpenses to support growth initiatives. Results for 2009 were favorably impacted by a $15 million reduction in the 2007 restructuring reserve, originallyrelated to pre-acquisition contract termination fees between the Company and Rohm and Haas. EBITDA for 2008 was negatively impacted by charges of$44 million for IPR&D related to seed acquisitions, $3 million in restructuring charges and $2 million related to the 2008 hurricanes.
Health and Agricultural Sciences Outlook for 2011Health and Agricultural Sciences sales for 2011 are expected to grow above the levels achieved in 2010. Volume is anticipated to increase in key regions as theagricultural industry benefits from strong global demand for agricultural products. SmartStax technology, which is already considered an industry leadingcorn stacked trait, will enter its second year of commercial production in 2011. Continued sales growth of new products pyroxsulam, spinetoram,penoxsulam, and aminopyralid is also anticipated in 2011. Investments in technology, capacity and geographic reach in the Seeds, Traits and Oils businessremain a priority.
44
TM
TM
TM

Table of Contents
PERFORMANCE SYSTEMSThe Performance Systems segment consists of the following businesses: Dow Automotive Systems; Dow Elastomers; Dow Wire and Cable; Dow FormulatedSystems; Dow Oil and Gas; and Dow Fiber Solutions. These businesses produce a wide variety of products with a broad range of applications – automotiveinteriors and exteriors, footwear, mattresses, specialty films, wind turbines, transportation, waterproofing membranes, and electrical and telecommunicationapplications.
On March 2, 2010, Dow announced that it had signed a definitive agreement for the sale of Styron to an affiliate of Bain Capital Partners; thetransaction closed on June 17, 2010. Businesses and products sold included Synthetic Rubber and certain products from Dow Automotive Systems, whichwere reported in the Performance Systems segment through the date of the divestiture. See Note E to the Consolidated Financial Statements for additionalinformation on this divestiture. Performance Systems Actual Results In millions 2010 2009 2008 Sales $6,676 $5,782 $7,531 EBITDA $855 $668 $235
Performance Systems 2010 Actual Versus 2009 Pro Forma 2009 Pro Forma Versus 2008 Pro Forma In millions 2010 2009 2008 Sales $6,676 $5,902 $8,294
Price change from comparative period 6% (11)% N/A Volume change from comparative period 7% (18)% N/A Volume change, excluding divestitures 15% N/A N/A
Equity earnings $8 $4 $(2) EBITDA $855 $666 $279 Certain items impacting EBITDA $(2) $(29) $(287)
2010 Actual Versus 2009 Pro FormaPerformance Systems sales for 2010 were $6,676 million, up 13 percent from $5,902 million in 2009. Volume increased 7 percent and price increased6 percent, with both volume and price improvement reported in all businesses and all geographic areas. Dow Formulated Systems led volume growth for thesegment, as demand for formulations related to alternative energy and energy efficiency rebounded from the global economic slowdown. Demand was alsostrong in the transportation, adhesives and packaging industries, while demand for wire and cable applications increased to a lesser extent. Offsetting theseincreases were reductions in volume due to the divestiture of Synthetic Rubber and certain products from Dow Automotive Systems in the second quarter of2010, as part of the Styron divestiture. Excluding the impact of these divestitures, volume increased 15 percent for the segment. Dow Elastomers reported themost significant increase in price, due to tight supply/demand balances during the year.
45

Table of Contents
EBITDA for 2010 was $855 million, compared with $666 million in 2009. EBITDA in 2010 included a $7 million net gain on the sale of Styron anda $9 million write-off of capital project spending in Dow Automotive Systems. EBITDA in 2009 was reduced by a $30 million increase in cost of sales relatedto the fair valuation of inventories acquired from Rohm and Haas and was favorably impacted $1 million from the sale of the Company’s ownership interestin OPTIMAL. Compared with last year, EBITDA improved as volume growth, higher prices, improved operating rates, and lower R&D expenses due torecent divestitures more than offset higher feedstock and energy and other raw material costs.
2009 Versus 2008 (Pro Forma Comparison)Performance Systems sales were $5,902 million in 2009, down from $8,294 million in 2008. Sales declined 29 percent with volume declining 18 percentand prices declining 11 percent. The decrease in volume was broad-based across all geographic areas and most businesses, with declines driven by the globaleconomic slowdown in the automotive, construction and utility industries. The drop in prices was also broad-based, with decreases reported in all geographicareas, driven by lower feedstock and other raw material costs.
EBITDA for 2009 was $666 million, compared with $279 million in 2008. EBITDA increased from 2008 as a decrease in raw material and feedstockcosts, lower freight costs, and lower R&D and SG&A expenses offset lower selling prices and lower volume. EBITDA for 2009 was reduced by a $30 millionincrease in cost of sales related to the fair valuation of inventories acquired from Rohm and Haas and was favorably impacted by $1 million from the sale ofthe Company’s ownership interest in OPTIMAL. EBITDA for 2008 was negatively impacted by a goodwill impairment loss of $209 million associated withDow Automotive Systems (See Note I to the Consolidated Financial Statements), costs of $6 million related to the U.S. Gulf Coast hurricanes, andrestructuring charges of $72 million related to the closure or impairment of several manufacturing facilities. See Note C to the Consolidated FinancialStatements for information on restructuring charges.
Performance Systems Outlook for 2011Performance Systems sales are expected to increase in 2011 as recovery in the transportation, packaging, building and construction, and infrastructure-relatedindustries continues, particularly in emerging geographies. Dow Formulated Systems volume is expected to continue to grow, with increased demand in energyefficiency and alternative energy applications. Dow Elastomers is also expected to experience continued growth with the introduction of the ENLIGHTencapsulant films, which began commercial-scale production in late 2010 in Findlay, Ohio. Performance Systems expects increased prices in 2011, driven byprojected higher feedstock and other raw material costs. The anticipated start-up of a new specialty elastomers production train at a joint venture in Thailandwill increase capacity and expand the Company’s presence in Asia Pacific.
PERFORMANCE PRODUCTSThe Performance Products segment consists of the following businesses: Amines; Emulsion Polymers (through the June 17, 2010 divestiture of Styron);Epoxy; Oxygenated Solvents; Performance Monomers; Polyglycols, Surfactants and Fluids; Polyurethanes; Dow Haltermann; and SAFECHEM. Thesebusinesses produce a wide variety of products with a broad range of applications – adhesives and deicing fluids, solvents, paper and paperboardapplications, carpet backing and home furnishings. The segment also includes a portion of the results of the OPTIMAL Group of Companies (through theSeptember 30, 2009 divestiture of this group of joint ventures) and the SCG-Dow Group of joint ventures.
On March 2, 2010, Dow announced the entry into a definitive agreement to sell Styron to an affiliate of Bain Capital Partners; the transaction closed onJune 17, 2010. Businesses and products sold included Emulsion Polymers (styrene-butadiene latex), which was reported in the Performance Products segmentthrough the date of the divestiture. See Note E to the Consolidated Financial Statements for additional information on this divestiture. Performance Products Actual Results In millions 2010 2009 2008 Sales $ 10,903 $ 8,938 $ 12,114 EBITDA $1,311 $1,151 $1,049
46
TM

Table of Contents
Performance Products 2010 Actual Versus 2009 Pro Forma 2009 Pro Forma Versus 2008 Pro Forma In millions 2010 2009 2008 Sales $10,903 $9,065 $13,026
Price change from comparative period 15% (18)% N/A Volume change from comparative period 5% (12)% N/A Volume change, excluding divestitures 14% N/A N/A
Equity earnings $ 5 $31 $52 EBITDA $1,311 $1,107 $1,060 Certain items impacting EBITDA $(84) $43 $(117)
2010 Actual Versus 2009 Pro FormaPerformance Products sales were $10,903 million in 2010, up 20 percent from $9,065 million in 2009. Price increased 15 percent, driven primarily byincreased feedstock and energy and other raw material costs, while volume increased 5 percent, as the global economic recovery led to increased demand.Prices increased in all businesses within the segment, and double-digit price increases were reported in all geographic areas. Compared with last year, volumegrowth was negatively impacted by the sale of the Company’s Emulsion Polymers assets as part of the Styron divestiture completed on June 17, 2010.Excluding the impact of the Emulsion Polymers divestiture, volume was up 14 percent, with increases in most businesses and all geographic areas. Stronggrowth was reported by the Epoxy business, up 30 percent driven by improved demand for resins used in the automotive and electronic industries and newproduct supply agreements with Styron. Oxygenated Solvents also reported a significant volume gain of 22 percent, driven by the economic recovery,especially in North America and Asia Pacific.
EBITDA for 2010 was $1,311 million, up from $1,107 million in 2009. Compared with last year, higher prices and volume, improved operatingrates, and lower R&D and SG&A expenses more than offset higher raw materials costs, higher manufacturing and supply chain costs, and lower equityearnings due to costs associated with the start-up of a new joint venture. EBITDA for 2010 was negatively impacted by $15 million in adjustments to the2009 restructuring plan and asset impairment charges and related costs of $48 million in the Polyurethanes business and a $34 million write-off of capitalproject spending and related costs in the Epoxy business, and was favorably impacted by a $13 million net gain on the sale of Styron. EBITDA for 2009 waspositively impacted by a gain of $145 million on the sale of the Company’s ownership interest in OPTIMAL, partially offset by restructuring charges of$73 million, an increase in cost of sales of $22 million related to the fair valuation of Rohm and Haas inventories, and a $7 million charge related to theimpairment of goodwill associated with the Dow Haltermann reporting unit.
2009 Versus 2008 (Pro Forma Comparison)Performance Products sales were $9,065 million in 2009, down from $13,026 million in 2008. Sales declined 30 percent with prices declining 18 percent andvolume declining 12 percent. The sharp drop in prices was largely driven by a decline in feedstock and energy and other raw material costs. Volume was downin all businesses as a result of weak global demand. From a geographic standpoint, North America and EMEA experienced substantial volume declines, whilethe decline in Latin America was less pronounced, and Asia Pacific reported a slight volume increase.
47

Table of Contents
EBITDA for 2009 was $1,107 million, up from $1,060 million in 2008. Compared with 2008, the benefits of lower raw material and freight costs andlower SG&A and R&D expenses were more than offset by declines in price and volume. EBITDA for 2009 was positively impacted by a gain of$145 million on the sale of the Company’s ownership interest in OPTIMAL, partially offset by restructuring charges of $73 million and an increase in cost ofsales of $22 million related to the fair valuation of Rohm and Haas inventories. EBITDA for 2008 was negatively impacted by costs of $78 million related tothe U.S. Gulf Coast hurricanes and restructuring charges of $39 million related to the closure of several manufacturing facilities. See Note C to theConsolidated Financial Statements for information on restructuring charges.
Performance Products Outlook for 2011The global economic recovery is expected to continue in 2011, with higher selling prices within the segment, largely driven by higher projected feedstock andenergy costs. Pricing may come under pressure for some of the businesses, as new industry capacity is anticipated in 2011. Moderate volume growth isexpected, driven by continued strong demand and the anticipated start-up of propylene oxide production at a consolidated joint venture in Thailand.
PLASTICSThe Plastics segment includes the following businesses: Polyethylene; Polypropylene; Styrenics (through the June 17, 2010 divestiture of Styron); Plastics,Licensing and Catalyst; and Polycarbonate and Compounds and Blends (through the June 17, 2010 divestiture of Styron). These world-leading businessesprovide a broad range of products and solutions by leveraging Dow’s leading manufacturing and application technology, research and product developmentexpertise, extensive market knowledge and strong customer relationships. Product applications range from beverage bottles, disposable diaper liners and toysto plastic pipe, oil tanks and road equipment. The Plastics segment also includes the results of Equipolymers, Americas Styrenics LLC (through the June 17,2010 divestiture of Styron) and Univation Technologies, LLC, and a portion of the results of EQUATE Petrochemical Company K.S.C., The KuwaitOlefins Company K.S.C. and the SCG-Dow Group, all joint ventures of the Company.
On March 2, 2010, Dow announced the entry into a definitive agreement to sell Styron to an affiliate of Bain Capital Partners; the transaction closed onJune 17, 2010. Businesses and products sold included Styrenics (polystyrene, acrylonitrile butadiene styrene, styrene acrylonitrile and expandablepolystyrene), Polycarbonate and Compounds and Blends, as well as the Company’s 50-percent ownership interest in Americas Styrenics LLC, a principalnonconsolidated affiliate; all of which were reported in the Plastics segment through the date of the divestiture. See Note E to the Consolidated FinancialStatements for additional information on this divestiture.
For the Plastics segment, there was no difference between actual and pro forma sales and EBITDA for 2009 and 2008. Plastics Actual Results In millions 2010 2009 2008 Sales $11,551 $ 9,925 $ 14,240
Price change from comparative period 24% (27)% N/A Volume change from comparative period (8)% (3)% N/A Volume change, excluding divestitures 1% N/A N/A
Equity earnings $255 $112 $115 EBITDA $2,910 $1,665 $1,746 Certain items impacting EBITDA $7 $(66) $(194)
48

Table of Contents
2010 Versus 2009Plastics sales for 2010 were $11,551 million, up 16 percent from $9,925 million in 2009, with price up 24 percent and volume down 8 percent. Globaleconomic conditions began to improve during the second half of 2009 and this momentum carried over into 2010. Feedstock and energy costs weresignificantly higher than in 2009, driving double-digit price increases in all geographic areas. The decline in volume for the segment reflected the divestiture ofthe Styrenics and Polycarbonate and Compounds and Blends businesses as part of the June 17, 2010 divestiture of Styron. Sales volume, excluding theimpact of the Styron divestiture, was up 1 percent from 2009. Sales volume during the first half of 2010 was negatively impacted by planned maintenanceturnarounds at the Company’s polyethylene and polypropylene production facilities in North America and Europe. Production was also negatively impactedduring the first half of the year by an unplanned site outage at the Company’s polypropylene production facility in Schkopau, Germany, and by ethylenesupply limitations at the Company’s Bahia Blanca polyethylene facility in Argentina. With the completion of the maintenance turnarounds and resolution ofthe outages, production returned to normal levels during the second half of 2010 and demand was strong. Polypropylene volume was significantly higher inNorth America and EMEA as demand in the consumer goods, automotive and packaging sectors was particularly strong.
EBITDA for 2010 was $2,910 million, up from $1,665 million in 2009. While feedstock and energy and other raw materials costs were significantlyhigher than those of 2009, these increases were more than offset by higher prices and improved equity earnings from the Company’s joint ventures in Kuwait.EBITDA for 2010 included a $7 million net gain on the divestiture of Styron. EBITDA in 2009 was impacted by $65 million of impairment charges relatedto the Company’s investment in Equipolymers, a nonconsolidated affiliate, and $1 million of restructuring charges. See Note C to the Consolidated FinancialStatements for information on restructuring charges.
2009 Versus 2008Plastics sales for 2009 were $9,925 million, down 30 percent from $14,240 million in 2008. Double-digit price declines were reported in all geographic areasduring 2009. The decline in feedstock costs and the weak pricing environment that developed in late 2008 carried forward into 2009, resulting in prices thatwere 27 percent lower than those of 2008. After reaching a low point during the first quarter of 2009, prices improved during the remainder of the year. Volumewas negatively impacted by weak global economic conditions, declining 3 percent for the year. Volume improved, however, in Asia Pacific and Latin Americaand as the economic recovery began to gather momentum and demand increased. Lower natural gas and other feedstock prices in North America, as well asdelays in the startup of new Middle East industry production capacity, resulted in economic conditions that favored the export of North American productioninto these geographic areas. Volume in North America and EMEA was lower as weak economic conditions persisted throughout the year. The volume decline inNorth America also reflected the May 2008 formation of Americas Styrenics LLC.
49

Table of Contents
EBITDA for 2009 was $1,665 million, down from $1,746 million in 2008. While Plastics benefited from a significant decline in feedstock costs,lower raw material and freight costs and lower SG&A expenses, these favorable impacts were more than offset by the decline in prices. Equity earnings weredown slightly from 2008 as improved earnings from Americas Styrenics LLC, The Kuwait Olefins Company K.S.C., LG DOW Polycarbonate Limited andSiam Polyethylene were more than offset by lower earnings from EQUATE. EBITDA in 2009 was impacted by $65 million of impairment charges related tothe Company’s investment in Equipolymers, a nonconsolidated affiliate, and $1 million of restructuring charges. EBITDA in 2008 was reduced byrestructuring charges totaling $148 million. The 2008 restructuring charges reflect the write-down of the Company’s investment in a project to form a jointventure in Oman with the Oman Petrochemicals Industries Company LLC; costs related to the shutdown of production facilities (Terneuzen, TheNetherlands; Freeport, Texas; and Riverside, Missouri); as well as costs associated with the permanent shutdown of the operations of the Pétromont andCompany, Limited Partnership (“Pétromont”) joint venture in Varennes, Canada. EBITDA in 2008 also included a goodwill impairment loss of $30 millionassociated with the polypropylene reporting unit (see Note I to the Consolidated Financial Statements), as well as costs of $16 million related to the U.S. GulfCoast hurricanes.
Plastics Outlook for 2011Feedstock and energy costs are expected to increase in 2011 as global economic conditions continue to improve. In North America, stable natural gas prices areexpected to help U.S. Gulf Coast polyethylene production maintain a competitive position globally. The Company will continue to focus on higher margin,differentiated products and operating efficiencies to minimize the potential impact of higher and volatile propylene costs. Both polyethylene and polypropyleneare expected to face increased competition from new industry capacity that came on-line in 2009 and 2010 and additional industry capacity expected to comeon-line during 2011. The segment is also expected to be favorably impacted by the SCG-Dow Group’s solutions polyethylene plant in Thailand that came on-line in the fourth quarter of 2010. Equity earnings from the Company’s joint ventures in Kuwait and Univation Technologies, LLC are also expected toimprove in 2011.
CHEMICALS AND ENERGYThe Chemicals and Energy segment includes the following businesses: Chlor-Alkali/Chlor-Vinyl; Energy; Ethylene Oxide/Ethylene Glycol; and ChlorinatedOrganics. The Chlor-Alkali/Chlor-Vinyl business focuses on the production of chlorine for consumption by downstream Dow derivatives, as well asproduction, marketing and supply of ethylene dichloride, vinyl chloride monomer and caustic soda. These products are used for applications such asalumina production, pulp and paper manufacturing, soaps and detergents, and building and construction. The Energy business supplies power, steam andother utilities, principally for use in Dow’s global operations. The Ethylene Oxide/Ethylene Glycol business is the world’s largest producer of purified ethyleneoxide, principally used in Dow’s downstream performance derivatives. Dow is also a key supplier of ethylene glycol to MEGlobal, a 50:50 joint venture.Ethylene glycol is used in polyester fiber, polyethylene terephthalate (PET) for food and beverage container applications, polyester film, and aircraft andrunway deicers. Also included in the Chemicals and Energy segment are the results of MEGlobal and a portion of the results of EQUATE PetrochemicalCompany K.S.C., The Kuwait Olefins Company K.S.C. and the OPTIMAL Group of Companies (through the September 30, 2009 divestiture of this groupof companies), all joint ventures of the Company.
For the Chemicals and Energy segment, there was no difference between actual and pro forma sales and EBITDA for 2009 and 2008. Chemicals and Energy Actual Results In millions 2010 2009 2008 Sales $3,485 $2,816 $4,893
Price change from comparative period 18% (27)% N/A Volume change from comparative period 6% (15)% N/A
Equity earnings $344 $163 $214 EBITDA $574 $103 $278 Certain items impacting EBITDA - $118 $(147)
50

Table of Contents
2010 Versus 2009Chemicals and Energy sales were $3,485 million in 2010, up 24 percent from $2,816 million in 2009. Compared with last year, price was up 18 percent,with increases reported across all businesses and geographic areas. Volume improved 6 percent for the segment, as volume gains in the Chlor-Alkali/Chlor-Vinyl and Energy businesses more than offset declines in the Ethylene Oxide/Ethylene Glycol (“EO/EG”) business. Sales for the Chlor-Alkali/Chlor-Vinylbusiness increased 28 percent over 2009, driven by a 19 percent increase in price and 9 percent increase in volume. Vinyl chloride monomer (“VCM”) priceand volume increased in response to higher ethylene costs and strong U.S. polyvinyl chloride (“PVC”) export demand. Caustic soda volume improved due toincreased demand in the alumina and pulp and paper industries. Sales for the EO/EG business were down compared with 2009, as a 21 percent decrease involume more than offset a 19 percent increase in price. EO/EG volume declined as expected, due to the business’ strategic shift to supply purified ethyleneoxide to internal derivative businesses, and the closure of the Company’s Wilton, England facility in January 2010. Sales for the Chlorinated Organicsbusiness increased due to improved pricing in refrigerants, fluoropolymers and solvent applications, as well as an improvement in volume. Sales for theEnergy business increased 34 percent compared with 2009, with volume up 31 percent and price up 3 percent. Sales for the Energy business are primarilyopportunistic merchant sales driven by market conditions and sales to customers located on Dow manufacturing sites. Sales fluctuate as the Companybalances energy supply and demand at its manufacturing sites; however, the improving economy offered more opportunities for merchant sales in 2010. TheEnergy business supplies Dow’s businesses at net cost, resulting in EBITDA that is at or near break-even for the business.
EBITDA for 2010 was $574 million, up significantly from $103 million in 2009, which included a $193 million gain on the sale of the Company’sownership interest in OPTIMAL, offset by $75 million of restructuring costs. EBITDA in 2010 improved significantly due to higher prices and volume,improved operating rates and higher equity earnings from EQUATE, MEGlobal and The Kuwait Olefins Company K.S.C.
2009 Versus 2008Chemicals and Energy sales were $2,816 million in 2009, down 42 percent from $4,893 million in 2008. Both volume and prices were down across allbusinesses, primarily due to unfavorable supply/demand balances. Chlor-Alkali/Chlor-Vinyl sales decreased 41 percent compared with 2008, with a34 percent decrease in prices and a 7 percent decrease in volume. Prices for VCM were down compared with 2008 on weak demand in the housing andconstruction industries. Volume for VCM was essentially unchanged as increased sales to customers exporting polyvinyl chloride offset the decline in NorthAmerican domestic demand. Caustic soda sales were impacted by weak demand in the alumina, chemical processing and pulp and paper industries, drivingboth prices and volume down. EO/EG sales decreased 55 percent versus 2008, with a 32 percent decrease in volume and a 23 percent decrease in prices.Compared with 2008, EG volume declined due to pressure from new industry capacity, while prices declined due to lower ethylene prices and weak demand.
EBITDA for 2009 was $103 million, compared with $278 million in 2008. EBITDA for 2009 was positively impacted by a $193 million gain on thesale of OPTIMAL, offset by restructuring charges of $75 million. EBITDA in 2008 was negatively impacted by hurricane-related costs of $44 million andrestructuring charges of $103 million related to the impairment of the ethylene oxide/ethylene glycol EO/EG plant at Wilton, England; the impairment of thechlorinated organics plant in Aratu, Brazil; and the closure of the chlor-alkali plant in Oyster Creek, Texas (see Note C to the Consolidated FinancialStatements for information on restructuring charges). EBITDA declined in 2009, as the benefit of significantly lower feedstock and energy costs and increasedequity earnings from The Kuwait Olefins Company K.S.C. were more than offset by lower prices, lower volume, and declines in equity earnings fromEQUATE and OPTIMAL.
51

Table of Contents
Chemicals and Energy Outlook for 2011The Chemicals and Energy segment expects overall market conditions to be consistent with 2010. VCM sales are expected to decline in 2011 due to theCompany’s planned reduction of North American VCM production capacity. Additional chlor-alkali industry capacity is expected to come on-line during thesecond half of 2011, but increasing global demand should keep supply and demand consistent with 2010. The EO/EG business is completing a strategic shiftto produce purified EO for the internal Dow derivative businesses; this will result in lower sales volume in 2011. Chlorinated Organics sales are expected todecline in 2011 due to maintenance turnarounds scheduled for 2011. Equity earnings are anticipated to be in line with 2010.
In the fourth quarter of 2010, Dow and Mitsui & Co., Ltd. formed a 50:50 manufacturing joint venture to construct, own and operate a new membranechlor-alkali facility located at Dow’s Freeport, Texas, integrated manufacturing complex. Construction is slated to begin in early 2011, and operations areexpected to begin in mid-2013. The new facility will have an annual capacity of approximately 800 kilotons. Under contract to the joint venture, Dow willoperate and maintain the facility and the joint venture is consolidated into Dow’s consolidated financial statements.
HYDROCARBONSThe Hydrocarbons business encompasses the procurement of fuels, natural gas liquids and crude oil-based raw materials, as well as the supply ofmonomers, principally for use in Dow’s global operations. The business regularly sells its by-products and buys and sells its products to balance regionalproduction capabilities and derivative requirements. The business also sells products to certain Dow joint ventures. The Hydrocarbons segment also includesthe results of Compañía Mega S.A. and a portion of the results of The Kuwait Olefins Company K.S.C. and the SCG-Dow Group, joint ventures of theCompany.
On March 2, 2010, Dow announced the entry into a definitive agreement to sell Styron to an affiliate of Bain Capital Partners; the transaction closed onJune 17, 2010. Businesses and products sold included certain styrene monomer assets, which were reported in the Hydrocarbons segment through the date ofthe divestiture. See Note E to the Consolidated Financial Statements for additional information on this divestiture.
For the Hydrocarbons segment, there was no difference between actual and pro forma sales and EBITDA for 2009 and 2008. Hydrocarbons Actual Results In millions 2010 2009 2008 Sales $5,442 $3,892 $8,340
Price change from comparative period 35% (28)% N/A Volume change from comparative period 5% (25)% N/A Volume change, excluding divestitures 38% N/A N/A
Equity earnings $63 $33 $41 EBITDA $(1) $391 $(70) Certain items impacting EBITDA - $392 $(61)
52
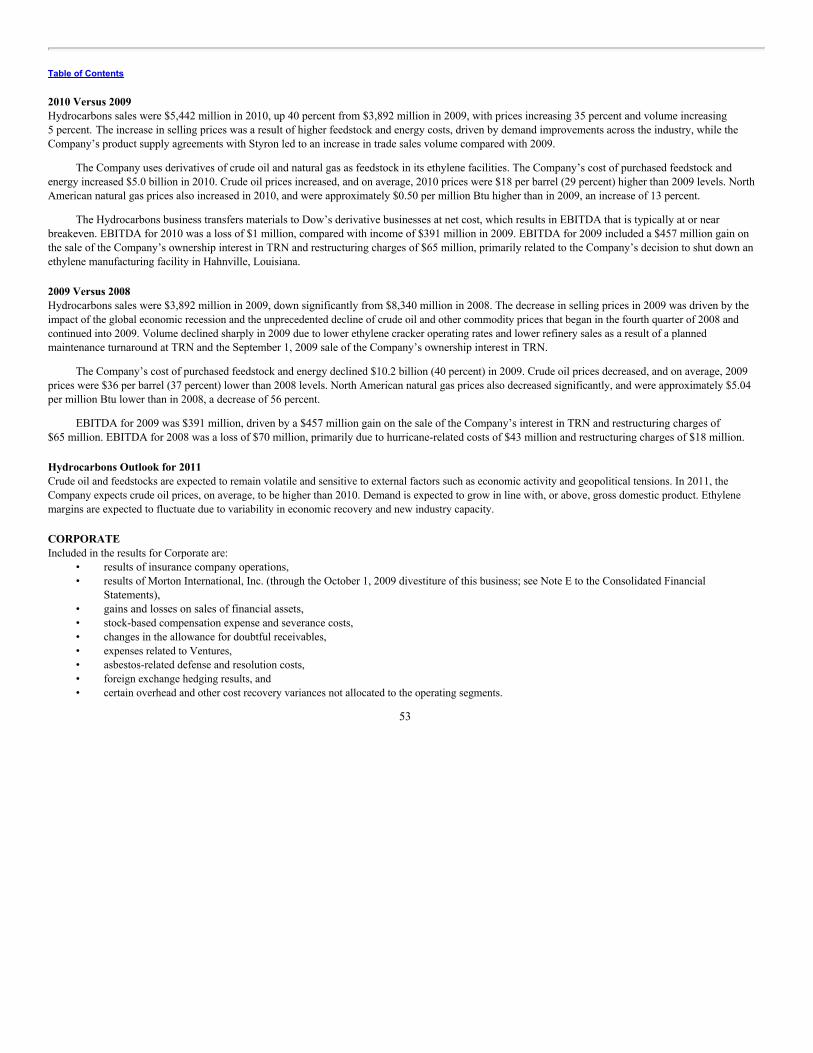
Table of Contents
2010 Versus 2009Hydrocarbons sales were $5,442 million in 2010, up 40 percent from $3,892 million in 2009, with prices increasing 35 percent and volume increasing5 percent. The increase in selling prices was a result of higher feedstock and energy costs, driven by demand improvements across the industry, while theCompany’s product supply agreements with Styron led to an increase in trade sales volume compared with 2009.
The Company uses derivatives of crude oil and natural gas as feedstock in its ethylene facilities. The Company’s cost of purchased feedstock andenergy increased $5.0 billion in 2010. Crude oil prices increased, and on average, 2010 prices were $18 per barrel (29 percent) higher than 2009 levels. NorthAmerican natural gas prices also increased in 2010, and were approximately $0.50 per million Btu higher than in 2009, an increase of 13 percent.
The Hydrocarbons business transfers materials to Dow’s derivative businesses at net cost, which results in EBITDA that is typically at or nearbreakeven. EBITDA for 2010 was a loss of $1 million, compared with income of $391 million in 2009. EBITDA for 2009 included a $457 million gain onthe sale of the Company’s ownership interest in TRN and restructuring charges of $65 million, primarily related to the Company’s decision to shut down anethylene manufacturing facility in Hahnville, Louisiana.
2009 Versus 2008Hydrocarbons sales were $3,892 million in 2009, down significantly from $8,340 million in 2008. The decrease in selling prices in 2009 was driven by theimpact of the global economic recession and the unprecedented decline of crude oil and other commodity prices that began in the fourth quarter of 2008 andcontinued into 2009. Volume declined sharply in 2009 due to lower ethylene cracker operating rates and lower refinery sales as a result of a plannedmaintenance turnaround at TRN and the September 1, 2009 sale of the Company’s ownership interest in TRN.
The Company’s cost of purchased feedstock and energy declined $10.2 billion (40 percent) in 2009. Crude oil prices decreased, and on average, 2009prices were $36 per barrel (37 percent) lower than 2008 levels. North American natural gas prices also decreased significantly, and were approximately $5.04per million Btu lower than in 2008, a decrease of 56 percent.
EBITDA for 2009 was $391 million, driven by a $457 million gain on the sale of the Company’s interest in TRN and restructuring charges of$65 million. EBITDA for 2008 was a loss of $70 million, primarily due to hurricane-related costs of $43 million and restructuring charges of $18 million.
Hydrocarbons Outlook for 2011Crude oil and feedstocks are expected to remain volatile and sensitive to external factors such as economic activity and geopolitical tensions. In 2011, theCompany expects crude oil prices, on average, to be higher than 2010. Demand is expected to grow in line with, or above, gross domestic product. Ethylenemargins are expected to fluctuate due to variability in economic recovery and new industry capacity.
CORPORATEIncluded in the results for Corporate are: • results of insurance company operations,
• results of Morton International, Inc. (through the October 1, 2009 divestiture of this business; see Note E to the Consolidated Financial
Statements), • gains and losses on sales of financial assets, • stock-based compensation expense and severance costs, • changes in the allowance for doubtful receivables, • expenses related to Ventures, • asbestos-related defense and resolution costs, • foreign exchange hedging results, and • certain overhead and other cost recovery variances not allocated to the operating segments.
53

Table of Contents
Corporate Actual Results In millions 2010 2009 2008 Sales $343 $705 $323 EBITDA $(1,444) $(1,133) $(1,005)
Corporate 2010 Actual Versus 2009 Pro Forma 2009 Pro Forma Versus 2008 Pro Forma In millions 2010 2009 2008 Sales $343 $1,095 $1,539 Equity earnings $(16) $(8) $(8) EBITDA $(1,444) $(1,092) $(1,092) Certain items impacting EBITDA $(230) $(623) $(784)
2010 Actual Versus 2009 Pro FormaSales for Corporate, which for 2010 primarily related to the Company’s insurance operations, were $343 million in 2010, down from $1,095 million in 2009,which also included the results of Morton International, Inc. (“Morton,” the Salt business acquired with the Rohm and Haas acquisition) through the fourthquarter of 2009 divestiture of the business.
EBITDA for 2010 was a loss of $1,444 million, compared with a loss of $1,092 million in the same period last year. EBITDA for 2010 was lower dueto increased performance-based compensation (including stock-based compensation and increased expense related to higher employee participation in theEmployees’ Stock Purchase Plan) and the absence of earnings from Morton. Additionally, EBITDA was reduced by integration costs of $143 million relatedto the acquisition of Rohm and Haas, $50 million of labor-related litigation costs, a charge of $47 million for an obligation related to a past divestiture, and a$46 million loss on the early extinguishment of debt. EBITDA for 2010 was favorably impacted by a $54 million reduction in the asbestos-related liabilityand $2 million in net adjustments to prior year restructuring plans.
EBITDA for 2009 was reduced by costs related to the April 1, 2009 acquisition of Rohm and Haas of $362 million, including $166 million of othertransaction and integration costs expensed in accordance with the accounting guidance for business combinations, $60 million of acquisition-related retentionexpenses, a $56 million loss on the early extinguishment of debt, and $80 million of transaction and other acquisition costs incurred by Rohm and Haas priorto the April 1, 2009 acquisition. EBITDA was also impacted by $224 million of 2009 restructuring charges, including employee-related severance expenses of$155 million, environmental obligations of $64 million, and $5 million of asset write-offs; plus $28 million in adjustments related to prior yearrestructuring plans. EBITDA for 2009 was further reduced by $7 million of IPR&D write-offs and $2 million of costs related to the 2008 hurricanes.
2009 Versus 2008 (Pro Forma Comparison)Sales for Corporate, which for 2009 and 2008 primarily related to Morton and the Company’s insurance operations, were $1,095 million in 2009, downfrom $1,539 million in 2008, reflecting the fourth quarter 2009 divestiture of Morton.
EBITDA for 2009 was a loss of $1,092 million, unchanged from 2008. EBITDA for 2009 was reduced by costs related to the April 1, 2009acquisition of Rohm and Haas of $362 million, $224 million of 2009 restructuring charges and $28 million in adjustments related to prior year restructuringplans. EBITDA for 2009 was further reduced by $7 million of IPR&D write-offs and $2 million of costs related to the 2008 hurricanes.
EBITDA for 2008 was negatively impacted by $594 million of 2008 restructuring charges, including employee-related severance expense of$321 million, pension curtailment costs and termination benefits of $88 million, asset write-offs and environmental obligations of $21 million, Rohm andHaas restructuring charges of $162 million and net adjustments to prior year restructuring plans of $2 million. EBITDA for 2008 was also negativelyimpacted by legal expenses and other costs related to the K-Dow transaction of $69 million and the acquisition of Rohm and Haas of $103 million; and costsassociated with the U.S. Gulf Coast hurricanes of $18 million.
54

Table of Contents
Sales Price and Volume by Operating Segment and Geographic AreaPro Forma Comparison 2010 2009
Percent change from prior year Volume Price Total Volume Price Total Operating Segments:
Electronic and Specialty Materials 19% - 19% (16)% (3)% (19)% Coatings and Infrastructure (3) 7% 4 (16) (7) (23) Health and Agricultural Sciences 11 (4) 7 4 (6) (2) Performance Systems 7 6 13 (18) (11) (29) Performance Products 5 15 20 (12) (18) (30) Plastics (8) 24 16 (3) (27) (30) Chemicals and Energy 6 18 24 (15) (27) (42) Hydrocarbons 5 35 40 (25) (28) (53)
Total 2% 13% 15% (13)% (17)% (30)% Geographic Areas:
United States 2% 15% 17% (19)% (14)% (33)% Europe, Middle East and Africa (1) - 13 13 (15) (20) (35) Rest of World 4 12 16 (4) (17) (21)
Total 2% 13% 15% (13)% (17)% (30)% (1) Sales to customers in the Middle East and Africa, previously reported with Rest of World, are now aligned with Europe, Middle East and Africa; prior
period sales have been adjusted to reflect this realignment. Sales Price and Volume by Operating Segment and Geographic AreaPro Forma Comparison, Excluding Divestitures (1)
2010
Percent change from prior year Volume Price Total Operating Segments:
Electronic and Specialty Materials 19% - 19% Coatings and Infrastructure 4 8% 12 Health and Agricultural Sciences 11 (4) 7 Performance Systems 15 6 21 Performance Products 14 17 31 Plastics 1 27 28 Chemicals and Energy 6 18 24 Hydrocarbons 38 46 84
Total 12% 14% 26% Geographic Areas:
United States 12% 17% 29% Europe, Middle East and Africa (2) 12 15 27 Rest of World 10 13 23
Total 12% 14% 26% (1) Excludes sales of the Salt business of Rohm and Haas divested on October 1, 2009, sales related to TRN
divested on September 1, 2009, sales of the acrylic monomer business and a portion of the specialty latexbusiness divested on January 25, 2010, sales of the Powder Coatings business divested on June 1, 2010and sales of Styron divested on June 17, 2010.
(2) Sales to customers in the Middle East and Africa, previously reported with Rest of World, are now alignedwith Europe, Middle East and Africa; prior period sales have been adjusted to reflect this realignment.
5 5

Table of Contents
LIQUIDITY AND CAPITAL RESOURCESThe Company’s cash flows from operating, investing and financing activities, as reflected in the Consolidated Statements of Cash Flows, are summarized inthe following table: Cash Flow Summary In millions 2010 2009 2008 Cash provided by (used in):
Operating activities $ 4,102 $ 2,075 $ 4,711 Investing activities 135 (14,767) (2,737) Financing activities (178) 12,659 (978) Effect of exchange rate changes on cash 88 79 68 Cash assumed in initial consolidation of variable interest entities 46 - -
Net increase in cash and cash equivalents $4,193 $ 46 $ 1,064
Cash provided by operating activities in 2010 increased significantly compared with 2009 primarily due to increased earnings. Cash provided byoperating activities in 2009 declined compared with 2008 due to an increase in working capital requirements primarily driven by an increase in trade accountsreceivable. The increase in trade accounts receivable reflected the increase in sales toward the end of 2009 versus the end of 2008 primarily due to theacquisition of Rohm and Haas in 2009.
Cash provided by investing activities in 2010 reflected proceeds from the divestiture of Styron, as well as other smaller divestitures, proceeds from thechange in restricted cash related to the consolidation of a variable interest entity (see Note S to the Consolidated Financial Statements) and the usage of cash forcapital expenditures. Cash used in investing activities in 2009 increased over 2008, reflecting the April 1, 2009 acquisition of Rohm and Haas for$15,681 million and the purchase of a previously leased ethylene plant in Canada for $713 million, partially offset by the proceeds from the sale of theCompany’s interest in nonconsolidated affiliates (TRN for $742 million and OPTIMAL for $660 million), net proceeds from the sale of Morton($1,576 million) and lower capital expenditures.
Cash used in financing activities in 2010 included payments on long-term debt and commercial paper, payments on notes payable related to themonetization of accounts receivable in Europe, and the payment of dividends to stockholders, partially offset by the proceeds from issuance of long-term debt.Cash provided by financing activities increased significantly in 2009, reflecting the funding for the acquisition of Rohm and Haas as discussed in furtherdetail below, partially offset by the redemption of the preferred partnership units and accrued dividends of Tornado Finance V.O.F. of $520 million.
Management expects that the Company will continue to have sufficient liquidity and financial flexibility to meet all of its business obligations.
The Company has undertaken several restructuring plans during the past three years as follows:
• On December 5, 2008, the Board of Directors approved a restructuring plan (the “2008 Plan”) that included the shutdown of a number of
facilities and a global workforce reduction. At the end of 2010, these restructuring activities were substantially complete with remaining liabilitiesprimarily related to pension and environmental remediation to be paid over time.
• Included in the liabilities assumed with the April 1, 2009 acquisition of Rohm and Haas was a reserve of $122 million for severance andemployee benefits for the separation of 1,255 employees associated with Rohm and Haas’ 2008 restructuring initiatives. The separations resultedfrom plant shutdowns, production schedule adjustments, productivity improvements and reductions in support services. These restructuringactivities are scheduled to be completed primarily by the third quarter of 2011.
• On June 30, 2009, following the acquisition of Rohm and Haas, the Board of Directors approved a restructuring plan (the “2009 Plan”) that
includes the elimination of approximately 2,500 positions and the shutdown of a number of manufacturing facilities. These restructuringactivities are scheduled to be completed primarily by the end of 2011.
5 6

Table of Contents
The restructuring activities related to the 2008 Plan, the severance reserve assumed from Rohm and Haas and the 2009 Plan are expected to result inadditional cash expenditures of approximately $240 million related to severance costs, contract termination fees, asbestos abatement and environmentalremediation (see Note C to the Consolidated Financial Statements). The Company expects to incur future costs related to its restructuring activities, as theCompany continually looks for ways to enhance the efficiency and cost effectiveness of its operations to ensure competitiveness across its businesses andacross geographic areas. Future costs are expected to include demolition costs related to the closed facilities, which will be recognized as incurred. TheCompany also expects to incur additional employee-related costs, including involuntary termination benefits and pension plan settlement costs, related to itsother optimization activities. These costs cannot be reasonably estimated at this time. Working Capital at December 31 In millions 2010 2009 Current assets $ 23,781 $19,542 Current liabilities 13,896 13,105 Working capital $ 9,885 $ 6,437 Current ratio 1.71:1 1.49:1
Working capital increased from December 31, 2009 to December 31, 2010 principally due to increased cash and cash equivalents. At December 31,2010, trade receivables were $4.6 billion, down from $5.7 billion at December 31, 2009, primarily due to a change in the way the sale of accounts receivablefacilities are being recorded (see Note O to the Consolidated Financial Statements), as well as the divestiture of Styron (see Note E to the Consolidated FinancialStatements). Days-sales-outstanding-in-receivables (excluding the impact of sales of receivables) was 43 days at December 31, 2010 compared with 45 days atDecember 31, 2009. At December 31, 2010, total inventories were $7.1 billion, up from $6.8 billion at December 31, 2009. Days-sales-in-inventory atDecember 31, 2010 was 62 days versus 64 days at December 31, 2009.
At the end of 2009, the Company’s net debt as a percent of total capitalization had risen to 48.0 percent, due to increased financing related to theacquisition of Rohm and Haas. As shown in the following table, net debt is equal to total debt minus “Cash and cash equivalents.” As Dow continues tostrengthen its balance sheet and increase financial flexibility, management is principally focused on net debt, as Dow believes this is the best measure of theCompany’s financial leverage. By the end of 2010, net debt as a percent of total capitalization had been reduced to 42.6 percent. Total Debt at December 31 In millions 2010 2009 Notes payable $ 1,467 $ 2,139 Long-term debt due within one year 1,755 1,082 Long-term debt 20,605 19,152
Gross debt $ 23,827 $ 22,373 Cash and cash equivalents $ 7,039 $ 2,846
Net debt $16,788 $19,527 Gross debt as a percent of total capitalization 51.3% 51.4% Net debt as a percent of total capitalization 42.6% 48.0%
57
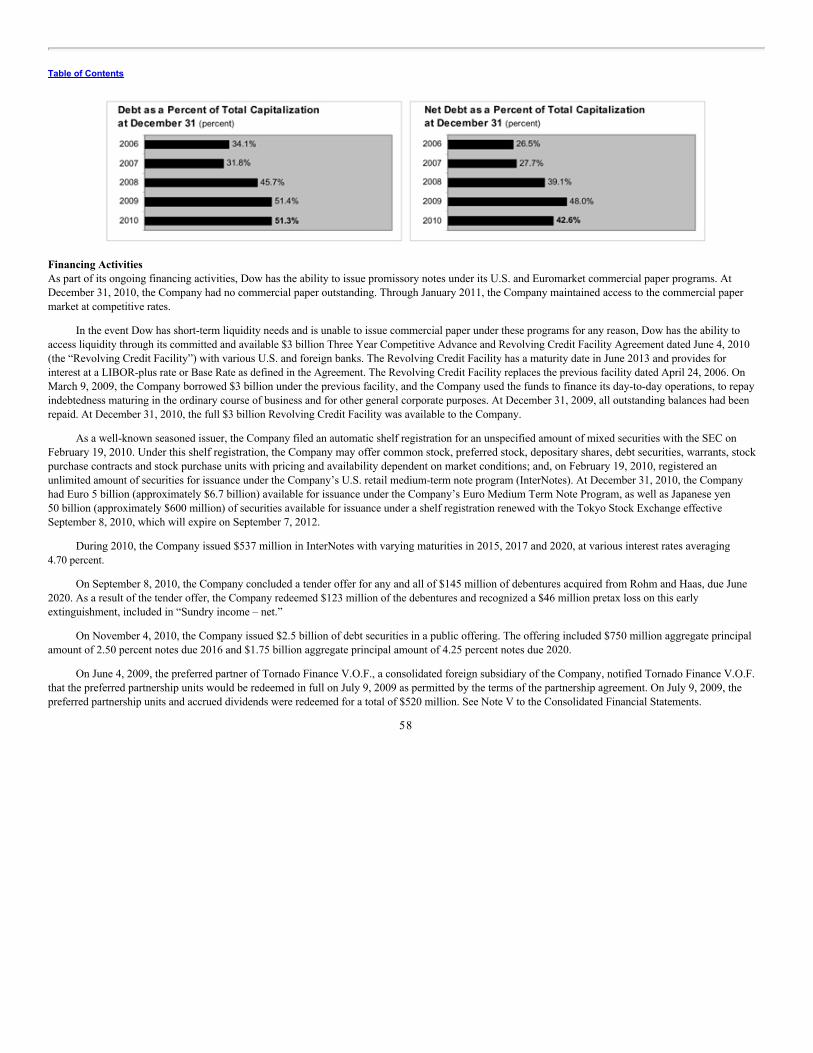
Table of Contents
Financing ActivitiesAs part of its ongoing financing activities, Dow has the ability to issue promissory notes under its U.S. and Euromarket commercial paper programs. AtDecember 31, 2010, the Company had no commercial paper outstanding. Through January 2011, the Company maintained access to the commercial papermarket at competitive rates.
In the event Dow has short-term liquidity needs and is unable to issue commercial paper under these programs for any reason, Dow has the ability toaccess liquidity through its committed and available $3 billion Three Year Competitive Advance and Revolving Credit Facility Agreement dated June 4, 2010(the “Revolving Credit Facility”) with various U.S. and foreign banks. The Revolving Credit Facility has a maturity date in June 2013 and provides forinterest at a LIBOR-plus rate or Base Rate as defined in the Agreement. The Revolving Credit Facility replaces the previous facility dated April 24, 2006. OnMarch 9, 2009, the Company borrowed $3 billion under the previous facility, and the Company used the funds to finance its day-to-day operations, to repayindebtedness maturing in the ordinary course of business and for other general corporate purposes. At December 31, 2009, all outstanding balances had beenrepaid. At December 31, 2010, the full $3 billion Revolving Credit Facility was available to the Company.
As a well-known seasoned issuer, the Company filed an automatic shelf registration for an unspecified amount of mixed securities with the SEC onFebruary 19, 2010. Under this shelf registration, the Company may offer common stock, preferred stock, depositary shares, debt securities, warrants, stockpurchase contracts and stock purchase units with pricing and availability dependent on market conditions; and, on February 19, 2010, registered anunlimited amount of securities for issuance under the Company’s U.S. retail medium-term note program (InterNotes). At December 31, 2010, the Companyhad Euro 5 billion (approximately $6.7 billion) available for issuance under the Company’s Euro Medium Term Note Program, as well as Japanese yen50 billion (approximately $600 million) of securities available for issuance under a shelf registration renewed with the Tokyo Stock Exchange effectiveSeptember 8, 2010, which will expire on September 7, 2012.
During 2010, the Company issued $537 million in InterNotes with varying maturities in 2015, 2017 and 2020, at various interest rates averaging4.70 percent.
On September 8, 2010, the Company concluded a tender offer for any and all of $145 million of debentures acquired from Rohm and Haas, due June2020. As a result of the tender offer, the Company redeemed $123 million of the debentures and recognized a $46 million pretax loss on this earlyextinguishment, included in “Sundry income – net.”
On November 4, 2010, the Company issued $2.5 billion of debt securities in a public offering. The offering included $750 million aggregate principalamount of 2.50 percent notes due 2016 and $1.75 billion aggregate principal amount of 4.25 percent notes due 2020.
On June 4, 2009, the preferred partner of Tornado Finance V.O.F., a consolidated foreign subsidiary of the Company, notified Tornado Finance V.O.F.that the preferred partnership units would be redeemed in full on July 9, 2009 as permitted by the terms of the partnership agreement. On July 9, 2009, thepreferred partnership units and accrued dividends were redeemed for a total of $520 million. See Note V to the Consolidated Financial Statements.
58

Table of Contents
On August 21, 2009, the Company executed a buy-back of Euro 175 million of private placement debt acquired from Rohm and Haas and recognized a$56 million pretax loss on early extinguishment, included in “Sundry income – net.”
Between May and December 2009, the Company issued $640 million in InterNotes with varying maturities in 2014, 2016 and 2019, at various interestrates averaging 6.45 percent.
Dow’s public debt instruments and documents for its private funding transactions contain, among other provisions, certain covenants and defaultprovisions. The Company’s most significant debt covenant with regard to its financial position is the obligation to maintain the ratio of the Company’sconsolidated indebtedness to consolidated capitalization at no greater than 0.65 to 1.00 at any time the aggregate outstanding amount of loans under theRevolving Credit Facility exceeds $500 million. The ratio of the Company’s consolidated indebtedness to consolidated capitalization as defined in the creditagreements was 0.493 to 1.00 at December 31, 2010. At December 31, 2010, management believes the Company was in compliance with all covenants anddefault provisions. For information on Dow’s covenants and default provisions, see Note P to the Consolidated Financial Statements.
The Company’s credit rating is investment grade. The Company’s long-term credit ratings are BBB- with a positive outlook (Standard & Poor’s), Baa3with a stable outlook (Moody’s) and BBB with a stable outlook (Fitch). In the third quarter of 2010, Standard & Poor’s upgraded the Company’s outlookfrom stable to positive, and in the fourth quarter of 2010, Moody’s upgraded the Company’s outlook from negative to stable. The Company’s short-term creditratings are A-3 (Standard & Poor’s), P-3 (Moody’s) and F2 (Fitch). If the Company’s credit ratings are downgraded, borrowing costs will increase on certainindentures, and it could have a negative impact on the Company’s ability to access credit markets.
Financing Activities Related to the Acquisition of Rohm and HaasOn April 1, 2009, the Company completed the acquisition of Rohm and Haas. Pursuant to the July 10, 2008 Agreement and Plan of Merger (the “MergerAgreement”), Ramses Acquisition Corp., a direct wholly owned subsidiary of the Company, merged with and into Rohm and Haas (the “Merger”), with Rohmand Haas continuing as the surviving corporation and a direct wholly owned subsidiary of the Company. Financing for the April 1, 2009 transaction includeddebt of $9.2 billion obtained through a Term Loan Agreement (“Term Loan”), as well as equity investments by Berkshire Hathaway Inc. (“BHI”) and theKuwait Investment Authority (“KIA”) in the form of Cumulative Convertible Perpetual Preferred Stock, Series A of 3 million shares for $3 billion (BHI) and1 million shares for $1 billion (KIA).
In connection with the closing of the Merger, the Company entered into an Investment Agreement with certain trusts established by members of the Haasfamily (the “Haas Trusts”) and Paulson & Co. Inc. (“Paulson”), each of whom was a significant shareholder of Rohm and Haas common stock at the time ofthe Merger. Under the Investment Agreement, the Haas Trusts and Paulson purchased from the Company 2.5 million shares (Haas Trusts - 1.5 millionshares; Paulson - 1.0 million shares) of Cumulative Perpetual Preferred Stock, Series B (“preferred series B”) for an aggregate price of $2.5 billion, with$1.5 billion from the Haas Trusts and $1.0 billion from Paulson. The Haas Trusts made an additional investment in 0.5 million shares of CumulativeConvertible Perpetual Preferred Stock, Series C (“preferred series C”) for an aggregate price of $500 million.
In May 2009, the Company entered into a purchase agreement with the Haas Trusts and Paulson, whereby the Haas Trusts and Paulson agreed to sell tothe Company their shares of the preferred series B in consideration for shares of the Company’s common stock and/or notes at the discretion of the Company.
On May 6, 2009, the Company launched a public offering of 150.0 million shares of its common stock. Included in the 150.0 million shares offered tothe public were 83.3 million shares issued to the Haas Trusts and Paulson in a private transaction in consideration for 1.2 million shares of preferred series B,at par plus accrued dividends, held by the Haas Trusts and Paulson. Gross proceeds were $2,250 million, of which the Company’s net proceeds (afterunderwriting discounts and commissions) were $966 million for the sale of the Company’s 66.7 million shares.
5 9

Table of Contents
On May 7, 2009, the Company issued $6 billion of debt securities in a public offering. The offering included $1.75 billion aggregate principal amountof 7.6 percent notes due 2014; $3.25 billion aggregate principal amount of 8.55 percent notes due 2019; and $1 billion aggregate principal amount of9.4 percent notes due 2039. An aggregate principal amount of $1.35 billion of the 8.55 percent notes due 2019 were offered by accounts and funds managedby Paulson and the Haas Trusts. These investors received notes from the Company in payment for 1.3 million shares of preferred series B, at par plusaccrued dividends. The Company used the net proceeds received from this offering for refinancing, renewals, replacements and refunding of outstandingindebtedness, including repayment of a portion of the Term Loan.
Upon the consummation of the above transactions, all shares of preferred series B were retired.
On May 26, 2009, the Company entered into an underwriting agreement and filed the corresponding shelf registration statement to effect the conversionof preferred series C into the Company’s common stock. On June 9, 2009, following the end of the sale period and determination of the share conversionamount, the Company issued 31.0 million shares of common stock to the Haas Trusts and all shares of preferred series C were retired.
On August 4, 2009, the Company issued $2.75 billion of debt securities in a public offering. The offering included $1.25 billion aggregate principalamount of 4.85 percent notes due 2012; $1.25 billion aggregate principal amount of 5.90 percent notes due 2015; and $0.25 billion aggregate principalamount of floating rate notes due 2011. The Company used the net proceeds received from this offering for refinancing, renewals, replacements and refundingof outstanding indebtedness, including repayment of a portion of the Term Loan.
On October 1, 2009, the remaining balance of the Term Loan was fully repaid using proceeds from the sale of the Salt business. See Note E to theConsolidated Financial Statements for more information on the divestiture of the Salt business.
See Notes D, P, W and X to the Consolidated Financial Statements for more information on the acquisition of Rohm and Haas and the correspondingfinancing activities.
Capital ExpendituresCapital spending for the year was $2,130 million (including $548 million of capital spending by consolidated variable interest entities); see Note B to theConsolidated Financial Statements for information on variable interest entities consolidated at January 1, 2010. Capital spending in 2009 was $1,683 million(including $273 million of capital spending by a consolidated variable interest entity); see Note S to the Consolidated Financial Statements for information ona variable interest entity consolidated in 2009. Capital spending in 2008 was $2,276 million. In 2010, approximately 39 percent of the Company’s capitalexpenditures were directed toward additional capacity for new and existing products, compared with 43 percent in 2009 and 40 percent in 2008. In 2010,approximately 17 percent was committed to projects related to environmental protection, safety, loss prevention and industrial hygiene compared with20 percent in 2009 and 18 percent in 2008. The remaining capital was utilized to maintain the Company’s existing asset base, including projects related toproductivity improvements, energy conservation and facilities support.
60

Table of Contents
Major projects underway during 2010 included: construction of a new propylene oxide production facility using hydrogen peroxide to propylene oxidetechnology, a distribution terminal and related infrastructure and utilities in Thailand; conversion of the St. Charles, Louisiana facility to produce onlyethylene oxide to support the Company’s business strategy to supply purified ethylene oxide to internal derivative customers; the design and construction of anew chlor-alkali production facility to replace existing facilities in Freeport, Texas; the installation of two new steam boilers in Stade, Germany; and theenhancement of caustic production assets in Freeport, Texas. Additional major projects included construction of a storage cavern for feedstock supply inCanada; new area headquarters and laboratory facilities in Brazil; new brine wells in Brazil; furnace rehabilitations to increase energy utilization in ethyleneproduction at St. Charles, Louisiana; a new centrifugal ethylene compressor in Freeport, Texas to reduce spot purchases of ethylene; and the design andconstruction of the new Midland Business Process Service Center. Because the Company designs and builds most of its capital projects in-house, it had nomaterial capital commitments other than for the purchase of materials from fabricators and construction labor. The Company expects capital spending in 2011to be approximately $2.4 billion.
Contractual ObligationsThe following tables summarize the Company’s contractual obligations, commercial commitments and expected cash requirements for interest at December 31,2010. Additional information related to these obligations can be found in Notes N, P, Q, R and Y to the Consolidated Financial Statements. Contractual Obligations at December 31, 2010 Payments Due by Year
In millions 2011 2012 2013 2014 2015
2016 andbeyond Total
Long-term debt – current and noncurrent (1) $1,755 $2,886 $943 $2,548 $1,574 $13,112 $22,818 Deferred income tax liabilities – noncurrent (2) - - - - - 1,295 1,295 Pension and other postretirement benefits 790 1,007 1,001 1,085 1,035 2,481 7,399 Other noncurrent obligations (3) 72 292 320 177 151 2,646 3,658 Uncertain tax positions, including interest and penalties (4) 33 - - - - 320 353 Other contractual obligations:
Minimum operating lease commitments 202 163 149 126 115 1,796 2,551 Purchase commitments – take-or-pay and throughput obligations 3,603 3,261 2,647 2,055 1,341 8,203 21,110 Purchase commitments – other (5) 26 18 25 17 17 77 180
Expected cash requirements for interest 1,382 1,332 1,187 1,061 926 7,659 13,547 Total $7,863 $8,959 $6,272 $7,069 $5,159 $37,589 $72,911
(1) Excludes unamortized debt discount of $458 million.(2) Deferred income tax liabilities may vary according to changes in tax laws, tax rates and the operating results of the Company. As a result, it is impractical
to determine whether there will be a cash impact to an individual year. All noncurrent deferred income tax liabilities have been reflected in “2016 andbeyond.”
(3) Annual payments to resolve asbestos litigation will vary based on changes in defense strategies, changes in state and national law, and claims filing andresolution rates. As a result, it is impractical to determine the anticipated payments in any given year. Therefore, the majority of the noncurrent asbestos-related liability of $663 million has been reflected in “2016 and beyond.”
(4) Due to uncertainties in the timing of the effective settlement of tax positions with the respective taxing authorities, the Company is unable to determine thetiming of payments related to its uncertain tax positions, including interest and penalties. Amounts beyond the current year are therefore reflected in “2016and beyond.”
(5) Includes outstanding purchase orders and other commitments greater than $1 million, obtained through a survey conducted within the Company.
Off-Balance Sheet ArrangementsOn January 1, 2010, the Company adopted ASU 2009-17, “Consolidations (Topic 810): Improvements to Financial Reporting by Enterprises Involved withVariable Interest Entities.” ASU 2009-17 amends the consolidation guidance applicable to variable interest entities (“VIEs”) and requires additional disclosuresconcerning an enterprise’s continuing involvement with VIEs. The Company evaluated the impact of this guidance and determined that the adoption resulted inthe January 1, 2010 consolidation of two additional joint ventures, an owner trust and an entity that was used to monetize accounts receivable. The Companyalso holds a variable interest in another joint venture accounted for under the equity method of accounting. The Company is not the primary beneficiary of thejoint venture and therefore is not required to consolidate this entity. See Notes B and S to the Consolidated Financial Statements.
61

Table of Contents
Guarantees arise during the ordinary course of business from relationships with customers and nonconsolidated affiliates when the Companyundertakes an obligation to guarantee the performance of others if specific triggering events occur. The Company had outstanding guarantees at December 31,2010 of $836 million, down from $1,053 million at December 31, 2009. The decrease in maximum future payments from year-end 2009 was due to theconsolidation of the Company’s variable interest in an owner trust in the first quarter of 2010, with the adoption of ASU 2009-17 (see Notes B and S to theConsolidated Financial Statements). Additional information related to these guarantees can be found in the “Guarantees” section of Note N to the ConsolidatedFinancial Statements.
See Note O to the Consolidated Financial Statements for information regarding the impact of adopting ASU 2009-16, “Transfers and Servicing(Topic 860): Accounting for Transfers of Financial Assets,” on January 1, 2010 and for additional information regarding the transfer of financial assets.
Fair Value MeasurementsThe Company’s assets and liabilities measured at fair value are classified in the fair value hierarchy (Level 1, 2 or 3) based on the inputs used for valuation.Assets and liabilities that are traded on an exchange with a quoted price are classified as Level 1. Assets and liabilities that are valued based on a bid or bidevaluation are classified as Level 2. The custodian of the Company’s debt and equity securities uses multiple industry-recognized vendors for pricinginformation and established processes for validation and verification to assist the Company in its process for determining and validating fair values for theseassets. For pension or other post retirement benefit plan assets classified as Level 3, the total fair value is based on significant unobservable inputs includingassumptions where there is little, if any, market activity for the investment. The sensitivity of fair value estimates is immaterial relative to the assets andliabilities measured at fair value, as well as to the total equity of the Company. See Note K to the Consolidated Financial Statements for the Company’sdisclosures about fair value measurements.
Portfolio managers and external investment managers regularly review all of the Company’s holdings to determine if any investments are other-than-temporarily impaired. The analysis includes reviewing the amount of the temporary impairment, as well as the length of time it has been impaired. In addition,specific guidelines for each instrument type are followed to determine if an other-than-temporary impairment has occurred. For debt securities, the credit ratingof the issuer, current credit rating trends and the trends of the issuer’s overall sector are considered in determining whether unrealized losses represent an other-than-temporary impairment. For equity securities, the Company’s investments are primarily in Standard & Poor’s (“S&P”) 500 companies; however, theCompany also allows investments in companies outside of the S&P 500. The Company considers the evidence to support the recovery of the cost basis of asecurity including volatility of the stock, the length of time the security has been in a loss position, value and growth expectations, and overall market andsector fundamentals, as well as technical analysis, in determining impairment. In 2010, other-than-temporary impairment write-downs were $5 million($93 million in 2009).
DividendsOn December 8, 2010, the Board of Directors declared a quarterly dividend of $0.15 per share, payable January 28, 2011, to stockholders of record onDecember 31, 2010. On February 9, 2011, the Board of Directors declared a quarterly dividend of $0.15 per share, payable April 29, 2011, to stockholdersof record on March 31, 2011. Since 1912, the Company has paid a cash dividend every quarter and, in each instance prior to February 12, 2009, hadmaintained or increased the amount of the dividend, adjusted for stock splits. During this 97-year period, Dow has increased the amount of the quarterlydividend 47 times (approximately 12 percent of the time), and maintained the amount of the quarterly dividend approximately 88 percent of the time. Thedividend was reduced in February 2009, for the first time in the 97-year period, due to uncertainty in the credit markets, unprecedented lower demand forchemical products and the ongoing global recession. The Company declared dividends of $0.60 per share in 2010, $0.60 per share in 2009 and $1.68 pershare in 2008.
On December 8, 2010, the Board of Directors declared a quarterly dividend of $85 million to Cumulative Convertible Perpetual Preferred Stock,Series A shareholders of record on December 15, 2010, which was paid on January 3, 2011. On February 9, 2011, the Board of Directors declared aquarterly dividend of $85 million to these shareholders, payable on April 1, 2011. Ongoing dividends related to Cumulative Convertible Perpetual PreferredStock, Series A will accrue at the rate of $85 million per quarter, and are payable quarterly subject to Board of Directors’ approval.
62

Table of Contents
Outlook for 2011In 2010, Dow and the chemical industry as a whole experienced another year of improving economic conditions. Economies across much of the developedworld showed signs of ongoing recovery in most end-markets as the year progressed. Meanwhile, the emerging geographies continued to lead in economicgrowth and, as a result, were a critical area of focus for new business opportunities and investments. As the year came to a close, however, some challengesremained, such as high unemployment in developed geographies and weakness in construction end-markets, particularly in the United States and Europe. Inthe face of these challenges, Dow delivered a reshaped and transformed business portfolio in 2010 - one that is increasingly targeted to growing geographicareas and end-markets, and well-balanced to mitigate uncertainties. Furthermore, the Company continued to emphasize its commitment to financial discipline,completing capital market transactions and divesting non-core assets to reduce financial expense and strengthen its balance sheet.
Looking to 2011, Dow expects growth in the emerging geographies to continue, driven by a broad range of leading end-markets. The Company projectsthat these geographic areas will continue their high rate of growth, although year-over-year comparisons will be subdued relative to recent years. Signs ofimprovement in industrial end-markets in North America and Europe, coupled with ongoing strength in higher-growth sectors such as electronics, agricultureand packaging, give Dow greater optimism that growth will continue in the developed geographies. Despite these more favorable business conditions, theCompany expects lingering challenges to remain, particularly slow employment growth in developed geographies. Furthermore, amid an environment ofimproving economic conditions, Dow expects feedstock and energy costs to remain at elevated levels, and volatility in these costs to continue. Within thechemical industry, the growing supply of natural gas liquids is expected to continue to benefit the competitiveness of U.S. chemical assets. Meanwhile, thestart-up of new ethylene capacity outside of the United States and Europe remains a challenge to supply fundamentals across the ethylene chain and could putdownward pressure on the profitability of higher-cost production assets within the industry.
The Company will continue to implement its strategic transformation while remaining focused on strengthening its balance sheet and preferentiallyinvesting in its Performance businesses and in emerging geographies. The Company’s plans do not assume an accelerated rebound in business conditions.Rather, Dow’s success will continue to be driven by its transformed business portfolio, balanced geographic presence, and continued investments ininnovations aimed at the intersection of greatest societal need and business opportunity.
The Company expects to generate positive cash flow from operations in 2011. Capital spending is expected to increase approximately $300 million from2010 levels. Research and development spending is projected to remain at approximately the same level as 2010. Equity in earnings of Dow’s nonconsolidatedaffiliates is expected to improve above pre-recession levels, driven by robust fundamentals at the Company’s principal joint ventures, particularly DowCorning, EQUATE and The Kuwait Olefins Company K.S.C.
OTHER MATTERSRecent Accounting GuidanceSee Note B to the Consolidated Financial Statements for a summary of recent accounting guidance.
Critical Accounting PoliciesThe preparation of financial statements and related disclosures in accordance with accounting principles generally accepted in the United States of America(“U.S. GAAP”) requires management to make judgments, assumptions and estimates that affect the amounts reported in the consolidated financial statementsand accompanying notes. Note A to the Consolidated Financial Statements describes the significant accounting policies and methods used in the preparation ofthe consolidated financial statements. Following are the Company’s critical accounting policies impacted by judgments, assumptions and estimates:
LitigationThe Company is subject to legal proceedings and claims arising out of the normal course of business. The Company routinely assesses the likelihood ofany adverse outcomes to these matters, as well as ranges of probable losses. A determination of the amount of the reserves required, if any, for thesecontingencies is made after thoughtful analysis of each known claim. Dow has an active risk management program consisting of numerous insurancepolicies secured from many carriers. These policies provide coverage that is utilized to minimize the financial impact, if any, of the legal proceedings.The required reserves may change in the future due to new developments in each matter. For further discussion, see Note N to the Consolidated FinancialStatements.
63

Table of Contents
Asbestos-Related Matters of Union Carbide CorporationUnion Carbide Corporation (“Union Carbide”), a wholly owned subsidiary of the Company, and a former Union Carbide subsidiary, AmchemProducts, Inc. (“Amchem”), are and have been involved in a large number of asbestos-related suits filed primarily in state courts during the past threedecades. Based on a study completed by Analysis, Research & Planning Corporation (“ARPC”) in January 2003, Union Carbide increased itsDecember 31, 2002 asbestos-related liability for pending and future claims for the 15-year period ending in 2017 to $2.2 billion, excluding futuredefense and processing costs. Union Carbide also increased the receivable for insurance recoveries related to its asbestos liability to $1.35 billion atDecember 31, 2002. Since then, Union Carbide has compared current asbestos claim and resolution activity to the results of the most recent ARPCstudy at each balance sheet date to determine whether the asbestos-related liability continues to be appropriate. In addition, Union Carbide has requestedARPC to review Union Carbide’s historical asbestos claim and resolution activity each November since 2004 to determine the appropriateness ofupdating the most recent ARPC study.
In November 2010, Union Carbide requested ARPC to review Union Carbide’s historical asbestos claim and resolution activity and determine theappropriateness of updating its then most recent study completed in December 2008. In response to that request, ARPC reviewed and analyzed datathrough October 31, 2010. The resulting study, completed by ARPC in December 2010, stated that the undiscounted cost of resolving pending andfuture asbestos-related claims against Union Carbide and Amchem, excluding future defense and processing costs, through 2025 was estimated to bebetween $744 million and $835 million. As in its earlier studies, ARPC provided estimates for a longer period of time in its December 2010 study, butalso reaffirmed its prior advice that forecasts for shorter periods of time are more accurate than those for longer periods of time.
In December 2010, based on ARPC’s December 2010 study and Union Carbide’s own review of asbestos claim and resolution activity, UnionCarbide decreased its asbestos-related liability for pending and future claims to $744 million. The reduction was $54 million and is shown as“Asbestos-related credits” in the consolidated statements of income. At December 31, 2010, the asbestos-related liability for pending and future claimswas $728 million.
Union Carbide’s receivable for insurance recoveries related to its asbestos liability was $50 million at December 31, 2010. At December 31, 2010,all of the receivable for insurance recoveries was related to insurers that are not signatories to the Wellington Agreement and/or do not otherwise haveagreements in place regarding their asbestos-related insurance coverage.
The amounts recorded by Union Carbide for the asbestos-related liability and related insurance receivable were based upon current, known facts.However, future events, such as the number of new claims to be filed and/or received each year, the average cost of disposing of each such claim,coverage issues among insurers, and the continuing solvency of various insurance companies, as well as the numerous uncertainties surroundingasbestos litigation in the United States, could cause the actual costs and insurance recoveries for Union Carbide to be higher or lower than thoseprojected or those recorded.
For additional information, see Legal Proceedings, Asbestos-Related Matters of Union Carbide Corporation in Management’s Discussion andAnalysis of Financial Condition and Results of Operations, and Note N to the Consolidated Financial Statements.
Environmental MattersThe Company determines the costs of environmental remediation of its facilities and formerly owned facilities based on evaluations of current law andexisting technologies. Inherent uncertainties exist in such evaluations primarily due to unknown environmental conditions, changing governmentalregulations and legal standards regarding liability, and emerging remediation technologies. The recorded liabilities are adjusted periodically asremediation efforts progress, or as additional technical or legal information becomes available. In the case of landfills and other active waste managementfacilities, Dow recognizes the costs over the useful life of the facility. At December 31, 2010, the Company had accrued obligations of $607 million forprobable environmental remediation and restoration costs, including $59 million for the remediation of Superfund sites. This is management’s bestestimate of the costs for remediation and restoration with respect to environmental matters for which the Company has accrued liabilities, although theultimate cost with respect to these particular matters could range up to approximately twice that amount. The Company had accrued obligations of
64

Table of Contents
$619 million at December 31, 2009 for probable environmental remediation and restoration costs, including $80 million for the remediation ofSuperfund sites. For further discussion, see Environmental Matters in Management’s Discussion and Analysis of Financial Condition and Results ofOperations and Notes A and N to the Consolidated Financial Statements.
GoodwillThe Company assesses goodwill recoverability through business financial performance reviews, enterprise valuation analysis, and impairment tests.
Annual goodwill impairment tests are completed during the Company’s fourth quarter of the year in accordance with the subsequent measurementprovisions of the accounting guidance for goodwill. The tests are performed at the reporting unit level which is defined as one level below operatingsegment with the exception of Health and Agricultural Sciences, which is both an operating segment and a reporting unit. Reporting units are the level atwhich discrete financial information is available and reviewed by business management on a regular basis. The Company has defined eight operatingsegments and 29 reporting units. Goodwill is carried by 17 of the Company’s 29 reporting units.
In addition to the annual goodwill impairment tests, the Company reviews the financial performance of its reporting units over the course of theyear to assess whether circumstances have changed that would more likely than not indicate that the fair value of a reporting unit has declined below itscarrying value. In cases where an indication of impairment is determined to exist, the Company completes an interim goodwill impairment testspecifically for that reporting unit.
The Company utilizes a discounted cash flow methodology to calculate the fair value of its reporting units. This valuation technique has beenselected by management as the most meaningful valuation method due to the limited number of market comparables for the Company’s reporting units.However, where market comparables are available, the Company includes EBIT/EBITDA multiples as part of the reporting unit valuation analysis.
The discounted cash flow valuations are completed with the use of key assumptions, including projected revenue growth rate, discount rate, taxrate, currency exchange rates, terminal value, and long-term hydrocarbons and energy prices. These key assumptions are reevaluated with each annualimpairment test and updated based on current facts and circumstances. Currency exchange rates, and long-term hydrocarbons and energy prices areestablished for the Company as a whole and applied consistently to all reporting units, while tax rates, revenue growth rates, terminal values (calculatedusing the key value driver implementation of the Gordon growth model), and discount rates are established by reporting unit to account for differencesin business fundamentals and industry risk.
For the 2010 annual impairment test, currency exchange rates were projected by year for 66 currencies, and long-term hydrocarbons and energyprices were forecast by geographic area by year and included all key feedstocks as well as natural gas and crude oil (due to the correlation to naphtha).Tax rates varied by reporting unit with the average rate being 27 percent. Discount rates ranged from 8.1 percent to 10.5 percent based on an assessmentof likely market participants and relative industry risk of each reporting unit. Terminal values were differentiated based on the cash flow projections ofeach reporting unit and the projected Net Operating Profit After Tax (“NOPAT”) growth rate, which ranged from negative 2.2 percent to positive4.5 percent. Revenue growth rates, or Compounded Annual Growth Rates (“CAGR”) over a ten-year cash flow forecast period, varied by reporting unitbased on underlying business fundamentals and future expectations with rates ranging from 1 percent to 15 percent.
Changes in key assumptions can affect the results of goodwill impairment tests. The changes made to key assumptions in 2010 did not result in asignificant change in the impairment analysis conclusion. The key assumptions with the most significant impact on reporting unit fair valuecalculations include the discount rate and terminal value NOPAT growth rate. For the 2010 impairment test, management completed sensitivity analyseson both of these key assumptions. An increase of 100 basis points in the discount rate would have resulted in a fair value, based on discounted cashflows, which exceeded the carrying value for all of the Company’s reporting units that carry goodwill. For the terminal value NOPAT growth rate, adecrease of 100 basis points would have resulted in a fair value, based on discounted cash flows, which exceeded the carrying value for all of theCompany’s reporting units that carry goodwill. Additional sensitivity analysis was completed on the combined impact of a 100 basis point increase inthe discount rate and a 100 basis point decrease in the terminal value NOPAT growth rate. This analysis resulted in fair values, based on discountedcash flows, that exceeded carrying values for all reporting units that carry goodwill.
6 5

Table of Contents
In completing the annual impairment test for 2010, management evaluated the reasonableness of differences noted between the fair value andcarrying value of each reporting unit. All differences were determined to be reasonable.
Based on the fair value analysis completed by the Company in the fourth quarter of 2010, using the key assumptions defined for the Company aswell as the key assumptions defined specifically for each reporting unit, management concluded that fair value exceeded carrying value for all reportingunits that carry goodwill.
The same analysis was completed by the Company in the fourth quarter of 2009 and management concluded that the fair value exceeded carryingvalue for all reporting units that carry goodwill except the Dow Haltermann reporting unit. As a result, the Company recorded a goodwill impairmentcharge of $7 million in the fourth quarter of 2009, which represented the total amount of goodwill carried by the Dow Haltermann reporting unit. Due tothe conclusion that the goodwill associated with the Dow Haltermann reporting unit was impaired, management also initiated a review of the underlyingassets of the reporting unit to assess whether or not any additional asset impairment existed. Based on the undiscounted cash flow analysis completed inaccordance with ASC Topic 360, “Property, Plant, and Equipment,” no further impairment existed.
The Company also monitors and evaluates its market capitalization relative to book value. When the market capitalization of the Company fallsbelow book value, management undertakes a process to evaluate whether a change in circumstances has occurred that would indicate it is more likelythan not that the fair value of any of its reporting units has declined below carrying value. This evaluation process includes the use of third-partymarket-based valuations and internal discounted cash flow analysis. As part of the annual goodwill impairment test, the Company also comparesmarket capitalization with the total estimated fair value of its reporting units to ensure that significant differences are understood. At December 31, 2010and December 31, 2009, Dow’s market capitalization exceeded book value.
Pension and Other Postretirement BenefitsThe amounts recognized in the consolidated financial statements related to pension and other postretirement benefits are determined from actuarialvaluations. Inherent in these valuations are assumptions including expected return on plan assets, discount rates at which the liabilities could have beensettled at December 31, 2010, rate of increase in future compensation levels, mortality rates and health care cost trend rates. These assumptions areupdated annually and are disclosed in Note Q to the Consolidated Financial Statements. In accordance with U.S. GAAP, actual results that differ fromthe assumptions are accumulated and amortized over future periods and, therefore, affect expense recognized and obligations recorded in future periods.The U.S. pension plans represent approximately 71 percent of the Company’s pension plan assets and 72 percent of the pension obligations.
The following information relates to the U.S. plans only; a similar approach is used for the Company’s non-U.S. plans.
The Company determines the expected long-term rate of return on assets by performing a detailed analysis of historical and expected returns basedon the strategic asset allocation approved by the Board of Directors and the underlying return fundamentals of each asset class. The Company’shistorical experience with the pension fund asset performance is also considered. The expected return of each asset class is derived from a forecastedfuture return confirmed by historical experience. The expected long-term rate of return is an assumption and not what is expected to be earned in any oneparticular year. The weighted-average long-term rate of return assumption used for determining net periodic pension expense for 2010 was 8.16 percent.This assumption was unchanged for determining 2011 net periodic pension expense. Future actual pension expense will depend on future investmentperformance, changes in future discount rates and various other factors related to the population of participants in the Company’s pension plans.
The discount rates utilized to measure the pension and other postretirement obligations of the U.S. qualified plans are based on the yield on high-quality fixed income instruments at the measurement date. Future expected actuarially determined cash flows of Dow’s major U.S. plans are matchedagainst the Towers Watson RATE:Link yield curve (based on 60th to 90th percentile bond yields) to arrive at a single discount rate by plan. Theweighted average discount rate was 5.51 percent at December 31, 2010 and 5.97 percent at December 31, 2009.
6 6

Table of Contents
At December 31, 2010, the U.S. qualified plans were underfunded on a projected benefit obligation basis by $3.3 billion. The underfundedamount increased by approximately $100 million compared with December 31, 2009. The increase was primarily due to lower discount rates partiallyoffset by favorable plan asset returns and contributions during the year. The Company contributed $435 million to the U.S. qualified plans in 2010.
The assumption for the long-term rate of increase in compensation levels for the principal U.S. qualified plans was 4.50 percent. Since 2002, theCompany has used a generational mortality table to determine the duration of its pension and other postretirement obligations.
The following discussion relates to all of the Company’s pension plans.
The Company bases the determination of pension expense or income on a market-related valuation of plan assets that reduces year-to-yearvolatility. This market-related valuation recognizes investment gains or losses over a five-year period from the year in which they occur. Investment gainsor losses for this purpose represent the difference between the expected return calculated using the market-related value of plan assets and the actualreturn based on the market value of plan assets. Since the market-related value of plan assets recognizes gains or losses over a five-year period, thefuture value of plan assets will be impacted when previously deferred gains or losses are recorded. Over the life of the plan, both gains and losses havebeen recognized and amortized. At December 31, 2010, net losses of $827 million remain to be recognized in the calculation of the market-related valueof plan assets. These net losses will result in increases in future pension expense as they are recognized in the market-related value of assets and are acomponent of the total net loss of $6,696 million for 2010 shown under “Pretax amounts recognized in AOCI at December 31” in the table entitled“Change in Projected Benefit Obligations, Plan Assets and Funded Status of All Significant Plans” included in Note Q to the Consolidated FinancialStatements. The other $5,869 million of net losses represents cumulative changes in plan experience and actuarial assumptions. The net decrease orincrease in the market-related value of assets due to the recognition of prior gains and losses is presented in the following table:
Net Decrease (Increase) in Market-Related Asset Value Due to Recognition of Prior Gains and Losses In millions 2011 $ 5 6 6 2012 628 2013 (271) 2014 (96) Total $ 827
Based on the 2011 pension assumptions and the changes in the market-related value of assets due to the recognition of prior asset losses, theCompany expects net periodic benefit costs to increase by approximately $60 million for all pension and other postretirement benefits in 2011 comparedwith 2010.
A 25 basis point increase or decrease in the long-term return on assets assumption would change the Company’s total pension expense for 2011by approximately $41 million. A 25 basis point increase or decrease in the discount rate assumption would change the Company’s total pension expensefor 2011 by approximately $50 million. A 25 basis point change in the long-term return and discount rate assumptions would have an immaterialimpact on the other postretirement benefit expense for 2011.
Income TaxesDeferred tax assets and liabilities are determined based on temporary differences between the financial reporting and tax bases of assets and liabilities,applying enacted tax rates expected to be in effect for the year in which the differences are expected to reverse. Based on the evaluation of availableevidence, both positive and negative, the Company recognizes future tax benefits, such as net operating loss carryforwards and tax creditcarryforwards, to the extent that realizing these benefits is considered to be more likely than not.
At December 31, 2010, the Company had a net deferred tax asset balance of $1,290 million, after valuation allowances of $682 million.
67

Table of Contents
In evaluating the ability to realize the deferred tax assets, the Company relies on, in order of increasing subjectivity, taxable income in priorcarryback years, the future reversals of existing taxable temporary differences, tax planning strategies and forecasted taxable income using historical andprojected future operating results.
At December 31, 2010, the Company had deferred tax assets for tax loss and tax credit carryforwards of $1,957 million, $62 million of whichis subject to expiration in the years 2011-2015. In order to realize these deferred tax assets for tax loss and tax credit carryforwards, the Company needstaxable income of approximately $6,790 million across multiple jurisdictions. The taxable income needed to realize the deferred tax assets for tax lossand tax credit carryforwards that are subject to expiration between 2011-2015 is approximately $469 million.
The Company recognizes the financial statement effects of an uncertain income tax position when it is more likely than not, based on technicalmerits, that the position will be sustained upon examination. At December 31, 2010, the Company had uncertain tax positions for both domestic andforeign issues of $319 million.
The Company accrues for non-income tax contingencies when it is probable that a liability to a taxing authority has been incurred and the amountof the contingency can be reasonably estimated. At December 31, 2010, the Company had a non-income tax contingency reserve for both domestic andforeign issues of $156 million.
For additional information, see Notes A and Y to the Consolidated Financial Statements.
Environmental MattersEnvironmental PoliciesDow is committed to world-class environmental, health and safety (“EH&S”) performance, as demonstrated by industry-leading performance, a long-standingcommitment to Responsible Care , and a strong commitment to achieve the Company’s 2015 Sustainability Goals – goals that set the standard forsustainability in the chemical industry by focusing on improvements in Dow’s local corporate citizenship and product stewardship, and by actively pursuingmethods to reduce the Company’s environmental impact.
To meet the Company’s public commitments, as well as the stringent laws and government regulations related to environmental protection andremediation to which its global operations are subject, Dow has well-defined policies, requirements and management systems. Dow’s EH&S ManagementSystem (“EMS”) defines the “who, what, when and how” needed for the businesses to achieve the Company’s policies, requirements, performance objectives,leadership expectations and public commitments. To ensure effective utilization, the EMS is integrated into a company-wide management system for EH&S,Operations, Quality and Human Resources.
It is Dow’s policy to adhere to a waste management hierarchy that minimizes the impact of wastes and emissions on the environment. First, Dow worksto eliminate or minimize the generation of waste and emissions at the source through research, process design, plant operations and maintenance. Second, Dowfinds ways to reuse and recycle materials. Finally, unusable or non-recyclable hazardous waste is treated before disposal to eliminate or reduce the hazardousnature and volume of the waste. Treatment may include destruction by chemical, physical, biological or thermal means. Disposal of waste materials inlandfills is considered only after all other options have been thoroughly evaluated. Dow has specific requirements for waste that is transferred to non-Dowfacilities, including the periodic auditing of these facilities.
Dow believes third-party verification and transparent public reporting are cornerstones of world-class EH&S performance and building public trust. Assuch, numerous Dow sites in Europe, Latin America, Asia Pacific and North America have received third-party verification of Dow’s compliance withResponsible Care and with outside specifications such as ISO-14001. Dow continues to be a global champion of Responsible Care and has worked tobroaden the application and impact of Responsible Care around the world through engagement with suppliers, customers and joint venture partners.
68
®
® ®
®

Table of Contents
Dow’s EH&S policies helped the Company achieve excellent EH&S performance in 2010. In recognition, the Company was presented the esteemedNational Safety Council’s Robert W. Campbell Award for 2010. Dow’s injury/illness rates and process safety performance were excellent in 2010, and theCompany is favorably positioned to achieve its 2015 sustainability goals in these key areas. Further improvement in these areas, as well as environmentalcompliance, remains a top management priority, with initiatives underway to further improve performance and compliance in 2011.
Detailed information on Dow’s performance regarding environmental matters and goals can be found online on Dow’s Sustainability webpage atwww.dow.com.
Chemical SecurityPublic and political attention continues to be placed on the protection of critical infrastructure, including the chemical industry, from security threats. Terroristattacks and natural disasters have increased concern about the security and safety of chemical production and distribution. Many, including Dow and theAmerican Chemistry Council, have called for uniform risk-based and performance-based national standards for securing the U.S. chemical industry. TheMaritime Transportation Security Act (“MTSA”) of 2002 and its regulations further set forth risk-based and performance-based standards that must be met atU.S. Coast Guard-regulated facilities. U.S. Chemical Plant Security legislation was passed in 2006 and the Department of Homeland Security (“DHS”) isnow implementing the regulations known as the Chemical Facility Anti-Terrorism Standards. The Company is complying with the requirements of the RailTransportation Security Rule issued by the U.S. Transportation Security Administration (“TSA”). Dow continues to support uniform risk-based nationalstandards for securing the chemical industry.
The focus on security is not new to Dow. A comprehensive, multi-level security plan for the Company has been maintained since 1988. This plan,which has been activated in response to significant world and national events since then, is reviewed on an annual basis. Dow continues to improve itssecurity plans, placing emphasis on the safety of Dow communities and people by being prepared to meet risks at any level and to address both internal andexternal identifiable risks. The security plan includes regular vulnerability assessments, security audits, mitigation efforts and physical security upgradesdesigned to reduce vulnerability. Dow’s security plans also are developed to avert interruptions of normal business work operations that could materially andadversely affect the Company’s results of operations, liquidity and financial condition.
Dow played a key role in the development and implementation of the American Chemistry Council’s Responsible Care Security Code, which requiresthat all aspects of security – including facility, transportation and cyberspace – be assessed and gaps addressed. Through the Company’s globalimplementation of the Security Code, Dow has permanently heightened the level of security – not just in the United States, but worldwide. Dow employsseveral hundred employees and contractors in its Emergency Services and Security department worldwide.
Through the implementation of the Security Code, including voluntary security enhancements and upgrades made since 2002, Dow is well-positioned tocomply with the new U.S. chemical facility regulations and other regulatory security frameworks. In addition, Dow was the first chemical company to receivecoverage under the Support Anti-terrorism by Fostering Effective Technologies Act (“SAFETY Act”) from the DHS in 2007 for the Company’s MTSAregulated sites, and the first to receive coverage under SAFETY Act in 2008 for the Company’s Rail Transportation Security Services. This unprecedentedcertification helps validate Dow’s efforts and provides additional liability coverage in the event of a terrorist attack.
Dow continues to work collaboratively across the supply chain on Responsible Care , Supply Chain Design, Emergency Preparedness, ShipmentVisibility and transportation of hazardous materials. Dow is cooperating with public and private entities to lead the implementation of advanced tank cardesign, and track and trace technologies. Further, Dow’s Distribution Risk Review process that has been in place for decades was expanded to addresspotential threats in all modes of transportation across the Company’s supply chain. To reduce vulnerabilities, Dow maintains security measures that meet orexceed regulatory and industry security standards in all areas in which the Company operates.
Dow continually works to strengthen partnerships with local responders, law enforcement and security agencies, and to enhance confidence in theintegrity of the Company’s security and risk management program, as well as strengthen its preparedness and response capabilities. Dow also works closelywith its supply chain partners and strives to educate lawmakers, regulators and communities about the Company’s resolve and actions to date that mitigatesecurity and crisis threats.
6 9
®
®

Table of Contents
Climate ChangeDow is committed to reducing its greenhouse gas (“GHG”) intensity (pounds of GHG per pound of product), developing climate-friendly products andprocesses and, over the longer term, implementing technology solutions to achieve even greater climate change improvements. Since 1990, Dow has reduced itsabsolute GHG emissions by more than 20 percent, a more rapid reduction than required by Kyoto Protocol targets. Since 1994, Dow has achieved a22 percent improvement in energy intensity (the amount of energy required to produce one pound of product). In doing so, it has avoided consuming more than1,700 trillion Btus, a savings that when converted to electricity would more than supply the residential electrical energy needs of California for one year.Through its energy savings, Dow has prevented approximately 90 million metric tons of carbon dioxide from entering the atmosphere. This trend couldchange, depending on business growth, capacity utilization and the pace of new technology development.
Dow, through its science and technology capabilities, is committed to bringing solutions to the challenge of climate change by producing products thathelp others reduce GHG emissions, such as lightweight plastics for automobiles and insulation for energy efficient homes and appliances. For example, Dow’sbuilding insulation materials and air-sealing products can save up to 20 percent on heating and cooling costs and significantly reduce GHG emissions. TheCompany’s STYROFOAM™ insulation is installed in over 20 million buildings worldwide, saving over $10 billion in energy costs annually. Dow’sDOWTHERM™ A heat transfer fluids are used in 14 large concentrating solar power plants, with a total capacity of over 700 megawatts. These plants willprovide power for the equivalent of approximately 415,000 homes and save 1.6 million metric tons of carbon dioxide emissions per year.
Gains made toward Dow’s Energy Efficiency goal will directly impact progress in reducing GHG intensity. Dow is studying the life cycle impact of itsproducts on climate change and additional global projects that could offset the Company’s overall GHG emissions through carbon dioxide reduction. Althoughthe Company has some units subject to the European Union’s Emissions Trading Scheme (“EU ETS”), the Company has not experienced any considerableimpact in regard to regulated GHG emissions from the EU ETS. Dow will continue to evaluate and monitor future developments that may affect operations inthe region.
Dow’s Energy & Climate Change Policy and Issue Management Team is tasked with developing and implementing a comprehensive strategy thataddresses the challenges of climate change and energy security and is advocating an international framework that establishes clear pathways to help slow, stopand reverse the rate of GHG emissions globally.
Environmental RemediationDow accrues the costs of remediation of its facilities and formerly owned facilities based on current law and existing technologies. The nature of suchremediation includes, for example, the management of soil and groundwater contamination and the closure of contaminated landfills and other wastemanagement facilities. In the case of landfills and other active waste management facilities, Dow recognizes the costs over the useful life of the facility. Theaccounting policies adopted to properly reflect the monetary impacts of environmental matters are discussed in Note A to the Consolidated FinancialStatements. To assess the impact on the financial statements, environmental experts review currently available facts to evaluate the probability and scope ofpotential liabilities. Inherent uncertainties exist in such evaluations primarily due to unknown environmental conditions, changing governmental regulationsand legal standards regarding liability, and emerging remediation technologies. These liabilities are adjusted periodically as remediation efforts progress or asadditional technical or legal information becomes available. Dow had an accrued liability of $548 million at December 31, 2010, related to the remediation ofcurrent or former Dow-owned sites. At December 31, 2009, the liability related to remediation was $539 million.
In addition to current and former Dow-owned sites, under the Federal Comprehensive Environmental Response, Compensation and Liability Act andequivalent state laws (hereafter referred to collectively as “Superfund Law”), Dow is liable for remediation of other hazardous waste sites where Dow allegedlydisposed of, or arranged for the treatment or disposal of, hazardous substances. Because Superfund Law imposes joint and several liability upon each partyat a site, Dow has evaluated its potential liability in light of the number of other companies that also have been named potentially responsible parties (“PRPs”)at each site, the estimated apportionment of costs among all PRPs, and the financial ability and commitment of each to pay its expected share. The Company’sremaining liability for the remediation of Superfund sites was $59 million at December 31, 2010 ($80 million at December 31, 2009). The Company has notrecorded any third-party recovery related to these sites as a receivable.
70

Table of Contents
Information regarding environmental sites is provided below: Environmental Sites Dow-owned Sites (1) Superfund Sites (2) 2010 2009 2010 2009 Number of sites at January 1 291 252 124 85 Sites acquired from Rohm and Haas - 42 - 39 Sites added during year 2 2 3 6 Sites closed during year (4) (5) (7) (6) Number of sites at December 31 289 291 120 124
(1) Dow-owned sites are sites currently or formerly owned by Dow, where remediation obligations are imposed in theUnited States by the Resource Conservation Recovery Act or analogous state law. 152 of these sites were formerlyowned by Dowell Schlumberger, Inc., a group of companies in which the Company previously owned a 50-percentinterest. Dow sold its interest in Dowell Schlumberger in 1992.
(2) Superfund sites are sites, including sites not owned by Dow, where remediation obligations are imposed by SuperfundLaw.
Additional information is provided below for the Company’s manufacturing sites in Freeport, Texas; Midland, Michigan; and Philadelphia,Pennsylvania, the sites for which the Company has the largest environmental remediation accruals; as well as a Superfund site in Wood-Ridge, New Jersey.
From the start of operations at the Freeport site in the 1940s until the mid-1970s, manufacturing wastes were typically placed in on-site pits andlandfills. The resulting soil and groundwater contamination is being assessed and remediated under the provisions of the Resource Conservation Recovery Act(“RCRA”), in concert with the state of Texas. At December 31, 2010, the Company had an accrual of $28 million ($29 million at December 31, 2009) relatedto environmental remediation at the Freeport manufacturing site. In 2010, $3 million ($3 million in 2009) was spent on environmental remediation at theFreeport site.
Similar to the Freeport site, in the early days of operations at the Midland site, manufacturing wastes were usually disposed of on-site, resulting in soiland groundwater contamination, which has been contained and managed on-site under a series of RCRA permits and regulatory agreements . The most recentHazardous Waste Operating License for the Midland site, issued in 2003, also included provisions for the Company to conduct an investigation to determinethe nature and extent of off-site contamination from historic Midland site operations. The scope of the investigation includes Midland area soils; theTittabawassee and Saginaw River sediment and floodplain soils; and Saginaw Bay, and requires the Company to conduct interim response actions. InJanuary 2010, the Company entered into a Federal Comprehensive Environmental Response, Compensation, and Liability Act Administrative Order onConsent to perform a Remedial Investigation, Feasibility Study and Remedial Design for the Tittabawassee and Saginaw River sediment and floodplain soils,and Saginaw Bay. See Note N to the Consolidated Financial Statements for additional information. At December 31, 2010, the Company had an accrual of$71 million ($64 million at December 31, 2009) for environmental remediation and investigation associated with the Midland site. In 2010, the Companyspent $16 million ($19 million in 2009) on environmental remediation at the Midland site.
On April 1, 2009, the Company acquired Rohm and Haas’ Philadelphia Plant, which has been an industrial site since the early 1700s, and since the1920s used by Rohm and Haas for the manufacture of a wide range of chemical products. Chemical disposal practices in the early years resulted in soil andgroundwater contamination at the site and in the sediments of the adjacent Frankford Inlet. The site has undergone a number of investigations and interimcleanup measures under the RCRA Corrective Action Program, and in 2009, was transferred to the regulatory management of the Pennsylvania One CleanupProgram. At December 31, 2010, the Company had an accrual of $56 million ($58 million at December 31, 2009) for environmental remediation at thePhiladelphia Plant. In 2010, the Company spent $1 million ($1 million in 2009, following the April 1, 2009 acquisition) on environmental remediation at thePhiladelphia Plant.
Rohm and Haas is a lead PRP at the Wood-Ridge, New Jersey Ventron/Velsicol Superfund Site, and the adjacent Berry’s Creek Study Area. Rohm andHaas is a successor in interest to a company that owned and operated a mercury processing facility, where wastewater and waste handling resulted incontamination of soils and adjacent creek sediments. The Ventron/Velsicol site is currently undergoing remediation. The Berry’s Creek Study Area is under thepreliminary remedial investigation phase and the PRP group is conducting an investigation of sediment contamination in Berry’s Creek. Sediment removal wasundertaken by the PRP group in 2009 in connection with an unrelated project to replace a flood control tidegate
71
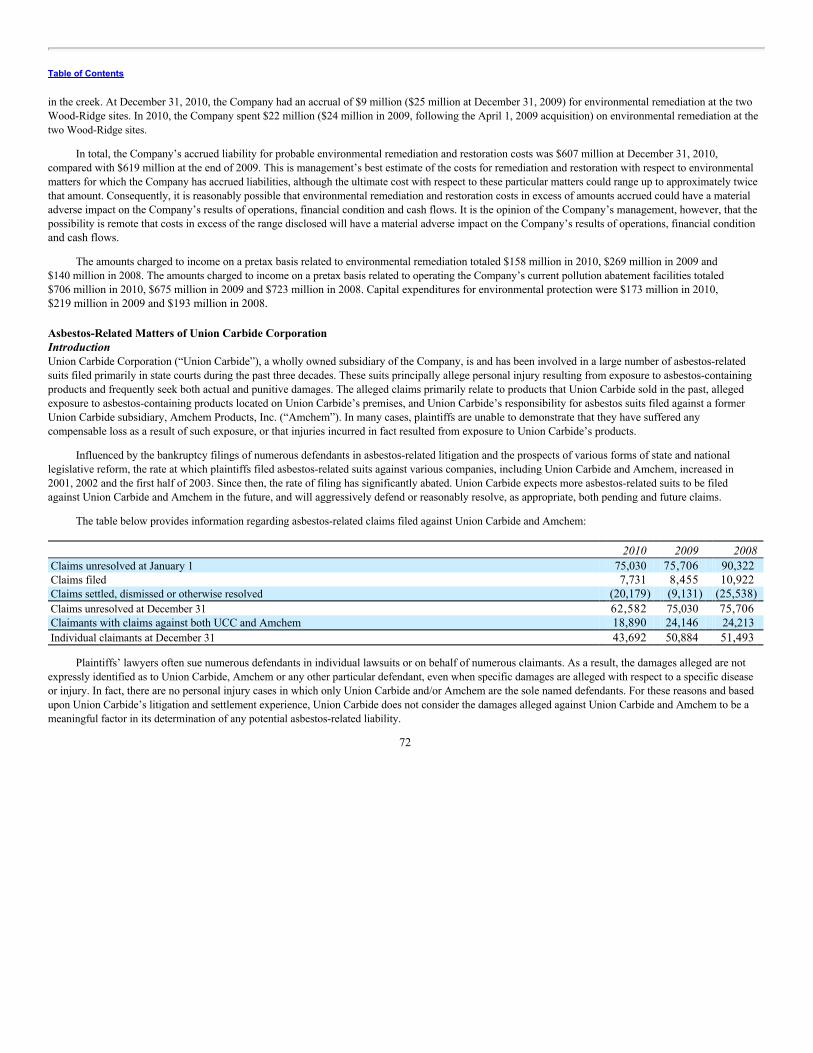
Table of Contents
in the creek. At December 31, 2010, the Company had an accrual of $9 million ($25 million at December 31, 2009) for environmental remediation at the twoWood-Ridge sites. In 2010, the Company spent $22 million ($24 million in 2009, following the April 1, 2009 acquisition) on environmental remediation at thetwo Wood-Ridge sites.
In total, the Company’s accrued liability for probable environmental remediation and restoration costs was $607 million at December 31, 2010,compared with $619 million at the end of 2009. This is management’s best estimate of the costs for remediation and restoration with respect to environmentalmatters for which the Company has accrued liabilities, although the ultimate cost with respect to these particular matters could range up to approximately twicethat amount. Consequently, it is reasonably possible that environmental remediation and restoration costs in excess of amounts accrued could have a materialadverse impact on the Company’s results of operations, financial condition and cash flows. It is the opinion of the Company’s management, however, that thepossibility is remote that costs in excess of the range disclosed will have a material adverse impact on the Company’s results of operations, financial conditionand cash flows.
The amounts charged to income on a pretax basis related to environmental remediation totaled $158 million in 2010, $269 million in 2009 and$140 million in 2008. The amounts charged to income on a pretax basis related to operating the Company’s current pollution abatement facilities totaled$706 million in 2010, $675 million in 2009 and $723 million in 2008. Capital expenditures for environmental protection were $173 million in 2010,$219 million in 2009 and $193 million in 2008.
Asbestos-Related Matters of Union Carbide CorporationIntroductionUnion Carbide Corporation (“Union Carbide”), a wholly owned subsidiary of the Company, is and has been involved in a large number of asbestos-relatedsuits filed primarily in state courts during the past three decades. These suits principally allege personal injury resulting from exposure to asbestos-containingproducts and frequently seek both actual and punitive damages. The alleged claims primarily relate to products that Union Carbide sold in the past, allegedexposure to asbestos-containing products located on Union Carbide’s premises, and Union Carbide’s responsibility for asbestos suits filed against a formerUnion Carbide subsidiary, Amchem Products, Inc. (“Amchem”). In many cases, plaintiffs are unable to demonstrate that they have suffered anycompensable loss as a result of such exposure, or that injuries incurred in fact resulted from exposure to Union Carbide’s products.
Influenced by the bankruptcy filings of numerous defendants in asbestos-related litigation and the prospects of various forms of state and nationallegislative reform, the rate at which plaintiffs filed asbestos-related suits against various companies, including Union Carbide and Amchem, increased in2001, 2002 and the first half of 2003. Since then, the rate of filing has significantly abated. Union Carbide expects more asbestos-related suits to be filedagainst Union Carbide and Amchem in the future, and will aggressively defend or reasonably resolve, as appropriate, both pending and future claims.
The table below provides information regarding asbestos-related claims filed against Union Carbide and Amchem: 2010 2009 2008 Claims unresolved at January 1 75,030 75,706 90,322 Claims filed 7,731 8,455 10,922 Claims settled, dismissed or otherwise resolved (20,179) (9,131) (25,538) Claims unresolved at December 31 62,582 75,030 75,706 Claimants with claims against both UCC and Amchem 18,890 24,146 24,213 Individual claimants at December 31 43,692 50,884 51,493
Plaintiffs’ lawyers often sue numerous defendants in individual lawsuits or on behalf of numerous claimants. As a result, the damages alleged are notexpressly identified as to Union Carbide, Amchem or any other particular defendant, even when specific damages are alleged with respect to a specific diseaseor injury. In fact, there are no personal injury cases in which only Union Carbide and/or Amchem are the sole named defendants. For these reasons and basedupon Union Carbide’s litigation and settlement experience, Union Carbide does not consider the damages alleged against Union Carbide and Amchem to be ameaningful factor in its determination of any potential asbestos-related liability.
72

Table of Contents
Estimating the LiabilityBased on a study completed by Analysis, Research & Planning Corporation (“ARPC”) in January 2003, Union Carbide increased its December 31, 2002asbestos-related liability for pending and future claims for the 15-year period ending in 2017 to $2.2 billion, excluding future defense and processing costs.Since then, Union Carbide has compared current asbestos claim and resolution activity to the results of the most recent ARPC study at each balance sheet dateto determine whether the accrual continues to be appropriate. In addition, Union Carbide has requested ARPC to review Union Carbide’s historical asbestosclaim and resolution activity each November since 2004 to determine the appropriateness of updating the most recent ARPC study.
In November 2008, Union Carbide requested ARPC to review Union Carbide’s historical asbestos claim and resolution activity and determine theappropriateness of updating its then most recent study completed in December 2006. In response to that request, ARPC reviewed and analyzed data throughOctober 31, 2008. The resulting study, completed by ARPC in December 2008, stated that the undiscounted cost of resolving pending and future asbestos-related claims against Union Carbide and Amchem, excluding future defense and processing costs, through 2023 was estimated to be between $952 millionand $1.2 billion. As in its earlier studies, ARPC provided estimates for a longer period of time in its December 2008 study, but also reaffirmed its prior advicethat forecasts for shorter periods of time are more accurate than those for longer periods of time.
In December 2008, based on ARPC’s December 2008 study and Union Carbide’s own review of the asbestos claim and resolution activity, UnionCarbide decreased its asbestos-related liability for pending and future claims to $952 million, which covered the 15-year period ending 2023, excluding futuredefense and processing costs. The reduction was $54 million and is shown as “Asbestos-related credits” in the consolidated statements of income. AtDecember 31, 2008, the asbestos-related liability for pending and future claims was $934 million.
In November 2009, Union Carbide requested ARPC to review Union Carbide’s 2009 asbestos claim and resolution activity and determine theappropriateness of updating its December 2008 study. In response to that request, ARPC reviewed and analyzed data through October 31, 2009. In December2009, ARPC stated that an update of its study would not provide a more likely estimate of future events than the estimate reflected in its study of the previousyear and, therefore, the estimate in that study remained applicable. Based on Union Carbide’s own review of the asbestos claim and resolution activity andARPC’s response, Union Carbide determined that no change to the accrual was required. At December 31, 2009, Union Carbide’s asbestos-related liability forpending and future claims was $839 million.
In November 2010, Union Carbide requested ARPC to review Union Carbide’s historical asbestos claim and resolution activity and determine theappropriateness of updating its December 2008 study. In response to that request, ARPC reviewed and analyzed data through October 31, 2010. The resultingstudy, completed by ARPC in December 2010, stated that the undiscounted cost of resolving pending and future asbestos-related claims against UnionCarbide and Amchem, excluding future defense and processing costs, through 2025 was estimated to be between $744 million and $835 million. As in itsearlier studies, ARPC provided estimates for a longer period of time in its December 2010 study, but also reaffirmed its prior advice that forecasts for shorterperiods of time are more accurate than those for longer periods of time.
In December 2010, based on ARPC’s December 2010 study and Union Carbide’s own review of the asbestos claim and resolution activity, UnionCarbide decreased its asbestos-related liability for pending and future claims to $744 million, which covered the 15-year period ending 2025, excluding futuredefense and processing costs. The reduction was $54 million and was shown as “Asbestos-related credits” in the consolidated statements of income. AtDecember, 31, 2010, the asbestos-related liability for pending and future claims was $728 million.
At December 31, 2010, approximately 21 percent of the recorded liability related to pending claims and approximately 79 percent related to futureclaims. At December 31, 2009, approximately 23 percent of the recorded liability related to pending claims and approximately 77 percent related to futureclaims.
73

Table of Contents
Defense and Resolution CostsThe following table provides information regarding defense and resolution costs related to asbestos-related claims filed against Union Carbide and Amchem: Defense and Resolution Costs Aggregate Costs
In millions 2010 2009 2008
to Date as ofDec. 31, 2010
Defense costs $ 87 $ 62 $ 60 $ 774 Resolution costs $ 43 $ 94 $116 $ 1,523
The average resolution payment per asbestos claimant and the rate of new claim filings has fluctuated both up and down since the beginning of 2001.Union Carbide’s management expects such fluctuations to continue in the future based upon a number of factors, including the number and type of claimssettled in a particular period, the jurisdictions in which such claims arose, and the extent to which any proposed legislative reform related to asbestos litigationis being considered.
Union Carbide expenses defense costs as incurred. The pretax impact for defense and resolution costs, net of insurance, was $73 million in 2010,$58 million in 2009 and $53 million in 2008, and was reflected in “Cost of sales” in the consolidated statements of income.
Insurance ReceivablesAt December 31, 2002, Union Carbide increased the receivable for insurance recoveries related to its asbestos liability to $1.35 billion, substantiallyexhausting its asbestos product liability coverage. The insurance receivable related to the asbestos liability was determined by Union Carbide after a thoroughreview of applicable insurance policies and the 1985 Wellington Agreement, to which Union Carbide and many of its liability insurers are signatory parties,as well as other insurance settlements, with due consideration given to applicable deductibles, retentions and policy limits, and taking into account thesolvency and historical payment experience of various insurance carriers. The Wellington Agreement and other agreements with insurers are designed tofacilitate an orderly resolution and collection of Union Carbide’s insurance policies and to resolve issues that the insurance carriers may raise.
In September 2003, Union Carbide filed a comprehensive insurance coverage case, now proceeding in the Supreme Court of the State of New York,County of New York, seeking to confirm its rights to insurance for various asbestos claims and to facilitate an orderly and timely collection of insuranceproceeds (the “Insurance Litigation”). The Insurance Litigation was filed against insurers that are not signatories to the Wellington Agreement and/or do nototherwise have agreements in place with Union Carbide regarding their asbestos-related insurance coverage, in order to facilitate an orderly resolution andcollection of such insurance policies and to resolve issues that the insurance carriers may raise. Since the filing of the case, Union Carbide has reachedsettlements with several of the carriers involved in the Insurance Litigation, including settlements reached with two significant carriers in the fourth quarter of2009. The Insurance Litigation is ongoing.
Union Carbide’s receivable for insurance recoveries related to its asbestos liability was $50 million at December 31, 2010 and $84 million atDecember 31, 2009. At December 31, 2010 and December 31, 2009, all of the receivable for insurance recoveries was related to insurers that are not signatoriesto the Wellington Agreement and/or do not otherwise have agreements in place regarding their asbestos-related insurance coverage.
In addition to the receivable for insurance recoveries related to its asbestos liability, Union Carbide had receivables for defense and resolution costssubmitted to insurance carriers that have settlement agreements in place regarding their asbestos-related insurance coverage. The following table summarizesUnion Carbide’s receivables related to its asbestos-related liability: Receivables for Asbestos-Related Costs at December 31 In millions 2010 2009 Receivables for defense costs – carriers with settlement agreements $ 12 $ 91 Receivables for resolution costs – carriers with settlement agreements 236 357 Receivables for insurance recoveries – carriers without settlement agreements 50 84 Total $298 $532
74

Table of Contents
After a review of its insurance policies, with due consideration given to applicable deductibles, retentions and policy limits, after taking into account thesolvency and historical payment experience of various insurance carriers; existing insurance settlements; and the advice of outside counsel with respect to theapplicable insurance coverage law relating to the terms and conditions of its insurance policies, Union Carbide continues to believe that its recorded receivablefor insurance recoveries from all insurance carriers is probable of collection.
SummaryThe amounts recorded by Union Carbide for the asbestos-related liability and related insurance receivable described above were based upon current, knownfacts. However, future events, such as the number of new claims to be filed and/or received each year, the average cost of disposing of each such claim,coverage issues among insurers, and the continuing solvency of various insurance companies, as well as the numerous uncertainties surrounding asbestoslitigation in the United States, could cause the actual costs and insurance recoveries for Union Carbide to be higher or lower than those projected or thoserecorded.
Because of the uncertainties described above, Union Carbide’s management cannot estimate the full range of the cost of resolving pending and futureasbestos-related claims facing Union Carbide and Amchem. Union Carbide’s management believes that it is reasonably possible that the cost of disposing ofUnion Carbide’s asbestos-related claims, including future defense costs, could have a material adverse impact on Union Carbide’s results of operations andcash flows for a particular period and on the consolidated financial position of Union Carbide.
It is the opinion of Dow’s management that it is reasonably possible that the cost of Union Carbide disposing of its asbestos-related claims, includingfuture defense costs, could have a material adverse impact on the Company’s results of operations and cash flows for a particular period and on theconsolidated financial position of the Company.
Matters Involving the Formation of K-Dow PetrochemicalsIntroductionOn December 13, 2007, the Company and Petrochemical Industries Company (K.S.C.) (“PIC”) of Kuwait, a wholly owned subsidiary of Kuwait PetroleumCorporation (“KPC”), announced plans to form a 50:50 global petrochemicals joint venture. The proposed joint venture, K-Dow Petrochemicals (“K-Dow”),was expected to have revenues of more than $11 billion and employ more than 5,000 people worldwide.
On November 28, 2008, the Company entered into a Joint Venture Formation Agreement (the “JVFA”) with PIC that provided for the establishment of K-Dow. To form the joint venture, the Company would transfer by way of contribution and sale to K-Dow, assets used in the research, development,manufacture, distribution, marketing and sale of polyethylene, polypropylene, polycarbonate, polycarbonate compounds and blends, ethyleneamines,ethanolamines, and related licensing and catalyst technologies; and K-Dow would assume certain related liabilities. PIC would receive a 50-percent equityinterest in K-Dow in exchange for the payment by PIC of the initial purchase price, estimated to be $7.5 billion. The purchase price was subject to certainpost-closing adjustments.
Failure to CloseOn December 31, 2008, the Company received a written notice from PIC with respect to the JVFA advising the Company of PIC’s position that certainconditions to closing were not satisfied and, therefore, PIC was not obligated to close the transaction. On January 2, 2009, PIC refused to close the K-Dowtransaction in accordance with the JVFA. The Company disagrees with the characterizations and conclusions expressed by PIC in the written notice and theCompany has informed PIC that it breached the JVFA. On January 6, 2009, the Company announced that it would seek to fully enforce its rights under theterms of the JVFA and various related agreements.
ArbitrationThe Company’s claims against PIC are subject to an arbitration agreement between the parties, which provides for arbitration under the Rules of Arbitration ofthe International Chamber of Commerce. On February 18, 2009, the Company initiated arbitration proceedings against PIC alleging that PIC breached theJVFA by failing to close the transaction on January 2, 2009. The Company is seeking damages in excess of $2.5 billion in the arbitration proceeding.
75

Table of Contents
The Dow Chemical Company and SubsidiariesPART II, Item 7A. Quantitative and Qualitative Disclosures About Market Risk.
QUANTITATIVE AND QUALITATIVE DISCLOSURES ABOUT MARKET RISK
Dow’s business operations give rise to market risk exposure due to changes in foreign exchange rates, interest rates, commodity prices and other marketfactors such as equity prices. To manage such risks effectively, the Company enters into hedging transactions, pursuant to established guidelines andpolicies, which enable it to mitigate the adverse effects of financial market risk. Derivatives used for this purpose are designated as hedges per the accountingguidance related to derivatives and hedging activities, where appropriate. A secondary objective is to add value by creating additional non-specific exposurewithin established limits and policies; derivatives used for this purpose are not designated as hedges. The potential impact of creating such additionalexposures is not material to the Company’s results.
The global nature of Dow’s business requires active participation in the foreign exchange markets. As a result of investments, production facilities andother operations on a global basis, the Company has assets, liabilities and cash flows in currencies other than the U.S. dollar. The primary objective of theCompany’s foreign exchange risk management is to optimize the U.S. dollar value of net assets and cash flows, keeping the adverse impact of currencymovements to a minimum. To achieve this objective, the Company hedges on a net exposure basis using foreign currency forward contracts, over-the-counteroption contracts, cross-currency swaps, and nonderivative instruments in foreign currencies. Exposures primarily relate to assets, liabilities and bondsdenominated in foreign currencies, as well as economic exposure, which is derived from the risk that currency fluctuations could affect the dollar value offuture cash flows related to operating activities. The largest exposures are denominated in European currencies, the Japanese yen and the Canadian dollar,although exposures also exist in other currencies of Asia Pacific, Latin America, and India, Middle East and Africa.
The main objective of interest rate risk management is to reduce the total funding cost to the Company and to alter the interest rate exposure to the desiredrisk profile. Dow uses interest rate swaps, “swaptions,” and exchange-traded instruments to accomplish this objective. The Company’s primary exposure is tothe U.S. dollar yield curve.
Dow has a portfolio of equity securities derived primarily from the investment activities of its insurance subsidiaries. This exposure is managed in amanner consistent with the Company’s market risk policies and procedures.
Inherent in Dow’s business is exposure to price changes for several commodities. Some exposures can be hedged effectively through liquid tradablefinancial instruments. Feedstocks for ethylene production and natural gas constitute the main commodity exposures. Over-the-counter and exchange tradedinstruments are used to hedge these risks when feasible.
Dow uses value at risk (“VAR”), stress testing and scenario analysis for risk measurement and control purposes. VAR estimates the maximum potentialloss in fair market values, given a certain move in prices over a certain period of time, using specified confidence levels. The VAR methodology used by theCompany is a historical simulation model which captures co-movements in market rates across different instruments and market risk exposure categories.The historical simulation model uses a 97.5 percent confidence level and the historical scenario period includes at least six months of historical data. The2010 and 2009 year-end and average daily VAR for the aggregate of all positions are shown below. These amounts are immaterial relative to the total equity ofthe Company: Total Daily VAR at December 31 2010 2009 In millions Year-end Average Year-end Average Foreign exchange $ 1 $ 3 $ 1 $ 4 Interest rate $ 251 $ 211 $ 257 $ 250 Equities $ 15 $ 12 $ 9 $ 14 Commodities $ 1 $ 2 $ 7 $ 3 Composite $ 252 $ 218 $ 254 $ 251
The Company’s daily VAR for the aggregate of all positions decreased slightly from a composite VAR of $254 million at December 31, 2009 to acomposite of $252 million at December 31, 2010.
See Note J to the Consolidated Financial Statements for further disclosure regarding market risk.
76

Table of Contents
The Dow Chemical Company and SubsidiariesPART II, Item 8. Financial Statements and Supplementary Data.
Report of Independent Registered Public Accounting FirmTo the Board of Directors and Stockholders ofThe Dow Chemical Company:
We have audited the accompanying consolidated balance sheets of The Dow Chemical Company and subsidiaries (the “Company”) as of December 31, 2010and 2009, and the related consolidated statements of income, equity, comprehensive income and cash flows for each of the three years in the period endedDecember 31, 2010. Our audits also included the financial statement schedule listed in the Index at Item 15 (a) 2. These financial statements and financialstatement schedule are the responsibility of the Company’s management. Our responsibility is to express an opinion on the financial statements and financialstatement schedule based on our audits.
We conducted our audits in accordance with the standards of the Public Company Accounting Oversight Board (United States). Those standards require thatwe plan and perform the audit to obtain reasonable assurance about whether the financial statements are free of material misstatement. An audit includesexamining, on a test basis, evidence supporting the amounts and disclosures in the financial statements. An audit also includes assessing the accountingprinciples used and significant estimates made by management, as well as evaluating the overall financial statement presentation. We believe that our auditsprovide a reasonable basis for our opinion.
In our opinion, such consolidated financial statements present fairly, in all material respects, the financial position of The Dow Chemical Company andsubsidiaries at December 31, 2010 and 2009, and the results of their operations and their cash flows for each of the three years in the period endedDecember 31, 2010, in conformity with accounting principles generally accepted in the United States of America. Also, in our opinion, such financialstatement schedule, when considered in relation to the basic consolidated financial statements taken as a whole, presents fairly, in all material respects, theinformation set forth therein.
We have also audited, in accordance with the standards of the Public Company Accounting Oversight Board (United States), the Company’s internal controlover financial reporting as of December 31, 2010, based on the criteria established in Internal Control—Integrated Framework issued by the Committee ofSponsoring Organizations of the Treadway Commission and our report dated February 18, 2011 expressed an unqualified opinion on the Company’s internalcontrol over financial reporting.
/s/ DELOITTE & TOUCHE LLPDeloitte & Touche LLPMidland, MichiganFebruary 18, 2011
77

Table of Contents
The Dow Chemical Company and SubsidiariesConsolidated Statements of Income
(In millions, except per share amounts) For the years ended December 31 2010 2009 2008 Net Sales $ 53,674 $ 44,875 $57,361
Cost of sales 45,780 39,148 51,913 Research and development expenses 1,660 1,492 1,310 Selling, general and administrative expenses 2,609 2,487 1,966 Amortization of intangibles 509 399 92 Goodwill impairment losses - 7 239 Restructuring charges 26 689 839 Purchased in-process research and development charges - 7 44 Acquisition and integration related expenses 143 166 49 Asbestos-related credits 54 - 54 Equity in earnings of nonconsolidated affiliates 1,112 630 787 Sundry income - net 125 891 89 Interest income 37 39 86 Interest expense and amortization of debt discount 1,473 1,571 648
Income from Continuing Operations Before Income Taxes 2,802 469 1,277 Provision (Credit) for income taxes 481 (97) 651
Net Income from Continuing Operations 2,321 5 6 6 626 Income from discontinued operations, net of income taxes - 110 28
Net Income 2,321 676 654 Net income attributable to noncontrolling interests 11 28 75
Net Income Attributable to The Dow Chemical Company 2,310 648 579 Preferred stock dividends 340 312 -
Net Income Available for The Dow Chemical Company Common Stockholders $ 1,970 $ 336 $ 579
Per Common Share Data: Net income from continuing operations available for common stockholders $ 1.75 $ 0.22 $ 0.59 Discontinued operations attributable to common stockholders - 0.10 0.03 Earnings per common share - basic $ 1.75 $ 0.32 $ 0.62
Net income from continuing operations available for common stockholders $ 1.72 $ 0.22 $ 0.59 Discontinued operations attributable to common stockholders - 0.10 0.03 Earnings per common share - diluted $ 1.72 $ 0.32 $ 0.62
Common stock dividends declared per share of common stock $ 0.60 $ 0.60 $ 1.68 Weighted-average common shares outstanding - basic 1,125.9 1,043.2 930.4 Weighted-average common shares outstanding - diluted 1,143.8 1,053.9 939.0 See Notes to the Consolidated Financial Statements.
78

Table of Contents
The Dow Chemical Company and SubsidiariesConsolidated Balance Sheets
(In millions, except share amounts) At December 31 2010 2009
Assets Current Assets
Cash and cash equivalents (variable interest entities restricted - 2010: $145) $ 7,039 $ 2,846 Accounts and notes receivable: Trade (net of allowance for doubtful receivables - 2010: $128; 2009: $160) 4,616 5,656 Other 4,428 3,539 Inventories 7,087 6,847
Deferred income tax assets - current 611 654 Total current assets 23,781 19,542 Investments
Investment in nonconsolidated affiliates 3,453 3,224 Other investments (investments carried at fair value - 2010: $2,064; 2009: $2,136) 2,542 2,561
Noncurrent receivables 388 210 Total investments 6,383 5,995 Property
Property 51,648 53,567 Less accumulated depreciation 33,980 35,426 Net property (variable interest entities restricted - 2010: $1,388) 17,668 18,141 Other Assets
Goodwill 12,967 13,213 Other intangible assets (net of accumulated amortization - 2010: $1,805; 2009: $1,302) 5,530 5,966 Deferred income tax assets - noncurrent 2,079 2,039 Asbestos-related insurance receivables - noncurrent 220 330
Deferred charges and other assets 960 792 Total other assets 21,756 22,340 Total Assets $69,588 $ 66,018
Liabilities and Equity Current Liabilities
Notes payable $ 1,467 $ 2,139 Long-term debt due within one year 1,755 1,082 Accounts payable: Trade 4,356 4,153 Other 2,249 2,014 Income taxes payable 349 176 Deferred income tax liabilities - current 105 78 Dividends payable 257 254
Accrued and other current liabilities 3,358 3,209 Total current liabilities 13,896 13,105 Long-Term Debt 20,605 19,152 Other Noncurrent Liabilities
Deferred income tax liabilities - noncurrent 1,295 1,367 Pension and other postretirement benefits - noncurrent 7,492 7,242 Asbestos-related liabilities - noncurrent 663 734
Other noncurrent obligations 2,995 3,294 Total other noncurrent liabilities 12,445 12,637 Stockholders’ Equity
Preferred stock, series A ($1.00 par, $1,000 liquidation preference, 4,000,000 shares) 4,000 4,000
Common stock (authorized 1,500,000,000 shares of $2.50 par value each; issued 2010: 1,172,354,054 shares; 2009:1,162,375,462 shares) 2,931 2,906
Additional paid-in capital 2,286 1,913 Retained earnings 17,736 16,704 Accumulated other comprehensive loss (4,399) (3,892) Unearned ESOP shares (476) (519)
Treasury stock at cost (2010: 5,137,039 shares; 2009: 12,158,605 shares) (239) (557) The Dow Chemical Company’s stockholders’ equity 21,839 20,555 Noncontrolling interests 803 569
Total equity 22,642 21,124 Total Liabilities and Equity $69,588 $ 66,018

See Notes to the Consolidated Financial Statements.
79

Table of Contents
The Dow Chemical Company and SubsidiariesConsolidated Statements of Cash Flows
(In millions) For the years ended December 31 2010 2009 2008 Operating Activities
Net Income $ 2,321 $ 676 $ 654 Adjustments to reconcile net income to net cash provided by operating activities:
Depreciation and amortization 2,962 2,827 2,236 Purchased in-process research and development charges - 7 44 Provision (Credit) for deferred income tax 328 (652) (260) Earnings of nonconsolidated affiliates less than (in excess of) dividends received (444) 60 49 Pension contributions (708) (355) (185) Net gain on sales of property, businesses and consolidated companies (95) (256) (127) Other net loss (gain) (12) (31) 16 Net gain on sales of ownership interest in nonconsolidated affiliates (25) (795) - Goodwill impairment losses - 7 239 Restructuring charges 26 684 837 Asbestos-related credits (54) - (54) Excess tax benefits from share-based payment arrangements (20) (10) (8)
Changes in assets and liabilities, net of effects of acquired and divested companies: Accounts and notes receivable (1,209) (990) 2,853 Proceeds from interests in trade accounts receivable conduits 1,038 - - Inventories (750) 63 812 Accounts payable 495 304 (1,062) Other assets and liabilities 249 536 (1,333)
Cash provided by operating activities 4,102 2,075 4,711 Investing Activities
Capital expenditures (2,130) (1,683) (2,276) Proceeds from sales of property and businesses 1,877 294 252 Acquisitions of businesses (8) (35) - Purchases of previously leased assets (45) (713) (63) Investments in consolidated companies, net of cash acquired (215) (15,045) (336) Proceeds from sales of consolidated companies 74 1,563 6 6 Investments in nonconsolidated affiliates (107) (122) (331) Distributions from nonconsolidated affiliates 29 9 6 Proceeds from sales of ownership interests in nonconsolidated affiliates 113 1,413 - Purchase of unallocated Rohm and Haas ESOP shares - (552) - Purchases of investments (946) (580) (855) Change in restricted cash 436 - - Proceeds from sales and maturities of investments 1,057 684 800 Cash provided by (used in) investing activities 135 (14,767) (2,737)
Financing Activities Changes in short-term notes payable (700) (418) 825 Proceeds from notes payable 84 - - Payments on notes payable (668) - - Proceeds from revolving credit facility - 3,000 - Payments on revolving credit facility - (3,000) - Proceeds from Term Loan - 9,226 - Payments on Term Loan - (9,226) - Proceeds from issuance of long-term debt 3,131 8,283 1,453 Payments on long-term debt (1,387) (1,790) (760) Redemption of preferred securities of subsidiaries and payment of accrued dividends - (520) - Purchases of treasury stock (14) (5) (898) Proceeds from issuance of common stock 181 9 6 6 - Proceeds from issuance of preferred stock - 7,000 - Proceeds from sales of common stock 109 5 5 5 72 Issuance costs for debt and equity securities (12) (368) (70) Excess tax benefits from share-based payment arrangements 20 10 8 Distributions to noncontrolling interests (8) (24) (45) Contribution from noncontrolling interest 100 - - Dividends paid to stockholders (1,014) (1,030) (1,563) Cash provided by (used in) financing activities (178) 12,659 (978)
Effect of Exchange Rate Changes on Cash 88 79 68 Cash Assumed in Initial Consolidation of Variable Interest Entities 46 - -

Summary Increase in cash and cash equivalents 4,193 46 1,064 Cash and cash equivalents at beginning of year 2,846 2,800 1,736 Cash and cash equivalents at end of year $ 7,039 $ 2,846 $ 2,800
See Notes to the Consolidated Financial Statements.
80

Table of Contents
The Dow Chemical Company and SubsidiariesConsolidated Statements of Equity
(In millions) For the years ended December 31 2010 2009 2008 Preferred Stock
Balance at beginning of year $ 4,000 - - Preferred stock issued - $ 7,000 - Preferred stock repurchased - (2,500) - Preferred stock converted to common stock - (500) - Balance at end of year 4,000 4,000 -
Common Stock Balance at beginning of year 2,906 2,453 $ 2,453 Common stock issued 25 453 - Balance at end of year 2,931 2,906 2,453
Additional Paid-in Capital Balance at beginning of year 1,913 872 902 Common stock issued 156 2,643 - Sale of shares to ESOP - (1,529) - Stock-based compensation and allocation of ESOP shares 217 (73) (30) Balance at end of year 2,286 1,913 872
Retained Earnings Balance at beginning of year 16,704 17,013 18,004 Net income available for The Dow Chemical Company common stockholders 1,970 336 579 Dividends declared on common stock (Per share: $0.60 in 2010, $0.60 in 2009 and $1.68 in 2008) (677) (639) (1,556) Other (13) (6) (14) Impact of adoption of ASU 2009-17, net of tax (248) - - Balance at end of year 17,736 16,704 17,013
Accumulated Other Comprehensive Loss Unrealized Gains (Losses) on Investments at beginning of year 79 (111) 71
Net change in unrealized gains (losses) 32 190 (182) Balance at end of year 111 79 (111)
Cumulative Translation Adjustments at beginning of year 624 221 723 Translation adjustments (257) 403 (502) Balance at end of year 367 624 221
Pension and Other Postretirement Benefit Plans at beginning of year (4,587) (4,251) (989) Net prior service credit 23 19 16 Net loss (307) (355) (3,278) Balance at end of year (4,871) (4,587) (4,251)
Accumulated Derivative Gain (Loss) at beginning of year (8) (248) 25 Net hedging results (13) (65) (452) Reclassification to earnings 15 305 179 Balance at end of year (6) (8) (248)
Total accumulated other comprehensive loss (4,399) (3,892) (4,389) Unearned ESOP Shares
Balance at beginning of year (519) - - Shares acquired (1) (553) - Shares allocated to ESOP participants 44 34 - Balance at end of year (476) (519) -
Treasury Stock Balance at beginning of year (557) (2,438) (1,800) Purchases (14) (5) (898) Sale of shares to ESOP - 1,529 - Issuance to employees and employee plans 332 357 260 Balance at end of year (239) (557) (2,438)
The Dow Chemical Company’s Stockholders’ Equity 21,839 20,555 13,511 Noncontrolling Interests
Balance at beginning of year 5 6 9 6 9 414 Net income attributable to noncontrolling interests 11 28 75 Purchase of noncontrolling interests’ share of subsidiaries - - (376) Distributions to noncontrolling interests (8) (24) (45) Acquisition of Rohm and Haas Company noncontrolling interests - 432 - Consolidation of variable interest entities 109 46 - Impact of adoption ASU 2009-17 100 - -

Other 22 18 1 Balance at end of year 803 5 6 9 69
Total Equity $22,642 $ 21,124 $ 13,580 See Notes to the Consolidated Financial Statements.
81
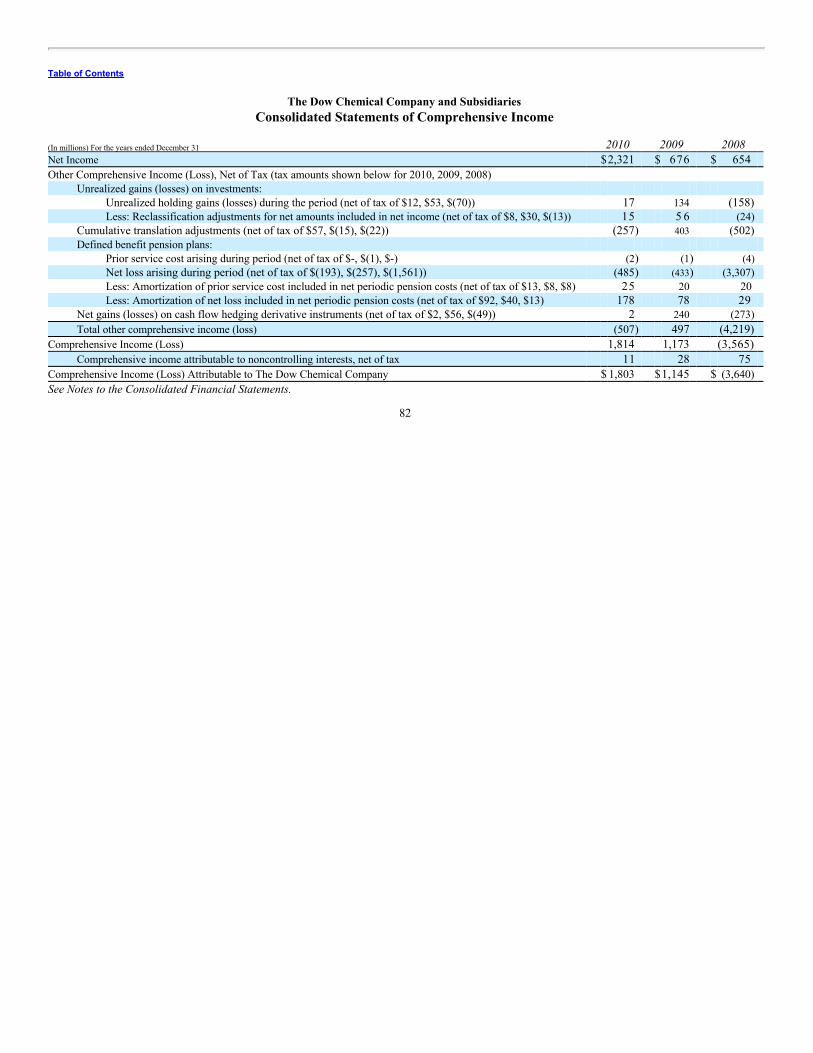
Table of Contents
The Dow Chemical Company and SubsidiariesConsolidated Statements of Comprehensive Income
(In millions) For the years ended December 31 2010 2009 2008 Net Income $2,321 $ 676 $ 654 Other Comprehensive Income (Loss), Net of Tax (tax amounts shown below for 2010, 2009, 2008)
Unrealized gains (losses) on investments: Unrealized holding gains (losses) during the period (net of tax of $12, $53, $(70)) 17 134 (158) Less: Reclassification adjustments for net amounts included in net income (net of tax of $8, $30, $(13)) 15 5 6 (24)
Cumulative translation adjustments (net of tax of $57, $(15), $(22)) (257) 403 (502) Defined benefit pension plans:
Prior service cost arising during period (net of tax of $-, $(1), $-) (2) (1) (4) Net loss arising during period (net of tax of $(193), $(257), $(1,561)) (485) (433) (3,307) Less: Amortization of prior service cost included in net periodic pension costs (net of tax of $13, $8, $8) 25 20 20 Less: Amortization of net loss included in net periodic pension costs (net of tax of $92, $40, $13) 178 78 29
Net gains (losses) on cash flow hedging derivative instruments (net of tax of $2, $56, $(49)) 2 240 (273) Total other comprehensive income (loss) (507) 497 (4,219)
Comprehensive Income (Loss) 1,814 1,173 (3,565) Comprehensive income attributable to noncontrolling interests, net of tax 11 28 75
Comprehensive Income (Loss) Attributable to The Dow Chemical Company $ 1,803 $1,145 $ (3,640) See Notes to the Consolidated Financial Statements.
82

Table of Contents
The Dow Chemical Company and SubsidiariesNotes to the Consolidated Financial Statements
Table of Contents
Note Page A Summary of Significant Accounting Policies 83 B Recent Accounting Guidance 86 C Restructuring 87 D Acquisitions 93 E Divestitures 9 6 F Inventories 98 G Property 9 9 H Nonconsolidated Affiliates and Related Company Transactions 9 9 I Goodwill and Other Intangible Assets 102 J Financial Instruments 104 K Fair Value Measurements 110 L Supplementary Information 113 M Earnings Per Share Calculations 114 N Commitments and Contingent Liabilities 115 O Transfers of Financial Assets 122 P Notes Payable, Long-Term Debt and Available Credit Facilities 125 Q Pension Plans and Other Postretirement Benefits 127 R Leased Property 135 S Variable Interest Entities 136 T Stock-Based Compensation 138 U Limited Partnership 141 V Preferred Securities of Subsidiaries 142 W Redeemable Preferred Stocks 142 X Stockholders’ Equity 143 Y Income Taxes 144 Z Operating Segments and Geographic Areas 147
NOTE A – SUMMARY OF SIGNIFICANT ACCOUNTING POLICIESPrinciples of Consolidation and Basis of PresentationThe accompanying consolidated financial statements of The Dow Chemical Company and its subsidiaries (“Dow” or the “Company”) were prepared inaccordance with accounting principles generally accepted in the United States of America (“U.S. GAAP”) and include the assets, liabilities, revenues andexpenses of all majority-owned subsidiaries over which the Company exercises control and, when applicable, entities for which the Company has a controllingfinancial interest or is the primary beneficiary. Intercompany transactions and balances are eliminated in consolidation. Investments in nonconsolidatedaffiliates (20-50 percent owned companies, joint ventures and partnerships) are accounted for using the equity method.
Certain changes to prior year balance sheet amounts have been made in accordance with the accounting guidance for business combinations to reflectadjustments made during the measurement period to provisional amounts recorded for assets acquired and liabilities assumed from Rohm and Haas Company(“Rohm and Haas”) on April 1, 2009. Certain changes have been made to geographic area information for prior years to reflect changes made in the firstquarter of 2010. Certain changes have been made to operating segment information for prior years to reflect changes made in the fourth quarter of 2010 relatedto changes in the Company’s organization.
Use of Estimates in Financial Statement PreparationThe preparation of financial statements in accordance with U.S. GAAP requires the use of estimates and assumptions that affect the reported amounts ofassets and liabilities, the disclosure of contingent assets and liabilities at the date of the financial statements, and the reported amounts of revenues andexpenses during the reporting period. The Company’s consolidated financial statements include amounts that are based on management’s best estimates andjudgments. Actual results could differ from those estimates.
83
Table of Contents
Foreign Currency TranslationThe local currency has been primarily used as the functional currency throughout the world. Translation gains and losses of those operations that use localcurrency as the functional currency are included in the consolidated balance sheets in “Accumulated other comprehensive income (loss)” (“AOCI”). Where theU.S. dollar is used as the functional currency, foreign currency gains and losses are reflected in income.
Environmental MattersAccruals for environmental matters are recorded when it is probable that a liability has been incurred and the amount of the liability can be reasonablyestimated based on current law and existing technologies. These accruals are adjusted periodically as assessment and remediation efforts progress or asadditional technical or legal information becomes available. Accruals for environmental liabilities are included in the consolidated balance sheets in “Accruedand other current liabilities” and “Other noncurrent obligations” at undiscounted amounts. Accruals for related insurance or other third-party recoveries forenvironmental liabilities are recorded when it is probable that a recovery will be realized and are included in the consolidated balance sheets as “Accounts andnotes receivable - Other.”
Environmental costs are capitalized if the costs extend the life of the property, increase its capacity, and/or mitigate or prevent contamination from futureoperations. Environmental costs are also capitalized in recognition of legal asset retirement obligations resulting from the acquisition, construction and/ornormal operation of a long-lived asset. Costs related to environmental contamination treatment and cleanup are charged to expense. Estimated future incrementaloperations, maintenance and management costs directly related to remediation are accrued when such costs are probable and reasonably estimable.
Cash and Cash EquivalentsCash and cash equivalents include time deposits and readily marketable securities with original maturities of three months or less.
Financial InstrumentsThe Company calculates the fair value of financial instruments using quoted market prices whenever available. When quoted market prices are not availablefor various types of financial instruments (such as forwards, options and swaps), the Company uses standard pricing models with market-based inputs thattake into account the present value of estimated future cash flows.
The Company utilizes derivatives to manage exposures to currency exchange rates, commodity prices and interest rate risk. The fair values of allderivatives are recognized as assets or liabilities at the balance sheet date. Changes in the fair value of these instruments are reported in income or AOCI,depending on the use of the derivative and whether it qualifies for hedge accounting treatment.
Gains and losses on derivatives that are designated and qualify as cash flow hedging instruments are recorded in AOCI, to the extent the hedges areeffective, until the underlying transactions are recognized in income. To the extent effective, gains and losses on derivative and nonderivative instruments usedas hedges of the Company’s net investment in foreign operations are recorded in AOCI as part of the cumulative translation adjustment. The ineffectiveportions of cash flow hedges and hedges of net investment in foreign operations, if any, are recognized in income immediately.
Gains and losses on derivatives designated and qualifying as fair value hedging instruments, as well as the offsetting losses and gains on the hedgeditems, are reported in income in the same accounting period. Derivatives not designated as hedging instruments are marked-to-market at the end of eachaccounting period with the results included in income.
InventoriesInventories are stated at the lower of cost or market. The method of determining cost for each subsidiary varies among last-in, first-out (“LIFO”); first-in, first-out (“FIFO”); and average cost, and is used consistently from year to year.
84

Table of Contents
PropertyLand, buildings and equipment, including property under capital lease agreements, are carried at cost less accumulated depreciation. Depreciation is based onthe estimated service lives of depreciable assets and is calculated using the straight-line method, unless the asset was capitalized before 1997 when thedeclining balance method was used. Fully depreciated assets are retained in property and accumulated depreciation accounts until they are removed fromservice. In the case of disposals, assets and related accumulated depreciation are removed from the accounts, and the net amounts, less proceeds fromdisposal, are included in income.
Impairment and Disposal of Long-Lived AssetsThe Company evaluates long-lived assets and certain identifiable intangible assets for impairment whenever events or changes in circumstances indicate thatthe carrying amount of an asset may not be recoverable. When undiscounted future cash flows are not expected to be sufficient to recover an asset’s carryingamount, the asset is written down to its fair value based on bids received from third parties or a discounted cash flow analysis based on market participantassumptions.
Long-lived assets to be disposed of by sale are classified as held for sale and are reported at the lower of carrying amount or fair value less cost to sell,and depreciation is ceased. Long-lived assets to be disposed of other than by sale are classified as held and used until they are disposed of and are reported atthe lower of carrying amount or fair value, and depreciation is recognized over the remaining useful life of the assets.
Goodwill and Other Intangible AssetsThe Company records goodwill when the purchase price of a business acquisition exceeds the estimated fair value of net identified tangible and intangibleassets acquired. Goodwill is tested for impairment at the reporting unit level annually, or more frequently when events or changes in circumstances indicatethat the fair value of a reporting unit has more likely than not declined below its carrying value. The Company primarily utilizes a discounted cash flowmethodology to calculate the fair value of its reporting units.
Finite-lived intangible assets such as purchased customer lists, licenses, intellectual property, patents, trademarks and software, are amortized over theirestimated useful lives, generally on a straight-line basis for periods ranging primarily from three to twenty years. Finite-lived intangible assets are reviewed forimpairment or obsolescence annually, or more frequently when events or changes in circumstances indicate that the carrying amount of an intangible assetmay not be recoverable. If impaired, intangible assets are written down to fair value based on discounted cash flows.
Asset Retirement ObligationsThe Company records asset retirement obligations as incurred and reasonably estimable, including obligations for which the timing and/or method ofsettlement are conditional on a future event that may or may not be within the control of the Company. The fair values of obligations are recorded as liabilitieson a discounted basis and are accreted over time for the change in present value. Costs associated with the liabilities are capitalized and amortized over theestimated remaining useful life of the asset, generally for periods of 10 years or less.
InvestmentsInvestments in debt and marketable equity securities (including warrants), primarily held by the Company’s insurance operations, are classified as trading,available-for-sale or held-to-maturity. Investments classified as trading are reported at fair value with unrealized gains and losses included in income. Thoseclassified as available-for-sale are reported at fair value with unrealized gains and losses recorded in AOCI. Those classified as held-to-maturity are recorded atamortized cost. The cost of investments sold is determined by specific identification. The Company routinely reviews available-for-sale and held-to-maturitysecurities for other-than-temporary declines in fair value below the cost basis, and when events or changes in circumstances indicate the carrying value of anasset may not be recoverable, the security is written down to fair value, establishing a new cost basis.
RevenueSales are recognized when the revenue is realized or realizable, and the earnings process is complete. Approximately 99 percent of the Company’s sales in 2010related to sales of product. The remaining 1 percent in 2010 related to the Company’s service offerings, insurance operations, and licensing of patents andtechnology. Revenue for product sales is recognized as risk and title to the product transfer to the customer, which usually occurs at the time shipment ismade. As such, title to the product passes when the product is delivered to the freight carrier. Dow’s standard terms of delivery are included in its contracts ofsale, order confirmation documents and invoices. Freight costs and any directly related costs of transporting finished product to customers are recorded as“Cost of sales.”
85

Table of Contents
Revenue related to the Company’s insurance operations includes third-party insurance premiums, which are earned over the terms of the relatedinsurance policies and reinsurance contracts. Revenue related to the initial licensing of patents and technology is recognized when earned; revenue related torunning royalties is recognized according to licensee production levels.
Legal CostsThe Company expenses legal costs, including those legal costs expected to be incurred in connection with a loss contingency, as incurred.
Severance CostsThe Company routinely reviews its operations around the world in an effort to ensure competitiveness across its businesses and geographic areas. When thereviews result in a workforce reduction related to the shutdown of facilities or other optimization activities, severance benefits are provided to employeesprimarily under Dow’s ongoing benefit arrangements. These severance costs are accrued under the guidance of the Financial Accounting Standards Board(“FASB”) Accounting Standards Codification™ (“ASC”) Topic 712, “Compensation – Nonretirement Postemployment Benefits,” once management commitsto a plan of termination including the number of employees to be terminated, their job classifications or functions, their locations and the expected completiondate.
Income TaxesThe Company accounts for income taxes using the asset and liability method. Under this method, deferred tax assets and liabilities are recognized for thefuture tax consequences of temporary differences between the carrying amounts and tax bases of assets and liabilities using enacted rates. The effect of achange in tax rates on deferred tax assets is recognized in income in the period that includes the enactment date.
Annual tax provisions include amounts considered sufficient to pay assessments that may result from examinations of prior year tax returns; however,the amount ultimately paid upon resolution of issues raised may differ from the amounts accrued.
The Company recognizes the financial statement effects of an uncertain income tax position when it is more likely than not, based on the technicalmerits, that the position will be sustained upon examination. The Company accrues for other tax contingencies when it is probable that a liability to a taxingauthority has been incurred and the amount of the contingency can be reasonably estimated. The current portion of uncertain income tax positions is includedin “Income taxes payable” and the long-term portion is included in “Other noncurrent obligations” in the consolidated balance sheets.
Provision is made for taxes on undistributed earnings of foreign subsidiaries and related companies to the extent that such earnings are not deemed to bepermanently invested.
Earnings per Common ShareThe calculation of earnings per common share is based on the weighted-average number of the Company’s common shares outstanding for the applicableperiod. The calculation of diluted earnings per common share reflects the effect of all potential dilutive common shares that were outstanding during therespective periods, unless the effect of doing so is antidilutive.
NOTE B – RECENT ACCOUNTING GUIDANCERecently Adopted Accounting GuidanceOn January 1, 2010, the Company adopted Accounting Standards Update (“ASU”) 2009-16, “Transfers and Servicing (Topic 860): Accounting forTransfers of Financial Assets.” This ASU is intended to improve the information provided in financial statements concerning transfers of financial assets,including the effects of transfers on financial position, financial performance and cash flows, and any continuing involvement of the transferor with thetransferred financial assets. The Company evaluated the impact of adopting the guidance and the terms and conditions in place at January 1, 2010 anddetermined that certain sales of accounts receivable would be classified as secured borrowings. Under the Company’s sale of accounts receivablearrangements, $915 million was outstanding at January 1, 2010. The maximum amount of receivables available for participation in these programs was$1,939 million at January 1, 2010. See Note O for additional information about transfers of financial assets.
86

Table of Contents
On January 1, 2010, the Company adopted ASU 2009-17, “Consolidations (Topic 810): Improvements to Financial Reporting by Enterprises Involvedwith Variable Interest Entities,” which amended the consolidation guidance applicable to variable interest entities and required additional disclosuresconcerning an enterprise’s continuing involvement with variable interest entities. The Company evaluated the impact of this guidance and determined that theadoption resulted in the consolidation of two additional joint ventures, an owner trust and an entity that was used to monetize accounts receivable. AtJanuary 1, 2010, $793 million in assets (net of tax, including the impact on “Investment in nonconsolidated affiliates”), $941 million in liabilities,$100 million in noncontrolling interests and a cumulative effect adjustment to retained earnings of $248 million were recorded as a result of the adoption ofthis guidance. See Note S for additional information about variable interest entities.
On January 1, 2010, the Company adopted ASU 2010-06, “Fair Value Measurements and Disclosures (Topic 820): Improving Disclosures about FairValue Measurements,” which added disclosure requirements about transfers in and out of Levels 1 and 2 and separate disclosures about activity relating toLevel 3 measurements and clarifies existing disclosure requirements related to the level of disaggregation and input and valuation techniques. See Note K foradditional disclosures about fair value measurements.
Accounting Guidance Issued But Not Adopted as of December 31, 2010In October 2009, the FASB issued ASU 2009-13, “Revenue Recognition (Topic 605): Multiple-Deliverable Revenue Arrangements – a consensus of the FASBEmerging Issues Task Force,” which amends the criteria for when to evaluate individual delivered items in a multiple deliverable arrangement and how toallocate consideration received. This ASU is effective for fiscal years beginning on or after June 15, 2010. The adoption of the guidance on January 1, 2011 isnot expected to have a material impact on the Company’s consolidated financial statements.
NOTE C – RESTRUCTURING2009 RestructuringOn June 30, 2009, the Company’s Board of Directors approved a restructuring plan related to the Company’s acquisition of Rohm and Haas Company(“Rohm and Haas”) as well as actions to advance the Company’s strategy and to respond to continued weakness in the global economy. The restructuring planincluded the elimination of approximately 2,500 positions primarily resulting from synergies to be achieved as a result of the acquisition of Rohm and Haas.In addition, the plan included the shutdown of a number of manufacturing facilities. These actions are expected to be completed primarily by the end of 2011.As a result of the restructuring activities, the Company recorded pretax restructuring charges of $677 million in the second quarter of 2009, consisting ofasset write-downs and write-offs of $454 million, costs associated with exit or disposal activities of $68 million and severance costs of $155 million. Theimpact of the charges is shown as “Restructuring charges” in the consolidated statements of income and was reflected in the Company’s segment results asshown in the following table, which also reflects adjustments made in 2009 to the 2009 plan, the 2008 plan (as discussed below and in the sections titled“2008 Restructuring”) and the 2007 plan.
2009 Restructuring Charges by Operating Segment In millions
Impairment ofLong-Lived Assets
and Other Assets
Costs associated withExit or Disposal
Activities
SeveranceCosts Total
Electronic and Specialty Materials $ 68 - - $ 68 Coatings and Infrastructure 167 $4 - 171 Performance Products 73 - - 73 Plastics 1 - - 1 Chemicals and Energy 75 - - 75 Hydrocarbons 6 5 - - 65 Corporate 5 64 $155 224 Total 2009 restructuring charges $ 454 $ 68 $155 $677 Adjustments to restructuring charges:
2009 - Corporate - 13 - 13 2008 - Corporate - - 19 19 2007 - Health and Agricultural Sciences - (15) - (15) 2007 - Corporate - - (5) (5)
Net 2009 restructuring charges $ 454 $ 66 $169 $689
87

Table of Contents
Details regarding the components of the 2009 restructuring charges and adjustments to restructuring charges are discussed below:
Impairment of Long-Lived Assets and Other AssetsThe restructuring charges related to the write-down or write-off of assets totaled $454 million. Write-downs were related to Dow’s facilities located in Hahnvilleand Plaquemine, Louisiana; the United States Federal Trade Commission (“FTC”) required divestiture of certain acrylic monomer and specialty latex assetsin North America; and other small manufacturing facilities where the acquisition of Rohm and Haas resulted in overlapping manufacturing capabilities.Details regarding these write-downs or write-offs are as follows:
• Due to continued weakness in the global economy, the decision was made to shut down a number of hydrocarbon and basic chemicals facilities,
with an impact of $126 million, including the following:
• Ethylene manufacturing facility in Hahnville, Louisiana. A write-off of the net book value of the related buildings, machinery and
equipment against the Hydrocarbons segment was recorded. The facility shut down in the second quarter of 2009.
• Ethylene oxide/ethylene glycol manufacturing facility in Hahnville, Louisiana. A write-off of the net book value of the related buildings,
machinery and equipment against the Chemicals and Energy segment was recorded. The facility shut down in the second quarter of 2009.
• Ethylene dichloride and vinyl chloride monomer manufacturing facility in Plaquemine, Louisiana. A write-down of the net book value of
the related buildings, machinery and equipment against the Chemicals and Energy segment was recorded. The facility will shut down inmid-2011.
• With the completion of the Company’s acquisition of Rohm and Haas, the following charges were recognized:
• Due to an expected loss arising from the FTC required divestitures of certain acrylic monomer and specialty latex assets within eightmonths of the closing of the acquisition of Rohm and Haas, the Company recognized an impairment charge of $205 million against theCoatings and Infrastructure ($134 million) and Performance Products ($71 million) segments in the second quarter of 2009. Thedivestiture of the assets was completed in January 2010 (see Note E).
• The decision was made to shut down a number of small manufacturing facilities to optimize the assets of the Company. Write-downs of
$96 million were recorded in the second quarter of 2009, primarily impacting the Electronic and Specialty Materials ($66 million) andCoatings and Infrastructure ($28 million) segments.
The restructuring charges in the second quarter of 2009 also included the write-off of capital project spending ($20 million) and other assets ($7 million)associated with plant closures. These charges were reflected in the results of the operating segments impacted by the restructuring activities.
Costs Associated with Exit or Disposal ActivitiesThe restructuring charges for costs associated with exit or disposal activities totaled $68 million in the second quarter of 2009 and included environmentalremediation of $64 million, impacting Corporate, with the remainder relating to contract termination fees and other charges. In the fourth quarter of 2009, theCompany increased the reserve by $13 million to reflect additional expense for pension settlements related to the Rohm and Haas acquisition.
Severance CostsThe restructuring charges included severance of $155 million for the separation of approximately 2,500 employees under the terms of the Company’s ongoingbenefit arrangements, primarily over two years. These costs were charged against Corporate. At December 31, 2009, severance of $72 million had been paidand a currency adjusted liability of $84 million remained for approximately 1,221 employees. At December 31, 2010, severance of $149 million had beenpaid and a currency adjusted liability of $6 million remained for approximately 189 employees, with anticipated departure dates scheduled primarily in thefirst quarter of 2011.
88

Table of Contents
The following table summarizes the activities related to the Company’s restructuring reserve: 2009 Restructuring Activities
In millions
Impairment ofLong-Lived Assets
and Other Assets
Costs associated withExit or Disposal
Activities
SeveranceCosts Total
Restructuring charges recognized in the second quarter of2009 $454 $ 68 $155 $677
Adjustment to reserve - 13 - 13 Charges against reserve (454) (13) - (467) Cash payments - - (72) (72) Foreign currency impact - - 1 1 Reserve balance at December 31, 2009 - $68 $ 84 $152 Adjustments to reserve 21 7 1 29 Charges against reserve (21) (7) - (28) Cash payments - - (77) (77) Foreign currency impact - - (2) (2) Reserve balance at December 31, 2010 - $ 68 $ 6 $ 74
Dow expects to incur future costs related to its restructuring activities, as the Company continually looks for ways to enhance the efficiency and costeffectiveness of its operations, and to ensure competitiveness across its businesses and across geographic areas. Future costs are expected to include demolitioncosts related to the closed facilities, which will be recognized as incurred. The Company also expects to incur additional employee-related costs, includinginvoluntary termination benefits, related to its other optimization activities. These costs cannot be reasonably estimated at this time.
2010 Adjustments to 2009 and 2008 Restructuring PlansIn the first quarter of 2010, the Company recorded an additional $8 million charge to adjust the impairment of long-lived assets and other assets related to theFTC required divestitures completed in the first quarter of 2010, and an additional $8 million charge related to the shutdown of a small manufacturing facilityunder the 2009 restructuring plan. The impact of these charges is shown as “Restructuring charges” in the consolidated statements of income and was reflectedin the following operating segments: Electronic and Specialty Materials ($8 million), Coatings and Infrastructure ($5 million) and Performance Products($3 million).
In the second quarter of 2010, the Company recorded additional restructuring charges of $13 million, which included the write-off of other assets of$5 million, additional costs associated with exit or disposal activities of $7 million and additional severance of $1 million related to the FTC requireddivestitures that were included in the 2009 restructuring plan. The impact of these charges is shown as “Restructuring charges” in the consolidated statementsof income and was reflected in Performance Products ($12 million) and Corporate ($1 million).
In the fourth quarter of 2010, the Company decreased the severance reserve for the 2008 restructuring plan by $3 million to adjust the reserve to theremaining future payments. The impact of this adjustment is shown as “Restructuring charges” in the consolidated statements of income and was reflected inCorporate.
2009 Adjustments to 2008 and 2007 Restructuring PlansIn the first quarter of 2009, the Company increased the severance reserve for the 2008 restructuring plan by $19 million, for an additional workforcereduction of approximately 500 employees. The increase was reflected in Corporate.
In the second quarter of 2009, the Company reduced the 2007 restructuring reserve related to contract termination fees by $15 million as a result of theCompany’s acquisition of Rohm and Haas, impacting the Health and Agricultural Sciences segment. The initial liability established in 2007 included contracttermination fees related to the cancellation of contract manufacturing agreements between the Company and Rohm and Haas. Following completion of theacquisition, the liability for these fees was reversed.
In the fourth quarter of 2009, the Company reduced the severance reserve for the 2007 restructuring plan by $5 million as redeployment opportunitiesfor affected employees were identified. The decrease was reflected in Corporate.
89
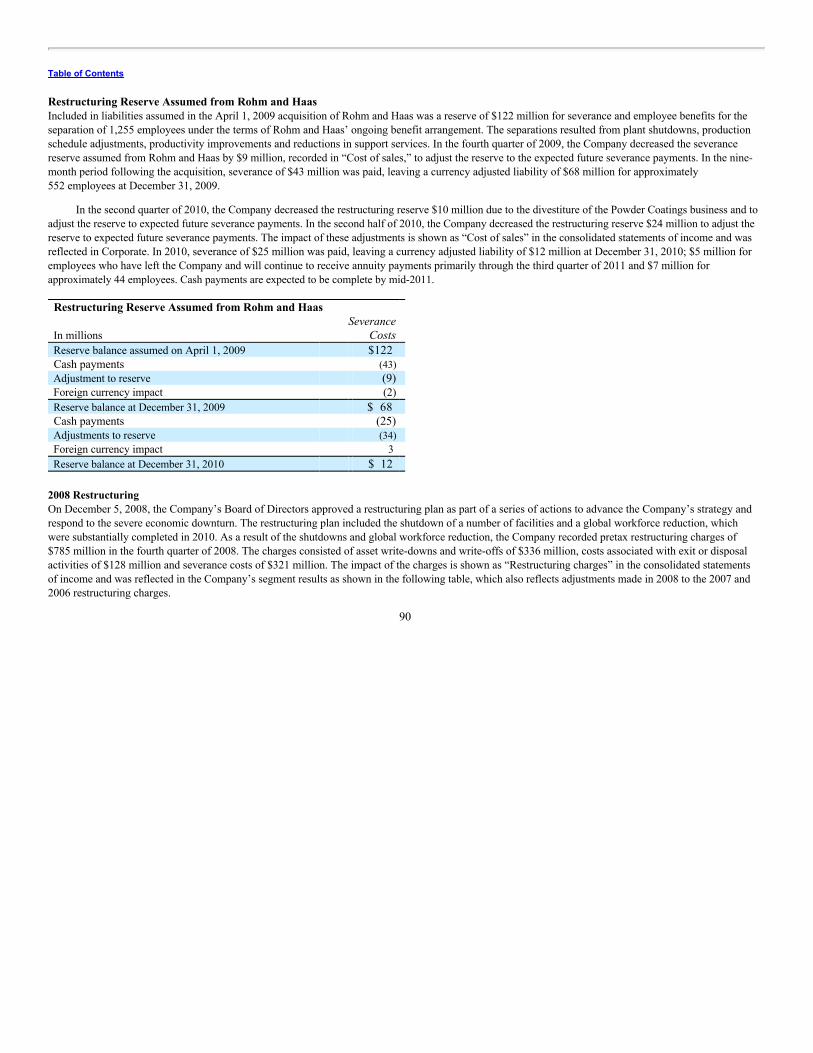
Table of Contents
Restructuring Reserve Assumed from Rohm and HaasIncluded in liabilities assumed in the April 1, 2009 acquisition of Rohm and Haas was a reserve of $122 million for severance and employee benefits for theseparation of 1,255 employees under the terms of Rohm and Haas’ ongoing benefit arrangement. The separations resulted from plant shutdowns, productionschedule adjustments, productivity improvements and reductions in support services. In the fourth quarter of 2009, the Company decreased the severancereserve assumed from Rohm and Haas by $9 million, recorded in “Cost of sales,” to adjust the reserve to the expected future severance payments. In the nine-month period following the acquisition, severance of $43 million was paid, leaving a currency adjusted liability of $68 million for approximately552 employees at December 31, 2009.
In the second quarter of 2010, the Company decreased the restructuring reserve $10 million due to the divestiture of the Powder Coatings business and toadjust the reserve to expected future severance payments. In the second half of 2010, the Company decreased the restructuring reserve $24 million to adjust thereserve to expected future severance payments. The impact of these adjustments is shown as “Cost of sales” in the consolidated statements of income and wasreflected in Corporate. In 2010, severance of $25 million was paid, leaving a currency adjusted liability of $12 million at December 31, 2010; $5 million foremployees who have left the Company and will continue to receive annuity payments primarily through the third quarter of 2011 and $7 million forapproximately 44 employees. Cash payments are expected to be complete by mid-2011. Restructuring Reserve Assumed from Rohm and Haas
In millions
Severance Costs
Reserve balance assumed on April 1, 2009 $122 Cash payments (43) Adjustment to reserve (9) Foreign currency impact (2) Reserve balance at December 31, 2009 $ 68 Cash payments (25) Adjustments to reserve (34) Foreign currency impact 3 Reserve balance at December 31, 2010 $ 12
2008 RestructuringOn December 5, 2008, the Company’s Board of Directors approved a restructuring plan as part of a series of actions to advance the Company’s strategy andrespond to the severe economic downturn. The restructuring plan included the shutdown of a number of facilities and a global workforce reduction, whichwere substantially completed in 2010. As a result of the shutdowns and global workforce reduction, the Company recorded pretax restructuring charges of$785 million in the fourth quarter of 2008. The charges consisted of asset write-downs and write-offs of $336 million, costs associated with exit or disposalactivities of $128 million and severance costs of $321 million. The impact of the charges is shown as “Restructuring charges” in the consolidated statementsof income and was reflected in the Company’s segment results as shown in the following table, which also reflects adjustments made in 2008 to the 2007 and2006 restructuring charges.
90

Table of Contents
2008 Restructuring Charges by Operating Segment In millions
Impairment ofLong-Lived Assets
and Other Assets
Costs associated withExit or Disposal
Activities
SeveranceCosts Total
Electronic and Specialty Materials $ 10 - - $ 10 Coatings and Infrastructure 15 $ 1 - 16 Performance Systems 67 1 - 68 Performance Products 39 - - 39 Plastics 9 6 2 - 98 Chemicals and Energy 86 20 - 106 Hydrocarbons 15 3 - 18 Corporate 8 101 $321 430 Total 2008 restructuring charges $336 $128 $321 $785 Adjustments to 2007 restructuring charges:
Performance Systems - 2 - 2 Health and Agricultural Sciences - 3 - 3 Plastics 30 20 - 50 Corporate - 5 - 5
Adjustments to 2006 restructuring charges: Chemicals and Energy - (3) - (3) Corporate - - (3) (3)
Net 2008 restructuring charges $ 366 $155 $318 $839
Details regarding the components of the 2008 restructuring charges are discussed below:
Impairment of Long-Lived Assets and Other AssetsThe restructuring charges related to the write-down or write-off of assets in 2008 totaled $336 million and included the impact of plant closures andimpairments of $288 million. The most significant write-downs were related to Dow’s facilities located in Oyster Creek, Freeport, Seadrift and Texas City,Texas; Pittsburg, California; Terneuzen, The Netherlands; Varennes, Quebec, Canada; Plaquemine, Louisiana; Aratu, Brazil; King’s Lynn and Wilton,England; assets related to the pending sale of the automotive sealants business in Europe; and project investment costs related to a potential joint venture inOman. Details regarding these write-downs or write-offs are as follows:
• Due to a severe economic downturn, the Company decided in the fourth quarter of 2008 to shut down a number of facilities, including the
following:
• Chlor-alkali manufacturing facility in Oyster Creek, Texas. A $31 million write-off of the net book value of the related buildings,
machinery and equipment against the Chemicals and Energy segment was recorded in the fourth quarter of 2008. This facility was shutdown in the first quarter of 2009.
• Styrene and styrene derivatives manufacturing facilities principally in Freeport, Texas; Pittsburg, California; Terneuzen, TheNetherlands; King’s Lynn, England; and Varennes, Canada. A $37 million write-off of the net book value of the related buildings,machinery and equipment was recorded in the fourth quarter of 2008 against the Hydrocarbons ($14 million), Plastics ($6 million),Performance Products ($10 million) and Coatings and Infrastructure ($2 million) segments, as well as Corporate ($5 million). Thefacilities were shut down in the fourth quarter of 2009.
• Facilities that manufacture NORDEL™ hydrocarbon rubber in Seadrift, Texas, and TYRIN™ chlorinated polyethylene in Plaquemine,
Louisiana. A $36 million write-down of the net book value of the related buildings, machinery and equipment against the PerformanceSystems segment was recorded in the fourth quarter of 2008. Both facilities were closed in the first quarter of 2009.
91

Table of Contents
• Solution vinyl resin manufacturing facilities in Texas City, Texas. A $26 million write-down of the net book value of the related
buildings, machinery and equipment against the Performance Products segment was recorded in the fourth quarter of 2008. This plantwas shut down in the third quarter of 2009.
• Perchloroethylene/carbon tetrachloride manufacturing facility in Aratu, Brazil. An $11 million write-off of the net book value of the related
buildings, machinery and equipment against the Chemicals and Energy segment was recorded in the fourth quarter of 2008. This facilitywas closed in the second quarter of 2010.
• In addition to the locations described above, the restructuring charges for plant closures included $26 million related to the shutdown of
several small production facilities.
• The Company decided in the fourth quarter of 2008 to pursue strategic alternatives regarding its Wilton, England, ethylene oxide/ethylene glycol
(“EO/EG”) plant. Based on the results of asset impairment testing, an impairment charge of $30 million against the Chemicals and Energysegment was recorded in the fourth quarter of 2008. The plant was shut down in January 2010.
• Due to an expected loss on the pending sale of the automotive sealants business in Europe, an impairment charge of $8 million against the
Performance Systems segment was recorded in the fourth quarter of 2008. The business was sold in the first quarter of 2009.
• Due to a change in scope, the Company’s investment (primarily engineering costs) in a project to form a joint venture to design, build and operate
a petrochemical complex in Oman was written down. An $83 million write-down of the project-related spending against the Plastics segment wasrecorded in the fourth quarter of 2008.
The restructuring charges in the fourth quarter of 2008 also included the write-off of capital project spending ($13 million); spare parts ($9 million) andcatalysts ($6 million) associated with plant closures; other assets ($5 million); as well as a loss on the sale of inventory ($15 million) associated with thedivestiture of the automotive sealants business in Europe. These write-offs were related to the businesses involved in the shutdown of assets and were thereforereflected in the results of various operating segments.
Costs Associated with Exit or Disposal ActivitiesThe restructuring charges for costs associated with exit or disposal activities totaled $128 million in 2008 and included pension curtailment costs andtermination benefits of $88 million reflected in Corporate; and environmental remediation and asbestos abatement of $40 million primarily impactingChemicals and Energy and Corporate.
Severance CostsAs a result of the Company’s decision to shut down assets around the world and implement a global workforce reduction, the restructuring charges includedseverance of $321 million for the separation of approximately 3,000 employees under the terms of Dow’s ongoing benefit arrangements. These costs werecharged against Corporate. In the first quarter of 2009, the Company increased the severance reserve by $19 million, including approximately 500 additionalemployees. At December 31, 2009, severance of $289 million had been paid and a currency adjusted liability of $53 million remained for approximately 293employees. In the fourth quarter of 2010, the Company decreased the severance reserve by $3 million to adjust the reserve to the remaining future payments.The impact of this adjustment is shown as “Restructuring charges” in the consolidated statements of income and was reflected in Corporate. At December 31,2010, severance of $316 million had been paid and employee separations were substantially complete. A currency adjusted liability of $22 million remained atDecember 31, 2010, largely for employees who have left the Company and will continue to receive annuity payments primarily through 2018.
92

Table of Contents
The following table summarizes the activities related to the Company’s restructuring reserve: 2008 Restructuring Activities
In millions
Impairment ofLong-Lived Assets
and Other Assets
Costs associated withExit or Disposal
Activities
SeveranceCosts Total
Restructuring charges recognized in the fourth quarter of2008 $ 336 $128 $321 $785
Cash payments - - (2) (2) Charges against reserve (336) - - (336) Reserve balance at December 31, 2008 - $128 $319 $447 Adjustment to reserve - - 19 19 Cash payments - - (287) (287) Foreign currency impact - 7 2 9 Reserve balance at December 31, 2009 - $135 $ 53 $188 Adjustment to reserve - - (3) (3) Cash payments - - (27) (27) Foreign currency impact - (3) (1) (4) Reserve balance at December 31, 2010 - $132 $ 22 $154
The shutdowns and optimization activities related to the 2008 restructuring plan were substantially complete in 2010, with remaining liabilitiesprimarily related to pension, environmental remediation and severance to be paid over time.
2008 Adjustments to 2007 and 2006 Restructuring PlansIn 2008, adjustments were made to the 2007 restructuring plan to increase the reserve for environmental remediation $5 million (impacting Corporate). The2007 restructuring reserve was also increased $5 million for contract termination fees, reflected in Performance Systems ($2 million) and Health andAgricultural Sciences ($3 million). In the fourth quarter of 2008, Pétromont, a nonconsolidated affiliate, announced the permanent shutdown of its operations.As a result of this announcement, the Company recorded an additional charge of $50 million against the 2007 restructuring plan (impacting the Plasticssegment).
In 2008, adjustments were made to the 2006 restructuring plan to decrease the reserve for environmental remediation $3 million (impacting theChemicals and Energy segment) and to decrease the severance reserve $3 million (impacting Corporate).
NOTE D – ACQUISITIONSAcquisition of Rohm and HaasOn April 1, 2009, the Company completed the acquisition of Rohm and Haas. Pursuant to the July 10, 2008 Agreement and Plan of Merger (the “MergerAgreement”), Ramses Acquisition Corp., a direct wholly owned subsidiary of the Company, merged with and into Rohm and Haas (the “Merger”), with Rohmand Haas continuing as the surviving corporation and becoming a direct wholly owned subsidiary of the Company.
The Company pursued the acquisition of Rohm and Haas to make the Company a leading specialty chemicals and advanced materials company,combining the two organizations’ best-in-class technologies, broad geographic reach and strong industry channels to create a business portfolio withsignificant growth opportunities.
93

Table of Contents
Pursuant to the terms and conditions of the Merger Agreement, each outstanding share of Rohm and Haas common stock was converted into the right toreceive cash of $78 per share, plus additional cash consideration of $0.97 per share. The additional cash consideration represented 8 percent per annum onthe $78 per share consideration from January 10, 2009 to the closing of the Merger, less dividends declared by Rohm and Haas with a dividend record datebetween January 10, 2009 and the closing of the Merger. All options to purchase shares of common stock of Rohm and Haas granted under the Rohm andHaas stock option plans and all other Rohm and Haas equity-based compensation awards, whether vested or unvested as of April 1, 2009, became fullyvested and converted into the right to receive cash of $78.97 per share, less any applicable exercise price. Total cash consideration paid to Rohm and Haasshareholders was $15,681 million. As part of the purchase price, $552 million in cash was paid to the Rohm and Haas Company Employee StockOwnership Plan (“Rohm and Haas ESOP”) on April 1, 2009 for 7.0 million shares of Rohm and Haas common stock held by the Rohm and Haas ESOP.
As a condition of the FTC’s approval of the Merger, the Company was required to divest a portion of its acrylic monomer business, a portion of itsspecialty latex business and its hollow sphere particle business. The Company completed the sale of these businesses in 2010 (see Note E). Total net sales andcost of sales for these businesses amounted to approximately one percent of the Company’s 2008 net sales and cost of sales.
The following table provides net sales and results of operations from the Rohm and Haas acquired businesses included in the Company’s 2009 resultssince the April 1, 2009 acquisition. Included in the results from Rohm and Haas was $257 million of restructuring charges (see Note C), a one-time increasein cost of sales of $209 million related to the fair value step-up of inventories acquired from Rohm and Haas and sold in the second quarter of 2009 and apretax loss of $56 million on the early extinguishment of debt. Rohm and Haas Results of Operations
April 1 – Dec. 31,
In millions 2009 Net sales $5,599 Loss from Continuing Operations Before Income Taxes $(134)
The following table provides pro forma net sales and results of operations for the years ended December 31, 2009 and December 31, 2008, as if Rohmand Haas had been acquired on January 1 of each year. The unaudited pro forma results reflect certain adjustments related to the acquisition, such asincreased depreciation and amortization expense on assets acquired from Rohm and Haas resulting from the fair valuation of assets acquired and the impact ofacquisition financing in place at December 31, 2009. The pro forma results do not include any anticipated cost synergies or other effects of the plannedintegration of Rohm and Haas. Accordingly, such pro forma amounts are not necessarily indicative of the results that actually would have occurred had theacquisition been completed on the dates indicated, nor are they indicative of the future operating results of the combined company. Pro Forma Results of Operations In millions, except per share amounts 2009 2008 Net sales $45,853 $65,704 Net loss available for The Dow Chemical Company common stockholders $(501) $(317) Loss per common share – diluted $(0.45) $(0.29)
The following table summarizes the fair values of the assets acquired and liabilities assumed from Rohm and Haas on April 1, 2009. During themeasurement period, which ended on March 31, 2010, net adjustments of $145 million were made to the fair values of the assets acquired and liabilitiesassumed with a corresponding adjustment to goodwill. These adjustments are summarized in the table presented below. The balance sheet at December 31,2009 has been retrospectively adjusted to reflect these adjustments as required by the accounting guidance for business combinations. No further adjustmentshave been made to the acquisition-date fair values of assets acquired and liabilities assumed since the end of the measurement period.
94
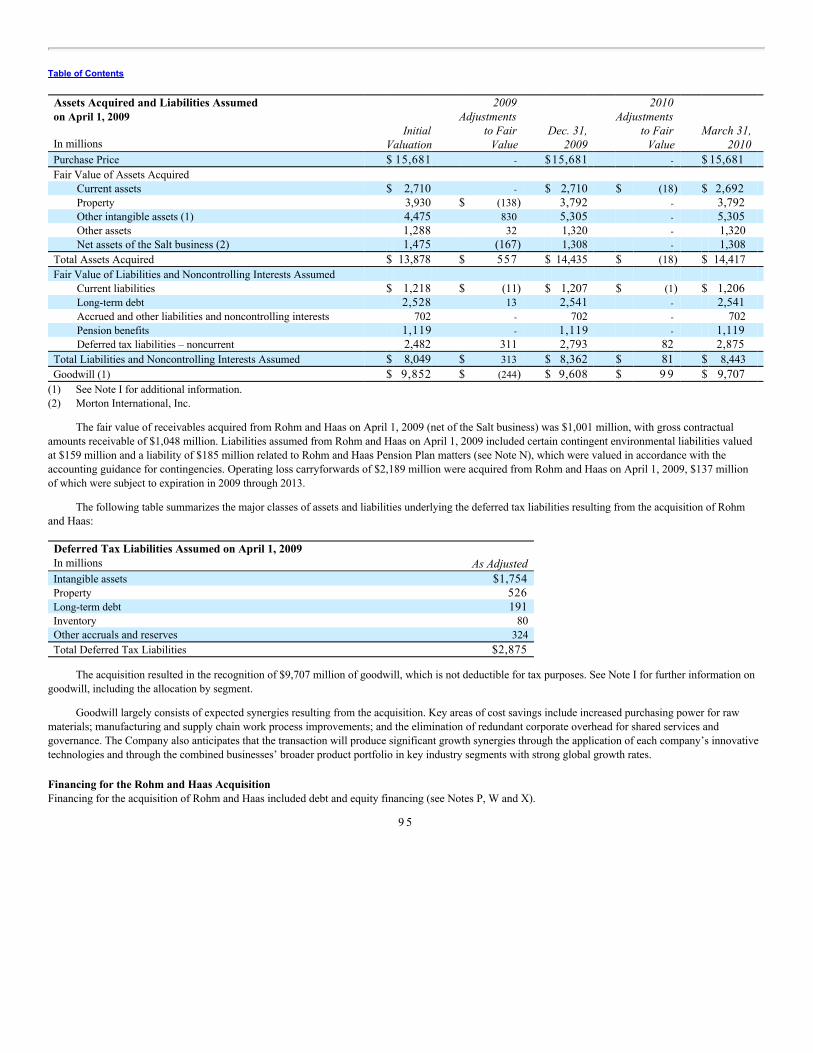
Table of Contents
Assets Acquired and Liabilities Assumed on April 1, 2009 In millions
InitialValuation
2009Adjustments
to FairValue
Dec. 31,2009
2010Adjustments
to FairValue
March 31, 2010
Purchase Price $ 15,681 - $15,681 - $ 15,681 Fair Value of Assets Acquired
Current assets $ 2,710 - $ 2,710 $ (18) $ 2,692 Property 3,930 $ (138) 3,792 - 3,792 Other intangible assets (1) 4,475 830 5,305 - 5,305 Other assets 1,288 32 1,320 - 1,320 Net assets of the Salt business (2) 1,475 (167) 1,308 - 1,308
Total Assets Acquired $ 13,878 $ 557 $ 14,435 $ (18) $ 14,417 Fair Value of Liabilities and Noncontrolling Interests Assumed
Current liabilities $ 1,218 $ (11) $ 1,207 $ (1) $ 1,206 Long-term debt 2,528 13 2,541 - 2,541 Accrued and other liabilities and noncontrolling interests 702 - 702 - 702 Pension benefits 1,119 - 1,119 - 1,119 Deferred tax liabilities – noncurrent 2,482 311 2,793 82 2,875
Total Liabilities and Noncontrolling Interests Assumed $ 8,049 $ 313 $ 8,362 $ 81 $ 8,443 Goodwill (1) $ 9,852 $ (244) $ 9,608 $ 9 9 $ 9,707 (1) See Note I for additional information.(2) Morton International, Inc.
The fair value of receivables acquired from Rohm and Haas on April 1, 2009 (net of the Salt business) was $1,001 million, with gross contractualamounts receivable of $1,048 million. Liabilities assumed from Rohm and Haas on April 1, 2009 included certain contingent environmental liabilities valuedat $159 million and a liability of $185 million related to Rohm and Haas Pension Plan matters (see Note N), which were valued in accordance with theaccounting guidance for contingencies. Operating loss carryforwards of $2,189 million were acquired from Rohm and Haas on April 1, 2009, $137 millionof which were subject to expiration in 2009 through 2013.
The following table summarizes the major classes of assets and liabilities underlying the deferred tax liabilities resulting from the acquisition of Rohmand Haas: Deferred Tax Liabilities Assumed on April 1, 2009 In millions As Adjusted Intangible assets $1,754 Property 526 Long-term debt 191 Inventory 80 Other accruals and reserves 324 Total Deferred Tax Liabilities $2,875
The acquisition resulted in the recognition of $9,707 million of goodwill, which is not deductible for tax purposes. See Note I for further information ongoodwill, including the allocation by segment.
Goodwill largely consists of expected synergies resulting from the acquisition. Key areas of cost savings include increased purchasing power for rawmaterials; manufacturing and supply chain work process improvements; and the elimination of redundant corporate overhead for shared services andgovernance. The Company also anticipates that the transaction will produce significant growth synergies through the application of each company’s innovativetechnologies and through the combined businesses’ broader product portfolio in key industry segments with strong global growth rates.
Financing for the Rohm and Haas AcquisitionFinancing for the acquisition of Rohm and Haas included debt and equity financing (see Notes P, W and X).
9 5

Table of Contents
Rohm and Haas Acquisition and Integration Related ExpensesDuring 2010, pretax charges totaling $143 million were recorded for integration expenses related to the April 1, 2009 acquisition of Rohm and Haas. During2009, pretax charges totaling $166 million ($49 million in 2008) were recorded for legal expenses and other transaction and integration costs related to theacquisition. These charges, which were expensed in accordance with the accounting guidance for business combinations, were recorded in “Acquisition andintegration related expenses” and reflected in Corporate. An additional $60 million of acquisition-related retention expenses were incurred during 2009 andrecorded in “Cost of sales,” “Research and development expenses,” and “Selling, general and administrative expenses” and reflected in Corporate.
Purchased In-Process Research and DevelopmentPurchased in-process research and development (“IPR&D”) represents the value assigned to acquired research and development projects that, as of the date ofthe acquisition, had not established technological feasibility and had no alternative future use. Prior to January 1, 2009, amounts assigned to IPR&D meetingthese criteria were charged to expense as part of the allocation of the purchase price of the business combination. With the adoption of ASC Topic 805,“Business Combinations,” on January 1, 2009, IPR&D acquired in a business combination is capitalized and tested for impairment annually.
The Company recorded pretax charges totaling $7 million in 2009 for IPR&D projects associated with the purchase of technology that was not part of abusiness combination. The Company recorded pretax charges totaling $44 million in 2008 for IPR&D projects associated with several acquisitions. Theestimated values assigned to the IPR&D projects were determined primarily based on a discounted cash flow model and are shown below: In-Process Research and Development ProjectsAcquired In millions Date of Acquisition
Estimated Value Assigned
to IPR&D 2009 Lithium ion battery technology purchase October 30, 2009 $7 2008 Germplasm from Triumph Seed Co., Inc. February 29, 2008 $ 4 Germplasm from Dairyland Seed Co., Inc. and Bio-Plant
Research Ltd. August 29, 2008 23 Germplasm from Südwestsaat GbR December 16, 2008 17 Total 2008 IPR&D $ 44
The IPR&D charges outlined above are shown as “Purchased in-process research and development charges” in the consolidated statements of income.The 2009 IPR&D charges related to a technology purchase for projects within the Ventures business, impacting Corporate. The 2008 IPR&D charges wererelated to projects within the Health and Agricultural Sciences segment.
NOTE E – DIVESTITURESDivestiture of the Styron Business UnitOn March 2, 2010, the Company announced the entry into a definitive agreement to sell the Styron business unit (“Styron”) to an affiliate of Bain CapitalPartners. The definitive agreement specified the assets and liabilities related to the businesses and products to be included in the sale. On June 17, 2010, thesale was completed for $1,561 million, net of working capital adjustments and costs to sell, with proceeds subject to customary post-closing adjustments.The proceeds included a $75 million long-term note receivable. In addition, the Company elected to acquire a 7.5 percent equity interest in the resultingprivately held, global materials company. Businesses and products sold included: Styrenics – polystyrene, acrylonitrile butadiene styrene, styreneacrylonitrile and expandable polystyrene; Emulsion Polymers; Polycarbonate and Compounds and Blends; Synthetic Rubber; and certain products from DowAutomotive Systems. Also included in the sale were certain styrene monomer assets and the Company’s 50-percent ownership interest in Americas StyrenicsLLC, a nonconsolidated affiliate. The transaction also resulted in several long-term supply, service and purchase agreements between Dow and Styron.
9 6

Table of Contents
Styron’s results of operations were not classified as discontinued operations, as the Company has continuing cash flows as a result of the supply,service and purchase agreements, and continues to hold an equity interest.
The following table presents the major classes of assets and liabilities divested by operating segment: Styron Assets and Liabilities Divested on June 17, 2010 In millions
PerfSystems
PerfProducts Plastics
Hydro-carbons Corp Total
Inventories $ 76 $ 9 6 $ 152 $ 144 - $ 468 Other current assets 53 238 201 27 $ 201 720 Investment in nonconsolidated affiliate - - 158 - - 158 Net property 140 137 126 8 - 411 Goodwill 94 17 30 - - 141 Other noncurrent assets - - - - 9 6 96 Total assets divested $ 363 $ 488 $ 667 $ 179 $ 297 $1,994 Current liabilities - - - - $ 347 $ 347 Other noncurrent liabilities - - - - 92 92 Total liabilities divested - - - - $ 439 $ 439 Components of accumulated other comprehensive income divested - - - - $ 45 $ 45 Net value divested $ 363 $ 488 $ 667 $ 179 $(187) $ 1,510
Post-closing adjustments were finalized in the fourth quarter of 2010. In 2010, the Company recognized a pretax gain of $27 million on the sale, net ofpost-closing adjustments of $24 million and including a net gain on the sale of two small, related joint ventures, working capital adjustments and additionalcosts to sell. The net gain was included in “Sundry income – net” and reflected in the following operating segments: Performance Systems ($7 million),Performance Products ($13 million) and Plastics ($7 million). The sale resulted in an after-tax loss of $56 million, primarily because goodwill related to thedivestiture was not tax deductible.
On February 3, 2011, Styron repaid the $75 million long-term note receivable, plus interest.
Divestitures Required as a Condition to the Acquisition of Rohm and HaasAs a condition of the FTC’s approval of the April 1, 2009 acquisition of Rohm and Haas, the Company was required to divest a portion of its acrylicmonomer business, a portion of its specialty latex business and its hollow sphere particle business. As a result, the Company recognized an impairmentcharge of $205 million related to these assets in the second quarter of 2009 restructuring charge (see Note C).
On July 31, 2009, the Company entered into a definitive agreement that included the sale of the portion of its acrylic monomer business and the portionof its specialty latex business. The sale was completed on January 25, 2010. Additional impairment charges of $8 million related to these assets wererecognized in the first quarter of 2010. In the second quarter of 2010, additional severance costs of $1 million and the write-off of other assets of $5 millionwere recognized (see Note C).
The Company completed the sale of its hollow sphere particle business in the second quarter of 2010 and recognized additional costs associated withdisposal activities of $7 million, related to contract termination fees (see Note C).
Divestiture of the Rohm and Haas Salt BusinessOn April 1, 2009, the Company announced the entry into a definitive agreement to sell the stock of Morton International, Inc. (“Morton”), the Salt business ofRohm and Haas, to K+S Aktiengesellschaft (“K+S”). On October 1, 2009, the Company completed the divestiture of its interest in Morton to K+S andreceived net proceeds of $1,576 million, with proceeds subject to customary post-closing adjustments. As a result, the Company recognized a pretax$37 million gain on the sale in the fourth quarter of 2009, included in “Sundry income – net,” and reflected in Corporate. One billion dollars in proceeds fromthis transaction were used to pay off the Term Loan Agreement used to fund the acquisition of Rohm and Haas (see Note P). The results of operations for theSalt business were reported in Corporate and were not material to the consolidated financial statements.
97

Table of Contents
Salt Business Assets and Liabilities Divested In millions
At Oct. 1, 2009
Current assets $ 374 Property 434 Other intangible assets 1,151 Deferred charges and other assets 102 Assets divested $2,061 Current liabilities $ 124 Deferred income tax liabilities – noncurrent 311 Pension and other postretirement benefits 89 Other noncurrent obligations 14 Liabilities divested $ 538
Divestiture of the Calcium Chloride BusinessOn June 30, 2009, the Company completed the sale of the Calcium Chloride business for net proceeds of $204 million and recognized a pretax gain of$162 million. The results of the Calcium Chloride business, including the second quarter of 2009 gain on the sale, are reflected as “Income from discontinuedoperations, net of income taxes” in the consolidated statements of income.
The following table presents the results of discontinued operations: Discontinued Operations In millions 2009 2008 Net sales $70 $153 Income before income taxes $175 $44 Provision for income taxes $ 6 5 $16 Income from discontinued operations, net of income taxes $110 $28
Divestiture of Investments in Nonconsolidated AffiliatesOn September 1, 2009, the Company completed the sale of its ownership interest in Total Raffinaderij Nederland N.V. (“TRN”), a nonconsolidated affiliate,and related inventory to Total S.A. for $742 million. This sale resulted in a pretax net gain of $457 million, which consisted of a gain of $513 millionreflected in “Sundry income – net” and a charge of $56 million related to the recognition of hedging losses which were recorded to “Cost of sales.” The gainimpacted the Hydrocarbons operating segment.
On September 30, 2009 the Company completed the sale of its ownership interest in the OPTIMAL Group of Companies (“OPTIMAL”),nonconsolidated affiliates, to Petroliam Nasional Berhad for net proceeds of $660 million. This sale resulted in a pretax gain of $339 million included in“Sundry income – net,” and reflected in the operating segments as follows: $1 million in Performance systems, $145 million in Performance Products and$193 million in Chemicals and Energy.
NOTE F – INVENTORIESThe following table provides a breakdown of inventories: Inventories at December 31 In millions 2010 2009 Finished goods $4,289 $3,887 Work in process 1,498 1,593 Raw materials 644 671 Supplies 6 5 6 696 Total inventories $7,087 $6,847
98

Table of Contents
The reserves reducing inventories from a FIFO basis to a LIFO basis amounted to $1,003 million at December 31, 2010 and $818 million atDecember 31, 2009. Inventories valued on a LIFO basis, principally hydrocarbon and U.S. chemicals and plastics product inventories, represented29 percent of the total inventories at December 31, 2010 and December 31, 2009.
A reduction of certain inventories resulted in the liquidation of some of the Company’s LIFO inventory layers, increasing pretax income $159 million in2010 and $84 million in 2009 and decreasing pretax income $45 million in 2008.
NOTE G – PROPERTY Property at December 31 In millions
EstimatedUseful Lives
(Years) 2010 2009 Land - $893 $942 Land and waterway improvements 15-25 1,264 1,342 Buildings 5-55 4,442 4,811 Machinery and equipment 3-20 37,224 39,983 Utility and supply lines 5-20 2,229 2,306 Other property 3-30 2,133 2,170 Construction in progress - 3,463 2,013 Total property $51,648 $53,567 In millions 2010 2009 2008 Depreciation expense $2,289 $2,291 $2,016 Manufacturing maintenance and repair costs $1,949 $1,473 $1,622 Capitalized interest $72 $61 $97
NOTE H – NONCONSOLIDATED AFFILIATES AND RELATED COMPANY TRANSACTIONSThe Company’s investments in related companies accounted for using the equity method (“nonconsolidated affiliates”) were $3,453 million at December 31,2010 and $3,224 million at December 31, 2009. At December 31, 2010, the carrying amount of the Company’s investments in nonconsolidated affiliates was$74 million more than its share of the investees’ net assets, exclusive of additional differences for Dow Corning Corporation (“Dow Corning”), MEGlobal andEquipolymers, which are discussed separately below. At December 31, 2009, the carrying amount of the Company’s investments in nonconsolidated affiliateswas $52 million more than its share of the investees’ net assets, exclusive of additional differences for Dow Corning, MEGlobal, Equipolymers and AmericasStyrenics LLC. Dividends received from the Company’s nonconsolidated affiliates were $668 million in 2010, $690 million in 2009 and $836 million in2008.
On May 15, 1995, Dow Corning, in which the Company is a 50-percent shareholder, voluntarily filed for protection under Chapter 11 of the U.S.Bankruptcy Code (see Note N). As a result, the Company fully reserved its investment in Dow Corning and reserved its 50-percent share of equity earningsfrom that time through the third quarter of 2000. In November 2000, following affirmation of the Bankruptcy Court’s order confirming the Joint Plan ofReorganization (the “Joint Plan”), the Company reviewed the value of its investment in Dow Corning, revised its assessment of the recoverability of itsinvestment, and determined that it had adequately provided for the other-than-temporary decline associated with the bankruptcy. On June 1, 2004, DowCorning’s Joint Plan became effective and Dow Corning emerged from bankruptcy. Since May 1995, a difference between the Company’s 50-percent share ofthe underlying equity of Dow Corning and the carrying value of this investment has existed, and the Company considers the difference to be permanent. TheCompany’s investment in Dow Corning was $227 million less than the Company’s proportionate share of Dow Corning’s underlying net assets atDecember 31, 2010 and December 31, 2009.
At December 31, 2010, the Company’s investment in MEGlobal was $250 million less than the Company’s proportionate share of MEGlobal’sunderlying net assets ($257 million less at December 31, 2009). This amount represents the difference between the value of certain assets of the joint ventureand the Company’s related valuation on a U.S. GAAP basis, of which $60 million is being amortized over the remaining useful lives of the assets and$190 million represents the Company’s share of the joint venture’s goodwill.
9 9

Table of Contents
At December 31, 2010, the Company’s investment in Equipolymers was $7 million less than the Company’s proportionate share of Equipolymers’underlying net assets ($8 million less at December 31, 2009). This amount represents the difference between the value of certain assets of the joint venture andthe Company’s related valuation on a U.S. GAAP basis, all of which is being amortized over the remaining useful lives of the assets. In the fourth quarter of2009, the Company recognized an impairment loss of $65 million related to its investment in Equipolymers.
At December 31, 2009, the Company’s investment in Americas Styrenics LLC was $136 million less than the Company’s proportionate share ofAmericas Styrenics LLC’s underlying net assets. This amount represented the difference between the book value of assets contributed to the joint venture bythe Company at the time of formation (May 1, 2008) and the Company’s 50-percent share of the total recorded value of the joint venture’s assets. TheCompany’s investment in Americas Styrenics LLC was sold on June 17, 2010, as part of the divestiture of Styron (see Note E).
See Note E for information regarding the divestiture of the Company’s investment in two additional nonconsolidated affiliates in 2009.
All of the nonconsolidated affiliates in which the Company has investments are privately held companies; therefore, quoted market prices are notavailable.
Principal Nonconsolidated AffiliatesDow’s principal nonconsolidated affiliates and the Company’s direct or indirect ownership interest for each at December 31, 2010, 2009 and 2008 are asfollows: Principal Nonconsolidated Affiliates at December 31 Ownership Interest 2010 2009 2008 Americas Styrenics LLC (1) - 50% 50% Compañía Mega S.A. 28% 28% 28% Dow Corning Corporation 50% 50% 50% EQUATE Petrochemical Company K.S.C. 42.5% 42.5% 42.5% Equipolymers 50% 50% 50% The Kuwait Olefins Company K.S.C. 42.5% 42.5% 42.5% MEGlobal 50% 50% 50% The OPTIMAL Group of Companies: (2)
OPTIMAL Chemicals (Malaysia) Sdn. Bhd. - - 50% OPTIMAL Glycols (Malaysia) Sdn. Bhd. - - 50% OPTIMAL Olefins (Malaysia) Sdn. Bhd. - - 23.75%
The SCG-Dow Group: Siam Polyethylene Company Limited 49% 49% 49% Siam Polystyrene Company Limited 50% 50% 50% Siam Styrene Monomer Co., Ltd. 50% 50% 50% Siam Synthetic Latex Company Limited 50% 50% 50%
Univation Technologies, LLC 50% 50% 50% (1) On June 17, 2010, the Company completed the sale of its ownership interest in Americas Styrenics LLC; see Note E.(2) On September 30, 2009, the Company completed the sale of its ownership interest in the OPTIMAL Group of
Companies; see Note E.
100

Table of Contents
The Company’s investment in its principal nonconsolidated affiliates was $2,635 million at December 31, 2010 and $2,359 million atDecember 31, 2009. Equity earnings from these companies were $1,032 million in 2010, $587 million in 2009 and $824 million in 2008. The summarizedfinancial information presented below represents the combined accounts (at 100 percent) of the principal nonconsolidated affiliates. Summarized Balance Sheet Information at December 31 In millions 2010 2009 Current assets $ 8,357 $ 6,916 Noncurrent assets 14,717 14,538 Total assets $ 23,074 $ 21,454 Current liabilities $ 4,338 $ 4,147 Noncurrent liabilities 11,345 10,504 Total liabilities $ 15,683 $ 14,651 Noncontrolling interests $ 647 $ 582 Summarized Income Statement Information In millions 2010 (1) 2009 (2) 2008 (3) Sales $ 14,702 $ 12,590 $ 15,508 Gross profit $ 3,833 $ 2,910 $ 4,064 Net income $ 2,189 $ 1,281 $ 1,940 (1) The summarized income statement information for 2010 includes the results
for Americas Styrenics LLC from January 1, 2010 through June 17, 2010;see Note E.
(2) The summarized income statement information for 2009 includes the resultsfor the OPTIMAL Group of Companies from January 1, 2009 throughSeptember 30, 2009; see Note E.
(3) The summarized income statement information for 2008 includes the resultsfor Americas Styrenics LLC from May 1, 2008 through December 31,2008.
The Company has service agreements with some of these entities, including contracts to manage the operations of manufacturing sites and theconstruction of new facilities; licensing and technology agreements; and marketing, sales, purchase and lease agreements.
Excess ethylene glycol produced in Dow’s plants in the United States and Europe is sold to MEGlobal and represented 1 percent of total net sales in2010 (1 percent of total net sales in 2009 and 2 percent of total net sales in 2008). In addition, the Company sells ethylene to MEGlobal as a raw material forits ethylene glycol plants in Canada. The impact of these sales to MEGlobal by operating segment is summarized below: Impact of Sales to MEGlobal by Operating Segment Percent of segment sales 2010 2009 2008 Chemicals and Energy 10% 10% 13% Hydrocarbons 3% 4% 3%
Overall, transactions with other nonconsolidated affiliates and balances due to and due from these entities were not material to the consolidated financialstatements.
101

Table of Contents
NOTE I – GOODWILL AND OTHER INTANGIBLE ASSETS
The following table shows changes in the carrying amount of goodwill for the year ended December 31, 2010, by operating segment: Goodwill Electronic Coatings
In millions
andSpecialty
Materials
andInfra-
structure
Healthand Ag
Sciences
PerfSystems
PerfProducts Plastics
Hydro-carbons Total
Gross goodwill at Jan. 1, 2010 $ 5,793 $ 4,236 $ 1,546 $ 1,175 $ 5 5 5 $ 9 5 $ 63 $ 13,463 Accumulated impairments at Jan. 1,
2010 - - - (213) (7) (30) - (250) Net goodwill at Jan. 1, 2010 $ 5,793 $ 4,236 $ 1,546 $ 962 $ 548 $ 6 5 $ 63 $ 13,213 Divestitures:
Styron - - - (94) (17) (30) - (141) Powder Coatings - (4) - - - - - (4) Hydrocarbon Resins (9) - - - - - - (9)
Foreign currency impact (37) (41) - (9) (5) - - (92) Net goodwill at Dec. 31, 2010 $ 5,747 $ 4,191 $ 1,546 $ 859 $ 526 $ 35 $ 63 $12,967 Accumulated impairments at Dec. 31,
2010 - - - 213 7 30 - 250 Gross goodwill at Dec. 31, 2010 $ 5,747 $ 4,191 $ 1,546 $ 1,072 $ 533 $ 6 5 $ 63 $ 13,217
The recording of the April 1, 2009 acquisition of Rohm and Haas (see Note D) resulted in goodwill of $9,707 million, which is not deductible for taxpurposes. During the first quarter of 2010, goodwill related to the acquisition of Rohm and Haas increased $99 million for net adjustments made during themeasurement period to the fair values of the assets acquired and liabilities assumed. In the table above, these adjustments have been retrospectively reflected inthe goodwill at January 1, 2010, in accordance with the accounting guidance for business combinations. The adjustments increased goodwill for the operatingsegments as follows: Electronic and Specialty Materials ($39 million), Coatings and Infrastructure ($51 million), Health and Agricultural Sciences($2 million), Performance Systems ($3 million) and Performance Products ($4 million).
As a result of the June 17, 2010 divestiture of Styron, $141 million of associated goodwill and $16 million of intangible assets were divested (seeNote E). On June 1, 2010, the Company divested its Powder Coatings business, including $4 million of associated goodwill and on October 1, 2010, theCompany divested its Hydrocarbon Resins business, including $9 million of associated goodwill.
Goodwill ImpairmentsDuring the fourth quarter of 2010, the Company performed its annual impairment tests for goodwill. As a result of this review, it was determined that noadditional goodwill impairments existed.
During the fourth quarter of 2009, the Company performed its annual impairment tests for goodwill. As a result of this review, it was determined thatthe goodwill associated with the Dow Haltermann reporting unit was impaired. The impairment was based on a review of the Dow Haltermann reporting unitperformed by management, in which discounted cash flows did not support the carrying value of the goodwill due to poor future projections for the business.As a result, an impairment loss of $7 million was recognized in the fourth quarter of 2009 against the Performance Products segment.
102

Table of Contents
During the fourth quarter of 2008, the Company performed its annual impairment tests for goodwill. As a result of this review, it was determined thatthe goodwill associated with the Dow Automotive Systems reporting unit was impaired. The impairment was based on a review of the Dow AutomotiveSystems reporting unit performed by management, in which discounted cash flows did not support the carrying value of the goodwill due to the severedownturn in the automotive industry and the future projections for the business. As a result, an estimated impairment loss of $209 million was recognized inthe fourth quarter of 2008 against the Performance Systems segment. The second step of goodwill impairment testing to determine the implied fair value ofgoodwill for the Dow Automotive Systems reporting unit was finalized in the first quarter of 2009. No adjustment was required to be made to the estimatedimpairment loss based on completion of the allocation process.
Also as a result of the 2008 annual tests, it was determined that the goodwill associated with the Polypropylene reporting unit was impaired. Theimpairment was based on a review of the Polypropylene reporting unit performed by management, in which discounted cash flows did not support thecarrying value of the goodwill due to demand decline in North America and Western Europe, as well as significant new industry capacity that came on streamin 2008 and additional industry capacity that was expected in 2009. As a result, an impairment loss of $30 million was recognized in the fourth quarter of2008 against the Plastics segment.
Other Intangible AssetsThe following table provides information regarding the Company’s other intangible assets: Other Intangible Assets at December 31 2010 2009
In millions
GrossCarrying
Amount
AccumulatedAmortization Net
GrossCarrying
Amount
AccumulatedAmortization Net
Intangible assets with finite lives: Licenses and intellectual property $ 1,733 $ (466) $1,267 $ 1,729 $ (320) $ 1,409 Patents 121 (95) 26 140 (107) 33 Software 9 6 5 (506) 459 875 (439) 436 Trademarks 693 (168) 525 694 (110) 584 Customer related 3,647 (492) 3,155 3,613 (261) 3,352 Other 122 (78) 44 142 (65) 77
Total other intangible assets, finite lives $ 7,281 $ (1,805) $5,476 $ 7,193 $ (1,302) $ 5,891 IPR&D (1), indefinite lives 54 - 54 75 - 75
Total other intangible assets $ 7,335 $ (1,805) $ 5,530 $ 7,268 $ (1,302) $5,966 (1) In-process research and development (“IPR&D”) purchased in a business combination.
Intangible assets acquired with the April 1, 2009 acquisition of Rohm and Haas amounted to $5,305 million including net adjustments made since theacquisition that increased the fair value of these assets $830 million. The following table provides information regarding the intangible assets acquired: Rohm and Haas Intangible AssetsAcquired on April 1, 2009In millions
GrossCarrying
Amount
Weighted-averageAmortization
Period Intangible assets with finite lives:
Licenses and intellectual property $ 1,410 10 years Software 73 3 years Trademarks 513 10 years Customer related 3,235 16 years
Total intangible assets, finite lives $ 5,231 14 years IPR&D, indefinite lives 74 -
Total intangible assets $ 5,305
During 2010, the Company acquired software for $20 million. The weighted-average amortization period for the acquired software is five years.
103

Table of Contents
The following table provides information regarding amortization expense: Amortization Expense In millions 2010 2009 2008 Other intangible assets, excluding software $509 $399 $92 Software, included in “Cost of sales” $ 87 $ 76 $48
Total estimated amortization expense for the next five fiscal years is as follows: Estimated Amortization Expense for Next Five Years In millions 2011 $ 616 2012 $ 557 2013 $ 537 2014 $ 512 2015 $ 494
NOTE J – FINANCIAL INSTRUMENTS
InvestmentsThe Company’s investments in marketable securities are primarily classified as available-for-sale. Investing Results In millions 2010 2009 2008 Proceeds from sales of available-for-sale securities $981 $593 $851 Gross realized gains $ 69 $ 32 $ 56 Gross realized losses $(26) $(28) $(18)
The following table summarizes the contractual maturities of the Company’s investments in debt securities: Contractual Maturities of Debt Securities at December 31, 2010 In millions Amortized Cost Fair Value Within one year $ 46 $ 46 One to five years 525 572 Six to ten years 547 585 After ten years 245 269 Total $1,363 $1,472
At December 31, 2010, the Company had $3,200 million of held-to-maturity securities (primarily Treasury Bills) classified as cash equivalents, asthese securities had original maturities of three months or less. At December 31, 2009, the Company had no such securities. The Company’s investments inheld-to-maturity securities are held at amortized cost, which approximates fair value. At December 31, 2010, the Company had investments in money marketfunds of $35 million classified as cash equivalents ($164 million at December 31, 2009).
The net unrealized gain recognized during 2010 on trading securities held at December 31, 2010 was $14 million ($7 million at December 31, 2009).
104

Table of Contents
The following tables provide the fair value and gross unrealized losses of the Company’s investments that were deemed to be temporarily impaired atDecember 31, 2010 and 2009, aggregated by investment category and length of time that individual securities had been in a continuous unrealized lossposition: Temporarily Impaired Securities at December 31, 2010 (1)
Less than 12 months
In millions
FairValue
UnrealizedLosses
Debt securities: Government debt (2) $ 62 $(2) Corporate bonds 43 (1)
Total debt securities $105 $(3) Equity securities 52 (3) Total temporarily impaired securities $157 $(6) (1) Unrealized losses of 12 months or more were less than $1 million.(2) U.S. Treasury obligations, U.S. agency obligations, agency mortgage-
backed securities and other municipalities’ obligations. Temporarily Impaired Securities at December 31, 2009
Less than 12 months 12 months or more Total
In millions
FairValue
UnrealizedLosses
FairValue
UnrealizedLosses
FairValue
UnrealizedLosses
Debt securities: Government debt (1) $217 $(4) - - $217 $(4) Corporate bonds 27 (1) $13 $(1) 40 (2)
Total debt securities $244 $(5) $13 $(1) $257 $(6) Equity securities 40 (2) 7 (1) 47 (3) Total temporarily impaired securities $284 $(7) $20 $(2) $304 $(9) (1) U.S. Treasury obligations, U.S. agency obligations, agency mortgage-backed securities and other municipalities’ obligations.
Portfolio managers regularly review the Company’s holdings to determine if any investments are other-than-temporarily impaired. The analysis includesreviewing the amount of the impairment, as well as the length of time it has been impaired. In addition, specific guidelines for each instrument type arefollowed to determine if an other-than-temporary impairment has occurred.
For debt securities, the credit rating of the issuer, current credit rating trends, the trends of the issuer’s overall sector, the ability of the issuer to payexpected cash flows and the length of time the security has been in a loss position are considered in determining whether unrealized losses represent an other-than-temporary impairment. The Company did not have any credit-related losses during 2010 or 2009.
For equity securities, the Company’s investments are primarily in Standard & Poor’s (“S&P”) 500 companies; however, the Company’s policies allowinvestments in companies outside of the S&P 500. The largest holdings are Exchange Traded Funds that represent the S&P 500 index or an S&P 500 sectoror subset. The Company considers the evidence to support the recovery of the cost basis of a security including volatility of the stock, the length of time thesecurity has been in a loss position, value and growth expectations, and overall market and sector fundamentals, as well as technical analysis, in determiningwhether unrealized losses represent an other-than-temporary impairment. In 2010, other-than-temporary impairment write-downs on investments still held bythe Company were $5 million ($93 million in 2009).
The aggregate cost of the Company’s cost method investments totaled $171 million at December 31, 2010 ($129 million at December 31, 2009). Due tothe nature of these investments, the fair market value is not readily determinable. These investments are reviewed for impairment indicators. During 2010, theCompany’s impairment analysis identified indicators that resulted in a reduction in the cost basis of these investments of $16 million; the analysis resulted ina reduction of $10 million for the year ended December 31, 2009.
105

Table of Contents
The following table summarizes the fair value of financial instruments at December 31, 2010 and 2009: Fair Value of Financial Instruments at December 31 2010 2009 In millions Cost Gain Loss Fair Value Cost Gain Loss Fair Value Marketable securities (1):
Debt securities: Government debt (2) $ 603 $ 40 $ (2) $ 641 $ 676 $ 25 $ (4) $ 697 Corporate bonds 760 72 (1) 831 868 5 6 (2) 922
Total debt securities $ 1,363 $ 112 $ (3) $ 1,472 $ 1,544 $ 81 $ (6) $ 1,619 Equity securities 501 94 (3) 592 455 6 5 (3) 517
Total marketable securities $ 1,864 $ 206 $ (6) $ 2,064 $ 1,999 $ 146 $ (9) $ 2,136 Long-term debt including debt due within one year (3) $(22,360) $175 $(2,530) $ (24,715) $(20,234) $126 $(1,794) $ (21,902) Derivatives relating to:
Foreign currency - $ 40 $ (38) $ 2 - $ 81 $ (20) $ 61 Commodities - $ 14 $ (4) $ 10 - $ 5 $ (18) $ (13)
(1) Included in “Other investments” in the consolidated balance sheets.(2) U.S. Treasury obligations, U.S. agency obligations, agency mortgage-backed securities and other municipalities’ obligations.(3) Cost includes fair value adjustments of $23 million at December 31, 2010 and $25 million at December 31, 2009.
Risk ManagementDow’s business operations give rise to market risk exposure due to changes in interest rates, foreign currency exchange rates, commodity prices and othermarket factors such as equity prices. To manage such risks effectively, the Company enters into hedging transactions, pursuant to established guidelines andpolicies, which enable it to mitigate the adverse effects of financial market risk. Derivatives used for this purpose are designated as cash flow, fair value or netforeign investment hedges where appropriate. The guidance requires companies to recognize all derivative instruments as either assets or liabilities at fair value.A secondary objective is to add value by creating additional nonspecific exposures within established limits and policies; derivatives used for this purpose arenot designated as hedges. The potential impact of creating such additional exposures is not material to the Company’s results.
The Company’s risk management program for interest rate, foreign currency and commodity risks is based on fundamental, mathematical andtechnical models that take into account the implicit cost of hedging. Risks created by derivative instruments and the mark-to-market valuations of positionsare strictly monitored at all times, using value at risk and stress tests. Credit risk arising from these contracts is not significant because the Companyminimizes counterparty concentration, deals primarily with major financial institutions of solid credit quality, and the majority of its hedging transactionsmature in less than three months. In addition, the Company minimizes concentrations of credit risk through its global orientation in diverse businesses with alarge number of diverse customers and suppliers. It is the Company’s policy not to have credit-risk-related contingent features in its derivative instruments.The Company does not anticipate losses from credit risk and the net cash requirements arising from counterparty risk associated with risk managementactivities are not expected to be material in 2011. No significant concentration of credit risk existed at December 31, 2010.
The Company reviews its overall financial strategies and the impacts from using derivatives in its risk management program with the Company’sBoard of Directors and revises its strategies as market conditions dictate.
Interest Rate Risk ManagementThe Company enters into various interest rate contracts with the objective of lowering funding costs or altering interest rate exposures related to fixed andvariable rate obligations. In these contracts, the Company agrees with other parties to exchange, at specified intervals, the difference between fixed and floatinginterest amounts calculated on an agreed-upon notional principal amount. At December 31, 2010, the Company had no open interest rate swaps.
106

Table of Contents
Foreign Currency Risk ManagementThe Company’s global operations require active participation in foreign exchange markets. The Company enters into foreign exchange forward contracts andoptions, and cross-currency swaps to hedge various currency exposures or create desired exposures. Exposures primarily relate to assets, liabilities and bondsdenominated in foreign currencies, as well as economic exposure, which is derived from the risk that currency fluctuations could affect the dollar value offuture cash flows related to operating activities. The primary business objective of the activity is to optimize the U.S. dollar value of the Company’s assets,liabilities and future cash flows with respect to exchange rate fluctuations. Assets and liabilities denominated in the same foreign currency are netted, and onlythe net exposure is hedged. At December 31, 2010, the Company had forward contracts, options and cross-currency swaps to buy, sell or exchange foreigncurrencies. These contracts had various expiration dates, primarily in the first quarter of 2011.
Commodity Risk ManagementThe Company has exposure to the prices of commodities in its procurement of certain raw materials. The primary purpose of commodity hedging activities isto manage the price volatility associated with these forecasted inventory purchases. At December 31, 2010, the Company had futures contracts, options andswaps to buy, sell or exchange commodities. These agreements had various expiration dates primarily in 2011.
Accounting for Derivative Instruments and Hedging ActivitiesCash Flow HedgesFor derivatives that are designated and qualify as cash flow hedging instruments, the effective portion of the gain or loss on the derivative is recorded in“Accumulated other comprehensive income (loss)” (“AOCI”); it is reclassified to “Cost of sales” in the same period or periods that the hedged transactionaffects income. The unrealized amounts in AOCI fluctuate based on changes in the fair value of open contracts at the end of each reporting period. TheCompany anticipates volatility in AOCI and net income from its cash flow hedges. The amount of volatility varies with the level of derivative activities andmarket conditions during any period. Gains and losses on the derivative representing either hedge ineffectiveness or hedge components excluded from theassessment of effectiveness are recognized in current period income.
The net loss from previously terminated interest rate cash flow hedges included in AOCI at December 31, 2010 was $2 million after tax ($2 million aftertax at December 31, 2009). During 2010, 2009 and 2008, there was no material impact on the consolidated financial statements due to interest rate hedgeineffectiveness. The Company had no open interest rate derivatives at December 31, 2010 (notional U.S. dollar equivalent of $30 million at December 31,2009).
Current open foreign currency forward contracts hedge the currency risk of forecasted feedstock purchase transactions until April 2011. The effectiveportion of the mark-to-market effects of the foreign currency forward contracts is recorded in AOCI; it is reclassified to income in the same period or periodsthat the underlying feedstock purchase affects income. The net loss from the foreign currency hedges included in AOCI at December 31, 2010 was $4 millionafter tax (net loss of $5 million after tax at December 31, 2009). During 2010, 2009 and 2008, there was no material impact on the consolidated financialstatements due to foreign currency hedge ineffectiveness. At December 31, 2010, the Company had open forward contracts with various expiration dates tobuy, sell or exchange foreign currencies with a notional U.S. dollar equivalent of $827 million ($645 million at December 31, 2009).
Commodity swaps, futures and option contracts with maturities of not more than 36 months are utilized and designated as cash flow hedges offorecasted commodity purchases. Current open contracts hedge forecasted transactions until December 2011. The effective portion of the mark-to-market effectof the cash flow hedge instrument is recorded in AOCI; it is reclassified to income in the same period or periods that the underlying commodity purchaseaffects income. Due to the September 1, 2009 sale of TRN, the Company recognized a pretax loss of $56 million for cash flow hedges of forecasted purchasesthat will not occur as a result of the sale (see Note E). The net gain from commodity hedges included in AOCI at December 31, 2010 was $3 million after tax(zero at December 31, 2009). During 2010, 2009 and 2008, there was no material impact on the consolidated financial statements due to commodity hedgeineffectiveness. At December 31, 2010 and 2009, the Company had the following aggregate notionals of outstanding commodity forward contracts to hedgeforecasted purchases: Commodity 2010 2009 Notional Volume Unit Crude Oil 0.1 0.7 million barrels Ethane 1.6 - million barrels Naphtha - 50 kilotons Natural
Gas 2.7 2.0 million million British thermal units
107

Table of Contents
Fair Value HedgesFor derivative instruments that are designated and qualify as fair value hedges, the gain or loss on the derivative as well as the offsetting loss or gain on thehedged item attributable to the hedged risk are recognized in current period income and reflected as “Interest expense and amortization of debt discount” in theconsolidated statements of income. The short-cut method is used when the criteria are met. The Company had no open interest rate swaps designated as fairvalue hedges of underlying fixed rate debt obligations at December 31, 2010 and 2009.
Net Foreign Investment HedgesFor derivative instruments that are designated and qualify as net foreign investment hedges, the effective portion of the gain or loss on the derivative is includedin “Cumulative Translation Adjustments” in AOCI. The results of hedges of the Company’s net investment in foreign operations included in “CumulativeTranslation Adjustments” in AOCI was a net gain of $70 million after tax at December 31, 2010 (net loss of $56 million after tax at December 31, 2009).During 2010, 2009 and 2008 there was no material impact on the consolidated financial statements due to hedge ineffectiveness. At December 31, 2010 and2009, the Company had no open forward contracts or outstanding options to buy, sell or exchange foreign currencies. At December 31, 2010, the Companyhad outstanding foreign-currency denominated debt designated as a hedge of net foreign investment of $1,250 million ($1,879 million at December 31, 2009).
Other Derivative InstrumentsThe Company utilizes futures, options and swap instruments that are effective as economic hedges of commodity price exposures, but do not meet the hedgeaccounting criteria in the accounting guidance for derivatives and hedging. At December 31, 2010 and 2009, the Company had the following aggregatenotionals of outstanding commodity contracts: Commodity 2010 2009 Notional Volume Unit Ethane 3.8 0.9 million barrels Natural Gas 12.0 2.8 million million British thermal units
The Company also uses foreign exchange forward contracts, options, and cross-currency swaps that are not designated as hedging instrumentsprimarily to manage foreign currency and interest rate exposure. The Company had open foreign exchange contracts with various expiration dates to buy, sellor exchange foreign currencies and a notional U.S. dollar equivalent of $13,944 million at December 31, 2010 ($15,312 million at December 31, 2009).
The following table provides the fair value and gross balance sheet classification of derivative instruments: Fair Value of Derivative Instruments at December 31 In millions Balance Sheet Classification 2010 2009 Asset Derivatives Derivatives designated as hedges:
Foreign currency Accounts and notes receivable – Other $ 9 $ 4 Commodities Accounts and notes receivable – Other 7 4 Total derivatives designated as hedges $ 16 $ 8
Derivatives not designated as hedges: Foreign currency Accounts and notes receivable – Other $ 77 $125 Commodities Accounts and notes receivable – Other 23 28 Total derivatives not designated as hedges $ 100 $ 153
Total asset derivatives $116 $161 Liability Derivatives Derivatives designated as hedges:
Foreign currency Accounts payable – Other $ 20 $ 3 Commodities Accounts payable – Other 8 - Total derivatives designated as hedges $ 28 $ 3
Derivatives not designated as hedges: Foreign currency Accounts payable – Other $ 64 $ 6 5 Commodities Accounts payable – Other 16 42 Total derivatives not designated as hedges $ 80 $ 107
Total liability derivatives $ 108 $ 110
108

Table of Contents
Effect of Derivative Instruments at December 31, 2010
Change inUnrealized
Gain (Loss) Income Statement
LossReclassified
from AOCI to
AdditionalGain (Loss)
Recognized in In millions in AOCI (1,2) Classification Income (3) Income (3,4) Derivatives designated as hedges:
Fair value: Interest rates - Interest expense (5) $(1) $(2)
Cash flow: Commodities $(10) Cost of sales (14) - Foreign currency 1 Cost of sales - -
Net foreign investment: Foreign currency (16) n/a - -
Total derivatives designated as hedges $(25) $(15) $(2) Derivatives not designated as hedges:
Foreign currency (6) - Sundry income – net - $155 Commodities - Cost of sales - 5
Total derivatives not designated as hedges - - $160 Total derivatives $(25) $(15) $158
Effect of Derivative Instruments at December 31, 2009
Change inUnrealized
Loss in Income Statement
Gain (Loss)Reclassified
from AOCI to
AdditionalGain (Loss)
Recognized in In millions AOCI (1,2) Classification Income (3) Income (3,4) Derivatives designated as hedges:
Fair value: Interest rates - Interest expense (5) - $(1)
Cash flow: Interest rates - Cost of sales $(9) - Interest rates - Interest expense (5) (1) - Commodities $(2) Cost of sales (306) (1) Foreign currency (10) Cost of sales 11 -
Total derivatives designated as hedges $(12) $(305) $(2) Derivatives not designated as hedges:
Foreign currency (6) - Sundry income – net - $(32) Commodities - Cost of sales - 3
Total derivatives not designated as hedges - - $(29) Total derivatives $(12) $(305) $(31) (1) Accumulated other comprehensive income (loss) (“AOCI”).(2) Net unrealized gains (losses) from hedges related to interest rates and commodities are included in “Accumulated Derivative Gain (Loss) – Net hedging
results” in the consolidated statements of equity; net unrealized gains (losses) from hedges related to foreign currency (net of tax) are included in“Cumulative Translation Adjustments – Translation adjustments” in the consolidated statements of equity.
(3) Pretax amounts.(4) Amounts impacting income not related to AOCI reclassification; also includes immaterial amounts of hedge ineffectiveness.(5) Interest expense and amortization of debt discount.(6) Foreign currency derivatives not designated as hedges are offset by foreign exchange gains/losses resulting from the underlying exposures of foreign
currency denominated assets and liabilities.
The net after-tax amounts to be reclassified from AOCI to income within the next 12 months are a $1 million loss for interest rate contracts, a $3 milliongain for commodity contracts and a $4 million loss for foreign currency contracts.
109

Table of Contents
NOTE K – FAIR VALUE MEASUREMENTSThe following tables summarize the bases used to measure certain assets and liabilities at fair value on a recurring basis in the consolidated balance sheets atDecember 31, 2010 and 2009: Basis of Fair Value Measurements on a Recurring Basis at December 31, 2010
Quoted Pricesin Active
Markets forIdentical Items
SignificantOther
ObservableInputs
SignificantUnobservable
Inputs
Counterpartyand CashCollateral
In millions (Level 1) (Level 2) (Level 3) Netting (1) Total Assets at fair value:
Interests in trade accounts receivable conduits (2) - - $1,267 - $1,267 Equity securities (3) $556 $36 - - 592 Debt securities: (3)
Government debt (4) - 641 - - 641 Corporate bonds - 831 - - 831
Derivatives relating to: (5) Foreign currency - 86 - $(46) 40 Commodities 12 18 - (16) 14
Total assets at fair value $568 $1,612 $1,267 $(62) $3,385 Liabilities at fair value:
Derivatives relating to: (5) Foreign currency - $84 - $(46) $38 Commodities $7 17 - (20) 4
Total liabilities at fair value $7 $101 - $(66) $42 Basis of Fair Value Measurements on a Recurring Basis at December 31, 2009
Quoted Pricesin Active
Markets forIdentical Items
SignificantOther
ObservableInputs
Counterpartyand CashCollateral
In millions (Level 1) (Level 2) Netting (1) Total Assets at fair value:
Equity securities (3) $483 $34 - $517 Debt securities (3)
Government debt (4) - 697 - 697 Corporate bonds - 922 - 922
Derivatives relating to: (5) Foreign currency - 129 $(48) 81 Commodities 28 4 (27) 5
Total assets at fair value $511 $1,786 $(75) $2,222 Liabilities at fair value:
Derivatives relating to: (5) Foreign currency - $68 $(48) $20 Commodities $24 18 (24) 18
Total liabilities at fair value $24 $86 $(72) $38 (1) Cash collateral is classified as “Accounts and notes receivable – Other” in the consolidated balance sheets. Amounts
represent the estimated net settlement amount when applying netting and set-off rights included in master nettingarrangements between the Company and its counterparties and the payable or receivable for cash collateral held orplaced with the same counterparty.
(2) Included in “Accounts and notes receivable – Other” in the consolidated balance sheets. See Note O for additionalinformation on transfers of financial assets.
(3) The Company’s investments in equity and debt securities are primarily classified as available-for-sale and areincluded in “Other investments” in the consolidated balance sheets.
(4) U.S. Treasury obligations, U.S. agency obligations, agency mortgage-backed securities and other municipalities’obligations.
(5) See Note J for the classification of derivatives in the consolidated balance sheets.
110

Table of Contents
Assets and liabilities related to forward contracts, interest rate swaps, currency swaps, options and other conditional or exchange contracts executed withthe same counterparty under a master netting arrangement are netted. Collateral accounts are netted with corresponding assets and liabilities. The Companyposted cash collateral of $4 million at December 31, 2010, classified as “Accounts and notes receivable – Other” in the consolidated balance sheets.
For assets and liabilities classified as Level 1 measurements (measured using quoted prices in active markets), total fair value is either the price of themost recent trade at the time of the market close or the official close price, as defined by the exchange on which the asset is most actively traded on the lasttrading day of the period, multiplied by the number of units held without consideration of transaction costs.
For assets and liabilities classified as Level 2 measurements, where the security is frequently traded in less active markets, fair value is based on theclosing price at the end of the period; where the security is less frequently traded, fair value is based on the price a dealer would pay for the security or similarsecurities, adjusted for any terms specific to that asset or liability. Market inputs are obtained from well-established and recognized vendors of market dataand subjected to tolerance/quality checks. For derivative assets and liabilities, standard industry models are used to calculate the fair value of the variousfinancial instruments based on significant observable market inputs, such as foreign exchange rates, commodity prices, swap rates, interest rates and impliedvolatilities obtained from various market sources.
For all other assets and liabilities for which observable inputs are used, fair value is derived through the use of fair value models, such as a discountedcash flow model or other standard pricing models. See Note J for further information on the types of instruments used by the Company for risk management.
There were no significant transfers between Levels 1 and 2 during the year ended December 31, 2010.
For assets classified as Level 3 measurements, fair value is based on significant unobservable inputs including assumptions where there is little, if any,market activity. The fair value of the Company’s interests held in trade receivable conduits is determined by calculating the expected amount of cash to bereceived using the key input of anticipated credit losses in the portfolio of receivables sold that have not yet been collected (1.42 percent for North America andzero for Europe at December 31, 2010). Given the short-term nature of the underlying receivables, discount rate and prepayments are not factors in determiningthe fair value of the interests. See Note O for further information on assets classified as Level 3 measurements.
The following table summarizes the changes in fair value measurements using Level 3 inputs for the year ended December 31, 2010: Fair Value Measurements Using Level 3 Inputs Interests Held in Trade Receivable Conduits (1) In millions 2010 Balance at January 1, 2010 - Gain included in earnings $ 8 Purchases, sales and settlements – North America 1,102 Purchases, sales and settlements – Europe 157 Balance at December 31, 2010 $1,267 (1) Included in “Accounts and notes receivable – Other” in the
consolidated balance sheets.
111

Table of Contents
Fair Value Measurements on a Nonrecurring BasisThe following table summarizes the bases used to measure certain assets and liabilities at fair value on a nonrecurring basis in 2010: Basis of Fair Value Measurements on a Nonrecurring Basis in 2010
SignificantOther
UnobservableInputs
TotalLosses
In millions (Level 3) 2010 Assets at fair value:
Long-lived and other assets - $ (75)
After evaluating expected future investments in conjunction with expected future cash flows, a $48 million asset impairment charge was recognized inthe Polyurethanes business in the fourth quarter of 2010. The Company’s evaluation of strategic alternatives for Epoxy capacity resulted in an $18 millionasset impairment charge in the fourth quarter of 2010. Due to a change in the scope of a capital project, a $9 million asset impairment charge was recognizedin Dow Automotive Systems in the fourth quarter of 2010. In all cases, the assets were written down to zero. The charges were included in “Cost of sales” inthe consolidated statements of income and reflected in the Performance Products ($66 million) and Performance Systems ($9 million) segments.
The following table summarizes the bases used to measure certain assets and liabilities at fair value on a nonrecurring basis in 2009: Basis of Fair Value Measurementson a Nonrecurring Basis in 2009
SignificantOther
ObservableInputs
SignificantOther
UnobservableInputs
TotalLosses
In millions (Level 2) (Level 3) Total 2009 Assets at fair value:
Long-lived and other assets - $30 $ 30 $(464) Net assets held for sale $1,657 - 1,657 - Goodwill - - - (7)
Total assets at fair value $1,657 $30 $ 1,687 $(471)
As part of the restructuring plan that was approved on June 30, 2009, the Company will shut down a number of manufacturing facilities by the end of2011. As a result, long-lived assets with a carrying value of $425 million were written down to the fair value of $26 million, resulting in an impairmentcharge of $399 million, which was included in the second quarter of 2009 restructuring charge (see Note C). In the fourth quarter of 2009, the Companyrecognized an impairment loss of $65 million related to its investment in Equipolymers with a remaining fair value of the investment of $4 million. The long-lived assets were valued based on bids received from third parties and using discounted cash flow analysis based on assumptions that market participantswould use. Key inputs included anticipated revenues, associated manufacturing costs, capital expenditures and discount, growth and tax rates.
On April 1, 2009, the Company announced the entry into a definitive agreement to sell the newly acquired stock of Morton International, Inc., the Saltbusiness of Rohm and Haas, to K+S Aktiengesellschaft. The assets were classified as held for sale with a net carrying value of $1,657 million atSeptember 30, 2009. The held for sale assets were valued based on the definitive agreement with K+S Aktiengesellschaft, less estimated cost to sell. The assetswere sold on October 1, 2009 (see Note E).
During the fourth quarter of 2009, the Company performed its annual impairment tests for goodwill. As a result of this review, it was determined thatthe goodwill associated with the Dow Haltermann reporting unit was impaired. The impairment was based on a review of the Dow Haltermann reporting unitperformed by management, in which discounted cash flows did not support the carrying value of the goodwill due to poor future projections for the business.As a result, an impairment loss of $7 million was recognized in the fourth quarter of 2009 against the Performance Products segment.
112

Table of Contents
NOTE L – SUPPLEMENTARY INFORMATION
Accrued and Other Current Liabilities“Accrued and other current liabilities” were $3,358 million at December 31, 2010 and $3,209 million at December 31, 2009. Accrued payroll, which is acomponent of “Accrued and other current liabilities,” was $917 million at December 31, 2010 and $736 million at December 31, 2009. No other componentof accrued liabilities was more than 5 percent of total current liabilities.
Sundry Income – Net In millions 2010 2009 2008 Gain on sale of TRN - $ 513 - Gain on sale of OPTIMAL - 339 - Gain on sale of Styron $ 27 - - Obligation related to past divestiture (47) - - Loss on early extinguishment of debt (46) (56) - Gain on sales of other assets and securities 166 100 $ 91 Foreign exchange gain (loss) (6) 1 (17) Dividend income - - 3 Other – net 31 (6) 12 Total sundry income – net $ 125 $ 891 $ 89
Other Supplementary Information In millions 2010 2009 2008 Cash payments for interest $1,535 $1,140 $ 713 Cash payments for income taxes $ 598 $ 1,034 $ 864 Provision for doubtful receivables (1) $ 6 $ 11 $ 20 (1) Included in “Selling, general and administrative expenses” in the consolidated statements
of income.
113
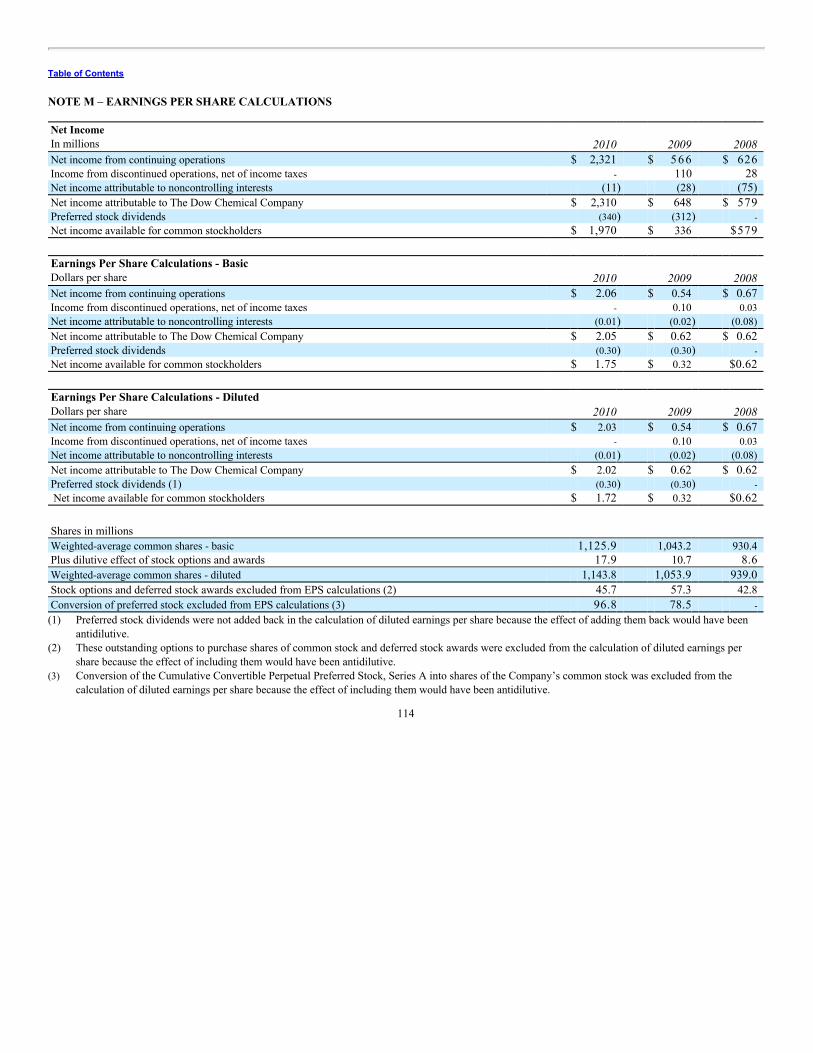
Table of Contents
NOTE M – EARNINGS PER SHARE CALCULATIONS Net Income In millions 2010 2009 2008 Net income from continuing operations $ 2,321 $ 5 6 6 $ 626 Income from discontinued operations, net of income taxes - 110 28 Net income attributable to noncontrolling interests (11) (28) (75) Net income attributable to The Dow Chemical Company $ 2,310 $ 648 $ 579 Preferred stock dividends (340) (312) - Net income available for common stockholders $ 1,970 $ 336 $579 Earnings Per Share Calculations - Basic Dollars per share 2010 2009 2008 Net income from continuing operations $ 2.06 $ 0.54 $ 0.67 Income from discontinued operations, net of income taxes - 0.10 0.03 Net income attributable to noncontrolling interests (0.01) (0.02) (0.08) Net income attributable to The Dow Chemical Company $ 2.05 $ 0.62 $ 0.62 Preferred stock dividends (0.30) (0.30) - Net income available for common stockholders $ 1.75 $ 0.32 $0.62 Earnings Per Share Calculations - Diluted Dollars per share 2010 2009 2008 Net income from continuing operations $ 2.03 $ 0.54 $ 0.67 Income from discontinued operations, net of income taxes - 0.10 0.03 Net income attributable to noncontrolling interests (0.01) (0.02) (0.08) Net income attributable to The Dow Chemical Company $ 2.02 $ 0.62 $ 0.62 Preferred stock dividends (1) (0.30) (0.30) - Net income available for common stockholders $ 1.72 $ 0.32 $0.62 Shares in millions Weighted-average common shares - basic 1,125.9 1,043.2 930.4 Plus dilutive effect of stock options and awards 17.9 10.7 8.6 Weighted-average common shares - diluted 1,143.8 1,053.9 939.0 Stock options and deferred stock awards excluded from EPS calculations (2) 45.7 57.3 42.8 Conversion of preferred stock excluded from EPS calculations (3) 96.8 78.5 - (1) Preferred stock dividends were not added back in the calculation of diluted earnings per share because the effect of adding them back would have been
antidilutive.(2) These outstanding options to purchase shares of common stock and deferred stock awards were excluded from the calculation of diluted earnings per
share because the effect of including them would have been antidilutive.(3) Conversion of the Cumulative Convertible Perpetual Preferred Stock, Series A into shares of the Company’s common stock was excluded from the
calculation of diluted earnings per share because the effect of including them would have been antidilutive.
114

Table of Contents
NOTE N – COMMITMENTS AND CONTINGENT LIABILITIES
Litigation
Breast Implant MattersOn May 15, 1995, Dow Corning Corporation (“Dow Corning”), in which the Company is a 50-percent shareholder, voluntarily filed for protection underChapter 11 of the Bankruptcy Code to resolve litigation related to Dow Corning’s breast implant and other silicone medical products. On June 1, 2004, DowCorning’s Joint Plan of Reorganization (the “Joint Plan”) became effective and Dow Corning emerged from bankruptcy. The Joint Plan contains release andinjunction provisions resolving all tort claims brought against various entities, including the Company, involving Dow Corning’s breast implant and othersilicone medical products.
To the extent not previously resolved in state court actions, cases involving Dow Corning’s breast implant and other silicone medical products filedagainst the Company were transferred to the U.S. District Court for the Eastern District of Michigan (the “District Court”) for resolution in the context of theJoint Plan. On October 6, 2005, all such cases then pending in the District Court against the Company were dismissed. Should cases involving DowCorning’s breast implant and other silicone medical products be filed against the Company in the future, they will be accorded similar treatment. It is theopinion of the Company’s management that the possibility is remote that a resolution of all future cases will have a material adverse impact on the Company’sconsolidated financial statements.
As part of the Joint Plan, Dow and Corning Incorporated agreed to provide a credit facility to Dow Corning in an aggregate amount of $300 million,which was reduced to $200 million effective June 1, 2010. The Company’s share of the credit facility was originally $150 million, but was reduced to$100 million effective June 1, 2010, and is subject to the terms and conditions stated in the Joint Plan. At December 31, 2010, no draws had been takenagainst the credit facility.
DBCP MattersNumerous lawsuits have been brought against the Company and other chemical companies, both inside and outside of the United States, alleging that themanufacture, distribution or use of pesticides containing dibromochloropropane (“DBCP”) has caused personal injury and property damage, includingcontamination of groundwater. It is the opinion of the Company’s management that the possibility is remote that the resolution of such lawsuits will have amaterial adverse impact on the Company’s consolidated financial statements.
Environmental MattersAccruals for environmental matters are recorded when it is probable that a liability has been incurred and the amount of the liability can be reasonablyestimated based on current law and existing technologies. At December 31, 2010, the Company had accrued obligations of $607 million for probableenvironmental remediation and restoration costs, including $59 million for the remediation of Superfund sites. This is management’s best estimate of thecosts for remediation and restoration with respect to environmental matters for which the Company has accrued liabilities, although the ultimate cost withrespect to these particular matters could range up to approximately twice that amount. Consequently, it is reasonably possible that environmental remediationand restoration costs in excess of amounts accrued could have a material adverse impact on the Company’s results of operations, financial condition and cashflows. It is the opinion of the Company’s management, however, that the possibility is remote that costs in excess of the range disclosed will have a materialadverse impact on the Company’s results of operations, financial condition and cash flows. Inherent uncertainties exist in these estimates primarily due tounknown conditions, changing governmental regulations and legal standards regarding liability, and emerging remediation technologies for handling siteremediation and restoration. At December 31, 2009, the Company had accrued obligations of $619 million for probable environmental remediation andrestoration costs, including $80 million for the remediation of Superfund sites.
The following table summarizes the activity in the Company’s accrued obligations for environmental matters for the years ended December 31, 2010 and2009: Accrued Obligations for Environmental Matters In millions 2010 2009 Balance at January 1 $ 619 $ 312 Additional accruals 159 271 Assumed from Rohm and Haas - 159 Charges against reserve (171) (143) Foreign currency impact - 20 Balance at December 31 $ 607 $619
115

Table of Contents
The amounts charged to income on a pretax basis related to environmental remediation totaled $158 million in 2010, $269 million in 2009 and$140 million in 2008. Capital expenditures for environmental protection were $173 million in 2010, $219 million in 2009 and $193 million in 2008.
Midland Off-Site Environmental MattersOn June 12, 2003, the Michigan Department of Natural Resources and Environment (“MDNRE,” formerly the Michigan Department of EnvironmentalQuality or MDEQ) issued a Hazardous Waste Operating License (the “License”) to the Company’s Midland, Michigan manufacturing site (the “Midlandsite”), which included provisions requiring the Company to conduct an investigation to determine the nature and extent of off-site contamination in the City ofMidland soils; the Tittabawassee River and Saginaw River sediment and floodplain soils; and the Saginaw Bay; and, if necessary, undertake remedial action.
City of MidlandMatters related to the City of Midland remain under the primary oversight of the State of Michigan (the “State”) under the License, and the Companyand the State are in ongoing discussions regarding the implementation of the requirements of the License.
Tittabawassee and Saginaw Rivers, Saginaw BayThe Company, the U.S. Environmental Protection Agency (“EPA”) and the State entered into an administrative order on consent (“AOC”), effectiveJanuary 21, 2010, that requires the Company to conduct a remedial investigation, a feasibility study and a remedial design for the Tittabawassee River,the Saginaw River and the Saginaw Bay, and pay the oversight costs of the EPA and the State under the authority of the Comprehensive EnvironmentalResponse, Compensation, and Liability Act (“CERCLA”). These actions, to be conducted under the lead oversight of the EPA, will build upon theinvestigative work completed under the State Resource Conservation Recovery Act (“RCRA”) program from 2005 through 2009. The TittabawasseeRiver, beginning at the Midland Site and extending down to the first six miles of the Saginaw River, are designated as the first Operable Unit forpurposes of conducting the remedial investigation, feasibility study and remedial design work. This work will be performed in a largely upriver todownriver sequence for eight geographic segments of the Tittabawassee and upper Saginaw Rivers. The remainder of the Saginaw River and the SaginawBay are designated as a second Operable Unit and the work associated with that unit may also be geographically segmented. The AOC does not obligatethe Company to perform removal or remedial action; that action can only be required by a separate order. The Company and the EPA will be negotiatingorders separate from the AOC that will obligate the Company to perform remedial actions under the scope of work of the AOC.
Alternative Dispute Resolution ProcessThe Company; the EPA; the U.S. Department of Justice; and the natural resource damage trustees (the Michigan Office of the Attorney General; theMDNRE; the U.S. Fish and Wildlife Service; the U.S. Bureau of Indian Affairs and the Saginaw-Chippewa tribe), have been engaged in negotiations toseek to resolve potential governmental claims against the Company related to historical off-site contamination associated with the City of Midland, theTittabawassee and Saginaw Rivers and the Saginaw Bay. The Company and the governmental parties started meeting in the fall of 2005 and entered intoa Confidentiality Agreement in December 2005. The Company continues to conduct negotiations under the Federal Alternative Dispute Resolution Actwith all of the governmental parties, except the EPA which withdrew from the alternative dispute resolution process on September 12, 2007.
On September 28, 2007, the Company and the natural resource damage trustees entered into a Funding and Participation Agreement that addressedthe Company’s payment of past costs incurred by the natural resource damage trustees, payment of the costs of a trustee coordinator and a process toreview additional cooperative studies that the Company might agree to fund or conduct with the natural resource damage trustees. On March 18, 2008,the Company and the natural resource damage trustees entered into a Memorandum of Understanding to provide a mechanism for the Company to fundcooperative studies related to the assessment of natural resource damages. On April 7, 2008, the natural resource damage trustees released their “NaturalResource Damage Assessment Plan for the Tittabawassee River System Assessment Area.”
At December 31, 2010, the accrual for these off-site matters was $32 million (included in the total accrued obligation of $607 million). At December 31,2009, the Company had an accrual for these off-site matters of $25 million (included in the total accrued obligation of $619 million).
116
Table of Contents
Environmental Matters SummaryIt is the opinion of the Company’s management that the possibility is remote that costs in excess of those disclosed will have a material adverse impact on theCompany’s results of operations, financial condition and cash flows.
Asbestos-Related Matters of Union Carbide CorporationUnion Carbide Corporation (“Union Carbide”), a wholly owned subsidiary of the Company, is and has been involved in a large number of asbestos-relatedsuits filed primarily in state courts during the past three decades. These suits principally allege personal injury resulting from exposure to asbestos-containingproducts and frequently seek both actual and punitive damages. The alleged claims primarily relate to products that Union Carbide sold in the past, allegedexposure to asbestos-containing products located on Union Carbide’s premises, and Union Carbide’s responsibility for asbestos suits filed against a formerUnion Carbide subsidiary, Amchem Products, Inc. (“Amchem”). In many cases, plaintiffs are unable to demonstrate that they have suffered anycompensable loss as a result of such exposure, or that injuries incurred in fact resulted from exposure to Union Carbide’s products.
Influenced by the bankruptcy filings of numerous defendants in asbestos-related litigation and the prospects of various forms of state and nationallegislative reform, the rate at which plaintiffs filed asbestos-related suits against various companies, including Union Carbide and Amchem, increased in2001, 2002 and the first half of 2003. Since then, the rate of filing has significantly abated. Union Carbide expects more asbestos-related suits to be filedagainst Union Carbide and Amchem in the future, and will aggressively defend or reasonably resolve, as appropriate, both pending and future claims.
Based on a study completed by Analysis, Research & Planning Corporation (“ARPC”) in January 2003, Union Carbide increased its December 31,2002 asbestos-related liability for pending and future claims for the 15-year period ending in 2017 to $2.2 billion, excluding future defense and processingcosts. Since then, Union Carbide has compared current asbestos claim and resolution activity to the results of the most recent ARPC study at each balancesheet date to determine whether the accrual continues to be appropriate. In addition, Union Carbide has requested ARPC to review Union Carbide’s historicalasbestos claim and resolution activity each November since 2004 to determine the appropriateness of updating the most recent ARPC study.
In November 2008, Union Carbide requested ARPC to review Union Carbide’s historical asbestos claim and resolution activity and determine theappropriateness of updating its then most recent study completed in December 2006. In response to that request, ARPC reviewed and analyzed data throughOctober 31, 2008. The resulting study, completed by ARPC in December 2008, stated that the undiscounted cost of resolving pending and future asbestos-related claims against Union Carbide and Amchem, excluding future defense and processing costs, through 2023 was estimated to be between $952 millionand $1.2 billion. As in its earlier studies, ARPC provided estimates for a longer period of time in its December 2008 study, but also reaffirmed its prior advicethat forecasts for shorter periods of time are more accurate than those for longer periods of time.
In December 2008, based on ARPC’s December 2008 study and Union Carbide’s own review of the asbestos claim and resolution activity, UnionCarbide decreased its asbestos-related liability for pending and future claims to $952 million, which covered the 15-year period ending 2023, excluding futuredefense and processing costs. The reduction was $54 million and is shown as “Asbestos-related credits” in the consolidated statements of income. AtDecember 31, 2008, the asbestos-related liability for pending and future claims was $934 million.
In November 2009, Union Carbide requested ARPC to review Union Carbide’s 2009 asbestos claim and resolution activity and determine theappropriateness of updating its December 2008 study. In response to that request, ARPC reviewed and analyzed data through October 31, 2009. In December2009, ARPC stated that an update of its study would not provide a more likely estimate of future events than the estimate reflected in its study of the previousyear and, therefore, the estimate in that study remained applicable. Based on Union Carbide’s own review of the asbestos claim and resolution activity andARPC’s response, Union Carbide determined that no change to the accrual was required. At December 31, 2009, Union Carbide’s asbestos-related liability forpending and future claims was $839 million.
In November 2010, Union Carbide requested ARPC to review Union Carbide’s historical asbestos claim and resolution activity and determine theappropriateness of updating its December 2008 study. In response to that request, ARPC reviewed and analyzed data through October 31, 2010. The resultingstudy, completed by ARPC in December 2010, stated that the undiscounted cost of resolving pending and future asbestos-related claims against UnionCarbide and Amchem, excluding future defense and processing costs, through 2025 was estimated to be between $744 million and $835 million. As in itsearlier studies, ARPC provided estimates for a longer period of time in its December 2010 study, but also reaffirmed its prior advice that forecasts for shorterperiods of time are more accurate than those for longer periods of time.
117

Table of Contents
In December 2010, based on ARPC’s December 2010 study and Union Carbide’s own review of the asbestos claim and resolution activity, UnionCarbide decreased its asbestos-related liability for pending and future claims to $744 million, which covered the 15-year period ending 2025, excluding futuredefense and processing costs. The reduction was $54 million and was shown as “Asbestos-related credits” in the consolidated statements of income. AtDecember 31, 2010, the asbestos-related liability for pending and future claims was $728 million.
At December 31, 2010, approximately 21 percent of the recorded liability related to pending claims and approximately 79 percent related to futureclaims. At December 31, 2009, approximately 23 percent of the recorded liability related to pending claims and approximately 77 percent related to futureclaims.
At December 31, 2002, Union Carbide increased the receivable for insurance recoveries related to its asbestos liability to $1.35 billion, substantiallyexhausting its asbestos product liability coverage. The insurance receivable related to the asbestos liability was determined by Union Carbide after a thoroughreview of applicable insurance policies and the 1985 Wellington Agreement, to which Union Carbide and many of its liability insurers are signatory parties,as well as other insurance settlements, with due consideration given to applicable deductibles, retentions and policy limits, and taking into account thesolvency and historical payment experience of various insurance carriers. The Wellington Agreement and other agreements with insurers are designed tofacilitate an orderly resolution and collection of Union Carbide’s insurance policies and to resolve issues that the insurance carriers may raise.
In September 2003, Union Carbide filed a comprehensive insurance coverage case, now proceeding in the Supreme Court of the State of New York,County of New York, seeking to confirm its rights to insurance for various asbestos claims and to facilitate an orderly and timely collection of insuranceproceeds (the “Insurance Litigation”). The Insurance Litigation was filed against insurers that are not signatories to the Wellington Agreement and/or do nototherwise have agreements in place with Union Carbide regarding their asbestos-related insurance coverage, in order to facilitate an orderly resolution andcollection of such insurance policies and to resolve issues that the insurance carriers may raise. Since the filing of the case, Union Carbide has reachedsettlements with several of the carriers involved in the Insurance Litigation, including settlements reached with two significant carriers in the fourth quarter of2009. The Insurance Litigation is ongoing.
Union Carbide’s receivable for insurance recoveries related to its asbestos liability was $50 million at December 31, 2010 and $84 million atDecember 31, 2009. At December 31, 2010 and December 31, 2009, all of the receivable for insurance recoveries was related to insurers that are not signatoriesto the Wellington Agreement and/or do not otherwise have agreements in place regarding their asbestos-related insurance coverage.
In addition to the receivable for insurance recoveries related to its asbestos liability, Union Carbide had receivables for defense and resolution costssubmitted to insurance carriers that have settlement agreements in place regarding their asbestos-related insurance coverage. The following table summarizesUnion Carbide’s receivables related to its asbestos-related liability: Receivables for Asbestos-Related Costs at December 31 In millions 2010 2009 Receivables for defense costs – carriers with settlement agreements $ 12 $ 91 Receivables for resolution costs – carriers with settlement agreements 236 357 Receivables for insurance recoveries – carriers without settlement agreements 50 84 Total $298 $532
Union Carbide expenses defense costs as incurred. The pretax impact for defense and resolution costs, net of insurance, was $73 million in 2010,$58 million in 2009 and $53 million in 2008, and was reflected in “Cost of sales.”
After a review of its insurance policies, with due consideration given to applicable deductibles, retentions and policy limits, after taking into account thesolvency and historical payment experience of various insurance carriers; existing insurance settlements; and the advice of outside counsel with respect to theapplicable insurance coverage law relating to the terms and conditions of its insurance policies, Union Carbide continues to believe that its recorded receivablefor insurance recoveries from all insurance carriers is probable of collection.
118

Table of Contents
The amounts recorded by Union Carbide for the asbestos-related liability and related insurance receivable described above were based upon current,known facts. However, future events, such as the number of new claims to be filed and/or received each year, the average cost of disposing of each suchclaim, coverage issues among insurers, and the continuing solvency of various insurance companies, as well as the numerous uncertainties surroundingasbestos litigation in the United States, could cause the actual costs and insurance recoveries for Union Carbide to be higher or lower than those projected orthose recorded.
Because of the uncertainties described above, Union Carbide’s management cannot estimate the full range of the cost of resolving pending and futureasbestos-related claims facing Union Carbide and Amchem. Union Carbide’s management believes that it is reasonably possible that the cost of disposing ofUnion Carbide’s asbestos-related claims, including future defense costs, could have a material adverse impact on Union Carbide’s results of operations andcash flows for a particular period and on the consolidated financial position of Union Carbide.
It is the opinion of Dow’s management that it is reasonably possible that the cost of Union Carbide disposing of its asbestos-related claims, includingfuture defense costs, could have a material adverse impact on the Company’s results of operations and cash flows for a particular period and on theconsolidated financial position of the Company.
Synthetic Rubber Industry MattersIn 2003, the U.S., Canadian and European competition authorities initiated separate investigations into alleged anticompetitive behavior by certain participantsin the synthetic rubber industry. Certain subsidiaries of the Company (but as to the investigation in Europe only) have responded to requests for documentsand are otherwise cooperating in the investigations.
On June 10, 2005, the Company received a Statement of Objections from the European Commission (the “EC”) stating that it believed that theCompany and certain subsidiaries of the Company (the “Dow Entities”), together with other participants in the synthetic rubber industry, engaged in conductin violation of European competition laws with respect to the butadiene rubber and emulsion styrene butadiene rubber businesses. In connection therewith, onNovember 29, 2006, the EC issued its decision alleging infringement of Article 81 of the Treaty of Rome and imposed a fine of Euro 64.575 million(approximately $85 million at that time) on the Dow Entities; several other companies were also named and fined. As a result, the Company recognized a losscontingency of $85 million related to the fine in the fourth quarter of 2006. The Company has appealed the EC’s decision. On October 13, 2009, the Court ofFirst Instance held a hearing on the appeal of all parties. Subsequent to the imposition of the fine, the Company and/or certain subsidiaries of the Companybecame named parties in various related U.S., United Kingdom and Italian civil actions. The U.S. matter was settled in March 2010 through a confidentialsettlement agreement, with an immaterial impact on the Company’s consolidated financial statements.
Additionally, on March 10, 2007, the Company received a Statement of Objections from the EC stating that it believed that DuPont Dow ElastomersL.L.C. (“DDE”), a former 50:50 joint venture with E.I. du Pont de Nemours and Company (“DuPont”), together with other participants in the syntheticrubber industry, engaged in conduct in violation of European competition laws with respect to the polychloroprene business. This Statement of Objectionsspecifically names the Company, in its capacity as a former joint venture owner of DDE. On December 5, 2007, the EC announced its decision to impose afine on the Company, among others, in the amount of Euro 48.675 million (approximately $65 million). The Company previously transferred its jointventure ownership interest in DDE to DuPont in 2005, and DDE then changed its name to DuPont Performance Elastomers L.L.C. (“DPE”). In February2008, DuPont, DPE and the Company each filed an appeal of the December 5, 2007 decision of the EC. Based on the Company’s allocation agreement withDuPont, the Company’s share of this fine, regardless of the outcome of the appeals, will not have a material adverse impact on the Company’s consolidatedfinancial statements.
Rohm and Haas Pension Plan MattersIn December 2005, a federal judge in the U.S. District Court for the Southern District of Indiana (the “District Court”) issued a decision granting a class ofparticipants in the Rohm and Haas Pension Plan (the “Rohm and Haas Plan”) who had retired from Rohm and Haas, now a wholly owned subsidiary of theCompany, and who elected to receive a lump sum benefit from the Rohm and Haas Plan, the right to a cost-of-living adjustment (“COLA”) as part of theirretirement benefit. In August 2007, the Seventh Circuit Court of Appeals affirmed the District Court’s decision, and in March 2008, the U.S. Supreme Courtdenied the Rohm and Haas Plan’s petition to review the Seventh Circuit’s decision. The case was returned to the District Court for further proceedings. InOctober 2008 and February 2009, the District Court issued rulings that have the effect of including in the class all Rohm and Haas retirees who received alump sum distribution without a COLA from the Rohm and Haas Plan since January 1976. These rulings are subject to appeal, and the District Court hasnot yet determined
119

Table of Contents
the amount of the COLA benefits that may be due to the class participants. The Rohm and Haas Plan and the plaintiffs entered into a settlement agreementthat, in addition to settling the litigation with respect to the Rohm and Haas retirees, provides for the amendment of the complaint and amendment of the Rohmand Haas Plan to include active employees in the settlement benefits. The District Court preliminarily approved the settlement on November 24, 2009 and,following a hearing on March 12, 2010, issued a final order approving the settlement on April 12, 2010. A group of objectors to the settlement filed an appealfrom the final order. In November 2010, the District Court issued an order approving class counsel’s fee award petition in an amount consistent with the termsof the settlement. The same objectors also appealed this order. Both appeals are pending.
A pension liability associated with this matter of $185 million was recognized as part of the acquisition of Rohm and Haas on April 1, 2009. Theliability, which was determined in accordance with the accounting guidance for contingencies, recognized the estimated impact of the above described judicialdecisions on the long-term Rohm and Haas Plan obligations owed to the applicable Rohm and Haas retirees and active employees. At December 31, 2010, theCompany had a liability of $186 million ($183 million at December 31, 2009) associated with this matter.
Other Litigation MattersIn addition to breast implant, DBCP, environmental and synthetic rubber industry matters, the Company is party to a number of other claims and lawsuitsarising out of the normal course of business with respect to commercial matters, including product liability, governmental regulation and other actions. Certainof these actions purport to be class actions and seek damages in very large amounts. All such claims are being contested. Dow has an active risk managementprogram consisting of numerous insurance policies secured from many carriers at various times. These policies provide coverage that will be utilized tominimize the financial impact, if any, of the contingencies described above.
SummaryExcept for the possible effect of Union Carbide’s asbestos-related liability described above, it is the opinion of the Company’s management that the possibilityis remote that the aggregate of all claims and lawsuits will have a material adverse impact on the Company’s consolidated financial statements.
Purchase CommitmentsThe Company has numerous agreements for the purchase of ethylene-related products globally. The purchase prices are determined primarily on a cost-plusbasis. Total purchases under these agreements were $714 million in 2010, $784 million in 2009 and $1,502 million in 2008. The Company’s take-or-paycommitments associated with these agreements at December 31, 2010 are included in the table below.
The Company also has various commitments for take-or-pay and throughput agreements. Such commitments are at prices not in excess of currentmarket prices. The terms of all but two of these agreements extend from one to 25 years. One agreement has terms extending to 35 years and another has termsextending to 80 years. The determinable future commitments for these agreements are included for 10 years in the following table which presents the fixed anddeterminable portion of obligations under the Company’s purchase commitments at December 31, 2010: Fixed and Determinable Portion of Take-or-Pay and Throughput Obligations at December 31, 2010 In millions 2011 $ 3,603 2012 3,261 2013 2,647 2014 2,055 2015 1,341 2016 and beyond 8,203 Total $ 21,110
In addition to the take-or-pay obligations at December 31, 2010, the Company had outstanding commitments which ranged from one to ten years formaterials, services and other items used in the normal course of business of approximately $180 million. Such commitments were at prices not in excess ofcurrent market prices.
120

Table of Contents
GuaranteesThe Company provides a variety of guarantees, as described more fully in the following sections.
GuaranteesGuarantees arise during the ordinary course of business from relationships with customers and nonconsolidated affiliates when the Company undertakes anobligation to guarantee the performance of others (via delivery of cash or other assets) if specified triggering events occur. With guarantees, such as commercialor financial contracts, non-performance by the guaranteed party triggers the obligation of the Company to make payments to the beneficiary of the guarantee.The majority of the Company’s guarantees relate to debt of nonconsolidated affiliates, which have expiration dates ranging from less than one year to ten years,and trade financing transactions in Latin America and Asia Pacific, which typically expire within one year of their inception. The Company’s currentexpectation is that future payment or performance related to the non-performance of others is considered unlikely.
Residual Value GuaranteesThe Company provides guarantees related to leased assets specifying the residual value that will be available to the lessor at lease termination through sale ofthe assets to the lessee or third parties.
The following tables provide a summary of the final expiration, maximum future payments and recorded liability reflected in the consolidated balancesheets for each type of guarantee: Guarantees at December 31, 2010 In millions
FinalExpiration
Maximum FuturePayments
RecordedLiability
Guarantees 2020 $445 $80 Residual value guarantees (1) 2020 391 17 Total guarantees $836 $97 (1) Does not include the residual value guarantee related to the Company’s variable interest
in an owner trust that was consolidated in the first quarter of 2010 with the adoption ofASU 2009-17; see Notes B and S.
Guarantees at December 31, 2009 In millions
FinalExpiration
Maximum FuturePayments
RecordedLiability
Guarantees 2020 $ 358 $52 Residual value guarantees 2014 6 9 5 5 Total guarantees $1,053 $57
Asset Retirement ObligationsDow has 188 manufacturing sites in 35 countries. Most of these sites contain numerous individual manufacturing operations, particularly at the Company’slarger sites. Asset retirement obligations are recorded as incurred and reasonably estimable, including obligations for which the timing and/or method ofsettlement are conditional on a future event that may or may not be within the control of the Company. The retirement of assets may involve such efforts asremediation and treatment of asbestos, contractually required demolition, and other related activities, depending on the nature and location of the assets, andretirement obligations are typically realized only upon demolition of those facilities. In identifying asset retirement obligations, the Company considersidentification of legally enforceable obligations, changes in existing law, estimates of potential settlement dates and the calculation of an appropriate discountrate to be used in calculating the fair value of the obligations. Dow has a well-established global process to identify, approve and track the demolition of retiredor to-be-retired facilities; and no assets are retired from service until this process has been followed. Dow typically forecasts demolition projects based on theusefulness of the assets; environmental, health and safety concerns; and other similar considerations. Under this process, as demolition projects are identifiedand approved, reasonable estimates are determined for the time frames during which any related asset retirement obligations are expected to be settled. For thoseassets where a range of potential settlement dates may be reasonably estimated, obligations are recorded. Dow routinely reviews all changes to items underconsideration for demolition to determine if an adjustment to the value of the asset retirement obligation is required.
121

Table of Contents
The Company has recognized asset retirement obligations for the following activities: demolition and remediation activities at manufacturing sites in theUnited States, Canada, Brazil, Chile, China and Europe; and capping activities at landfill sites in the United States, Canada, Brazil and Europe. TheCompany has also recognized conditional asset retirement obligations related to asbestos encapsulation as a result of planned demolition and remediationactivities at manufacturing and administrative sites in the United States, Canada, Brazil, Chile, China and Europe. The aggregate carrying amount ofconditional asset retirement obligations recognized by the Company (included in the asset retirement obligations balance) was $40 million at December 31,2010 ($41 million at 2009).
The following table shows changes in the aggregate carrying amount of the Company’s asset retirement obligations: Asset Retirement Obligations In millions 2010 2009 Balance at January 1 $101 $106 Additional accruals 6 7 Assumed from Rohm and Haas (1) - 13 Sold with Salt business (2) - (12) Liabilities settled (10) (21) Accretion expense 1 1 Revisions in estimated cash flows 1 1 Other - 6 Balance at December 31 $ 9 9 $ 101 (1) See Note D.(2) See Note E.
The discount rate used to calculate the Company’s asset retirement obligations at December 31, 2010 was 1.78 percent (2.45 percent at December 31,2009). These obligations are included in the consolidated balance sheets as “Other noncurrent obligations.”
The Company has not recognized conditional asset retirement obligations for which a fair value cannot be reasonably estimated in its consolidatedfinancial statements. Assets that have not been submitted/reviewed for potential demolition activities are considered to have continued usefulness and aregenerally still operating normally. Therefore, without a plan to demolish the assets or the expectation of a plan, such as shortening the useful life of assets fordepreciation purposes in accordance with the accounting guidance related to property, plant and equipment, the Company is unable to reasonably forecast atime frame to use for present value calculations. As such, the Company has not recognized obligations for individual plants/buildings at its manufacturingsites where estimates of potential settlement dates cannot be reasonably made. In addition, the Company has not recognized conditional asset retirementobligations for the capping of its approximately 60 underground storage wells and 130 underground brine mining and other wells at Dow-owned sites whenthere are no plans or expectations of plans to exit the sites. It is the opinion of the Company’s management that the possibility is remote that such conditionalasset retirement obligations, when estimable, will have a material adverse impact on the Company’s consolidated financial statements based on current costs.
NOTE O – TRANSFERS OF FINANCIAL ASSETSOn January 1, 2010, the Company adopted ASU 2009-16, “Transfers and Servicing (Topic 860): Accounting for Transfers of Financial Assets.” This ASUis intended to improve the information provided in financial statements concerning transfers of financial assets, including the effects of transfers on financialposition, financial performance and cash flows, and any continuing involvement of the transferor with the transferred financial assets. The Companyevaluated the impact of adopting the guidance and the terms and conditions in place at January 1, 2010 and determined that certain sales of accounts receivablewould be classified as secured borrowings. Under the Company’s sale of accounts receivable arrangements, $915 million was outstanding at January 1,2010. The maximum amount of receivables available for participation in these programs was $1,939 million at January 1, 2010.
122

Table of Contents
In January 2010, the Company terminated the North American arrangement and replaced it with a new arrangement that qualified for treatment as a saleunder ASU 2009-16. The arrangement related to $294 million of the $915 million outstanding at January 1, 2010 and $1,100 million of the $1,939 millionmaximum participation.
In June 2010, the Company terminated the European arrangement and replaced it with a new arrangement that qualified for treatment as a sale underASU 2009-16. The arrangement related to $584 million of the $915 million outstanding at January 1, 2010 and $721 million of the $1,939 millionmaximum participation.
Sale of Trade Accounts Receivable in North AmericaIn January 2010, the Company terminated its previous facilities used in North America for the transfers of trade accounts receivable by entering into anagreement to repurchase the outstanding receivables for $264 million and replacing it with a new arrangement. During the year ended December 31, 2010,under the new arrangement, the Company sold the trade accounts receivable of select North America entities on a revolving basis to certain multi-sellercommercial paper conduit entities. The Company maintains servicing responsibilities and the related costs are insignificant. The proceeds received arecomprised of cash and interests in specified assets (the receivables sold by the Company) of the conduits that entitle the Company to the residual cash flows ofsuch specified assets in the conduits after the commercial paper has been repaid. Neither the conduits nor the investors in those entities have recourse to otherassets of the Company in the event of nonpayment by the debtors.
During the year ended December 31, 2010, the Company recognized a loss of $19 million on the sale of these receivables, which is classified as“Interest expense and amortization of debt discount” in the consolidated statements of income. The Company classifies its interests in the conduits as“Accounts and notes receivable – Other” on the consolidated balance sheets and those interests are carried at fair value. Fair value of the interests is determinedby calculating the expected amount of cash to be received and is based on unobservable inputs (a Level 3 measurement). The key input in the valuation ispercentage of anticipated credit losses, which was 1.42 percent, in the portfolio of receivables sold that have not yet been collected. Given the short-term natureof the underlying receivables, discount rates and prepayments are not factors in determining the fair value of the interests. At December 31, 2010, the carryingvalue of the interests held was $1,110 million, which is the Company’s maximum exposure to loss related to the receivables sold.
The sensitivity of the fair value of the interests held to hypothetical adverse changes in the anticipated credit losses are as follows (amounts shown arethe corresponding hypothetical decreases in the carrying value of the interests): Impact to Carrying Value In millions 10% adverse change $ 2 20% adverse change $5
Following is an analysis of certain cash flows between the Company and the North American conduits: Cash Proceeds In millions 2010 Sale of receivables $ 264 Collections reinvested in revolving receivables $18,952 Interests in conduits (1) $ 974 (1) Presented in operating activities in the consolidated statements
of cash flows.
Delinquencies on the sold receivables that were still outstanding at December 31, 2010 were $127 million. Trade accounts receivable outstanding andderecognized from the Company’s consolidated balance sheet at December 31, 2010 were $1,930 million. Credit losses, net of any recoveries, on receivablessold during the year ended December 31, 2010 were $2 million. During 2010, the Company repurchased $13 million of previously sold receivables related to adivestiture.
123

Table of Contents
Sale of Trade Accounts Receivable in EuropeIn June 2010, the Company terminated its previous facility used in Europe for the transfers of trade accounts receivable by entering into an agreement torepurchase the outstanding receivables for $11 million and replacing it with a new arrangement. Since June 2010, under the new arrangement, the Companysold qualifying trade accounts receivable of select European entities on a revolving basis to certain multi-seller commercial paper conduit entities. TheCompany maintains servicing responsibilities and the related costs are insignificant. The proceeds received are comprised of cash and interests in specifiedassets (the receivables sold by the Company) of the conduits that entitle the Company to the residual cash flows of such specified assets in the conduits afterthe commercial paper has been repaid. Neither the conduits nor the investors in those entities have recourse to other assets of the Company in the event ofnonpayment by the debtors.
During the period from the June 2010 inception of the new arrangement through December 31, 2010, the Company recognized a loss of $7 million on thesale of these receivables, which is classified as “Interest expense and amortization of debt discount” in the consolidated statements of income. The Companyclassifies its interests in the conduits as “Accounts and notes receivable – Other” on the consolidated balance sheets and those interests are carried at fair value.Fair value of the interests is determined by calculating the expected amount of cash to be received and is based on unobservable inputs (a Level 3measurement). The key input in the valuation is percentage of anticipated credit losses, which was zero, in the portfolio of receivables sold that have not yetbeen collected. Given the short-term nature of the underlying receivables, discount rates and prepayments are not factors in determining the fair value of theinterests. At December 31, 2010, the carrying value of the interests held was $157 million, which is the Company’s maximum exposure to loss related to thereceivables sold.
Following is an analysis of certain cash flows between the Company and the European conduits: Cash Proceeds In millions 2010 Sale of receivables $ 554 Collections reinvested in revolving receivables $3,914 Interests in conduits (1) $ 64 (1) Presented in operating activities in the consolidated statements of cash flows.
Delinquencies on the sold receivables still outstanding at December 31, 2010 were $42 million. Trade accounts receivable outstanding and derecognizedfrom the Company’s consolidated balance sheet at December 31, 2010 were $405 million. There were no credit losses on receivables sold since June 2010.
Sale of Trade Accounts Receivable in Asia PacificDuring the year ended December 31, 2010, the Company sold participating interests in trade accounts receivable of select Asia Pacific entities for which theCompany received cash. The Company maintains servicing responsibilities for the participating interests sold and the related costs are insignificant. Thethird-party holders of the participating interests do not have recourse to the Company’s assets in the event of nonpayment by the debtors.
During the year ended December 31, 2010, the Company recognized a loss of less than $1 million on the sale of the participating interests in thereceivables, which is classified as “Interest expense and amortization of debt discount” in the consolidated statements of income.
Following is an analysis of certain cash flows between the Company and the third-party holders of the participating interests: Cash Proceeds In millions 2010 Sale of participating interests $ 218 Collections reinvested in revolving receivables $195
124

Table of Contents
Following is additional information related to the sale of participating interests in the receivables under this facility: Trade Accounts Receivable In millions Dec. 31, 2010 Derecognized from the consolidated balance sheet $ 25 Outstanding in the consolidated balance sheet 281 Total accounts receivable in select Asia Pacific entities $306
There were no credit losses on receivables relating to the participating interests sold during the year ended December 31, 2010. There were nodelinquencies on the outstanding receivables related to the participating interests sold at December 31, 2010.
NOTE P – NOTES PAYABLE, LONG-TERM DEBT AND AVAILABLE CREDIT FACILITIES Notes Payable at December 31 In millions 2010 2009 Commercial paper - $ 721 Notes payable to banks $ 1,310 1,285 Notes payable to related companies 157 131 Notes payable trade - 2 Total notes payable $1,467 $ 2,139 Year-end average interest rates 2.64% 2.18% Long-Term Debt at December 31
2010Average
2009Average
In millions Rate 2010 Rate 2009 Promissory notes and debentures:
Final maturity 2010 - - 9.13% $ 281 Final maturity 2011 5.30% $ 1,057 5.32% 1,054 Final maturity 2012 5.33% 2,154 5.14% 2,280 Final maturity 2013 6.05% 389 6.05% 389 Final maturity 2014 7.27% 2,096 7.60% 1,750 Final maturity 2015 5.90% 1,250 5.90% 1,250 Final maturity 2016 and thereafter 6.95% 11,260 7.95% 8,880
Other facilities: U.S. dollar loans, various rates and maturities 1.67% 20 1.95% 35 Foreign currency loans, various rates and maturities 2.95% 998 3.65% 754 Medium-term notes, varying maturities through 2022 5.96% 2,005 6.39% 1,624 Foreign medium-term notes, various rates and maturities - - 4.13% 1 Euro medium-term notes, final maturity 2010 - - 4.37% 576 Euro medium-term notes, final maturity 2011 4.63% 6 6 5 4.63% 713 Pollution control/industrial revenue bonds, varying maturities through 2038 5.68% 907 5.21% 1,114 Capital lease obligations - 17 - 44
Unamortized debt discount - (458) - (485) Unexpended construction funds - - - (26) Long-term debt due within one year - (1,755) - (1,082) Total long-term debt - $20,605 - $19,152
125

Table of Contents
Annual Installments on Long-Term Debt for Next Five Years In millions 2011 $ 1,755 2012 $ 2,886 2013 $ 943 2014 $ 2,548 2015 $ 1,574
On November 4, 2010, the Company issued $2.5 billion of debt securities in a public offering. The offering included $750 million aggregate principalamount of 2.50 percent notes due 2016 and $1.75 billion aggregate principal amount of 4.25 percent notes due 2020.
On March 9, 2009, the Company borrowed $3 billion under its Five Year Competitive Advance and Revolving Credit Facility Agreement, datedApril 24, 2006 (“Agreement”); $1.6 billion of the funds were repaid on May 15, 2009; $0.5 billion of the funds were repaid on June 30, 2009; and theremaining $0.9 billion of the funds were repaid on December 30, 2009. The funds were due in April 2011 and bore interest at a variable London InterbankOffered Rate (“LIBOR”)-plus rate or Base Rate as defined in the Agreement. The Company used the funds to finance day-to-day operations, to repayindebtedness maturing in the ordinary course of business and for other general corporate purposes. In 2010, the Company replaced the Agreement with a new$3 billion Three Year Competitive Advance and Revolving Credit Facility Agreement dated June 4, 2010 (“Revolving Credit Facility”) with various U.S. andforeign banks. The Revolving Credit Facility has a maturity date in June 2013 and provides for interest at a LIBOR-plus rate or Base Rate as defined in theRevolving Credit Facility. At December 31, 2010, the full $3 billion credit facility was available to the Company.
Debt financing for the acquisition of Rohm and Haas was provided by a $9,226 million draw on a Term Loan Agreement dated September 8, 2008(“Term Loan”) on April 1, 2009. The original maturity date of the Term Loan was April 1, 2010, provided however, that the maturity date could have beenextended for an additional year at the option of the Company, for a maximum outstanding balance of $8.0 billion. Prepaid up-front debt issuance costs of$304 million were paid. Amortization of the prepaid costs was accelerated concurrent with the repayment of the Term Loan. The Term Loan was repaidthrough a combination of proceeds obtained through asset sales and the issuance of debt and equity securities. At December 31, 2009, the Term Loan balancewas zero and the Term Loan was terminated.
On May 7, 2009, the Company issued $6 billion of debt securities in a public offering. The offering included $1.75 billion aggregate principal amountof 7.6 percent notes due 2014; $3.25 billion aggregate principal amount of 8.55 percent notes due 2019; and $1 billion aggregate principal amount of9.4 percent notes due 2039. Aggregate principal amount of $1.35 billion of the 8.55 percent notes due 2019 were offered by accounts and funds managed byPaulson & Co. Inc. and trusts created by members of the Haas family. These investors received notes from the Company in payment for 1.3 million shares ofthe Company’s Perpetual Preferred Stock, Series B, at par plus accrued dividends (see Note W for further information). The Company used the net proceedsreceived from this offering for refinancing, renewals, replacements and refunding of outstanding indebtedness, including repayment of a portion of the TermLoan.
On August 4, 2009, the Company issued $2.75 billion of debt securities in a public offering. The offering included $1.25 billion aggregate principalamount of 4.85 percent notes due 2012; $1.25 billion aggregate principal amount of 5.90 percent notes due 2015; and $0.25 billion aggregate principalamount of LIBOR-plus based floating rate notes due 2011. The Company used the net proceeds received from this offering for refinancing, renewals,replacements and refunding of outstanding indebtedness, including repayment of a portion of the Term Loan.
The fair value of debt assumed from Rohm and Haas on April 1, 2009 of $2,576 million is reflected in the long-term debt table above. On August 21,2009, the Company executed a buy-back of Euro 175 million of private placement debt acquired from Rohm and Haas and recognized a $56 million pretaxloss on this early extinguishment, included in “Sundry income – net.” On September 8, 2010, the Company concluded a tender offer for any and all of$145 million of debentures acquired from Rohm and Haas, due June 2020. As a result of the tender offer, the Company redeemed $123 million of thedebentures and recognized a $46 million pretax loss on this early extinguishment, included in “Sundry income – net.”
126
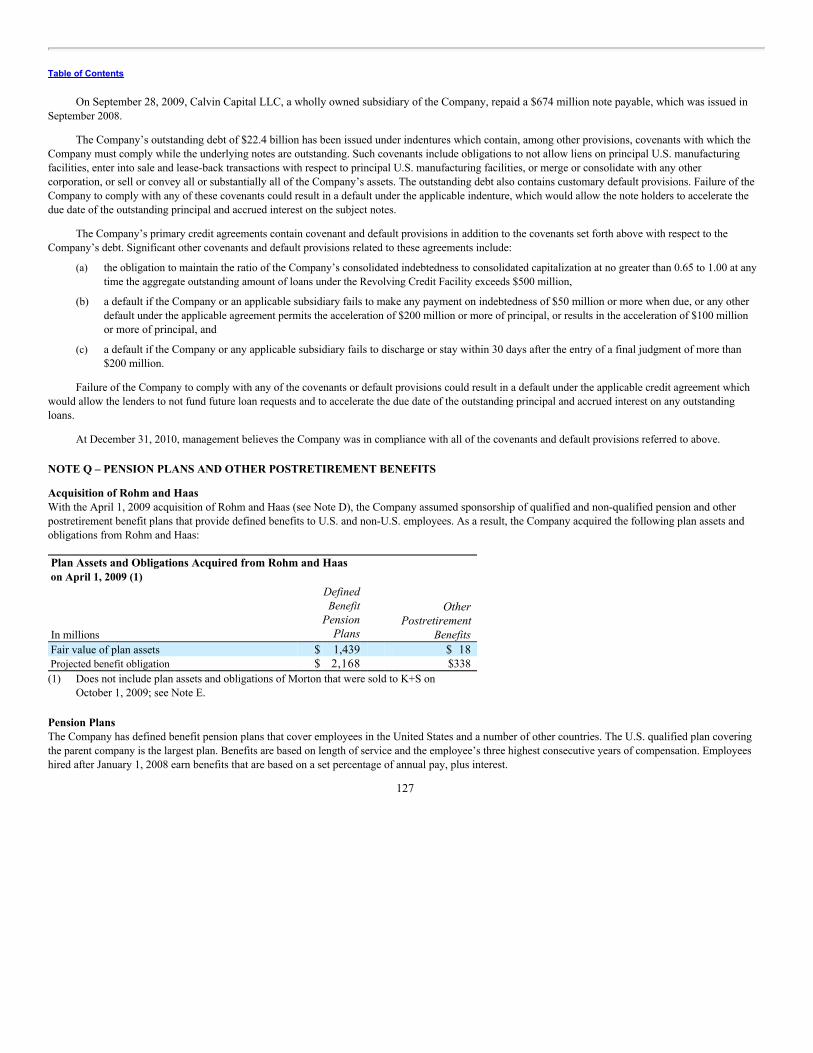
Table of Contents
On September 28, 2009, Calvin Capital LLC, a wholly owned subsidiary of the Company, repaid a $674 million note payable, which was issued inSeptember 2008.
The Company’s outstanding debt of $22.4 billion has been issued under indentures which contain, among other provisions, covenants with which theCompany must comply while the underlying notes are outstanding. Such covenants include obligations to not allow liens on principal U.S. manufacturingfacilities, enter into sale and lease-back transactions with respect to principal U.S. manufacturing facilities, or merge or consolidate with any othercorporation, or sell or convey all or substantially all of the Company’s assets. The outstanding debt also contains customary default provisions. Failure of theCompany to comply with any of these covenants could result in a default under the applicable indenture, which would allow the note holders to accelerate thedue date of the outstanding principal and accrued interest on the subject notes.
The Company’s primary credit agreements contain covenant and default provisions in addition to the covenants set forth above with respect to theCompany’s debt. Significant other covenants and default provisions related to these agreements include:
(a) the obligation to maintain the ratio of the Company’s consolidated indebtedness to consolidated capitalization at no greater than 0.65 to 1.00 at any
time the aggregate outstanding amount of loans under the Revolving Credit Facility exceeds $500 million,
(b) a default if the Company or an applicable subsidiary fails to make any payment on indebtedness of $50 million or more when due, or any other
default under the applicable agreement permits the acceleration of $200 million or more of principal, or results in the acceleration of $100 millionor more of principal, and
(c) a default if the Company or any applicable subsidiary fails to discharge or stay within 30 days after the entry of a final judgment of more than
$200 million.
Failure of the Company to comply with any of the covenants or default provisions could result in a default under the applicable credit agreement whichwould allow the lenders to not fund future loan requests and to accelerate the due date of the outstanding principal and accrued interest on any outstandingloans.
At December 31, 2010, management believes the Company was in compliance with all of the covenants and default provisions referred to above.
NOTE Q – PENSION PLANS AND OTHER POSTRETIREMENT BENEFITS
Acquisition of Rohm and HaasWith the April 1, 2009 acquisition of Rohm and Haas (see Note D), the Company assumed sponsorship of qualified and non-qualified pension and otherpostretirement benefit plans that provide defined benefits to U.S. and non-U.S. employees. As a result, the Company acquired the following plan assets andobligations from Rohm and Haas: Plan Assets and Obligations Acquired from Rohm and Haas on April 1, 2009 (1)
In millions
DefinedBenefit
PensionPlans
OtherPostretirement
Benefits Fair value of plan assets $ 1,439 $ 18 Projected benefit obligation $ 2,168 $338 (1) Does not include plan assets and obligations of Morton that were sold to K+S on
October 1, 2009; see Note E.
Pension PlansThe Company has defined benefit pension plans that cover employees in the United States and a number of other countries. The U.S. qualified plan coveringthe parent company is the largest plan. Benefits are based on length of service and the employee’s three highest consecutive years of compensation. Employeeshired after January 1, 2008 earn benefits that are based on a set percentage of annual pay, plus interest.
127

Table of Contents
The Company’s funding policy is to contribute to the plans when pension laws and/or economics either require or encourage funding. In 2010, Dowcontributed $708 million to its pension plans, including contributions to fund benefit payments for its non-qualified supplemental plans. Dow expects tocontribute approximately $700 million to its pension plans in 2011.
The weighted-average assumptions used to determine pension plan obligations and net periodic benefit costs for the plans are provided in the two tablesbelow: Weighted-Average Assumptions for All Pension Plans
Benefit Obligationsat December 31
Net Periodic Costsfor the Year
2010 2009 2010 2009 Discount rate 5.38% 5.71% 5.71% 6.53% Rate of increase in future compensation levels 4.13% 4.14% 4.17% 4.01% Expected long-term rate of return on plan assets - - 7.74% 8.03% Weighted-Average Assumptions for U.S. Pension Plans
Benefit Obligationsat December 31
Net Periodic Costsfor the Year
2010 2009 2010 2009 Discount rate 5.51% 5.97% 5.97% 6.82% Rate of increase in future compensation levels 4.50% 4.50% 4.50% 4.31% Expected long-term rate of return on plan assets - - 8.16% 8.46%
The Company determines the expected long-term rate of return on plan assets by performing a detailed analysis of key economic and market factorsdriving historical returns for each asset class and formulating a projected return based on factors in the current environment. Factors considered include, butare not limited to, inflation, real economic growth, interest rate yield, interest rate spreads, and other valuation measures and market metrics. The expectedlong-term rate of return for each asset class is then weighted based on the strategic asset allocation approved by the governing body for each plan. TheCompany’s historical experience with the pension fund asset performance is also considered. A similar process is followed in determining the expected long-term rate of return for assets held in the Company’s other postretirement benefit plan trusts. The discount rates utilized to measure the pension and otherpostretirement obligations of the U.S. qualified plans are based on the yield on high-quality fixed income investments at the measurement date. Future expectedactuarially determined cash flows of Dow’s major U.S. plans are matched against the Towers Watson RATE:Link yield curve (based on 60th to 90thpercentile bond yields) to arrive at a single discount rate for each plan.
The accumulated benefit obligation for all defined benefit pension plans was $20.1 billion at December 31, 2010 and $18.9 billion at December 31,2009. Pension Plans with Accumulated Benefit Obligations in Excess of Plan Assets at December 31 In millions 2010 2009 Projected benefit obligations $ 18,424 $ 18,113 Accumulated benefit obligations $ 17,571 $ 17,277 Fair value of plan assets $ 12,912 $ 12,679
In addition to the U.S. qualified defined benefit pension plan, U.S. employees may participate in defined contribution plans (Employee Savings Plans or401(k) plans) by contributing a portion of their compensation, which is partially matched by the Company. Defined contribution plans also cover employeesin some subsidiaries in other countries, including Australia, Brazil, Canada, Italy, Spain and the United Kingdom. Expense recognized for all definedcontribution plans was $184 million in 2010, $156 million in 2009 and $49 million in 2008.
128

Table of Contents
Other Postretirement BenefitsThe Company provides certain health care and life insurance benefits to retired employees. The Company’s plans outside of the United States are notsignificant; therefore, this discussion relates to the U.S. plans only. The plans provide health care benefits, including hospital, physicians’ services, drug andmajor medical expense coverage, and life insurance benefits. In general, for employees hired before January 1, 1993, the plans provide benefits supplementalto Medicare when retirees are eligible for these benefits. The Company and the retiree share the cost of these benefits, with the Company portion increasing asthe retiree has increased years of credited service, although there is a cap on the Company portion. The Company has the ability to change these benefits at anytime. Employees hired after January 1, 2008 are not covered under the plans.
The Company funds most of the cost of these health care and life insurance benefits as incurred. In 2010, Dow did not make any contributions to itsother postretirement benefit plan trusts. Likewise, Dow does not expect to contribute assets to its other postretirement benefits plan trusts in 2011.
The weighted-average assumptions used to determine other postretirement benefit obligations and net periodic benefit costs for the U.S. plans areprovided below: U.S. Plan Assumptions for Other Postretirement Benefits
Benefit Obligationsat December 31
Net Periodic Costsfor the Year
2010 2009 2010 2009 Discount rate 5.15% 5.69% 5.69% 7.11% Expected long-term rate of return on plan assets - - 4.35% 5.15% Initial health care cost trend rate 8.70% 9.13% 9.13% 9.71% Ultimate health care cost trend rate 5.00% 5.00% 5.00% 6.00% Year ultimate trend rate to be reached 2019 2019 2019 2018
Increasing the assumed medical cost trend rate by one percentage point in each year would increase the accumulated postretirement benefit obligation atDecember 31, 2010 by less than $1 million and decrease the net periodic postretirement benefit cost for the year by $1 million. Decreasing the assumedmedical cost trend rate by one percentage point in each year would increase the accumulated postretirement benefit obligation at December 31, 2010 by$23 million and the net periodic postretirement benefit cost for the year by $1 million. Net Periodic Benefit Cost for All Significant Plans
Defined Benefit Pension Plans Other Postretirement Benefits In millions 2010 2009 2008 2010 2009 2008 Service cost $ 309 $ 270 $ 264 $ 15 $ 16 $ 18 Interest cost 1,098 1,081 961 111 138 117 Expected return on plan assets (1,212) (1,254) (1,232) (10) (17) (29) Amortization of prior service cost (credit) 28 31 32 - (3) (4) Amortization of unrecognized loss (gain) 268 106 43 (1) (1) (1) Curtailment/settlement/other costs (1) 11 13 54 3 - 34 Net periodic benefit cost $ 502 $ 247 $ 122 $118 $133 $135 (1) Includes $11 million of curtailment and settlement costs recorded in 2010 related to the divestiture of Styron (see Note E). See Note C for information
regarding curtailment and settlement costs recorded in 2009 and 2008. Other Changes in Plan Assets and Benefit Obligations Recognized in Other Comprehensive Income for All Significant Plans
Defined Benefit Pension Plans Other Postretirement Benefits In millions 2010 2009 2008 2010 2009 2008 Net loss (gain) $ 591 $ 804 $4,669 $ 59 $(114) $ 23 Prior service cost 2 2 4 - - - Amortization of prior service (cost) credit (36) (31) (32) (3) 3 4 Amortization of unrecognized (loss) gain (271) (119) (43) 1 1 1 Total recognized in other comprehensive loss (income) $ 286 $ 656 $4,598 $ 57 $(110) $ 28 Total recognized in net periodic benefit cost and other comprehensive loss $ 788 $ 903 $4,720 $175 $ 23 $163
129

Table of Contents
Change in Projected Benefit Obligations, Plan Assets and Funded Status of All Significant Plans
In millions
DefinedBenefit Pension
Plans
OtherPostretirement
Benefits Change in projected benefit obligations 2010 2009 2010 2009 Benefit obligation at beginning of year $ 19,914 $15,573 $ 2,079 $ 1,821 Service cost 309 270 15 16 Interest cost 1,098 1,081 111 138 Plan participants’ contributions 22 27 - - Amendments 2 2 - - Actuarial changes in assumptions and experience 1,133 1,718 68 (75) Acquisition/divestiture/other activity (53) 2,175 (1) 336 Benefits paid (1,148) (1,239) (180) (171) Currency impact (86) 307 3 14 Termination benefits/curtailment cost (33) - - - Benefit obligations at end of year $ 21,158 $19,914 $ 2,095 $ 2,079
Change in plan assets Fair value of plan assets at beginning of year $ 14,589 $ 11,573 $ 367 $ 368 Actual return on plan assets 1,724 2,155 17 5 6 Currency impact (28) 279 - - Employer contributions 708 355 (60) - Plan participants’ contributions 22 27 - - Acquisition/divestiture/other activity (16) 1,439 - 18 Benefits paid (1,148) (1,239) (86) (75) Fair value of plan assets at end of year $15,851 $14,589 $ 238 $ 367 Funded status at end of year $ (5,307) $ (5,325) $ (1,857) $(1,712)
Net amounts recognized in the consolidated balance sheets at December 31: Noncurrent assets $ 235 $ 110 - - Current liabilities (58) (54) $ (88) $ (89) Noncurrent liabilities (5,484) (5,381) (1,769) (1,623) Net amounts recognized in the consolidated balance sheets $ (5,307) $ (5,325) $ (1,857) $(1,712)
Pretax amounts recognized in AOCI at December 31: Net loss (gain) $ 6,696 $ 6,376 $ (26) $ (86) Prior service cost (credit) 182 216 (16) (13) Pretax balance in AOCI at end of year $ 6,878 $ 6,592 $ (42) $ (99)
In 2011, an estimated net loss of $372 million and prior service cost of $27 million for the defined benefit pension plans will be amortized from AOCIto net periodic benefit cost. In 2011, an estimated net loss of $2 million and prior service credit of $2 million for other postretirement benefit plans will beamortized from AOCI to net periodic benefit cost.
130

Table of Contents
Estimated Future Benefit PaymentsThe estimated future benefit payments, reflecting expected future service, as appropriate, are presented in the following table: Estimated Future Benefit Payments at December 31, 2010
In millions
Defined BenefitPension
Plans
OtherPostretirement
Benefits 2011 $ 1,330 $ 194 2012 1,156 189 2013 1,168 180 2014 1,191 172 2015 1,218 166 2016 through 2020 6,646 773 Total $12,709 $1,674
Plan AssetsPlan assets consist mainly of equity and fixed income securities of U.S. and foreign issuers, and may include alternative investments such as real estate,private equity and absolute return strategies. At December 31, 2010, plan assets totaled $15.9 billion and included Company common stock with a value of$13 million (less than 1 percent of total plan assets). At December 31, 2009, plan assets totaled $14.6 billion and included Company common stock with avalue of $11 million (less than 1 percent of total plan assets).
Investment Strategy and Risk Management for Plan AssetsThe Company’s investment strategy for the plan assets is to manage the assets in relation to the liability in order to pay retirement benefits to plan participantswhile minimizing cash contributions from the Company over the life of the plans. This is accomplished by identifying and managing the exposure to variousmarket risks, diversifying investments across various asset classes and earning an acceptable long-term rate of return consistent with an acceptable amount ofrisk, while considering the liquidity needs of the plans.
The plans are permitted to use derivative instruments for investment purposes, as well as for hedging the underlying asset and liability exposure andrebalancing the asset allocation. The plans use value at risk, stress testing, scenario analysis and Monte Carlo simulation to monitor and manage both risk inthe portfolios and surplus risk.
Equity securities primarily include investments in large- and small-cap companies located in both developed and emerging markets around the world.Fixed income securities are primarily U.S. dollar based and include investment grade corporate bonds of companies diversified across industries, U.S.treasuries, non-U.S. developed market securities and U.S. agency mortgage-backed securities. Alternative investments primarily include investments in realestate, private equity limited partnerships and absolute return strategies. Other significant investment types include various insurance contracts; and interestrate, equity, commodity and foreign exchange derivative investments and hedges. Strategic Weighted-Average Target Allocation of PlanAssets for All Significant Plans
Asset Category
TargetAllocation
Equity securities 45% Fixed Income securities 35% Alternative investments 15% Other investments 5% Total 100%
131

Table of Contents
Concentration of RiskThe Company mitigates the credit risk of investments by establishing guidelines with investment managers that limit investment in any single issue or issuerto an amount that is not material to the portfolio being managed. These guidelines are monitored for compliance both by the Company and external managers.Credit risk related to derivative activity is mitigated by utilizing multiple counterparties and through collateral support agreements.
The JP Morgan Federal Agency money market fund is utilized as the sweep vehicle for the two largest U.S. plans, which from time to time can representa significant investment. For one U.S. plan, approximately half of the liability is covered by a participating group annuity issued by Prudential InsuranceCompany.
The following tables summarize the bases used to measure the Company’s pension plan assets at fair value for the years ended December 31, 2010 and2009: Basis of Fair Value Measurements of Pension Plan Assetsat December 31, 2010
Quoted Pricesin Active
Markets forIdentical Items
SignificantOther
ObservableInputs
SignificantUnobservable
Inputs In millions (Level 1) (Level 2) (Level 3) Total Cash and cash equivalents $ 56 $ 751 - $ 807 Equity securities:
U.S. equity (1) $2,038 $ 167 - $ 2,205 Non-U.S. equity – developed countries 2,300 932 - 3,232 Emerging markets 759 469 - 1,228 Equity derivatives 8 3 - 11
Total equity securities $5,105 $1,571 - $ 6,676 Fixed income securities:
U.S. government and municipalities - $ 961 - $ 961 U.S. agency and agency mortgage-backed securities - 385 - 385 Corporate bonds – investment grade - 1,313 - 1,313 Non-U.S. governments – developed countries - 643 - 643 Non-U.S. corporate bonds – developed countries - 897 - 897 Emerging market debt - 51 - 51 Other asset-backed securities - 217 $ 13 230 Convertible bonds $ 32 385 - 417 High yield bonds 14 279 17 310 Other fixed income funds - 208 20 228 Fixed income derivatives - (11) - (11)
Total fixed income securities $ 46 $5,328 $ 50 $ 5,424 Alternative investments:
Real estate $ 29 $45 $ 727 $801 Private equity - - 997 997 Absolute return - 395 303 698
Total alternative investments $ 29 $ 440 $2,027 $ 2,496 Other - $ 408 $40 $ 448 Total assets at fair value $5,236 $8,498 $2,117 $15,851 (1) Includes $13 million of the Company’s common stock.
132

Table of Contents
Basis of Fair Value Measurements of Pension Plan Assetsat December 31, 2009
Quoted Pricesin Active
Markets forIdentical Items
SignificantOther
ObservableInputs
SignificantUnobservable
Inputs In millions (Level 1) (Level 2) (Level 3) Total Cash and cash equivalents $ 100 $ 730 - $ 830 Equity securities:
U.S. equity (1) $1,774 $ 142 - $ 1,916 Non-U.S. equity – developed countries 2,203 922 - 3,125 Emerging markets 668 490 - 1,158 Equity derivatives 1 9 - 10
Total equity securities $4,646 $1,563 - $ 6,209 Fixed income securities:
U.S. government and municipalities - $ 991 - $ 991 U.S. agency and agency mortgage-backed securities - 300 - 300 Corporate bonds – investment grade - 1,242 - 1,242 Non-U.S. governments – developed countries - 463 - 463 Non-U.S. corporate bonds – developed countries - 557 - 557 Emerging market debt - 30 - 30 Other asset-backed securities - 156 $ 25 181 Convertible bonds $ 50 386 - 436 High yield bonds - 176 25 201 Other fixed income funds - 878 - 878 Fixed income derivatives (7) (36) - (43)
Total fixed income securities $ 43 $5,143 $ 50 $ 5,236 Alternative investments:
Real estate $ 26 $ 46 $ 561 $ 633 Private equity - - 802 802 Absolute return - 350 9 5 445
Total alternative investments $ 26 $ 396 $1,458 $ 1,880 Other - $ 391 $ 43 $ 434 Total assets at fair value $4,815 $8,223 $1,551 $14,589 (1) Includes $11 million of the Company’s common stock.
133

Table of Contents
For pension or other postretirement benefit plan assets classified as Level 1 measurements (measured using quoted prices in active markets), total fairvalue is either the price of the most recent trade at the time of the market close or the official close price, as defined by the exchange on which the asset is mostactively traded on the last trading day of the period, multiplied by the number of units held without consideration of transaction costs.
For pension or other postretirement benefit plan assets classified as Level 2 measurements, where the security is frequently traded in less active markets,fair value is based on the closing price at the end of the period; where the security is less frequently traded, fair value is based on the price a dealer would payfor the security or similar securities, adjusted for any terms specific to that asset or liability. Market inputs are obtained from well-established and recognizedvendors of market data and subjected to tolerance/quality checks. For derivative assets and liabilities, standard industry models are used to calculate the fairvalue of the various financial instruments based on significant observable market inputs, such as foreign exchange rates, commodity prices, swap rates,interest rates and implied volatilities obtained from various market sources.
Some pension or other postretirement benefit plan assets are held in funds where a net asset value is calculated based on the fair value of the underlyingassets and the number of shares owned. The classification of the fund (Level 1, 2 or 3 measurements) is determined based on the classification of thesignificant holdings within the fund. For all other pension or other postretirement benefit plan assets for which observable inputs are used, fair value is derivedthrough the use of fair value models, such as a discounted cash flow model or other standard pricing models.
For pension or other postretirement benefit plan assets classified as Level 3 measurements, total fair value is based on significant unobservable inputsincluding assumptions where there is little, if any, market activity for the investment. Investment managers or fund managers provide valuations of theinvestment on a monthly or quarterly basis. These valuations are reviewed for reasonableness based on applicable sector, benchmark and companyperformance. Adjustments to valuations are made where appropriate. Where available, audited financial statements are obtained and reviewed for theinvestments as support for the manager’s investment valuation.
The following tables summarize the changes in fair value of Level 3 pension plan assets for the years ended December 31, 2009 and 2010: Fair Value Measurement of Level 3 PensionPlan Assets Equity
FixedIncome Alternative Other
In millions Securities Securities Investments Securities Total Balance at January 1, 2009 $ 3 $ 28 $1,242 $20 $1,293 Acquisitions and divestitures - 44 257 20 321 Actual return on plan assets:
Relating to assets sold during 2009 (16) (6) (23) - (45) Relating to assets held at Dec. 31, 2009 16 13 (121) 2 (90)
Purchases, sales and settlements (3) (29) 9 9 1 68 Foreign currency impact - - 4 - 4 Balance at December 31, 2009 - $ 50 $1,458 $43 $1,551 Actual return on plan assets:
Relating to assets sold during 2010 $(3) 2 32 - 31 Relating to assets held at Dec. 31, 2010 2 2 162 (1) 165
Purchases, sales and settlements 1 (6) 379 (2) 372 Transfers into Level 3, net - 2 1 - 3 Foreign currency impact - - (5) - (5) Balance at December 31, 2010 - $ 50 $2,027 $40 $2,117
134

Table of Contents
The following tables summarize the bases used to measure the Company’s other postretirement benefit plan assets at fair value for the years endedDecember 31, 2010 and 2009: Basis of Fair Value Measurements of Other Postretirement Benefit Plan Assets at December 31, 2010
Quoted Pricesin Active
Markets forIdentical Items
SignificantOther
ObservableInputs
In millions (Level 1) (Level 2) Total Cash and cash equivalents - $ 39 $ 39 Equity securities (1) $ 6 6 - 6 6 Fixed income securities 4 129 133 Total assets at fair value $70 $168 $238 (1) Includes no common stock of the Company. Basis of Fair Value Measurements of Other Postretirement Benefit Plan Assets at December 31, 2009
Quoted Pricesin Active
Markets forIdentical Items
SignificantOther
ObservableInputs
In millions (Level 1) (Level 2) Total Cash and cash equivalents - $ 74 $ 74 Equity securities (1) $82 - 82 Fixed income securities 3 208 211 Total assets at fair value $85 $282 $367 (1) Includes no common stock of the Company.
NOTE R – LEASED PROPERTYLeased PropertyThe Company routinely leases premises for use as sales and administrative offices, warehouses and tanks for product storage, motor vehicles, railcars,computers, office machines, and equipment under operating leases. In addition, the Company leases aircraft in the United States. At the termination of theleases, the Company has the option to purchase certain leased equipment and buildings based on a fair market value determination. In 2009, the Companypurchased a previously leased ethylene plant in Canada for $713 million.
Rental expenses under operating leases, net of sublease rental income, were $404 million in 2010, $459 million in 2009 and $439 million in 2008.Future minimum rental payments under operating leases with remaining noncancelable terms in excess of one year are as follows: Minimum Operating Lease Commitments at December 31, 2010 In millions 2011 $ 202 2012 163 2013 149 2014 126 2015 115 2016 and thereafter 1,796 Total $ 2,551
135

Table of Contents
NOTE S – VARIABLE INTEREST ENTITIESOn January 1, 2010, the Company adopted ASU 2009-17, “Consolidations (Topic 810): Improvements to Financial Reporting by Enterprises Involved withVariable Interest Entities.” ASU 2009-17 amends the consolidation guidance applicable to variable interest entities (“VIEs”) and requires additional disclosuresconcerning an enterprise’s continuing involvement with VIEs. The Company evaluated the impact of this guidance and determined that the adoption resulted inthe January 1, 2010 consolidation of two additional joint ventures, an owner trust and an entity that is used to monetize accounts receivable. The Companyelected prospective application of this guidance at adoption.
The following table summarizes the carrying amount of the assets and liabilities of the two additional joint ventures and the owner trust entity includedin the Company’s consolidated balance sheet at January 1, 2010. Assets and Liabilities of Newly Consolidated VIEs Included in the Consolidated Balance Sheet In millions Jan. 1, 2010 Current assets $ 37 Property 209 Other noncurrent assets 3 Total assets $249 Current liabilities $ 76 Long-term debt 346 Total liabilities $422
The carrying amounts of assets and liabilities pertaining to the entity used to monetize accounts receivable, included in the Company’s consolidatedbalance sheet at January 1, 2010, were current assets of $817 million (including $436 million of restricted cash) and current liabilities of $589 million.
Consolidated Variable Interest EntitiesThe Company holds a variable interest in five joint ventures for which the Company is the primary beneficiary. Three of the joint ventures are developmentstage enterprises, which will produce propylene oxide and hydrogen peroxide and provide terminal services in Thailand. The Company’s variable interest inthese joint ventures relates to cost-plus arrangements between the joint venture and the Company, involving the majority of the output on take-or-pay terms andensuring a guaranteed return to the joint ventures.
Another joint venture will construct, own and operate a membrane chlor-alkali facility to be located at the Company’s Freeport, Texas integratedmanufacturing complex. The Company’s variable interests in this joint venture relate to equity options between the partners and a cost-plus off-takearrangement between the joint venture and the Company, involving proportional purchase commitments on take-or-pay terms and ensuring a guaranteed returnto the joint venture. The Company will provide the joint venture with operation and maintenance services, utilities and raw materials; market the jointventure’s co-products; and toll convert the other partner’s proportional purchase commitments into ethylene dichloride. The joint venture is expected to beginoperations in mid-2013.
The fifth joint venture was acquired through the acquisition of Rohm and Haas on April 1, 2009. This joint venture manufactures products in Japan forthe semiconductor industry. Each joint venture partner holds several equivalent variable interests, with the exception of a royalty agreement held exclusivelybetween the joint venture and the Company. In addition, the entire output of the joint venture is sold to the Company for resale to third-party customers.
The Company also holds a variable interest in an owner trust, for which the Company is the primary beneficiary. The owner trust leases an ethylenefacility in The Netherlands to the Company, whereby substantially all of the rights and obligations of ownership are transferred to the Company. TheCompany’s variable interest in the owner trust relates to a residual value guarantee provided to the owner trust. Upon expiration of the lease, which matures in2014, the Company may purchase the facility for an amount based on a fair market value determination. At December 31, 2010, the Company had providedto the owner trust a residual value guarantee of $363 million, which represents the Company’s maximum exposure to loss under the lease.
136

Table of Contents
As the primary beneficiary of these VIEs, the entities’ assets, liabilities and results of operations are included in the Company’s consolidated financialstatements. The other equity holders’ interests are reflected in “Net income attributable to noncontrolling interests” in the consolidated statements of income and“Noncontrolling interests” in the consolidated balance sheets. The following table summarizes the carrying amounts of the entities’ assets and liabilitiesincluded in the Company’s consolidated balance sheets at December 31, 2010 and December 31, 2009: Assets and Liabilities of Consolidated VIEs In millions
Dec. 31,2010
Dec. 31,2009
Current assets (restricted 2010: $228) $ 228 $ 102 Property (restricted 2010: $1,388) 1,388 455 Other noncurrent assets (restricted 2010: $122) 122 81 Total assets $ 1,738 $ 638 Current liabilities (nonrecourse 2010: $190) $ 837 $ 183 Long-term debt (nonrecourse 2010: $167) 513 125 Other noncurrent liabilities (nonrecourse 2010: $64) 64 43 Total liabilities $ 1,414 $ 351
The Company holds a variable interest in an entity created in June 2010 to monetize accounts receivable of select European entities. The Company is theprimary beneficiary of this entity as a result of holding subordinated notes while maintaining servicing responsibilities for the accounts receivable. Thecarrying amounts of assets and liabilities pertaining to this entity, included in the Company’s consolidated balance sheet at December 31, 2010, were currentassets of $158 million (zero restricted) and current liabilities of $1 million ($1 million nonrecourse). Prior to the creation of this entity, the Company held avariable interest in another entity that was also used to monetize accounts receivable originated by several European subsidiaries. That arrangement wasterminated in June 2010. No gain or loss was recognized as a result of terminating the arrangement.
Amounts presented in the consolidated balance sheets and the table above as restricted assets or nonrecourse obligations relating to consolidated VIEs atDecember 31, 2010 are adjusted for intercompany eliminations, parental guarantees and residual value guarantees.
In September 2001, Hobbes Capital S.A. (“Hobbes”), a former consolidated foreign subsidiary of the Company, issued $500 million of preferredsecurities in the form of equity certificates. The certificates provided a floating rate of return (which could be reinvested) based on LIBOR. Under theaccounting guidance for consolidation, Hobbes was a VIE and the Company was the primary beneficiary. During the third quarter of 2008, the other partnerof Hobbes redeemed its $674 million ownership in Hobbes. The minority ownership was redeemed in a non-cash transaction in exchange for a three-year notepayable with a floating rate based on LIBOR, which was repaid in September 2009. Prior to redemption, the preferred return was included in “Net incomeattributable to noncontrolling interests” in the consolidated statements of income.
Nonconsolidated Variable Interest EntityThe Company holds a variable interest in a joint venture accounted for under the equity method of accounting, acquired through the acquisition of Rohm andHaas on April 1, 2009. The joint venture manufactures crude acrylic acid in the United States and Germany on behalf of the Company and the other jointventure partner. The variable interest relates to a cost-plus arrangement between the joint venture and each joint venture partner. The Company is not theprimary beneficiary, as a majority of the joint venture’s output is sold to the other joint venture partner, and therefore the entity is not consolidated. AtDecember 31, 2010, the Company’s investment in the joint venture was $144 million, classified as “Investment in nonconsolidated affiliates” in theconsolidated balance sheets, representing the Company’s maximum exposure to loss.
137

Table of Contents
NOTE T – STOCK-BASED COMPENSATION
The Company grants stock-based compensation to employees and non-employee directors in the form of the Employees’ Stock Purchase Plan (“ESPP”) andstock option plans, which include deferred and restricted stock. Information regarding these plans is provided below.
Accounting for Stock-Based CompensationThe Company grants stock-based compensation awards that vest over a specified period or upon employees meeting certain performance and/or retirementeligibility criteria. The fair value of equity instruments issued to employees is measured on the grant date. The fair value of liability instruments issued toemployees (specifically, performance deferred stock awards, which are granted to executive employees subject to stock ownership requirements, that providethe recipient the option to elect to receive a cash payment equal to the value of the stock award on the date of delivery) is measured at the end of each quarter.The fair value of equity and liability instruments is expensed over the vesting period or, in the case of retirement, from the grant date to the date on whichretirement eligibility provisions have been met and additional service is no longer required.
The Company uses a lattice-based option valuation model to estimate the fair value of stock options, the Black-Scholes option valuation model forsubscriptions to purchase shares under the ESPP and Monte Carlo simulation for the market portion of performance deferred stock awards. The weighted-average assumptions used to calculate total stock-based compensation are included in the following table: 2010 2009 2008 Dividend yield 2.5% 3.8% 4.4% Expected volatility 47.35% 43.78% 29.57% Risk-free interest rate 1.28% 1.61% 3.42% Expected life of stock options granted during period 6.5 years 6.25 years 6 years Life of Employees’ Stock Purchase Plan 5 months 9 months 6.5 months
The dividend yield assumption for 2010 was based on a 30 percent / 70 percent blend of the Company’s current declared dividend as a percentage of thestock price on the grant date and a 10-year dividend yield average. The dividend yield assumption for 2009 was based on a 10-year dividend yield average.The dividend yield assumption for 2008 was based on the Company’s current declared dividend as a percentage of the stock price on the grant date. Theexpected volatility assumption for 2009 was based entirely on historical daily volatility, while the expected volatility assumption for 2010 and 2008 was basedon an equal weighting of the historical daily volatility and current implied volatility from exchange-traded options for the contractual term of the options. Therisk-free interest rate for all years was based on the weighted-average of U.S. Treasury strip rates over the contractual term of the options. The expected life ofstock options granted was based on an analysis of historical exercise patterns.
Employees’ Stock Purchase PlanOn February 13, 2003, the Board of Directors authorized a 10-year ESPP, which was approved by stockholders at the Company’s annual meeting on May 8,2003. Under the 2010 annual offering, most employees were eligible to purchase shares of common stock of the Company valued at up to 10 percent of theirannual base earnings. The value is determined using the plan price multiplied by the number of shares subscribed to by the employee. The plan price of thestock is set each year at no less than 85 percent of market price. Employees’ Stock Purchase Plan 2010
Shares in thousands Shares
ExercisePrice (1)
Outstanding at beginning of year - - Granted 13,753 $ 18.09 Exercised (12,359) $ 18.09 Forfeited/Expired (1,394) $ 18.09 Outstanding and exercisable at end of year - - (1) Weighted-average per share
138

Table of Contents
Additional Information about ESPP In millions, except per share amounts 2010 2009 2008 Weighted-average fair value per share of purchase rights granted $11.90 $1.00 $4.33 Total compensation expense for ESPP $ 164 $ 10 $ 20
Related tax benefit $ 61 $ 4 $ 7 Total amount of cash received from the exercise of purchase rights $ 224 $ 137 $ 32 Total intrinsic value of purchase rights exercised (1) $ 147 $ 38 $ 3
Related tax benefit $ 54 $ 14 $ 1 (1) Difference between the market price at exercise and the price paid by the employee to exercise the purchase rights
Stock Option PlansUnder the 1988 Award and Option Plan (the “1988 Plan”), a plan approved by stockholders, the Company may grant options or shares of common stock toits employees subject to certain annual and individual limits. The terms of the grants are fixed at the grant date. At December 31, 2010, there were22,612,549 shares available for grant under this plan.
Under the 1994 Non-Employee Directors’ Stock Plan, the Company was previously allowed to grant up to 300,000 options to non-employee directors;however, no additional grants will be made under this plan. At December 31, 2010, there were 34,650 options outstanding under this plan.
Under the 1998 Non-Employee Directors’ Stock Plan, the Company was previously allowed to grant up to 600,000 options to non-employee directors;however, no additional grants will be made under this plan. At December 31, 2010, there were 85,000 options outstanding under this plan.
The exercise price of each stock option equals the market price of the Company’s stock on the date of grant. Options vest from one to three years, andhave a maximum term of 10 years.
The following table provides stock option activity for 2010: Stock Options 2010
Shares in thousands Shares
ExercisePrice (1)
Outstanding at beginning of year 60,244 $ 34.22 Granted 8,488 $ 27.79 Exercised (3,103) $ 21.39 Forfeited/Expired (4,806) $ 35.80 Outstanding at end of year 60,823 $ 33.85
Remaining contractual life in years 5.41 Aggregate intrinsic value in millions $ 336 -
Exercisable at end of year 42,188 $ 38.93 Remaining contractual life in years 4.18 Aggregate intrinsic value in millions $ 103 -
(1) Weighted-average per share Additional Information about Stock Options In millions, except per share amounts 2010 2009 2008 Weighted-average fair value per share of options granted $9.17 $2.60 $8.88 Total compensation expense for stock option plans $ 72 $ 46 $ 79
Related tax benefit $ 27 $ 17 $ 29 Total amount of cash received from the exercise of options $ 6 6 - $ 40 Total intrinsic value of options exercised (1) $ 30 - $ 12
Related tax benefit $ 11 - $ 4 (1) Difference between the market price at exercise and the price paid by the employee to exercise the options
139
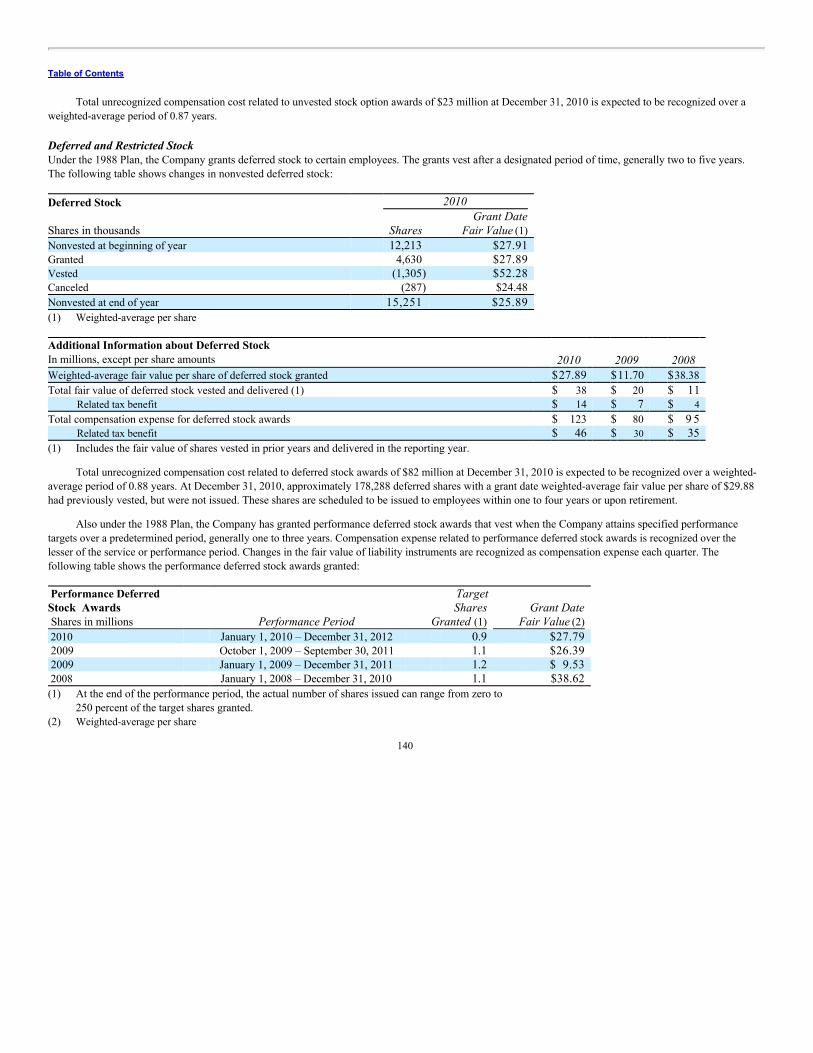
Table of Contents
Total unrecognized compensation cost related to unvested stock option awards of $23 million at December 31, 2010 is expected to be recognized over aweighted-average period of 0.87 years.
Deferred and Restricted StockUnder the 1988 Plan, the Company grants deferred stock to certain employees. The grants vest after a designated period of time, generally two to five years.The following table shows changes in nonvested deferred stock: Deferred Stock 2010
Shares in thousands Shares
Grant DateFair Value (1)
Nonvested at beginning of year 12,213 $27.91 Granted 4,630 $27.89 Vested (1,305) $52.28 Canceled (287) $24.48 Nonvested at end of year 15,251 $25.89 (1) Weighted-average per share Additional Information about Deferred StockIn millions, except per share amounts 2010 2009 2008 Weighted-average fair value per share of deferred stock granted $27.89 $11.70 $38.38 Total fair value of deferred stock vested and delivered (1) $ 38 $ 20 $ 11
Related tax benefit $ 14 $ 7 $ 4 Total compensation expense for deferred stock awards $ 123 $ 80 $ 9 5
Related tax benefit $ 46 $ 30 $ 35 (1) Includes the fair value of shares vested in prior years and delivered in the reporting year.
Total unrecognized compensation cost related to deferred stock awards of $82 million at December 31, 2010 is expected to be recognized over a weighted-average period of 0.88 years. At December 31, 2010, approximately 178,288 deferred shares with a grant date weighted-average fair value per share of $29.88had previously vested, but were not issued. These shares are scheduled to be issued to employees within one to four years or upon retirement.
Also under the 1988 Plan, the Company has granted performance deferred stock awards that vest when the Company attains specified performancetargets over a predetermined period, generally one to three years. Compensation expense related to performance deferred stock awards is recognized over thelesser of the service or performance period. Changes in the fair value of liability instruments are recognized as compensation expense each quarter. Thefollowing table shows the performance deferred stock awards granted: Performance DeferredStock Awards
TargetShares
Granted (1) Grant Date
Fair Value (2) Shares in millions Performance Period 2010 January 1, 2010 – December 31, 2012 0.9 $27.79 2009 October 1, 2009 – September 30, 2011 1.1 $26.39 2009 January 1, 2009 – December 31, 2011 1.2 $ 9.53 2008 January 1, 2008 – December 31, 2010 1.1 $38.62 (1) At the end of the performance period, the actual number of shares issued can range from zero to
250 percent of the target shares granted.(2) Weighted-average per share
140

Table of Contents
The following table shows changes in nonvested performance deferred stock: Performance Deferred Stock 2010
Shares in thousands Shares
Grant Date Fair Value (1)
Nonvested at beginning of year 3,356 $24.54 Granted 875 $27.79 Vested (1,045) $38.38 Canceled (54) $26.02 Nonvested at end of year 3,132 $20.72 (1) Weighted-average per share Additional Information about Performance Deferred Stock In millions 2010 2009 2008 Total fair value of performance deferred stock vested and delivered (1) $28 $1 $166
Related tax benefit $10 - $62 Total compensation expense for performance deferred stock awards (2) $143 $(7) $17
Related tax benefit $53 $(2) $6 (1) Includes the fair value of shares vested in prior years and delivered in the reporting year.(2) Compensation expense in 2010 includes $25 million related to the modification of equity instruments to liability
instruments for certain executive employees.
During 2010, the Company settled 0.3 million shares of performance deferred stock for $8 million in cash. During the second quarter of 2008, theCompany settled 0.9 million shares of performance deferred stock for $35 million in cash. Total unrecognized compensation cost related to performancedeferred stock awards of $32 million at December 31, 2010 is expected to be recognized over a weighted-average period of 0.51 years. At December 31, 2010,approximately 0.9 million performance deferred shares with a grant date weighted-average fair value of $38.38 per share were vested, but not issued. Theseshares are scheduled to be issued in April 2011.
In addition, the Company is authorized to grant up to 300,000 deferred shares of common stock to executive officers of the Company under the 1994Executive Performance Plan.
Under the 2003 Non-Employee Directors’ Stock Incentive Plan, a plan approved by stockholders, the Company may grant up to 1.5 million shares(including options, restricted stock and deferred stock) to non-employee directors over the 10-year duration of the program, subject to an annual aggregateaward limit of 25,000 shares for each individual director. In 2010, 38,940 shares of restricted stock with a weighted-average fair value of $30.00 per sharewere issued under this plan. The restricted stock issued under this plan cannot be sold, assigned, pledged or otherwise transferred by the non-employeedirector, until the director is no longer a member of the Board.
NOTE U – LIMITED PARTNERSHIPIn early 1998, a subsidiary of the Company purchased the 20 percent limited partner interests of outside investors in a consolidated subsidiary, ChemtechRoyalty Associates L.P., for a fair value of $210 million in accordance with wind-up provisions in the partnership agreement. The limited partnership wasrenamed Chemtech II L.P. (“Chemtech II”). In June 1998, the Company contributed assets with an aggregate fair value of $783 million (through a whollyowned subsidiary) to Chemtech II and an outside investor acquired a limited partner interest in Chemtech II totaling 20 percent in exchange for $200 million. InSeptember 2000, the Company contributed additional assets with an aggregate fair value of $18 million (through a wholly owned subsidiary) to Chemtech II.During the second quarter of 2008, the minority outside investor presented the Company with a liquidation notice, resulting in Dow’s election to purchase theoutside investor’s share in the partnership for $200 million. The transaction was completed in the second quarter of 2008.
Prior to the sale of its interest, the outside investor in Chemtech II received a cumulative annual priority return on its investment and participated inresidual earnings. For financial reporting purposes, the assets (other than intercompany loans, which were eliminated), liabilities, results of operations andcash flows of the partnership and subsidiaries were included in the Company’s consolidated financial statements, and the outside investor’s limited partnerinterest was included in “Noncontrolling interests” in the consolidated balance sheets.
141
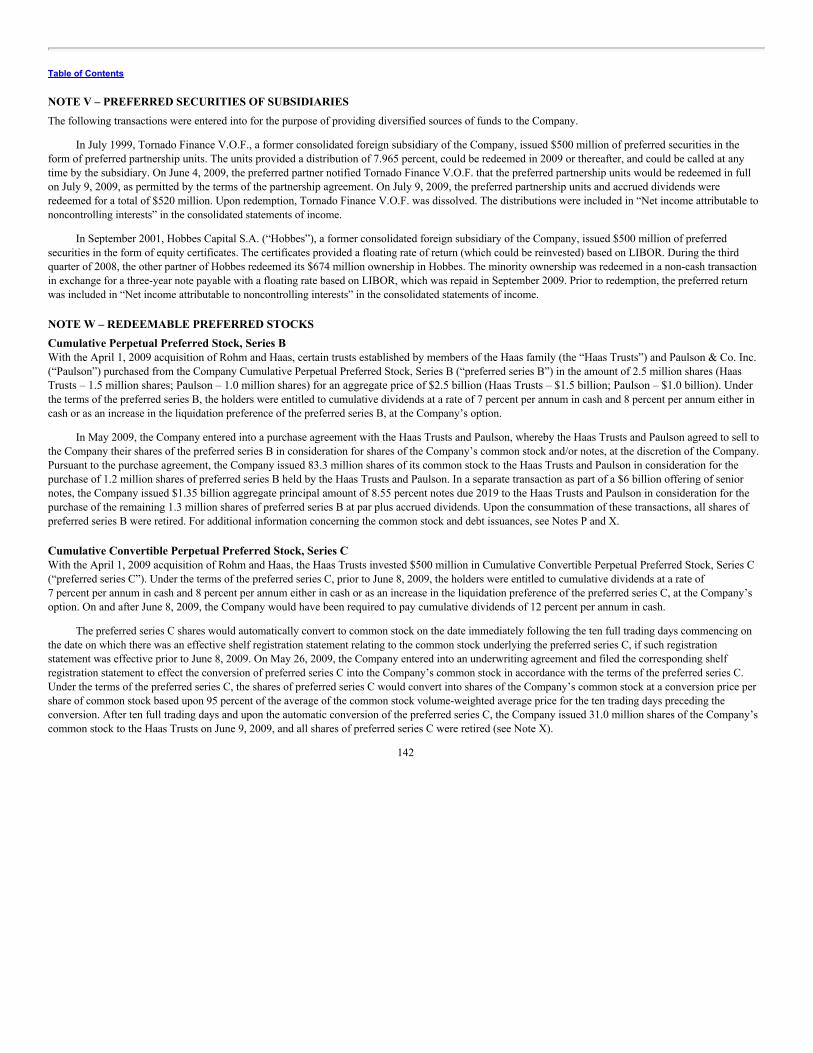
Table of Contents
NOTE V – PREFERRED SECURITIES OF SUBSIDIARIESThe following transactions were entered into for the purpose of providing diversified sources of funds to the Company.
In July 1999, Tornado Finance V.O.F., a former consolidated foreign subsidiary of the Company, issued $500 million of preferred securities in theform of preferred partnership units. The units provided a distribution of 7.965 percent, could be redeemed in 2009 or thereafter, and could be called at anytime by the subsidiary. On June 4, 2009, the preferred partner notified Tornado Finance V.O.F. that the preferred partnership units would be redeemed in fullon July 9, 2009, as permitted by the terms of the partnership agreement. On July 9, 2009, the preferred partnership units and accrued dividends wereredeemed for a total of $520 million. Upon redemption, Tornado Finance V.O.F. was dissolved. The distributions were included in “Net income attributable tononcontrolling interests” in the consolidated statements of income.
In September 2001, Hobbes Capital S.A. (“Hobbes”), a former consolidated foreign subsidiary of the Company, issued $500 million of preferredsecurities in the form of equity certificates. The certificates provided a floating rate of return (which could be reinvested) based on LIBOR. During the thirdquarter of 2008, the other partner of Hobbes redeemed its $674 million ownership in Hobbes. The minority ownership was redeemed in a non-cash transactionin exchange for a three-year note payable with a floating rate based on LIBOR, which was repaid in September 2009. Prior to redemption, the preferred returnwas included in “Net income attributable to noncontrolling interests” in the consolidated statements of income.
NOTE W – REDEEMABLE PREFERRED STOCKSCumulative Perpetual Preferred Stock, Series BWith the April 1, 2009 acquisition of Rohm and Haas, certain trusts established by members of the Haas family (the “Haas Trusts”) and Paulson & Co. Inc.(“Paulson”) purchased from the Company Cumulative Perpetual Preferred Stock, Series B (“preferred series B”) in the amount of 2.5 million shares (HaasTrusts – 1.5 million shares; Paulson – 1.0 million shares) for an aggregate price of $2.5 billion (Haas Trusts – $1.5 billion; Paulson – $1.0 billion). Underthe terms of the preferred series B, the holders were entitled to cumulative dividends at a rate of 7 percent per annum in cash and 8 percent per annum either incash or as an increase in the liquidation preference of the preferred series B, at the Company’s option.
In May 2009, the Company entered into a purchase agreement with the Haas Trusts and Paulson, whereby the Haas Trusts and Paulson agreed to sell tothe Company their shares of the preferred series B in consideration for shares of the Company’s common stock and/or notes, at the discretion of the Company.Pursuant to the purchase agreement, the Company issued 83.3 million shares of its common stock to the Haas Trusts and Paulson in consideration for thepurchase of 1.2 million shares of preferred series B held by the Haas Trusts and Paulson. In a separate transaction as part of a $6 billion offering of seniornotes, the Company issued $1.35 billion aggregate principal amount of 8.55 percent notes due 2019 to the Haas Trusts and Paulson in consideration for thepurchase of the remaining 1.3 million shares of preferred series B at par plus accrued dividends. Upon the consummation of these transactions, all shares ofpreferred series B were retired. For additional information concerning the common stock and debt issuances, see Notes P and X.
Cumulative Convertible Perpetual Preferred Stock, Series CWith the April 1, 2009 acquisition of Rohm and Haas, the Haas Trusts invested $500 million in Cumulative Convertible Perpetual Preferred Stock, Series C(“preferred series C”). Under the terms of the preferred series C, prior to June 8, 2009, the holders were entitled to cumulative dividends at a rate of7 percent per annum in cash and 8 percent per annum either in cash or as an increase in the liquidation preference of the preferred series C, at the Company’soption. On and after June 8, 2009, the Company would have been required to pay cumulative dividends of 12 percent per annum in cash.
The preferred series C shares would automatically convert to common stock on the date immediately following the ten full trading days commencing onthe date on which there was an effective shelf registration statement relating to the common stock underlying the preferred series C, if such registrationstatement was effective prior to June 8, 2009. On May 26, 2009, the Company entered into an underwriting agreement and filed the corresponding shelfregistration statement to effect the conversion of preferred series C into the Company’s common stock in accordance with the terms of the preferred series C.Under the terms of the preferred series C, the shares of preferred series C would convert into shares of the Company’s common stock at a conversion price pershare of common stock based upon 95 percent of the average of the common stock volume-weighted average price for the ten trading days preceding theconversion. After ten full trading days and upon the automatic conversion of the preferred series C, the Company issued 31.0 million shares of the Company’scommon stock to the Haas Trusts on June 9, 2009, and all shares of preferred series C were retired (see Note X).
142
Table of Contents
NOTE X – STOCKHOLDERS’ EQUITYCumulative Convertible Perpetual Preferred Stock, Series AEquity securities in the form of Cumulative Convertible Perpetual Preferred Stock, Series A (“preferred series A”) were issued on April 1, 2009 to BerkshireHathaway Inc. in the amount of $3 billion (3 million shares) and the Kuwait Investment Authority in the amount of $1 billion (1 million shares). TheCompany will pay cumulative dividends on preferred series A at a rate of 8.5 percent per annum in either cash, shares of common stock, or any combinationthereof, at the option of the Company. Dividends may be deferred indefinitely, at the Company’s option. If deferred, common stock dividends must also bedeferred. Any past due and unpaid dividends will accrue additional dividends at a rate of 10 percent per annum, compounded quarterly. If dividends aredeferred for any six quarters, the preferred series A shareholders may elect two directors to the Company’s Board of Directors until all past due dividends arepaid. Ongoing dividends related to preferred series A are $85 million per quarter; no dividends had been deferred at December 31, 2010.
Shareholders of preferred series A may convert all or any portion of their shares, at their option, at any time, into shares of the Company’s commonstock at an initial conversion rate of 24.2010 shares of common stock for each share of preferred series A. Under certain circumstances, the Company will berequired to adjust the conversion rate. On or after the fifth anniversary of the issuance date, if the common stock price exceeds $53.72 per share for any20 trading days in a consecutive 30-day window, the Company may, at its option, at any time, in whole or in part, convert preferred series A into commonstock at the then applicable conversion rate. Upon conversion, accrued and unpaid dividends will be payable, at the option of the Company, in either cash,shares of common stock, or any combination thereof.
Common StockOn May 6, 2009, the Company launched a public offering of 150.0 million shares of its common stock at a price of $15.00 per share. Included in the150.0 million shares offered to the public were 83.3 million shares issued to the Haas Trusts and Paulson in consideration for shares of preferred series B heldby the Haas Trusts and Paulson (see Note W). Gross proceeds were $2,250 million, of which the Company’s net proceeds (after underwriting discounts andcommissions) were $966 million for the sale of the Company’s 66.7 million shares.
On May 26, 2009, the Company entered into an underwriting agreement and filed the corresponding shelf registration statement to effect the conversionof the preferred series C into shares of the Company’s common stock (see Note W). On June 9, 2009, following the end of the sale period and determination ofthe share conversion amount, the Company issued 31.0 million shares to the Haas Trusts.
The Company issues common stock shares for purchases under the Employees’ Stock Purchase Plan (“ESPP”) out of treasury stock or as newcommon stock shares. The number of new common stock shares issued to employees under the Company’s ESPP was 10.0 million in 2010. No new commonshares were issued to ESPP participants in 2009 or 2008, as all share issuances were satisfied from treasury stock.
Retained EarningsThere are no significant restrictions limiting the Company’s ability to pay dividends.
Undistributed earnings of nonconsolidated affiliates included in retained earnings were $2,264 million at December 31, 2010 and $1,826 million atDecember 31, 2009.
Employee Stock Ownership PlanThe Company has the Dow Employee Stock Ownership Plan (the “ESOP”), which is an integral part of The Dow Chemical Company Employees’ SavingsPlan (the “Plan”). A significant majority of full-time employees in the United States are eligible to participate in the Plan. The Company uses the ESOP toprovide the Company’s matching contribution in the form of the Company’s stock to Plan participants.
In connection with the acquisition of Rohm and Haas (see Note D), $552 million in cash was paid to the Rohm and Haas Company Employee StockOwnership Plan (the “Rohm and Haas ESOP”) for 7.0 million shares of Rohm and Haas common stock held by the Rohm and Haas ESOP on April 1, 2009.On the date of the acquisition, the Rohm and Haas ESOP was merged into the Plan, and the Company assumed the $78 million balance of debt at 9.8 percentinterest with final maturity in 2020 that was used to finance share purchases by the Rohm and Haas ESOP in 1990. The outstanding balance of the debt was$64 million at December 31, 2010.
143

Table of Contents
On May 11, 2009, the Company sold 36.7 million shares of common stock (from treasury stock) to the ESOP at a price of $15.0561 per share for atotal of $553 million. The treasury stock was carried at an aggregate historical cost of $1,529 million.
Dividends on unallocated shares held by the ESOP are used by the ESOP to make debt service payments. Dividends on allocated shares are used by theESOP to make debt service payments to the extent needed; otherwise, they are paid to the Plan participants. Shares are released for allocation to participantsbased on the ratio of the current year’s debt service to the sum of the principal and interest payments over the life of the loan. The shares are allocated to Planparticipants in accordance with the terms of the Plan.
Compensation expense for allocated shares is recorded at the fair value of the shares on the date of allocation. ESOP shares that have not been released orcommitted to be released are not considered outstanding for purposes of computing basic and diluted earnings per share.
Compensation expense for ESOP shares allocated to plan participants was $81 million for the year ended December 31, 2010 ($48 million for the yearended December 31, 2009); no shares were allocated to plan participants in 2008. At December 31, 2010, 14.4 million shares out of a total 46.0 million sharesheld by the ESOP had been allocated to participants’ accounts; 0.9 million shares were released but unallocated; and 30.7 million shares, at a fair value of$1,050 million, were considered unearned.
Treasury StockOn October 26, 2006, the Company announced that its Board of Directors had approved a share buy-back program, authorizing up to $2 billion to be spenton the repurchase of the Company’s common stock (the “2006 Program”). Purchases under the 2006 Program began in March 2007. In 2008, the Companypurchased 21.9 million shares under the 2006 Program, bringing the total number of shares purchased under this program to 48.1 million and bringing theprogram to a close.
The total number of treasury shares purchased by the Company, including shares received from employees and non-employee directors to pay taxesowed to the Company as a result of the exercise of stock options or the delivery of deferred stock, was 0.5 million in 2010, 0.5 million in 2009 and23.0 million in 2008.
The Company issues shares for options exercised as well as for the release of deferred and restricted stock out of treasury stock or as new commonstock shares. The number of treasury shares issued to employees and non-employee directors under the Company’s option and purchase programs was7.5 million in 2010, 8.7 million in 2009 and 7.0 million in 2008. Reserved Treasury Stock at December 31 Shares in millions 2010 2009 2008 Stock option and deferred stock plans 5.1 12.2 57.0
On May 11, 2009, the Company sold 36.7 million shares from treasury stock to the ESOP.
NOTE Y – INCOME TAXESOperating loss carryforwards amounted to $4,572 million at December 31, 2010 and $4,550 million at December 31, 2009. At December 31, 2010,$405 million of the operating loss carryforwards were subject to expiration in 2011 through 2015. The remaining operating loss carryforwards expire in yearsbeyond 2015 or have an indefinite carryforward period. Tax credit carryforwards at December 31, 2010 amounted to $479 million ($656 million atDecember 31, 2009), net of uncertain tax positions, of which $12 million is subject to expiration in 2011 through 2015. The remaining tax creditcarryforwards expire in years beyond 2015.
Undistributed earnings of foreign subsidiaries and related companies that are deemed to be permanently invested amounted to $9,798 million atDecember 31, 2010, $8,707 million at December 31, 2009 and $8,043 million at December 31, 2008. It is not practicable to calculate the unrecognizeddeferred tax liability on those earnings.
144

Table of Contents
The Company had valuation allowances that primarily related to the realization of recorded tax benefits on tax loss carryforwards from operations in theUnited States, Brazil and Asia Pacific of $682 million at December 31, 2010; valuation allowances of $721 million at December 31, 2009 primarily related tothe realization of recorded tax benefits on tax loss carryforwards from operations in the United States, Brazil, Asia Pacific and Denmark.
The tax rate for 2010 was positively impacted by a high level of equity earnings as a percentage of total earnings, the release of a tax valuation allowance,a tax law change, and improved financial results in jurisdictions with tax rates that are lower than the U.S. statutory rate. These factors resulted in an effectivetax rate of 17.2 percent for 2010.
The tax rate for 2009 was reduced by several factors: a significantly higher level of equity earnings as a percent of total earnings, favorable accrual-to-return adjustments in various geographies, the recognition of domestic losses and an improvement in financial results in jurisdictions with tax rates that arelower than the U.S. statutory rate. These factors resulted in an effective tax rate of negative 20.7 percent for 2009.
The tax rate for 2008 was negatively impacted by increased foreign taxes, declining financial results in jurisdictions with lower tax rates than the UnitedStates and goodwill impairment losses that are not deductible for tax purposes (see Note I). Additionally, during 2008, the Company determined that it wasmore likely than not that certain tax loss carryforwards in the United States and Asia Pacific would not be utilized due to deteriorating market conditions forthe Company’s products in these areas, which resulted in increases in valuation allowances of $48 million in the United States and $24 million in AsiaPacific. These events resulted in an effective tax rate for 2008 that was higher than the U.S. statutory rate. The Company’s reported effective tax rate for 2008was 51.0 percent. Domestic and Foreign Components of Income from Continuing Operations Before Income Taxes In millions 2010 2009 2008 Domestic $ (821) $(290) $ (1,290) Foreign 3,623 759 2,567 Total $2,802 $ 469 $ 1,277 Reconciliation to U.S. Statutory Rate In millions 2010 2009 2008 Taxes at U.S. statutory rate $ 981 $ 164 $ 447 Equity earnings effect (272) (266) (309) Foreign income taxed at rates other than 35% (1) (262) (121) 261 U.S. tax effect of foreign earnings and dividends 118 210 164 Goodwill impairment losses - 3 75 Change in valuation allowances (34) 9 60 Unrecognized tax benefits (52) 21 31 Federal tax accrual adjustments (13) (119) 29 Other – net 15 2 (107) Total tax provision (credit) $ 481 $ (97) $ 651 Effective tax rate 17.2% (20.7)% 51.0% (1) Includes the tax provision for statutory taxable income in foreign jurisdictions for which there is no
corresponding amount in “Income from Continuing Operations Before Income Taxes.” Provision (Credit) for Income Taxes
2010 2009 2008 In millions Current Deferred Total Current Deferred Total Current Deferred Total Federal $(576) $445 $(131) $ 65 $(538) $(473) $ 3 $(541) $(538) State and local (36) (21) (57) 27 (15) 12 6 (17) (11) Foreign 765 (96) 669 463 (99) 364 918 282 1,200 Total $ 153 $328 $ 481 $555 $(652) $ (97) $927 $(276) $ 651
The provision for income taxes attributable to discontinued operations (domestic) was $65 million for 2009 and $16 million for 2008 (see Note E). TheCompany did not report discontinued operations in 2010.
145
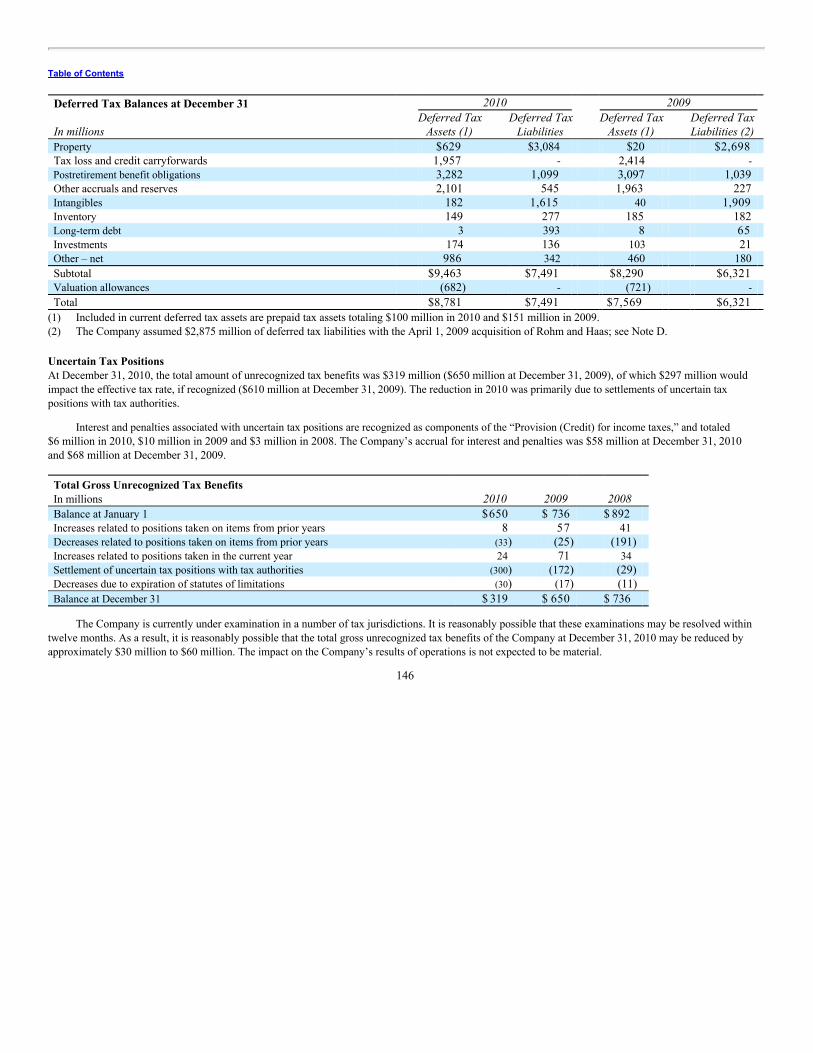
Table of Contents
Deferred Tax Balances at December 31 2010 2009
In millions
Deferred TaxAssets (1)
Deferred TaxLiabilities
Deferred TaxAssets (1)
Deferred Tax Liabilities (2)
Property $629 $3,084 $20 $2,698 Tax loss and credit carryforwards 1,957 - 2,414 - Postretirement benefit obligations 3,282 1,099 3,097 1,039 Other accruals and reserves 2,101 545 1,963 227 Intangibles 182 1,615 40 1,909 Inventory 149 277 185 182 Long-term debt 3 393 8 65 Investments 174 136 103 21 Other – net 986 342 460 180 Subtotal $9,463 $7,491 $8,290 $6,321 Valuation allowances (682) - (721) - Total $8,781 $7,491 $7,569 $6,321 (1) Included in current deferred tax assets are prepaid tax assets totaling $100 million in 2010 and $151 million in 2009.(2) The Company assumed $2,875 million of deferred tax liabilities with the April 1, 2009 acquisition of Rohm and Haas; see Note D.
Uncertain Tax PositionsAt December 31, 2010, the total amount of unrecognized tax benefits was $319 million ($650 million at December 31, 2009), of which $297 million wouldimpact the effective tax rate, if recognized ($610 million at December 31, 2009). The reduction in 2010 was primarily due to settlements of uncertain taxpositions with tax authorities.
Interest and penalties associated with uncertain tax positions are recognized as components of the “Provision (Credit) for income taxes,” and totaled$6 million in 2010, $10 million in 2009 and $3 million in 2008. The Company’s accrual for interest and penalties was $58 million at December 31, 2010and $68 million at December 31, 2009. Total Gross Unrecognized Tax Benefits In millions 2010 2009 2008 Balance at January 1 $650 $ 736 $ 892 Increases related to positions taken on items from prior years 8 57 41 Decreases related to positions taken on items from prior years (33) (25) (191) Increases related to positions taken in the current year 24 71 34 Settlement of uncertain tax positions with tax authorities (300) (172) (29) Decreases due to expiration of statutes of limitations (30) (17) (11) Balance at December 31 $ 319 $ 650 $ 736
The Company is currently under examination in a number of tax jurisdictions. It is reasonably possible that these examinations may be resolved withintwelve months. As a result, it is reasonably possible that the total gross unrecognized tax benefits of the Company at December 31, 2010 may be reduced byapproximately $30 million to $60 million. The impact on the Company’s results of operations is not expected to be material.
146

Table of Contents
Tax years that remain subject to examination for the Company’s major tax jurisdictions are shown below: Tax Years Subject to Examination by Major Tax Jurisdiction at December 31
Earliest Open Year Jurisdiction 2010 2009 Argentina 2004 2003 Brazil 2005 2004 Canada 2006 2002 France 2008 2007 Germany 2002 2002 Italy 2005 2004 The Netherlands 2009 2008 Spain 2004 2004 Switzerland 2008 2008 United Kingdom 2008 2007 United States:
Federal income tax 2004 2004 State and local income tax 1996 1989
The reserve for non-income tax contingencies related to issues in the United States and foreign locations was $156 million at December 31, 2010 and$189 million at December 31, 2009. This is management’s best estimate of the potential liability for non-income tax contingencies. Inherent uncertainties existin estimates of tax contingencies due to changes in tax law, both legislated and concluded through the various jurisdictions’ tax court systems. It is the opinionof the Company’s management that the possibility is remote that costs in excess of those accrued will have a material adverse impact on the Company’sconsolidated financial statements.
NOTE Z – OPERATING SEGMENTS AND GEOGRAPHIC AREASDow is a diversified, worldwide manufacturer and supplier of products used primarily as raw materials in the manufacture of customer products andservices. The Company serves the following industries: appliance; automotive; agricultural; building and construction; chemical processing; electronics;furniture; housewares; oil and gas; packaging; paints, coatings and adhesives; personal care; pharmaceutical; processed foods; pulp and paper; textile andcarpet; utilities; and water treatment.
Dow conducts its worldwide operations through global businesses, which are reported in eight operating segments. The Company’s operating segmentsare Electronic and Specialty Materials, Coatings and Infrastructure, Health and Agricultural Sciences, Performance Systems, Performance Products, Plastics,Chemicals and Energy, and Hydrocarbons. Corporate contains the reconciliation between the totals for the reportable segments and the Company’s totals andincludes research and other expenses related to new business development activities, and other corporate items not allocated to the reportable operatingsegments.
In the fourth quarter of 2010, the Company made the following changes to its operating segments to reflect changes in the Company’s organization. • Segment name changed from Basic Plastics to Plastics • Segment name changed from Basic Chemicals to Chemicals and Energy • Segment name changed from Hydrocarbons and Energy to Hydrocarbons • Energy moved from Hydrocarbons to Chemicals and Energy • Construction-related cellulosics moved from Electronic and Specialty Materials to Coatings and Infrastructure • Transportation adhesives moved from Coatings and Infrastructure to Performance Systems • Certain new business development initiatives moved from Performance Products to Coatings and Infrastructure
The reporting changes are reflected for all periods presented.
147

Table of Contents
The Company uses EBITDA (which Dow defines as earnings before interest, income taxes, depreciation and amortization) as its measure of profit/lossfor segment reporting purposes. EBITDA by operating segment includes all operating items relating to the businesses, except depreciation and amortization;items that principally apply to the Company as a whole are assigned to Corporate. See table toward the end of this footnote for depreciation and amortizationby segment, as well as a reconciliation of EBITDA to “Income from Continuing Operations Before Income Taxes.”
The Corporate Profile included below describes the operating segments, and the types of products and services from which their revenues are derived.
Corporate ProfileDow combines the power of science and technology with the “Human Element” to passionately innovate what is essential to human progress. The Companyconnects chemistry and innovation with the principles of sustainability to help address many of the world’s most challenging problems such as the need forclean water, renewable energy generation and conservation, and increasing agricultural productivity. Dow’s diversified industry-leading portfolio of specialtychemical, advanced materials, agrosciences and plastics businesses deliver a broad range of technology-based products and solutions to customers inapproximately 160 countries and in high growth sectors such as electronics, water, energy, coatings and agriculture. In 2010, Dow had annual sales of$53.7 billion and employed approximately 50,000 people worldwide. The Company’s more than 5,000 products are manufactured at 188 sites in 35 countriesacross the globe. The following descriptions of the Company’s eight operating segments include a representative listing of products for each business.
ELECTRONIC AND SPECIALTY MATERIALSApplications: chemical mechanical planarization (CMP) pads and slurries • chemical processing aids and intermediates • electronic displays • foodand pharmaceutical processing and ingredients • home and personal care ingredients • hygiene and infection control • photolithography materials •printed circuit board materials • process and materials preservation • semiconductor packaging, connectors and industrial finishing • water purification
Dow Electronic Materials is a leading global supplier of materials for chemical mechanical planarization; materials used in the production ofelectronic displays, including brightness films, diffusers, metalorganic light emitting diode (LED) precursors and organic light emitting diode(OLED) materials; products and technologies that drive leading edge semiconductor design; materials used in the fabrication of printed circuitboards; and integrated metallization processes critical for interconnection, corrosion resistance, metal finishing and decorative applications. Theseenabling materials are found in applications such as consumer electronics, flat panel displays and telecommunications.
• Products: ACuPLANE™ CMP slurries; AR™ antireflective coatings; AUROLECTROLESS™ immersion gold process; COPPERGLEAM™ acid copper plating products; CYCLOTENE™ advanced electronics resins; DURAPOSIT™ electroless nickel process;ENLIGHT™ products for photovoltaic manufacturers; EPIC™ immersion photoresists; INTERVIA™ photodielectrics for advancedpackaging; LITHOJET™ digital imaging processes; OPTOGRADE™ metalorganic precursors; VISIONPAD™ CMP pads
Specialty Materials is a portfolio of businesses characterized by a vast global footprint, a broad array of unique chemistries, multi-functionalingredients and technology capabilities, combined with key positions in the pharmaceuticals, food, home and personal care, water and energyproduction, and industrial specialty industries. These technology capabilities and market platforms enable the businesses to develop innovativesolutions that address modern societal needs for sufficient and clean water, air and energy, material preservation and improved health care,disease prevention, nutrition and wellness. The businesses’ global footprint and geographic reach provide multiple opportunities for value growth.Specialty Materials consists of five global businesses: Dow Water and Process Solutions, Dow Home and Personal Care, Dow Microbial Control,Dow Wolff Cellulosics and Performance Materials.
• Products and Services: Acrolein derivatives; ACUDYNE™ hair fixative resins; ACULYN™ rheology modifiers; ACUMER™ scaleinhibitors and dispersants; ACUSOL™ detergent polymers, dispersants, opacifiers and rheology modifiers; AMBERCHROM™chromatography resins; AMBERJET™, AMBERLITE™, AMBERLYST™ and DOWEX™ ion exchange resins; ANGUS™nitroalkanes and derivatives; AQUCAR™ water treatment microbiocides; ASC METATIN™ dimethyltin catalyst;
148

Table of Contents
AUTOMATE™ liquid dyes; BIOBAN™ biocide for material preservation; CELLOSIZE™ hydroxyethyl cellulose;CLEAR+STABLE™ carboxymethyl cellulose; Divinylbenzene; DOW™ electrodeionization; DOW™ ultrafiltration; DUOLITE™pharmaceutical grade resins; DURAGREEN™ and DURAPLUS™ floor care polymers; ECOSMOOTH™ silk conditioning polymers;ECOSURF™ biodegradable surfactants; ETHOCEL™ ethylcellulose polymers; FILMTEC™ reverse osmosis membrane elements;GLUTEX™ sanitizers and cleaners; KATHON™ preservatives; KLARIX™ algicides; METHOCEL™ cellulose ethers; NEOLONE™preservatives for personal care; OPULYN™ opacifiers; POLYOX™ water-soluble resins; PRIMENE™ amines; Quaternaries;SATISFIT™ Weight Care Technology; SILVADUR™ antimicrobial; Sodium borohydride products; SOFTCAT™ polymers;SOLTERRA™ Boost inorganic SPF booster; SOLTEX™ waterproofing polymer; SUNSPHERES™ SPF boosters; UCARE™polymers; UCARHIDE™ opacifier; UCON™ fluids; VENPURE™ reducing agents; VERSENE™ chelating agents; Vinylbenzylchloride; VINYZENE™ antimicrobials for plastics; WALOCEL™ cellulose polymers; WALSRODER™ nitrocellulose; ZinClear™ IMzinc oxide dispersions
The Electronic and Specialty Materials segment also includes the Company’s share of the results of Dow Corning Corporation, a joint venture ofthe Company.
COATINGS AND INFRASTRUCTUREApplications: building and construction, insulation and weatherization, roofing membrane systems, adhesives and sealants • cellulosic-basedconstruction additives • construction materials (vinyl siding, vinyl windows, vinyl fencing) • flexible and rigid packaging • general mortars andconcrete, cement modifiers and plasters, tile adhesives and grouts • house and traffic paints • leather, textile, graphic arts and paper • metal coatings •pipeline coatings • processing aids for plastic production • tapes and labels • transportation and corrosion protection
Dow Adhesives and Functional Polymers is a portfolio of businesses that primarily manufacture sticking and bonding solutions for a widerange of applications, including adhesive tapes and paper labels, flexible packaging and leather, textile and imaging. These products aresupported with market recognized best-in-class technical support and end-use application knowledge. Many of the businesses’ water-bornetechnologies are well-positioned to support more environmentally preferred applications.
• Products: ADCOTE™ and AQUA-LAM™ laminating adhesives; MOR-FREE™ solventless adhesives; ROBOND™ acrylic
adhesives; SERFENE™ barrier coatings; Solvent-based polyurethanes and polyesters; TYMOR™ tie resins
Dow Building and Construction is comprised of three global businesses – Dow Building Solutions, Dow Construction Chemicals and DowSolar Solutions – which offer extensive lines of industry-leading insulation, housewrap, sealant and adhesive products and systems, as well asconstruction chemical solutions and building-integrated photovoltaics. Through its strong sales support, customer service and technical expertise,Dow Building Solutions provides meaningful solutions for improving the energy efficiency in homes and buildings today, while also addressingthe industry’s emerging needs and demands. Dow Construction Chemicals provides solutions for increased durability, greater water resistanceand lower systems costs. As a leader in insulation solutions, the businesses’ products help curb escalating utility bills, reduce a building’scarbon footprint and provide a more comfortable indoor environment. Dow Solar Solutions is focused on developing the next generation of solarenergy products to solve global energy challenges.
• Products: AQUASET™ acrylic thermosetting resins; CELLOSIZE™ hydroxyethyl cellulose; DOW™ latex powders; FROTH-PAK™polyurethane spray foam; GREAT STUFF™ polyurethane foam sealant; INSTA-STIK™ roof insulation adhesive; METHOCEL™cellulose ethers; POWERHOUSE™ solar shingle; RHOPLEX™ aqueous acrylic polymer emulsions; STYROFOAM™ brand insulationproducts (including extruded polystyrene and polyisocyanurate rigid foam sheathing products); THERMAX™ insulation; TILEBOND™ roof tile adhesive; WEATHERMATE™ weather barrier solutions (housewraps, sill pans, flashings and tapes)
149

Table of Contents
Dow Coating Materials is the largest coatings supplier in the world and a premier supplier of raw materials for architectural paints andindustrial coatings. The business manufactures and delivers solutions that leverage high quality, technologically advanced product offerings forpaint and coatings. The business also offers technologies used in industrial coatings, including packaging, pipelines, wood, automotive, marine,maintenance and protective industries. The business is also the leader in the conversion of solvent to water-based technologies, which enablecustomers to offer more environmentally friendly products, including low volatile organic compound (VOC) paints and other sustainablecoatings.
• Products: ACRYSOL™ rheology modifiers; AVANSE™, ELASTENE™, PRIMAL™ and RHOPLEX™ acrylics; CELLOSIZE™hydroxyethyl cellulose; CELLOSOLVE™ and the CARBITOL™ and DOWANOL™ series of oxygenated solvents; D.E.H.™ curingagent and intermediates; D.E.R.™ and D.E.N.™ liquid and epoxy resins; FORTEGRA™ Epoxy Tougheners; OROTAN™ andTAMOL™ dispersants; ROPAQUE™ opaque polymers; TRITON™, TERGITOL™, DOWFAX™ and ECOSURF™ SA surfactants
HEALTH AND AGRICULTURAL SCIENCESApplications: agricultural seeds, traits (genes) and oils • control of weeds, insects and plant diseases for agriculture and pest management
Dow AgroSciences is a global leader in providing agricultural and plant biotechnology products, pest management solutions and healthy oils.The business invents, develops, manufactures and markets products for use in agriculture, industrial and commercial pest management, andfood service.
• Products: AGROMEN™ seeds; BRODBECK™ seed; CLINCHER™ herbicide; DAIRYLAND™ seed; DELEGATE™ insecticide;DITHANE™ fungicide; Dow AgroSciences™ SmartStax™; FORTRESS™ fungicide; GARLON™ herbicide; GLYPHOMAX™herbicide; GRANITE™ herbicide; HERCULEX™ I, HERCULEX™ RW and HERCULEX™ XTRA insect protection;KEYSTONE™ herbicides; LAREDO™ fungicide; LONTREL™ herbicide; LORSBAN™ insecticides; MILESTONE™ herbicide;MUSTANG™ herbicide; MYCOGEN™ seeds; NEXERA™ canola and sunflower seeds; PHYTOGEN™ cottonseeds; PROFUME™gas fumigant; RENZE™ seed; SENTRICON™ termite colony elimination system; SIMPLICITY™ herbicide; STARANE™ herbicide;TELONE™ soil fumigant; TORDON™ herbicide; TRACER™ NATURALYTE™ insect control; TRIUMPH™ seed; VIKANE™structural fumigant; WIDESTRIKE™ insect protection
The Health and Agricultural Sciences segment also includes the results of the AgroFresh business, providing a portfolio of products used formaintaining the freshness of fruits, vegetables and flowers.
PERFORMANCE SYSTEMSApplications: automotive interiors, exteriors, under-the-hood and body engineered systems • bedding • caps and closures • food and specialtypackaging • footwear • furniture • gaskets and sealing components • manufactured housing and modular construction • medical equipment • mining •pipe treatment • pressure sensitive adhesives • transportation • vinyl exteriors • waterproofing membranes • wire and cable insulation and jacketingmaterials for power utility and telecommunications
Dow Automotive Systems is a leading global provider of technology-driven solutions that meet consumer demand for vehicles that are safer,stronger, quieter, lighter, more comfortable and stylish. The business provides plastics, adhesives, glass bonding systems, emissions controltechnology, films, fluids, structural enhancement and acoustical management solutions to original equipment manufacturers, tier, aftermarketand commercial transportation customers. With offices and application development centers around the world, Dow Automotive Systemsprovides materials science expertise and comprehensive technical capabilities to its customers worldwide.
• Products: AERIFY™ diesel particulate filters; BETAFOAM™ NVH acoustical foams; BETAMATE™ structural adhesives;BETASEAL™ glass bonding systems; DOW™ polyethylene resins; IMPAXX™ energy management foam; INSPIRE™ performancepolymers; INTEGRAL™ adhesive films; ISONATE™ pure and modified methylene diphenyl diisocyanate (MDI) products;PELLETHANE™ thermoplastic polyurethane elastomers; Premium brake fluids and lubricants; SPECFLEX™ semi-flexiblepolyurethane foam systems
150

Table of Contents
Dow Elastomers offers a unique set of elastomers, specialty films and plastic additive products for customers worldwide. The business isfocused on delivering innovative solutions that allow for differentiated participation in multiple industries and applications. The business offers abroad range of performance elastomers and plastomers, specialty copolymers, synthetic rubber, specialty resins, and films and plastic additives.Key applications include adhesives, transportation, building and construction, packaging and consumer durables.
• Products: ADVASTAB™ thermal stabilizer; AFFINITY™ polyolefin plastomers (POPs); AMPLIFY™ functional polymers; DOW™Adhesive Film; DOW™ Backing Layer Film; DOW™ Medical Device Film; DOW™ Medical Packaging Film; DOW™ very lowdensity polyethylene; ENGAGE™ polyolefin elastomers; ENLIGHT™ polyolefin encapsulant films; INFUSE™ olefin blockcopolymers; INTEGRAL™ adhesive films; NORDEL™ hydrocarbon rubber; NYLOPAK™ nylon barrier films; OPTICITE™ films;PARALOID™ EXL impact modifier; PRIMACOR™ copolymers; PROCITE™ window envelope films; SARAN™ barrier resins;SARANEX™ barrier films; TRENCHCOAT™ protective films; TRYCITE™ polystyrene film; TYBRITE™ clear packaging film;TYRIN™ chlorinated polyethylene; VERSIFY™ plastomers and elastomers
Dow Formulated Systems manufactures and markets custom formulated, rigid and semi-rigid, flexible, integral skin and microcellularpolyurethane foams and systems and tailor-made epoxy solutions and systems. These products are used in a broad range of applicationsincluding appliances, athletic equipment, automotive, bedding, construction, decorative molding, furniture, shoe soles and wind turbines.
• Products: AIRSTONE™ epoxy systems; Encapsulants and chemical compositions; ENFORCER™ Technology and ENHANCER™Technology for polyurethane carpet and turf backing; HYPERKOTE™, TRAFFIDECK™ and VERDISEAL™ waterproofing systems;HYPOL™ hydrophilic polyurethane prepolymers; RENUVA™ Renewable Resource Technology; SPECFIL™ urethane components;SPECFLEX™ copolymer polyols; SPECTRIM™ reaction moldable products; VORACOR™ and VORALAST™ polyurethane systemsand VORALAST™ R renewable content system; VORAMER™ industrial adhesives and binders; VORASTAR™ polymers;XITRACK™ polyurethane rail ballast stabilization systems
Dow Wire and Cable is the world’s leading provider of polymers, additives and specialty oil technology-based solutions for electrical andtelecommunication applications. Through its suite of polyolefin ENDURANCE™ products, the business sets industry standards for assuranceof longevity, efficiency, ease of installation and protection in the transmission, distribution and consumption of power, voice and data. In additionto world-class power, telecommunications and flame retardant/specialty cable applications, the business supports its product offerings with solidresearch, product development, engineering and market validation expertise.
• Products: ENGAGE™ polyolefin elastomers; NORDEL™ hydrocarbon rubber; SI-LINK™ and REDI-LINK™ moisture crosslinkable
polyethylene-based wire and cable insulation compounds; TYRIN™ chlorinated polyethylene; UNIGARD™ flame retardant compoundfor specialty wire and cable applications
The Performance Systems segment also includes the results of Dow Fiber Solutions, providing differentiated fibers and process improvements tothe textile industry, and Dow Oil and Gas, providing products for use in exploration and production, refining and gas processing, transportation,and fuel and lubricant performance.
On March 2, 2010, Dow announced the entry into a definitive agreement to sell Styron to an affiliate of Bain Capital Partners; the transactionclosed on June 17, 2010. Businesses and products sold included Synthetic Rubber and certain products from Dow Automotive Systems, whichwere reported in the Performance Systems segment through the date of the divestiture (see Note E).
PERFORMANCE PRODUCTSApplications: adhesives • aircraft and runway deicing fluids • appliances • carpeting • chelating agents • chemical intermediates • civil engineering •cleaning products • coated paper and paperboard • composites • construction • corrosion inhibitors • detergents, cleaners and fabric softeners • electricalcastings, potting and encapsulation and tooling • electrical laminates • electronics • flavors and fragrances • flooring • footwear • gas treatment • heattransfer fluids • home and office furnishings • industrial coatings • mattresses • metalworking fluids • packaging • sealants • surfactants
151
Table of Contents
The Amines business is the world’s largest producer of ethanolamines, ethyleneamines and isopropanolamines used in a wide variety ofapplications, including gas treatment, heavy-duty liquid detergents, herbicide formulations for the agricultural industry and personal careproducts.
• Products: Alkyl alkanolamines; Ethanolamines; Ethyleneamines; Isopropanolamines; Piperazine; VERSENE™ chelating agents
The Emulsion Polymers business provided a broad line of styrene-butadiene products supporting customers in paper and paperboardapplications, as well as carpet and artificial turf backings.
On March 2, 2010, Dow announced the entry into a definitive agreement to sell Styron to an affiliate of Bain Capital Partners; thetransaction closed on June 17, 2010. Businesses sold included Emulsion Polymers (styrene-butadiene latex), which was reported in thePerformance Products segment through the date of the divestiture (see Note E).
The Epoxy business is the world’s largest producer of epoxy resins and intermediates. The business is the most feedstock-integrated supplier inthe world. Epoxies provide good adhesion and coating protection over a range of environmental conditions, making them ideal for applicationssuch as transportation, marine and civil engineering.
• Products: D.E.H.™ epoxy curing agents or hardeners; D.E.N.™ epoxy novolac resins; D.E.R.™ epoxy resins (liquids, solids and
solutions); Epoxy intermediates (acetone, allyl chloride, epichlorohydrin and phenol); Epoxy resin waterborne emulsions and dispersions;FORTEGRA™ epoxy tougheners; Glycidyl methacrylate (GMA)
The Oxygenated Solvents business offers a full range of acetone derivatives, alcohols, esters, and ethylene- and propylene-based glycol etherproducts. The business is the industry leader in solvent products used in cleaning products, inks, electronics, mining, paints and coatings,personal care and other applications.
• Products: Acetic esters; Acetone derivatives; Alcohols; Aldehydes; Butyl CARBITOL™ and Butyl CELLOSOLVE™ solvents;
Carboxylic acids; DOWANOL™ glycol ethers; ECOSOFT™ IK solvent; PROGLYDE™ DMM solvent; UCAR™ propionates
The Performance Monomers business produces specialty monomer products that are sold externally as well as consumed internally as buildingblocks used in downstream polymer businesses. The business’ products are used in several applications, including cleaning materials, personalcare products, paints, coatings and inks.
• Products: Acrylic acid/acrylic esters; ACUMER™, ACUSOL™, DURAMAX™, OPTIDOSE™, ROMAX™ and TAMOL™
dispersants; Methyl methacrylate
The Polyglycols, Surfactants and Fluids business is one of the world’s leading suppliers of polyglycols and surfactants, with a broad range ofproducts and technology and a proven record of performance and economy. The business also produces a broad line of lubricants, hydraulicfluids, aircraft deicing fluids and thermal fluids, with some of the most recognized brand names in the industry. Product applications includechemical processing, cleaning, heating, cooling, food and beverage processing, fuel additives, paints and coatings, pharmaceuticals and siliconesurfactants.
• Products: AMBITROL™ and NORKOOL™ coolants; CARBOWAX™ and CARBOWAX SENTRY™ polyethylene glycols andmethoxypolyethylene glycols; DOW™ polypropylene glycols; DOW™ SYMBIO base fluid; DOWFAX™, TERGITOL™ andTRITON™ surfactants; DOWFROST™ and DOWTHERM™ heat transfer fluids; ECOSURF™ biodegradable surfactants;SYNALOX™ lubricants; UCAR™ deicing fluids; UCON™ fluids
The Polyurethanes business is a leading global producer of polyurethane raw materials. Dow’s polyurethane products are used in a broad rangeof applications including appliance, athletic equipment, automotive, bedding, construction, decorative molding, furniture and shoe soles.
152

Table of Contents
• Products: ECHELON™ polyurethane prepolymer; ISONATE™ methylene diphenyl diisocyanate (MDI); MONOTHANE™ single
component polyurethane elastomers; PAPI™ polymeric MDI; Propylene glycol; Propylene oxide; RENUVA™ Renewable ResourceTechnology; VORANATE™ isocyanate; VORANOL™ VORACTIV™ polyether and copolymer polyols
The Performance Products segment also includes the results of Dow Haltermann, a provider of world-class contract manufacturing services tocompanies in the fine and specialty chemicals and polymers industries, and SAFECHEM, a wholly owned subsidiary that manufactures closed-loop systems to manage the risks associated with chlorinated solvents. The segment also includes a portion of the results of the OPTIMAL Groupof Companies (through the September 30, 2009 divestiture of this group of joint ventures) and the SCG-Dow Group, joint ventures of theCompany.
PLASTICSApplications: adhesives • appliances and appliance housings • agricultural films • automotive parts and trim • beverage bottles • bins, crates, pails andpallets • building and construction • coatings • consumer and durable goods • consumer electronics • disposable diaper liners • fibers and nonwovens •films, bags and packaging for food and consumer products • hoses and tubing • household and industrial bottles • housewares • hygiene and medicalfilms • industrial and consumer films and foams • information technology • oil tanks and road equipment • plastic pipe • textiles • toys, playgroundequipment and recreational products • wire and cable compounds
The Polyethylene business is the world’s leading supplier of polyethylene-based solutions through sustainable product differentiation. Withmultiple catalyst and process technologies, the business offers customers one of the industry’s broadest ranges of polyethylene resins.
• Products: ASPUN™ fiber grade resins; ATTANE™ ultra low density polyethylene (ULDPE) resins; CONTINUUM™ bimodalpolyethylene resins; DOW™ high density polyethylene (HDPE) resins; DOW™ low density polyethylene (LDPE) resins; DOWLEX™polyethylene resins; ELITE™ enhanced polyethylene (EPE) resins; TUFLIN™ linear low density polyethylene (LLDPE) resins;UNIVAL™ HDPE resins
The Polypropylene business, a major global polypropylene supplier, provides a broad range of products and solutions tailored to customer needsby leveraging Dow’s leading manufacturing and application technology, research and product development expertise, extensive market knowledgeand strong customer relationships.
• Products: DOW™ homopolymer polypropylene resins; DOW™ impact copolymer polypropylene resins; DOW™ random copolymer
polypropylene resins; INSPIRE™ performance polymers; UNIPOL™ PP process technology; SHAC™ and SHAC™ ADT catalystsystems
The Styrenics business, the global leader in the production of polystyrene resins, is uniquely positioned with geographic breadth andparticipation in a diversified portfolio of applications.
• Products: Licensing and supply of related catalysts, process control software and services for the Mass ABS process technology;
STYRON A-TECH™ and C-TECH™ advanced technology polystyrene resins and a full line of STYRON™ general purposepolystyrene resins; STYRON™ high-impact polystyrene resins
On March 2, 2010, Dow announced the entry into a definitive agreement to sell Styron to an affiliate of Bain Capital Partners; thetransaction closed on June 17, 2010. Businesses sold included Styrenics (polystyrene, acrylonitrile butadiene styrene, styreneacrylonitrile and expandable polystyrene), Polycarbonate and Compounds and Blends, as well as the Company’s 50-percent ownershipinterest in Americas Styrenics LLC, a nonconsolidated affiliate; all of which were reported in the Plastics segment through the date of thedivestiture (see Note E).
The Plastics segment also includes the results of the Plastics Licensing and Catalyst business and the Polycarbonate and Compounds and Blendsbusiness (through the June 17, 2010 divestiture of Styron). It also includes the results of Equipolymers, Americas Styrenics LLC (through theJune 17, 2010 divestiture of Styron) and Univation Technologies, LLC (which licenses the UNIPOL™ polyethylene process and sells relatedcatalysts, including metallocene catalysts), as well as a portion of the results of EQUATE Petrochemical Company K.S.C., The Kuwait OlefinsCompany K.S.C. and the SCG-Dow Group, all joint ventures of the Company.
153

Table of Contents
CHEMICALS AND ENERGYApplications: agricultural products • alumina • automotive antifreeze and coolant systems • carpet and textiles • chemical processing • dry cleaning •household cleaners and plastic products • inks • metal cleaning • packaging, food and beverage containers • paints, coatings and adhesives • personalcare products • petroleum refining • pharmaceuticals • plastic pipe • power • protective packaging • pulp and paper manufacturing • soaps anddetergents • water treatment
The Chlor-Alkali/Chlor-Vinyl business focuses on the production of chlorine for consumption by downstream Dow derivatives, as well asproduction, marketing and supply of ethylene dichloride, vinyl chloride monomer and caustic soda. These products are used for applicationssuch as alumina production, pulp and paper manufacturing, soaps and detergents and building and construction. Dow is the world’s largestproducer of both chlorine and caustic soda.
• Products: Caustic soda; Chlorine; Ethylene dichloride (EDC); Hydrochloric acid; Vinyl chloride monomer (VCM)
The Energy business supplies power, steam and other utilities, principally for use in Dow’s global operations.
• Products: Power, steam and other utilities
The Ethylene Oxide/Ethylene Glycol business is the world’s largest producer of purified ethylene oxide, principally used in Dow’s downstreamperformance derivatives. Dow is also a key supplier of ethylene glycol to MEGlobal, a 50:50 joint venture and a world leader in the manufactureand marketing of merchant monoethylene glycol and diethylene glycol. Ethylene glycol is used in polyester fiber, polyethylene terephthalate (PET)for food and beverage container applications, polyester film, and aircraft and runway deicers.
• Products: Ethylene oxide (EO); Ethylene glycol (EG); METEOR™ EO/EG process technology and catalysts
The Chemicals and Energy segment also includes the results of the Chlorinated Organics business. Also included in the Chemicals and Energysegment are the results of MEGlobal and a portion of the results of EQUATE Petrochemical Company K.S.C., The Kuwait Olefins CompanyK.S.C. and the OPTIMAL Group of Companies (through the September 30, 2009 divestiture of this group of joint ventures), all joint ventures ofthe Company.
HYDROCARBONSApplications: polymer and chemical production
The Hydrocarbons business encompasses the procurement of natural gas liquids and crude oil-based raw materials, as well as the supply ofmonomers, principally for use in Dow’s global operations. The business regularly sells its by-products and buys and sells products in order tobalance regional production capabilities and derivative requirements. The business also sells products to certain Dow joint ventures. Dow is theworld leader in the production of olefins and aromatics.
• Products: Benzene; Butadiene; Butylene; Cumene; Ethylene; Propylene; Styrene
The Hydrocarbons segment also includes the results of Compañía Mega S.A. and a portion of the results of The Kuwait Olefins CompanyK.S.C. and the SCG-Dow Group, joint ventures of the Company.
On March 2, 2010, Dow announced the entry into a definitive agreement to sell Styron to an affiliate of Bain Capital Partners; the transactionclosed on June 17, 2010. Businesses and products sold included certain styrene monomer assets, which were reported in the Hydrocarbonssegment through the date of the divestiture (see Note E).
154

Table of Contents
Corporate includes the results of Ventures (which includes new business incubation platforms focused on identifying and pursuing newcommercial opportunities); Venture Capital; non-business aligned technology licensing and catalyst activities; the Company’s insuranceoperations and environmental operations; and certain corporate overhead costs and cost recovery variances not allocated to the operating segments.In 2009, Corporate also included the results of the Salt business, which the Company acquired with the April 1, 2009 acquisition of Rohm andHaas and sold to K+S Aktiengesellschaft on October 1, 2009.
Total assets divested with the sale of Styron on June 17, 2010 are presented by operating segment in Note E.
Transfers of products between operating segments are generally valued at cost. However, transfers of products to Health and Agricultural Sciencesfrom other segments are generally valued at market-based prices; the revenues generated by these transfers are provided in the following table:
155
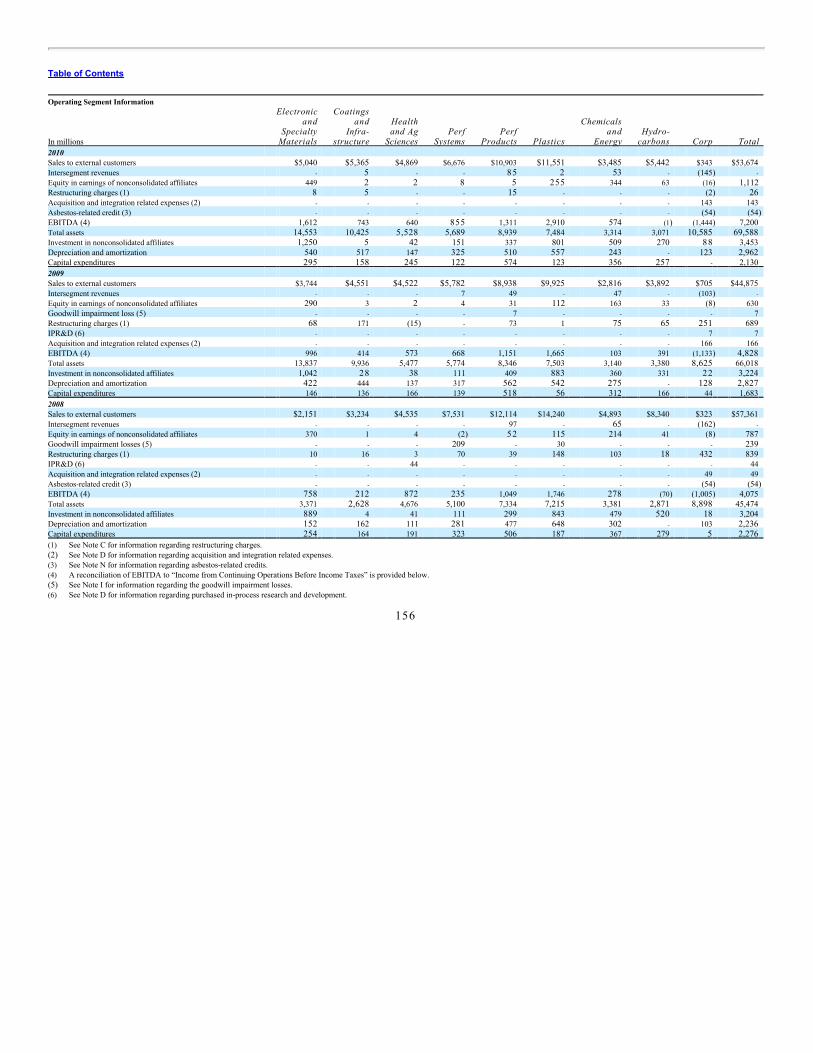
Table of Contents
Operating Segment Information
In millions
Electronicand
SpecialtyMaterials
Coatingsand
Infra-structure
Healthand Ag
Sciences Perf
Systems Perf
Products Plastics
Chemicalsand
Energy Hydro-
carbons Corp Total 2010 Sales to external customers $5,040 $5,365 $4,869 $6,676 $10,903 $11,551 $3,485 $5,442 $343 $53,674 Intersegment revenues - 5 - - 85 2 53 - (145) - Equity in earnings of nonconsolidated affiliates 449 2 2 8 5 255 344 63 (16) 1,112 Restructuring charges (1) 8 5 - - 15 - - - (2) 26 Acquisition and integration related expenses (2) - - - - - - - - 143 143 Asbestos-related credit (3) - - - - - - - - (54) (54) EBITDA (4) 1,612 743 640 855 1,311 2,910 574 (1) (1,444) 7,200 Total assets 14,553 10,425 5,528 5,689 8,939 7,484 3,314 3,071 10,585 69,588 Investment in nonconsolidated affiliates 1,250 5 42 151 337 801 509 270 88 3,453 Depreciation and amortization 540 517 147 325 510 557 243 - 123 2,962 Capital expenditures 295 158 245 122 574 123 356 257 - 2,130 2009 Sales to external customers $3,744 $4,551 $4,522 $5,782 $8,938 $9,925 $2,816 $3,892 $705 $44,875 Intersegment revenues - - - 7 49 - 47 - (103) - Equity in earnings of nonconsolidated affiliates 290 3 2 4 31 112 163 33 (8) 630 Goodwill impairment loss (5) - - - - 7 - - - - 7 Restructuring charges (1) 68 171 (15) - 73 1 75 65 251 689 IPR&D (6) - - - - - - - - 7 7 Acquisition and integration related expenses (2) - - - - - - - - 166 166 EBITDA (4) 996 414 573 668 1,151 1,665 103 391 (1,133) 4,828 Total assets 13,837 9,936 5,477 5,774 8,346 7,503 3,140 3,380 8,625 66,018 Investment in nonconsolidated affiliates 1,042 28 38 111 409 883 360 331 22 3,224 Depreciation and amortization 422 444 137 317 562 542 275 - 128 2,827 Capital expenditures 146 136 166 139 518 56 312 166 44 1,683 2008 Sales to external customers $2,151 $3,234 $4,535 $7,531 $12,114 $14,240 $4,893 $8,340 $323 $57,361 Intersegment revenues - - - - 97 - 65 - (162) - Equity in earnings of nonconsolidated affiliates 370 1 4 (2) 52 115 214 41 (8) 787 Goodwill impairment losses (5) - - - 209 - 30 - - - 239 Restructuring charges (1) 10 16 3 70 39 148 103 18 432 839 IPR&D (6) - - 44 - - - - - - 44 Acquisition and integration related expenses (2) - - - - - - - - 49 49 Asbestos-related credit (3) - - - - - - - - (54) (54) EBITDA (4) 758 212 872 235 1,049 1,746 278 (70) (1,005) 4,075 Total assets 3,371 2,628 4,676 5,100 7,334 7,215 3,381 2,871 8,898 45,474 Investment in nonconsolidated affiliates 889 4 41 111 299 843 479 520 18 3,204 Depreciation and amortization 152 162 111 281 477 648 302 - 103 2,236 Capital expenditures 254 164 191 323 506 187 367 279 5 2,276 (1) See Note C for information regarding restructuring charges.(2) See Note D for information regarding acquisition and integration related expenses.(3) See Note N for information regarding asbestos-related credits.(4) A reconciliation of EBITDA to “Income from Continuing Operations Before Income Taxes” is provided below.(5) See Note I for information regarding the goodwill impairment losses.(6) See Note D for information regarding purchased in-process research and development.
156

Table of Contents
Reconciliation of EBITDA to “Income from Continuing Operations Before Income Taxes” In millions 2010 2009 2008 EBITDA $7,200 $4,828 $4,075 - Depreciation and amortization 2,962 2,827 2,236 + Interest income 37 39 86 - Interest expense and amortization of debt discount 1,473 1,571 648 Income from Continuing Operations Before Income Taxes $2,802 $469 $1,277
The Company operates 188 manufacturing sites in 35 countries. The United States is home to 55 of these sites, representing 48 percent of theCompany’s long-lived assets. Sales are attributed to geographic areas based on customer location; long-lived assets are attributed to geographic areas based onasset location. Geographic Area Information
In millions United States
Europe,Middle East
and Africa (1) Rest of World Total 2010 Sales to external customers $17,497 $18,464 $17,713 $53,674 Long-lived assets (2) $8,393 $4,501 $4,774 $17,668 2009 Sales to external customers $14,145 $16,010 $14,720 $44,875 Long-lived assets (2) $9,212 $4,021 $4,908 $18,141 2008 Sales to external customers $18,306 $22,910 $16,145 $57,361 Long-lived assets (2) $7,631 $3,302 $3,361 $14,294 (1) Sales to customers in the Middle East and Africa, previously reported in Rest of World, are now aligned with Europe,
Middle East and Africa; prior period sales have been adjusted to reflect this realignment.(2) Long-lived assets in Germany represented 9 percent of the total at December 31, 2010, 11 percent of the total at
December 31, 2009 and 14 percent of the total at December 31, 2008.
157
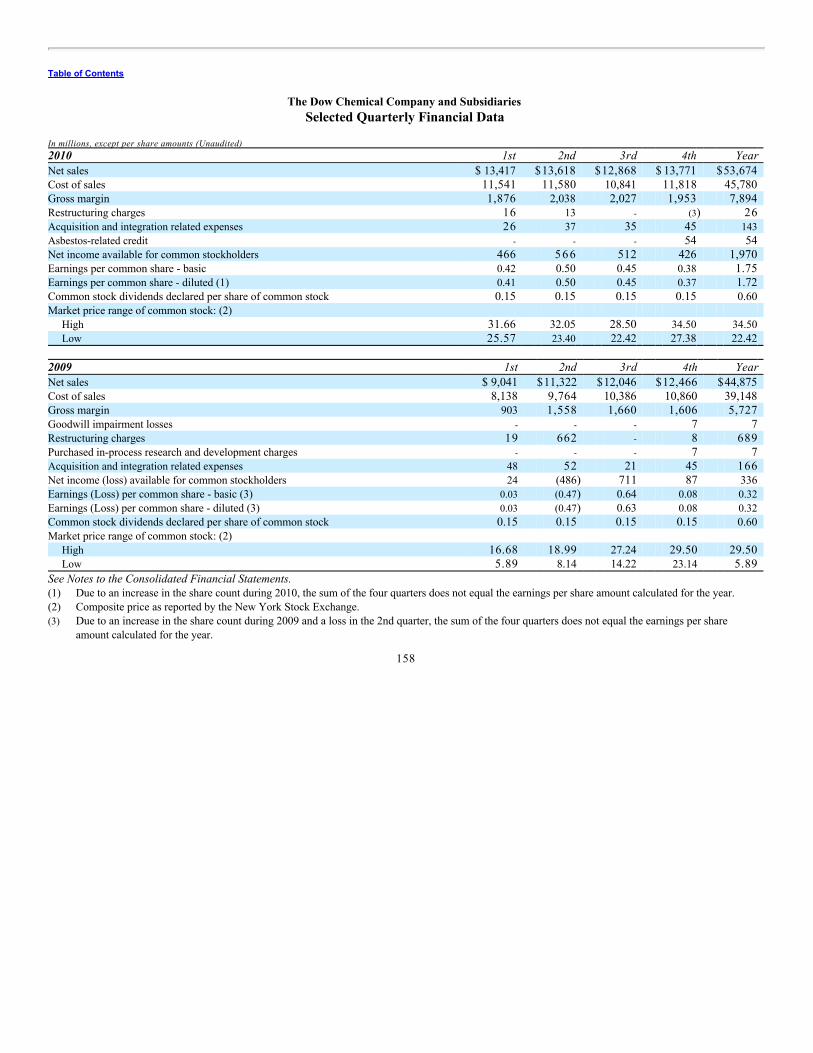
Table of Contents
The Dow Chemical Company and SubsidiariesSelected Quarterly Financial Data
In millions, except per share amounts (Unaudited) 2010 1st 2nd 3rd 4th Year Net sales $ 13,417 $13,618 $12,868 $ 13,771 $53,674 Cost of sales 11,541 11,580 10,841 11,818 45,780 Gross margin 1,876 2,038 2,027 1,953 7,894 Restructuring charges 16 13 - (3) 26 Acquisition and integration related expenses 26 37 35 45 143 Asbestos-related credit - - - 54 54 Net income available for common stockholders 466 5 6 6 512 426 1,970 Earnings per common share - basic 0.42 0.50 0.45 0.38 1.75 Earnings per common share - diluted (1) 0.41 0.50 0.45 0.37 1.72 Common stock dividends declared per share of common stock 0.15 0.15 0.15 0.15 0.60 Market price range of common stock: (2)
High 31.66 32.05 28.50 34.50 34.50 Low 25.57 23.40 22.42 27.38 22.42
2009 1st 2nd 3rd 4th Year Net sales $ 9,041 $11,322 $12,046 $12,466 $44,875 Cost of sales 8,138 9,764 10,386 10,860 39,148 Gross margin 903 1,558 1,660 1,606 5,727 Goodwill impairment losses - - - 7 7 Restructuring charges 19 662 - 8 689 Purchased in-process research and development charges - - - 7 7 Acquisition and integration related expenses 48 52 21 45 166 Net income (loss) available for common stockholders 24 (486) 711 87 336 Earnings (Loss) per common share - basic (3) 0.03 (0.47) 0.64 0.08 0.32 Earnings (Loss) per common share - diluted (3) 0.03 (0.47) 0.63 0.08 0.32 Common stock dividends declared per share of common stock 0.15 0.15 0.15 0.15 0.60 Market price range of common stock: (2)
High 16.68 18.99 27.24 29.50 29.50 Low 5.89 8.14 14.22 23.14 5.89
See Notes to the Consolidated Financial Statements.(1) Due to an increase in the share count during 2010, the sum of the four quarters does not equal the earnings per share amount calculated for the year.(2) Composite price as reported by the New York Stock Exchange.(3) Due to an increase in the share count during 2009 and a loss in the 2nd quarter, the sum of the four quarters does not equal the earnings per share
amount calculated for the year.
158

Table of Contents
The Dow Chemical Company and SubsidiariesPART II
ITEM 9. CHANGES IN AND DISAGREEMENTS WITH ACCOUNTANTS ON ACCOUNTING AND FINANCIAL DISCLOSURE.
Not applicable.
159
Table of Contents
The Dow Chemical Company and SubsidiariesPART II
ITEM 9A. CONTROLS AND PROCEDURES.
Evaluation of Disclosure Controls and ProceduresAs of the end of the period covered by this Annual Report on Form 10-K, the Company carried out an evaluation, under the supervision and with theparticipation of the Company’s Disclosure Committee and the Company’s management, including the Chief Executive Officer and the Chief Financial Officer,of the effectiveness of the design and operation of the Company’s disclosure controls and procedures pursuant to paragraph (b) of Exchange Act Rules 13a-15and 15d-15. Based upon that evaluation, the Chief Executive Officer and the Chief Financial Officer concluded that the Company’s disclosure controls andprocedures were effective.
Changes in Internal Control Over Financial ReportingThere were no changes in the Company’s internal control over financial reporting identified in connection with the evaluation required by paragraph (d) ofExchange Act Rules 13a-15 or 15d-15 that was conducted during the last fiscal quarter that have materially affected, or are reasonably likely to materiallyaffect, the Company’s internal control over financial reporting.
Management’s Report on Internal Control Over Financial ReportingManagement is responsible for establishing and maintaining adequate internal control over financial reporting. The Company’s internal control framework andprocesses are designed to provide reasonable assurance to management and the Board of Directors regarding the reliability of financial reporting and thepreparation of the Company’s consolidated financial statements in accordance with accounting principles generally accepted in the United States of America.
The Company’s internal control over financial reporting includes those policies and procedures that:
• pertain to the maintenance of records that, in reasonable detail, accurately and fairly reflect the transactions and dispositions of the assets of the
Company;
• provide reasonable assurance that transactions are recorded properly to allow for the preparation of financial statements in accordance with
generally accepted accounting principles, and that receipts and expenditures of the Company are being made only in accordance withauthorizations of management and Directors of the Company;
• provide reasonable assurance regarding prevention or timely detection of unauthorized acquisition, use, or disposition of the Company’s assets
that could have a material effect on the consolidated financial statements; and • provide reasonable assurance as to the detection of fraud.
Because of its inherent limitations, any system of internal control over financial reporting can provide only reasonable assurance and may not prevent ordetect misstatements.
Management assessed the effectiveness of the Company’s internal control over financial reporting and concluded that, as of December 31, 2010, suchinternal control is effective. In making this assessment, management used the criteria set forth by the Committee of Sponsoring Organizations of the TreadwayCommission (“COSO”) in Internal Control—Integrated Framework.
The Company’s independent auditors, Deloitte & Touche LLP, with direct access to the Company’s Board of Directors through its Audit Committee,have audited the consolidated financial statements prepared by the Company. Their report on the consolidated financial statements is included in Part II,Item 8. Financial Statements and Supplementary Data. Deloitte & Touche LLP’s report on the Company’s internal control over financial reporting is includedherein.
/s/ ANDREW N. LIVERIS /s/ WILLIAM H. WEIDEMANAndrew N. Liveris William H. WeidemanPresident, Chief Executive Officer and Executive Vice President and Chief Financial OfficerChairman of the Board
/s/ RONALD C. EDMONDS Ronald C. Edmonds Vice President and Controller February 18, 2011
160

Table of Contents
The Dow Chemical Company and SubsidiariesPART II
Report of Independent Registered Public Accounting FirmTo the Board of Directors and Stockholders ofThe Dow Chemical Company:
We have audited the internal control over financial reporting of The Dow Chemical Company and subsidiaries (the “Company”) as of December 31, 2010,based on criteria established in Internal Control — Integrated Framework issued by the Committee of Sponsoring Organizations of the TreadwayCommission. The Company’s management is responsible for maintaining effective internal control over financial reporting and for its assessment of theeffectiveness of internal control over financial reporting, included in the accompanying Management’s Report on Internal Control Over FinancialReporting. Our responsibility is to express an opinion on the Company’s internal control over financial reporting based on our audit.
We conducted our audit in accordance with the standards of the Public Company Accounting Oversight Board (United States). Those standards require thatwe plan and perform the audit to obtain reasonable assurance about whether effective internal control over financial reporting was maintained in all materialrespects. Our audit included obtaining an understanding of internal control over financial reporting, assessing the risk that a material weakness exists, testingand evaluating the design and operating effectiveness of internal control based on the assessed risk, and performing such other procedures as we considerednecessary in the circumstances. We believe that our audit provides a reasonable basis for our opinion.
A company’s internal control over financial reporting is a process designed by, or under the supervision of, the company’s principal executive and principalfinancial officers, or persons performing similar functions, and effected by the company’s board of directors, management, and other personnel to providereasonable assurance regarding the reliability of financial reporting and the preparation of financial statements for external purposes in accordance withgenerally accepted accounting principles. A company’s internal control over financial reporting includes those policies and procedures that (1) pertain to themaintenance of records that, in reasonable detail, accurately and fairly reflect the transactions and dispositions of the assets of the company; (2) providereasonable assurance that transactions are recorded as necessary to permit preparation of financial statements in accordance with generally accepted accountingprinciples, and that receipts and expenditures of the company are being made only in accordance with authorizations of management and directors of thecompany; and (3) provide reasonable assurance regarding prevention or timely detection of unauthorized acquisition, use, or disposition of the company’sassets that could have a material effect on the financial statements.
Because of the inherent limitations of internal control over financial reporting, including the possibility of collusion or improper management override ofcontrols, material misstatements due to error or fraud may not be prevented or detected on a timely basis. Also, projections of any evaluation of theeffectiveness of the internal control over financial reporting to future periods are subject to the risk that the controls may become inadequate because of changesin conditions, or that the degree of compliance with the policies or procedures may deteriorate.
In our opinion, the Company maintained, in all material respects, effective internal control over financial reporting as of December 31, 2010, based on thecriteria established in Internal Control — Integrated Framework issued by the Committee of Sponsoring Organizations of the Treadway Commission.
We have also audited, in accordance with the standards of the Public Company Accounting Oversight Board (United States), the consolidated financialstatements and financial statement schedule listed in the Index at Item 15 (a) 2 as of and for the year ended December 31, 2010 of the Company and our reportdated February 18, 2011 expressed an unqualified opinion on those financial statements and financial statement schedule.
/S/ DELOITTE & TOUCHE LLPDeloitte & Touche LLPMidland, MichiganFebruary 18, 2011
161

Table of Contents
The Dow Chemical Company and SubsidiariesPART II
ITEM 9B. OTHER INFORMATION.
None.
162

Table of Contents
The Dow Chemical Company and SubsidiariesPART III
ITEM 10. DIRECTORS, EXECUTIVE OFFICERS AND CORPORATE GOVERNANCE.
Information relating to Directors, certain executive officers and certain corporate governance matters (including identification of Audit Committee members andfinancial expert(s)) is contained in the definitive Proxy Statement for the Annual Meeting of Stockholders of The Dow Chemical Company to be held onMay 12, 2011, and is incorporated herein by reference. See also the information regarding executive officers of the registrant set forth in Part I, Item 1.Business under the caption “Executive Officers of the Registrant” in reliance on General Instruction G to Form 10-K.
On July 10, 2003, the Board of Directors of the Company adopted a code of ethics that applies to its principal executive officer, principal financialofficer and principal accounting officer, and is incorporated herein by reference to Exhibit 14 to the Company’s Annual Report on Form 10-K for the yearended December 31, 2003.
ITEM 11. EXECUTIVE COMPENSATION.
Information relating to executive compensation and the Company’s equity compensation plans is contained in the definitive Proxy Statement for the AnnualMeeting of Stockholders of The Dow Chemical Company to be held on May 12, 2011, and is incorporated herein by reference.
ITEM 12. SECURITY OWNERSHIP OF CERTAIN BENEFICIAL OWNERS AND MANAGEMENT AND RELATED STOCKHOLDERMATTERS.
Information with respect to beneficial ownership of Dow common stock by each Director and all Directors and executive officers of the Company as a group iscontained in the definitive Proxy Statement for the Annual Meeting of Stockholders of The Dow Chemical Company to be on held May 12, 2011, and isincorporated herein by reference.
Information relating to any person who beneficially owns in excess of 5 percent of the total outstanding shares of Dow common stock is contained in thedefinitive Proxy Statement for the Annual Meeting of Stockholders of The Dow Chemical Company to be on held May 12, 2011, and is incorporated hereinby reference.
Information with respect to compensation plans under which equity securities are authorized for issuance is contained in the definitive Proxy Statementfor the Annual Meeting of Stockholders of The Dow Chemical Company to be held on May 12, 2011, and is incorporated herein by reference.
ITEM 13. CERTAIN RELATIONSHIPS AND RELATED TRANSACTIONS, AND DIRECTOR INDEPENDENCE.
Reportable relationships and related transactions, if any, as well as information relating to director independence are contained in the definitive Proxy Statementfor the Annual Meeting of Stockholders of The Dow Chemical Company to be held on May 12, 2011, and are incorporated herein by reference.
ITEM 14. PRINCIPAL ACCOUNTING FEES AND SERVICES.
Information with respect to fees and services related to the Company’s independent auditors, Deloitte & Touche LLP, and the disclosure of the AuditCommittee’s pre-approval policies and procedures are contained in the definitive Proxy Statement for the Annual Meeting of Stockholders of The DowChemical Company to be held on May 12, 2011, and are incorporated herein by reference.
163

Table of Contents
The Dow Chemical Company and SubsidiariesPART IV
ITEM 15. EXHIBITS, FINANCIAL STATEMENT SCHEDULES. (a) The following documents are filed as part of this report:
(1) The Company’s 2010 Consolidated Financial Statements and the Report of Independent Registered Public Accounting Firm are included in
Part II, Item 8. Financial Statements and Supplementary Data.
(2) Financial Statement Schedules – The following Financial Statement Schedule should be read in conjunction with the Consolidated
Financial Statements and Report of Independent Registered Public Accounting Firm included in Part II, Item 8. Financial Statements andSupplementary Data:
Schedule II Valuation and Qualifying Accounts
Schedules other than the one listed above are omitted due to the absence of conditions under which they are required or because theinformation called for is included in the Consolidated Financial Statements or the Notes to the Consolidated Financial Statements.
(3) Exhibits – See the Exhibit Index on pages 167-173 for exhibits filed with this Annual Report on Form 10-K or incorporated by reference.
The following exhibits, listed on the Exhibit Index, are filed with this Annual Report on Form 10-K:
Exhibit No. Description of Exhibit12.1 Computation of Ratio of Earnings to Fixed Charges.21 Subsidiaries of The Dow Chemical Company.23(a) Consent of Independent Registered Public Accounting Firm.23(b) Analysis, Research & Planning Corporation’s Consent.23(c) Consent of Independent Registered Public Accounting Firm.31(a) Certification Pursuant to Section 302 of the Sarbanes-Oxley Act of 2002.31(b) Certification Pursuant to Section 302 of the Sarbanes-Oxley Act of 2002.32(a) Certification Pursuant to Section 906 of the Sarbanes-Oxley Act of 2002.32(b) Certification Pursuant to Section 906 of the Sarbanes-Oxley Act of 2002.101.INS XBRL Instance Document (1)101.SCH XBRL Taxonomy Extension Schema Document (1)101.CAL XBRL Taxonomy Extension Calculation Linkbase Document (1)101.DEF XBRL Taxonomy Extension Definition Linkbase Document (1)101.LAB XBRL Taxonomy Extension Label Linkbase Document (1)101.PRE XBRL Taxonomy Extension Presentation Linkbase Document (1)
(1) Pursuant to Rule 406T of Regulation S-T, this interactive data file is deemed not filed or part of a registration statement or
prospectus for purposes of sections 11 or 12 of the Securities Act of 1933, is deemed not filed for purposes of section 18 ofthe Securities Exchange Act of 1934, and otherwise is not subject to liability under these sections.
A copy of any exhibit can be obtained via the Internet through the Company’s Investor Relations webpage on www.dow.com, or theCompany will provide a copy of any exhibit upon receipt of a written request for the particular exhibit or exhibits desired. All requestsshould be addressed to the Vice President and Controller of the Company at the address of the Company’s principal executive offices.
(c) The consolidated financial statements of Dow Corning Corporation and Subsidiaries for the period ended December 31, 2010 are presented
pursuant to Rule 3-09 of Regulation S-X.
164

Table of Contents
Schedule IIThe Dow Chemical Company and Subsidiaries
Valuation and Qualifying AccountsFor the Years Ended December 31
In millions
COLUMN A COLUMN B COLUMN C COLUMN D COLUMN E
Description
Balanceat Beginning
of Year
Additions toReserves
Deductionsfrom
Reserves
Balanceat Endof Year
2010 RESERVES DEDUCTED FROM ASSETS TO WHICH THEY APPLY:
For doubtful receivables $160 29 61 (1) $128 Other investments and noncurrent receivables $552 73 107 $518
2009 RESERVES DEDUCTED FROM ASSETS TO WHICH THEY APPLY:
For doubtful receivables $124 5 9 23 (1) $160 Other investments and noncurrent receivables $442 162 52 $552
2008 RESERVES DEDUCTED FROM ASSETS TO WHICH THEY APPLY:
For doubtful receivables $118 39 33 (1) $124 Other investments and noncurrent receivables $473 20 51 $442
2010 2009 2008 (1) Deductions represent:
Notes and accounts receivable written off $ 29 $ 21 $ 23 Credits to profit and loss 1 1 6 Sale of trade accounts receivable (see Note O to the Consolidated Financial
Statements) 27 — — Miscellaneous other 4 1 4
$ 61 $ 23 $ 33
165

Table of Contents
The Dow Chemical Company and SubsidiariesSignatures
Pursuant to the requirements of Section 13 or 15(d) of the Securities Exchange Act of 1934, the registrant has duly caused this report to be signed on its behalfby the undersigned, thereunto duly authorized.
THE DOW CHEMICAL COMPAY
By /S/ R. C. EDMONDS R. C. Edmonds, Vice President and Controller
Date February 10, 2011
Pursuant to the requirements of the Securities Exchange Act of 1934, this report has been signed below by the following persons on behalf of the registrant andin the capacities and on the dates indicated.
By /S/ A. A. ALLEMANG By /S/ A. N. LIVERIS
Date
A. A. Allemang, DirectorFebruary 10, 2011
A. N. Liveris, Director, President, Chief Executive Officer andChairman of the Board
Date February 10, 2011
By /S/ J. K. BARTON By /S/ P. POLMAN J. K. Barton, Director P. Polman, Director
Date February 10, 2011 Date February 10, 2011
By /S/ J. A. BELL By /S/ D. H. REILLEY J. A. Bell, Director D. H. Reilley, Director
Date February 10, 2011 Date February 10, 2011
By /S/ R. C. EDMONDS By /S/ J. M. RINGLER R. C. Edmonds, Vice President and Controller J. M. Ringler, Director
Date February 10, 2011 Date February 10, 2011
By /S/ J. M. FETTIG By /S/ R. G. SHAW J. M. Fettig, Director R. G. Shaw, Director
Date February 10, 2011 Date February 10, 2011
By /S/ B. H. FRANKLIN By /S/ P. G. STERN B. H. Franklin, Director P. G. Stern, Presiding Director
Date February 10, 2011 Date February 10, 2011
By /S/ J. B. HESS By /S/ W. H. WEIDEMAN
Date
J. B. Hess, DirectorFebruary 10, 2011
W. H. Weideman, Executive Vice President and Chief FinancialOfficer
Date February 10, 2011
166

Table of Contents
The Dow Chemical Company and SubsidiariesExhibit Index
EXHIBIT NO. DESCRIPTION
2(a)
Agreement and Plan of Merger dated as of August 3, 1999 among Union Carbide Corporation, The Dow Chemical Company andTransition Sub Inc., incorporated by reference to Annex A to the proxy statement/prospectus included in The Dow Chemical Company’sRegistration Statement on Form S-4, File No. 333-88443, filed October 5, 1999.
2(b)
Agreement and Plan of Merger, dated as of July 10, 2008, among The Dow Chemical Company, Ramses Acquisition Corp. and Rohmand Haas Company, incorporated by reference to Exhibit 2.1 to The Dow Chemical Company Current Report on Form 8-K filed onJuly 10, 2008.
2(c)
Joint Venture Formation Agreement, dated November 28, 2008, between The Dow Chemical Company and Petroleum IndustriesCompany (K.S.C.), incorporated by reference to Exhibit 2.1 to The Dow Chemical Company Current Report on Form 8-K filed onFebruary 19, 2009.
2(d)
Stock Purchase Agreement, dated as of April 1, 2009, between Rohm and Haas Company and K+S Aktiengesellschaft, incorporated byreference to Exhibit 2.1 to The Dow Chemical Company Current Report on Form 8-K filed on April 7, 2009.
2(d)(i)
Amendment No. 1, dated as of October 1, 2009, to the Stock Purchase Agreement, dated as of April 1, 2009, between Rohm and HaasCompany and K+S Aktiengesellschaft, incorporated by reference to Exhibit 2(d)(i) to The Dow Chemical Company Quarterly Report forthe quarter ended September 30, 2009.
3(i)
The Restated Certificate of Incorporation of The Dow Chemical Company as filed with the Secretary of State, State of Delaware on May17, 2010, incorporated by reference to Exhibit 3(i) to The Dow Chemical Company Quarterly Report on Form 10-Q for the quarter endedSeptember 30, 2010.
3(i)(a)
Certificate of Designations for the Cumulative Convertible Perpetual Preferred Stock, Series A, as originally filed with the Secretary ofState, State of Delaware on March 31, 2009, incorporated by reference to Exhibit 3.1 to The Dow Chemical Company Current Report onForm 8-K filed on April 1, 2009; and as re-filed with the Secretary of State, State of Delaware on May 17, 2010.
3(ii)
The Bylaws of The Dow Chemical Company, as amended and re-adopted in full on February 10, 2010, effective February 10, 2010,incorporated by reference to Exhibit 99.1 to The Dow Chemical Company Current Report on Form 8-K filed on February 12, 2010.
4
Indenture, dated as of April 1, 1992, between The Dow Chemical Company and the First National Bank of Chicago, as trustee(incorporated by reference to Exhibit 4.1 to The Dow Chemical Company’s Registration Statement on Form S-3, File No. 333-88617 (the“S-3 Registration Statement”)), as amended by the Supplemental Indenture, dated as of January 1, 1994, between The Dow ChemicalCompany and The First National Bank of Chicago, as trustee (incorporated by reference to Exhibit 4.2 to the S-3 Registration Statement),as amended by the Second Supplemental Indenture, dated as of October 1, 1999, between The Dow Chemical Company and Bank OneTrust Company, N.A. (formerly The First National Bank of Chicago), as trustee (incorporated by reference to Exhibit 4.3 to the S-3Registration Statement), as amended by the Third Supplemental Indenture, dated as of May 15, 2001, between The Dow ChemicalCompany and Bank One Trust Company, N.A. (formerly The First National Bank of Chicago), as trustee (incorporated by reference toExhibit 4.4 to The Dow Chemical Company’s Registration Statement on Form S-4, File No. 333-67368); and all other such indenturesthat define the rights of holders of long-term debt of The Dow Chemical Company and its consolidated subsidiaries as shall be requestedto be furnished to the Securities and Exchange Commission pursuant to Item 601(b)(4)(iii)(A) of Regulation S-K.
4(a)
Indenture, dated May 1, 2008, between The Dow Chemical Company and The Bank of New York Trust Company, N.A., as trustee,incorporated by reference to Exhibit 4.1 to Post-Effective Amendment No. 1 to The Dow Chemical Company’s Registration Statement onForm S-3, File No. 333-140859.
167
Table of Contents
10(a)
The Dow Chemical Company Executives’ Supplemental Retirement Plan, as amended, restated and effective as of April 14, 2010,incorporated by reference to Exhibit 10.1 to The Dow Chemical Company Current Report on Form 8-K filed on May 3, 2010.
10(a)(i)
An Amendment to The Dow Chemical Company Executives’ Supplemental Retirement Plan, effective as of April 14, 2010, incorporated byreference to Exhibit 10.4 to The Dow Chemical Company Current Report on Form 8-K filed on May 3, 2010.
10(b)
The Dow Chemical Company 1979 Award and Option Plan, as amended and restated on May 13, 1983, incorporated by reference toExhibit 10(b) to The Dow Chemical Company Quarterly Report on Form 10-Q for the quarter ended March 31, 2009.
10(b)(i)
A resolution adopted by the Board of Directors of The Dow Chemical Company on April 12, 1984 amending The Dow ChemicalCompany 1979 Award and Option Plan, incorporated by reference to Exhibit 10(b)(i) to The Dow Chemical Company Quarterly Report onForm 10-Q for the quarter ended March 31, 2009.
10(b)(ii)
A resolution adopted by the Board of Directors of The Dow Chemical Company on April 18, 1985 amending The Dow ChemicalCompany 1979 Award and Option Plan, incorporated by reference to Exhibit 10(b)(ii) to The Dow Chemical Company Quarterly Reporton Form 10-Q for the quarter ended March 31, 2009.
10(b)(iii)
A resolution adopted by the Executive Committee of the Board of Directors of The Dow Chemical Company on October 30, 1987amending The Dow Chemical Company 1979 Award and Option Plan, incorporated by reference to Exhibit 10(b)(iii) to The DowChemical Company Quarterly Report on Form 10-Q for the quarter ended March 31, 2009.
10(c)
The Dow Chemical Company Voluntary Deferred Compensation Plan for Outside Directors (for deferrals made through December 31,2004), as amended effective as of July 1, 1994, incorporated by reference to Exhibit 10(f) to The Dow Chemical Company Annual Reporton Form 10-K for the year ended December 31, 1994, as amended in the manner described in the definitive Proxy Statement for the AnnualMeeting of Stockholders of The Dow Chemical Company held on May 14, 1998, incorporated by reference.
10(d)
Rohm and Haas Company Non-Qualified Retirement Plan, as amended and restated effective as of January 1, 2009, incorporated byreference to Exhibit 10.1 to The Dow Chemical Company Current Report on Form 8-K filed on February 17, 2011.
10(e)
The Dow Chemical Company Dividend Unit Plan, incorporated by reference to Exhibit 10(e) to The Dow Chemical Company QuarterlyReport on Form 10-Q for the quarter ended March 31, 2009.
10(f)
The Dow Chemical Company 1988 Award and Option Plan, as amended and restated on December 10, 2008, effective as of January 1,2009, incorporated by reference to Exhibit 10(f) to The Dow Chemical Company Annual Report on Form 10-K for the year endedDecember 31, 2008.
10(g) Intentionally left blank.
10(h)
The Dow Chemical Company 1994 Executive Performance Plan, as amended and restated on December 10, 2008, effective as ofJanuary 1, 2009, incorporated by reference to Exhibit 10(h) to The Dow Chemical Company Annual Report on Form 10-K for the yearended December 31, 2008.
10(i)
The Dow Chemical Company 1994 Non-Employee Directors’ Stock Plan, incorporated by reference to Exhibit 10(i) to The Dow ChemicalCompany Quarterly Report on Form 10-Q for the quarter ended March 31, 2009.
10(j) Intentionally left blank.
168

Table of Contents
10(k)
A written description of the 1998 Non-Employee Directors’ Stock Incentive Plan, incorporated by reference to the definitive Proxy Statementfor the Annual Meeting of Stockholders of The Dow Chemical Company held on May 14, 1998.
10(l)
A written description of compensation for Directors of The Dow Chemical Company, incorporated by reference to the definitive ProxyStatement for the Annual Meeting of Stockholders of The Dow Chemical Company to be held on May 12, 2011.
10(m)
A written description of the manner in which compensation is set for the Executive Officers of The Dow Chemical Company, incorporatedby reference to the definitive Proxy Statement for the Annual Meeting of Stockholders of The Dow Chemical Company to be held on May 12,2011.
10(n)
A resolution adopted by the Board of Directors of The Dow Chemical Company on May 5, 1971, and most recently amended on July 9,1998, describing the employee compensation program for decelerating Directors, incorporated by reference to Exhibit 10(p) to The DowChemical Company Annual Report on Form 10-K for the year ended December 31, 1998; as amended, re-adopted in full and restated onMarch 21, 2003, incorporated by reference to Exhibit 10(n) to The Dow Chemical Company Quarterly Report on Form 10-Q for the quarterended March 31, 2003; as amended, re-adopted in full and restated on February 10, 2005, incorporated by reference to Exhibit 10(n) to TheDow Chemical Company Quarterly Report on Form 10-Q for the quarter ended March 31, 2005.
10(o)
The template used for The Dow Chemical Company Key Employee Insurance Program (“KEIP”), which provides benefits using insurancepolicies that replace benefits otherwise payable under The Dow Chemical Company Executives’ Supplemental Retirement Plan andCompany-Paid Life Insurance Plan, incorporated by reference to Exhibit 10(o) to The Dow Chemical Company Annual Report on Form 10-Kfor the year ended December 31, 2002. KEIP is a component of the annual pension benefits listed in and incorporated by reference to thedefinitive Proxy Statement for the Annual Meeting of Stockholders of The Dow Chemical Company to be held on May 12, 2011.
10(p)
The Dow Chemical Company Elective Deferral Plan (for deferrals made through December 31, 2004), as amended, restated and effective asof April 14, 2010, incorporated by reference to Exhibit 10.2 to The Dow Chemical Company Current Report on Form 8-K filed on May 3,2010.
10(p)(i)
An Amendment to The Dow Chemical Company Elective Deferral Plan (for deferrals made through December 31, 2004), effective as ofApril 14, 2010, incorporated by reference to Exhibit 10.5 to The Dow Chemical Company Current Report on Form 8-K filed on May 3,2010.
10(q)
The Rohm and Haas Company Non-Qualified Savings Plan (for deferrals made through December 31, 2004), amended and restated effectiveas of January 1, 2010, incorporated by reference to Exhibit 10.2 to The Dow Chemical Company Current Report on Form 8-K filed onFebruary 18, 2010.
10(r)
The Rohm and Haas Company Non-Qualified Savings Plan (for deferrals made after January 1, 2005), amended and restated effective as ofJanuary 1, 2010, incorporated by reference to Exhibit 10.3 to The Dow Chemical Company Current Report on Form 8-K filed onFebruary 18, 2010.
10(s)
The Summary Plan Description for The Dow Chemical Company Company-Paid Life Insurance Plan, Employee-Paid Life Insurance Plan,and Dependent Life Insurance Plan, amended and restated on December 23, 2010, effective as of January 1, 2011, incorporated by referenceto Exhibit 10.2 to The Dow Chemical Company Current Report on Form 8-K filed on February 17, 2011.
10(t)
The Summary Plan Description for The Dow Chemical Company Retiree Company-Paid Life Insurance Plan, Retiree Optional LifeInsurance Plan, and Retiree Dependent Life Insurance Plan, amended and restated on December 23, 2010, effective as of January 1, 2011,incorporated by reference to Exhibit 10.3 to The Dow Chemical Company Current Report on Form 8-K filed on February 17, 2011.
169
Table of Contents
10(u)
Amended and Restated 2003 Non-Employee Directors’ Stock Incentive Plan, adopted by the Board of Directors of The Dow ChemicalCompany on December 10, 2007, incorporated by reference to Exhibit 10(u) to The Dow Chemical Company Annual Report on Form 10-Kfor the year ended December 31, 2007.
10(v)
Non-Qualified Stock Option Agreement Pursuant to The Dow Chemical Company 1994 Non-Employee Directors’ Stock Plan,incorporated by reference to Exhibit 10.1 to The Dow Chemical Company Current Report on Form 8-K filed on September 3, 2004.
10(w)
Non-Qualified Stock Option Agreement Pursuant to The Dow Chemical Company 2003 Non-Employee Directors’ Stock Incentive Plan,incorporated by reference to Exhibit 10(w) to The Dow Chemical Company Quarterly Report on Form 10-Q for the quarter endedSeptember 30, 2004.
10(x)
The Performance Shares Deferred Stock Agreement Pursuant to The Dow Chemical Company 1988 Award and Option Plan, as amended,restated and effective as of January 1, 2009, incorporated by reference to Exhibit 10(x) to The Dow Chemical Company Annual Report onForm 10-K for the year ended December 31, 2008.
10(y)
The Deferred Stock Agreement Pursuant to The Dow Chemical Company 1988 Award and Option Plan, as amended, restated and effectiveas of January 1, 2009, incorporated by reference to Exhibit 10(y) to The Dow Chemical Company Annual Report on Form 10-K for theyear ended December 31, 2008.
10(z)
The Non-Qualified Stock Option Agreement Pursuant to The Dow Chemical Company 1988 Award and Option Plan, as amended,restated and effective as of January 1, 2009, incorporated by reference to Exhibit 10(z) to The Dow Chemical Company Annual Report onForm 10-K for the year ended December 31, 2008.
10(aa)
Settlement Agreement and General Release between Richard L. Manetta and The Dow Chemical Company dated December 10, 2004,incorporated by reference to Exhibit 10.1 to The Dow Chemical Company Current Report on Form 8-K filed on December 16, 2004.
10(bb)
Deferred Compensation Agreement between Richard L. Manetta and The Dow Chemical Company dated December 10, 2004, incorporatedby reference to Exhibit 10.2 to The Dow Chemical Company Current Report on Form 8-K filed on December 16, 2004.
10(cc)
The Dow Chemical Company Voluntary Deferred Compensation Plan for Non-Employee Directors, effective for deferrals after January 1,2005, as amended and restated on December 10, 2008, effective as of January 1, 2009, incorporated by reference to Exhibit 10(cc) to TheDow Chemical Company Annual Report on Form 10-K for the year ended December 31, 2008.
10(dd)
The Dow Chemical Company Elective Deferral Plan, effective for deferrals after January 1, 2005, as amended, restated and effective as ofApril 14, 2010, incorporated by reference to Exhibit 10.3 to The Dow Chemical Company Current Report on Form 8-K filed on May 3,2010.
10(dd)(i)
An Amendment to The Dow Chemical Company Elective Deferral Plan, effective for deferrals after January 1, 2005, effective as ofApril 14, 2010, incorporated by reference to Exhibit 10.6 to The Dow Chemical Company Current Report on Form 8-K filed on May 3,2010.
10(ee)
The template for communication to employee Directors who are decelerating pursuant to The Dow Chemical Company Retirement Policy forEmployee Directors, incorporated by reference to Exhibit 10(ee) to The Dow Chemical Company Quarterly Report on Form 10-Q for thequarter ended June 30, 2005.
170
Table of Contents
10(ff)
Purchase and Sale Agreement dated as of September 30, 2005 between Catalysts, Adsorbents and Process Systems, Inc. and HoneywellSpecialty Materials LLC, incorporated by reference to Exhibit 10(ff) to The Dow Chemical Company Quarterly Report on Form 10-Q forthe quarter ended September 30, 2005.
10(gg)
Employment agreement with Geoffery Merszei, Executive Vice President and Chief Financial Officer, incorporated by reference to Exhibit10(gg) to The Dow Chemical Company Annual Report on Form 10-K for the year ended December 31, 2005.
10(hh)
Employment agreement dated June 18, 2005, between William F. Banholzer and The Dow Chemical Company, incorporated by referenceto the Current Report on Form 8-K filed on March 16, 2006.
10(ii)
Employment agreement dated February 14, 2006, between Heinz Haller and The Dow Chemical Company, incorporated by reference toExhibit 10(ii) to The Dow Chemical Company Annual Report on Form 10-K for the year ended December 31, 2008.
10(jj)
Change in Control Executive Severance Agreement - Tier 1, incorporated by reference to Exhibit 10(jj) to The Dow Chemical CompanyAnnual Report on Form 10-K for the year ended December 31, 2007.
10(kk)
Change in Control Executive Severance Agreement - Tier 2, incorporated by reference to Exhibit 10(kk) to The Dow Chemical CompanyAnnual Report on Form 10-K for the year ended December 31, 2007.
10(ll)
Voting Agreement dated as of July 10, 2008, by and among Rohm and Haas Company, The Dow Chemical Company and each of thepersons and entities listed on Schedule I thereto, incorporated by reference to Exhibit 10.1 to The Dow Chemical Company Current Reporton Form 8-K filed on July 10, 2008.
10(mm)
Term Loan Agreement, dated as of September 8, 2008, among The Dow Chemical Company, as borrower, the lenders party thereto andCitibank, N.A, as administrative agent for the lenders, incorporated by reference to Exhibit 99.1 to The Dow Chemical CompanyCurrent Report on Form 8-K filed on September 9, 2008.
10(mm)(i)
First Amendment to the Term Loan Agreement, dated as of March 4, 2009, among The Dow Chemical Company, the lenders party to theTerm Loan Agreement dated as of September 8, 2008, Citibank, N.A., as administrative agent, and Merrill Lynch, Pierce, Fenner &Smith Incorporated and Morgan Stanley Senior Funding, Inc., as co-syndication agents, incorporated by reference to Exhibit 10.1 to TheDow Chemical Company Current Report on Form 8-K filed on March 6, 2009.
10(nn)
Investment Agreement, dated as of October 27, 2008, between The Dow Chemical Company and Berkshire Hathaway Inc., incorporatedby reference to Exhibit 10.1 to The Dow Chemical Company Current Report on Form 8-K filed on October 27, 2008.
10(oo)
Investment Agreement, dated as of October 27, 2008, between The Dow Chemical Company and The Kuwait Investment Authority,incorporated by reference to Exhibit 10.2 to The Dow Chemical Company Current Report on Form 8-K filed on October 27, 2008.
10(pp)
Securities Issuance Letter, dated March 4, 2009, among The Dow Chemical Company, Citigroup Global Markets Inc., Merrill Lynch,Pierce, Fenner & Smith Incorporated and Morgan Stanley Senior Funding, Inc., incorporated by reference to Exhibit 10.2 to The DowChemical Company Current Report on Form 8-K filed on March 6, 2009.
10(qq)
Commitment to Close, dated March 9, 2009, among The Dow Chemical Company, Ramses Acquisition Corp. and Rohm and HaasCompany, incorporated by reference to Exhibit 10.1 to The Dow Chemical Company Current Report on Form 8-K filed on March 12,2009.
171

Table of Contents
10(rr)
Investment Agreement, dated March 9, 2009, among The Dow Chemical Company, Paulson & Co. Inc. and the Haas Family Trusts,incorporated by reference to Exhibit 10.2 to The Dow Chemical Company Current Report on Form 8-K filed on March 12, 2009.
10(ss)
Letter Agreement, dated March 9, 2009, among The Dow Chemical Company, Ramses Acquisition Corp. and the Haas Family Trusts,incorporated by reference to Exhibit 10.3 to The Dow Chemical Company Current Report on Form 8-K filed on March 12, 2009.
10(tt)
Letter Agreement, dated March 9, 2009, among The Dow Chemical Company, Ramses Acquisition Corp. and Paulson & Co. Inc.,incorporated by reference to Exhibit 10.4 to The Dow Chemical Company Current Report on Form 8-K filed on March 12, 2009.
10(uu)
Purchase Agreement, dated May 5, 2009, among The Dow Chemical Company, Paulson & Co. Inc. and the Haas Family Trusts,incorporated by reference to Exhibit 10.1 to The Dow Chemical Company Current Report on Form 8-K filed on May 11, 2009.
10(vv)
Stock Purchase Agreement, dated May 11, 2009, between The Dow Chemical Company and Fidelity Management Trust Services, as trusteeof a trust established under The Dow Chemical Company Employees’ Savings Plan, incorporated by reference to Exhibit 1.1 to The DowChemical Company Current Report on Form 8-K filed on May 14, 2009.
10(ww)
The Deferred Stock Units Agreement Pursuant to The Dow Chemical Company 1988 Award and Option Plan, as amended, restated andeffective as of January 1, 2010, incorporated by reference to Exhibit 10.7 to The Dow Chemical Company Current Report on Form 8-K filedon February 18, 2010.
10(xx)
The Special Deferred Stock Agreement Pursuant to The Dow Chemical Company 1988 Award and Option Plan, as amended, restated andeffective as of January 1, 2010, incorporated by reference to Exhibit 10.8 to The Dow Chemical Company Current Report on Form 8-K filedon February 18, 2010.
10(yy)
The Performance Shares Deferred Stock Units Agreement Pursuant to The Dow Chemical Company 1988 Award and Option Plan, asamended, restated and effective as of January 1, 2010, incorporated by reference to Exhibit 10.9 to The Dow Chemical Company CurrentReport on Form 8-K filed on February 18, 2010.
10(zz)
The Special Performance Shares Deferred Stock Agreement Pursuant to The Dow Chemical Company 1988 Award and Option Plan, asamended, restated and effective as of January 1, 2010, incorporated by reference to Exhibit 10.10 to The Dow Chemical Company CurrentReport on Form 8-K filed on February 18, 2010.
10(aaa)
The Stock Appreciation Rights Agreement Relating to a Stock Option Granted Under The Dow Chemical Company 1988 Award and OptionPlan, as amended, restated and effective as of January 1, 2010, incorporated by reference to Exhibit 10.11 to The Dow Chemical CompanyCurrent Report on Form 8-K filed on February 18, 2010.
12.1 Computation of Ratio of Earnings to Fixed Charges.
14
Code of Ethics for Principal Executive Officer, Principal Financial Officer and Principal Accounting Officer, incorporated by reference toExhibit 14 to The Dow Chemical Company Annual Report on Form 10-K for the year ended December 31, 2003.
21 Subsidiaries of The Dow Chemical Company.
23(a) Consent of Independent Registered Public Accounting Firm.
23(b) Analysis, Research & Planning Corporation’s Consent.
172

Table of Contents
23(c) Consent of Independent Registered Public Accounting Firm.
31(a) Certification Pursuant to Section 302 of the Sarbanes-Oxley Act of 2002.
31(b) Certification Pursuant to Section 302 of the Sarbanes-Oxley Act of 2002.
32(a) Certification Pursuant to Section 906 of the Sarbanes-Oxley Act of 2002.
32(b) Certification Pursuant to Section 906 of the Sarbanes-Oxley Act of 2002.
99.1
Replacement Capital Covenant, dated April 1, 2009, relating to the Cumulative Perpetual Preferred Stock, Series B, incorporated byreference to Exhibit 99.2 to The Dow Chemical Company Current Report on Form 8-K filed on April 1, 2009.
99.2
Replacement Capital Covenant, dated April 1, 2009, relating to the Cumulative Convertible Perpetual Preferred Stock, Series C,incorporated by reference to Exhibit 99.3 to The Dow Chemical Company Current Report on Form 8-K filed on April 1, 2009.
99.3
Guarantee relating to the 5.60% Notes of Rohm and Haas Company, incorporated by reference to Exhibit 99.4 to The Dow ChemicalCompany Current Report on Form 8-K filed on April 1, 2009.
99.4
Guarantee relating to the 6.00% Notes of Rohm and Haas Company, incorporated by reference to Exhibit 99.5 to The Dow ChemicalCompany Current Report on Form 8-K filed on April 1, 2009.
99.5
Guarantee relating to the 9.80% Debentures of Rohm and Haas Company, incorporated by reference to Exhibit 99.6 to The Dow ChemicalCompany Current Report on Form 8-K filed on April 1, 2009.
101.INS XBRL Instance Document (1)
101.SCH XBRL Taxonomy Extension Schema Document (1)
101.CAL XBRL Taxonomy Extension Calculation Linkbase Document (1)
101.DEF XBRL Taxonomy Extension Definition Linkbase Document (1)
101.LAB XBRL Taxonomy Extension Label Linkbase Document (1)
101.PRE XBRL Taxonomy Extension Presentation Linkbase Document (1) (1) Pursuant to Rule 406T of Regulation S-T, this interactive data file is deemed not filed or part of a registration statement or prospectus for purposes of
sections 11 or 12 of the Securities Act of 1933, is deemed not filed for purposes of section 18 of the Securities Exchange Act of 1934, and otherwiseis not subject to liability under these sections.
173

Table of Contents
The Dow Chemical Company and SubsidiariesTrademark Listing
The following trademarks or service marks of The Dow Chemical Company and certain affiliated companies of Dow appear in this report: ACRYSOL,ACUDYNE, ACULYN, ACUMER, ACuPLANE, ACUSOL, ADCOTE, ADVASTAB, AERIFY, AFFINITY, AIRSTONE, AMBERCHROM,AMBERJET, AMBERLITE, AMBERLYST, AMBITROL, AMPLIFY, ANGUS, AQUA-LAM, AQUASET, AQUCAR, AR, ASC METATIN, ASPUN,ATTANE, AUROLECTROLESS, AUTOMATE, AVANSE, BETAFOAM, BETAMATE, BETASEAL, BIOBAN, CARBITOL, CARBOWAX,CARBOWAX SENTRY, CELLOSIZE, CELLOSOLVE, CLEAR+STABLE, CONTINUUM, COPPER GLEAM, CYCLOTENE, D.E.H., D.E.N.,D.E.R., DOW, DOWANOL, DOWEX, DOWFAX, DOWFROST, DOWLEX, DOWTHERM, DUOLITE, DURAGREEN, DURAMAX, DURAPLUS,DURAPOSIT, ECHELON, ECOSMOOTH, ECOSOFT, ECOSURF, ELASTENE, ELITE, ENDURANCE, ENFORCER, ENGAGE, ENHANCER,ENLIGHT, EPIC, ETHOCEL, FILMTEC, FORTEGRA, FROTH-PAK, GLUTEX, GREAT STUFF, HYPERKOTE, HYPOL, IMPAXX, INFUSE,INSPIRE, INSTA-STIK, INTEGRAL, INTERVIA, ISONATE, KATHON, KLARIX, LITHOJET, METEOR, METHOCEL, MONOTHANE, MOR-FREE, NEOLONE, NORDEL, NORKOOL, NYLOPAK, OPTICITE, OPTIDOSE, OPTOGRADE, OPULYN, OROTAN, PAPI, PARALOID, POLYOX,POWERHOUSE, PRIMACOR, PRIMAL, PRIMENE, PROCITE, PROGLYDE, REDI-LINK, RENUVA, RHOPLEX, ROBOND, ROMAX, ROPAQUE,SARAN, SARANEX, SATISFIT, SERFENE, SHAC, SI-LINK, SILVADUR, SMARTFRESH, SOLTERRA, SOFTCAT, SOLTEX, SPECFIL,SPECFLEX, SPECTRIM, STYROFOAM, SUNSPHERES, SYNALOX, TAMOL, TERGITOL, THERMAX, TILE BOND, TRAFFIDECK,TRENCHCOAT, TRITON, TRYCITE, TUFLIN, TYBRITE, TYMOR, TYRIN, UCAR, UCARE, UCARHIDE, UCON, UNIGARD, UNIPOL,UNIVAL, VENPURE, VERDISEAL, VERSENE, VERSIFY, VINYZENE, VISIONPAD, VORACOR, VORACTIV, VORALAST, VORAMER,VORANATE, VORANOL, VORASTAR, WALOCEL, WALSRODER, WEATHERMATE, XITRACK
The following trademarks or service marks of Dow AgroSciences LLC and certain affiliated companies of Dow AgroSciences LLC appear in this report:BRODBECK, CLINCHER, DAIRYLAND, DELEGATE, DITHANE, FORTRESS, GARLON, GLYPHOMAX, GRANITE, HERCULEX, KEYSTONE,LAREDO, LONTREL, LORSBAN, MILESTONE, MUSTANG, MYCOGEN, NEXERA, PHYTOGEN, PROFUME, Refuge Advanced, RENZE,SENTRICON, SIMPLICITY, STARANE, TELONE, TORDON, TRACER NATURALYTE, TRIUMPH, VIKANE, WIDESTRIKEThe following trademark of Agromen Sementes Agricolas Ltda appears in this report: AGROMEN
The following registered service mark of American Chemistry Council appears in this report: Responsible Care
The following trademark of Antaria Limited appears in this report: ZinClear
The following trademark of the Financial Accounting Standards Board appears in this report: FASB Accounting Standards Codification
The following trademark of Lubrizol Advanced Materials, Inc. appears in this report: PELLETHANE
The following trademark of Monsanto Technology LLC appears in this report: SmartStax. SmartStax multi-event technology developed by DowAgroSciences and Monsanto
The following trademarks of Styron LLC appear in this report: STYRON, STYRON A-TECH, STYRON C-TECH
174

Table of Contents
DOW CORNING CORPORATIONAND SUBSIDIARIES
CONSOLIDATED FINANCIAL STATEMENTS
For the period ended December 31, 2010

Table of Contents
DOW CORNING CORPORATION AND SUBSIDIARIES
INDEX TO CONSOLIDATED FINANCIAL STATEMENTS Page
Report of Independent Auditors 3
Consolidated Statements of Income for the years ended December 31, 2010, 2009 and 2008 4
Consolidated Balance Sheets at December 31, 2010 and 2009 5
Consolidated Statements of Cash Flows for the years ended December 31, 2010, 2009 and 2008 7
Consolidated Statements of Equity for the years ended December 31, 2010, 2009 and 2008 8
Notes to Consolidated Financial Statements 9
2

Table of Contents
Report of Independent Registered Public Accounting Firm
To the Stockholders andBoard of Directors ofDow Corning Corporation
In our opinion, the accompanying consolidated balance sheets and the related consolidated statements of income, cash flows and equity present fairly, in allmaterial respects, the financial position of Dow Corning Corporation and its subsidiaries at December 31, 2010 and 2009, and the results of their operationsand their cash flows for each of the three years in the period ended December 31, 2010 in conformity with accounting principles generally accepted in theUnited States of America. These financial statements are the responsibility of the Company’s management. Our responsibility is to express an opinion on thesefinancial statements based on our audits. We conducted our audits of these statements in accordance with the standards of the Public Company AccountingOversight Board (United States). Those standards require that we plan and perform the audit to obtain reasonable assurance about whether the financialstatements are free of material misstatement. An audit includes examining, on a test basis, evidence supporting the amounts and disclosures in the financialstatements, assessing the accounting principles used and significant estimates made by management, and evaluating the overall financial statementpresentation. We believe that our audits provide a reasonable basis for our opinion. /s/ PricewaterhouseCoopers LLPFebruary 7, 2011
3

Table of Contents
DOW CORNING CORPORATION AND SUBSIDIARIESCONSOLIDATED STATEMENTS OF INCOME
(in millions of U.S. dollars, except for per share amounts) Year Ended December 31,
2010 2009 2008 Net Sales $5,997.3 $5,092.5 $ 5,450.0 Operating Costs and Expenses
Cost of sales 3,862.7 3,332.1 3,496.7 Marketing and administrative expenses 699.7 580.3 542.5 Restructuring expenses, net (4.7) 101.6 —
Total operating costs and expenses 4,557.7 4,014.0 4,039.2 Operating Income 1,439.6 1,078.5 1,410.8
Interest income 12.7 17.4 74.2 Other nonoperating expenses, net (35.6) (10.8) (66.4)
Income before Income Taxes 1,416.7 1,085.1 1,418.6 Income tax provision 338.9 331.1 495.9
Net Income 1,077.8 754.0 922.7 Less: Noncontrolling interests’ share in net income 211.8 155.9 184.0
Net Income Attributable to Dow Corning Corporation $ 866.0 $ 598.1 $ 738.7 Weighted-Average Common Shares Outstanding
(basic and diluted) 2.5 2.5 2.5 Net Income per Share (basic and diluted) $ 346.40 $ 239.24 $ 295.48 Dividends Declared per Common Share $ 177.60 $ 177.60 $ 164.80
(See Notes to the Consolidated Financial Statements)
4

Table of Contents
DOW CORNING CORPORATION AND SUBSIDIARIESCONSOLIDATED BALANCE SHEETS
(in millions of U.S. dollars) December 31, 2010 December 31, 2009 ASSETS Current Assets
Cash and cash equivalents $ 2,360.0 $ 1,716.1 Accounts receivable (net of allowance for doubtful accounts of $8.5 in 2010 and $9.8
in 2009) 784.5 679.8 Notes and other receivables 282.5 204.4 Inventories 923.0 706.3 Deferred income taxes 166.7 205.2 Other current assets 107.9 67.4
Total current assets 4,624.6 3,579.2 Property, Plant and Equipment 10,447.0 9,180.5 Less - Accumulated Depreciation (4,326.3) (4,130.7)
Net property, plant and equipment 6,120.7 5,049.8 Other Assets
Marketable securities 544.0 1,072.9 Deferred income taxes 642.7 724.5 Intangible assets (net of accumulated amortization of $52.4 in 2010 and $37.9 in
2009) 98.8 72.2 Goodwill 70.0 75.0 Other noncurrent assets 547.6 249.7
Total other assets 1,903.1 2,194.3 Total Assets $ 12,648.4 $ 10,823.3
(See Notes to the Consolidated Financial Statements)
5

Table of Contents
DOW CORNING CORPORATION AND SUBSIDIARIESCONSOLIDATED BALANCE SHEETS
(in millions of U.S. dollars)
December 31, 2010 December 31, 2009 LIABILITIES AND STOCKHOLDERS’ EQUITY Current Liabilities
Short-term borrowings and current maturities of long-term debt $ 842.1 $ 682.8 Trade accounts payable 668.4 527.1 Accrued payrolls and employee benefits 209.0 184.2 Accrued taxes 91.2 85.5 Accrued interest 82.5 78.1 Current deferred revenue 266.0 209.1 Other current liabilities 128.6 159.2
Total current liabilities 2,287.8 1,926.0 Other Liabilities
Long-term debt 866.8 742.0 Implant reserve 1,566.8 1,580.3 Employee benefits 1,129.2 1,084.3 Deferred revenue 3,130.7 2,324.3 Other noncurrent liabilities 169.3 119.9
Total other liabilities 6,862.8 5,850.8 Equity
Stockholders’ equity Common stock ($5.00 par value - 2,500,000 shares authorized, issued and
outstanding) 12.5 12.5 Retained earnings 3,336.4 2,914.4 Accumulated other comprehensive loss
Cumulative translation adjustment 217.4 204.8 Pension and other postretirement benefit adjustments (659.9) (617.6) Other equity adjustments (33.5) (25.4)
Total accumulated other comprehensive loss (476.0) (438.2) Dow Corning Corporation’s stockholders’ equity 2,872.9 2,488.7
Noncontrolling interest in consolidated subsidiaries 624.9 557.8 Total equity 3,497.8 3,046.5
Total Liabilities and Equity $ 12,648.4 $ 10,823.3
(See Notes to the Consolidated Financial Statements)
6

Table of Contents
DOW CORNING CORPORATION AND SUBSIDIARIESCONSOLIDATED STATEMENTS OF CASH FLOWS
(in millions of U.S. dollars) Year Ended December 31,
2010 2009 2008 Cash Flows from Operating Activities
Net income $ 1,077.8 $ 754.0 $ 922.7 Depreciation and amortization 301.3 198.9 223.5 Changes in deferred revenue, net 863.3 876.7 763.0 Tax-related bond deposits (145.0) — — Changes in deferred taxes, net 151.9 82.7 90.8 Changes in restructuring accrual (20.9) 20.9 — Other, net (38.6) (46.1) 59.0 Changes in operating assets and liabilities
Changes in accounts and notes receivable (170.1) (73.5) 25.2 Changes in accounts payable 85.8 61.7 (83.2) Changes in inventory (214.1) 232.8 (214.1) Changes in other operating assets and liabilities (5.7) (1.5) (102.3)
Cash flows related to reorganization, net (7.9) (5.5) (8.4) Cash provided by operating activities 1,877.8 2,101.1 1,676.2
Cash Flows from Investing Activities Capital expenditures (1,340.3) (1,465.1) (1,370.2) Acquisition of business interests (40.3) (158.6) — Proceeds from sales, maturities, and redemptions of securities 498.5 135.4 1,226.7 Purchases of securities (0.5) (1.6) (938.1) Other, net (0.6) (51.8) 45.3
Cash used in investing activities (883.2) (1,541.7) (1,036.3) Cash Flows from Financing Activities
Increase in long-term debt 194.6 681.4 20.8 Payments of long-term debt (3.1) (26.7) (1.7) Change in short-term borrowings 58.3 (213.2) 869.8 Distributions to shareholders of noncontrolling interests (156.8) (177.1) (91.5) Cash received from noncontrolling shareholders — 46.5 41.0 Dividends paid to stockholders (444.0) (444.0) (412.0)
Cash (used in)/provided by financing activities (351.0) (133.1) 426.4 Effect of Exchange Rate Changes on Cash 0.3 8.1 (10.0) Changes in Cash and Cash Equivalents
Net increase in cash and cash equivalents 643.9 434.4 1,056.3 Cash and cash equivalents at beginning of period 1,716.1 1,281.7 225.4
Cash and cash equivalents at end of period $ 2,360.0 $ 1,716.1 $ 1,281.7
(See Notes to the Consolidated Financial Statements)
7

Table of Contents
DOW CORNING CORPORATION AND SUBSIDIARIESCONSOLIDATED STATEMENTS OF EQUITY
(in millions of U.S. dollars) Dow Corning Corporation Stockholders’ Equity
Total ComprehensiveIncome/(Loss)
RetainedEarnings AOCI
CommonStock
NoncontrollingInterest
Balance at December 31, 2007 $2,743.5 $ 2,433.3 $ (85.6) $ 12.5 $ 383.3 Adoption of Uncertain Tax Positions Guidance 0.3 $ 0.3 0.3 Net Income 922.7 922.7 738.7 184.0 Other comprehensive income (loss), net of tax
Foreign currency translation adjustments 32.2 32.2 14.1 18.1 Unrealized net loss on available for sale securities (115.8) (115.8) (88.0) (27.8) Net loss on cash flow hedges (17.7) (17.7) (17.7) — Pension and other postretirement benefit adjustments (363.3) (363.3) (365.1) 1.8
Other comprehensive income (loss), net of tax (464.6) (464.6) Comprehensive income 458.4 458.4 Cash received from noncontrolling shareholders 41.0 41.0 Dividends declared on common stock (503.5) (412.0) (91.5)
Balance at December 31, 2008 2,739.4 2,760.3 (542.3) 12.5 508.9 Net Income 754.0 754.0 598.1 155.9 Other comprehensive income (loss), net of tax
Foreign currency translation adjustments 9.1 9.1 9.6 (0.5) Unrealized net gain on available for sale securities 96.0 96.0 71.5 24.5 Net gain on cash flow hedges 11.0 11.0 11.0 — Pension and other postretirement benefit adjustments 11.6 11.6 12.0 (0.4)
Other comprehensive income (loss), net of tax 127.7 127.7 Comprehensive income 881.7 881.7 Cash received from noncontrolling shareholders 46.5 46.5 Dividends declared on common stock (621.1) (444.0) (177.1)
Balance at December 31, 2009 3,046.5 2,914.4 (438.2) 12.5 557.8 Net Income 1,077.8 1,077.8 866.0 211.8 Other comprehensive income (loss), net of tax
Foreign currency translation adjustments 28.5 28.5 12.6 15.9 Unrealized net loss on available for sale securities (16.7) (16.7) (12.3) (4.4) Net gain on cash flow hedges 4.2 4.2 4.2 — Pension and other postretirement benefit adjustments (41.7) (41.7) (42.3) 0.6
Other comprehensive income (loss), net of tax (25.7) (25.7) Comprehensive income 1,052.1 $ 1,052.1 Dividends declared on common stock (600.8) (444.0) (156.8)
Balance at December 31, 2010 $3,497.8 $ 3,336.4 $ (476.0) $ 12.5 $ 624.9
(See Notes to the Consolidated Financial Statements)
Accumulated Other Comprehensive Income/(Loss) (“AOCI”)
8
1
1

Table of Contents
DOW CORNING CORPORATION AND SUBSIDIARIESNOTES TO CONSOLIDATED FINANCIAL STATEMENTS
TABLE OF CONTENTS Note Page 1 BUSINESS AND BASIS OF PRESENTATION 10
2 SUMMARY OF SIGNIFICANT ACCOUNTING POLICIES 10
3 ADVANCED ENERGY MANUFACTURING TAX CREDITS 15
4 RESTRUCTURING 16
5 ACQUISITIONS OF BUSINESS INTERESTS 16
6 INVESTMENTS 17
7 INVENTORIES 20
8 INCOME TAXES 21
9 DERIVATIVE INSTRUMENTS AND HEDGING ACTIVITIES 24
10 VARIABLE INTEREST ENTITIES 26
11 PROPERTY, PLANT AND EQUIPMENT 27
12 GOODWILL AND OTHER INTANGIBLE ASSETS 27
13 NOTES PAYABLE AND CREDIT FACILITIES 28
14 DEFERRED REVENUE 30
15 PENSION AND OTHER POSTRETIREMENT BENEFITS 31
16 COMMITMENTS, CONTINGENCIES AND GUARANTEES 37
17 RELATED PARTY TRANSACTIONS 42
9

Table of Contents
DOW CORNING CORPORATION AND SUBSIDIARIESNOTES TO CONSOLIDATED FINANCIAL STATEMENTS
(in millions of U.S. dollars, except where noted)
NOTE 1 – BUSINESS AND BASIS OF PRESENTATIONDow Corning Corporation (“Dow Corning”) was incorporated in 1943 by Corning Glass Works, now Corning Incorporated (“Corning”) and The Dow
Chemical Company (“Dow Chemical”) for the purpose of developing and producing polymers and other materials based on silicon chemistry. Dow Corningoperates in various countries around the world through numerous wholly owned or majority owned subsidiary corporations (hereinafter, the consolidatedoperations of Dow Corning and its subsidiaries may be referred to as the “Company”).
Dow Corning built its business based on silicon chemistry. Silicon is one of the most abundant elements in the world. Most of Dow Corning’s productsare based on polymers known as silicones, which have a silicon-oxygen-silicon backbone. Through various chemical processes, Dow Corning manufacturessilicones that have an extremely wide variety of characteristics, in forms ranging from fluids, gels, greases and elastomeric materials to resins and other rigidmaterials. Silicones combine the temperature and chemical resistance of glass with the versatility of plastics. Regardless of form or application, siliconesgenerally possess such qualities as electrical resistance, resistance to extreme temperatures, resistance to deterioration from aging, water repellency, lubricatingcharacteristics, relative chemical and physiological inertness and resistance to ultraviolet radiation.
The Company engages primarily in the discovery, development, manufacturing, marketing and distribution of silicon-based materials and offers relatedservices. Since its inception, Dow Corning has been engaged in a continuous program of basic and applied research on silicon-based materials to develop newproducts and processes, to improve and refine existing products and processes and to develop new applications for existing products. The Companymanufactures over 7,000 products and serves approximately 25,000 customers worldwide, with no single customer accounting for more than five percent ofthe Company’s sales in any of the past three years. Principal United States manufacturing plants are located in Kentucky and Michigan. Principal foreignmanufacturing plants are located in Belgium, Brazil, China, France, Germany, Japan, South Korea and the United Kingdom. The Company operatesresearch and development facilities and/or technical service centers in the United States, Belgium, Brazil, China, Germany, Japan, South Korea, Taiwan andthe United Kingdom.
The consolidated financial statements include the accounts of the Company and its subsidiaries. Management has evaluated subsequent events throughFebruary 7, 2011, the date the financial statements were available to be issued. Certain prior period items have been reclassified to conform to the currentpresentation.
NOTE 2 – SUMMARY OF SIGNIFICANT ACCOUNTING POLICIESPrinciples of Consolidation
The consolidated financial statements include the accounts of Dow Corning and all of its wholly owned and majority owned domestic and foreignsubsidiaries. The Company’s interests in 20% to 50% owned subsidiaries are carried on the equity basis and are included in “Other noncurrent assets” in theconsolidated balance sheets. Intercompany transactions and balances have been eliminated in consolidation. The Company’s policy is to include the accountsof entities in which the Company holds a controlling interest based on exposure to economic risks and potential rewards (variable interests), and for which it isthe primary beneficiary, in the Company’s consolidated financial statements.
10
Table of Contents
Use of Estimates
The preparation of financial statements in conformity with accounting principles generally accepted in the United States requires management to makeestimates and assumptions that affect the reported amounts of assets and liabilities, the reported amounts of revenues and expenses during the reporting periodand disclosure of contingent assets and liabilities at the date of the financial statements. Actual results could differ from those estimates.
Fair Value Measurements
Assets and liabilities measured at fair value are classified in their entirety based on the lowest level of input that is significant to the fair valuemeasurement. Fair value is defined as the price that would be received to sell an asset or paid to transfer a liability in an orderly transaction between marketparticipants. Level 1 inputs are unadjusted, quoted prices for identical assets or liabilities in active markets. Level 2 inputs are quoted prices, not included inLevel 1, that are either directly or indirectly observable, including quoted prices for similar assets or liabilities in active markets or quoted prices for identicalassets or liabilities in inactive markets. Level 3 inputs are unobservable inputs and include the Company’s assumptions that may be used by marketparticipants.
Cash and Cash EquivalentsCash equivalents include all highly liquid investments with an original maturity of ninety days or less. The carrying amounts for cash equivalents
approximate their fair values. Cash equivalents are measured at fair value using Level 1 inputs.
Accounts Receivable
The Company maintains an allowance for doubtful accounts that reduces receivables to amounts that are expected to be collected. In estimating theallowance, management considers factors such as current overall geographic and industry-specific economic conditions, statutory requirements, historical andanticipated customer performance, historical experience with write-offs and the level of past-due amounts. Changes in these conditions may result in additionalallowances. After all attempts to collect a receivable have failed and local legal requirements are met, the receivable is written off against the allowance.
Inventories
The value of inventories is determined using lower of cost or market as the basis. Produced goods are valued using a first-in, first-out cost flowmethodology, while purchased materials and supplies are valued using an average cost flow methodology.
Property and Depreciation
Property, plant and equipment are carried at cost less any impairment and are depreciated over estimated useful lives using the straight-line method. TheCompany periodically monitors actual experience to determine whether events and circumstances have occurred that may warrant revision of the estimateduseful lives of property, plant and equipment. Engineering and other costs directly related to the construction of property, plant and equipment are capitalizedas construction in progress until construction is complete and such property, plant and equipment is ready and available to perform its specifically assignedfunction. Upon retirement or other disposal, the asset cost and related accumulated depreciation are removed from the accounts and the net amount, less anyproceeds, is charged or credited to income. If an asset is determined to be impaired, the carrying amount of the asset is reduced to its fair value and thedifference is charged to income in the period incurred.
The Company capitalizes the costs of internal-use software as intangibles. Amounts capitalized during the years ended December 31, 2010 and 2009were $12.1 and $11.0, respectively. As of December 31, 2010 and 2009, unamortized software costs were $11.8 and $10.7, respectively. Amortizationexpense of $10.9, $10.5 and $10.5 were recognized during the years ended December 31, 2010, 2009 and 2008, respectively, related to such capitalizedsoftware costs.
11

Table of Contents
Expenditures for maintenance and repairs are charged against income as incurred. Expenditures that significantly increase asset value, extend usefulasset lives or adapt property to a new or different use are capitalized.
The Company capitalizes interest as a component of the cost of capital assets constructed for its own use. The Company includes interest expenseincurred on all liabilities, including interest related to commercial creditor obligations, in the amount of interest expense subject to capitalization. See Note 16for additional details on interest payable to the Company’s commercial creditors.
The Company accounts for asset retirement obligations by recording an asset and related liability for the costs associated with the retirement of long-lived tangible assets when a legal liability to retire the assets exists. These obligations may result from acquisition, construction, or the normal operation of along-lived asset. The Company records asset retirement obligations at fair value in the period in which they are incurred.
In addition, the Company has identified conditional asset retirement obligations, such as for the removal of asbestos and records such obligations whenthere are plans in place to undertake major renovations or plans to exit a facility. Due to the nature of the Company’s operations, the Company believes thatthere is an indeterminate settlement date for the existing conditional asset retirement obligations as the range of time over which the Company may settle theobligation is unknown or cannot be estimated. Therefore, the Company cannot reasonably estimate the fair value of the liability.
Marketable Securities
The Company accounts for investments in debt and equity securities at fair value for trading or available for sale securities. The amortized cost methodis used to account for investments in debt securities that the Company has the positive intent and ability to hold to maturity. Investments in debt and equitysecurities are included in “Marketable securities” and “Other current assets” in the consolidated balance sheets. All such investments are considered to beavailable for sale. Because the Company does not intend to sell, nor is it likely to be forced to sell its available-for-sale securities, declines in fair value areconsidered temporary. In addition, the Company regularly evaluates available evidence to determine if it will be able to recover the cost of these securities. If theCompany is unable to recover the cost of the securities, an other-than-temporary impairment has occurred and credit losses are charged to income in the periodincurred. Temporary declines in the fair value of investments are included in “Accumulated other comprehensive loss.” For the purpose of computing realizedgain or loss on the disposition of investments, the specific identification method is used. The Company’s policy is to purchase investment grade securities.
Credit Risk
Financial instruments that potentially subject the Company to concentrations of credit risk consist principally of cash, investments, derivative financialinstruments and trade receivables. The Company’s policies limit the amount of credit exposure to any single counterparty for cash and investments. TheCompany uses major financial institutions with high credit ratings to engage in transactions involving investments and derivative instruments. The Companyminimizes credit risk in its receivables from customers through its sale of products to a wide variety of customers and markets in locations throughout theworld. The Company performs ongoing credit evaluations of its customers and generally does not require collateral. The Company maintains reserves forpotential credit losses, and historically such losses have been within expectations.
Intangibles
Intangible assets of the Company include goodwill, patents and licenses and other assets acquired by the Company that are separable and measurableapart from goodwill. Goodwill, representing the excess of cost over the fair value of net assets of businesses acquired, is tested at least annually forimpairment. The Company completed its tests for impairment of goodwill during the three month period ended September 30, 2010. Other intangible assetswith finite lives are amortized on a straight-line basis over their estimated useful lives.
12

Table of Contents
Revenue
The Company recognizes revenue only when persuasive evidence of an arrangement exists, delivery has occurred or services have been rendered, theprice to the customer is fixed or determinable and collectability is reasonably assured. Revenue is recognized when title and risk of loss transfer to the customerfor products and as work is performed for professional services. Amounts billed to a customer in a sale transaction related to shipping costs are classified asrevenue. The Company reduces revenue for product returns, allowances and price discounts at the time the sale is recognized. Amounts billed to customers inexcess of amounts recognized as revenue are reported as deferred revenue in the consolidated balance sheets.
Shipping CostsShipping costs are primarily comprised of payments to third party shippers. The Company records shipping costs incurred as a component of “Cost of
sales” in the consolidated statements of income. Shipping costs were $168.9, $138.3 and $151.0 for the years ended December 31, 2010, 2009 and 2008,respectively.
Research and Development Costs
Research and development costs are charged to operations when incurred and are included in “Cost of sales” in the consolidated statements of income.These costs are comprised of primarily labor costs, outside services and depreciation. Research and development costs were $251.8, $216.6 and $227.6 forthe years ended December 31, 2010, 2009 and 2008, respectively.
Income Taxes
The Company records deferred tax assets and liabilities for the expected future tax consequences of events that have been recognized in the Company’sfinancial statements or tax returns. Under this method, deferred tax assets and liabilities are determined based on the difference between the financial statementcarrying amounts and tax bases of assets and liabilities using enacted tax rates in effect in the years in which the differences are expected to reverse. TheCompany records a valuation allowance on deferred tax assets when it is more likely than not the expected future tax benefits will not be realized. Indetermining the appropriate valuation allowance, certain judgments are made relating to recoverability of deferred tax assets, use of tax loss carryforwards,level of expected future taxable income and available tax planning strategies. These judgments are routinely reviewed by management. Further, the Companyrecognizes tax liabilities stemming from uncertain tax positions. As of December 31, 2010 and 2009, the Company had net deferred tax asset balances of$808.2 and $928.6, respectively, after valuation allowances of $55.7 and $85.9, respectively.
Currency TranslationThe value of the U.S. dollar fluctuates against foreign currencies. Because the Company conducts business in many countries, these fluctuations affect
the Company’s consolidated financial position and results of operations.
Subsidiaries in Europe, Japan and China translate their assets and liabilities, stated in their functional currency, into U.S. dollars at exchange rates ineffect at the end of the current period. The resulting gains or losses are reflected in “Cumulative translation adjustment” in the stockholders’ equity section ofthe consolidated balance sheets. Changes in the functional currency value of monetary assets and liabilities denominated in foreign currencies are recognized in“Other nonoperating income/expenses” in the consolidated statements of income. The revenues and expenses of these non-U.S. subsidiaries are translated intoU.S. dollars at the average exchange rates that prevailed during the period. Therefore, the reported U.S. dollar results included in the consolidated statements ofincome fluctuate from period to period, depending on the value of the U.S. dollar against foreign currencies.
13

Table of Contents
For non-U.S. subsidiaries outside of Europe, Japan and China, where the U.S. dollar is the functional currency, inventories, property, plant andequipment and other non-monetary assets, together with their related elements of expense, are translated at historical rates of exchange. All other assets andliabilities are translated at current exchange rates. All other revenues and expenses are translated at average exchange rates. Translation gains and losses forthese subsidiaries are recognized in “Other nonoperating income/expenses” in the consolidated statements of income.
Derivative Financial Instruments
The Company measures derivative financial instruments at fair value and classifies them as “Other current assets,” “Other noncurrent assets,” “Othercurrent liabilities,” or “Other noncurrent liabilities” in the consolidated balance sheets. On the date the derivative instrument is entered into, if the Company isdesignating the instrument as a hedge, the Company designates the derivative as either (1) a hedge of the exposure to changes in the fair value of a recognizedasset or liability or an unrecognized firm commitment (fair value hedge), (2) a hedge of the exposure to variability in cash flows of a forecasted transaction(cash flow hedge), or (3) a hedge of the foreign currency exposure of a net investment in a foreign operation. Changes in the fair value of a derivative that isdesignated as and meets all the required criteria for a fair value hedge, along with the gain or loss on the hedged asset or liability that is attributable to thehedged risk are recorded in current period earnings. Changes in the fair value of a derivative that is designated as and meets all the required criteria for a cashflow hedge are recorded in “accumulated other comprehensive loss” and reclassified into earnings as the underlying hedged item affects earnings. Changes inthe fair value of a derivative or non-derivative that is designated as and meets all the required criteria for a hedge of a net investment are recorded in“accumulated other comprehensive loss”. Changes in the fair value of a derivative that is not designated as a hedge are recorded immediately in earnings. Cashflows from derivatives designated as hedges are classified in the same category of the consolidated statements of cash flows as the items being hedged. Cashflows from derivatives not designated as hedging instruments are classified in the investing activities section of the consolidated statements of cash flows.
Where an instrument is designated as a hedge, the Company formally documents all relationships between the hedging instruments and hedged items, aswell as its risk management objective and strategy for undertaking various hedge transactions. This process includes relating all derivatives that are designatedas fair value or cash flow hedges to specific assets and liabilities on the balance sheet or to specific firm commitments or forecasted transactions. TheCompany also formally assesses both at the inception of the hedge and on an ongoing basis, whether each derivative is highly effective in offsetting changes infair values or cash flows of the hedged item. If it is determined that a derivative is not highly effective as a hedge, or if a derivative ceases to be a highlyeffective hedge, the Company will discontinue hedge accounting with respect to that derivative prospectively.
Litigation
The Company is subject to legal proceedings and claims arising out of the normal course of business. The Company routinely assesses the likelihood ofany adverse judgments or outcomes to these matters, as well as ranges of probable losses. A determination of the amount of the reserves required, if any, forthese contingencies is made after analysis of each known issue and an analysis of historical claims experience for incurred but not reported matters. TheCompany expenses legal costs, including those expected to be incurred in connection with a loss contingency, as incurred. The Company has an active riskmanagement program consisting of numerous insurance policies secured from many carriers. These policies provide coverage that is utilized to mitigate theimpact, if any, of certain of the legal proceedings. The required reserves may change in the future due to new developments in each matter.
Environmental Matters
The Company determines the costs of environmental remediation for its facilities, facilities formerly owned by the Company and third party wastedisposal facilities based on evaluations of current law and existing technologies. Inherent uncertainties exist in these evaluations primarily due to unknownconditions, changing governmental regulations and legal standards regarding liability and evolving technologies. The Company records a charge to earningsfor environmental matters when it is probable that a liability has been incurred and the Company’s costs can be reasonably estimated. The recorded liabilitiesare adjusted periodically as remediation efforts progress or as additional technical or legal information becomes available.
14

Table of Contents
New Accounting StandardsIn January 2010, the Financial Accounting Standards Board (“FASB”) issued guidance requiring disclosures about fair value measurements included in
a company’s financial statements. The Company adopted the guidance effective January 1, 2010. The adoption did not impact the Company’s financialposition and results of operations.
In December 2009, the FASB issued guidance related to the accounting and disclosure requirements for transfers of financial assets. This guidancerequires greater transparency and additional disclosures for transfers of financial assets and the entity’s continuing involvement with them. The guidance alsochanged the requirements for derecognizing the transferred assets and eliminates the concept of a qualifying special purpose entity. The Company adopted thenew guidance effective January 1, 2010. The adoption did not impact the Company’s financial position and results of operations.
In December 2009, the FASB issued guidance related to the accounting and disclosure requirements for the consolidation of variable interest entities(“VIEs”). This guidance requires an enterprise to perform a qualitative analysis on a continual basis to determine whether or not it must consolidate a VIE.Additionally, the guidance requires enhanced disclosures about an enterprise’s involvement with VIEs as well as disclosure of any significant assumptionsand judgments used to determine whether or not to consolidate a VIE. The Company adopted the new guidance effective January 1, 2010. The adoption did notimpact the Company’s financial position and results of operations.
In October 2009, the FASB issued new guidance related to revenue recognition for multiple-deliverable revenue arrangements expanding the disclosurerequirements related to such arrangements. The guidance is effective for revenue arrangements entered into or materially modified in fiscal years beginning onor after June 15, 2010. The adoption is not expected to impact the Company’s financial position and results of operations.
NOTE 3 – ADVANCED ENERGY MANUFACTURING TAX CREDITSOn January 8, 2010, the Company was approved to receive Advanced Energy Manufacturing Tax Credits of $169.0. The tax credits were granted as
part of the American Reinvestment and Recovery Act of 2009 and are focused on job creation from increased domestic manufacturing capacity supplying cleanand renewable energy projects. The credits granted to the Company are related to the Company’s manufacturing expansion projects supporting the solarindustry. The Company accounts for investment tax credits under the flow-through method, which results in the recognition of the credit as a reduction offederal income taxes in the year in which the credit arises. During the year ended December 31, 2010 the Company recognized $141.9 of the credits resulting ina reduction of the tax liability, a reduction in the income tax provision of $92.2 and an increase in deferred tax liabilities of $49.7. The income tax benefit of$92.2 included $69.9 as a discrete benefit as it related to qualifying expenditures through December 31, 2009. The impact of these tax credits on net incomefor the year ended December 31, 2010 was $58.3, net of the noncontrolling interests’ share.
15

Table of Contents
NOTE 4 – RESTRUCTURINGIn February 2009, in response to economic challenges, Dow Corning announced it would reduce its workforce through reduction-in-force programs and
site closures globally. These actions were part of broader cost-saving measures taken by the Company, including efforts to maximize operational efficiency andtightly control expenses. The Company recorded restructuring expenses of $101.6 during the year ended December 31, 2009. This amount was comprised ofapproximately $95.6 for employee-related costs associated with ongoing benefit arrangements and one-time termination benefits and $6.0 for leaseterminations, asset disposals and demolitions. As of December 31, 2010, the program was complete.
The following tables summarize activities related to restructuring:
Year Ended December 31, 2010
SeveranceCosts
Accrued liability at January 1, 2010 $ 20.9 Adjustment to liability (6.7) Cash payments (14.1) Foreign currency impact (0.1) Accrued liability at December 31, 2010 $ —
Year Ended December 31, 2009
SeveranceCosts
Accrued liability at January 1, 2009 $ — Accrual of restructuring expenses 96.6 Adjustment to liability (4.2) Cash payments (74.1) Foreign currency impact 2.6 Accrued liability at December 31, 2009 $ 20.9
NOTE 5 – ACQUISITIONS OF BUSINESS INTERESTSGlobe Metais Industria e Comercio S.A. and West Virginia Alloy
On November 5, 2009, the Company paid $174.9 and acquired 100% of the equity of Globe Metais Industria e Comercio S.A. (“Metais”), a siliconmetal producer with manufacturing operations in Brazil and a 49% equity interest of Globe Metallurgical Inc.’s silicon manufacturing operation, WVAManufacturing LLC (“WVA”), a silicon metal producer with manufacturing operations in West Virginia (collectively, the “Transaction”). Direct costs relatedto the Transaction were approximately $3.6, primarily for legal and advisory services. The Company believes that the Transaction enhances both the securityof supply and cost effectiveness of a key raw material.
The acquisition of the controlling interest of Metais was accounted for as a business combination. The results of operations of Metais were included inthe Company’s consolidated financial statements from the date of acquisition. The investment in WVA was accounted for by the equity method of accountingfor investments and was included in “Other noncurrent assets” in the Company’s consolidated balance sheet as of December 31, 2010 and 2009. The resultsof operations of Metais and the equity results of WVA were not material to the consolidated statement of income.
The Company’s initial estimates for the Transaction resulted in a fair value of assets and liabilities which exceeded the purchase price by $14.8. Thisamount was recorded as a bargain purchase gain in “Other nonoperating income/expenses” of the consolidated statement of income for the year endedDecember 31, 2009. The gain was primarily related to access to a stable and favorably priced supply of electricity under a long-term contract, the relativecondition of property, plant and equipment in relation to replacement cost and the benefit of a net operating loss carryforward that the Company expects to beable to utilize based on its strategic plans for this business.
The fair values of assets acquired and liabilities assumed on November 5, 2009 related to the Transaction were as shown in the table below. Since theacquisition, net adjustments of $18.5 were made to the fair values of the assets acquired and liabilities assumed, with a corresponding adjustment to thebargain purchase gain, as summarized in the table below. The adjustments were primarily due to the completed valuation of forestry assets, the finalevaluation of contingent liabilities and the related deferred tax impacts. The December 31, 2009 financial statement balances and disclosures impacted by theseadjustments have been retrospectively adjusted.
16

Table of Contents
Initial Valuations Adjustment Adjusted Values Cash and marketable securities $ 16.7 $ — $ 16.7 Other current assets 15.3 9.5 24.8 Property, plant and equipment 30.4 31.3 61.7 Other intangible assets 35.3 — 35.3 Other assets 155.3 (57.2) 98.1 Current and noncurrent liabilities (47.2) 34.9 (12.3) Debt (16.1) — (16.1) Total fair value of net assets acquired $ 189.7 $ 18.5 $ 208.2 Purchase price including cash received 174.9 — 174.9 Gain on bargain purchase $ 14.8 $ 18.5 $ 33.3
Quebec Silicon Limited Partnership
On October 1, 2010, the Company acquired 49% of the equity of Quebec Silicon Limited Partnership (“Quebec Silicon LP”), a silicon metal manufacturingcompany with operations in Canada. The Company paid $40.3 in exchange for the equity interests in Quebec Silicon LP. The Company believes that thistransaction enhances both the security of supply and cost effectiveness of a key raw material. The investment in Quebec Silicon LP was accounted for by theequity method of accounting for investments and included in “Other noncurrent assets” in the Company’s consolidated balance sheet as of December 31,2010. The results of operations from Quebec Silicon LP were not material to the consolidated statement of income.
NOTE 6 – INVESTMENTSInvestments reflected in “Other current assets” and “Marketable securities” in the consolidated balance sheets at December 31, 2010 and 2009 were
$544.3 and $1,075.5 respectively. These investments have been classified as available for sale.
The cost, gross unrealized gains, gross unrealized losses and fair value of the investments were as follows: December 31, 2010
Cost
GrossUnrealized
Gains
GrossUnrealized(Losses)
FairValue
Debt Securities: Auction rate securities backed by student loans $ 493.8 $ — $ (28.2) $465.6 Auction rate preferred securities 76.9 — (8.0) 68.9
Total Debt Securities $ 570.7 $ — $ (36.2) $ 534.5 Foreign Equity Securities $ 2.3 $ 1.7 $ — $ 4.0 Other 5.8 — — 5.8 Total Marketable Securities $578.8 $ 1.7 $ (36.2) $ 544.3
As of December 31, 2010, securities in an unrealized loss position for 12 months or more were valued at $172.0, net of unrealized losses of $22.0.
17

Table of Contents
The cost, gross unrealized gains, gross unrealized losses and fair value of the investments were as follows: December 31, 2009
Cost
GrossUnrealized
Gains
GrossUnrealized(Losses)
FairValue
Debt Securities: Auction rate securities backed by student loans $ 1,006.2 $ — $ (11.4) $ 994.8 Auction rate preferred securities and other 79.2 0.8 (8.8) 71.2
Total Debt Securities $ 1,085.4 $ 0.8 $ (20.2) $ 1,066.0 Foreign Equity Securities $ 2.0 $ 1.3 $ — $ 3.3 Other 6.2 — — 6.2 Total Marketable Securities $1,093.6 $ 2.1 $ (20.2) $1,075.5
As of December 31, 2009, all debt securities with fair value less than cost were in an unrealized loss position for 12 months or more.
Assets and liabilities measured at fair value are classified in their entirety based on the lowest level of input that is significant to the fair valuemeasurement. The classifications as of the balance sheet dates were as follows:
Fair Value December 31, 2010 December 31, 2009 Level 1 $ 9.8 $ 11.8 Level 3 534.5 1,063.7
Total $ 544.3 $ 1,075.5
The changes in fair value of Level 3 assets were as follows:
2010 2009 Beginning balance January 1 $ 1,063.7 $ 1,100.6 Change in unrealized losses in other comprehensive loss (16.9) 94.3 Realized losses included in earnings (16.1) — Sales/redemptions of assets classified as Level 3 (496.2) (131.2) Ending balance at December 31 $ 534.5 $ 1,063.7
Level 3 available for sale securities with a par value of $512.4 were redeemed or sold during the year ended December 31, 2010. These redemptions wererelated to securities backed by student loans and were redeemed or sold at a weighted average price of 96.8% of par.
Subsequent to December 31, 2010, the Company received an unsolicited offer to purchase certain of its auction rate securities backed by student loansthat had a par value of $134.7. The sale will result in an immaterial loss that will be included in the income statement for the three months ended March 31,2011.
As of December 31, 2010, the debt securities with a fair value of $465.6, excluding auction rate preferred securities, have maturities greater than fiveyears.
18

Table of Contents
Level 3 AssetsAuction Rate Securities
As of December 31, 2010, the Company held auction rate securities of $534.5 included in the consolidated balance sheet. These securities consistedprincipally of revenue bonds backed by student loans that are guaranteed by the U.S. Government, revenue bonds backed by insured student loans andbundled preferred equity securities.
Historically, the cost of the auction rate securities approximated fair value. The Company had experienced a long history of successful auctions.However, in mid-February 2008, auctions began to fail and continued to fail for virtually all of these securities because there were an insufficient number ofbuy bids. Upon failure of an auction, the Company is required to hold the security until the next auction date at a contractually predetermined interest rategenerally higher than the risk-free treasury rate. A failed auction reduces the immediate liquidity available to the Company, since there are currently nosecondary markets for the auction rate securities held by the Company. Securities valued at $534.5 were classified as noncurrent assets as of December 31,2010. Management believes the Company has sufficient sources of liquidity to fund its operations, capital expenditure plan, breast implant settlementliabilities and shareholder dividends through cash on hand, cash generated by operations or access to credit markets.
Due to the absence of observable prices in an active market for the same or similar securities, the fair value of $534.5 of the securities was based on adiscounted cash flow analysis using forecasts of future cash flows and interest rates. The data used for the forecasts included benchmark interest rates suchas LIBOR and U.S. Treasury rates, commercial paper rates and other interest rate indices reflecting market required rates of return. The valuation consideredvariable coupon payments, the restriction in liquidity due to failed auctions, the credit risk related to each group of securities and the probability of recovery orreplacement of the auction rate securities market. Other considerations also included the nature of the collateralizations, guarantees, contractual structures ofthe securities and issuers’ indication of intent to redeem. In accordance with fair value measurement guidance, the auction rate securities were included in Level3 at December 31, 2010 because certain of the cash flow model inputs were not readily observable.
Auction Rate Securities backed by Student Loans
The Company held auction rate securities backed by student loans valued at $465.6 included in the consolidated balance sheet as of December 31,2010. The securities had credit ratings above investment grade for 95% of the portfolio. These auction rate securities were variable rate debt instruments withunderlying securities that have contractual maturities that range from 14 to 36 years and whose interest rates are reset every 28 to 35 days through an auctionprocess. Since the auctions have failed, default interest rates are applicable and each issuer has continued to pay required interest payments. Because the fairvalue of these securities was lower than the cost, an unrealized loss of $21.2, net of the noncontrolling interests’ share of $7.0, was recorded in “Accumulatedother comprehensive loss” at December 31, 2010.
Auction Rate Preferred Securities
The Company held auction rate securities backed by preferred equity securities valued at $68.9 included in the consolidated balance sheets as ofDecember 31, 2010. The interest rates reset on these variable rate equity instruments every 45 to 90 days through an auction process. Since the auctions havefailed, default dividend allocation methods are in effect. While 72% of the securities were rated below investment grade, the issuers of the underlying preferredequity securities have continued to remit dividends consistent with historical practices. Because the fair value of these securities was lower than the cost, anunrealized loss of $7.4, net of the noncontrolling interests’ share of $0.6, was recorded in “Accumulated other comprehensive loss” at December 31, 2010.
19

Table of Contents
Classification of Unrealized Losses
As of December 31, 2010, the Company was not actively marketing, had no intent to sell, nor was expected to be required to sell, auction rate securitiesbacked by student loans and auction rate preferred securities before the anticipated recovery in market value. In determining that the unrealized losses related tothese securities were not other-than-temporary, the Company considered several other factors. These factors included the financial condition and prospects ofthe issuers, expected continuation of interest and dividend payments, the magnitude of losses compared with the cost of the investments, the length of time theinvestments have been in an unrealized loss position and the credit rating of the security. Management believes the decline in fair value is primarily related tothe current interest rate environment and market inefficiencies and not to the credit deterioration of the individual issuers. Total unrealized losses of $28.6, netof $7.6 for the noncontrolling interests’ share, related to auction rate securities were included in “Accumulated other comprehensive loss” in the consolidatedbalance sheet at December 31, 2010. The fair value of these securities could be subject to further adjustments in the future if indicated by either observableprices in an active market or a change in the results of valuations.
NOTE 7 – INVENTORIESThe value of inventories is determined using the lower of cost or market as the basis. Produced goods were valued using a first-in, first-out (FIFO) cost
flow methodology, while purchased materials and supplies were valued using an average cost flow methodology. The components of inventories were asfollows: December 31, 2010 December 31, 2009 Produced goods $ 727.8 $ 547.6 Purchased materials 97.3 76.9 Maintenance and supplies 97.9 81.8 Total Inventory $ 923.0 $ 706.3
Produced goods include both work-in-process and finished goods. Due to the nature of the Company’s operations, it is impractical to classify inventorybetween work-in-process and finished goods as such classifications can be interchangeable for certain inventoriable items. Purchased materials primarilyconsist of the Company’s raw material inventories. Maintenance and supplies included in inventory primarily represent spare component parts that are criticalto the Company’s manufacturing processes.
20

Table of Contents
NOTE 8 – INCOME TAXESThe components of income before income taxes and noncontrolling interests for the year ended December 31 were as follows:
2010 2009 2008 Domestic $ 1,134.8 $ 964.3 $1,219.1 Foreign 281.9 120.8 199.5 Total $1,416.7 $1,085.1 $ 1,418.6
The components of the income tax provision for the year ended December 31 were as follows: 2010 2009 2008
Current Deferred Total Current Deferred Total Current Deferred Total Domestic $ 85.5 $ 203.4 $288.9 $172.9 $ 92.9 $265.8 $ 328.8 $ 89.3 $ 418.1 Foreign 107.2 (57.2) 50.0 75.5 (10.2) 65.3 76.3 1.5 77.8 Total $192.7 $ 146.2 $ 338.9 $ 248.4 $ 82.7 $ 331.1 $ 405.1 $ 90.8 $495.9
The tax effects of the principal temporary differences giving rise to deferred tax assets and liabilities as of December 31 were as follows: 2010 2009 Deferred Tax Assets:
Implant costs $ 568.6 $ 572.4 Postretirement benefit obligations 401.0 409.0 Tax loss carryforwards 176.8 159.2 Tax credit carryforwards 153.0 47.0 Accruals and other 165.3 163.0 Inventories 61.8 80.0 Long-term debt 34.2 33.8
Total deferred tax assets $1,560.7 $ 1,464.4 Deferred tax liabilities:
Property, plant and equipment (696.8) (449.9) Net deferred tax asset prior to valuation allowance $ 863.9 $1,014.5 Less: Valuation allowance (55.7) (85.9) Net Deferred Tax Asset $ 808.2 $ 928.6
The Company believes that it is more likely than not that the net deferred tax asset will be realized. The criteria that management considered in makingthis determination were historical and projected operating results, the ability to utilize tax planning strategies and the period of time over which the tax benefitscan be utilized.
Tax effected operating loss carryforwards as of December 31, 2010 were $176.8 and $159.2 as of December 31, 2009. Of the tax effected operatingloss carryforwards, $142.3 are subject to an indefinite carryforward period and were generated by the Company’s subsidiaries in Brazil and the UnitedKingdom. Substantially all of the remaining operating loss carryforwards relate to the Company’s subsidiaries in China. The carryforward period of netoperating losses in China is five years. The Company has determined that no valuation allowance is needed for the net operating losses.
The valuation allowance as of December 31, 2010 was $55.7. Of this amount, $39.0 is attributable to realized and unrealized capital losses onmarketable securities and $14.9 from outside basis differences in the Company’s joint ventures.
21

Table of Contents
Tax credit carryforwards of $153.0 as of December 31, 2010 are attributable to foreign tax credits of $72.7 and general business credits of $80.3. Theforeign tax credits expire in 2019. The general business credits are related to the advanced energy manufacturing credit and expire in 2030. The Companybelieves that these credits will be utilized before the expiration period based on future foreign source income and taxable income.
Cash paid during the year for income taxes, net of refunds received, was $191.1 in 2010, $234.4 in 2009 and $399.8 in 2008.
The income tax provision at the effective rate may differ from the income tax provision at the United States federal statutory tax rate. A reconciliation ofthe tax rate for the years ended December 31 is illustrated in the following table: 2010 2009 2008 Income Tax Provision at Statutory Rate $495.9 $379.8 $496.5 Increase /(Decrease) in Income Tax Provision due to:
Foreign provisions and related items (12.7) (9.1) (6.8) Change in foreign tax rates 4.9 — 0.5 China joint venture losses 9.3 28.4 15.9 China valuation allowance release (44.0) — — Domestic joint venture dividends 18.9 18.0 11.0 Domestic manufacturing deduction (18.1) (15.6) (21.1) Advanced energy manufacturing credits (92.2) — — U.S. tax effect of foreign earnings and dividends (30.9) (68.9) 1.3 State income taxes 9.1 5.9 13.1 Tax exempt interest income (1.5) (3.3) (19.0) Audit settlement (8.3) — (7.0) Valuation allowance on capital losses 5.8 0.6 19.4 Other, net 2.7 (4.7) (7.9)
Total Income Tax Provision at Effective Rate $ 338.9 $ 331.1 $495.9 Effective Rate 23.9% 30.5% 35.0%
As of December 31, 2009, the Company had a valuation allowance of $44.0 on the deferred tax assets of a China subsidiary. During 2010, theallowance was increased by $24.4. As of December 31, 2010, management concluded that the weight of all available evidence, both positive and negative,warranted the release of the valuation allowance of $68.4 when the China subsidiary achieved operational performance.
Also during 2010, the Company was approved to receive Advanced Energy Manufacturing Tax Credits of approximately $169.0 that resulted in a$92.2 reduction in the income tax provision for the year ended December 31, 2010.
During 2009, the Company’s subsidiary in the Netherlands paid a dividend to the United States that resulted in a reduction in the income tax provisionfor the year ended December 31, 2009 and 2010. Substantially all of the reduction in the income tax provision from the U.S. tax effect of foreign earnings anddividends in 2009 and 2010 relates to this dividend.
As of December 31, 2010, income and remittance taxes have not been recorded on $413.4 of undistributed earnings of foreign subsidiaries, eitherbecause any taxes on dividends would be offset substantially by foreign tax credits or because the Company intends to reinvest those earnings indefinitely.
22

Table of Contents
The Company files income tax returns in the U.S. federal jurisdiction and various state, local and foreign jurisdictions. With few exceptions, theCompany is no longer subject to U.S. federal, state, local or non-U.S. income tax examination by tax authorities for years before 2005.
The following table indicates, for each significant jurisdiction, the earliest tax year that remains subject to examination:
Year Year United Kingdom 2009 Japan 2006 Belgium 2008 Brazil 2005 France 2007 United States 2005 Germany 2007 China 2002 Korea 2007
The Company is participating in the IRS Compliance Assurance Process for the 2009 and 2010 tax years. In addition, certain foreign jurisdictions andcertain states have commenced examinations of returns filed by the Company and some of its foreign subsidiaries. Management anticipates that none of theseaudits will be closed before 2012. As of December 31, 2010, no jurisdiction has proposed any significant adjustments to the Company’s tax returns thatmanagement believes would be sustained and would materially affect the Company’s financial position. In addition, the Company does not anticipate that anymaterial adjustments will result from settlements, closing of tax examinations or expiration of applicable statutes of limitation in various jurisdictions withinthe next 12 months.
During the year ended December 31, 2010, the Company received proposed adjustments from the IRS related to the Company’s consolidated federalincome tax returns for the 2006, 2007, 2008 and 2009 calendar years. The Company filed protests and appeals in response to the proposed adjustments forthe years 2006 through 2008. Management believes that the deficiencies asserted by the IRS will not be sustained and is vigorously contesting the IRS’ claims.However, if the IRS prevails, the resulting tax deficiency would be approximately $206.1. Management believes that the resolution of the issues will not have amaterial impact on the Company’s consolidated financial position or results of operations. In July 2010, the Company made voluntary protective bonddeposits of $145.0 to the IRS related to these tax positions for the earlier tax years. Additional tax payments of $61.0 were made for the 2008 through 2010 taxyears to cover anticipated adjustments for these years. The deposits and the additional payments were made to alleviate the potential for interest expense andpenalties as well as to generate competitive interest income on the funds.
A reconciliation of the beginning and ending amount of unrecognized gross tax benefits, exclusive of the federal benefit of state items, interest andpenalties as of December 31 were as follows:
2010 2009 2008 Unrecognized tax benefits as of January 1 $15.1 $16.7 $ 18.8 Additions based on tax positions related to the current year 4.7 0.4 1.6 Reductions based on tax positions related to the current year — (0.8) — Additions for tax positions of prior years — — 1.4 Reductions for tax positions of prior years (2.6) (1.0) (1.3) Settlements (6.6) (0.2) (3.8) Balance as of December 31 $ 10.6 $15.1 $16.7
As outlined above, the Company had approximately $10.6 of total gross unrecognized tax benefits as of December 31, 2010. Of this total, $9.0, net ofthe federal benefit on state issues, represents the amounts of the unrecognized tax benefits that, if recognized, would affect the effective income tax rate in anyfuture periods.
23

Table of Contents
The Company recognizes interest accrued related to unrecognized tax benefits and penalties in income tax expense. During the years ended December 31,2010 and 2009, the Company recognized approximately $1.8 and $0.1, respectively, of benefit from interest and penalties. During the year endedDecember 31, 2008, the Company recognized $1.0 of expense related to interest and penalties. The Company had approximately $1.7 and $3.5 accrued for thepayment of interest and penalties as of December 31, 2010 and 2009, respectively.
Tax Effect of Other Comprehensive Income
The following table details the tax (expense) benefit of other comprehensive income amounts recognized during the year ended December 31: 2010 2009 2008 Net gain/loss on cash flow hedges (2.3) (5.0) 10.3 Pension and other postretirement benefit adjustments 33.1 (3.4) 210.8
NOTE 9 – DERIVATIVE INSTRUMENTS AND HEDGING ACTIVITIESThe Company uses derivative financial instruments to reduce the impact of changes in foreign exchange rates on its earnings, cash flows and fair values
of assets and liabilities. In addition, the Company uses derivative financial instruments to reduce the impact of changes in natural gas and other commodityprices on its earnings and cash flows. The Company enters into derivative financial contracts based on analysis of specific and known economic exposures.The Company’s policy prohibits holding or issuing derivative financial instruments for trading or speculative purposes. The types of instruments typicallyused are forward contracts, but may also include option combinations and purchased option contracts.
Cash Flow Hedges
The Company uses forward contracts and options to hedge the exposure to changes in the prices of commodities, primarily natural gas. Net unrealizedgains and losses on these contracts are recorded as a component of “Accumulated other comprehensive loss” in the Company’s consolidated balance sheetsand are reclassified into earnings in the same period or periods during which the underlying hedged item impacts earnings. Gains or losses on the derivativesrepresenting either hedge ineffectiveness or hedge components excluded from the assessment of hedge effectiveness are recognized in current earnings. As ofDecember 31, 2010, the Company had outstanding commodity forward contracts and options to hedge forecasted purchases of 3.9 million mmbtu of naturalgas. Net losses of $5.4 ($3.4 after tax) are expected to be reclassified from “Accumulated other comprehensive loss” to the consolidated statements of incomeand included as part of “Cost of sales” in the next 12 months. The forward contracts and options outstanding at December 31, 2010 hedge forecastedtransactions expected to occur within the next 24 months.
Foreign exchange options are also used to hedge specific firm commitments or forecasted transactions by locking in exchange rates for such anticipatedcash flows. Gains and losses on these instruments are recorded as a component of “Accumulated other comprehensive loss” in the consolidated balance sheetsuntil the forecasted transaction occurs. As of December 31, 2010, the total notional amount of the Company’s foreign currency cash flow hedges was $59.5expressed as U.S. dollars. Net gains of $0.7 ($0.4 after tax) are expected to be reclassified from “Accumulated other comprehensive loss” to the consolidatedstatements of income and included as part of “Other nonoperating income/expenses” during the next 12 months. The options outstanding as of December 31,2010 hedge forecasted transactions expected to occur within the next 17 months.
Economic Hedges
Contracts used to hedge the economic exposure to foreign currency fluctuations associated with certain monetary assets and liabilities are not designatedas hedging instruments. Changes in the fair value of these items are recorded in earnings to offset the foreign exchange gains and losses of the monetary assetsand liabilities. As of December 31, 2010, the total notional amount of the Company’s non-designated foreign currency fair value hedges was $714.5, expressedas U.S. dollars.
24

Table of Contents
The location and amounts of derivative fair values in the Company’s statement of financial position were as follows: December 31, 2010
Derivative Assets Derivative Liabilities
Balance SheetLocation
FairValue Balance Sheet Location
FairValue
Designated hedging instruments Foreign exchange contracts Other current assets $ 1.7 Other current liabilities $ — Commodity contracts Other current assets — Other current liabilities (5.2) Commodity contracts > 12 months Other noncurrent assets — Other noncurrent liabilities (0.2)
Economic hedges not designated Foreign exchange contracts Other current assets 1.1 Other current liabilities (1.8)
Total derivatives $ 2.8 $ (7.2)
December 31, 2009
Derivative Assets Derivative Liabilities
Balance SheetLocation
FairValue
Balance SheetLocation
FairValue
Designated hedging instruments Commodity contracts Other current assets $ 0.7 Other current liabilities $ (9.8) Commodity contracts > 12 months Other noncurrent assets — Other noncurrent liabilities (0.2)
Economic hedges not designated Foreign exchange contracts Other current assets 4.0 Other current liabilities —
Total derivatives $ 4.7 $ (10.0)
The location and amounts of derivative gains and losses recognized in the Company’s income statement were as follows: Year Ended
Location of AmountRecognized in Income 2010 2009
Derivatives designated as hedging instruments Other nonoperating
Foreign exchange contracts income/expenses $ (0.7) $ (3.8) Commodity contracts Cost of sales (14.7) (19.7) Total derivatives designated as hedges (15.4) (23.5)
Economic hedges not designated Other nonoperating
Foreign exchange contracts income/expenses 0.7 (34.8) Tax hedging contracts Tax provision 2.2 4.1 Total derivatives not designated as hedges 2.9 (30.7)
Total derivative impact on income statement $(12.5) $ (54.2)
The tables below detail gains and losses recognized in “Other comprehensive income/loss” (“OCI”) and gains and losses reclassified from “Accumulatedother comprehensive loss” related to derivatives that were designated as cash flow hedges. The amount of ineffectiveness related to existing cash flow hedgesduring the periods ending December 31, 2010 and 2009 was immaterial.
25

Table of Contents
December 31, 2010
Gain/(Loss)in OCI
(Gain)/LossReclassified fromAOCI into Income
Location of Gain/(Loss)Reclassified
Other nonoperating Foreign exchange contracts $ 1.7 $ 0.7 income/expenses Commodity contracts (10.5) 14.7 Cost of sales Total $ (8.8) $ 15.4
December 31, 2009
Gain/(Loss)in OCI
(Gain)/LossReclassified fromAOCI into Income
Location of Gain/(Loss)Reclassified
Other nonoperating Foreign exchange contracts $ 7.5 $ 3.8 income/expenses Commodity contracts (15.0) 19.7 Cost of sales Total $ (7.5) $ 23.5
Derivative options held by the Company as of December 31, 2010 were valued using observable market inputs and the Black-Scholes model. Forwardcontracts were also valued using observable market inputs. The inputs used in valuation were considered Level 2 because the inputs are readily observable forthe derivative asset or liability.
The amounts below represent fair value classifications of derivative instruments held as of the balance sheet dates and are prior to consideration ofcounterparty netting arrangements.
The net assets and liabilities were recorded in the consolidated balance sheets, accordingly. December 31, 2010 December 31, 2009
Assets Liabilities Assets Liabilities Level 1 $ — $ — $ — $ — Level 2 2.8 (7.2) 4.7 (10.0) Level 3 — — — —
$ 2.8 $ (7.2) $ 4.7 $ (10.0)
NOTE 10 – VARIABLE INTEREST ENTITIESThe Company holds minority voting interests in certain joint ventures that produce key raw material inputs for the Company. These joint ventures
operate under supply agreements that sell inventory to the equity owners using pricing mechanisms that guarantee a return, therefore shielding the jointventures from the right or ability to absorb expected gains or losses. As a result of the pricing mechanisms of these agreements, these entities are determined tobe variable interest entities. As the Company does not hold the power to direct the activities that most significantly impact the economic performance of theseentities, it is not the primary beneficiary and therefore does not consolidate the results of these entities.
The Company accounts for its investment in these entities under the equity method of accounting. The Company’s maximum exposure to loss as aresult of its involvement with these variable interest entities is determined to be the carrying value of the investment in these entities plus the maximum amountof potential future payments under the Company’s guarantee of a nonconsolidated subsidiary’s debt. As of December 31, 2010 the maximum exposure to losswas $211.9.
26

Table of Contents
NOTE 11 – PROPERTY, PLANT AND EQUIPMENTThe components of property, plant and equipment as of December 31 were as follows:
Estimated UsefulLife (Years) 2010 2009
Land — $ 217.7 $ 194.7 Land improvements 11-20 328.0 276.7 Buildings 18-33 1,964.9 1,717.6 Machinery and equipment 3-25 6,960.8 5,414.6 Construction-in-progress — 975.6 1,576.9 Total property, plant and equipment $10,447.0 $ 9,180.5 Accumulated depreciation (4,326.3) (4,130.7) Net property, plant and equipment $ 6,120.7 $ 5,049.8
The Company recorded depreciation expense of $291.6, $192.7 and $218.4 for the years ended December 31, 2010, 2009 and 2008, respectively.
Effective October 1, 2008, the Company changed the useful lives of certain property, plant and equipment as a result of the Company’s historicalexperience which demonstrated longer useful lives for certain classes of assets. The change was accounted for as a change in estimate and appliedprospectively. The effect of the change to depreciation expense increased pre-tax income by $21.7 and increased net income by $13.7 for the year endedDecember 31, 2008.
The amount of interest capitalized as a component of the cost of capital assets constructed for the years ended December 31, 2010, 2009 and 2008 was$71.2, $49.1 and $32.8, respectively.
As of December 31, 2010 and 2009, the Company had noncurrent liabilities of $9.9 and $8.7, respectively, for asset retirement obligations primarilyrelated to landfill closure costs recorded in the consolidated balance sheets as “Other noncurrent liabilities.”
NOTE 12 – GOODWILL AND OTHER INTANGIBLE ASSETSThe gross and net amounts of intangible assets, excluding goodwill, as of December 31 were as follows:
2010
GrossCarrying Amount
AccumulatedAmortization
NetCarrying Amount
Patents and licenses $ 11.7 $ (3.3) $ 8.4 Customer/Distributor relationships 24.1 (21.3) 2.8 Completed technology 19.6 (12.6) 7.0 Other 95.8 (15.2) 80.6
Total $ 151.2 $ (52.4) $ 98.8
2009
GrossCarrying Amount
AccumulatedAmortization
NetCarrying Amount
Patents and licenses $ 15.2 $ (5.4) $ 9.8 Customer/Distributor relationships 21.1 (15.6) 5.5 Completed technology 17.2 (9.3) 7.9 Other 56.6 (7.6) 49.0
Total $ 110.1 $ (37.9) $ 72.2
27

Table of Contents
The Company recorded amortization expense related to these intangible assets of $9.6, $6.2 and $5.1 for the years ended December 31, 2010, 2009and 2008, respectively. The estimated aggregate amortization expense to be recorded in each of the next five years is as follows:
2011 $ 9.3 2012 9.3 2013 8.1 2014 6.9 2015 7.2
The changes in the carrying amount of goodwill for the year ended December 31 were as follows: 2010 2009 Beginning balance $75.0 $72.6 Translation and other (5.0) 2.4 Total ending balance $ 70.0 $ 75.0
NOTE 13 – NOTES PAYABLE AND CREDIT FACILITIESShort Term Borrowings
The Company has a $500.0 revolving credit arrangement which expires in 2011. The revolving credit agreement allows for borrowing in variouscurrencies for general corporate purposes of the Company and its subsidiaries and requires the payment of commitment fees. The credit arrangement sets theinterest rate at LIBOR at the time of borrowing plus a margin representing a credit spread, which is reset quarterly. The Company is in compliance with itsdebt covenants, including leverage and interest coverage ratios, related to this credit arrangement. As of December 31, 2010 and 2009, the Company hadborrowed the maximum amount allowed under this credit arrangement. The Company also had outstanding short-term debt of $232.5 and $169.1 in Asia atDecember 31, 2010 and 2009, respectively. The borrowings in Asia consisted of $30.0 denominated in U.S. dollars with an interest rate of LIBOR plus 250basis points. The remaining borrowings in Asia are primarily denominated in Renminbi with an interest rate generally set by the People’s Bank of China at thetime of borrowing. The weighted average interest rate for the outstanding short-term borrowings was 2.1% as of December 31, 2010.
In addition, the Company had unused and committed credit facilities for use by foreign subsidiaries at December 31, 2010 and 2009 with various U.S.and foreign banks totaling $216.0 and $416.2, respectively. These credit facilities require the payment of commitment fees. The Company intends to renewthese facilities at their respective maturities. These facilities are available in support of working capital requirements.
Since the interest rates for the borrowings in the U.S. and Asia are reset regularly based on market conditions, management believes the carrying value ofthe debt approximates its fair value.
28
Table of Contents
Long Term Debt
In April 2009, a majority owned subsidiary of the Company entered into an unsecured five-year term loan facility with a syndicate of commercial banksin China. The amount of the facility was 4.2 billion Renminbi ($626.7 U.S. dollars). The facility permits borrowing in various currencies with repaymentrequired to begin two years after the drawdown date. The subsidiary had borrowed the maximum amount under the facility as of December 2010 and 2009.Repayment will begin in April 2011. The subsidiary is in compliance with its debt covenants, including interest coverage ratio and tangible net worth, relatedto this credit arrangement.
In October 2009, a majority owned subsidiary of the Company entered into an unsecured term loan facility with a syndicate of commercial banks inChina that will expire in 4.5 years. The amount of the facility was 1.6 billion Renminbi ($241.6 U.S. dollars) and permits borrowing in Renminbi only. Thesubsidiary had borrowed $241.6 amount and $73.2 under the facility as of December 2010 and 2009, respectively. Repayment will begin in April 2011. Thesubsidiary is in compliance with its debt covenants, including interest coverage ratio and tangible net worth, related to this credit arrangement.
In August 2010, a majority owned subsidiary of the Company entered into an unsecured term loan with a bank in China. The amount of the loan was193.5 Renminbi ($29.2 U.S. dollars) and permits borrowing in Renminbi only. As of December 31, 2010, the subsidiary had borrowed the maximumamount under the loan. Repayment will begin in December 2011. The subsidiary is in compliance with its debt covenants, including interest coverage ratioand tangible net worth, related to this credit arrangement.
Since the interest rates for the borrowings in the U.S. and Asia are reset regularly based on market conditions, management believes the carrying value ofthe debt approximates its fair value.
Long-term debt as of December 31 consisted of the following: 2010 Rates 2009 Rates Long-term debt
Variable rate notes due 2011-2014 $ 868.3 5.2-5.4% $681.0 5.2-5.4% Variable rate notes due 2011-2015 29.2 5.2% — — Variable rate bonds due 2019 4.2 0.4% 4.2 1.0% Other obligations and capital leases 59.8 3.8-6.4% 60.8 3.8-6.4%
Total long-term debt $961.5 $ 746.0 Less payments due within one year 94.7 4.0
Total long-term debt due after one year $ 866.8 $ 742.0
Annual aggregate maturities of the long-term debt of the Company are: $94.7 in 2011, $185.4 in 2012, $185.6 in 2013, $450.5 in 2014, $45.3thereafter.
Cash paid during the year for interest was $66.8 in 2010, $51.7 in 2009 and $24.1 in 2008.
Sales of Accounts Receivable
Dow Corning Toray (“DCT”) maintains an accounts receivable facility with its primary bank. The discount rate under this facility is the equivalent ofTIBOR plus 0.25%. DCT sold accounts receivable in the amount of $275.5 and $201.3 to this bank in exchange for cash proceeds of $275.3 and $201.2during the years ended December 31, 2010 and 2009, respectively. Under the facility, DCT continues to collect the receivables from the customer but retainsno interest in the accounts receivable. The facility agreement does not permit DCT to transfer the accounts receivable to any other institution and DCT is notpermitted to repurchase the transferred receivables. The transfer of receivables provides additional liquidity to DCT. The counterparty for the accountsreceivables facility is a financial institution that specializes in receivables securitization transactions and is financed through the issuance of commercial paper.
29

Table of Contents
Additionally, the Company has access to a short term borrowing facility securitized by accounts receivable in the U.S. which expires in 2011. Theinterest rate under this facility is based on commercial paper pool rates. The facility requires the payment of commitment fees on the unused portion. TheCompany is in compliance with its debt covenants, including leverage and interest coverage ratios, related to this credit arrangement. As of December 31, 2010and 2009, there were no outstanding amounts under this agreement.
NOTE 14 – DEFERRED REVENUEThe Company enters into long-term product sales agreements with certain customers. Under certain agreements, customers are obligated to purchase
minimum quantities of product and make specified payments. The product sales agreements extend over various periods and the revenue associated with theagreements is recognized using the average sales price over the life of the agreements. Differences between amounts invoiced to customers under the agreementsand amounts recognized using the average price methodology are reported as deferred revenue in the consolidated balance sheets.
Under certain agreements, customers were required to make initial non-refundable advanced cash payments. During the years ended December 31, 2010and 2009, advanced payments of $981.8 and $946.7, respectively, were received by the Company. These amounts are recorded as deferred revenue and arerecognized as income ratably on a per kilogram basis as products are shipped over the life of the agreements. The Company expects to receive advancedpayments of $572.4 in the next twelve months and $178.7 in periods thereafter. In the event that certain product delivery timelines are not met, subject tospecific conditions outlined in the agreements, customers may be entitled to damages up to the amount of the advanced cash payments.
Deferred revenue included in the consolidated balance sheets as of December 31, 2010 and 2009 was $3,396.7 and $2,533.4 respectively. The currentportion of $266.0 and $209.1 was recorded as “Current deferred revenue” in the consolidated balance sheets as of December 31, 2010 and 2009, respectively.The remaining amounts were included in the consolidated balance sheets as “Deferred revenue” in noncurrent liabilities. The advanced payments received arereported as cash flows from operating activities in the consolidated statements of cash flows.
30

Table of Contents
NOTE 15 – PENSION AND OTHER POSTRETIREMENT BENEFITSDefined Benefit Pension Plans
The Company maintains defined benefit employee retirement plans covering most domestic and certain non-U.S. employees. The components of pensionexpense for the Company’s U.S. and non-U.S. plans were as follows: U.S. Plans Non-U.S. Plans Total
2010 2009 2008 2010 2009 2008 2010 2009 2008 Net Periodic Benefit Cost Service cost $ 38.0 $ 37.3 $ 31.1 $ 21.7 $ 19.4 $ 25.1 $ 59.7 $ 56.7 $ 56.2 Interest cost on projected benefit obligations 86.4 81.6 76.0 32.7 30.4 34.2 119.1 112.0 110.2 Expected return on plan assets (67.4) (77.0) (83.2) (33.1) (27.9) (32.1) (100.5) (104.9) (115.3) Amortization of net transition obligation — — — — 0.2 0.3 — 0.2 0.3 Amortization of net prior service costs 2.8 3.1 4.4 0.9 0.8 1.2 3.7 3.9 5.6 Amortization of net losses 37.7 30.9 13.5 7.0 2.3 5.3 44.7 33.2 18.8 Other adjustments — — 12.0 0.5 4.8 0.2 0.5 4.8 12.2 Total $ 97.5 $75.9 $ 53.8 $29.7 $ 30.0 $ 34.2 $ 127.2 $ 105.9 $ 88.0
Due to corrections of employee demographic data, pension expense for the year ended December 31, 2008 included an adjustment of $12.0 and theprojected benefit obligation at December 31, 2008 included an adjustment of $29.0.
Other changes in plan assets and benefit obligations that were recognized in or reclassified from other comprehensive income as of December 31 were asfollows: U.S. Plans Non-U.S. Plans Total
2010 2009 2010 2009 2010 2009 Amortization of net prior service costs $ (2.8) $ (3.1) $ (0.6) $ (0.5) $ (3.4) $ (3.6) Amortization of transition obligation — — — 0.1 — 0.1 Amortization of net losses or settlement recognition (37.7) (30.9) (7.0) (6.6) (44.7) (37.5) Net loss (gain) arising during the year 119.9 (56.2) (25.2) 54.6 94.7 (1.6) Total $ 79.4 $ (90.2) $ (32.8) $ 47.6 $46.6 $(42.6)
The Company’s defined benefit employee retirement plans have a measurement date of December 31 of the applicable year. The projected benefitobligation, accumulated benefit obligation and fair value of plan assets for defined benefit plans with accumulated benefit obligations in excess of plan assetsas of December 31 were as follows: U.S. Plans Non-U.S. Plans Total
2010 2009 2010 2009 2010 2009 Projected benefit obligation $1,632.6 $ 1,454.8 $592.0 $576.6 $2,224.6 $ 2,031.4 Accumulated benefit obligation 1,363.0 1,238.6 537.5 523.3 1,900.5 1,761.9 Fair value of plan assets 986.4 870.3 417.5 367.0 1,403.9 1,237.3
31

Table of Contents
The following table provides a reconciliation of beginning and ending balances of the projected benefit obligation, beginning and ending balances of thefair value of plan assets and the funded status of the plans as of December 31: U.S. Plans Non-U.S. Plans Total
2010 2009 2010 2009 2010 2009 Change in benefit obligation
Projected benefit obligation, beginning of year $ 1,454.8 $ 1,374.9 $666.1 $ 527.6 $ 2,120.9 $1,902.5 Service cost 38.0 37.3 21.7 19.4 59.7 56.7 Interest cost 86.4 81.6 32.7 30.4 119.1 112.0 Actuarial (gains) losses 135.1 35.7 (1.4) 82.3 133.7 118.0 Foreign currency exchange rate changes — — (14.4) 41.1 (14.4) 41.1 Benefits paid and settlements (81.7) (74.7) (23.1) (34.7) (104.8) (109.4)
Projected benefit obligation, end of year $1,632.6 $ 1,454.8 $ 681.6 $ 666.1 $ 2,314.2 $ 2,120.9 Fair value of plan assets
Fair value of plan assets, beginning of year $ 870.3 $ 666.3 $ 441.0 $ 317.9 $ 1,311.3 $ 984.2 Actual return on plan assets 82.5 168.9 51.0 66.2 133.5 235.1 Foreign currency exchange rate changes — — (16.8) 32.4 (16.8) 32.4 Employer contributions 115.3 109.8 40.8 57.7 156.1 167.5 Benefits paid and settlements (81.7) (74.7) (23.1) (33.2) (104.8) (107.9)
Fair value of plan assets, end of year $ 986.4 $ 870.3 $ 492.9 $ 441.0 $ 1,479.3 $ 1,311.3 Funded status of plans $ (646.1) $ (584.5) $(188.7) $(225.1) $ (834.8) $ (809.6) Accumulated benefit obligation 1,363.0 1,238.6 596.3 583.2 1,959.3 1,821.8
The following table represents assets by category and fair value level of the U.S and non-U.S. defined benefit employee retirement plans as ofDecember 31: 2010
Level 1 Level 2 Level 3 Total Cash and cash equivalents $ 10.1 $ — $ — $ 10.1 Equity securities 203.3 3.0 — 206.3 Corporate debt securities 0.1 217.3 — 217.4 U.S. government debt securities — 137.2 — 137.2 U.S. government guaranteed mortgage backed securities — 4.1 0.7 4.8 Other governmental debt securities 0.4 33.7 — 34.1 Investment funds 25.8 823.0 7.6 856.4 Other — 13.0 — 13.0 Total $ 239.7 $1,231.3 $ 8.3 $1,479.3
2009
Level 1 Level 2 Level 3 Total Cash and cash equivalents $ 14.3 $ — $ — $ 14.3 Equity securities 197.2 1.8 — 199.0 Corporate debt securities 0.1 93.1 — 93.2 U.S. government debt securities 12.9 26.5 — 39.4 U.S. government guaranteed mortgage backed securities — 86.4 — 86.4 Other governmental debt securities 0.3 8.8 0.1 9.2 Investment funds — 832.9 11.6 844.5 Other — 25.3 — 25.3 Total $ 224.8 $1,074.8 $ 11.7 $ 1,311.3
32

Table of Contents
The changes in fair value of Level 3 assets for the year ended December 31, 2010 were as follows: Beginning balance, January 1, 2010 $11.7 Actual return on assets 0.9 Purchases 0.7 Sales (5.0) Ending value, December 31, 2010 $ 8.3
Level 1 assets were valued based on quoted prices in active markets. Level 2 assets were primarily comprised of assets held in investment funds. Thevalue of these funds was determined based on quoted prices in active markets for assets that are identical to the underlying assets held by the funds.
Level 3 assets were investments in a long term property lease fund. Due to the absence of observable prices in an active market for the same or similarsecurities, the fair value of the securities was based on the last available market price for the underlying assets.
The following table represents amounts recorded in the consolidated balance sheets as of December 31: U.S. Plans Non-U.S. Plans Total
2010 2009 2010 2009 2010 2009 Current benefit liabilities $ (5.0) $ (4.9) $ (4.1) $ (6.1) $ (9.1) $ (11.0) Noncurrent benefit liabilities (641.1) (579.6) (184.6) (219.0) (825.7) (798.6)
Total recognized liabilities $(646.1) $ (584.5) $(188.7) $(225.1) $ (834.8) $ (809.6) Amounts recognized in accumulated other comprehensive loss
Prior service cost 18.5 21.2 10.8 7.9 29.3 29.1 Net loss 787.0 704.8 152.2 181.9 939.2 886.7 Accumulated other comprehensive loss $ 805.5 $ 726.0 $ 163.0 $ 189.8 $ 968.5 $ 915.8 Net amounts recognized $ 159.4 $ 141.5 $ (25.7) $ (35.3) $ 133.7 $ 106.2
The Company expects to recognize $57.4 of net loss and $3.5 of net prior service cost as a component of net periodic pension cost in 2011 for itsdefined benefit pension plans.
The expected return on plan assets is a long-term assumption based on projected returns for assets and the approved asset allocations of the plan. For thepurpose of pension expense recognition, the Company uses a market-related value of assets that amortizes the difference between the expected return and theactual return on plan assets over a three-year period. The Company had approximately $40.7 of net unrecognized asset losses associated with its U.S. pensionplans as of December 31, 2010 that will be recognized in the calculation of the market-related value of assets and subject to amortization in future periods.
For the United States defined benefit plan, as of December 31, 2010 and 2009, the fair value of plan assets included 54% of equity securities and 46%of debt securities. The plan targets an asset allocation of 50% equity securities and 50% debt securities. The plan’s expected long-term rate of return is basedon the asset allocation and expected future rates of return on equity and fixed income securities based on the investment outlook provided by the Company’sactuary.
33

Table of Contents
Given the relatively long horizon of the Company’s aggregate obligation, its investment strategy is to improve and maintain the funded status of its U.S.and non-U.S. plans over time without exposure to excessive asset value volatility. The Company manages this risk primarily by maintaining actual assetallocations between equity and fixed income securities for the plans within a specified range of its target asset allocation. In addition, the Company ensures thatdiversification across various investment subcategories within each plan are maintained within specified ranges.
All of the Company’s pension assets are managed by outside investment managers and held in trust by third-party custodians. The selection andoversight of these outside service providers is the responsibility of investment committees. The selection of specific securities is at the discretion of theinvestment manager and is subject to the provisions set forth by written investment management agreements and related policy guidelines regarding permissibleinvestments and risk control practices.
The Company’s funding policy is to contribute to defined benefit plans when pension laws and economics either require or encourage funding.Contributions of approximately $155.1 are planned for the U.S. plans in 2011. Contributions of approximately $29.0 are planned for non-U.S. plans in2011.
The weighted-average assumptions used to determine the benefit obligation and to determine the net benefit costs are shown in the following table.Discount rates and rates of increase in future compensation are weighted based upon the projected benefit obligations of the respective plans. The expected long-term rate of return on plan assets is weighted based on total plan assets for each plan at year end. The long-term rate of return on plan assets assumption isdetermined considering historical returns and expected future asset allocation and returns for each plan. Benefit Obligations at December 31
U.S. Plans Non-U.S. Plans Total
2010 2009 2010 2009 2010 2009 Discount rate 5.5% 6.0% 4.9% 5.2% 5.3% 5.8% Rate of increase in future compensation levels 4.8% 4.8% 4.3% 4.5% 4.6% 4.7%
Net Periodic Pension Cost for the Year Ended December 31
U.S. Plans Non-U.S. Plans Total
2010 2009 2010 2009 2010 2009 Discount rate 6.0% 6.0% 5.2% 5.7% 5.8% 5.9% Rate of increase in future compensation levels 4.8% 4.8% 4.5% 4.2% 4.7% 4.6% Expected long-term rate of return on plan assets 7.2% 8.1% 7.4% 7.1% 7.3% 7.8%
The Company uses the Citigroup Pension Discount Curve and matches points along the curve to the estimated future benefit payments of the U.S.defined benefit plans to arrive at an effective discount rate. The discount rates for non-U.S. defined benefit plans are based on benchmark rate indices specificto the respective countries and durations similar to those of the plans’ liabilities.
34

Table of Contents
The Company expects to pay benefits under its defined benefit plans in future periods as detailed in the following table. The expected benefits have beenestimated based on the same assumptions used to measure the Company’s benefit obligation as of December 31, 2010 and include benefits attributable tofuture employee service. Estimated Future Benefit Payments
U.S. Plans Non-U.S. Plans Total 2011 $ 80.1 $ 19.0 $ 99.1 2012 80.6 23.2 103.8 2013 81.6 24.5 106.1 2014 83.2 22.0 105.2 2015 85.2 27.7 112.9
2016-2020 479.1 150.4 629.5
Other Postretirement Plans
In addition to providing pension benefits, the Company provides certain health care and life insurance benefits for most retired employees, primarily inthe U.S. The cost of providing these benefits to retirees outside the U.S. is not significant. Net periodic postretirement benefit cost included the followingcomponents: Year Ended December 31,
2010 2009 2008 Net Periodic Postretirement Benefit Cost
Service cost $ 4.5 $ 4.5 $ 3.8 Interest cost 16.3 15.8 14.6 Amortization of prior service credits (6.8) (6.8) (6.2) Amortization of actuarial losses 4.6 3.8 1.6
Total $ 18.6 $ 17.3 $ 13.8
Other changes in benefit obligations that were recognized in or reclassified from other comprehensive income for the year ended December 31 included: 2010 2009 Amortization of prior service costs $ 6.8 $ 6.8 Amortization of loss (4.6) (3.8) Net loss arising during the year 16.9 21.6 New prior service credit — (0.6) Total $ 19.1 $ 24.0
35

Table of Contents
The following table presents a reconciliation of the beginning and ending balances of the accumulated postretirement benefit obligation as ofDecember 31. 2010 2009 Accumulated postretirement benefit obligation
Accrued postretirement benefit obligation at beginning of year $ 290.7 $266.5 Service cost 4.5 4.5 Interest cost 16.3 15.8 Actuarial loss 16.9 21.6 Plan change — (0.6) Benefits paid (17.5) (17.1)
Accumulated postretirement benefit obligation at end of year $ 310.9 $ 290.7 Funded status of plans $ (310.9) $(290.7) Amounts recognized in the consolidated balance sheets
Current benefit liabilities $ (20.4) $ (20.4) Noncurrent benefit liabilities (290.5) (270.3)
Total recognized liabilities $ (310.9) $(290.7) Amounts recognized in accumulated other comprehensive loss
Prior service credit (16.5) (23.3) Net loss 102.5 90.1 Accumulated other comprehensive loss 86.0 66.8 Net amounts recognized $ (224.9) $(223.9)
The Company expects to recognize $5.3 of net loss and $6.6 of net prior service credit as a component of net periodic postretirement benefit cost in2011.
The health care cost trend rate used in measuring the accumulated postretirement benefit obligation was 8.5% in 2010 and was assumed to decreasegradually to 5.0% in 2033 and remain at that level thereafter. The health care cost trend rate assumption has an effect on the amounts reported, but is offset byplan provisions that limit the Company’s share of the total postretirement health care benefits cost for the vast majority of participants. The Company’sportion of the total annual health care benefits cost is capped at specified dollar amounts for participants who retired in 1994 or later, and such limits areexpected to be reached in all subsequent years. Increasing the assumed health care cost trend rate by one percentage point in each year would increase theaccumulated postretirement benefit obligation by 1.9% and the aggregate of the service and interest cost components of net periodic postretirement benefit costfor 2010 by 1.5%. Decreasing the assumed health care cost trend rates by one percentage point in each year would decrease the accumulated postretirementbenefit obligation by 1.7% and the aggregate of the service and interest cost components of net periodic postretirement benefit cost for 2010 by 1.3%.
The discount rate used in determining the accumulated postretirement benefit obligation was 5.25% and 5.75% at December 31, 2010 and 2009,respectively. The Company uses the Citigroup Pension Discount Curve and matches points along the curve to the estimated future benefit payments of theU.S. postretirement health care benefit plans to arrive at an effective discount rate.
36

Table of Contents
The Company funds most of the cost of the postretirement health care and life insurance benefits as incurred. Benefit payments to retirees were $19.3for the year ended December 31, 2010. Reimbursements received under Medicare Part D were $1.8 for the year ended December 31, 2010. The Companyexpects to pay future benefits under its postretirement health care and life insurance benefit plans and expects to receive reimbursements from annual MedicarePart D subsidy as detailed in the following table. The expected payments have been estimated based on the same assumptions used to measure the Company’spostretirement benefit obligations as of December 31, 2010.
EstimatedPostretirement Benefit
Payments
EstimatedMedicareSubsidies
2011 $ 20.9 $ 1.7 2012 20.8 1.9 2013 20.9 2.1 2014 20.9 2.3 2015 21.2 2.5
2016-2020 108.4 16.9
Defined Contribution Plans
The Company has various defined contribution and savings plans covering certain employees. The Company made matching contributions under definedcontribution plans of $20.6, $19.7 and $20.7 for the years ended December 31, 2010, 2009 and 2008, respectively. The U.S. plan is the largest of thedefined contribution and savings plans maintained by the Company. Employer matching contributions for the U.S. defined contribution plan for the yearended December 31, 2010 was $13.8. The Company expects to make additional contributions of $20.7 to all defined contribution plans during 2011.
NOTE 16 – COMMITMENTS, CONTINGENCIES AND GUARANTEESChapter 11 Related Matters
On May 15, 1995 (the “Filing Date”), the Company voluntarily filed for protection under Chapter 11 of the U.S. Bankruptcy Code with the U.S.Bankruptcy Court for the Eastern District of Michigan, Northern Division in order to resolve the Company’s breast implant liabilities and related matters (the“Chapter 11 Proceeding”). The Joint Plan of Reorganization was confirmed in November 1999 and provides funding for the resolution of breast implant andother products liability litigation covered by the Chapter 11 Proceeding through several settlement options or through litigation and for the satisfaction ofcommercial creditor claims in the Chapter 11 Proceeding. The Company emerged from the Chapter 11 Proceeding on June 1, 2004 (the “Effective Date”) and isimplementing its Joint Plan of Reorganization.
Breast Implant and Other Products Liability Claims
Products liability claims to be resolved by settlement are administered by a settlement facility (the “Settlement Facility”), and products liability claims tobe resolved by litigation are defended by a litigation facility (the “Litigation Facility”). Products liability claimants choosing to litigate their claims are requiredto pursue their claims through litigation against the Litigation Facility. Under the Joint Plan of Reorganization, the total amount of payments by the Companycommitted to resolve products liability claims will not exceed a net present value of $2.35 billion determined as of the Effective Date using a discount rate of7%. Of this amount, no more than a net present value of $400.0 determined as of the Effective Date will be used to fund the Litigation Facility.
37

Table of Contents
Funding the Settlement and Litigation Facilities
The Company has an obligation to fund the Settlement Facility and the Litigation Facility (collectively, the “Facilities”) over a 16-year period,commencing at the Effective Date. The Company anticipates that it will be able to meet its remaining payment obligations to the Facilities utilizing cash flowfrom operations, insurance proceeds and/or prospective borrowings. If the Company is unable to meet its remaining obligations to fund the Facilities, theCompany will also have access to a ten-year unsecured revolving credit commitment, established by Dow Chemical and Corning, in an original maximumaggregate amount of $300.0. Beginning June 1, 2009, the amount available decreases by $50.0 per year and will fully expire June 1, 2014. As of December 31,2010 the maximum aggregate amount available to the Company under this revolving credit commitment was $200.0. As of December 31, 2010, the Companyhad not drawn any amounts against the revolving credit commitment.
Funds are paid by the Company (a) to the Settlement Facility with respect to products liability claims, as such claims are processed and allowed by theSettlement Facility and (b) via the Settlement Facility with respect to products liability claims processed through the Litigation Facility, as such claims areresolved. Insurance settlements are paid by the Company’s insurers directly to the Settlement Facility on behalf of the Company. The amount of funds paid byor on behalf of the Company is subject to annual and aggregate funding limits. The Company has made payments of $1,677.5 to the Settlement Facilitythrough December 31, 2010.
In accordance with the Joint Plan of Reorganization, and subject to the annual and aggregate funding limits, future payments to the Settlement Facilitywill be made on a periodic basis as necessary to preserve the liquidity of the Settlement Facility until such payment obligations cease as provided for in thePlan. Based on these funding agreements, the recorded liability is adjusted to maintain the present value of $2.35 billion determined as of the Effective Dateusing a discount rate of 7% (“Time Value Adjustments”). The Company has made early payments to the Settlement Facility in advance of their due dates andhas recognized Time Value Adjustments for certain of those early payments consisting primarily of insurance proceeds. The actual amounts payable and thetiming of payments by the Company to the Settlement Facility are uncertain and will be affected by, among other things, the rate at which claims are resolvedby the Facilities, the rate at which insurance proceeds are received by the Company from its insurers and the degree to which Time Value Adjustments arerecognized.
As of December 31, 2010 and December 31, 2009, the Company’s “Implant reserve” recorded in the consolidated balance sheets was $1,566.8 and$1,580.3, respectively. These amounts reflect the Company’s estimated remaining obligation to fund the resolution of breast implant and other medical deviceclaims pursuant to the Company’s Joint Plan of Reorganization and other breast implant litigation related matters
During 2010 the Company recorded an out of period adjustment of $25.6 to reflect prior years’ settlements of products liability claims. The adjustmentreduced the Company’s liability to fund the Settlement Facility as recorded in “Implant reserve” on the consolidated balance sheet and increased “Othernonoperating income/expenses” on the consolidated statement of income. The adjustment increased the Company’s pretax income by $25.6 and net income by$16.1.
Insurance Proceeds – London Market Insurers
The London Market Insurers (the “LMI Claimants”) have claimed a reimbursement right with respect to a portion of insurance proceeds based on atheory that the LMI Claimants overestimated the Company’s products liability. During the third quarter of 2008, the LMI Claimants offered two calculationsof their claim amount: $54.0 and $92.5, plus minimum interest of $67.0 and $115.5, respectively. These estimates were explicitly characterized aspreliminary and subject to change. Litigation regarding this claim is in discovery. The Company disputes the claim. Based on settlement negotiations, theCompany has estimated that the most likely outcome will result in payment to the LMI Claimants in a range of $10.0 to $20.0. The Company recorded aliability for an amount within this range as of December 31, 2010.
38

Table of Contents
Insurance Allocation Agreement between the Company and Dow Chemical
A number of the products liability insurance policies relevant to claims against the Company name the Company and Dow Chemical as co-insureds (the“Shared Insurance Assets”). In order to resolve issues related to the amount of the Shared Insurance Assets that would be available to the Company forresolution of its products liability claims, the Company and Dow Chemical entered into an insurance allocation agreement. Under this agreement, 25% ofcertain of the Shared Insurance Assets were paid by the Company to Dow Chemical subsequent to the Effective Date. The maximum $285.0 liability was paidin full as of September 30, 2009. In accordance with the agreement, a portion of any such amounts paid to Dow Chemical, to the extent not used by DowChemical to pay certain products liability claims, will be paid over to the Company after the expiration of a 17.5-year period commencing on the EffectiveDate.
Commercial Creditor Issues
The Joint Plan of Reorganization provides that each of the Company’s commercial creditors (the “Commercial Creditors”) would receive in cash the sumof (a) an amount equal to the principal amount of their claims and (b) interest on such claims. The actual amount of interest that will ultimately be paid tothese Commercial Creditors is uncertain due to pending litigation between the Company and the Commercial Creditors regarding the appropriate interest ratesto be applied to outstanding obligations from the Filing Date through the Effective Date (the “Pendency Interest”) as well as the presence of any recoverable fees,costs and expenses.
The Company’s position is that (a) Pendency Interest should be (i) an amount determined by applying non-default rates of interest for floating rateobligations in accordance with the formulas in the relevant contracts, except that the aggregate amount of interest cannot be less than that resulting from theapplication of a fixed rate of 6.28% through the Effective Date and (ii) the higher of the relevant contract rates or 6.28% for all other obligations to theCommercial Creditors through the Effective Date, (b) interest payable to the Commercial Creditors for periods following the Effective Date should be computedat 5% and (c) default interest rates should not apply (the “Company’s Position”). The Commercial Creditors’ position is that (a) Pendency Interest should bean amount determined by applying default rates of interest with respect to amounts overdue under the terms of the relevant debt and commercial agreementsuntil the Effective Date, (b) interest payable to the Commercial Creditors for periods following the Effective Date should be computed at 5% and (c) certain ofthe Commercial Creditors are entitled to unspecified fees, costs and expenses. The Company has paid to the Commercial Creditors an amount of interest thatthe Company considers to be undisputed, which was calculated by application of the Company’s Position (the “Undisputed Portion”).
In July 2006, the U.S. Court of Appeals for the Sixth Circuit concluded that there is a general presumption that contractually specified default interestshould be paid by a solvent debtor to unsecured creditors (the “Interest Rate Presumption”) and permitting the Company’s Commercial Creditors to recoverfees, costs and expenses where allowed by relevant loan agreements and state law. The matter was remanded to the U.S. District Court for the Eastern Districtof Michigan for further proceedings to determine the presence of equitable considerations that would preclude the application of the Interest Rate Presumptionor, in the absence of equitable considerations, what the default rates of interest will be, along with any recoverable fees, costs and expenses.
As of December 31, 2010, the Company has paid approximately $1.5 billion to the Commercial Creditors, representing principal and the UndisputedPortion. As of December 31, 2010, the Company has estimated its liability payable to the Commercial Creditors to be within a range of $81.4 to $267.9.However, no single amount within the range appears to be a better estimate than any other amount within the range. Therefore, the Company has recorded theminimum liability within the range. As of December 31, 2010 and December 31, 2009, the amount of interest included in “Accrued interest” recorded in theconsolidated balance sheets related to the Company’s potential obligation to pay additional interest to its Commercial Creditors in the Chapter 11 Proceedingwas $79.9 and $76.1, respectively. The actual amount of interest that will be paid to these creditors is uncertain and will ultimately be resolved throughcontinued proceedings in the District Court.
39

Table of Contents
Risks and UncertaintiesWhile the Company does not anticipate a need to further revise amounts recorded in its consolidated financial statements for these Chapter 11 related
matters, as additional facts and circumstances develop, it is at least reasonably possible that amounts recorded in the Company’s consolidated financialstatements may be revised. Future revisions, if required, could have a material effect on the Company’s financial position or results of operations in the periodor periods in which such revisions are recorded. Since any specific future developments, and the impact such developments might have on amounts recordedin the Company’s consolidated financial statements, are unknown at this time, an estimate of possible future adjustments cannot be made.
Environmental MattersThe Company was previously advised by the United States Environmental Protection Agency (“EPA”) or by similar state and non-U.S. national
regulatory agencies that the Company, together with others, is a Potentially Responsible Party (“PRP”) with respect to a portion of the cleanup costs and otherrelated matters involving a number of waste disposal sites. Management believes that there are 23 sites at which the Company may have some liability,although management expects to settle the Company’s liability for eight of these sites for de minimis amounts.
Based upon preliminary estimates by the EPA or the PRP groups formed with respect to these sites, the aggregate liabilities for all PRP’s at those sites atwhich management believes the Company may have more than a de minimis liability is $28.1. Management cannot estimate the aggregate liability for allPRP’s at all of the sites at which management expects the Company has a de minimis liability. The Company records accruals for environmental matters whenit is probable that a liability has been incurred and the Company’s costs can be reasonably estimated. The amount accrued for environmental matters as ofDecember 31, 2010 and 2009 was $2.1 and $3.2, respectively.
As additional facts and circumstances develop, it is at least reasonably possible that the accrued liability related to environmental matters may berevised. While there are a number of uncertainties with respect to the Company’s estimate of its ultimate liability for cleanup costs at these waste disposal sites,management believes that any costs incurred in excess of those accrued will not have a material adverse impact on the Company’s consolidated financialposition or results of operations. This opinion is based upon the number of identified PRP’s at each site, the number of such PRP’s that are believed bymanagement to be financially capable of paying their share of the ultimate liability, and the portion of waste sent to the sites for which management believes theCompany might be held responsible based on available records.
Other Regulatory MattersCompanies that manufacture and sell chemical products may experience risks under current or future laws and regulations which may result in
significant costs and liabilities. The Company routinely conducts health, toxicological and environmental tests of its products. The Company cannot predictwhat future legal, regulatory or other actions, if any, may be taken regarding the Company’s products or the consequences of their production and sale. Suchactions could result in significant losses, and there can be no assurance that significant losses would not be incurred. However, based on currently availableinformation, the Company’s management does not believe that any such actions would have a material adverse effect on the Company’s financial condition orresults of operations.
40
Table of Contents
Guarantees and Letters of CreditGuarantees arise in the normal course of business from relationships with customers, employees and nonconsolidated affiliates when the Company
undertakes an obligation to guarantee the performance of others (via delivery of cash or other assets) if specified triggering events occur. Non-performanceunder a contract by the guaranteed party triggers the obligation of the Company. The Company maintained an agreement to guarantee the debt of anonconsolidated affiliate. The maximum amount of potential future payments under this guarantee was $63.6 as of December 31, 2010. The guarantee expiresupon repayment of the debt which is due to be repaid by May 2013. The Company’s potential obligation under other guarantees is not material to theconsolidated financial statements. The Company does not expect to be required to make any payments related to these agreements and no liability has beenrecorded on the Company’s consolidated balance sheets for the years ended December 31, 2010 and 2009.
The Company had outstanding letters of credit of $15.2 and $13.2 at December 31, 2010 and 2009, respectively. These letters of credit relatedprimarily to the Company’s wholly-owned captive insurance subsidiary.
LeasesThe Company leases certain real and personal property under agreements that generally require the Company to pay for maintenance, insurance and
taxes. Lease expense was $51.8 in 2010, $51.1 in 2009 and $52.0 in 2008. The minimum future lease payments required under noncancellable operatingleases at December 31, 2010 in the aggregate, are $262.2 including the following amounts due in each of the next five years: 2011 - $41.2, 2012 - $31.4, 2013- $24.6, 2014 - $19.7 and 2015 - $17.7.
WarrantiesIn the normal course of business to facilitate sales of its products, the Company has issued product warranties, and it has entered into contracts and
purchase orders that often contain standard terms and conditions that typically include a warranty. The Company’s warranty activities do not have a materialimpact on the Company’s consolidated financial position or results of operations.
41

Table of Contents
NOTE 17 – RELATED PARTY TRANSACTIONSThe Company has transactions in the normal course of business with its shareholders, Dow Chemical and Corning and their affiliates. The following
tables summarize related party transactions for the year ended December 31 and balances with the Company’s shareholders as of December 31. 2010 2009 2008 Sales to Dow Chemical $ 14.4 $ 14.6 $12.9 Sales to Corning 19.3 17.1 13.8 Purchases from Dow Chemical 68.1 43.5 64.7
2010 2009 Accounts receivable from Dow Chemical $ 0.4 $ 0.8 Accounts receivable from Corning 1.2 1.1 Accounts payable to Dow Chemical 5.3 4.0
In addition, non-wholly owned consolidated subsidiaries of the Company have transactions in the normal course of business with their noncontrollingshareholders. The following tables summarize related party transactions for the year ended December 31 and balances between these non-wholly ownedconsolidated subsidiaries and their minority owners as of December 31. 2010 2009 2008 Sales to minority owners $ 483.9 $436.6 $383.1 Purchases from minority owners 275.9 77.8 85.3
2010 2009 Accounts receivable from minority owners $ 137.9 $ 80.3 Accounts payable to minority owners 8.1 3.3
Management believes the costs of such purchases and the prices for such sales were competitive with purchases from other suppliers and sales to othercustomers.
In addition, DCT loans excess funds to its minority shareholder Toray Industries, Inc. The amount of loans receivable at December 31, 2010 and 2009was $42.1 and $20.6, respectively. These balances are included in “Notes and other receivables” in the consolidated balance sheets. Management believes thatinterest earned from this loan arrangement is at rates commensurate with market rates for companies of similar credit standing.
In December 2009, the Company purchased an office building and technology center from Rohm & Haas Investment Holding Co. Ltd, a subsidiary ofThe Dow Chemical Company for approximately $47.2.
42

The Dow Chemical Company and Subsidiaries EXHIBIT 12.1
Computation of Ratio of Earnings to Fixed Charges and CombinedFixed Charges and Preferred Stock Dividend Requirements
For the Years Ended December 31
In millions, except ratio (Unaudited) 2010 2009 2008 2007 2006 Income from Continuing Operations Before Income Taxes $ 2,802 $ 469 $1,277 $ 4,192 $ 4,938 Add (deduct):
Equity in earnings of nonconsolidated affiliates (1,112) (630) (787) (1,122) (959) Distributed income of earnings of nonconsolidated affiliates 668 690 836 774 616 Capitalized interest (72) (61) (97) (85) (73) Amortization of capitalized interest 9 5 91 84 79 70 Preferred security dividends - (20) (63) (81) (77)
Adjusted earnings $ 2,381 $ 539 $1,250 $ 3,757 $4,515 Fixed charges:
Interest expense and amortization of debt discount 1,473 1,571 648 584 616 Capitalized interest 72 61 97 85 73 Preferred security dividends - 20 63 81 77 Rental expense – interest component 9 5 107 120 124 131 Total fixed charges $ 1,640 $1,759 $ 928 $ 874 $ 897
Earnings available for the payment of fixed charges $ 4,021 $ 2,298 $2,178 $ 4,631 $ 5,412 Ratio of earnings to fixed charges 2.5 1.3 2.3 5.3 6.0 Earnings required for combined fixed charges and preferred stock dividends:
Preferred stock dividends $ 340 $ 312 - - - Adjustment to pretax basis (at 35 percent) 183 168 - - - Preferred stock dividends - pretax $ 523 $ 480 - - -
Combined fixed charges and preferred stock dividend requirements $ 2,163 $ 2,239 $ 928 $ 874 $ 897 Ratio of earnings to combined fixed charges and preferred stock dividend requirements 1.9 1.0 2.3 5.3 6.0
175

EXHIBIT 21
Subsidiaries of The Dow Chemical CompanyAt December 31, 2010
Location* % Ownership
This list includes companies for which the effective ownership by The Dow Chemical Company is 50 percent or more. The Dow Chemical Company Delaware
Arabian Chemical Company (Latex) Ltd. (1) Saudi Arabia 50 Arabian Chemical Company (Polystyrene) Limited (1) Saudi Arabia 50 Battleground Water Company (73) Texas 9 Buildscape, LLC Delaware 100 CanStates Holdings Inc. Oklahoma 100
ANGUS Chemical Company Delaware 100 CD Polymers Inc. Delaware 100 Centen Ag Inc. Delaware 100
Dow AgroSciences LLC (9) Delaware 39 DowBrands Inc. (14) Delaware 8 Mycogen Corporation (13) California 12
Chemars III LLC Delaware 100 Chemtech II L.P. (8) Delaware 22 DC Partnership Management Inc. Delaware 100
DowBrands L.P. (6) Delaware 42 DCOMCO, Inc. Delaware 100 Denmerco Inc. Delaware 100 Dexco Polymers Operating Company LLC (1) Texas 50
Dexco Polymers LP (1) (18) Texas 1 Diamond Capital Management Inc. Delaware 100 DML Holding Inc. (30) Delaware 89
Rohm and Haas Canada Investments Inc./Placements Rohm et Haas Canada Inc. (56) Canada 1 Dofinco, Inc. Delaware 100 Dow Business Services LLC Delaware 100 Dow Capital International LLC Delaware 100 Dow Chemical (Australia) Limited Australia 100
Dow Australia Superannuation Fund A Pty Limited Australia 100 Dow Chemical (China) Investment Company Limited China 100
Dow Chemical (China) Company Limited China 100 Dow Chemical (Guangzhou) Company Limited China 100 Dow Chemical (Shanghai) Company Limited China 100 Dow Chemical (Zhangjiagang) Company Limited China 100 Guangdong Zhongshan Amerchol Specialty Chemicals Co., Ltd. China 90 Zhejiang Pacific Chemical Corporation China 100
Dow Chemical China Holdings Pte. Ltd. Singapore 100 Dow Chemical Delaware Corp. Delaware 100
Chemtech II L.P. (8) Delaware 73 Chemtech Portfolio Inc. (11) Texas 33 Chemtech Portfolio II Inc. Michigan 100
Dow Chemical International Ltd. Delaware 100 Dow Chemical Thailand Ltd. Thailand 100 Dow International Holdings Company (22) Delaware 1 Dow International Holdings S.A. (77) Switzerland 1 Pacific Plastics (Thailand) Limited (41) Thailand 51 Petroquimica-Dow S.A. (Petrodow) Chile 100
Dow Chemical Korea Limited (34) Korea 86 Dow Chemical (NZ) Limited New Zealand 100 Dow Chemical Pacific Limited Hong Kong 100 Dow Chemical Pacific (Singapore) Private Limited Singapore 100
Dow Chemical (Malaysia) Sdn. Bhd. Malaysia 100 Dow Chemical International Pvt. Ltd. (26) India 99 Dow Chemical Vietnam LLC Vietnam 100 PT Dow Indonesia (65) Indonesia 99
Dow Chemical (Singapore) Private Limited Singapore 100 Dow Chemical International Pvt. Ltd. (26) India 1 PT Dow Indonesia (65) Indonesia 1
176

Subsidiaries of The Dow Chemical CompanyAt December 31, 2010
Location* % Ownership
This list includes companies for which the effective ownership by The Dow Chemical Company is 50 percent or more. Dow Chemical Taiwan Limited Taiwan 100 Dow Chemical Telecommunications Corp. Delaware 100 Dow Credit Corporation Delaware 100 Dow Customs & Trade LLC Delaware 100 Dow Deutschland Inc. Delaware 100
Dow Chemical Inter-American Limited Delaware 100 Dow Quimica de Colombia S.A. (5) Colombia 10
Dow Deutschland Management Inc. Delaware 100 Dow Engineering Company Delaware 100
Dow Engineering, Inc. Michigan 100 Dow Environmental Inc. Delaware 100 Dow Financial Services Inc. Delaware 100 Dow Global Technologies LLC Delaware 100
Chemtech Portfolio Inc. (11) Texas 67 Stonehenge Community Development XVII, LLC Delaware 99
Dow Petrochemicals Holding LLC (42) Delaware 25 Daulat Holdco LLC Delaware 100
K-D Petrochemicals C.V. (1) (47) Netherlands 1 K-Dow Petrochemicals GmbH (1) Switzerland 50
K-D Petrochemicals C.V. (1) (47) Netherlands 47 Dow Technology Investments LLC (37) Delaware 50
Dow Holdings LLC Delaware 100 Dow Corning Corporation (82) Michigan 50 Dow Hydrocarbons and Resources LLC Delaware 100
Cayuse Pipeline, Inc. Texas 100 Dow Intrastate Gas Company Louisiana 100 Dow Pipeline Company Texas 100 K/D/S Promix, LLC (1) Texas 50 Midland Pipeline Corp. Delaware 100
Fort Saskatchewan Ethylene Storage Corporation (1) Canada 50 Fort Saskatchewan Ethylene Storage Limited Partnership (1) (12) Canada 1
DowBrands L.P. (6) Delaware 58 Dow Internacional Mexicana S.A. de C.V. Mexico 100 Dow International B.V. Netherlands 100 Dow International Financial Services Ireland 100
Dow Capital Public Limited Company Ireland 100 Dow International Holdings Company (22) Delaware 72
DC Spectrum Holding C.V. (38) Netherlands 99 Coöperatieve DC Prisma Holding U.A. (39) Netherlands 99
Dow Dutch Holding B.V. Netherlands 100 DC Galaxy Holding C.V. (40) Netherlands 1 Dow Europe Finance I B.V. Netherlands 100 Dow International Holdings S.A. (77) Switzerland 99
3243424 Nova Scotia Company Canada 100 DC Galaxy Holding C.V. (40) Netherlands 99
Dow Europe Holding B.V. Netherlands 100 BASF DOW HPPO B.V. (1) Netherlands 50 BASF DOW HPPO Technology B.V. (1) Netherlands 50 Control Securities Finance (Consecfin) B.V. Netherlands 100 DC Finance Canada B.V. Netherlands 100 Domaluna B.V. Netherlands 100 Dow Austria Gesellschaft m.b.H Austria 100 Dow Belgium B.V.B.A. Belgium 100 Dow Benelux B.V. Netherlands 100
Dow Netwerk B.V. Netherlands 100 Emergo Finance C.V. (1) Netherlands 50 Polyol Belgium B.V.B.A. (10) Belgium 99
177

Subsidiaries of The Dow Chemical CompanyAt December 31, 2010
Location* % Ownership
This list includes companies for which the effective ownership by The Dow Chemical Company is 50 percent or more. Valuepark Terneuzen Beheer B.V. (1) Netherlands 50
Valuepark Terneuzen C.V. (1) (25) Netherlands 1 Dow Beteiligungsgesellschaft mbH & Co. KG Germany 100
Dow Olefinverbund GmbH (44) Germany 5 Dow Chemical Company Limited United Kingdom 100
Autothane Limited United Kingdom 100 Cromarty Petroleum Company Limited (1) United Kingdom 50 Dow Chemical Services UK Limited United Kingdom 100 Dow Services Trustees UK Limited United Kingdom 100 Hyperlast Limited United Kingdom 100
ALH Rail Coatings Limited (1) United Kingdom 50 Hypertec Print Services Limited United Kingdom 100 Xitrack Limited (1) United Kingdom 50
Dow Chemical East Africa Limited (79) Kenya 90 Dow Chemical Iberica S.L. Spain 99
Terminal de Atraque de Productos Petroquimicos, AIE (1) Spain 50 Transformadora de Etileno A.I.E. (1) Spain 50
Dow Chemical Korea Limited (34) Korea 14 Dow Chemical OOO Russia 100 Dow Chemical Romania S.R.L. Romania 100 Dow Deutschland Verwaltungs Vertriebs GmbH Germany 100
Dow Deutschland Vertriebs GmbH & Co. OHG (76) Germany 30 Dow Europe GmbH Switzerland 100
Dolpa S.a.r.l. Luxembourg 100 Dow-GACL SolVenture Limited (1) India 50 Dow Chemical IMEA GmbH Switzerland 100 Dow Contract Services FZE Dubai 100 Dow Egypt Services Limited (43) Egypt 25 Dow Mideast Systems S.A.E. (JSC) (2) Egypt 1
Dow France S.A.S. France 100 Dow Hellas A.E. Greece 100 Dow Hungary Kft. Hungary 100 Dow InterBranch B.V. Netherlands 100
Business Process Service Center Terneuzen B.V. Netherlands 100 Dow Chemical East Africa Limited (79) Kenya 10 Dow Danmark A/S Denmark 100 Dow Mideast Systems S.A.E. (JSC) (2) Egypt 1 Dow Norge A/S Norway 100 Dow Saudi Arabia Company (35) Saudi Arabia 15 Dow Turkiye Kimya Sanayi ve Ticaret Limited Sirketi (3) Turkey 1 Dow Zwijndrecht B.V.B.A. (19) Belgium 1 Santa Vitoria Acucar e Alcool Ltda. (81) Brazil 50
Dow Italia s.r.l. Italy 100 Dow AgroSciences Italia s.r.l. Italy 100 Dow Italia Divisione Commerciale s.r.l Italy 100
Dow Mideast Systems S.A.E. (JSC) (2) Egypt 98 Dow Egypt Services Limited (43) Egypt 75
Dow Olefinverbund GmbH (44) Germany 95 ANGUS Chemie GmbH Germany 100
Dow Stade Produktions GmbH & Co. OHG (29) Germany 30 Dow Wolff Cellulosics GmbH & Co. OHG (36) Germany 50
Dow AgroSciences GmbH Germany 100 Dow Deutschland Anlagengesellschaft mbH Germany 100
Dow Wolff Cellulosics GmbH Germany 100 Probis GmbH Germany 100
UPPC GmbH Germany 100 UPPC Ltd. United Kingdom 100
178

Subsidiaries of The Dow Chemical CompanyAt December 31, 2010
Location* % Ownership
This list includes companies for which the effective ownership by The Dow Chemical Company is 50 percent or more. Dow MF Verwaltungs GmbH Germany 100
Dow MF Produktion GmbH & Co. OHG (74) Germany 30 Dow Pipeline Gesellschaft mbH & Co. KG Germany 80 Dow Pipeline Verwaltungsgesellschaft mbH Germany 80 SAFECHEM Europe GmbH Germany 100
Dow Deutschland Vertriebs GmbH & Co. OHG (76) Germany 70 Dow MF Produktion GmbH & Co. OHG (74) Germany 70 Dow Stade Produktions GmbH & Co. OHG (29) Germany 70 Dow Wolff Cellulosics GmbH & Co. OHG (36) Germany 50
Dow Plastics and Chemicals Holding B.V. Netherlands 100 K-D Petrochemicals C.V. (1) (47) Netherlands 1
Dow Polska Sp.z.o.o. Poland 100 Dow Portugal - Produtos Quimicos, Unipessoal, Lda. Portugal 100 Dow Saudi Arabia Company (35) Saudi Arabia 85 Dow Southern Africa (Pty) Ltd South Africa 100 Dow Suomi OY Finland 100 Dow Sverige AB Sweden 100 Dow Turkiye Kimya Sanayi ve Ticaret Limited Sirketi (3) Turkey 99 Dow (Wilton) Limited United Kingdom 100 Dow Zwijndrecht B.V.B.A. (19) Belgium 99 Edulan A/S Denmark 100
Edulan U.K. Limited United Kingdom 100 HPPO Holding & Finance C.V. (1) Netherlands 50 MEGlobal B.V. (1) Netherlands 50 MTP HPJV C.V. (83) Netherlands 50 MTP HPJV Management B.V. (83) Netherlands 50 Oman Petrochemical Industries Company LLC (1) Oman 50 Polyol Belgium B.V.B.A. (10) Belgium 1 RUS Polyurethanes Holding B.V. Netherlands 58
Dow Izolan OOO (45) Russia 100 Dow Izolan Ukraine LLC (46) Ukraine 100
UC Investment B.V. Netherlands 100 EQUATE Marketing Company E.C. (1) Bahrain 50
Rofan Automation and Information Systems B.V. Netherlands 100 Terneuzen Partnership Services B.V. Netherlands 100
Valuepark Terneuzen C.V. (1) (25) Netherlands 49 Dow Netherlands Investments LLC Delaware 100
Coöperatieve DC Prisma Holding U.A. (39) Netherlands 1 Dow Netherlands Holdings LLC Delaware 100
DC Spectrum Holding C.V. (38) Netherlands 1 DowBrands Inc. (14) Delaware 79
Dow International Technology Corporation Delaware 100 Dow Kakoh Kabushiki Kaisha Japan 65 Dow Pacific Holdings B.V. Netherlands 100 Dow Peru S.A. (24) Peru 91 Dow Petrochemicals Holding LLC (42) Delaware 25 Dow Quimica Argentina S.A. (20) Argentina 76 Dow Quimica Chilena S.A. (21) Chile 89 Dow Quimica de Colombia S.A. (5) Colombia 90 Dow Quimica Mexicana S.A. de C.V. (16) Mexico 85 Dow Roofing Systems LLC Delaware 100 Dow South Africa Holdings (Pty) Ltd. South Africa 100
Sentrachem Limited South Africa 100 Cisvaal (Proprietary) Limited South Africa 100 Minchem International Inc. South Africa 100 South African Polymer Holdings (PTY) Ltd. South Africa 100
Dow Trading S.A. Switzerland 100
179

Subsidiaries of The Dow Chemical CompanyAt December 31, 2010
Location* % Ownership
This list includes companies for which the effective ownership by The Dow Chemical Company is 50 percent or more. Dow Trent Limited United Kingdom 100
Dow UK Limited United Kingdom 100 Haltermann Limited United Kingdom 100
Ascot Investments Limited United Kingdom 100 Ascot Chemicals Limited United Kingdom 100
Haltermann Pension Trustees Limited United Kingdom 100 Suter Limited United Kingdom 100
Dow Venezuela, C.A. (7) Venezuela 36 Dow Verwaltungsgesellschaft mbH Germany 100 Dow-Mitsui Chlor-Alkali LLC (83) Delaware 50 DSL Holdings Inc. Delaware 100
Dow Reichhold Specialty Latex LLC (1) Delaware 50 DW Dexco Investment LLC Delaware 100
Dexco Polymers LP (1) (18) Texas 49 Equipolymers B.V. (1) Netherlands 50 Essex Chemical Corporation New Jersey 100 Essex Specialty Products LLC New Jersey 100
American Mortell Corporation Texas 100 Mortell Company Delaware 100
Dow Chemical (Wuhan) Company Limited China 100 Dow International Holdings Company (22) Delaware 8 GWN Holding, Inc. (31) Delaware 27
FilmTec Corporation Delaware 100 OMEX Overseas Holdings Inc. Virgin Islands 100
Zhejiang OMEX Environmental Engineering Co., Ltd. China 100 Flexible Products Company Georgia 100
Flexible Products Company of Canada, Inc Canada 100 Forbanco Inc. Delaware 100 General Latex and Chemical Corporation Massachusetts 100 GNS Enterprises, LLC Georgia 100 GNS Technologies, LLC Georgia 100 Great Western Pipeline Company, Inc. California 100 GWN Holding, Inc. (31) Delaware 66
Rohm and Haas Canada Investments Inc./Placements Rohm et Haas Canada Inc. (56) Canada 92 3243425 Nova Scotia Company Canada 100
Daulat Canada Holding LP (80) Canada 1 Dow Canada Holding LP (78) Canada 1 Rohm and Haas Canada LP (57) Canada 1
Dow Canada Holding LP (78) Canada 99 Daulat Canada Holding LP (80) Canada 99
3229809 Nova Scotia Company Canada 100 Dow Investment Argentina S.A. (48) Argentina 97
PBBPolisur S.A. (28) Argentina 72 PBBPolisur S.A. (28) Argentina 28
Dow Investment Argentina S.A. (48) Argentina 3 K-D Petrochemicals C.V. (1) (47) Netherlands 1 SD Group Service Co., Ltd. (1) Thailand 50
Siam Polyethylene Company Limited (1) (75) Thailand 2 Siam Polyethylene Company Limited (1) (75) Thailand 49
Dow Chemical Canada ULC Canada 100 3229897 Nova Scotia Company Canada 100 Dow Chemical Finance Canada ULC Canada 100
Modeland International Holdings Inc. (23) Barbados 59 Dow Brasil S.A. Brazil 100
Branco Dow Compostos de Engenharia Ltda. Brazil 100 Dopec Industria E Comercio Ltda. Brazil 100 Dow Especialidades Quimicas Ltda. Brazil 100
180

Subsidiaries of The Dow Chemical CompanyAt December 31, 2010
Location* % Ownership
This list includes companies for which the effective ownership by The Dow Chemical Company is 50 percent or more. Dow Brasil Sudeste Industrial Ltda. Brazil 100 Keytil Sociedad Anonima Uruguay 100 Santa Vitoria Acucar e Alcool Ltda. (81) Brazil 50
Fort Saskatchewan Ethylene Storage Limited Partnership (1) (12) Canada 49 H-D Tech Inc. (1) Canada 50 MEGlobal Canada Inc (1) Canada 50 Pétromont and Company, Limited Partnership (1) Canada 50 Pétromont Inc. (1) Canada 50
Rohm and Haas Canada LP (57) Canada 99 Ifco Inc. Delaware 100
Chemtech II L.P. (8) Delaware 5 Intarsia Corporation Delaware 99 Ion Holdings LLC (15) Delaware 60
Ion Investments S.a.r.l. Luxembourg 100 Liana Limited Delaware 100
Dorinco Insurance (Ireland) Limited Ireland 100 Dorinco Reinsurance Company Michigan 100 Dorintal Reinsurance Limited Bermuda 100
100 Independence Mall West LLC Delaware 100 Timber Insurance Limited Bermuda 100
Pacific Plastics (Thailand) Limited (41) Thailand 49 Raven Group Ltd. Delaware 100 RavenWorks Ltd. Delaware 100 Rofan Services Inc. Delaware 100
Dow AgroSciences LLC (9) Delaware 10 DowBrands Inc. (14) Delaware 2 Ion Holdings LLC (15) Delaware 40 Mycogen Corporation (13) California 88
Dow AgroSciences LLC (9) Delaware 51 Alsan Research (1) Iowa 50 Bayer DAS (Private) Ltd (1) Pakistan 50 DAS Agricultural Investment Holding Company Ltd. Mauritius 100
Dow AgroSciences India Pvt. Ltd. (27) India 1 Dow AgroSciences (China) Company Limited China 100
DERe Insurance Company Vermont 100 Dintec Agrichemicals LLC (1) Delaware 50 Dow AgroSciences Agricultural Products Limited Mauritius 100
Dow AgroSciences India Pvt. Ltd. (27) India 99 Dow AgroSciences B.V. Netherlands 100
Ambito DAS S.A. (1) Argentina 50 ChacoDAS S.A. (1) Argentina 50 DASER AGRO S.A. (1) Argentina 50 Desab S.A. (1) Argentina 50 Dintec Agroquimica Produtos Quimicos, Lda. Portugal 66 Dow AgroSciences A.S. Turkey 100 Dow AgroSciences Argentina S.A. (17) Argentina 89
Dow AgroSciences Bolivia S.A. (32) Bolivia 1 Dow AgroSciences Paraguay S.A. (33) Paraguay 1
Dow AgroSciences Asia Sdn. Bhd. Malaysia 100 Dow AgroSciences Australia Limited Australia 100 Dow AgroSciences Bolivia S.A. (32) Bolivia 98 Dow AgroSciences Canada Inc. Canada 100 Dow AgroSciences Chile S.A. Chile 100 Dow AgroSciences Costa Rica S.A. Costa Rica 100 Dow AgroSciences Danmark A/S Denmark 100 Dow AgroSciences de Colombia S.A. Colombia 100 Dow AgroSciences de Mexico S.A. de C.V. Mexico 100
181

Subsidiaries of The Dow Chemical CompanyAt December 31, 2010
Location* % Ownership
This list includes companies for which the effective ownership by The Dow Chemical Company is 50 percent or more. Dow AgroSciences Export S.A.S. France 100 Dow AgroSciences Guatemala S.A. Guatemala 100 Dow AgroSciences Iberica S.A. Spain 100 Dow AgroSciences Industrial Ltda. Brazil 100
Dow AgroSciences Sementes & Biotecnologia Brasil Ltda. Brazil 100 Dow AgroSciences Limited United Kingdom 100 Dow AgroSciences (Malaysia) Sdn Bhd Malaysia 100 Dow AgroSciences (NZ) Limited New Zealand 100 Dow AgroSciences OOO Russia 100 Dow AgroSciences Pacific Limited Hong Kong 100 Dow AgroSciences Paraguay S.A. (33) Paraguay 99
Dow AgroSciences Bolivia S.A. (32) Bolivia 1 Dow AgroSciences Polska Sp z.o.o. Poland 100 Dow AgroSciences S.A.S. France 100
Dow AgroSciences Distribution S.A.S. France 100 Dow AgroSciences s.r.o. Czech Republic 100 Dow AgroSciences Sverige A/B Sweden 100 Dow AgroSciences Taiwan Ltd. Taiwan 100 Dow AgroSciences Technology GmbH Switzerland 100
Dow AgroSciences Switzerland S.A. Switzerland 100 Dow AgroSciences Hungary Kft. Hungary 100
Dow AgroSciences Vertriebsgesellschaft m.b.H. Austria 100 Dow Chemical Japan Limited Japan 100 Dow Venezuela, C.A. (7) Venezuela 54 Fedea S.A. (1) Argentina 50 Forratec Argentina S.A. (1) Argentina 50 JV Agro S.A. (1) Argentina 50 P.T. Dow AgroSciences Indonesia Indonesia 95 Rindes y Cultivos DAS S.A. (1) Argentina 50 Terramar JV S.A. (1) Argentina 50 Ubajay DAS S.A. (1) Argentina 50
Dow AgroSciences China Ltd. Delaware 100 Dow AgroSciences International Ltd. Delaware 100
Dow AgroSciences (Thailand) Limited Thailand 100 Dow AgroSciences Southern Africa (Proprietary) Ltd. South Africa 100
Sanachem Zimbabwe (Pvt) Ltd. Zimbabwe 100 DowBrands Inc. (14) Delaware 11 Mycogen Crop Protection, Inc. California 100
Mycogen S.A. de C.V. (4) Mexico 99 Mycogen Plant Science, Inc. Delaware 100
Agrigenetics, Inc. Delaware 100 Agrigenetics Molokai LLC Hawaii 100 Brodbeck Seeds LLC Delaware 100 Dairyland Seed Co., Inc. Wisconsin 100 Dow AgroSciences Argentina S.A. (17) Argentina 11 Duo Maize B.V. Netherlands 100 Mycogen S.A. de C.V. (4) Mexico 1 Mycogen Seeds-Puerto Rico Corporation Delaware 100 Pfister Seeds LLC Delaware 100 Renze Seeds LLC Delaware 100 Texas Triumph Seed Co., Inc. Texas 100
Monterey Seed Company, Inc. Texas 100 Phytogen Seed Company, LLC Delaware 54
Wenben Inc. Delaware 100 Rohm and Haas Company Delaware 100
AgroFresh Inc. Illinois 100 Charles Lennig & Company LLC Delaware 100
182
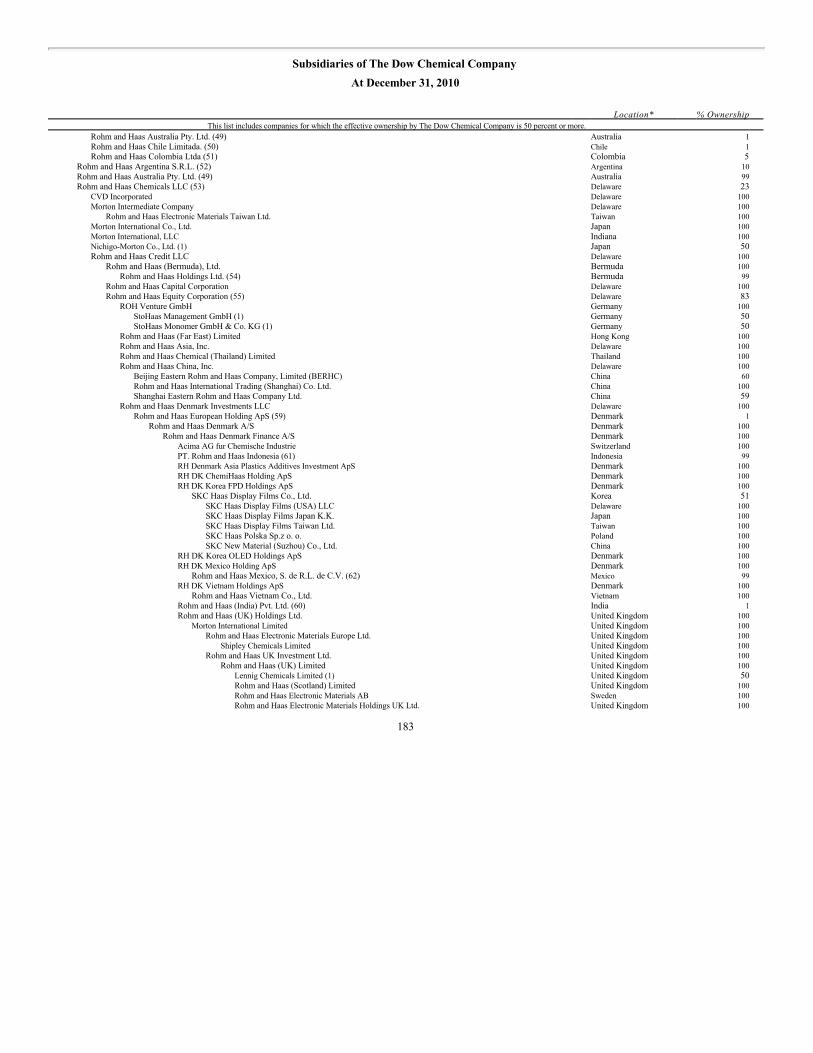
Subsidiaries of The Dow Chemical CompanyAt December 31, 2010
Location* % Ownership
This list includes companies for which the effective ownership by The Dow Chemical Company is 50 percent or more. Rohm and Haas Australia Pty. Ltd. (49) Australia 1 Rohm and Haas Chile Limitada. (50) Chile 1 Rohm and Haas Colombia Ltda (51) Colombia 5
Rohm and Haas Argentina S.R.L. (52) Argentina 10 Rohm and Haas Australia Pty. Ltd. (49) Australia 99 Rohm and Haas Chemicals LLC (53) Delaware 23
CVD Incorporated Delaware 100 Morton Intermediate Company Delaware 100
Rohm and Haas Electronic Materials Taiwan Ltd. Taiwan 100 Morton International Co., Ltd. Japan 100 Morton International, LLC Indiana 100 Nichigo-Morton Co., Ltd. (1) Japan 50 Rohm and Haas Credit LLC Delaware 100
Rohm and Haas (Bermuda), Ltd. Bermuda 100 Rohm and Haas Holdings Ltd. (54) Bermuda 99
Rohm and Haas Capital Corporation Delaware 100 Rohm and Haas Equity Corporation (55) Delaware 83
ROH Venture GmbH Germany 100 StoHaas Management GmbH (1) Germany 50 StoHaas Monomer GmbH & Co. KG (1) Germany 50
Rohm and Haas (Far East) Limited Hong Kong 100 Rohm and Haas Asia, Inc. Delaware 100 Rohm and Haas Chemical (Thailand) Limited Thailand 100 Rohm and Haas China, Inc. Delaware 100
Beijing Eastern Rohm and Haas Company, Limited (BERHC) China 60 Rohm and Haas International Trading (Shanghai) Co. Ltd. China 100 Shanghai Eastern Rohm and Haas Company Ltd. China 59
Rohm and Haas Denmark Investments LLC Delaware 100 Rohm and Haas European Holding ApS (59) Denmark 1
Rohm and Haas Denmark A/S Denmark 100 Rohm and Haas Denmark Finance A/S Denmark 100
Acima AG fur Chemische Industrie Switzerland 100 PT. Rohm and Haas Indonesia (61) Indonesia 99 RH Denmark Asia Plastics Additives Investment ApS Denmark 100 RH DK ChemiHaas Holding ApS Denmark 100 RH DK Korea FPD Holdings ApS Denmark 100
SKC Haas Display Films Co., Ltd. Korea 51 SKC Haas Display Films (USA) LLC Delaware 100 SKC Haas Display Films Japan K.K. Japan 100 SKC Haas Display Films Taiwan Ltd. Taiwan 100 SKC Haas Polska Sp.z o. o. Poland 100 SKC New Material (Suzhou) Co., Ltd. China 100
RH DK Korea OLED Holdings ApS Denmark 100 RH DK Mexico Holding ApS Denmark 100
Rohm and Haas Mexico, S. de R.L. de C.V. (62) Mexico 99 RH DK Vietnam Holdings ApS Denmark 100
Rohm and Haas Vietnam Co., Ltd. Vietnam 100 Rohm and Haas (India) Pvt. Ltd. (60) India 1 Rohm and Haas (UK) Holdings Ltd. United Kingdom 100
Morton International Limited United Kingdom 100 Rohm and Haas Electronic Materials Europe Ltd. United Kingdom 100
Shipley Chemicals Limited United Kingdom 100 Rohm and Haas UK Investment Ltd. United Kingdom 100
Rohm and Haas (UK) Limited United Kingdom 100 Lennig Chemicals Limited (1) United Kingdom 50 Rohm and Haas (Scotland) Limited United Kingdom 100 Rohm and Haas Electronic Materials AB Sweden 100 Rohm and Haas Electronic Materials Holdings UK Ltd. United Kingdom 100
183

Subsidiaries of The Dow Chemical CompanyAt December 31, 2010
Location* % Ownership
This list includes companies for which the effective ownership by The Dow Chemical Company is 50 percent or more. Rohm and Haas Argentina S.R.L. (52) Argentina 90 Rohm and Haas Bermuda Partner I GP (63) Bermuda 46
Rohm and Haas Denmark Bermuda GP ApS Denmark 100 Rohm and Haas Bermuda GP (64) Bermuda 47
Rohm and Haas Denmark Holding Company ApS Denmark 100 Finndisp Ltd. Russia 100 Limited Liability Company “Rohm and Haas” Russia 100 Limited Liability Company “Rohm and Haas Khimicheskiye Tekhnologii” Russia 100 Rohm and Haas B.V. Netherlands 100 Rohm and Haas Espana Production Holding, S.L. Spain 100
Rohm and Haas Espana, S.L. Spain 100 Rohm and Haas Europe Sales ApS Denmark 100
Rohm and Haas International SNC (69) France 1 Rohm and Haas Europe Services ApS Denmark 100 Rohm and Haas Europe Trading ApS Denmark 100
RH Switzerland Production Holding GmbH Switzerland 100 Rohm and Haas Electronic Materials Schweiz GmbH Switzerland 100
RH Deutschland Produktion Holding GmbH Germany 100 Rohm and Haas Deutschland Produktion GmbH & Co. KG Germany 100
Rohm and Haas Nordiska AB Sweden 100 Rohm and Haas South Africa (PTY) Limited South Africa 100
Rohm and Haas France Finance SAS France 100 Rohm and Haas Italia S.r.l. Italy 100 Rohm and Haas Kimya Sanayi Limited Sirketi (66) Turkey 99 Rohm and Haas Kimya Ticaret Limited Sirketi (67) Turkey 99 Rohm and Haas Kimyasal Urunler Uretim Dagitim ve Ticaret A.S. (68) Turkey 59 Rohm and Haas International SNC (69) France 99
RH France Production Holding SAS France 100 Rohm and Haas France S.A.S. France 100
Morton International S.A.S. France 100 Rohm and Haas Electronic Materials SAS France 100
Rohm and Haas Polska Sp. z o.o. Poland 100 Rohm and Haas Bermuda Partner II GP (70) Bermuda 99
Rohm and Haas Bermuda GP (64) Bermuda 53 Rohm and Haas Chemicals Singapore Pte. Ltd. Singapore 100 Rohm and Haas China Holding ApS Denmark 100
Rohm and Haas (China) Holding Co., Ltd. China 100 Rohm and Haas China Investment Holding Company Ltd Mauritius 100 Rohm and Haas Denmark Bermuda Holding Company ApS Denmark 100
RH Asia Holding GmbH Switzerland 100 Rohm and Haas Electronic Materials Asia Limited Hong Kong 100
RH Denmark Dongguan Holding Company ApS Denmark 100 Rohm and Haas Electronic Materials (Shanghai) Ltd. China 100 Rohm and Haas Electronic Materials Singapore Pte. Ltd. (71) Singapore 50 Rohm and Haas HK China Investments Limited Hong Kong 100
Rohm and Haas Electronic Materials Singapore Pte. Ltd. (71) Singapore 50 Rohm and Haas Bermuda Partner I GP (63) Bermuda 53
Rohm and Haas Denmark China Investment ApS Denmark 100 PT. Rohm and Haas Indonesia (61) Indonesia 1 Rohm and Haas Bermuda Partner I GP (63) Bermuda 1 Rohm and Haas Bermuda Partner II GP (70) Bermuda 1 Rohm and Haas Latinoamerica, S. de R.L. de C.V. (72) Mexico 1 Rohm and Haas Mexico, S. de R.L. de C.V. (62) Mexico 1 Rohm and Haas Shanghai Chemical Industry Co., Ltd. China 100
Rohm and Haas Finland Oy Finland 100 Rohm and Haas HK Dongguan Holding Limited Hong Kong 100
Rohm and Haas Electronic Materials Dongguan Ltd. China 100
184

Subsidiaries of The Dow Chemical CompanyAt December 31, 2010
Location* % Ownership
This list includes companies for which the effective ownership by The Dow Chemical Company is 50 percent or more. Rohm and Haas India Investment ApS Denmark 100
Rohm and Haas (India) Pvt. Ltd. (60) India 99 Rohm and Haas Kimya Sanayi Limited Sirketi (66) Turkey 1 Rohm and Haas Kimya Ticaret Limited Sirketi (67) Turkey 1 Rohm and Haas Kimyasal Urunler Uretim Dagitim ve Ticaret A.S. (68) Turkey 1 Rohm and Haas Latinoamerica, S. de R.L. de C.V. (72) Mexico 99 Rohm and Haas Nederland B.V. Netherlands 100 Rohm and Haas Singapore (Pte.) Ltd. Singapore 100
Rohm and Haas European Holding ApS (59) Denmark 99 Rohm and Haas German Real Estate GmbH Germany 100 Rohm and Haas Korea Co., Ltd. Korea 100 Rohm and Haas Luxembourg Holding S.a.r.l. Luxembourg 100
Rohm and Haas Canada Finance Company/Compagnie de Finance Rohm et Haas Canada Canada 100 Rohm and Haas Canada Investments Inc./Placements Rohm et Haas Canada Inc. (56) Canada 8 Rohm and Haas Texas Incorporated Texas 100
Battleground Water Company (73) Texas 52 ROH Monomer Holding Company Delaware 100 Rohm and Haas Investment Holdings Inc. (58) Delaware 27
Rohm and Haas Malaysia Sdn Bhd Malaysia 100 Rohm and Haas Holdings Ltd. (54) Bermuda 1
Rohm and Haas Equity Corporation (55) Delaware 12 Rohm and Haas Wood Treatment LLC Delaware 100
Rohm and Haas Chile Limitada. (50) Chile 99 Rohm and Haas Colombia Ltda (51) Colombia 95 Rohm and Haas de Venezuela, C.A. Venezuela 100 Rohm and Haas Electronic Materials K.K. Japan 100
LeaRonal Japan Y.K. Japan 100 Rohm and Haas Japan Kabushiki Kaisha Japan 100
Japan Acrylic Chemical Co., Ltd. Japan 100 Rohm and Haas Equity Corporation (55) Delaware 2 Rohm and Haas Holdings LLC Delaware 100
Rohm and Haas Chemicals LLC (53) Delaware 76 Rohm and Haas Electronic Materials Holdings, Inc. Delaware 100
Rohm and Haas Electronic Materials CMP Inc. Delaware 100 Rohm and Haas Electronic Materials CMP Asia Inc. Delaware 80
Nitta Haas Trading Company Japan 100 Rohm and Haas Electronic Materials CMP Korea Ltd. Korea 100 Rohm and Haas Electronic Materials CMP Sdn. Bhd. Malaysia 100
Rohm and Haas Electronic Materials CMP Europe GmbH Germany 100 Rohm and Haas Electronic Materials CMP Holdings, Inc. Delaware 100 Rohm and Haas International Holdings Inc. Delaware 100
Rohm and Haas Asia Holdings B.V. Netherlands 100 Rohm and Haas Electronic Materials Asia-Pacific Co., Ltd. Taiwan 100 Rohm and Haas Electronic Materials Korea Ltd. Korea 100 Rohm and Haas Japan Holdings Y.K. Japan 100
Nitta Haas Incorporated (83) Japan 50 Rodel Particles, Inc. Japan 100
Rohm and Haas Taiwan, Inc. Taiwan 100 Rohm and Haas Electronic Materials LLC Delaware 100
Rohm and Haas Equity Corporation (55) Delaware 3 Rohm and Haas Latin America, Inc. Delaware 100
Rohm and Haas Chemicals LLC (53) Delaware 1 Rohm and Haas Vermont Company Vermont 100
Rohm and Haas Investment Holdings Inc. (58) Delaware 64 Rohm and Haas New Zealand Limited New Zealand 100 Rohm and Haas Philippines, Inc. Philippines 100 Rohm and Haas Quimica Ltda. Brazil 100
185
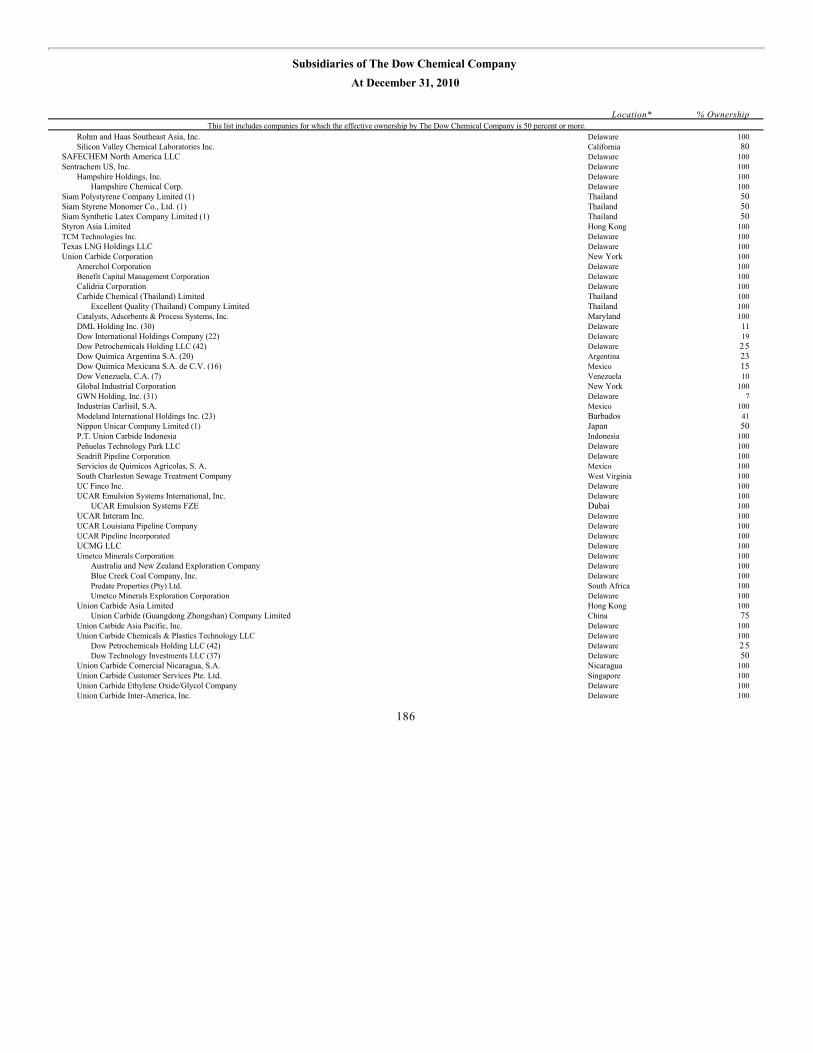
Subsidiaries of The Dow Chemical CompanyAt December 31, 2010
Location* % Ownership
This list includes companies for which the effective ownership by The Dow Chemical Company is 50 percent or more. Rohm and Haas Southeast Asia, Inc. Delaware 100 Silicon Valley Chemical Laboratories Inc. California 80
SAFECHEM North America LLC Delaware 100 Sentrachem US, Inc. Delaware 100
Hampshire Holdings, Inc. Delaware 100 Hampshire Chemical Corp. Delaware 100
Siam Polystyrene Company Limited (1) Thailand 50 Siam Styrene Monomer Co., Ltd. (1) Thailand 50 Siam Synthetic Latex Company Limited (1) Thailand 50 Styron Asia Limited Hong Kong 100 TCM Technologies Inc. Delaware 100 Texas LNG Holdings LLC Delaware 100 Union Carbide Corporation New York 100
Amerchol Corporation Delaware 100 Benefit Capital Management Corporation Delaware 100 Calidria Corporation Delaware 100 Carbide Chemical (Thailand) Limited Thailand 100
Excellent Quality (Thailand) Company Limited Thailand 100 Catalysts, Adsorbents & Process Systems, Inc. Maryland 100 DML Holding Inc. (30) Delaware 11 Dow International Holdings Company (22) Delaware 19 Dow Petrochemicals Holding LLC (42) Delaware 25 Dow Quimica Argentina S.A. (20) Argentina 23 Dow Quimica Mexicana S.A. de C.V. (16) Mexico 15 Dow Venezuela, C.A. (7) Venezuela 10 Global Industrial Corporation New York 100 GWN Holding, Inc. (31) Delaware 7 Industrias Carlisil, S.A. Mexico 100 Modeland International Holdings Inc. (23) Barbados 41 Nippon Unicar Company Limited (1) Japan 50 P.T. Union Carbide Indonesia Indonesia 100 Peñuelas Technology Park LLC Delaware 100 Seadrift Pipeline Corporation Delaware 100 Servicios de Quimicos Agricolas, S. A. Mexico 100 South Charleston Sewage Treatment Company West Virginia 100 UC Finco Inc. Delaware 100 UCAR Emulsion Systems International, Inc. Delaware 100
UCAR Emulsion Systems FZE Dubai 100 UCAR Interam Inc. Delaware 100 UCAR Louisiana Pipeline Company Delaware 100 UCAR Pipeline Incorporated Delaware 100 UCMG LLC Delaware 100 Umetco Minerals Corporation Delaware 100
Australia and New Zealand Exploration Company Delaware 100 Blue Creek Coal Company, Inc. Delaware 100 Predate Properties (Pty) Ltd. South Africa 100 Umetco Minerals Exploration Corporation Delaware 100
Union Carbide Asia Limited Hong Kong 100 Union Carbide (Guangdong Zhongshan) Company Limited China 75
Union Carbide Asia Pacific, Inc. Delaware 100 Union Carbide Chemicals & Plastics Technology LLC Delaware 100
Dow Petrochemicals Holding LLC (42) Delaware 25 Dow Technology Investments LLC (37) Delaware 50
Union Carbide Comercial Nicaragua, S.A. Nicaragua 100 Union Carbide Customer Services Pte. Ltd. Singapore 100 Union Carbide Ethylene Oxide/Glycol Company Delaware 100 Union Carbide Inter-America, Inc. Delaware 100
186
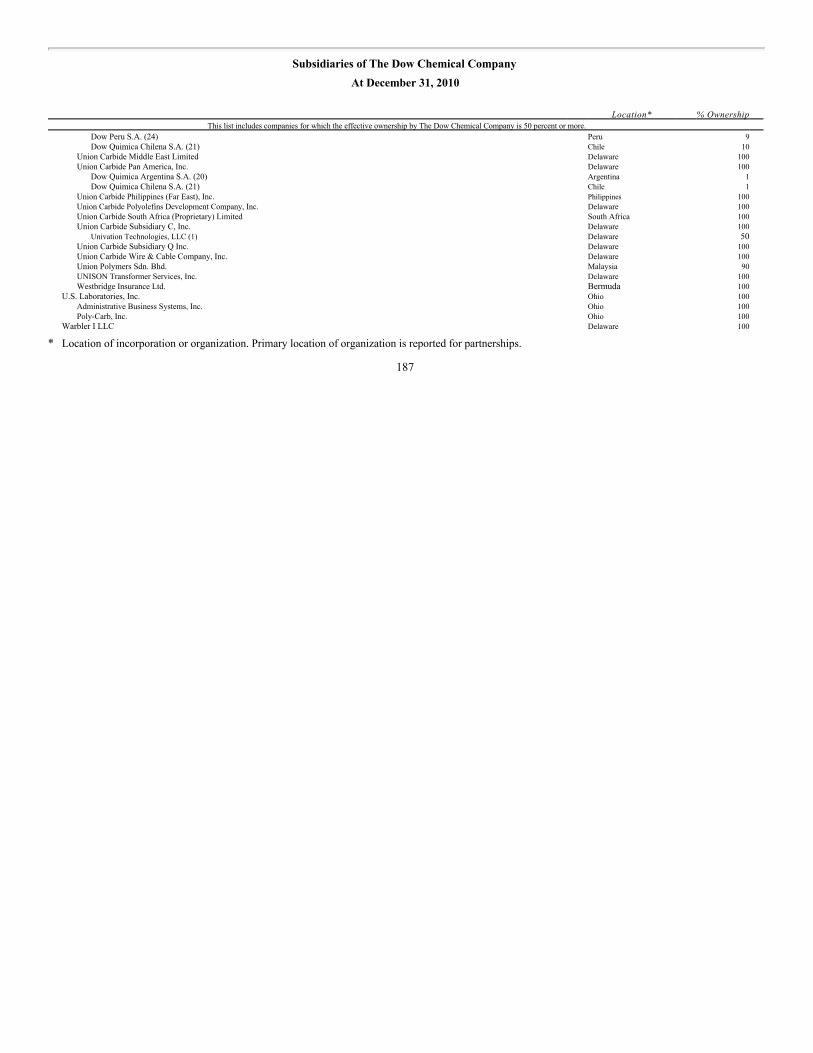
Subsidiaries of The Dow Chemical CompanyAt December 31, 2010
Location* % Ownership
This list includes companies for which the effective ownership by The Dow Chemical Company is 50 percent or more. Dow Peru S.A. (24) Peru 9 Dow Quimica Chilena S.A. (21) Chile 10
Union Carbide Middle East Limited Delaware 100 Union Carbide Pan America, Inc. Delaware 100
Dow Quimica Argentina S.A. (20) Argentina 1 Dow Quimica Chilena S.A. (21) Chile 1
Union Carbide Philippines (Far East), Inc. Philippines 100 Union Carbide Polyolefins Development Company, Inc. Delaware 100 Union Carbide South Africa (Proprietary) Limited South Africa 100 Union Carbide Subsidiary C, Inc. Delaware 100
Univation Technologies, LLC (1) Delaware 50 Union Carbide Subsidiary Q Inc. Delaware 100 Union Carbide Wire & Cable Company, Inc. Delaware 100 Union Polymers Sdn. Bhd. Malaysia 90 UNISON Transformer Services, Inc. Delaware 100 Westbridge Insurance Ltd. Bermuda 100
U.S. Laboratories, Inc. Ohio 100 Administrative Business Systems, Inc. Ohio 100 Poly-Carb, Inc. Ohio 100
Warbler I LLC Delaware 100
* Location of incorporation or organization. Primary location of organization is reported for partnerships.
187

Subsidiaries of The Dow Chemical CompanyAt December 31, 2010
(1) These companies are 50%-owned, nonconsolidated affiliates of The Dow Chemical Company and are accounted for on the equity basis. Separate
financial statements for these companies are not included in this Annual Report on Form 10-K. These companies are not controlled, directly orindirectly, by The Dow Chemical Company. Subsidiaries of these companies, if any, are not listed in this Exhibit 21.
(2) The Dow Chemical Company effective ownership of Dow Mideast Systems S.A.E. (JSC) is 100% of which Dow Europe Holding B.V. owns99.96%, Dow Europe GmbH owns 0.020% and Dow InterBranch B.V. owns 0.020%.
(3) The Dow Chemical Company effective ownership of Dow Turkiye Kimya Sanayi ve Ticaret Ltd Sirketi is 100% of which Dow Europe Holding B.V.owns 99.9988% and Dow InterBranch B.V. owns 0.0012%.
(4) The Dow Chemical Company effective ownership of Mycogen S.A. de C.V. is 100% of which Mycogen Crop Protection, Inc. owns 99% andAgrigenetics, Inc. owns 1%.
(5) The Dow Chemical Company effective ownership of Dow Quimica de Colombia S.A. is 100% of which The Dow Chemical Company owns 90% andDow Chemical Inter-American Limited owns 10%.
(6) The Dow Chemical Company effective ownership of DowBrands L.P. is 100% of which Dow Holdings LLC owns 58% and DC PartnershipManagement Inc. owns 42%.
(7) The Dow Chemical Company effective ownership of Dow Venezuela, C.A. is 100% of which Dow AgroSciences B.V. owns 53.84%, The DowChemical Company owns 36.06% and Union Carbide Corporation owns 10.1%.
(8) The Dow Chemical Company effective ownership of Chemtech II L.P. is 100% of which Dow Chemical Delaware Corp. owns 72.46%, The DowChemical Company owns 22.39% and Ifco Inc. owns 5.15%.
(9) The Dow Chemical Company effective ownership of Dow AgroSciences LLC is 100% of which Mycogen Corporation owns 51%, Centen Ag Inc.owns 38.91% and Rofan Services Inc. owns 10.09%.
(10) The Dow Chemical Company effective ownership of Polyol Belgium B.V.B.A. is 100% of which Dow Benelux B.V. owns 99.5% and Dow EuropeHolding B.V. owns 0.5%.
(11) The Dow Chemical Company effective ownership of Chemtech Portfolio Inc. is 100% of which Dow Global Technologies Inc. owns 66.82% andChemtech II L.P. owns 33.18%.
(12) The Dow Chemical Company effective ownership of Fort Saskatchewan Ethylene Storage Limited Partnership is 50% of which Dow ChemicalCanada ULC owns 49.9% and Fort Saskatchewan Ethylene Storage Corporation owns 0.2%. (Midland Pipeline Corp. owns 50% of FortSaskatchewan Ethylene Storage Corporation.)
(13) The Dow Chemical Company effective ownership of Mycogen Corporation is 100% of which Rofan Services Inc. owns 88.11% and Centen Ag Inc.owns 11.89%.
(14) The Dow Chemical Company effective ownership of DowBrands Inc. is 100% of which Dow International Holdings Company owns 79%, MycogenCorporation owns 11%, Centen Ag Inc. owns 8% and Rofan Services Inc. owns 2%.
(15) The Dow Chemical Company effective ownership of Ion Holdings LLC is 100% of which The Dow Chemical Company owns 60% and RofanServices Inc. owns 40%.
(16) The Dow Chemical Company effective ownership of Dow Quimica Mexicana S.A. de C.V. is 100% of which The Dow Chemical Company owns84.58% and Union Carbide Corporation owns 15.42%.
(17) The Dow Chemical Company effective ownership of Dow AgroSciences Argentina S.A. is 100% of which Dow AgroSciences B.V. owns 89.13% andAgrigenetics, Inc. owns 10.87%.
(18) The Dow Chemical Company effective ownership of Dexco Polymers LP is 50% of which DW Dexco Investment LLC owns 49.5% and DexcoPolymers Operating Company LLC owns 1%. (The Dow Chemical Company owns 50% of Dexco Polymers Operating Company LLC).
(19) The Dow Chemical Company effective ownership of Dow Zwijndrecht B.V.B.A. is 100% of which Dow Europe Holding B.V. owns 99.65% and DowInterBranch B.V. owns 0.35%.
(20) The Dow Chemical Company effective ownership of Dow Quimica Argentina S.A. is 100% of which The Dow Chemical Company owns 76.70%,Union Carbide Corporation owns 23.20% and Union Carbide Pan America, Inc. owns 0.10%.
(21) The Dow Chemical Company effective ownership of Dow Quimica Chilena S.A. is 100% of which The Dow Chemical Company owns 89.81%,Union Carbide Inter-America, Inc. owns 10.16% and Union Carbide Pan America, Inc. owns 0.03%.
(22) The Dow Chemical Company effective ownership of Dow International Holdings Company is 100% of which The Dow Chemical Company owns72.0268%, Union Carbide Corporation owns 19.1341%, Essex Specialty Products LLC owns 8.7988% and Dow Chemical International Ltd owns0.0403%.
(23) The Dow Chemical Company effective ownership of Modeland International Holdings Inc. is 100% of which Dow Chemical Finance Canada ULCowns 59.1% and Union Carbide Corporation owns 40.9%.
(24) The Dow Chemical Company effective ownership of Dow Peru S.A. is 100% of which The Dow Chemical Company owns 91.21% and UnionCarbide Inter-America, Inc. owns 8.79%.
188

Subsidiaries of The Dow Chemical CompanyAt December 31, 2010
(25) The Dow Chemical Company effective ownership of Valuepark Terneuzen C.V. is 50% of which Terneuzen Partnership Services B.V. owns 49.82%
and Valuepark Terneuzen Beheer B.V. owns 0.36%. (Dow Benelux B.V. owns 50% of Valuepark Terneuzen Beheer BV).(26) The Dow Chemical Company effective ownership of Dow Chemical International Pvt. Ltd. is 100% of which Dow Chemical Pacific (Singapore)
Private Limited owns 99.99% and Dow Chemical (Singapore) Private Limited owns 0.01%.(27) The Dow Chemical Company effective ownership of Dow AgroSciences India Pvt. Ltd. is 100% of which Dow AgroSciences Agricultural Products
Limited owns 99.99% and DAS Agricultural Investment Holding Company Ltd. owns 0.01%.(28) The Dow Chemical Company effective ownership of PBBPolisur S.A. is 100% of which Dow Investment Argentina S.A. owns 72% and 3229809
Nova Scotia Company owns 28%.(29) The Dow Chemical Company effective ownership of Dow Stade Produktions GmbH & Co. OHG is 100% of which SAFECHEM Europe GmbH
owns 70% and ANGUS Chemie GmbH owns 30%. Dow Europe Holding B.V acts as a general partner with 0% capital participation.(30) The Dow Chemical Company effective ownership of DML Holding Inc. is 100% of which The Dow Chemical Company owns 88.84% and Union
Carbide Corporation owns 11.16%.(31) The Dow Chemical Company effective ownership of GWN Holding, Inc. is 100% of which The Dow Chemical Company owns 66.23%, Essex
Specialty Products LLC owns 26.93% and Union Carbide Corporation owns 6.84%.(32) The Dow Chemical Company effective ownership of Dow AgroSciences Bolivia S.A. is 100% of which Dow AgroSciences B.V. owns 99%, Dow
AgroSciences Argentina S.A. owns 0.5% and Dow AgroSciences Paraguay S.A. owns 0.5%.(33) The Dow Chemical Company effective ownership of Dow AgroSciences Paraguay S.A. is 100% of which Dow AgroSciences B.V. owns 99.99% and
Dow AgroSciences Argentina S.A. owns 0.01%.(34) The Dow Chemical Company effective ownership of Dow Chemical Korea Limited is 100% of which The Dow Chemical Company owns 85.82%
and Dow Europe Holding B.V. owns 14.18%.(35) The Dow Chemical Company effective ownership of Dow Saudi Arabia Company is 100% of which Dow Europe Holding B.V. owns 85% and Dow
Interbranch B.V. owns 15%.(36) The Dow Chemical Company effective ownership of Dow Wolff Cellulosics GmbH & Co. OHG is 100% of which ANGUS Chemie GmbH owns
50% and SAFECHEM Europe GmbH owns 50%. Dow Europe Holding B.V. acts as general partner with 0% capital participation.(37) The Dow Chemical Company effective ownership of Dow Technology Investments LLC is 100% of which Dow Global Technologies Inc. owns 50%
and Union Carbide Chemicals & Plastics Technology LLC owns 50%.(38) The Dow Chemical Company effective ownership of DC Spectrum Holding C.V. is 100% of which Dow International Holdings Company owns
99.999% and Dow Netherlands Holdings LLC owns 0.001%.(39) The Dow Chemical Company effective ownership of Coöperatieve DC Prisma Holding U.A. is 100% of which DC Spectrum Holding C.V. owns
99.999% and Dow Netherlands Investments LLC owns .001%.(40) The Dow Chemical Company effective ownership of DC Galaxy Holding C.V. is 100% of which Dow International Holdings S.A. owns 99.928% and
Dow Dutch Holding B.V. owns 0.072%.(41) The Dow Chemical Company effective ownership of Pacific Plastics (Thailand) Limited is 100% of which Dow Chemical International Ltd. owns
51% and The Dow Chemical Company owns 49%.(42) The Dow Chemical Company effective ownership of Dow Petrochemicals Holding LLC is 100% of which The Dow Chemical Company owns 25%,
Dow Global Technologies Inc. owns 25%, Union Carbide Corporation owns 25% and Union Carbide Chemicals & Plastics Technology LLC owns25%.
(43) The Dow Chemical Company effective ownership of Dow Egypt Services Limited is 100% of which Dow Mideast Systems S.A.E. (JSC) owns 75%and Dow Europe GmbH owns 25%.
(44) The Dow Chemical Company effective ownership of Dow Olefinverbund GmbH is 100% of which Dow Europe Holding B.V. owns 95% and DowBeteiligungsgesellschaft mbH & Co. KG owns 5%.
(45) The Dow Chemical Company effective ownership of Dow Izolan OOO is 58% via its ownership interest in RUS Polyurethanes Holding B.V.(46) The Dow Chemical Company effective ownership of Dow Izolan Ukraine LLC is 58% via its ownership interest in RUS Polyurethanes Holding B.V.(47) The Dow Chemical Company effective ownership of K-D Petrochemicals C.V. is 50% of which Daulat Holdco LLC owns .00058011%, Dow Plastics
and Chemicals Holding B.V. owns .00058011%, Daulat Canada Holding LP owns .00058011% and K-Dow Petrochemicals GmbH owns99.99651933% (Dow Petrochemicals Holding LLC owns 50% of K-Dow Petrochemicals GmbH.)
189
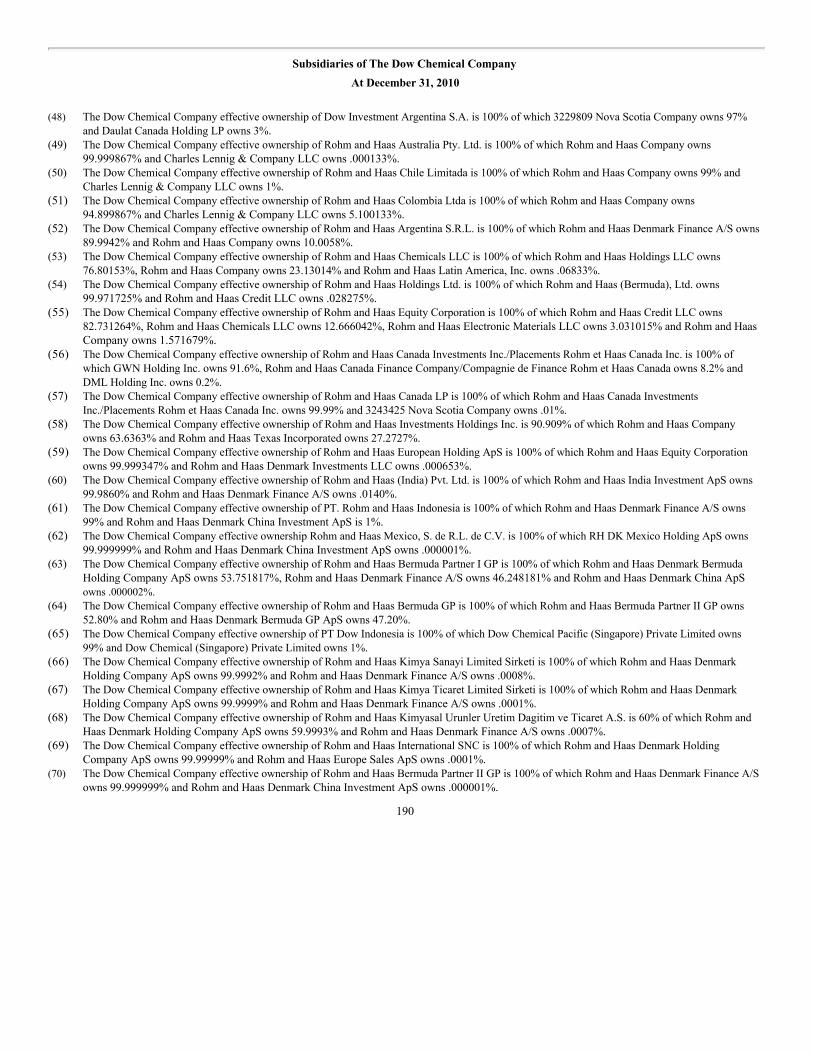
Subsidiaries of The Dow Chemical CompanyAt December 31, 2010
(48) The Dow Chemical Company effective ownership of Dow Investment Argentina S.A. is 100% of which 3229809 Nova Scotia Company owns 97%
and Daulat Canada Holding LP owns 3%.(49) The Dow Chemical Company effective ownership of Rohm and Haas Australia Pty. Ltd. is 100% of which Rohm and Haas Company owns
99.999867% and Charles Lennig & Company LLC owns .000133%.(50) The Dow Chemical Company effective ownership of Rohm and Haas Chile Limitada is 100% of which Rohm and Haas Company owns 99% and
Charles Lennig & Company LLC owns 1%.(51) The Dow Chemical Company effective ownership of Rohm and Haas Colombia Ltda is 100% of which Rohm and Haas Company owns
94.899867% and Charles Lennig & Company LLC owns 5.100133%.(52) The Dow Chemical Company effective ownership of Rohm and Haas Argentina S.R.L. is 100% of which Rohm and Haas Denmark Finance A/S owns
89.9942% and Rohm and Haas Company owns 10.0058%.(53) The Dow Chemical Company effective ownership of Rohm and Haas Chemicals LLC is 100% of which Rohm and Haas Holdings LLC owns
76.80153%, Rohm and Haas Company owns 23.13014% and Rohm and Haas Latin America, Inc. owns .06833%.(54) The Dow Chemical Company effective ownership of Rohm and Haas Holdings Ltd. is 100% of which Rohm and Haas (Bermuda), Ltd. owns
99.971725% and Rohm and Haas Credit LLC owns .028275%.(55) The Dow Chemical Company effective ownership of Rohm and Haas Equity Corporation is 100% of which Rohm and Haas Credit LLC owns
82.731264%, Rohm and Haas Chemicals LLC owns 12.666042%, Rohm and Haas Electronic Materials LLC owns 3.031015% and Rohm and HaasCompany owns 1.571679%.
(56) The Dow Chemical Company effective ownership of Rohm and Haas Canada Investments Inc./Placements Rohm et Haas Canada Inc. is 100% ofwhich GWN Holding Inc. owns 91.6%, Rohm and Haas Canada Finance Company/Compagnie de Finance Rohm et Haas Canada owns 8.2% andDML Holding Inc. owns 0.2%.
(57) The Dow Chemical Company effective ownership of Rohm and Haas Canada LP is 100% of which Rohm and Haas Canada InvestmentsInc./Placements Rohm et Haas Canada Inc. owns 99.99% and 3243425 Nova Scotia Company owns .01%.
(58) The Dow Chemical Company effective ownership of Rohm and Haas Investments Holdings Inc. is 90.909% of which Rohm and Haas Companyowns 63.6363% and Rohm and Haas Texas Incorporated owns 27.2727%.
(59) The Dow Chemical Company effective ownership of Rohm and Haas European Holding ApS is 100% of which Rohm and Haas Equity Corporationowns 99.999347% and Rohm and Haas Denmark Investments LLC owns .000653%.
(60) The Dow Chemical Company effective ownership of Rohm and Haas (India) Pvt. Ltd. is 100% of which Rohm and Haas India Investment ApS owns99.9860% and Rohm and Haas Denmark Finance A/S owns .0140%.
(61) The Dow Chemical Company effective ownership of PT. Rohm and Haas Indonesia is 100% of which Rohm and Haas Denmark Finance A/S owns99% and Rohm and Haas Denmark China Investment ApS is 1%.
(62) The Dow Chemical Company effective ownership Rohm and Haas Mexico, S. de R.L. de C.V. is 100% of which RH DK Mexico Holding ApS owns99.999999% and Rohm and Haas Denmark China Investment ApS owns .000001%.
(63) The Dow Chemical Company effective ownership of Rohm and Haas Bermuda Partner I GP is 100% of which Rohm and Haas Denmark BermudaHolding Company ApS owns 53.751817%, Rohm and Haas Denmark Finance A/S owns 46.248181% and Rohm and Haas Denmark China ApSowns .000002%.
(64) The Dow Chemical Company effective ownership of Rohm and Haas Bermuda GP is 100% of which Rohm and Haas Bermuda Partner II GP owns52.80% and Rohm and Haas Denmark Bermuda GP ApS owns 47.20%.
(65) The Dow Chemical Company effective ownership of PT Dow Indonesia is 100% of which Dow Chemical Pacific (Singapore) Private Limited owns99% and Dow Chemical (Singapore) Private Limited owns 1%.
(66) The Dow Chemical Company effective ownership of Rohm and Haas Kimya Sanayi Limited Sirketi is 100% of which Rohm and Haas DenmarkHolding Company ApS owns 99.9992% and Rohm and Haas Denmark Finance A/S owns .0008%.
(67) The Dow Chemical Company effective ownership of Rohm and Haas Kimya Ticaret Limited Sirketi is 100% of which Rohm and Haas DenmarkHolding Company ApS owns 99.9999% and Rohm and Haas Denmark Finance A/S owns .0001%.
(68) The Dow Chemical Company effective ownership of Rohm and Haas Kimyasal Urunler Uretim Dagitim ve Ticaret A.S. is 60% of which Rohm andHaas Denmark Holding Company ApS owns 59.9993% and Rohm and Haas Denmark Finance A/S owns .0007%.
(69) The Dow Chemical Company effective ownership of Rohm and Haas International SNC is 100% of which Rohm and Haas Denmark HoldingCompany ApS owns 99.99999% and Rohm and Haas Europe Sales ApS owns .0001%.
(70) The Dow Chemical Company effective ownership of Rohm and Haas Bermuda Partner II GP is 100% of which Rohm and Haas Denmark Finance A/Sowns 99.999999% and Rohm and Haas Denmark China Investment ApS owns .000001%.
190

Subsidiaries of The Dow Chemical CompanyAt December 31, 2010
(71) The Dow Chemical Company effective ownership of Rohm and Haas Electronic Materials Singapore Pte. Ltd. is 100% of which Rohm and Haas
Electronic Materials Asia Limited owns 50% and RH Asia Holding GmbH owns 50%.(72) The Dow Chemical Company effective ownership of Rohm and Haas Latinoamerica, S. DE R.L. DE C.V. is 100% of which Rohm and Haas
Denmark Finance A/S owns 99.999999% and Rohm and Haas Denmark China Investment ApS owns .000001%.(73) The Dow Chemical Company effective ownership of Battleground Water Company is 60.61% of which Rohm and Haas Texas Incorporated owns
51.77% and The Dow Chemical Company owns 8.84%.(74) The Dow Chemical Company effective ownership of Dow MF Produktion GmbH & Co. OHG is 100% of which SAFECHEM Europe GmbH owns
70% and Dow MF Verwaltungs GmbH owns 30%. Dow Europe Holding B.V. acts as a general partner with 0% capital participation.(75) The Dow Chemical Company effective ownership of Siam Polyethylene Company Limited is 50% of which Daulat Canada Holding LP owns 49%
and SD Group Service Co. Ltd., which is 50%-owned by The Dow Chemical Company, owns 2%.(76) The Dow Chemical Company effective ownership of Dow Deutschland Vertriebs GmbH & Co. OHG is 100% of which SAFECHEM Europe GmbH
owns 70% and Dow Deutschland Verwaltungs Vertriebs GmbH owns 30%. Dow Europe Holding B.V. acts as a general partner with 0% capitalparticipation.
(77) The Dow Chemical Company effective ownership of Dow International Holdings S.A. is 100% of which Dow Dutch Holding B.V. owns 99.824% andDow Chemical International Ltd. owns 0.176%.
(78) The Dow Chemical Company effective ownership of Dow Canada Holding LP is 100% of which Rohm and Haas Canada Investments Inc./PlacementsRohm et Haas Canada Inc. owns 99.9999% and 3243425 Nova Scotia Company owns 0.0001%.
(79) The Dow Chemical Company effective ownership of Dow Chemical East Africa Limited is 100% of which Dow Europe Holding B.V. owns 90% andDow InterBranch B.V. owns 10%.
(80) The Dow Chemical Company effective ownership of Daulat Canada Holding LP is 100% of which Dow Canada Holding LP owns 99.9999% and3243425 Nova Scotia Company owns 0.0001%.
(81) The Dow Chemical Company effective ownership of Santa Vitoria Acucar e Alcool Ltda. Is 100% of which Dow Brasil S.A. owns 50% and DowInterBranch B.V owns 50%.
(82) Dow Corning Corporation is a 50%-owned, nonconsolidated affiliate of The Dow Chemical Company and is accounted for on the equity basis. As asignificant subsidiary, separate financial statements for Dow Corning Corporation are presented in this Annual Report on Form 10-K pursuant to Rule3-09 of Regulation S-X. Subsidiaries of Dow Corning Corporation, if any, are not listed in this Exhibit 21.
(83) These companies are 50%-owned, consolidated affiliates of The Dow Chemical Company. Subsidiaries of these companies, if any, are not listed inthis Exhibit 21.
191

Consent of Independent Registered Public Accounting Firm EXHIBIT 23(a)
We consent to the incorporation by reference of our reports dated February 18, 2011, relating to the consolidated financial statements and financial statementschedule of The Dow Chemical Company and subsidiaries (the “Company”), and the effectiveness of the Company’s internal control over financial reporting,appearing in this Annual Report on Form 10-K of The Dow Chemical Company for the year ended December 31, 2010, in the following RegistrationStatements of The Dow Chemical Company: Form S-3:
No. 333-140859
Form S-4:
No. 333-88443
Form S-8:
Nos. 2-64560 33-21748 33-51453 33-52841 33-58205 33-61795 333-27381 333-40271 333-43730 333-49183 333-67414 333-88443 333-91027 333-103518 333-103519 333-105080 333-115185 333-122932 333-145015 333-162910 333-170384
/s/ DELOITTE & TOUCHE LLPDeloitte & Touche LLPMidland, MichiganFebruary 18, 2011
192

Analysis, Research & Planning Corporation’s Consent EXHIBIT 23(b)
The Dow Chemical Company:
Analysis, Research & Planning Corporation (“ARPC”) hereby consents to the use of ARPC’s name and the reference to ARPC’s reports in this Annual Reporton Form 10-K of The Dow Chemical Company for the year ended December 31, 2010, and the incorporation by reference thereof in the following RegistrationStatements of The Dow Chemical Company: Form S-3:
No. 333-140859
Form S-4:
No. 333-88443
Form S-8:
Nos. 2-64560 33-21748 33-51453 33-52841 33-58205 33-61795 333-27381 333-40271 333-43730 333-49183 333-67414 333-88443 333-91027 333-103518 333-103519 333-105080 333-115185 333-122932 333-145015 333-162910 333-170384
/S/ B. THOMAS FLORENCEB. Thomas FlorencePresidentAnalysis, Research & Planning CorporationFebruary 16, 2011
193

Consent of Independent Registered Public Accounting Firm EXHIBIT 23(c)
We hereby consent to the incorporation by reference in the Registration Statements on Form S-3 (No. 333-140859), Form S-4 (No. 333-88443) and Form S-8(Nos. 2-64560, 33-21748, 33-51453, 33-52841, 33-58205, 33-61795, 333-27381, 333-40271, 333-43730, 333-49183, 333-67414, 333-88443, 333-91027,333-103518, 333-103519, 333-105080, 333-115185, 333-122932, 333-145015, 333-162910 and 333-170384) of The Dow Chemical Company of our reportdated February 7, 2011, relating to the financial statements of Dow Corning Corporation, which appears in this Form 10-K. /s/ PricewaterhouseCoopers LLPDetroit, MichiganFebruary 17, 2011
194

The Dow Chemical Company and Subsidiaries EXHIBIT 31(a)
Certification Pursuant to Section 302 of the Sarbanes-Oxley Act of 2002
I, Andrew N. Liveris, certify that:
1. I have reviewed this annual report on Form 10-K of The Dow Chemical Company;
2. Based on my knowledge, this report does not contain any untrue statement of a material fact or omit to state a material fact necessary to make thestatements made, in light of the circumstances under which such statements were made, not misleading with respect to the period covered by this report;
3. Based on my knowledge, the financial statements, and other financial information included in this report, fairly present in all material respects thefinancial condition, results of operations and cash flows of the registrant as of, and for, the periods presented in this report;
4. The registrant’s other certifying officer and I are responsible for establishing and maintaining disclosure controls and procedures (as defined inExchange Act Rules 13a-15(e) and 15d-15(e)) and internal control over financial reporting (as defined in Exchange Act Rules 13a-15(f) and 15d-15(f))for the registrant and have:
a) designed such disclosure controls and procedures, or caused such disclosure controls and procedures to be designed under our supervision, to
ensure that material information relating to the registrant, including its consolidated subsidiaries, is made known to us by others within thoseentities, particularly during the period in which this report is being prepared;
b) designed such internal control over financial reporting, or caused such internal control over financial reporting to be designed under our
supervision, to provide reasonable assurance regarding the reliability of financial reporting and the preparation of financial statements for externalpurposes in accordance with generally accepted accounting principles;
c) evaluated the effectiveness of the registrant’s disclosure controls and procedures and presented in this report our conclusions about the
effectiveness of the disclosure controls and procedures, as of the end of the period covered by this report based on such evaluation; and
d) disclosed in this report any change in the registrant’s internal control over financial reporting that occurred during the registrant’s most recent
fiscal quarter (the registrant’s fourth fiscal quarter in the case of an annual report) that has materially affected, or is reasonably likely to materiallyaffect, the registrant’s internal control over financial reporting; and
5. The registrant’s other certifying officer and I have disclosed, based on our most recent evaluation of internal control over financial reporting, to theregistrant’s auditors and the audit committee of registrant’s board of directors (or persons performing the equivalent function):
a) all significant deficiencies and material weaknesses in the design or operation of internal control over financial reporting which are reasonably
likely to adversely affect the registrant’s ability to record, process, summarize and report financial information; and
b) any fraud, whether or not material, that involves management or other employees who have a significant role in the registrant’s internal control
over financial reporting.
Date: February 18, 2011
/s/ ANDREW N. LIVERISAndrew N. Liveris
President, Chief Executive Officer andChairman of the Board
195

The Dow Chemical Company and Subsidiaries EXHIBIT 31(b)
Certification Pursuant to Section 302 of the Sarbanes-Oxley Act of 2002
I, William H. Weideman, certify that:
1. I have reviewed this annual report on Form 10-K of The Dow Chemical Company;
2. Based on my knowledge, this report does not contain any untrue statement of a material fact or omit to state a material fact necessary to make thestatements made, in light of the circumstances under which such statements were made, not misleading with respect to the period covered by this report;
3. Based on my knowledge, the financial statements, and other financial information included in this report, fairly present in all material respects thefinancial condition, results of operations and cash flows of the registrant as of, and for, the periods presented in this report;
4. The registrant’s other certifying officer and I are responsible for establishing and maintaining disclosure controls and procedures (as defined inExchange Act Rules 13a-15(e) and 15d-15(e)) and internal control over financial reporting (as defined in Exchange Act Rules 13a-15(f) and 15d-15(f))for the registrant and have:
a) designed such disclosure controls and procedures, or caused such disclosure controls and procedures to be designed under our supervision, to
ensure that material information relating to the registrant, including its consolidated subsidiaries, is made known to us by others within thoseentities, particularly during the period in which this report is being prepared;
b) designed such internal control over financial reporting, or caused such internal control over financial reporting to be designed under our
supervision, to provide reasonable assurance regarding the reliability of financial reporting and the preparation of financial statements for externalpurposes in accordance with generally accepted accounting principles;
c) evaluated the effectiveness of the registrant’s disclosure controls and procedures and presented in this report our conclusions about the
effectiveness of the disclosure controls and procedures, as of the end of the period covered by this report based on such evaluation; and
d) disclosed in this report any change in the registrant’s internal control over financial reporting that occurred during the registrant’s most recent
fiscal quarter (the registrant’s fourth fiscal quarter in the case of an annual report) that has materially affected, or is reasonably likely to materiallyaffect, the registrant’s internal control over financial reporting; and
5. The registrant’s other certifying officer and I have disclosed, based on our most recent evaluation of internal control over financial reporting, to theregistrant’s auditors and the audit committee of registrant’s board of directors (or persons performing the equivalent function):
a) all significant deficiencies and material weaknesses in the design or operation of internal control over financial reporting which are reasonably
likely to adversely affect the registrant’s ability to record, process, summarize and report financial information; and
b) any fraud, whether or not material, that involves management or other employees who have a significant role in the registrant’s internal control
over financial reporting.
Date: February 18, 2011
/s/ WILLIAM H. WEIDEMANWilliam H. Weideman
Executive Vice President and Chief Financial Officer
196

The Dow Chemical Company and Subsidiaries EXHIBIT 31(a)
Certification Pursuant to Section 906 of the Sarbanes-Oxley Act of 2002
I, Andrew N. Liveris, President, Chief Executive Officer and Chairman of the Board of The Dow Chemical Company (the “Company”), certify that:
1. the Annual Report on Form 10-K of the Company for the year ended December 31, 2010 as filed with the Securities and Exchange Commission (the“Report”) fully complies with the requirements of Section 13(a) or 15(d) of the Securities Exchange Act of 1934; and
2. the information contained in the Report fairly presents, in all material respects, the financial condition and results of operations of the Company.
/s/ ANDREW N. LIVERISAndrew N. LiverisPresident, Chief Executive Officer andChairman of the BoardFebruary 18, 2011
197

The Dow Chemical Company and Subsidiaries EXHIBIT 31(b)
Certification Pursuant to Section 906 of the Sarbanes-Oxley Act of 2002
I, William H. Weideman, Executive Vice President and Chief Financial Officer of The Dow Chemical Company (the “Company”), certify that:
1. the Annual Report on Form 10-K of the Company for the year ended December 31, 2010 as filed with the Securities and Exchange Commission (the“Report”) fully complies with the requirements of Section 13(a) or 15(d) of the Securities Exchange Act of 1934; and
2. the information contained in the Report fairly presents, in all material respects, the financial condition and results of operations of the Company. /s/ WILLIAM H. WEIDEMANWilliam H. WeidemanExecutive Vice President and Chief Financial OfficerFebruary 18, 2011
198


®™ The DOW Diamond Logo and Human Element and design are trademarks of The Dow Chemical Company © 2011
™ AERIFY, AIRSTONE, AVANSE, DOWTHERM, ECOLIBRIUM, ELEVATE, ENLIGHT, EXZACT, FILMTEC, METHOCEL, POWERHOUSE, STYROFOAM and WALOCEL are trademarks of The Dow Chemical Company (“Dow”) or an affiliated company of Dow
™ SmartStax multi-event technology developed by Dow AgroSciences and Monsanto SmartStax and the SmartStax logo are trademarks of Monsanto Technology, LLC
™ Refuge Advanced is a trademark of Dow AgroSciences LLC ® ValuePark is a registerd trademark of Dow Olefinverbund GmbH ® WideStrike is a registered trademark of Dow AgroSciences LLC
™ GlyTol is a proprietary technology developed by Bayer CropScience
® Keep America Beautiful is a registered trademark of Keep America Beautiful, Inc ® Responsible Care is a registered service mark of the American Chemistry Council
The Dow Chemical CompanyMidland, MI 48674 U.S.A.
Investor Relations
(800) 422 8193(989) 636 1463
www.dow.com/financial
Form No. 161-00760