
The Return to a University Education in Great Britainftp.iza.org/dp1199.pdfIZA Discussion Paper No....
37
IZA DP No. 1199 The Return to a University Education in Great Britain Peter J. Sloane Nigel C. O'Leary DISCUSSION PAPER SERIES Forschungsinstitut zur Zukunft der Arbeit Institute for the Study of Labor June 2004
Transcript of The Return to a University Education in Great Britainftp.iza.org/dp1199.pdfIZA Discussion Paper No....
IZA DP No. 1199
The Return to a UniversityEducation in Great Britain
Peter J. SloaneNigel C. O'Leary
DI
SC
US
SI
ON
PA
PE
R S
ER
IE
S
Forschungsinstitutzur Zukunft der ArbeitInstitute for the Studyof Labor
June 2004

The Return to a University Education in Great Britain
Peter J. Sloane University of Wales Swansea
and IZA Bonn
Nigel C. O'Leary University of Wales Swansea
Discussion Paper No. 1199 June 2004
IZA
P.O. Box 7240 53072 Bonn
Germany
Phone: +49-228-3894-0 Fax: +49-228-3894-180
Email: [email protected]
Any opinions expressed here are those of the author(s) and not those of the institute. Research disseminated by IZA may include views on policy, but the institute itself takes no institutional policy positions. The Institute for the Study of Labor (IZA) in Bonn is a local and virtual international research center and a place of communication between science, politics and business. IZA is an independent nonprofit company supported by Deutsche Post World Net. The center is associated with the University of Bonn and offers a stimulating research environment through its research networks, research support, and visitors and doctoral programs. IZA engages in (i) original and internationally competitive research in all fields of labor economics, (ii) development of policy concepts, and (iii) dissemination of research results and concepts to the interested public. IZA Discussion Papers often represent preliminary work and are circulated to encourage discussion. Citation of such a paper should account for its provisional character. A revised version may be available on the IZA website (www.iza.org) or directly from the author.
IZA Discussion Paper No. 1199 June 2004
ABSTRACT
The Return to a University Education in Great Britain∗
In this paper, we estimate the rate of return to first degrees, masters degrees and PhDs in Britain using data from the Labour Force Survey. We estimate returns to broad subject groups and more narrowly defined disciplines, distinguishing returns by gender and attempting to control for variations in student quality across disciplines. The results reveal considerable heterogeneity in returns to particular degree programmes and by gender, which have important policy implications for charging students for the costs of their education. JEL Classification: I2, J0, J3 Keywords: education, wages Corresponding author: Nigel C. O’Leary Department of Economics University of Wales Swansea Swansea SA2 8PP Wales Email: [email protected]
∗ Material from the Labour Force Survey is Crown Copyright: it has been made available by the Office for National Statistics through The Data Archive and has been used by permission. Neither the ONS nor The Data Archive bear any responsibility for the analysis or interpretation of the data reported here.
1
1. Introduction There has been a substantial increase in the number of individuals obtaining a degree in
Britain, beginning in the 1960s, accelerating in the 1970s, slowing in the 1980s and
speeding up again in the 1990s. Walker and Zhu (2003) show that the proportion of
young people studying full-time in universities increased from 13% in 1980 to 33% in
2000 and the Labour Government has expressed a desire to see this figure rise to 50%.
This in turn has raised the issue of how the increase in the age participation rates in
higher education is to be financed. In the White Paper, The Future of Higher Education
(2003) the Government announced its intention to introduce from 2006 a new Graduate
Contribution Scheme under which universities would be allowed to charge fees up to
£3,000 per year for each course with payments by students deferred until after they had
graduated. Payments after graduation would be through the tax system, linked to ability
to pay with the threshold at which graduates would have to start repaying their fee
contribution and maintenance loan fixed at £15,000. These proposals have, at the time of
writing, still to be ratified by parliament. In making the case for a greater contribution by
students to the costs of their own education, reliance has been placed on estimates of the
lifetime earnings differential of graduates over non-graduates. The Department of
Education and Skills have calculated this to be as much as £400,000 (see Greenaway and
Haynes, 2003). However, the proposed policy does not distinguish between different
types of degree programmes, which may offer different potential returns or different
institutions where the same considerations apply, though some institutions may choose
not to increase fees to the maximum level allowed.
The purpose of this paper is to cast some light on these issues by estimating the current
returns to different degree programmes, using the Labour Force Survey (LFS), by
classifying degree programmes into broad groups, narrow disciplines and higher degrees.
We cover the period 1994 to 2002, a time of sustained economic growth and falling
unemployment in the UK, pooling the results to achieve more robust sample sizes. We
then turn to gender differences in rates of return, which in part may result from
differences in choices of degree programmes. Using decomposition analysis, we estimate
2
the effect of such choices on the gender wage gap. Finally, we draw some conclusions for
policy.
In addition to using the most recent LFS data, we diverge from earlier studies by
focussing on returns to particular undergraduate degree programmes, differentiated by
gender, with controls for varying student quality and by examining returns to higher
degree programmes, also at a disaggregated level in so far as sample size constraints
allow.
2. Previous Work
Most studies do not control for field of study despite the fact that rates of return vary
substantially across disciplines. This is at least in part a consequence of the fact that few
data sets differentiate type as opposed to level of study. As Harkness and Machin (1999)
note, returns to fields of study may be influenced by changes in the numbers entering
particular degree programmes. Thus, while the number of graduates overall increased
between 1980-2 and 1993-5, the proportion studying in Arts fell from 15 to 11% for men
and from 38 to 25% for women. At the same time the proportion studying in Science and
Engineering rose from 40 to 45% for men and from 15 to 24% for women. Subsequently,
this pattern seems to have been reversed. An interesting question is whether these
changes reflect changes in the demand for particular types of graduate or are independent
of them, although this is not an issue that we address in this paper given the nature of our
data set.
Blundell et al. (2000), using National Child Development Study data, found that males
had rates of return which were particularly lower in Biology, Chemistry, Environmental
Sciences and Geography than the base group (no information available), while for
women the pattern was rather different, with higher returns in particular in Economics,
Accountancy and Law. Chevalier and Walker (2000), using General Household Survey
data over the period 1980/2 to 1993/5, found that returns to men rose across all subjects
until the late 1980s and then fell for all disciplines other than Arts/Humanities, where the
returns in any event were never significantly different from zero. For women, returns rose

3
in Arts/Humanities and in Science (including Medicine and Engineering) and decreased
elsewhere. Blackaby, Murphy and O’Leary, using Labour Force Survey data for 1993-95,
found that rates of return for men varied between 9.0% in Arts and 34.2% in Economics,
Accountancy, Law and Management (with returns in Medicine at 51.5%). For women,
rates of return varied between 26.2% in other Social Sciences to 46.9% in Architecture
and Building (with Medicine at 55.4%). All their estimates are relative to those whose
highest qualification is at least one A-level and control for a wide range of variables.
Walker and Zhu (2003) conducted a similar analysis, using the Labour Force Survey over
the period 1993 to 2001, finding that Law, Health, Economics and Business, and
Mathematics had considerably higher returns than Arts, Education and other Social
Sciences. Their results are not directly comparable to those of Blackaby et al. as the
comparison is with those having at least two A-levels and excludes those living in
Scotland, immigrants and those aged below 25 and above 59.1
As well as type of degree, other relevant explanatory variables are type of institution and
class of degree obtained, but even fewer data sets include these variables. One such data
set is a survey organised by the University of Birmingham for the Dearing Committee in
the Winter of 1996 which included cohorts of graduates in 1985 and 1990 surveyed 1
year, 6 years and in the latter case 11 years after graduation. Using this data set Battu,
Belfield and Sloane (1999) found that class of degree had a significant effect on graduate
earnings both 1 year and 6 years after graduation with a first class degree having a
premium of 8–13% over a lower second class honours. Similarly, the institution from
which one graduated mattered, with those graduating from more established (pre-1992)
universities earning 8–11% more than those graduating from former polytechnics;
Chevalier and Conlon (2003) distinguish between three categories of university – the
Russell Group (large research based universities), other old universities (pre-1992) and
modern universities (post-1992). Male graduates from the Russell Group earn between
4% and 12% more than those from modern universities, ceteris paribus. There are
1 These findings are not dissimilar to those reported in the USA. For an analysis of returns to studying
economics see Black, Sanders and Taylor (2003). They find that economists do well whether or not they do
a higher degree.

4
substantial disparities even with the Russell group. Comparing the returns to graduates
from two high quality institutions with a control institution within the group it was found
that graduates from the former two institutions earned between 9 and 10 per cent more
than those from the latter. These factors may become even more important over time, as
the higher education system expands.2
Part of the return to particular disciplines may reflect a quality effect, if more able
students are attracted to particular disciplines and less able students to other disciplines.3
Leslie (2003) hypotheses that the more able students will self-select into the more
difficult subjects and using University College Admissions Service (UCAS) applications
data over the period 1996-2001 develops a unidimensional measure of quality on a scale
figure 0 (lowest) to 1 (highest) for a total of 170 broad subject groups. These rankings are
based on the average success rate of each qualification in gaining entry. For 22 broad
subject areas, the range is from 0.614 in the case of other General and Combined Studies
to 0.863 in the case of Medicine and Dentistry. For all 170 subject groups, the range is
0.447 in the case of Social Work to 0.882 in the case of Pre-Clinical Dentistry.4
Two studies have attempted to deal directly with the heterogeneity of students and the
sorting problem. Chevalier and Conlon (2003) note that if there were perfect sorting of
the able into more prestigious institutions (disciplines) there would be a lack of common
support problem. However, they argue that the application process will create some
disparities between the academic ability of students and the quality of the institution
2 As Bratti and Mancini (2003) put it, “As more individuals experience higher education, just holding a
university degree becomes a weaker distinguishing mark for students and a less informative screening
device for the talent at the disposal of employers, if not supplemented by information on the graduate’s
awarding university, field of study, or degree class obtained.” 3 Similar sorting may occur in relation to institutions, but in both cases class of degree should be affected if
standards are similar across disciplines and institutions. 4 He also uses a logit model that estimates the probability of acceptance controlling for social class,
ethnicity, school background and time effects in addition to qualifications. There is, in fact, little difference
in the two methods of analysis. We make use of these quality scales to adjust rate of return estimates in our
analysis below.
5
(discipline) chosen, allowing for the use of propensity score matching (Rosenbaum and
Rubin, 1983). This compares occupational earnings for individuals who graduate in one
subject with matched individuals who studied for a different degree. The propensity score
is defined as the conditional probability of receiving the treatment given an individual’s
characteristics. Their matching estimates range from 1 to 6% as opposed to 4 to 12%
using OLS estimation. Neither OLS nor propensity score matching deal, however, with
the problem of self-selection with respect to unobservable characteristics. Bratti and
Mancini (2003) use OLS, propensity score matching and a simultaneous model of
graduate earnings and subject choice, following Lee (1983), to analyse early occupational
earnings of UK male graduates over the period 1980 – 1993. They define five broad
disciplinary areas and control for family background, schooling and personal
characteristics. They obtain very different results using the simultaneous model from
those produced by OLS or propensity score matching. In particular, the last two of these
methods seem to produce positive selection bias in relation to one of the five disciplinary
groups (high tech). However, their data do not seem ideal. Their University Statistical
Research data contain information on occupation six months after graduation, but no
information on earnings. Their occupational data, with corresponding gender-specific 3
digit SOCs, are from the New Earnings Survey, with occupational earnings then
computed as the average gross weekly pay of individuals employed full-time (in the same
occupation) in the year following graduation. The literature on over- and under-education
suggests, however, that the NES occupations will include substantial numbers of non-
graduates in what are presumed to be graduate level occupations, and their approach
provides no information on intra-occupational variations in pay.
In all disciplines, the returns to education are higher for women than for men as a
consequence of the lower comparator group earnings in the case of women, but the
differences tend to be greater for arts and education graduates. While the effect of higher
education is to reduce the gender pay gap, women tend to select those disciplines which
lead to lower lifetime earnings. Thus, Machin and Puhani (2003) found that controlling
for subject of degree explained a significant part of the gender wage gap amongst
graduates. Further, in their most detailed subject specification (124 subjects) the increase
6
in the part of the explained wage gap due to subject dummies doubles for the UK.5
Chevalier (2002) argues that much of the unexplained component of the graduate gender
wage gap may be accounted for by differences in tastes and socialisation. He utilises a
1996 survey of graduates which includes twenty questions on character traits, motivations
and expectations. By including variables not typically included in wage decompositions
he is able to explain 84% of the gender wage gap, which itself is only 12.4% in raw
terms.
To summarise, there is considerable heterogeneity in the returns to undertaking a degree
according to the discipline and the motivation and performance of the student, with
differences also across these dimensions according to gender.
3. Methodology
Assume a standard OLS human capital model in which
ii
J
jjijij XSLnE εβα ++= ∑
=1
[1]
where Eit are the hourly earnings of individual i who graduated is subject j (j=1...J), Sij is
a dummy variable which takes the value of 1 if individual i graduated in that subject and
zero otherwise, αj is the earnings premium of graduating from subject j relative to the
default case, Xi is a vector of personal characteristics which affects both subject choice
and occupational earnings, β is a conformable vector of estimated rewards to these
characteristics and εi is a random error term. Without controls for ability, α reflects both
the ability of particular disciplines to attract good students and the value placed on that
discipline by the labour market. As outlined earlier, we therefore attempt to correct for
this by utilising Leslie’s degree acceptance quality variable (A). Thus we have:
5 Some studies in the US have found that up to 40 or 50% of the gender pay gap can be explained by
differences in degree subject. However, Joy (2003) finds that subject choice has been changing, with
women now much more likely to study business, science, maths and engineering than in the past.
According to her analysis of 1993/4 data, gender differences in choice of subject now account for less than
10% of the gender wage gap with labour market variables being much more important. Interestingly,
women in the sample had a higher grade point average than men – 3.21 as opposed to 3.08.

7
iijj
J
jijij XASLnE εβγα +++= ∑
=1
[2]
where γ will measure the return to student ability and α will now reflect only the market
return to subject j. An inherent problem with using α to measure the return to subjects in
this way, though, is that it imposes a constant estimated wage structure between subject j
and the default case i.e. β and γ will be assumed constant between all subject groups and
α will merely be picking up an OLS intercept shift. However, by allowing both intercepts
and slope coefficients to differ in the estimation framework we can draw a true picture of
the relationship between earnings and educational outcomes. Thus, assume that we are
interested in comparing two degree subjects, who we shall refer to as subject 1 and
subject j (j=2...J). Dropping the subscript i for ease of exposition, this will mean that we
can estimate separate earnings relationships for individuals with degree subject 1 and
individuals with degree subject j as follows:
111111 εβγ ++= XALnE [3]
jjjjjj XALnE εβγ ++= [4]
By employing the popular framework proposed by Blinder (1973) and Oaxaca (1973), it
is possible to obtain a measure of the hourly earnings markup subject j imparts over
subject 1. More formally, the approach of Blinder and Oaxaca allows for the difference in
average earnings between holders of degree subject 1 and holders of degree subject j to
be decomposed into a component due to average characteristic (X) and average ability (A)
differences, and a component due to the way such attributes are rewarded in the labour
market. This latter component is taken as evidence of subject specific wage markups.
Thus, by making a simple extrapolation from the standard Blinder-Oaxaca decomposition
framework, we can isolate the percentage earnings markup to any degree subject (Dj) as:
100).1]))()(exp[( 1111 −−+−= AXD jjj γγββ [5]
where a bar represents an average value. All premiums for the j subjects are therefore
measured relative to a constant baseline of subject 1 and will show the earnings
advantage such subjects impart over this constant baseline.

8
Further, following Oaxaca and Ransom (1998), standard errors for [5] can be
approximated by:
11
/2 )()1()(se XXLnDD jjjj Σ+Σ+= [6]
where Σ is the variance-covariance matrix from the estimated OLS coefficient vectors in
equations [3] and [4].
4. Data
The data used in this analysis come from the Labour Force Survey (LFS), a large-scale
survey conducted by the Office for National Statistics (ONS). Switched from an annual to
a quarterly basis in 1992, it aims to produce a sample of approximately 60,000
responding households in Great Britain every quarter. Over the course of the survey
respondents are interviewed on five separate occasions, commencing in the quarter they
enter the survey and then once more in each of the next subsequent four quarters.
Following their fifth interview respondents are replaced by a new cohort. This rotating
sample design means that within any one quarter approximately one-fifth of all
respondents are being interviewed for the first time, one-fifth for the second time etc., all
the way up to the fifth who are being interviewed for the final time. There is, therefore,
an eighty per cent overlap of respondents from any one quarter to the next. To avoid any
possible double-counting we ensure that individuals are only picked up once during their
participation within the LFS. This is done by selecting respondents only after they have
provided earnings information.6
The data used run from the Spring of 1994 to the Winter of 2002. The start date was
chosen to provide a period of relatively stable economic growth to remove the potential
influence of cyclical effects in the early 1990s and the end point was chosen as to provide
a sufficiently large sample for the detailed analysis that follows. By pooling the separate
quarters and after selecting only university graduates for whom there was no missing
6 Between Winter 1992 and Winter 1996, respondents were only asked about their earnings once, and this
was during their fifth interview. Since Spring 1997, however, respondents are now asked about their
earnings on two separate occasions. These will be during their first (wave 1) and final (wave 5) interviews.

9
information, there were approximately 17,500 males and 15,200 females of working age
remaining who had hourly earnings data available.
5. Results
Underlying the analysis and decomposition framework employed here is a wage equation
that captures variation in the hourly wages paid to workers with differing levels of
educational achievement. As such, we have controlled for individual-varying
characteristics but not attributes associated with an individual's job, as these might be
supposed to be influenced by the level of educational attainment.7 Full details of all the
variables used and their definitions may be found in the Appendix. While it is impractical
to present results for all of the wage equations that were estimated or give a blow by blow
account of the individual estimates, they were nonetheless consistently well-defined and
conformed to a familiar pattern: hourly earnings increase with seniority (though at a
decreasing rate) and job tenure; younger cohorts of workers face an earnings
disadvantage relative to older cohorts; married (and co-habitating) individuals enjoy a
wage premium over other marital states, as do healthy individuals relative to those with
reported health problems; likewise, full-time work is associated with higher remuneration
relative to working on a part-time basis; there are large regional variations in wage rates,
with the highest rates being found in the South East of England and London; and finally,
being of an ethnic origin other than ‘white’ substantially reduces hourly wage rates.8
Table 1 provides some background to the investigation that will follow and shows the
return to educational qualifications for men and women.9 Relative to having no formal
educational qualifications, there are substantial returns to human capital investment, with
7 As Pereira and Martins (2004) note, to obtain the full effect of education on earnings one should avoid the
inclusion in the wage equation of covariates whose value can depend upon education. The education
coefficient will decrease when extra covariates are used that can be considered as post-education decisions,
such as firm or industry. One of the returns to education is to increase the number of options available to an
individual. 8 All such results are available from the authors on request. 9 These results are calculated from two separately estimated earnings equations and reflect earnings
markups as given by equation [5] in the methodology section.
10
returns to degrees being considerably higher for women than for men.10 For example, a
higher degree would provide an hourly earnings boost of 113.76 per cent for a man
(relative to a similar man with no qualifications), while the comparable figure for a
woman is 131.52 per cent. Likewise, higher premiums for degree-qualified men are also
evident at the first (undergraduate university) and degree equivalent level.11
In contrast, the rewards associated with intermediate education levels favour men. Thus,
education up to an A-level standard provides men with an hourly earnings premium of
30.03 per cent, but there is only a 25.33 per cent premium for women. At the O-level
standard, the relativities are again fairly similar (27.01 and 23.24 per cent respectively). It
is only in the bottom educational category that relative female advantage is restored. At
this level, the rewards to education have been greatly reduced for both men (6.85 per
cent) and women (9.01 per cent), but nevertheless remain significant.
Thus, in comparison to men, it would appear that women benefit in two ways from
undertaking a degree: first, there is the higher absolute return relative to no qualifications;
and secondly, there is the higher relative return compared to A-levels. This, though, does
not tell the whole story. A common approach to measuring the returns to degrees is to
base estimates relative to those who could have pursued further education but chose not
to do so. This indicator role is filled by those individuals who have gained two or more 10 Over the period of our analysis there has been a general upward movement in the proportions obtaining
higher qualifications, but in general the rate of return to the investment in human capital has remained high.
Indeed, these rates of return remain high compared to most other advanced industrial nations (see Blöndal,
Field and Girouard, 2002). In keeping with the findings of Walker and Zu (2003), though, there is no
evidence that this recent expansion in higher education has resulted in a significant decline in financial
returns. For example, we split the sample into two periods, 1994-1996 and 2000-2002, and compared the
returns to degree level qualifications. For men, returns to first degrees have remained roughly constant
while the returns to higher degrees have risen marginally. However, there is the suggestion of a fall in the
returns to both first and higher degrees for women of the order of about 7 and 5 percentage points
respectively. 11 Undergraduate degrees will include those awarded by both the pre- and post-1992 institutions.
Meanwhile, degree equivalent qualifications will include qualifications such as HNC/HNDs, teaching and
nursing diplomas and NVQs above level 3.

11
A-levels. Thus, the finding that women gain a greater advantage than men when pursuing
education beyond sixth-form studies is reinforced when we distinguish between those
who have only gained one A-level pass and those who have gained two or more A-level
passes. Such results are shown in Table 2, which are again measured relative to
comparable men and women with no formal qualifications. Naturally, the gender
difference seen in Table 1 is again evident and returns increase from gaining additional
A-levels. For men whose highest qualification is only a single A-level pass, an hourly
earnings premium of 45.59 per cent is enjoyed over those men with no qualifications.
This increases to 58.60 per cent for those men who have gained two or more A-levels.
The comparable figures for women are 36.60 per cent for single A-level achievers and
45.46 per cent for multiple achievers. Thus, the potential penalty of not pursuing
academic studies in higher education for those with the innate ability is that much greater
for women than it is for men.
Table 3 explores further the issue of the returns to a university education.12 Unlike the
preceding tables, though, all returns are measured relative to the benchmark of a person
who has obtained two or more A-levels. As such, the return to men from pursuing an
undergraduate (first) degree is 20.23 per cent and for women it is 35.49 per cent.13 This is
a more direct way of looking at what we have stated previously, namely that the benefit
of a university education on hourly wages is more apparent for women than it is for men.
The table also shows that the greater female advantage to a university education extends
into postgraduate studies, and indeed the scope of this advantage increases with
additional study. So while there may be substantial rewards for men to gaining a masters
degree (29.15 per cent) or a PhD degree (31.40 per cent), such returns are far lower than
12 It is important to note that the results for Table 3 and all of the following tables examine the returns to
degree level qualifications and will exclude degree-equivalent qualifications. As evidenced in Table 1,
these have vastly different labour market outcomes. The focus here is firmly upon the returns to a
university education. 13 This means someone whose highest qualification is an undergraduate degree i.e. they have not gone on to
pursue a postgraduate degree.
12
those afforded to women (at 54.00 and 60.02 per cent for masters and PhD qualifications
respectively).
Although there are substantial rewards to a university education for both men and
women, this finding disguises substantial variance in the returns to particular degree
subjects. This is clearly shown in Table 4 for men and Table 5 for women. In these tables,
we compare returns to broad groups of degrees at first degree level relative to those
obtained from Arts degrees.14 This is done with and without the Leslie index of student
quality. Dealing firstly with the estimates for men without the quality index, the subject
with the largest markup over Arts is Maths and Computing (31.97 per cent), closely
followed by Medicine and Related (29.23 per cent) and then Engineering and Technology
(27.04). At the other end of the spectrum are the subjects of Education (14.76 per cent)
and Architecture and Related (13.84 per cent). It is noticeable, though, that even the
returns to these broad degree subjects are far in excess of the baseline Arts category. This
is consistent with the labour market offering greater rewards to men who have undertaken
more quantitative degrees.
While the impact of introducing the index of student quality on the rate of return for men
is not dramatic, it is nonetheless not insubstantial. In five cases the estimated return
increases and in the other five it falls. Maths and Computing remains the subject with the
highest premium relative to Arts (31.55 per cent), but the return to Medicine and Related
has dropped to 23.43 per cent. This sees it slip to fourth in the ranking of subjects.15
Those disciplines moving above it are Engineering and Technology (28.58 per cent) and
Business and Financial Studies (27.34 per cent). Similarly moving up the rankings are
Education (5th) and Architecture and Related (6th), where premiums of 21.37 and 19.54 14 Arts degrees are chosen as the comparator as this is the group with the lowest returns – just 2.07 per cent
for men in relation to someone with two or more A-levels, and 25.91 per cent in the case of women. 15 Given the high entrance requirements into subjects such as clinical medicine and dentistry, this fall in the
estimated premium is exactly what would have been anticipated. High calibre students (as proxied by A-
level scores) would be expected to perform well in whatever field of study they chose to pursue. Once we
have removed this difference in innate ability, what we are left with is a direct measure of the return to
degree subjects.
13
per cent respectively have shown substantial increases. Their positions in the bottom two
rankings above Arts have now been filled by Sciences (9th) and Languages (10th), where
the magnitude of the fall in the premiums is comparable to the increases already
discussed for Education and Architecture and Related. Nevertheless, the premium of
10.72 per cent for Languages is still well in excess of the comparator Arts group.
For women, the spread of premiums across broad degree subjects is again pronounced
(see Table 5). Without the measure of student quality, the highest markups over Arts are
for Medicine and Related (21.14 per cent) and Maths and Computing (19.26 per cent),
the same two subjects found to dominate the analysis for men. Education is also a strong
performer, whose premium of 16.59 per cent places it at a position of three in the
discipline rankings.16 Subjects faring not so well (in a relative sense), are Sciences (5.49
per cent), Languages (5.25 per cent) and Combined (3.91 per cent).
The effect of introducing student quality has a similar reordering effect as it does for
men. Medicine and Related subjects continue to reward women well (a 21.36 per cent
premium), but its place at the head of the rankings has been lost to Education where
women can expect a markup of 22.42 per cent. Other areas where substantial premiums
relative to Arts subjects can be found are Architecture and Related (16.66 per cent),
Business and Financial Studies (15.52 per cent), Maths and Computing (14.82 per cent)
and Engineering and Technology (12.21 per cent). Considerably less well rewarded are
Combined subjects (3.52 per cent), Sciences (2.71 per cent) and Languages (a statistically
16 In their analysis of the Labour Force Survey, Walker and Zu (2003) consistently found that Education
occupied a much more lowly position. There are two probable causes for this. Firstly, they included a
control for union membership in their analysis which, given the higher incidence of union membership in
the public sector, is likely to be picking up this sectoral effect. The domination of the public sector in
education provision would mean that the return to Education is likely to be biased downwards once public
sector employment is controlled for. Secondly, their inclusion of degree-equivalent qualifications would
have an unduly large effect upon Education because of the proliferation of LFS respondents with such
qualifications at the further education level (as opposed to the higher education level examined here). We
have already highlighted the markedly lower returns to degree-equivalent qualifications.
14
insignificant -0.14 per cent), all subject areas giving returns similar to those in Arts.17 In
contrast to the findings for men, though, the link between higher rewards and more
quantitative degree programmes is less marked.
The academic groupings in the above tables have been relatively broad by design. To a
large extent this is unavoidable as the number of sample observations available within
more detailed subject areas would not allow for a meaningful analysis. Even within the
broad groupings used, though, there is likely to be variation across subject areas and so in
Table 6 (for men) and Table 7 (for women) we have selected more narrowly defined
undergraduate disciplines where possible. This enables us to analyse 25 distinct
subjects.18 For men, this variation across groupings is clearly shown with reference to the
baseline category of Arts degrees. Within this broad heading are the subjects of English
and History, both of which offer substantial earnings advantage over the other subjects in
the broader category. Taking the residual subjects in Arts as the comparator (i.e.
excluding English and History), an English degree would afford an hourly earnings
markup of 10.84 per cent and a History degree a markup of 11.69 per cent. These still,
though, represent some of the lowest returns to any degree subject.
The ability to isolate more detailed subject classifications identifies Accountancy as the
degree scheme with the most pronounced effect upon earnings. Relative to a graduate in
the excluded Arts category, an undergraduate Accountancy degree confers and earnings
17 It is worthwhile re-emphasising that there are still substantial gains to be had from women pursuing
degrees in these subjects. For example, even though a degree in Languages offers the lowest return, a
woman graduate in this field would still expect her earnings to be 25 per cent higher than a comparable
woman with two or more A-levels. 18 While Geography and Psychology are grouped under the heading of Sciences in Tables 6 and 7, some
students would pursue these subjects as a social science and hence there might appear to be a discrepancy
between the sample sizes between Tables 5 and 7 and between Tables 6 and 8. Thus, the classification of
Geography in Tables 7 and 8, for example, will denote this subject regardless of whether it is studied as a
science or as a social science.
15
advantage for men of 42.15 per cent.19 This compares to a premium of 26.53 per cent in
Business and Financial Studies, the broader group from which Accountancy would have
previously featured. Also drawn from this broad heading is the discipline of Economics,
where the reported mark-up of 28.57 per cent is again higher than the remaining subjects
in the category.
Unlike Accountancy and Economics, subjects with higher returns than the broad
categories within which they were encompassed, Nursing has appreciably lower returns
than other disciplines in Medicine and Related. A 14.39 per cent markup in Nursing (at
position 20 out of the 25) compares to a figure of 32.06 per cent for the disciplines left
within Medicine and Related. While this represents an absolute improvement in the
return to Medicine and Related (compared to Table 4 and the baseline comparator used
there), such a figure is only the fifth highest in Table 6. Above it is not only
Accountancy, which we have discussed already, and Maths and Computing (37.23 per
cent) but now also a number of specific subject areas in Engineering and Technology. A
markup of 40.73 per cent in Electrical Engineering is the second highest in the table, and
a markup of 33.71 per cent in Mechanical Engineering is the fourth. Civil Engineering
(29.25 per cent), while slightly behind Medicine and Related, still offers a substantial
premium to its graduates, as do the residual subjects in Engineering and Technology
(31.85 per cent).
It is in the sciences and social sciences that returns for men to some of the more
traditional subjects appear to be less well rewarded. In the former category, Biology
(15.87 per cent) and Psychology (18.66 per cent) stand out as modest performers, while
19 Note that the baseline from which these estimates are calculated is different from that used for Tables 4
and 5. Excluding English and History graduates means that the subjects included within the baseline Arts
category now offer no earnings advantage for men relative to two or more A-level qualifications. In fact,
comparable men with 2+ A-levels could expect their hourly earnings to be 3.36 per cent higher than
graduates from Arts disciplines. With the exception of this particular category, we already know that
university degrees impart substantial earnings advantage. The important point of these tables is that they
provide a ranking of degree subjects. For women, graduates in the baseline Arts category in Table 7 still
enjoy a substantial earnings mark-up (19.29 per cent) over women with only two or more A-levels.

16
in the social sciences the returns to Sociology (10.83 per cent) and Politics (15.70 per
cent) occupy similar roles.
For women (see Table 7), Accountancy again emerges as the most financially rewarding
degree subject at the undergraduate level. Relative to the comparison Arts category, an
earnings markup of 37.12 per cent is well in excess of the next highest figure, 27.52 per
cent in Medicine and Related. Similarly high returns to this are also exhibited in Law
(23.97 per cent) and Education (22.40 per cent), but those subjects in engineering found
to be so lucrative for men now tend to offer more modest relative returns for women. The
returns in Mechanical Engineering (13.84 per cent) and Civil Engineering (13.70 per
cent), for example, are now only on a par with the return in Nursing (13.93 per cent).20
Mirroring the pattern for men, subjects that offer women substantially less earnings
advantage are Biology and Psychology, which confer no statistically significant wage
premium over an Arts degree. Likewise, the premiums for History and Politics are also
insignificantly different from Arts, but these are all against a backdrop of a 19.29 per cent
return to Arts relative to two or more A-levels. Thus, there is little doubt that even though
there is substantial variation in the returns to undergraduate degree subjects, even the
least well-rewarded subjects offer a substantial labour market reward to women.
In Table 8 (men) and Table 9 (women) we compare returns to higher degrees relative to
undergraduate degrees. Due to limited sample sizes, we are unable to perform this
analysis for detailed subject areas but instead use the broad subject groupings seen
earlier. For men, the greatest rewards to postgraduate study at the masters level are in the
area of Business and Financial Studies. A graduate with a first degree in this area could
expect a return of 14.34 per cent from a masters degree. Architecture and Related (13.28
per cent) and Education (12.28 per cent) also offer substantial returns relative to study at
the undergraduate level.
20 It should be noted, though, that women are much less likely to take engineering degrees and the estimates
reported are based upon relatively modest sample sizes.

17
By way of contrast to the returns available at the undergraduate level, a masters-level
qualification in Arts imparts a not insubstantial premium of 9.11 per cent for men. This is
higher, for example, than the returns to a masters degree in either Engineering and
Technology (7.76 per cent) or Medicine and Related (a statistically insignificant 4.37 per
cent). Conversely, there is no apparent additional benefit to studying Maths and
Computing at the masters level, in spite of the substantial rewards that are available at the
first-degree level.
At the doctoral level, sample sizes are rather small with subsequently higher standard
errors (in some cases), but on the whole these indicate that doctoral study is a worthwhile
investment over and above an undergraduate degree. Business and Financial Studies
(20.21 per cent) again emerges as the subject attracting the greatest premium relative to
undergraduate study, closely followed by Medicine and Related (17.81 per cent).
Reasonable returns are also evident in Combined (11.16 per cent), Sciences (7.85 per
cent) and Social Sciences (7.50 per cent), while lesser returns are on offer in Engineering
and Technology (4.97 per cent), Maths and Computing (4.78 per cent) and Arts (4.48 per
cent). It is interesting to note also that the returns to both Arts and Engineering and
Technology PhDs are less than the rewards from gaining a masters-level qualification in
these subjects.21
For women, the majority of the broad subject categories in Table 9 offer impressive
rewards for a masters degree over and above a first degree. As with men, Business and
Financial Studies imparts the greatest earnings benefit (19.52 per cent). Similarly high
returns are also available in Engineering and Technology (16.47 per cent) and Social
21 It is possible that the mix of subjects within these broad categories is different at the masters and doctoral
levels and it is these composition effects that are being captured. To test this hypothesis, we compared
masters-level and doctoral-level degrees in broad subject areas, but included additional controls for the
narrow subject classifications shown in Tables 6 and 7. Such a procedure had no meaningful effect upon
the results reported in Table 8. Alternatively, the finding could be the result of selection effects, where
those students choosing to pursue doctoral studies are inherently different from those who leave education
after a masters-level qualification.

18
Sciences (17.79 per cent). Indeed, it is only in Languages and Architecture and Related
that the estimated advantage to a masters-level qualification is not statistically significant.
At the PhD level, sample sizes are again rather small. The highest return of 14.59 per cent
is obtained in Medicine and Related, but elsewhere, statistically significant returns are to
be had in all subjects except Languages and Engineering and Technology. Thus, the
inescapable conclusion that can be drawn is that women have more to gain than men in a
relative sense from a university education and that the gains that are available increase as
women progress up the educational ladder.
Degree choice and its effect upon the gender wage gap
It has been clearly demonstrated that there is substantial variation in rewards across
different degree programmes, but there is also clear evidence that patterns of degree
choice differ markedly between men and women. Men, for example, are more heavily
represented in the well-rewarded fields of Maths and Computing and Engineering and
Technology, while women have a relative over-representation in the Arts.22 As shown by
Machin and Puhani (2003), such patterns will have implications for the gender wage gap.
We have explored this issue too and the results of our analysis are shown in Table 10.
Following Machin and Puhani, we have estimated the extent of gender discrimination
facing female graduates within a standard decomposition framework and examined the
impact of including controls for subject of degree.23 For the sample as a whole (Table 10,
22 Indeed, the Duncan Index of Dissimilarity for the sample of first-degree graduates is calculated at 0.325
(see Duncan and Duncan, 1955). This would suggest that over 32 per cent of women would have to choose
an alternative degree course to achieve an equal distribution across subjects with men. 23 Using the same notation from section 3, Oaxaca and Ransom (1994) show that the difference in average
earnings between men (M) and women (W) can be decomposed as:
)]()()()([)()( ******WWMMWWMMWMWM
WM
XXAAXXAA
LnELnE
ββββγγγγβγ −+−+−+−+−+−
=−
where a * refers to the Oaxaca-Ransom non-discriminatory wage structure that would exist in the absence
of discrimination and the entire term in square parentheses is the part of the wage differential that is usually
ascribed to discrimination. The remaining terms in the decomposition is the component of the earnings
difference due to differences in average wage determining characteristics between men and women.

19
column 1), the effect of controlling for subject of degree is to explain an additional .031
log points of the gender wage differential.
Examining separate cohorts of men and women, though, reveals some interesting trends.
For those men and women who graduated from university and entered the labour market
before 1970, the influence of degree choice is at its most profound. The Duncan Index,
calculated at 0.368, is greater than in any of the following cohorts and the effect of
controlling for subject of degree is to explain an additional 0.044 log points of the gender
wage differential. In the following two cohorts, those graduating between 1970-1989 and
those graduating post-1989, the effect of degree choice has an identical outcome of
explaining an additional 0.029 log points. These, though, have been periods over which a
considerable convergence has been shown in the subject choice of men and women. As
such, the Duncan Index falls substantially from 0.344 for the 1970-1989 cohort to 0.295
for the post-1989 cohort. But even though there is evidence of a recent change in the
traditional patterns of men and women in the choice of what to study at university, there
is no clear supporting evidence to suggest that continuing convergence towards a more
balanced distribution of men and women across courses will lead to further erosion of the
gender wage gap.24 This reflects the fact that the gender pay gap for graduates is now
quite small and student choices by gender are becoming more similar over time.
6. Conclusions
The evidence from this analysis of the Labour Force Survey suggests that there are still
sizeable returns to be attained from undertaking a degree. However, focusing just on the
returns to a degree relative to those without degrees can be misleading, since there are
substantial differences in the return to different types of degree. Further, the types of
degree offering the highest returns are different for men and for women. This suggests
that as the numbers entering degree programmes continue to increase more attention
should be paid to the type of degree programme that students enter. Further, there is a
strong argument for variable graduate contributions, with higher fees set for programmes
24 By gender wage gap we mean that part of the difference in men and women's earnings that cannot be
explained by compositional differences.
20
which have a higher value in the marketplace. This logic might suggest that men and
women should face differentiated fees for given disciplines. However, this would fall foul
of equal opportunities legislation, so that variable contributions would need to be based
on the mean returns to men and women combined.
Finally, in so far as education is treated as an investment rather than a consumption
decision, regularly updated information on returns to different degree programmes can
make an important contribution to the educational decisions of future students.

21
References
Ashworth J. (1996) "A Waste of Time? (Private Rates of Return to Higher Education in
the 1990s)", unpublished manuscript, University of Durham.
Battu H., Belfield C. and Sloane P.J. (1999) "Over-Education Among Graduates: A
Cohort View", Education Economics, vol. 7, pp. 21-38.
Black D., Sanders S. and Taylor L. (2003) "The Economic Reward for Studying
Economics", Economic Inquiry, vol. 41, pp. 365-377.
Blackaby D., Murphy P. and O’Leary N. (1999) "Graduate Earnings in Great Britain: A
Matter of Degree?", Applied Economics Letters, vol. 6, pp. 311-315.
Blöndal S., Field S. and Girouard N. (2002) "Investment in Human Capital Through Post-
Compulsory Education and Training: Selected Efficiency and Equity Aspects", OECD
Economics Department Working Paper, no. 333.
Blinder A. (1973) "Wage Discrimination: Reduced Form and Structural Estimates",
Journal of Human Resources, vol. 8, pp. 436-455.
Blundell R., Dearden L., Goodman A. and Reed H. (2000) "The Returns to Higher
Education in Britain: Evidence from a British Cohort", Economic Journal, vol. 110, pp.
F82-F99.
Bratti M. and Mancini L. (2003) "Difference in Early Occupational Earnings of UK Male
Graduates by Degree Subject: Evidence from the 1980-1993 USR", IZA Discussion
Paper, Bonn, no. 890.
Chevalier A. (2003) "Motivation, Expectations and the Gender Pay Gap for UK
Graduates", Institute for the Study of Social Change, University College Dublin.
22
Chevalier A. and Conlon G. (2003) "Does it Pay to Attend a Prestigious University?",
IZA Discussion Paper, Bonn, no. 848.
Chevalier A. and Walker I. (2001) "The United Kingdom", in Harmon C., Walker I. and
Westergaard-Nielson N., editors, Education and Earnings in Europe: A Cross Country
Analysis of the Returns to Education, Edward Elgar, Cheltenham, pp. 302-330.
Department for Education and Skills (2003) The Future of Higher Education, CM 5735,
HMSO.
Duncan O. and Duncan B. (1955) "A Methodological Analysis of Segregation Indices",
American Sociological Review, vol. 20, pp. 210-217.
Greenaway D. and Haynes M.(2003) "Funding Higher Education in the UK: The Role of
Fees and Loans", Economic Journal, vol. 113, pp. F150-F166.
Harkness S. and Machin S. (1999) "Graduate Earnings in Britain", Research Brief No.
95, Department for Education and Employment, London.
Joy, L. (2003) "Salaries of Recent Male and Female College Graduates: Educational and
Labor Market Effects", Industrial and Labor Relations Review, vol. 56, pp. 606-621
Lee L.F. (1983) "Generalised Econometric Models with Selectivity", Econometrica, vol.
51, pp. 507-512.
Leslie D. (2003) "Using Success to Measure Quality in British Higher Education: Which
Subjects Attract the Best-Qualified Students?", Journal of the Royal Statistical Society,
vol. 166, pp. 329-347.
Machin S. and Puhani P. (2003) "Subject of Degree and the Gender Wage Differential:
Evidence for the UK and Germany", Economics Letters, vol. 79, pp. 393-400.
23
Oaxaca R. (1973) "Male-Female Wage Differentials in Urban Labour Markets",
International Economic Review, vol. 14, pp. 693-709.
Oaxaca R. and Ransom M. (1994) "On Discrimination and the Decomposition of Wage
Differentials", Journal of Econometrics, vol. 61, pp. 5-21.
Oaxaca R. and Ransom M. (1998) "Calculation of Approximate Variances for Wage
Decomposition Differentials", Journal of Economic and Social Measurement, vol. 24, pp.
55-61.
Pereira P. and Martins P. (2004) "Returns to Education and Wage Equations", Applied
Economics, vol. 36, pp. 525-531.
Rosenbaum P. and Rubin D. (1983) "The Central Role of the Propensity Score in
Observational Studies for Causal Effects", Biometrika, vol. 70, pp. 41-55.
Walker I. And Zhu Y. (2003) "Education, Earnings and Productivity: Recent UK
Evidence", Labour Market Trends, March, pp. 145-152.

Table 1 Percentage Returns to Qualifications for Men and Women:
LFS 1994Q1-2002Q4
Men Women Markup SE Markup SE
Higher degree First degree Degree equivalent A-level (or equivalent) O-level (or equivalent) Other
113.76+
96.70+
65.20+
30.03+
27.01+
6.85+
0.01110.00900.00720.00500.00630.0048
131.52+
101.64+
70.30+
25.33+
23.24+
9.01+
0.0124 0.0096 0.0066 0.0055 0.0047 0.0039
Notes: all returns are measured relative to no qualifications; + (++) denotes statistical significance at the 95% (90%) confidence level.

Table 2 Percentage Returns to A-Levels for Men and Women:
LFS 1994Q1-2002Q4
Men Women Markup SE Markup SE
One A-level Two or more A-levels
45.59+
58.60+0.01420.0104
36.60+
45.46+0.0107 0.0095
Notes: all returns are measured relative to no qualifications; + (++) denotes statistical significance at the 95% (90%) confidence level.

Table 3 Percentage Returns to First and Higher Degrees for Men and Women:
LFS 1994Q1-2002Q4
Men Women Markup SE Markup SE
Undergraduate degree Masters degree PhD degree
20.23+
29.15+
31.40+
0.00920.01290.0167
35.49+
54.00+
60.02+
0.0104 0.0164 0.0291
Notes: all returns are measured relative to 2+ A-levels; + (++) denotes statistical significance at the 95% (90%) confidence level.

Table 4 Percentage Returns to Broad First Degree Subjects for Men:
LFS 1994Q1-2002Q4
n Markup SE rank Markup SE rankMedicine and related
Sciences Maths and computing
Engineering and technology Architecture and related
Social sciences Business and financial studies
Arts Languages Education Combined
361 1644 975
2267 410
1357 1020 1323 110 490
2529
29.23+ 18.77+ 31.67+ 27.04+ 13.84+ 19.34+ 24.30+
(E) 16.36+ 14.76+ 16.88+
0.02950.01850.02320.01890.02350.01880.0219
0.04240.02350.0169
2613
1054
11897
23.43+ 14.90+ 31.55+ 28.58+ 19.54+ 17.43+ 27.34+
(E) 10.72+ 21.37+ 17.45+
0.0301 0.0195 0.0231 0.0192 0.0271 0.0187 0.0230
0.0421 0.0282 0.0169
4912683
111057
Index of Student Quality NO YES Notes: all returns are measured relative to an Arts degree; return to an Arts degree relative to 2+ A-levels is 2.07%; + (++) denotes statistical significance at the 95% (90%) confidence level.
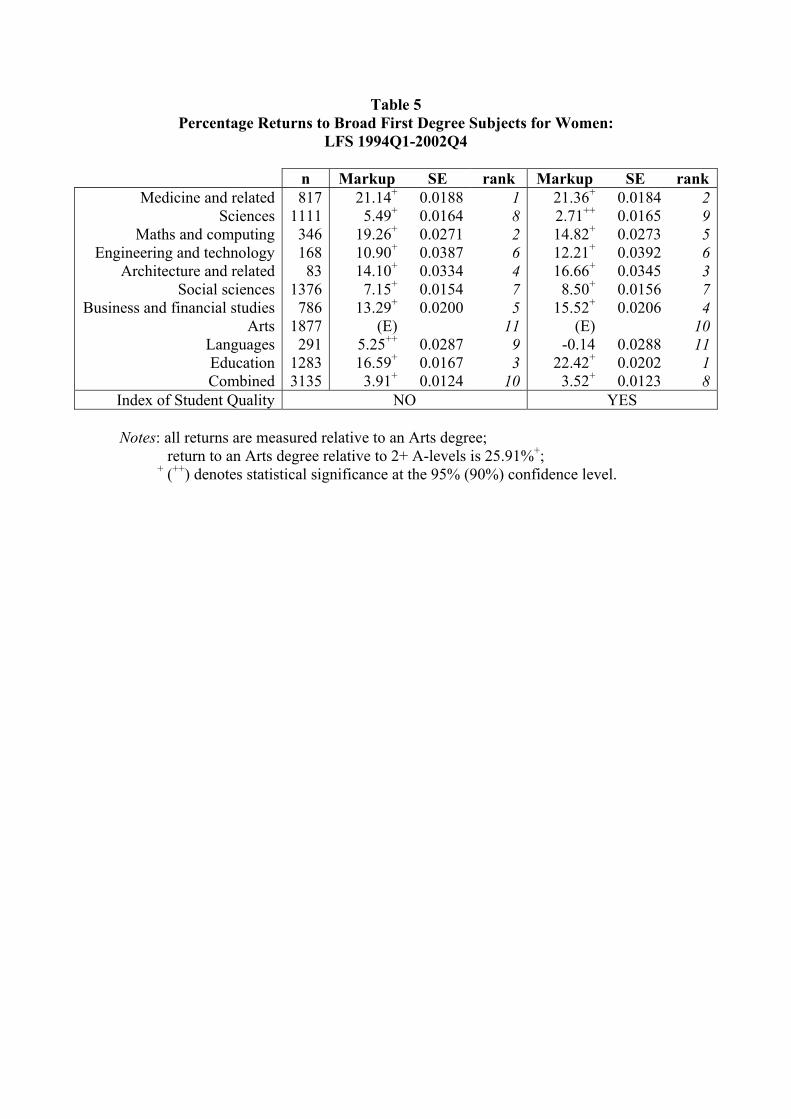
Table 5 Percentage Returns to Broad First Degree Subjects for Women:
LFS 1994Q1-2002Q4
n Markup SE rank Markup SE rankMedicine and related
Sciences Maths and computing
Engineering and technology Architecture and related
Social sciences Business and financial studies
Arts Languages Education Combined
817 1111 346 168 83
1376 786
1877 291
1283 3135
21.14+ 5.49+
19.26+ 10.90+ 14.10+ 7.15+
13.29+ (E)
5.25++ 16.59+ 3.91+
0.01880.01640.02710.03870.03340.01540.0200
0.02870.01670.0124
1826475
1193
10
21.36+ 2.71++ 14.82+ 12.21+ 16.66+ 8.50+
15.52+ (E)
-0.14 22.42+ 3.52+
0.0184 0.0165 0.0273 0.0392 0.0345 0.0156 0.0206
0.0288 0.0202 0.0123
2956374
101118
Index of Student Quality NO YES Notes: all returns are measured relative to an Arts degree; return to an Arts degree relative to 2+ A-levels is 25.91%+; + (++) denotes statistical significance at the 95% (90%) confidence level.
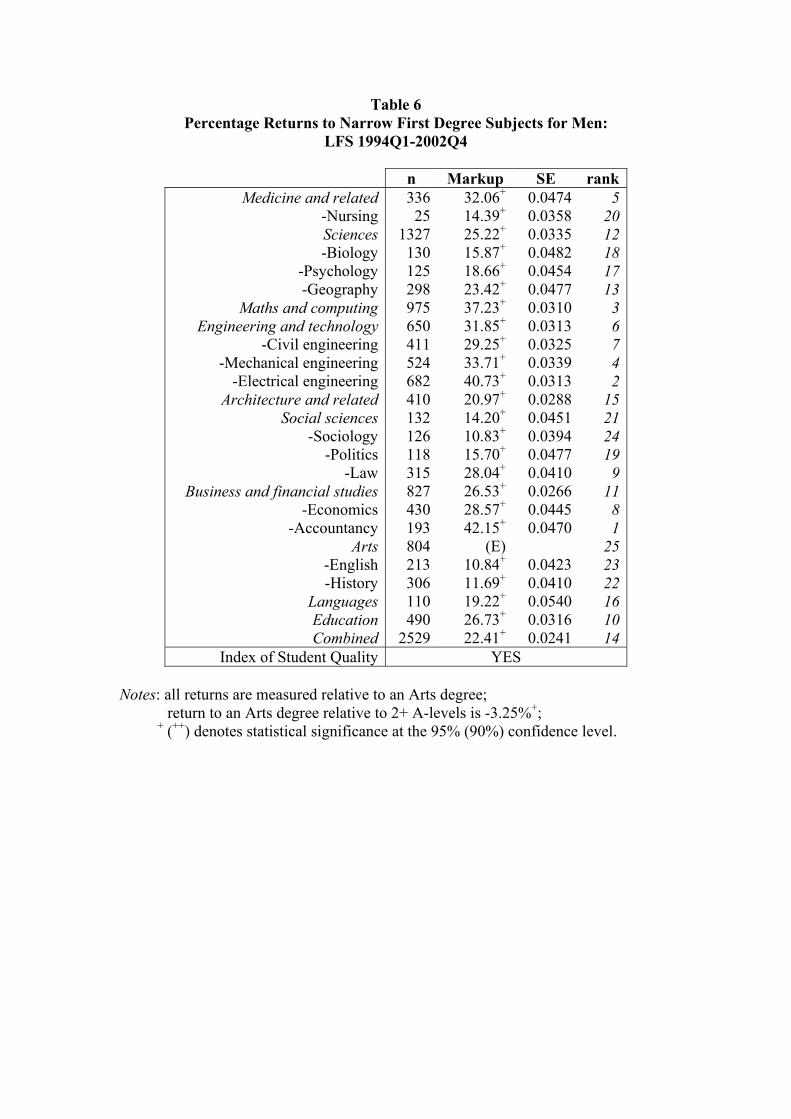
Table 6 Percentage Returns to Narrow First Degree Subjects for Men:
LFS 1994Q1-2002Q4
n Markup SE rank Medicine and related
-NursingSciences-Biology
-Psychology-Geography
Maths and computingEngineering and technology
-Civil engineering-Mechanical engineering
-Electrical engineeringArchitecture and related
Social sciences-Sociology
-Politics-Law
Business and financial studies-Economics
-AccountancyArts
-English-History
LanguagesEducationCombined
336 25
1327 130 125 298 975 650 411 524 682 410 132 126 118 315 827 430 193 804 213 306 110 490
2529
32.06+ 14.39+ 25.22+ 15.87+ 18.66+ 23.42+ 37.23+ 31.85+ 29.25+ 33.71+ 40.73+ 20.97+ 14.20+ 10.83+ 15.70+ 28.04+ 26.53+ 28.57+ 42.15+
(E) 10.84+ 11.69+ 19.22+ 26.73+ 22.41+
0.0474 0.0358 0.0335 0.0482 0.0454 0.0477 0.0310 0.0313 0.0325 0.0339 0.0313 0.0288 0.0451 0.0394 0.0477 0.0410 0.0266 0.0445 0.0470
0.0423 0.0410 0.0540 0.0316 0.0241
5 20 12 18 17 13 3 6 7 4 2
15 21 24 19 9
11 8 1
25 23 22 16 10 14
Index of Student Quality YES Notes: all returns are measured relative to an Arts degree; return to an Arts degree relative to 2+ A-levels is -3.25%+; + (++) denotes statistical significance at the 95% (90%) confidence level.

Table 7 Percentage Returns to Narrow First Degree Subjects for Women:
LFS 1994Q1-2002Q4
n Markup SE rank Medicine and related
-NursingSciences-Biology
-Psychology-Geography
Maths and computingEngineering and technology
-Civil engineering-Mechanical engineering
-Electrical engineeringArchitecture and related
Social sciences-Sociology
-Politics-Law
Business and financial studies-Economics
-AccountancyArts
-English-History
LanguagesEducationCombined
597 220 696 188 303 261 346 97 24 19 28 83
286 269 72
302 691 110 95
1091 468 318 291
1283 3135
27.52+ 13.93+ 6.13+ 1.60 1.98 4.34
18.10+ 13.54+ 13.70
13.84+ 19.04+ 18.70+ 13.45+ 6.50+ -0.91
23.97+ 14.34+ 9.68++ 37.12+
(E) 6.65+ 0.95 3.30
22.40+ 5.58+
0.0305 0.0301 0.0261 0.0356 0.0262 0.0398 0.0370 0.0556 0.0950 0.0286 0.0233 0.0370 0.0313 0.0292 0.0508 0.0372 0.0234 0.0508 0.0504
0.0322 0.0365 0.0386 0.0223 0.0187
2 9
17 22 21 19 7
12 11 10 5 6
13 16 25 3 8
14 1
24 15 23 20 4
18 Index of Student Quality YES
Notes: all returns are measured relative to an Arts degree; return to an Arts degree relative to 2+ A-levels is 19.29%+; + (++) denotes statistical significance at the 95% (90%) confidence level.
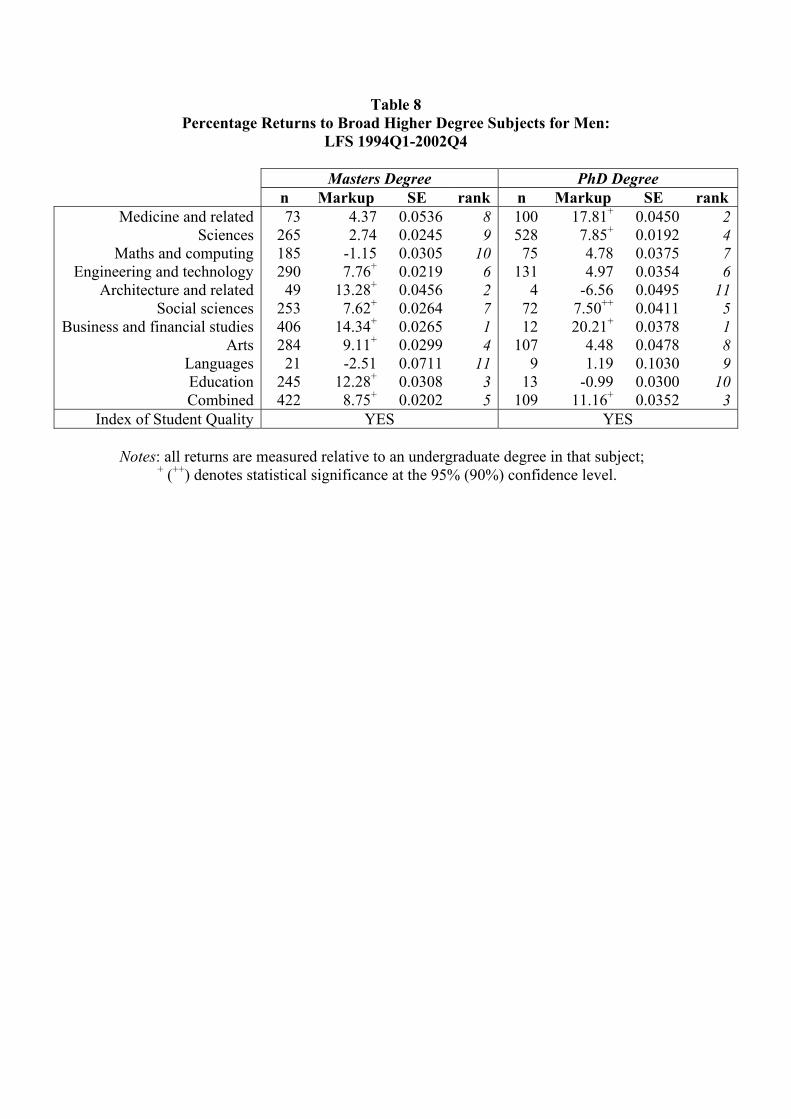
Table 8 Percentage Returns to Broad Higher Degree Subjects for Men:
LFS 1994Q1-2002Q4
Masters Degree PhD Degree n Markup SE rank n Markup SE rank
Medicine and related Sciences
Maths and computing Engineering and technology
Architecture and related Social sciences
Business and financial studies Arts
Languages Education Combined
73 265 185 290 49
253 406 284 21
245 422
4.372.74
-1.157.76+
13.28+
7.62+
14.34+
9.11+
-2.5112.28+
8.75+
0.0536 0.0245 0.0305 0.0219 0.0456 0.0264 0.0265 0.0299 0.0711 0.0308 0.0202
89
1062714
1135
100 528 75
131 4
72 12
107 9
13 109
17.81+ 7.85+ 4.78 4.97
-6.56 7.50++ 20.21+
4.48 1.19
-0.99 11.16+
0.0450 0.0192 0.0375 0.0354 0.0495 0.0411 0.0378 0.0478 0.1030 0.0300 0.0352
2476
115189
103
Index of Student Quality YES YES Notes: all returns are measured relative to an undergraduate degree in that subject; + (++) denotes statistical significance at the 95% (90%) confidence level.

Table 9 Percentage Returns to Broad Higher Degree Subjects for Women:
LFS 1994Q1-2002Q4
Masters Degree PhD Degree n Markup SE rank n Markup SE rank
Medicine and related Sciences
Maths and computing Engineering and technology
Architecture and related Social sciences
Business and financial studies Arts
Languages Education Combined
127 112 79 28 23
280 140 245 18
234 288
8.52+
8.37++
13.87+
16.47+
9.0017.79+
19.52+
8.13+
5.257.72+
15.29+
0.0305 0.0421 0.0544 0.0520 0.0747 0.0264 0.0436 0.0283 0.0499 0.0258 0.0241
78536219
11104
59 174 10 8 1
52 6
50 9
12 42
14.59+ 14.19+ 12.39+
3.50 -
14.27++ 10.80+ 8.45++
6.62 12.39+ 15.07+
0.0427 0.0335 0.0429 0.0892
- 0.0752 0.0428 0.0527 0.0604 0.0201 0.0544
24
=510
-3789
=51
Index of Student Quality YES YES Notes: all returns are measured relative to an undergraduate degree in that subject; + (++) denotes statistical significance at the 95% (90%) confidence level.

Table 10 Effect of Subject of Degree on the Gender Wage Gap:
LFS 1994Q1-2002Q4 All Cohorts Pre-1970 1970-1989 Post-1989 without
subject with
subject withoutsubject
with subject
withoutsubject
with subject
without subject
with subject
∆Y 0.1774 0.2195 0.1903 0.0705 X (%)
0.0904 (50.96)
0.1214 (68.43)
0.0755 (34.40)
0.1198(54.58)
0.0942 (49.50)
0.1233(64.79)
0.0297 (42.13)
0.0584(82.84)
β (%)
0.0870 (49.04)
0.0604 (31.57)
0.1440 (63.60)
0.1018(45.42)
0.0961 (50.50)
0.0715(35.21)
0.0409 (57.87)
0.0162(19.16)
∆ X (%)
0.0310 (17.47)
0.0443 (20.18)
0.0291 (15.29)
0.0287 (40.71)
DI 0.3245 0.3675 0.3444 0.2954 Notes (see footnote 23): ∆Y refers to WM LnELnE − ; X refers to ** )()( βγ WMWM XXAA −+− ; β refers to )()()()( ****
WWMMWWMM XXAA ββββγγγγ −+−+−+− ; ∆X refers to the change in X from including degree subject controls; DI refers to the Duncan Index of Dissimilarity (see Duncan and Duncan, 1955).
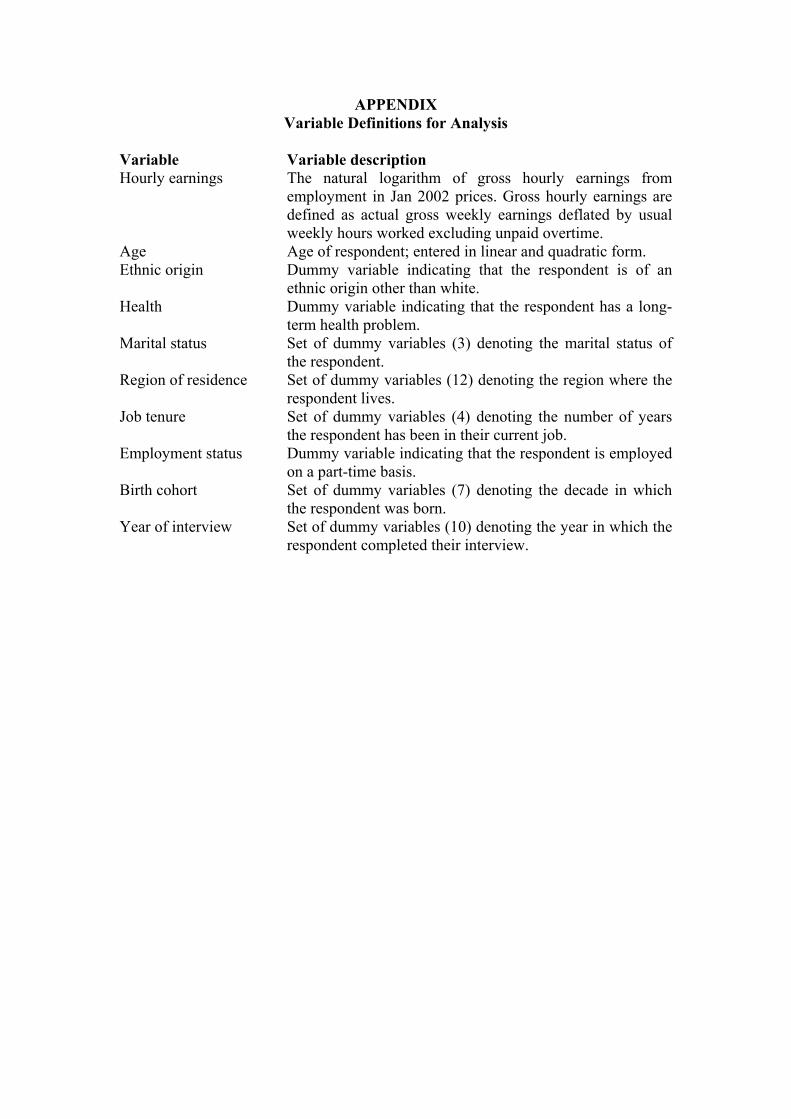
APPENDIX Variable Definitions for Analysis
Variable Variable description Hourly earnings The natural logarithm of gross hourly earnings from
employment in Jan 2002 prices. Gross hourly earnings are defined as actual gross weekly earnings deflated by usual weekly hours worked excluding unpaid overtime.
Age Age of respondent; entered in linear and quadratic form. Ethnic origin Dummy variable indicating that the respondent is of an
ethnic origin other than white. Health Dummy variable indicating that the respondent has a long-
term health problem. Marital status Set of dummy variables (3) denoting the marital status of
the respondent. Region of residence Set of dummy variables (12) denoting the region where the
respondent lives. Job tenure Set of dummy variables (4) denoting the number of years
the respondent has been in their current job. Employment status Dummy variable indicating that the respondent is employed
on a part-time basis. Birth cohort Set of dummy variables (7) denoting the decade in which
the respondent was born. Year of interview Set of dummy variables (10) denoting the year in which the
respondent completed their interview.